Aptamer Based Microsphere Biosensor for Thrombin Detection

Department of Biological Engineering, 240D Life Sciences Center, 1201 East Rollins Street, University of Missouri—Columbia Columbia, Missouri 65211, USA
*
Author to whom correspondence should be addressed.
Sensors 2006, 6(8), 785-795; https://doi.org/10.3390/s6080785
Submission received: 17 January 2006
/
Accepted: 12 April 2006
/
Published: 16 August 2006
(This article belongs to the Special Issue Photonic Sensors for Chemical, Biological, and Nuclear Agent Detection)
Abstract
:We have developed an optical microsphere resonator biosensor using aptamer as receptor for the measurement of the important biomolecule thrombin. The sphere surface is modified with anti-thrombin aptamer, which has excellent binding affinity and selectivity for thrombin. Binding of the thrombin at the sphere surface is monitored by the spectral position of the microsphere's whispering gallery mode resonances. A detection limit on the order of 1 NIH Unit/mL is demonstrated. Control experiments with non-aptamer oligonucleotide and BSA are also carried out to confirm the specific binding between aptamer and thrombin. We expect that this demonstration will lead to the development of highly sensitive biomarker sensors based on aptamer with lower cost and higher throughput than current technology.
1. Introduction
Dielectric microspheres of a few tens to a few hundreds of microns in diameter support a series of optical resonance modes at the surface called whispering gallery modes (WGMs) [1]. The WGM has an evanescent field that extends into the surrounding medium, and therefore can be utilized for biosensing applications. The quality of the resonating mode is characterized by the Q-factor, where a higher Q-factor indicates a higher number of revolutions by photons trapped in the microsphere. Due to the extremely high Q-factor (106∼109) associated with the WGM in silica spheres, the interaction between the WGM and the analytes on the sphere surface is significantly enhanced, leading to a very low sample detection limit. Recent studies with microspheres have shown that the detection limit for refractive index and DNA molecules is on the order of 10-7 refractive index units and 10 pg/mm2, respectively, comparable to that in commercialized surface plasmon resonance biosensors [2,3]. This indicates that microsphere resonators are a very promising technology platform for label-free sensor development.
In a typical biosensor configuration, the microsphere surface is immobilized with a layer of antibodies as the receptor. However, antibodies need to be produced through immune responses in animal, and thus it is difficult to get the homogenous qualities without batch-to-batch variation. Furthermore, antibodies are easily denatured, making it hard to regenerate the receptor layer [4]. These issues have limited the use of antibodies as a recognition element for biosensor development. In recent years, aptamers have been widely explored for potential recognition elements in biosensors [5]. Aptamers are artificial short-stranded oligonucleotides (ssDNA or ssRNA) that can fold into well-defined three dimensional conformations capable of binding to their targets with high affinity and specificity. Compared to antibodies, aptamer-based receptors have many advantages. First, aptamers can be vitro-selected to bind to any target. Second, aptamers are chemically synthesized and easy to modify with functional groups, which can enhance their specificity. Third, aptamers have simple structures and it is easy to regenerate the aptamer based receptor layer. Moreover, unlike antibodies, aptamers are more stable because they are more resistant to denaturation [4].
Microsphere resonators have already been used in protein, DNA and protease detection [3, 6-8]. However, until now, the feasibility of using an aptamer as the receptor on the microsphere surface has not been demonstrated. Here we present the development of a microsphere resonator biosensor using an aptamer as the receptor molecule on the surface. In our experiment, we investigate the combination of an anti-thrombin aptamer and a human thrombin [9]. The measurement and detection of thrombin as a biomarker plays an important role in coagulation and cardiovascular disease therapy, and may also be useful during surgical procedures [10]. Thrombin has been optically detected using a fiber-optic sensor, fluorescence anisotropy, and near-infrared fluorescence [11-13]. However, all these methods are fluorescence-based, and thus require a laborious labeling process and expensive detection equipment. Furthermore, the fluorescent labels may cause steric hindrance, which will affect the binding ability. In contrast, label-free techniques avoid the fluorescent label on both the analyte (thrombin) and the receptor (aptamer), which greatly reduces the detection time. Recently, label-free thrombin detection using aptamers has been demonstrated using the Fourier transform infrared spectroscopy technique [14]. Optical microsphere resonator sensors provide another label-free approach to detect interaction of aptamers and thrombin. In our design, the transduction signal is derived from spectral shifts in the WGMs that result from interactions between the evanescent field and molecules binding to the surface. The thrombin concentration used in the experiment ranges from 6 to 440 NIH/mL. A detection limit is estimated to be on the order of 1 NIH Unit/mL. For comparison, control experiments with non-aptamers and BSA are also carried out to confirm the specific binding between aptamer and thrombin.
2. Experimental setup
2.1 Materials
3-APS (3- Aminopropyltrimethoxysilane 97%), PDC (1-4 phenylene diissothiocyanate 98%), Pyridine (99%), N, N-Dimethyl formamide (DMF, 99.8%), anhydrous ethanol, acetone, and thrombin from human plasma (38 kD MW and 3880 NIH Unit/mg) are purchased from Sigma-Aldrich (St. Louis, MO). Oligonucleotide (5′- CCAACCCAACGGTTGGTGTGGTTGG-3′ that contains anti-thrombin aptamers (GGTTGGTGTGGTTGG) [9,14,15] and non-thrombin oligonucleotide (5′-TATGAATTCAATCCGTCGAGCAGAGTT-3′) are purchased from Invitrogen (Frederick, MD). Both oligonucleotides are modified at the 5′end with amino groups. All chemicals are used without further purification.
2.2 Sphere preparation
Microspheres are fabricated by melting the tip of an optical fiber under CO2 laser irradiation. A thorough sequence of steps is then performed to prepare the surface of the spheres for thrombin sensing. First the spheres are cleaned by oxygen plasma etching (plasma cleaner PDC-32G, Harrick, Ossining, NY) for 10 minutes, and then placed in a desiccator with pure 3-APS for vapor silanization for 1 hour. To stabilize the silane layer on the sphere surface, spheres are then oven-cured at 160° C for 20 minutes. Following this, they are incubated in 1% (w/w) PDC dissolved in 10/90 (v/v) pyridine/DMF for two hours. PDC is capable of cross-linking the amine group on the surface to the amine group on protein molecules [16]. After rinsing the PDC-covered microspheres with anhydrous ethanol and acetone five times separately, the spheres are incubated in 2 mM anti-thrombin aptamer in carbonate buffer (pH = 8.3) for one hour. The spheres are stored at room temperature before use.
2.3 Sensor configuration
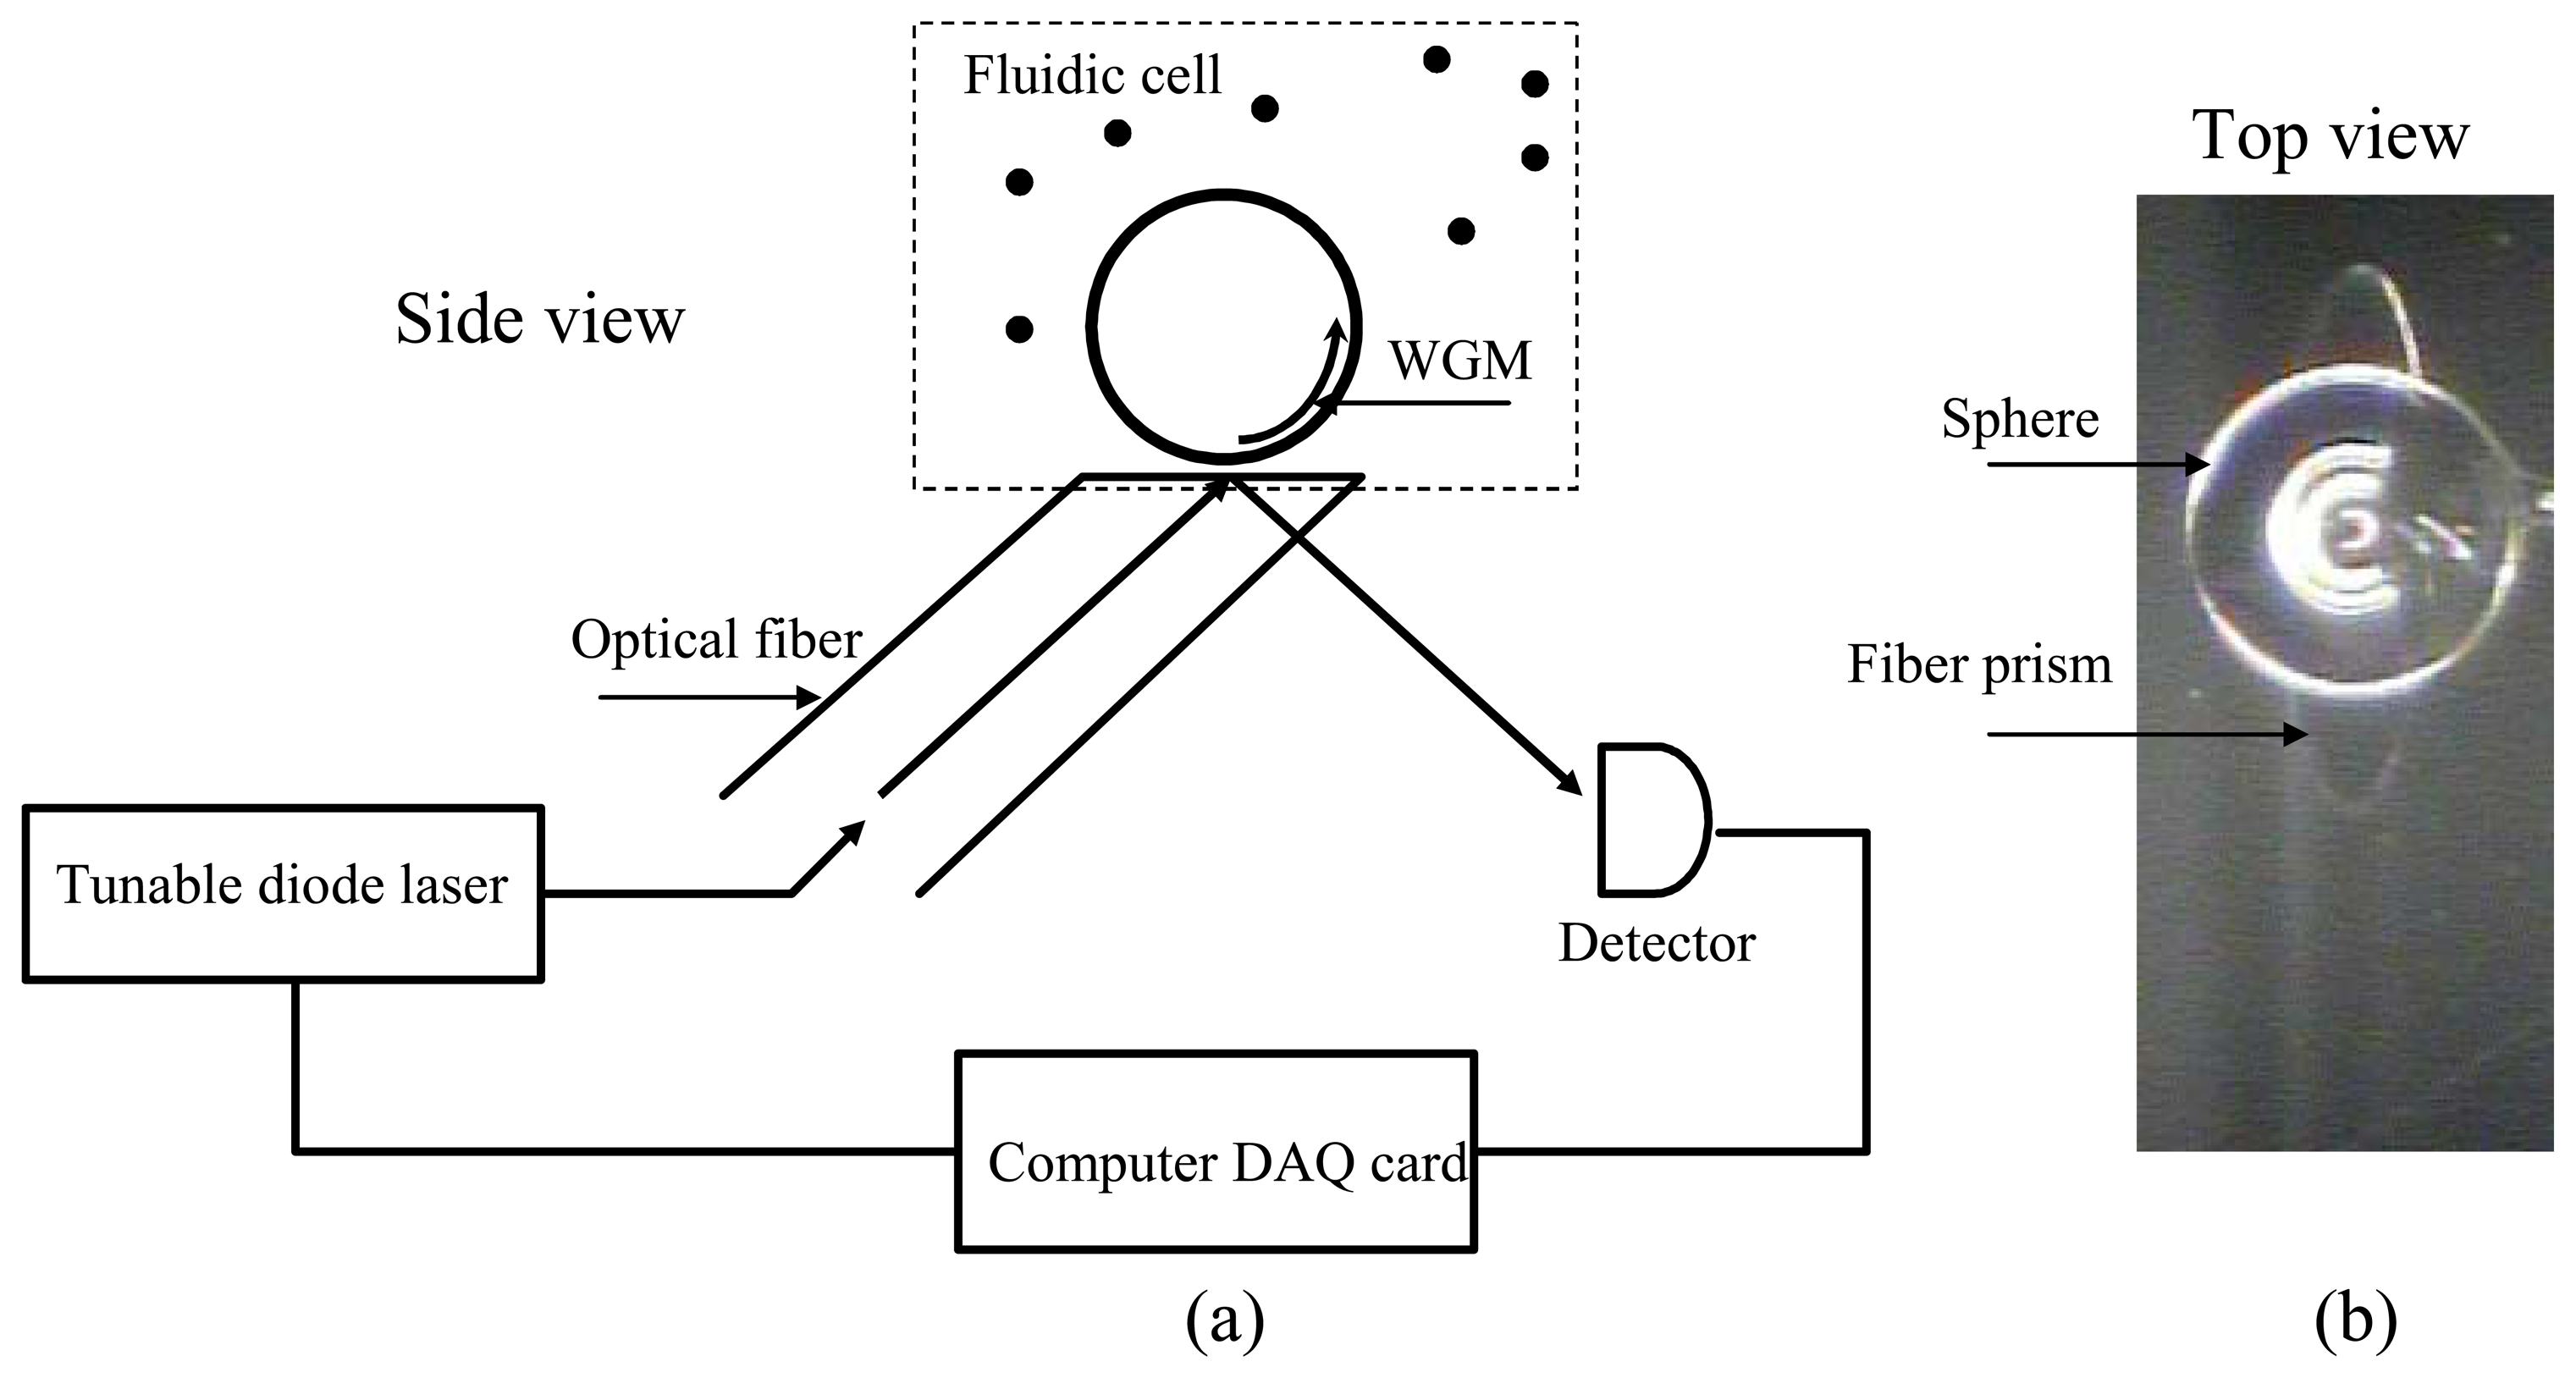
Fig.1 illustrates the experimental configuration. The chemically treated microsphere is brought into contact with a fiber prism [2,17]. The excitation light from a tunable diode laser (980nm, New Focus) is coupled into the microsphere via frustrated total internal reflection. The prism is built into the wall of a small fluidic cell, which contains the aqueous samples. The sphere is immersed in de-ionized (DI) water and brought into contact with the fiber prism.
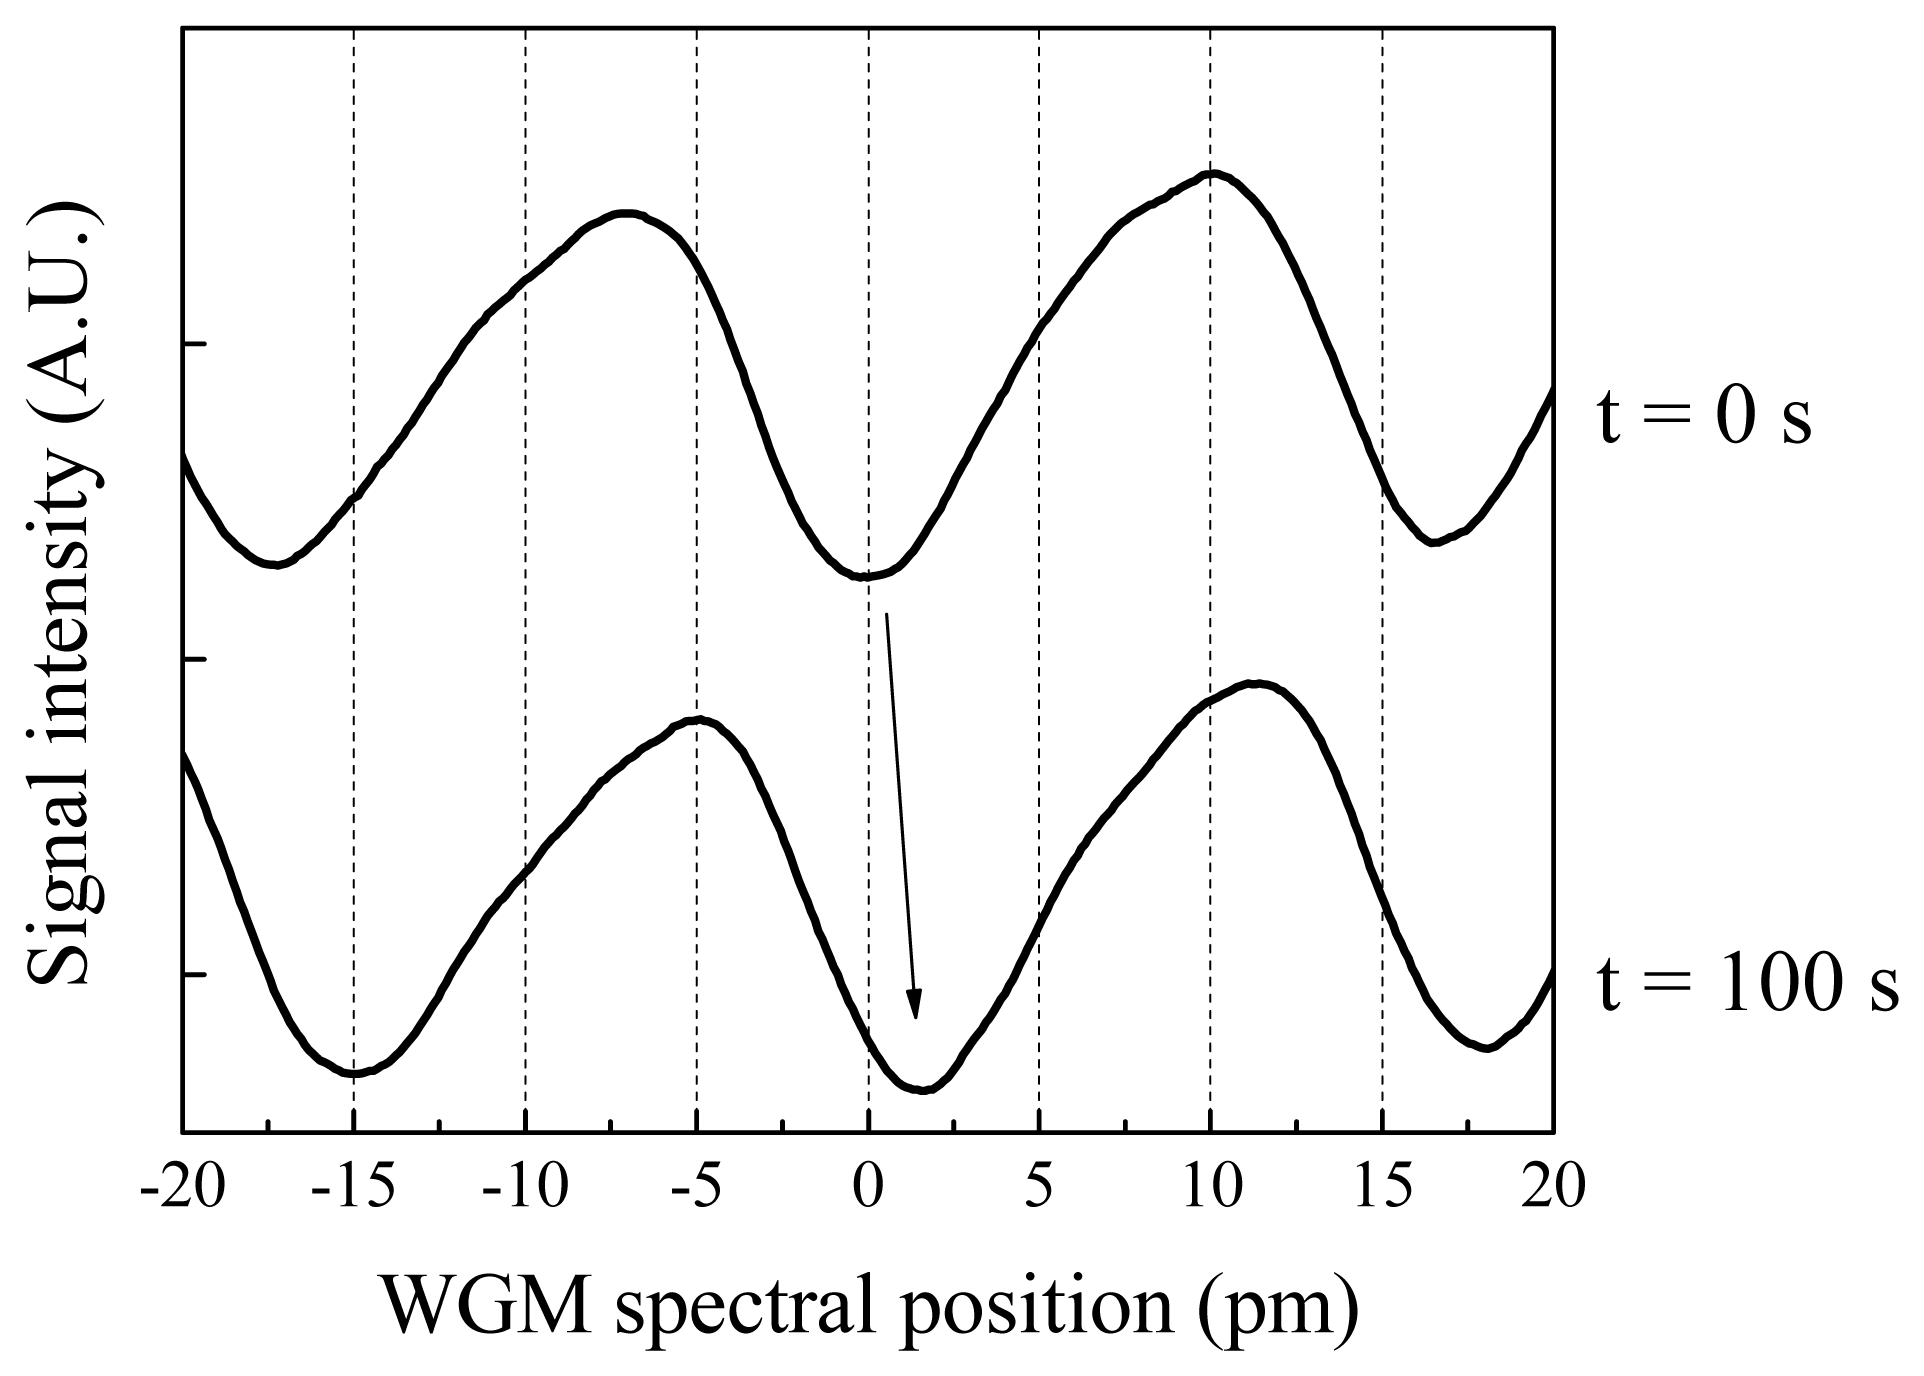
The intensity of light reflected by the prism is measured by the photodetector as the tunable laser is scanned repeatedly across a wavelength range of approximately 100 pm. A spectral dip occurs in the reflected light monitored by the detector when the light is on resonance with the WGM. The spectral position of the WGM resonance is very sensitive to the refractive index experienced by the optical mode [2]. As Fig. 2 shows, the binding of biomolecules to the sphere surface will lead a “red shift” of a given resonance dip due to the change in refractive index at the surface.
3. Results and discussion
The microsphere sensor design enables the aptamer deposition to be monitored. After PDC deposition, the sphere is immersed in the fluidic cell filled with carbonate buffer (pH = 8.3). The sensor baseline is established when the sphere and water reach thermal equilibrium. 2 mM aptamer is injected to the carbonate buffer and reached the final concentration of 0.5 mM. As shown in Fig. 3, the WGM spectral position shifts to the longer wavelength by 4.1 pm in response to the binding of aptamers to the functionalized sphere surface, which reaches saturation within 5 minutes. Therefore, in our experiment, 1 hour incubation in 2 mM aptamer solution is sufficient for aptamer immobilization. The surface density σ of the aptamer can be calculated using the following expression [18]:
where λ = 980 nm and δλ are the WGM resonant wavelength and the final WGM wavelength shift, respectively. ε0 is the vacuum permittivity, R (∼ 125 μm) is the sphere radius, and nsphere (1.45) and nbuffer (1.333) are the refractive indices for the sphere and buffer solution, respectively. αex is excess polarizability for DNA , which is 4πε0 × 4.4 × 10-22 cm3 [3]. Figure 3 shows a δλ of 4.1 pm, corresponding to a surface density of 3 × 10¹² /cm2, which leads to a projected area of 33 nm2 per aptamer molecule. The area occupied by each thrombin molecule is approximately 20 nm2 [19]. Therefore, the microsphere sensor should be able to capture thrombin molecules efficiently.
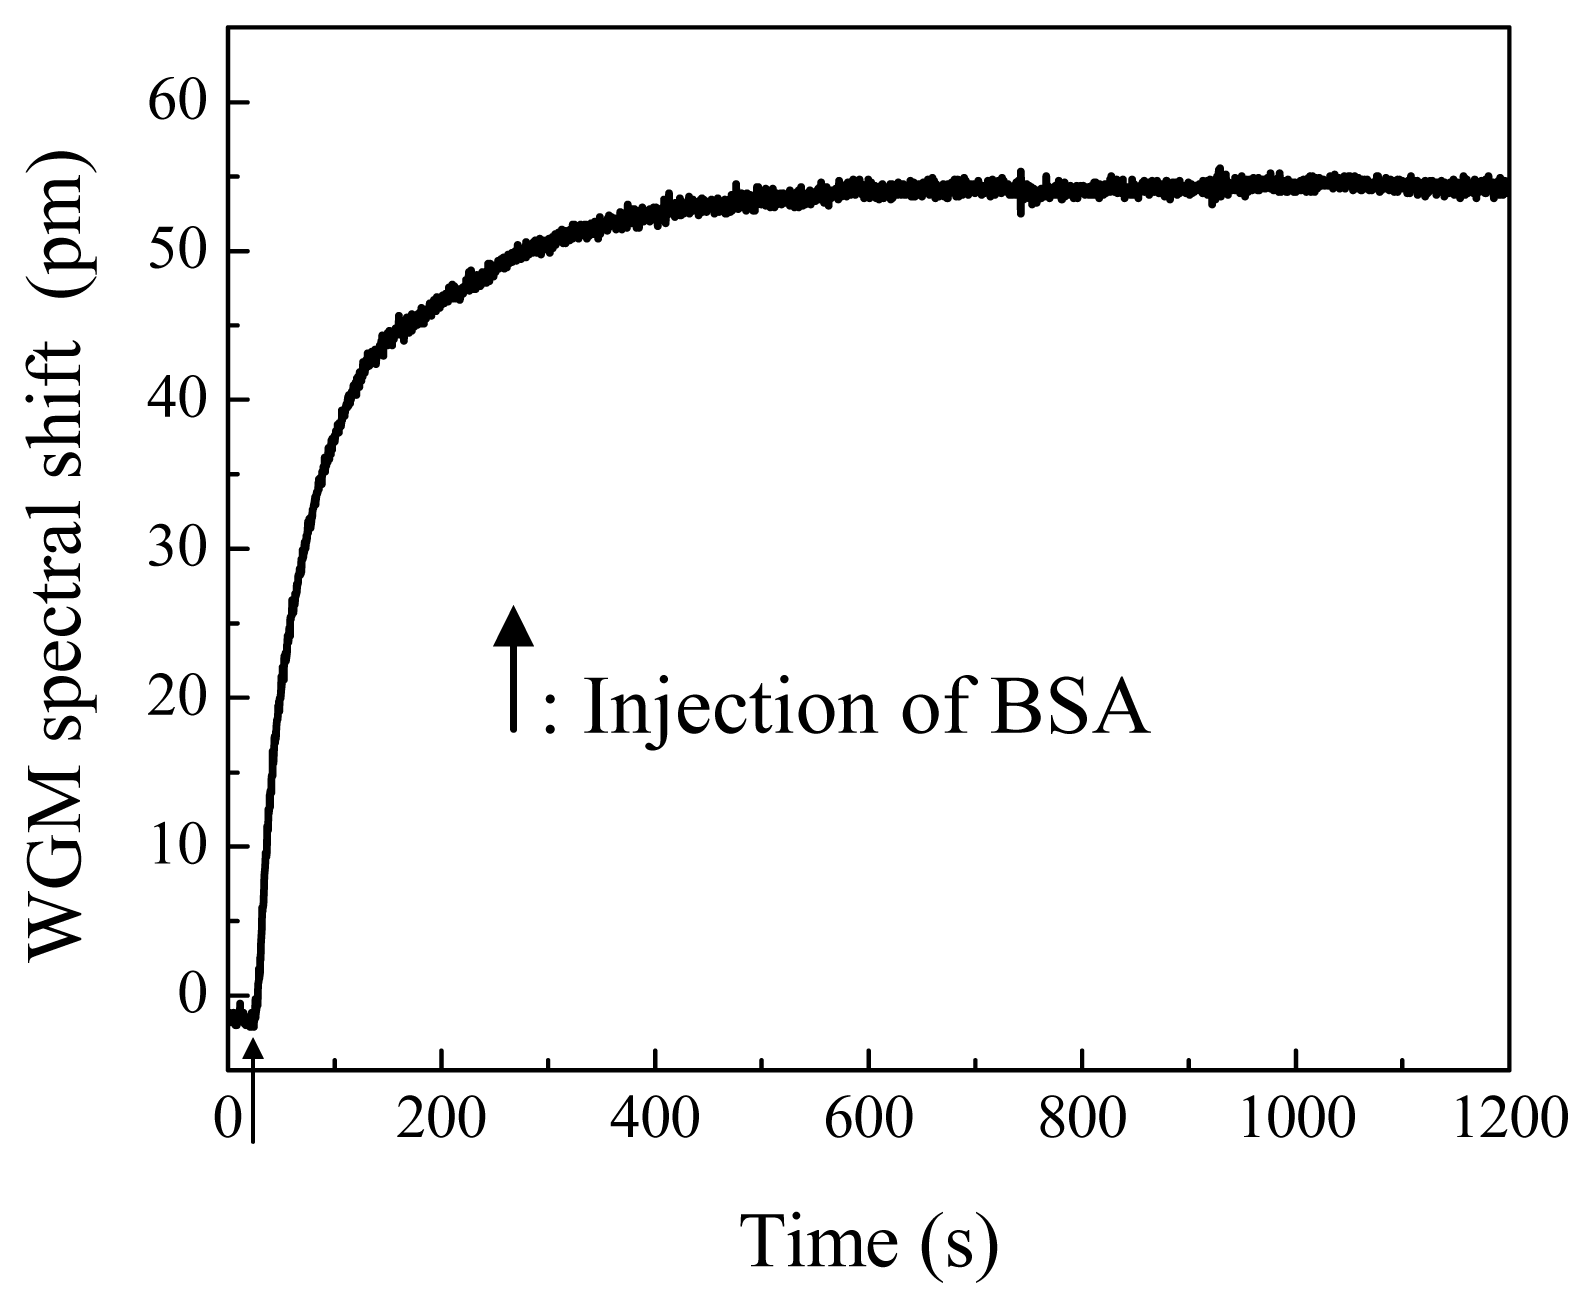
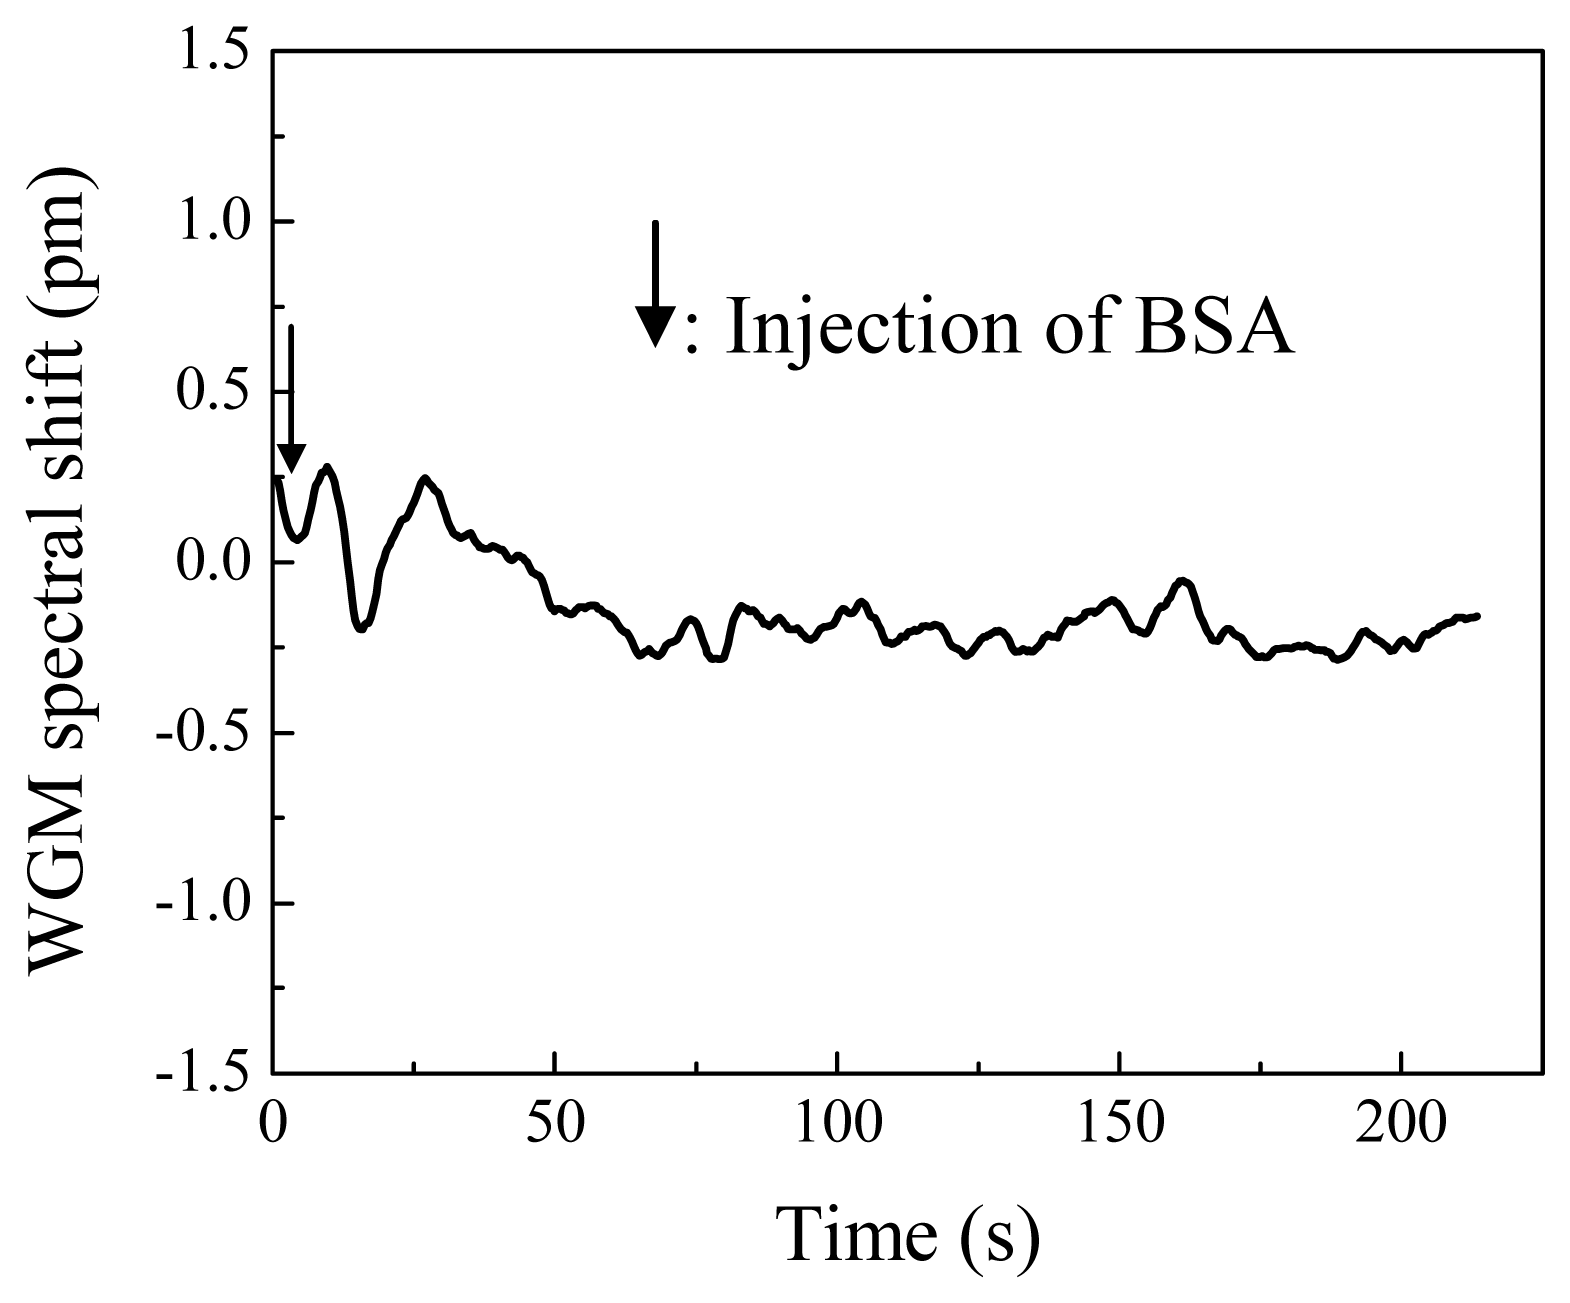
In order to further confirm that the sphere surface is covered by the aptamers, a set of control experiments are carried out. First, following PDC deposition, a microsphere is immersed in the fluidics cell full of PBS buffer (pH = 7.4). BSA is then injected to reach the final concentration of 0.8 mg/mL. The WGM resonance shifts immediately to a longer wavelength and reaches equilibrium within 6 minutes, as shown in Fig. 4. With αex = 4πε0 × 4.3 × 10-21 cm3 for BSA molecules [6], and R ∼ 100 μm, and δλ = 54 pm (Fig. 4), Eq. (1) shows that the surface density of BSA is 3.4 × 10¹²/cm2. Given the projected area of each BSA molecule of 3.7 × 10⁻¹³ cm2 [20], this result indicates that BSA binds strongly and non-specifically to the sphere surface through the PDC crosslinker. However, when a microsphere pre-treated with aptamers is used in this experiment, no WGM spectral shift is observed when the BSA solution of a similar concentration is injected to the fluidic cell, as shown in Fig. 5. Combining the results from aptamer binding experiment, and from these two control experiments, it can be concluded that the aptamers is efficiently immobilized onto the sphere surface and that BSA does not non-specifically bind to the anti-thrombin aptamers.
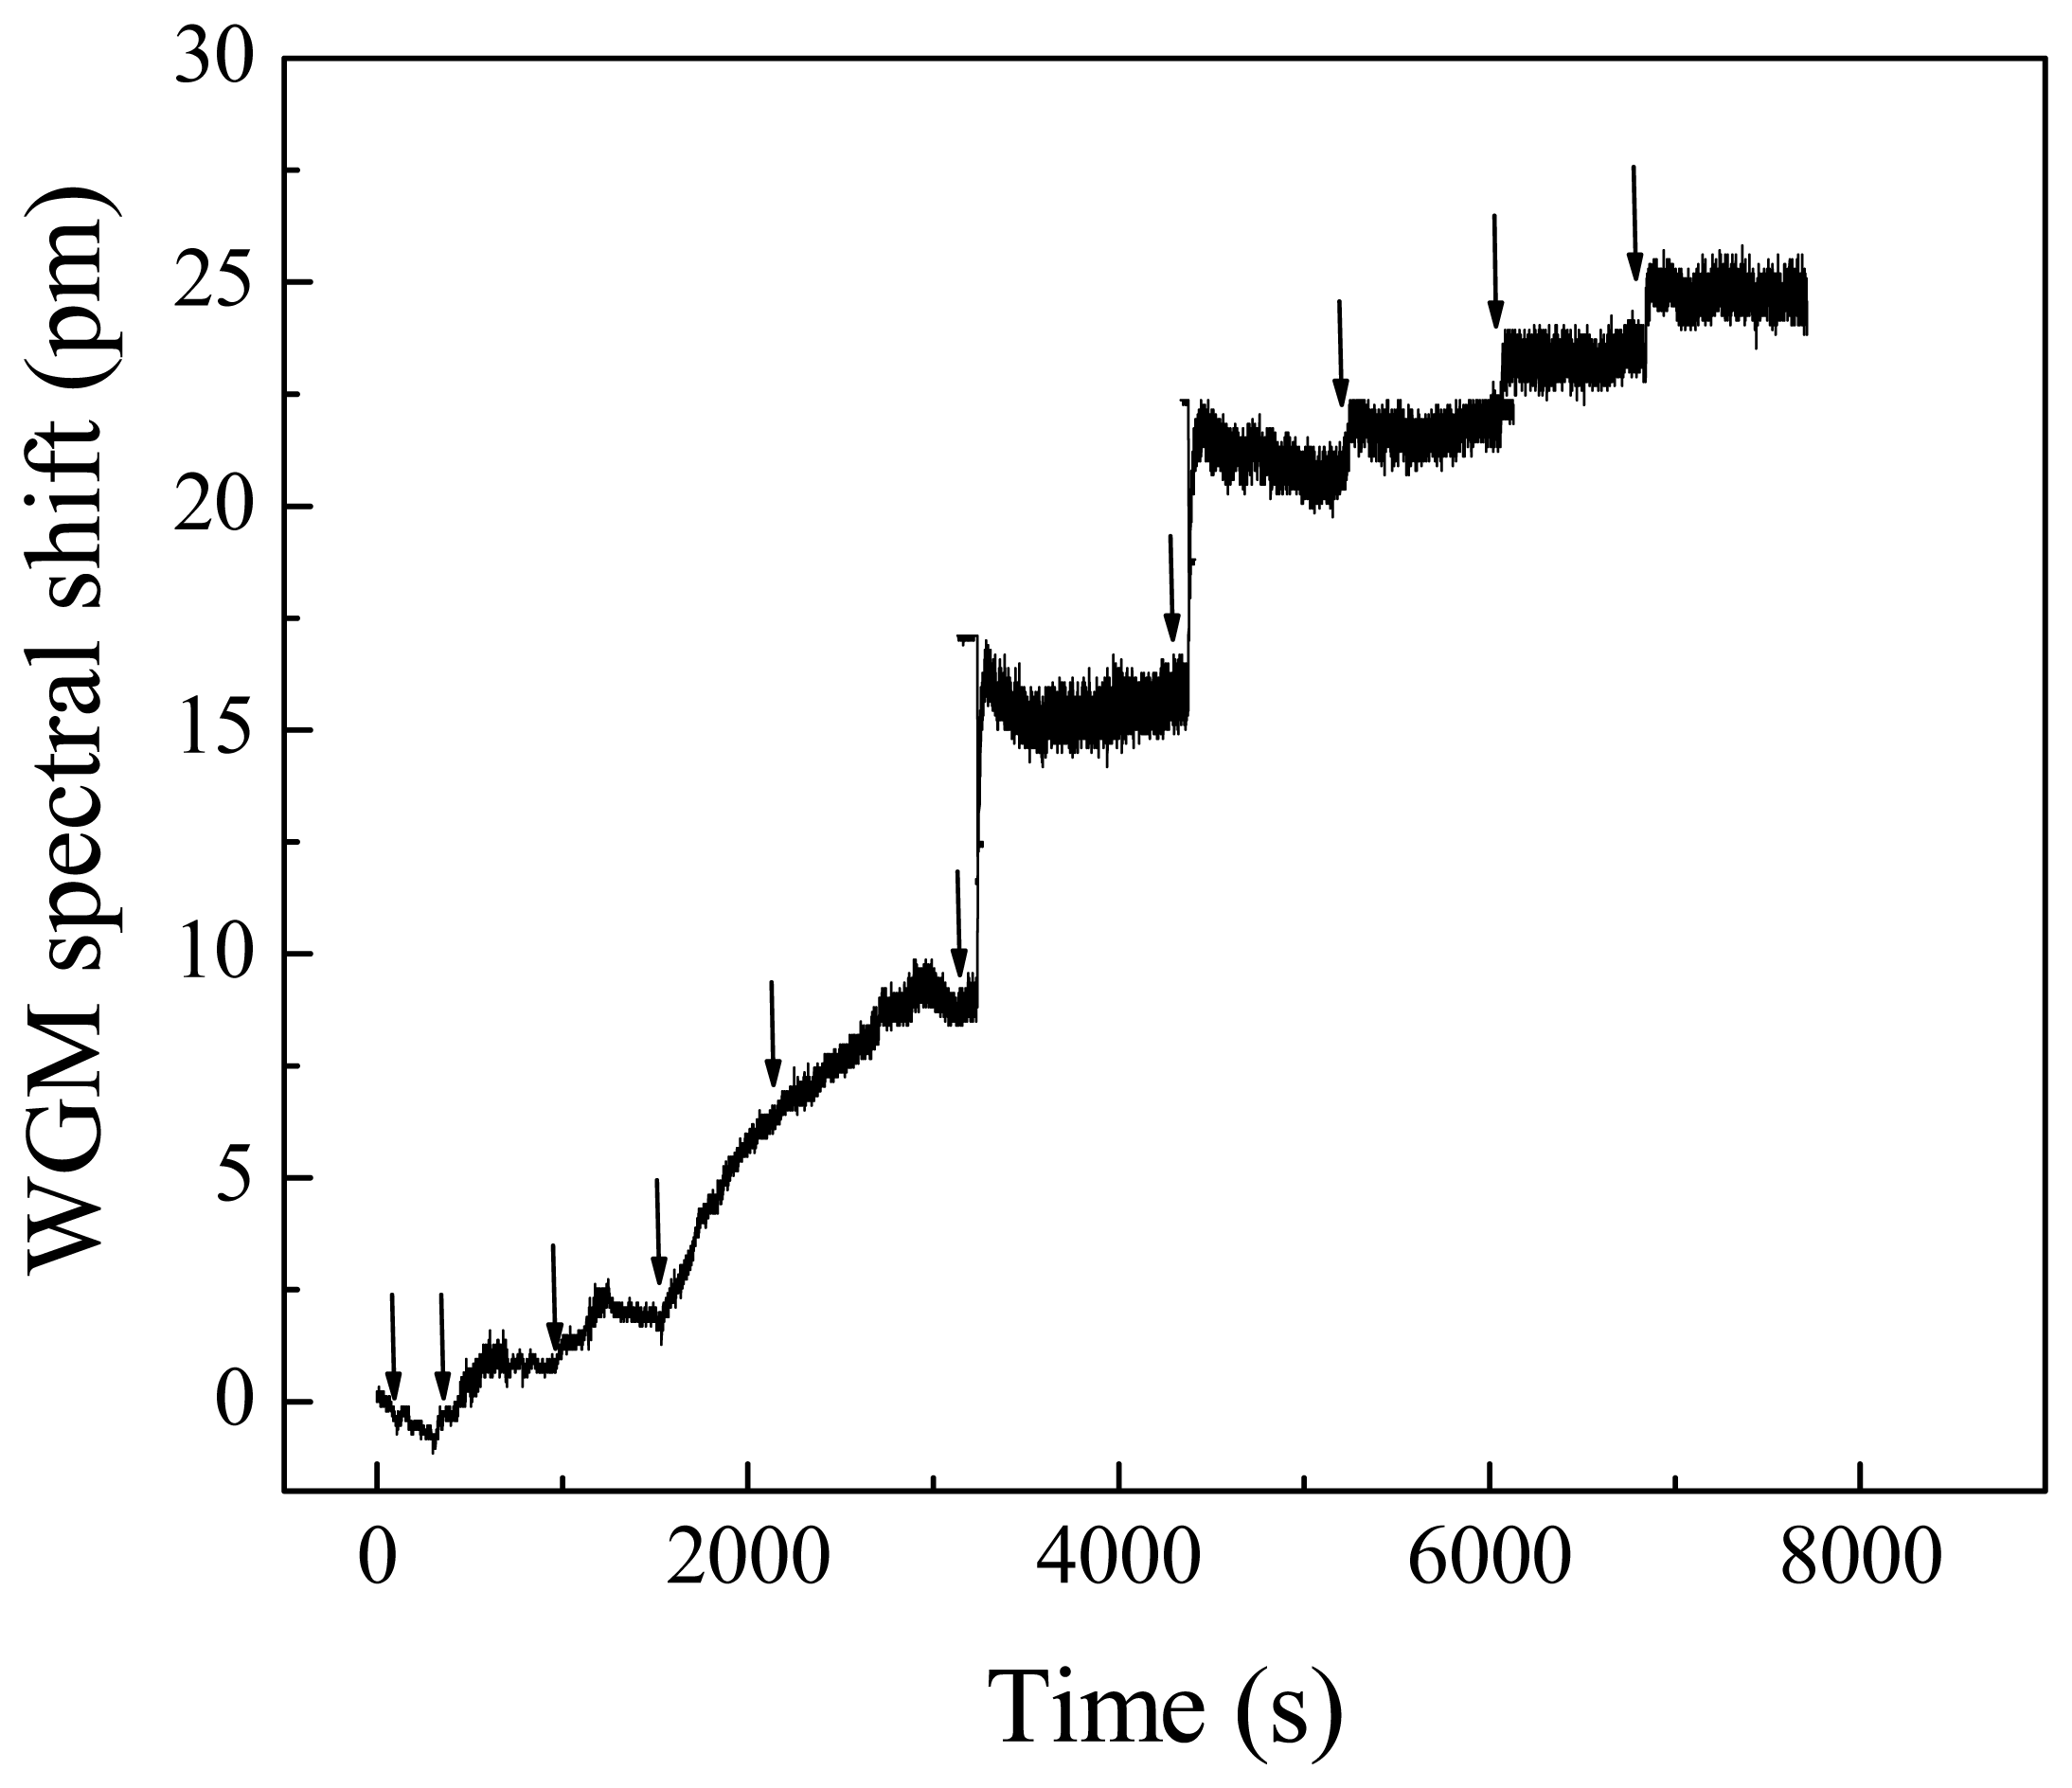
The primary experiment in this work demonstrates that a microsphere treated with anti-thrombin aptamers is capable of specifically capturing thrombin molecules. Thrombin is first dissolved in DI water (pH ∼ 7) and stored in a plastic vial, as it typically adsorbs to silica surfaces. The aptamer-modified sphere is immersed in DI water and different concentrations of thrombin are injected to the fluidics cell gradually. Upon each injection, the WGM shifts to a higher wavelength, as shown in the sensorgram in Fig. 6, indicating a binding between thrombin and aptamers on the sphere surface. The WGM spectral response as a function of the thrombin concentration is plotted in Fig. 7.
The interaction between aptamer and thrombin can be described by:
which leads to the relation between the transduction signal (WGM spectral shift) and the thrombin concentration:
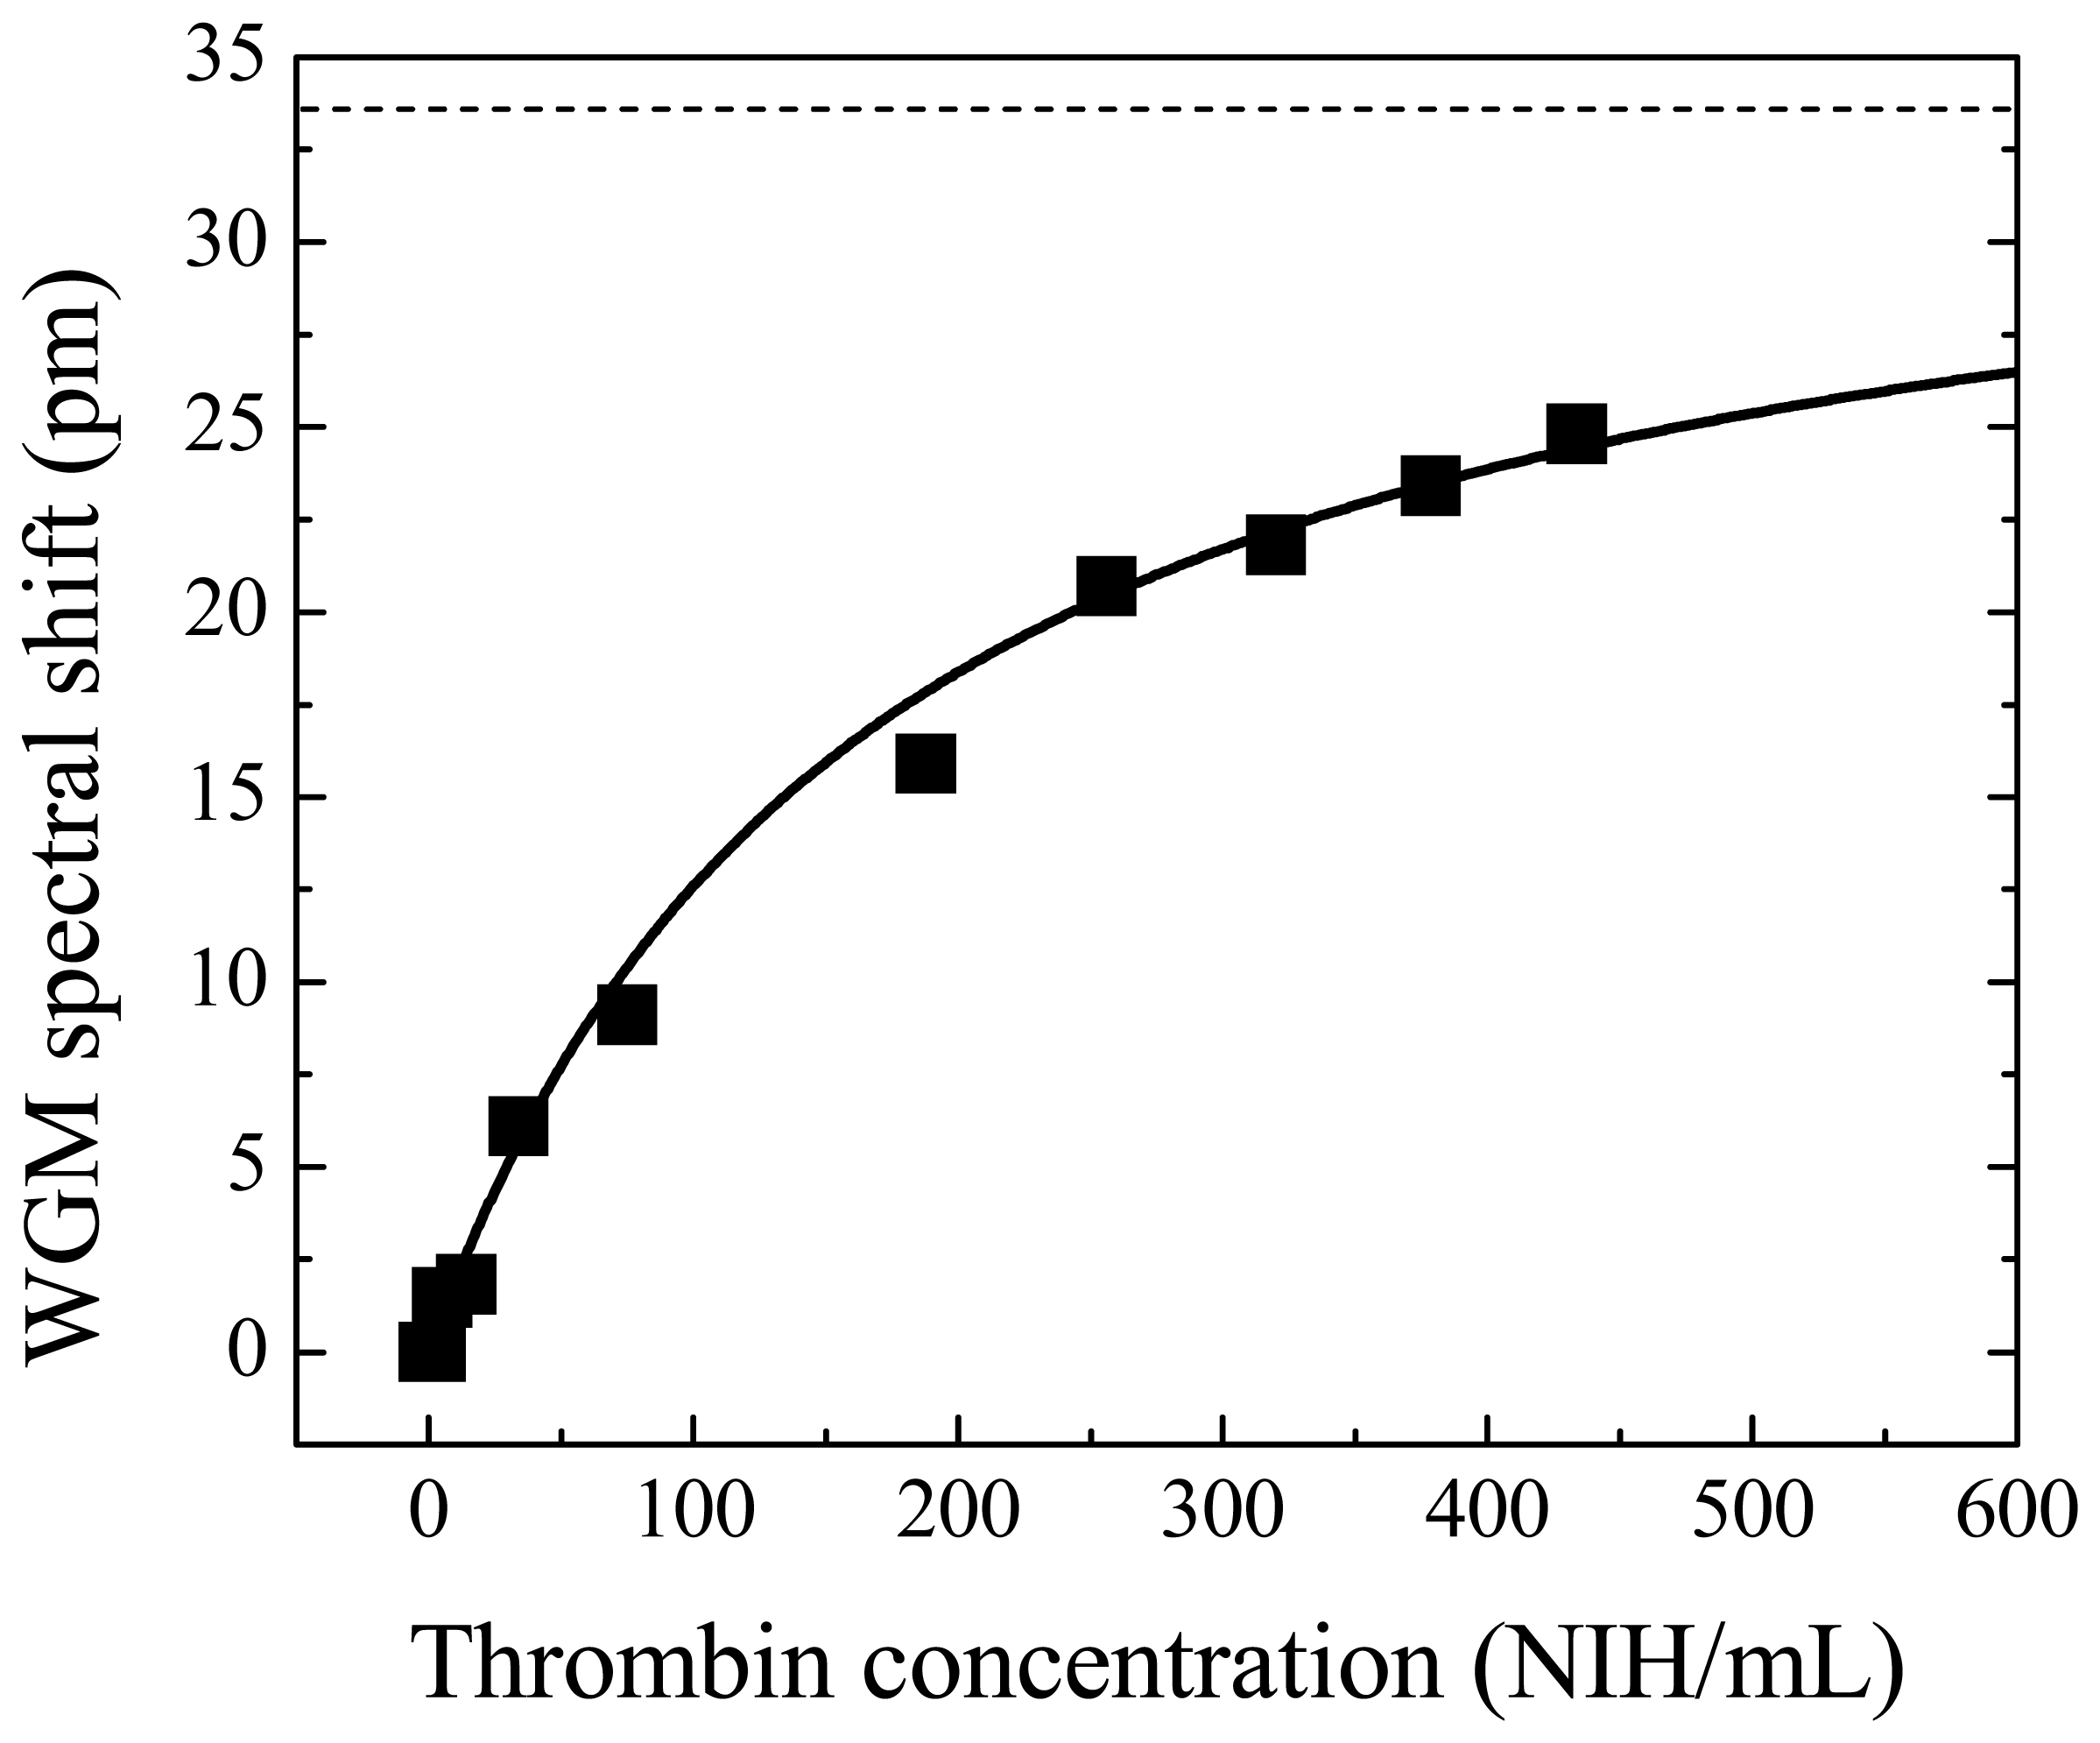
where Kd is the dissociation constant and δλmax is the WGM shift when the microsphere surface is saturated with aptamer molecules. The solid curve in Fig. 7 shows the fitted data with Kd = 170 NIH/mL (or approximately 1000 nM) and δλmax = 34 pm.
The Kd for thrombin-aptamer interaction has been shown to exhibit large variations in recent studies, ranging from 2.68 nM – 450 nM [21-25]. This large discrepancy is attributed to different experimental methods and conditions, and the composition and pH of the incubation buffer [23-25]. In our experiment, the aptamers-thrombin interaction appears to be weaker than in other experiments. By using Eq. (1) with αex = 4πε0 × 2.5 × 10-21 cm3, R = 150 μm (the sphere size for this experiment), and δλmax = 34 pm, the maximum thrombin surface density is estimated to be 5.4 × 1012 cm-2. This density corresponds to an area of 18 nm2 per thrombin molecule, which is close to projected area of each thrombin molecule of 20 nm2 [19], suggesting good surface coverage with aptamers and subsequent efficient thrombin binding. The detection limit of thrombin is estimated to be on the order of 1 NIH Unit/mL, which, based on Eq. (3), corresponds to a WGM shift of 0.2 pm, within the spectral resolution capability of our system.
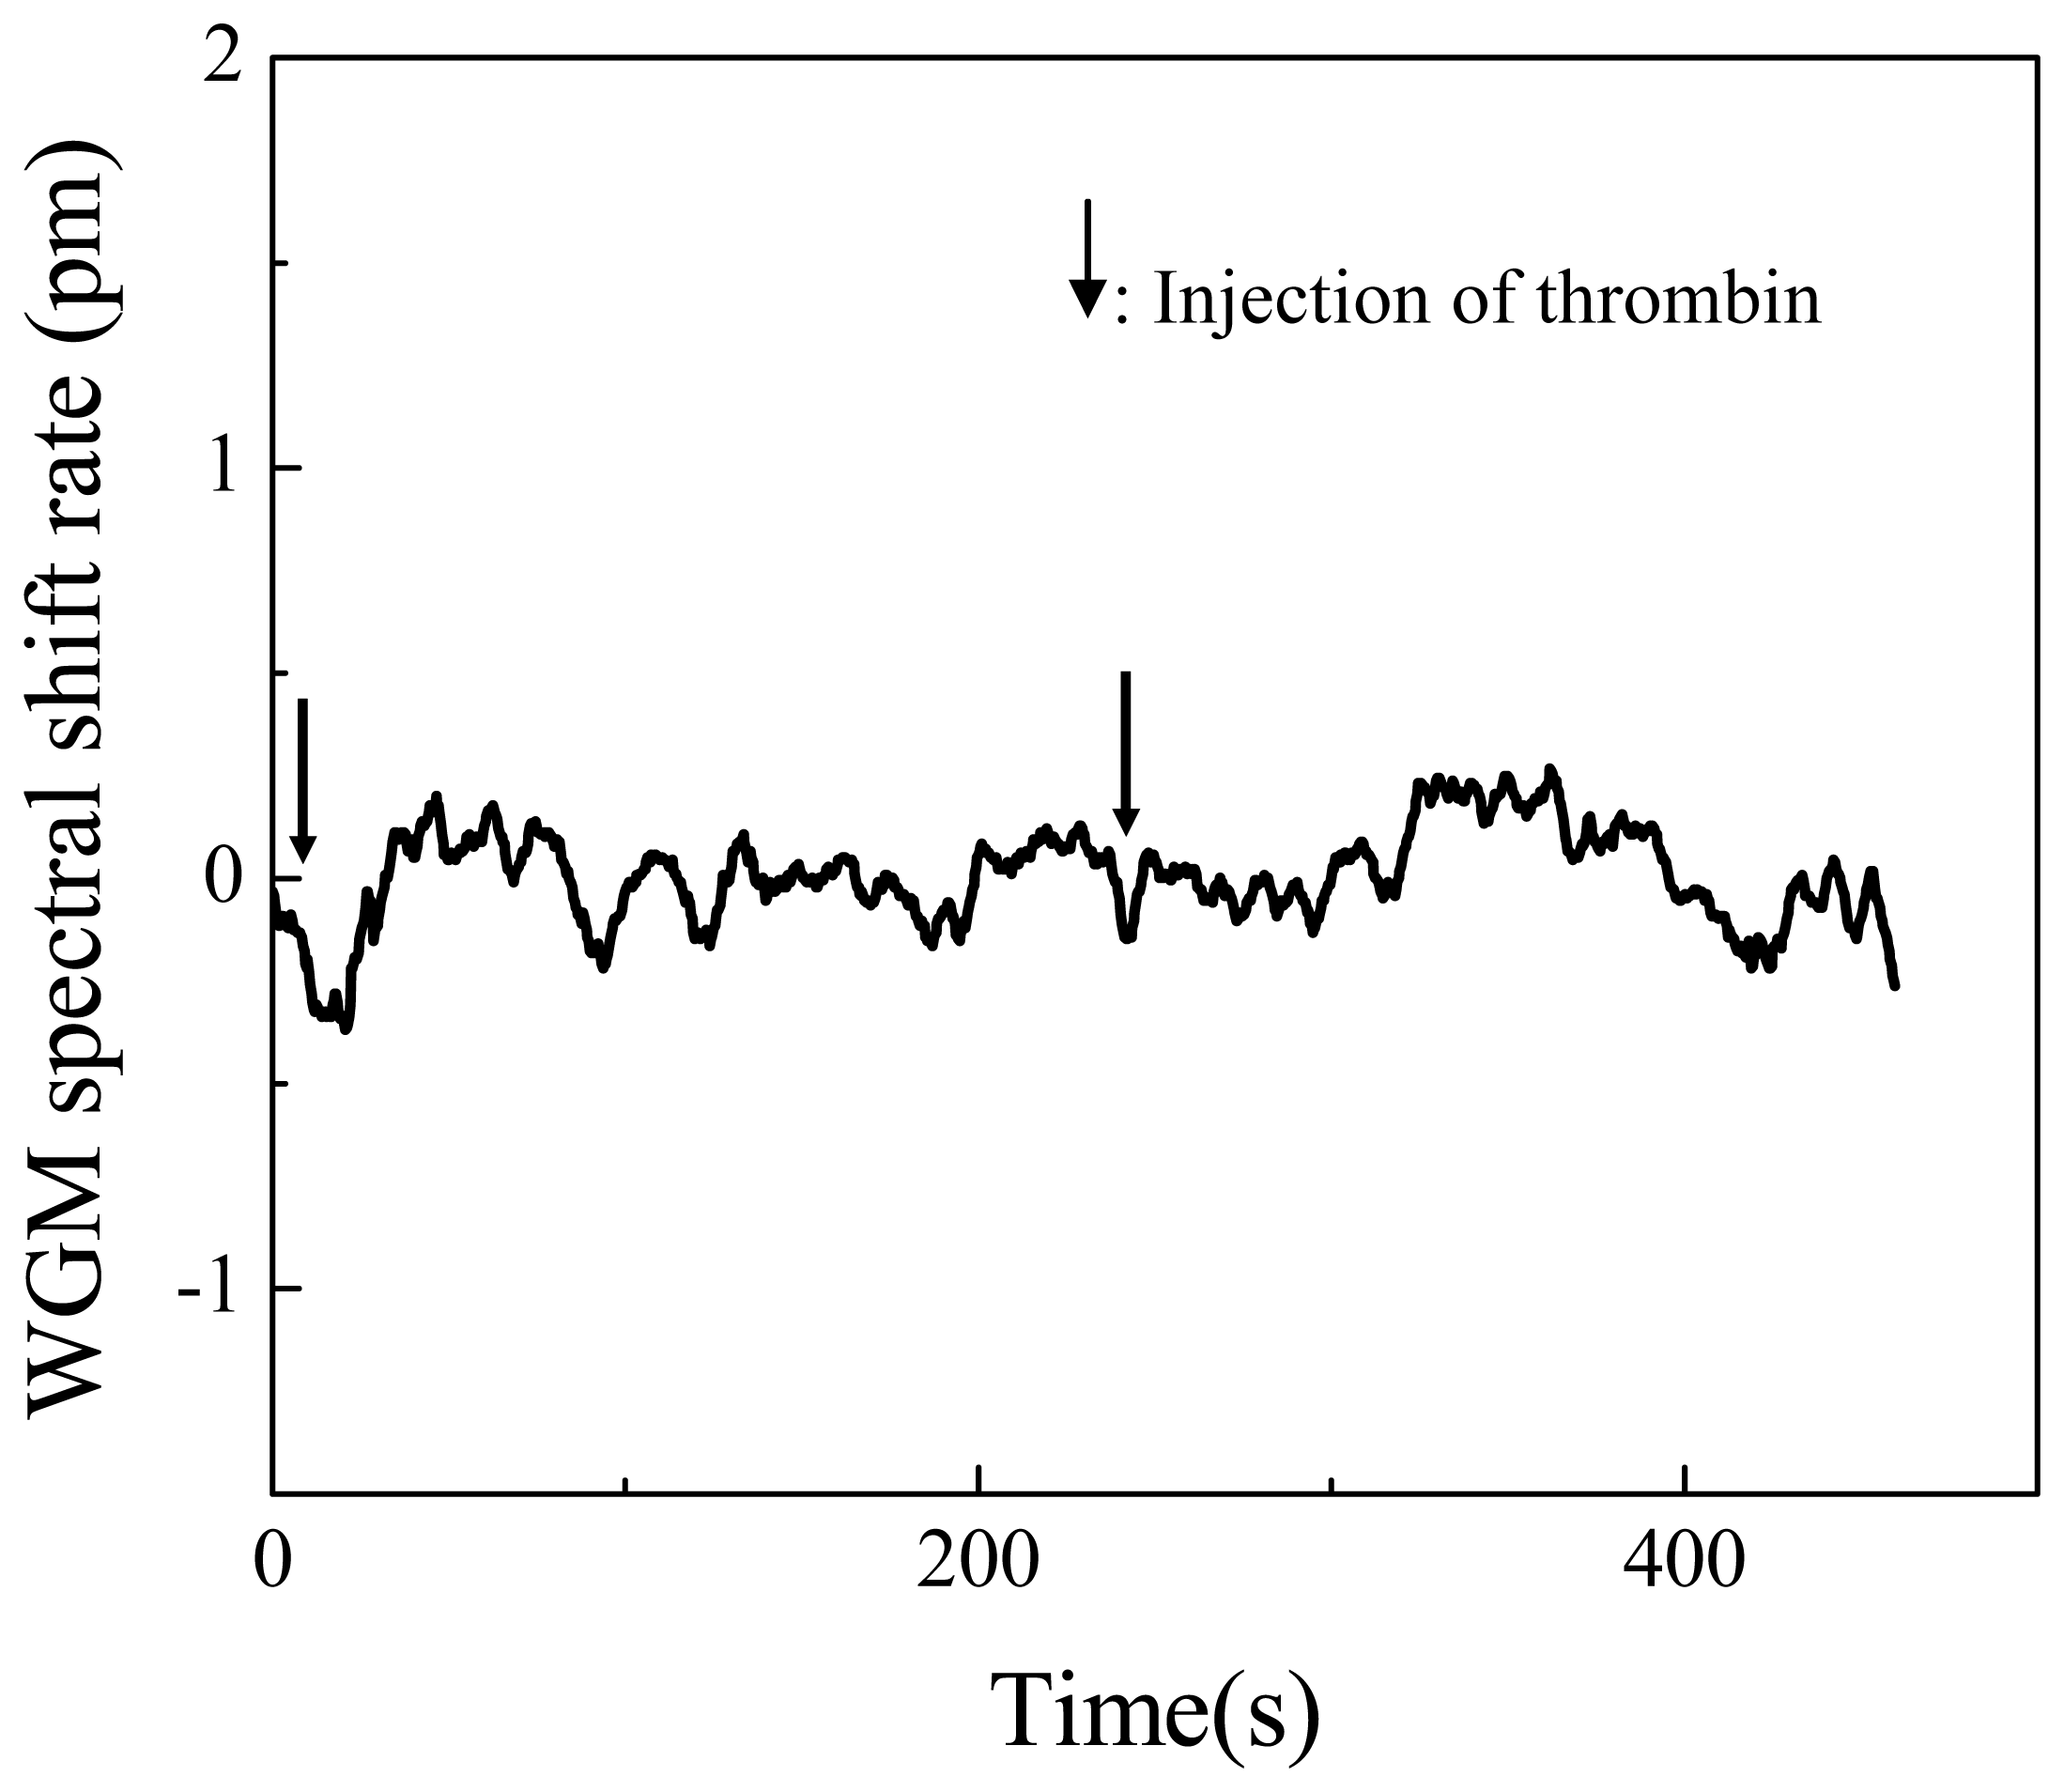
In order to better know the specificity of thrombin-aptamer interaction, another control experiment is performed under the same conditions, except that non-aptamer oligonucleotides are immobilized on the sphere surface. To avoid any unexpected non-specific adsorption, low concentrations of thrombin are used. As evidenced in Fig. 8, thrombin molecules do not bind to non-aptamer oligonucleotides when the thrombin concentration is below 10 NIH Unit/mL. At higher thrombin concentrations, however, such specificity is observed to gradually diminish, in agreement with what was reported previously [14]. This non-specific binding may set the upper limit in thrombin concentration in sensor development.
4. Summary
We have developed a label-free method using a microsphere biosensor for thrombin detection. In this sensor model, anti-thrombin aptamer is used as the receptor layer on the microsphere. The high thrombin capture efficiency and the control experiment indicated that the aptamer-based microsphere sensor has high specificity and binding affinity to thrombin. The detection limit is estimated to be on the order of 1 NIH Unit/mL. Compared with other thrombin detection methods, our method is simple and faster, and has potential to scale up to sensor arrays through fiber technologies. Most of all, it avoids the laborious labeling process, which may hinder the thrombin-aptamer binding. The combination of the microsphere sensor with aptamers should allow high sensitivity and selectivity detection for a wide range of biomolecules.
Acknowledgments
This work was sponsored by the 3M Non-Tenured Faculty Award, the University of Missouri Research Board Award (RB 05-013), and the University of Missouri Life Sciences Center. I. M. White is supported by the MU Life Sciences Fellowship Program. The authors are thankful for helpful discussion with Prof. X. S. Zhao and Dr. Wei Liao.
References and Notes
- Bohren, C. F.; Huffman, D. R. Absorption and Scattering of Light by Small Particles; John Wiley & Sons, Inc: New York, 1998. [Google Scholar]
- Hanumegowda, N. M.; Stica, C. J.; Patel, B. C.; White, I. M.; Fan, X. Refractometric sensors based on microsphere resonators. Appl. Phys. Lett. 2005, 87, 201107. [Google Scholar]
- Vollmer, F.; Arnold, S.; Braun, D.; Teraoka, I.; Libchaber, A. Multiplexed DNA quantification by spectroscopic shift of two microsphere cavities. Biophys. J. 2003, 85, 1974–1979. [Google Scholar]
- Tombelli, S.; Minunni, M.; Mascini, M. Review, Analytical applications of Aptamers. Biosens. Bioelecs. 2005, 20, 2424–2434. [Google Scholar]
- O'Sullivan, C. K. Review: Aptasensors – the future of biosensing. Anal. Bioanal. Chem. 2002, 372, 44–48. [Google Scholar]
- Vollmer, F.; Braun, D.; Libchaber, A.; Khoshsima, M.; Teraoka, I.; Arnold, S. Protein detection by optical shift of a resonant microcavity. Appl. Phys. Lett. 2002, 80, 4057–4059. [Google Scholar]
- Hanumegowda, N. M.; White, I. M.; Oveys, H.; Fan, X. Label-free protease sensors based on optical Microsphere resonators. Sensor Lett. 2005, 3, 315–319. [Google Scholar]
- White, I. M.; Hanumegowda, N. M.; Fan, X. Sub-femtomole detection of small molecules with microsphere sensors. Opt. Lett. 2005, 30, 3189–3191. [Google Scholar]
- Lee, M.; Walt, D. R. A Fiber-optic Micro array Biosensor Using Aptamers as Receptors. Anal. Biochem. 2000, 282, 142–146. [Google Scholar]
- Becker, R. C.; Spencer, F. A. Thrombin: Structure, Biochemistry, Measurement, and Status in Clinical Medicine. Journal of Thrombosis and Thrombolysis 1998, 215–229. [Google Scholar]
- Garden, S. R.; Doellgast, G.J.; Killham, K.S.; Strachan, N. J. C. A fluorescent coagulation assay for thrombin using a fiber optic evanescent wave sensor. Biosens. Bioelecs. 2004, 19, 737–734. [Google Scholar]
- Potryailo, R. A.; Conrad, R. C.; Ellington, A. D.; Hieftje, G. M. Adapting Selected Nucleic Acid Ligands (Aptamers) to Biosensors. Anal Chem. 1998, 70, 3419–3425. [Google Scholar]
- Tung, C. H.; Gerszten, R. E.; Jaffer, F. A.; Weissleder, R. A Novel Near-Infrared Fluorescence Sensor for Detection of Thrombin Activation in Blood. Chem. Biochem. 2002, 3, 207–211. [Google Scholar]
- Liao, W.; Wei, F.; Lin, D.; Qian, M. X.; Yuan, G.; Zhao, X. S. FTIR-ATR detection of proteins and small molecules through DNA conjugation. Sens. Actuators. B 2006, 114, 445–450. [Google Scholar]
- Pavlov, V.; Xiao, Y.; Shlyahovsky, B.; Willner, I. Aptamer-Functionalized Au Nanoparticles for the Amplified Optical Detection of Thrombin. J. Am. Chem. Soc. 2004, 126, 11768–11769. [Google Scholar]
- Charles, P. T.; Vora, G. J.; Andreadis, J. D.; Fortney, A. J.; Meador, C. E.; Dulcey, C. S.; Stenger, D. A. Fabrication and Surface Characterization of DNA Microarrays Using Amine- And Thiol-Terminated Oligonucleotide Probes. Langmuir 2003, 19, 1586–1591. [Google Scholar]
- Ilchenko, V. S.; Yao, X. S.; Maleki, L. Pigtailing the high-Q microsphere cavity: a simple fiber coupler for optical whispering-gallery modes. Opt. Lett. 1999, 24, 723–725. [Google Scholar]
- Arnold, S.; Khoshsima, M.; Teraoka, I. Shift of whispering-gallery modes in microspheres by protein adsorption. Opt. Lett. 2003, 28, 272–274. [Google Scholar]
- Freitas, R. A., Jr. Nanomedicine, Volume IIA: Biocompatibility; Landes Bioscience: Georgetown, TX, 2003; pp. 74–78. [Google Scholar]
- Carter, D. C.; He, X.; Munson, S. H.; Twigg, P. D.; Gernert, K. M.; Broom, M. B.; Miller, T. Y. Three-dimensional structure of human serum albumin. Science 1989, 244, 1195–1198. [Google Scholar]
- Wu, Q.; Tsiange, M.; Sadler, J. E. Localization of the Single-stranded DNA Binding Site in the Thrombin Anion-binding Exosite. J. Biol. Chem. 1992, 267, 24408–24412. [Google Scholar]
- Tasset, D. M.; Kubik, M. F.; Steiner, W. Oligonucleotide inhibitors of human thrombin that bind distinct epitopes. J. Mol. Biol. 1997, 272, 688–698. [Google Scholar]
- German, I.; Buchanan, D. D.; Kennedy, R. T. Aptamers as Ligands in Affinty Probe Capillary Electrophoresis. Anal. Chem. 1998, 70, 4540–4545. [Google Scholar]
- Li, J. J.; Fang, X.; Tan, W. Molecular Aptamer Beacons for Real-Time Protein Recognition. Biochem. Biophys. Res. Commun. 2002, 292, 31–40. [Google Scholar]
- Berezovski, M.; Nutiu, R.; Li, Y.; Krylov, S. N. Affinity Analysis of a Protein-Aptamer Complex Using Nonequilibrium Capillary Electrophoresis of Equilibrium Mixtures. Anal. Chem. 2003, 75, 1382–1386. [Google Scholar]
Figure 1.
Experimental setup. (a) The sphere is immersed in a fluidic cell and in physical contact with a fiber prism. A tunable diode laser at 980 nm is coupled into the WGM of the sphere via frustrated total internal reflection at the sphere-prism interface. The laser is repeatedly scanned in wavelength and controlled by a computer DAQ card. (b) Image of a fiber prism with a fused silica microsphere.

Figure 2.
WGM spectral position shifts as bio/chemical molecules attach to the surface over time. The lines are shifted vertically for clarity.
Figure 2.
WGM spectral position shifts as bio/chemical molecules attach to the surface over time. The lines are shifted vertically for clarity.

Figure 3.
Sensorgram of a microsphere resonator when aptamer molecules bind to the silanized sphere surface via PDC. The total WGM shift due to aptamer binding is 4.1 pm, corresponding to an aptamer surface density of 3 × 10¹²/cm2. Arrow indicates when aptamer solution is added. Aptamer concentration is 0.5 mM. Sphere size: R = 125 μm.

Figure 4.
Sensorgram of BSA binding to the PDC cross-linker on the silanized microsphere surface. The total WGM shift is 54 pm, corresponding to a BSA surface density of 3.4×10¹²/cm2. Arrow indicates when BSA solution is added. BSA concentration is 0.8 mg/mL. Sphere size: R = 100 μm.
Figure 4.
Sensorgram of BSA binding to the PDC cross-linker on the silanized microsphere surface. The total WGM shift is 54 pm, corresponding to a BSA surface density of 3.4×10¹²/cm2. Arrow indicates when BSA solution is added. BSA concentration is 0.8 mg/mL. Sphere size: R = 100 μm.

Figure 5.
Sensorgram shows that BSA molecules do not bind to the sphere when sphere surface is immobilized with aptamers. Arrow indicates when BSA solution is added. The initial spikes are due to the temperature transient after the BSA injection. BSA concentration = 0.5 mg/mL.
Figure 5.
Sensorgram shows that BSA molecules do not bind to the sphere when sphere surface is immobilized with aptamers. Arrow indicates when BSA solution is added. The initial spikes are due to the temperature transient after the BSA injection. BSA concentration = 0.5 mg/mL.

Figure 6.
Sensorgram of thrombin binding to sphere surface immobilized with aptamers. Arrows indicate when thrombin is added. The final concentrations of thrombin are 5 NIH/mL, 14.2 NIH/mL, 34 NIH/mL, 75 NIH/mL, 188 NIH/mL, 256 NIH/mL, 320 NIH/mL, 378.6 NIH/mL, 434 NIH/mL, respectively, after each injection. Sphere size R=150μm

Figure 7.
WGM spectral shift as a function of thrombin concentration obtained from Figure 6. Solid curve is the calculation from Eq. (3) with Kd = 170 NIH Unit/mL and δλmax = 34 pm. Dashed line shows the WGM shift for the maximal thrombin binding (δλmax).

Figure 8.
Control experiment shows that thrombin does not bind to the sphere surface immobilized with non-aptamer oligonucleotides. Arrows indicate when thrombin solution is added to reach a concentration of 7 NIH Unit/mL and 9 NIH Unit/mL, respectively. Spikes are due to transient temperature and refractive index fluctuations after injection.

©2006 by MDPI ( http://www.mdpi.org). Reproduction is permitted for noncommercial purposes.
Share and Cite
MDPI and ACS Style
Zhu, H.; Suter, J.D.; White, I.M.; Fan, X. Aptamer Based Microsphere Biosensor for Thrombin Detection. Sensors 2006, 6, 785-795. https://doi.org/10.3390/s6080785
AMA Style
Zhu H, Suter JD, White IM, Fan X. Aptamer Based Microsphere Biosensor for Thrombin Detection. Sensors. 2006; 6(8):785-795. https://doi.org/10.3390/s6080785
Chicago/Turabian StyleZhu, Hongying, Jonathan D. Suter, Ian M. White, and Xudong Fan. 2006. "Aptamer Based Microsphere Biosensor for Thrombin Detection" Sensors 6, no. 8: 785-795. https://doi.org/10.3390/s6080785