
Convolutional Neural Network Bootstrapped by Dynamic Segmentation and Stigmergy-Based Encoding for Real-Time Human Activity Recognition in Smart Homes

Abstract
:1. Introduction
2. Reported Works
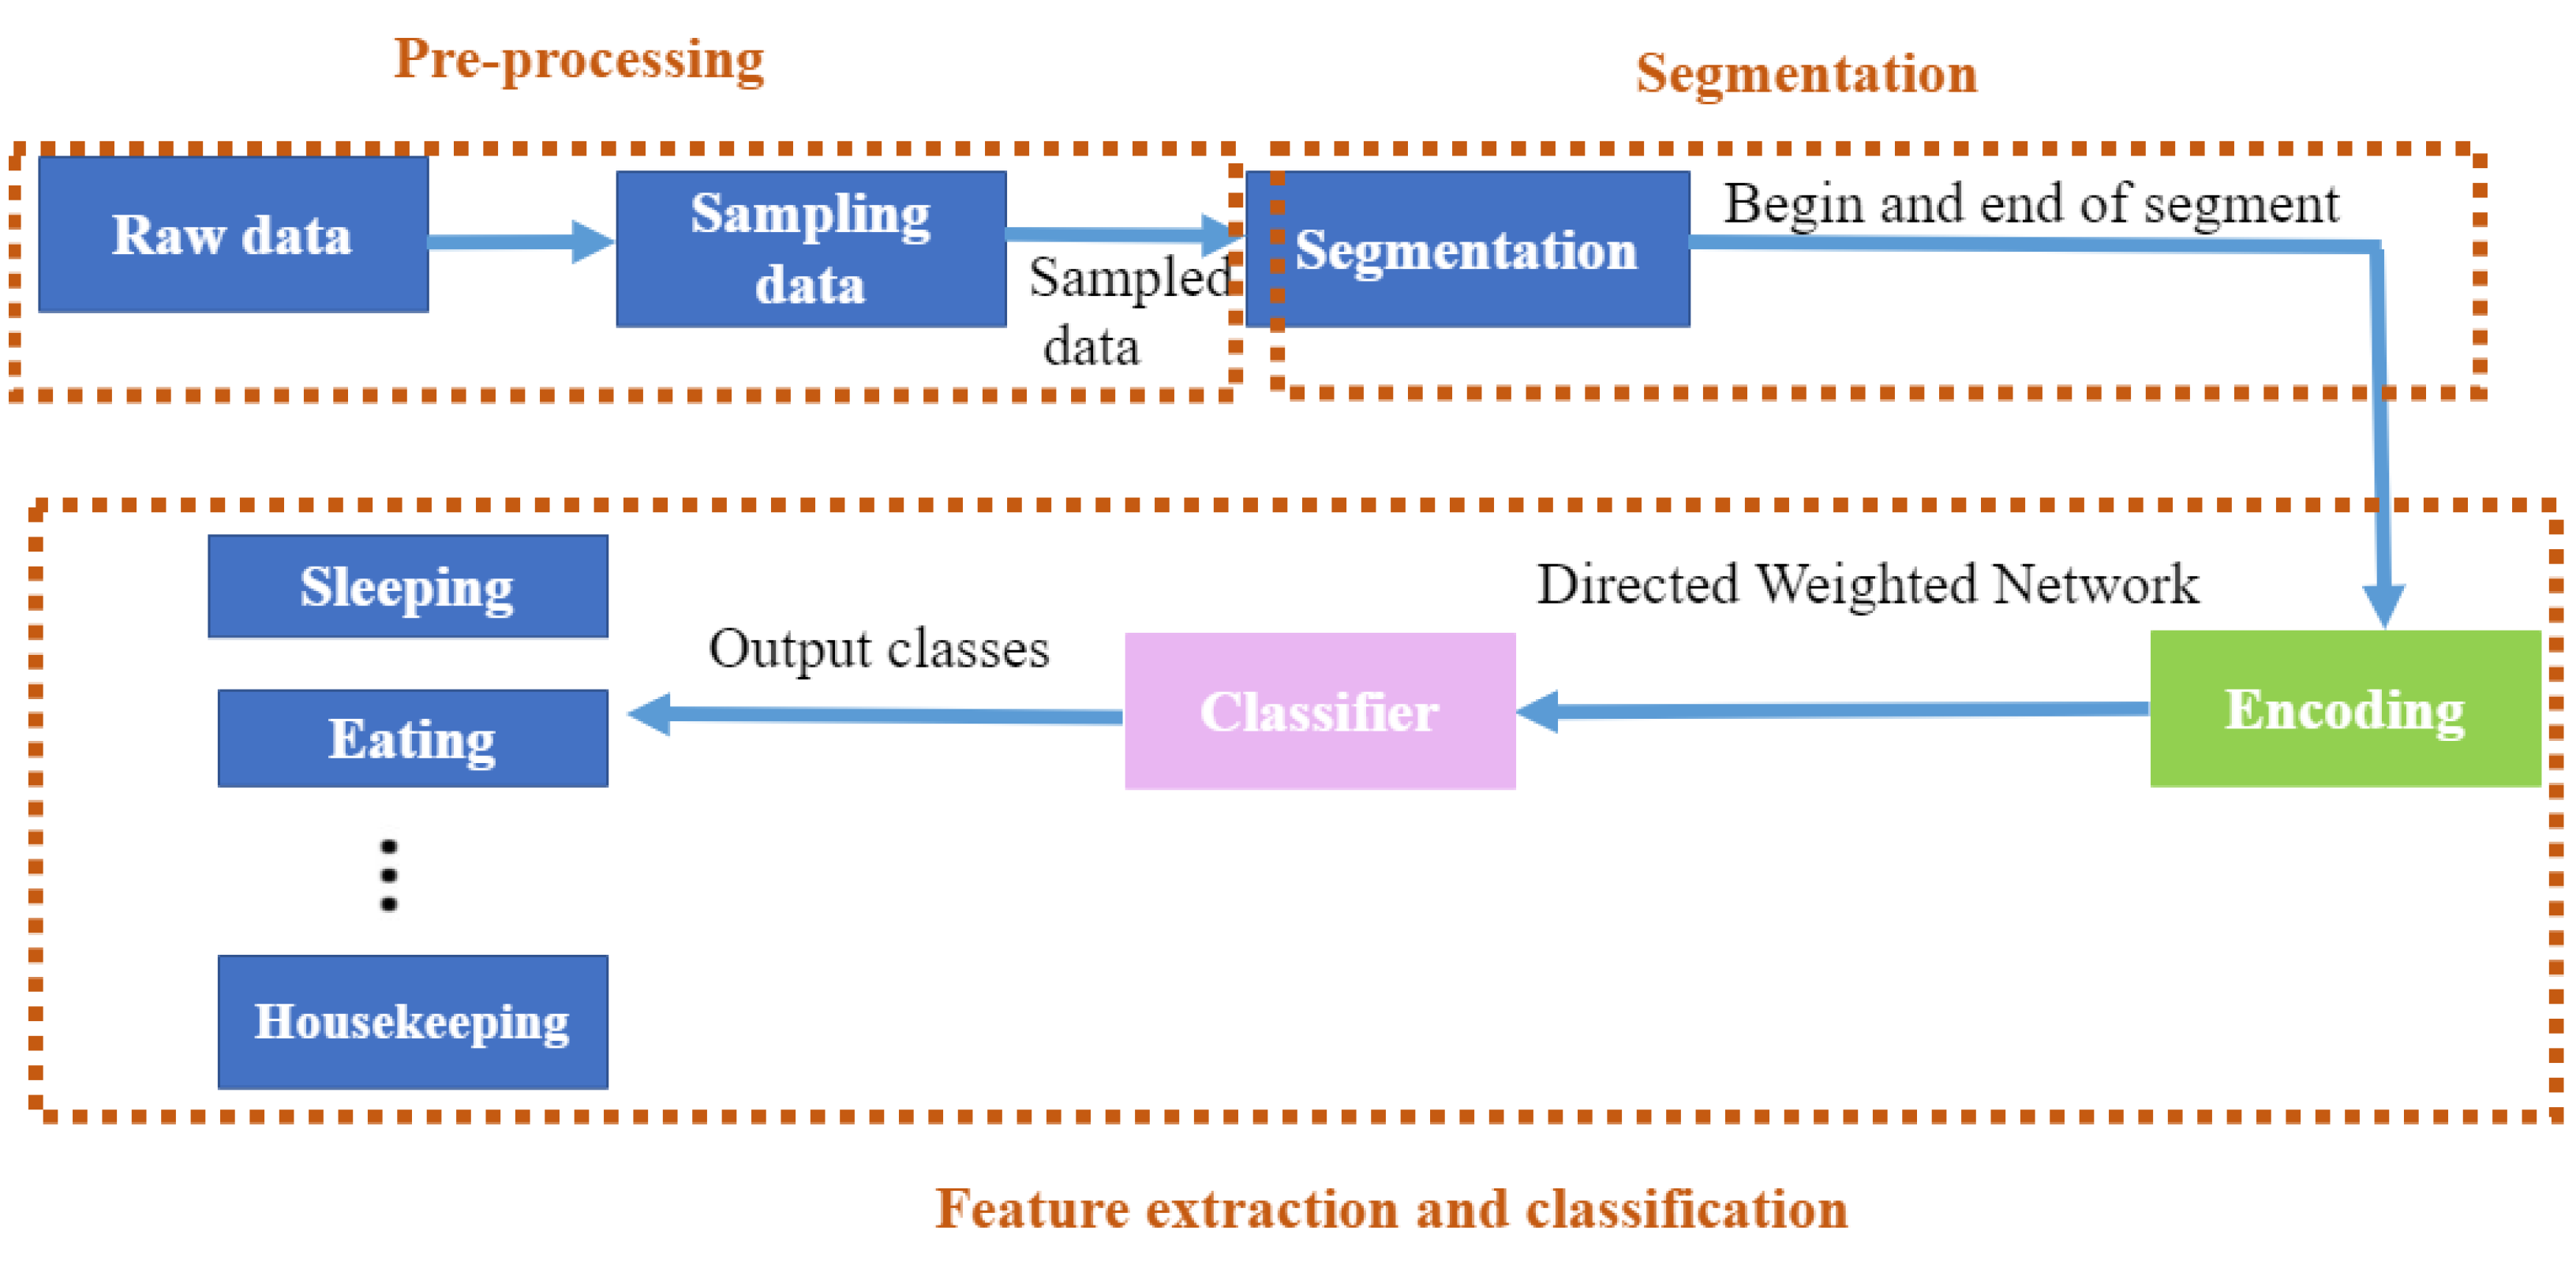
3. Real-Time Human Activity Recognition Framework
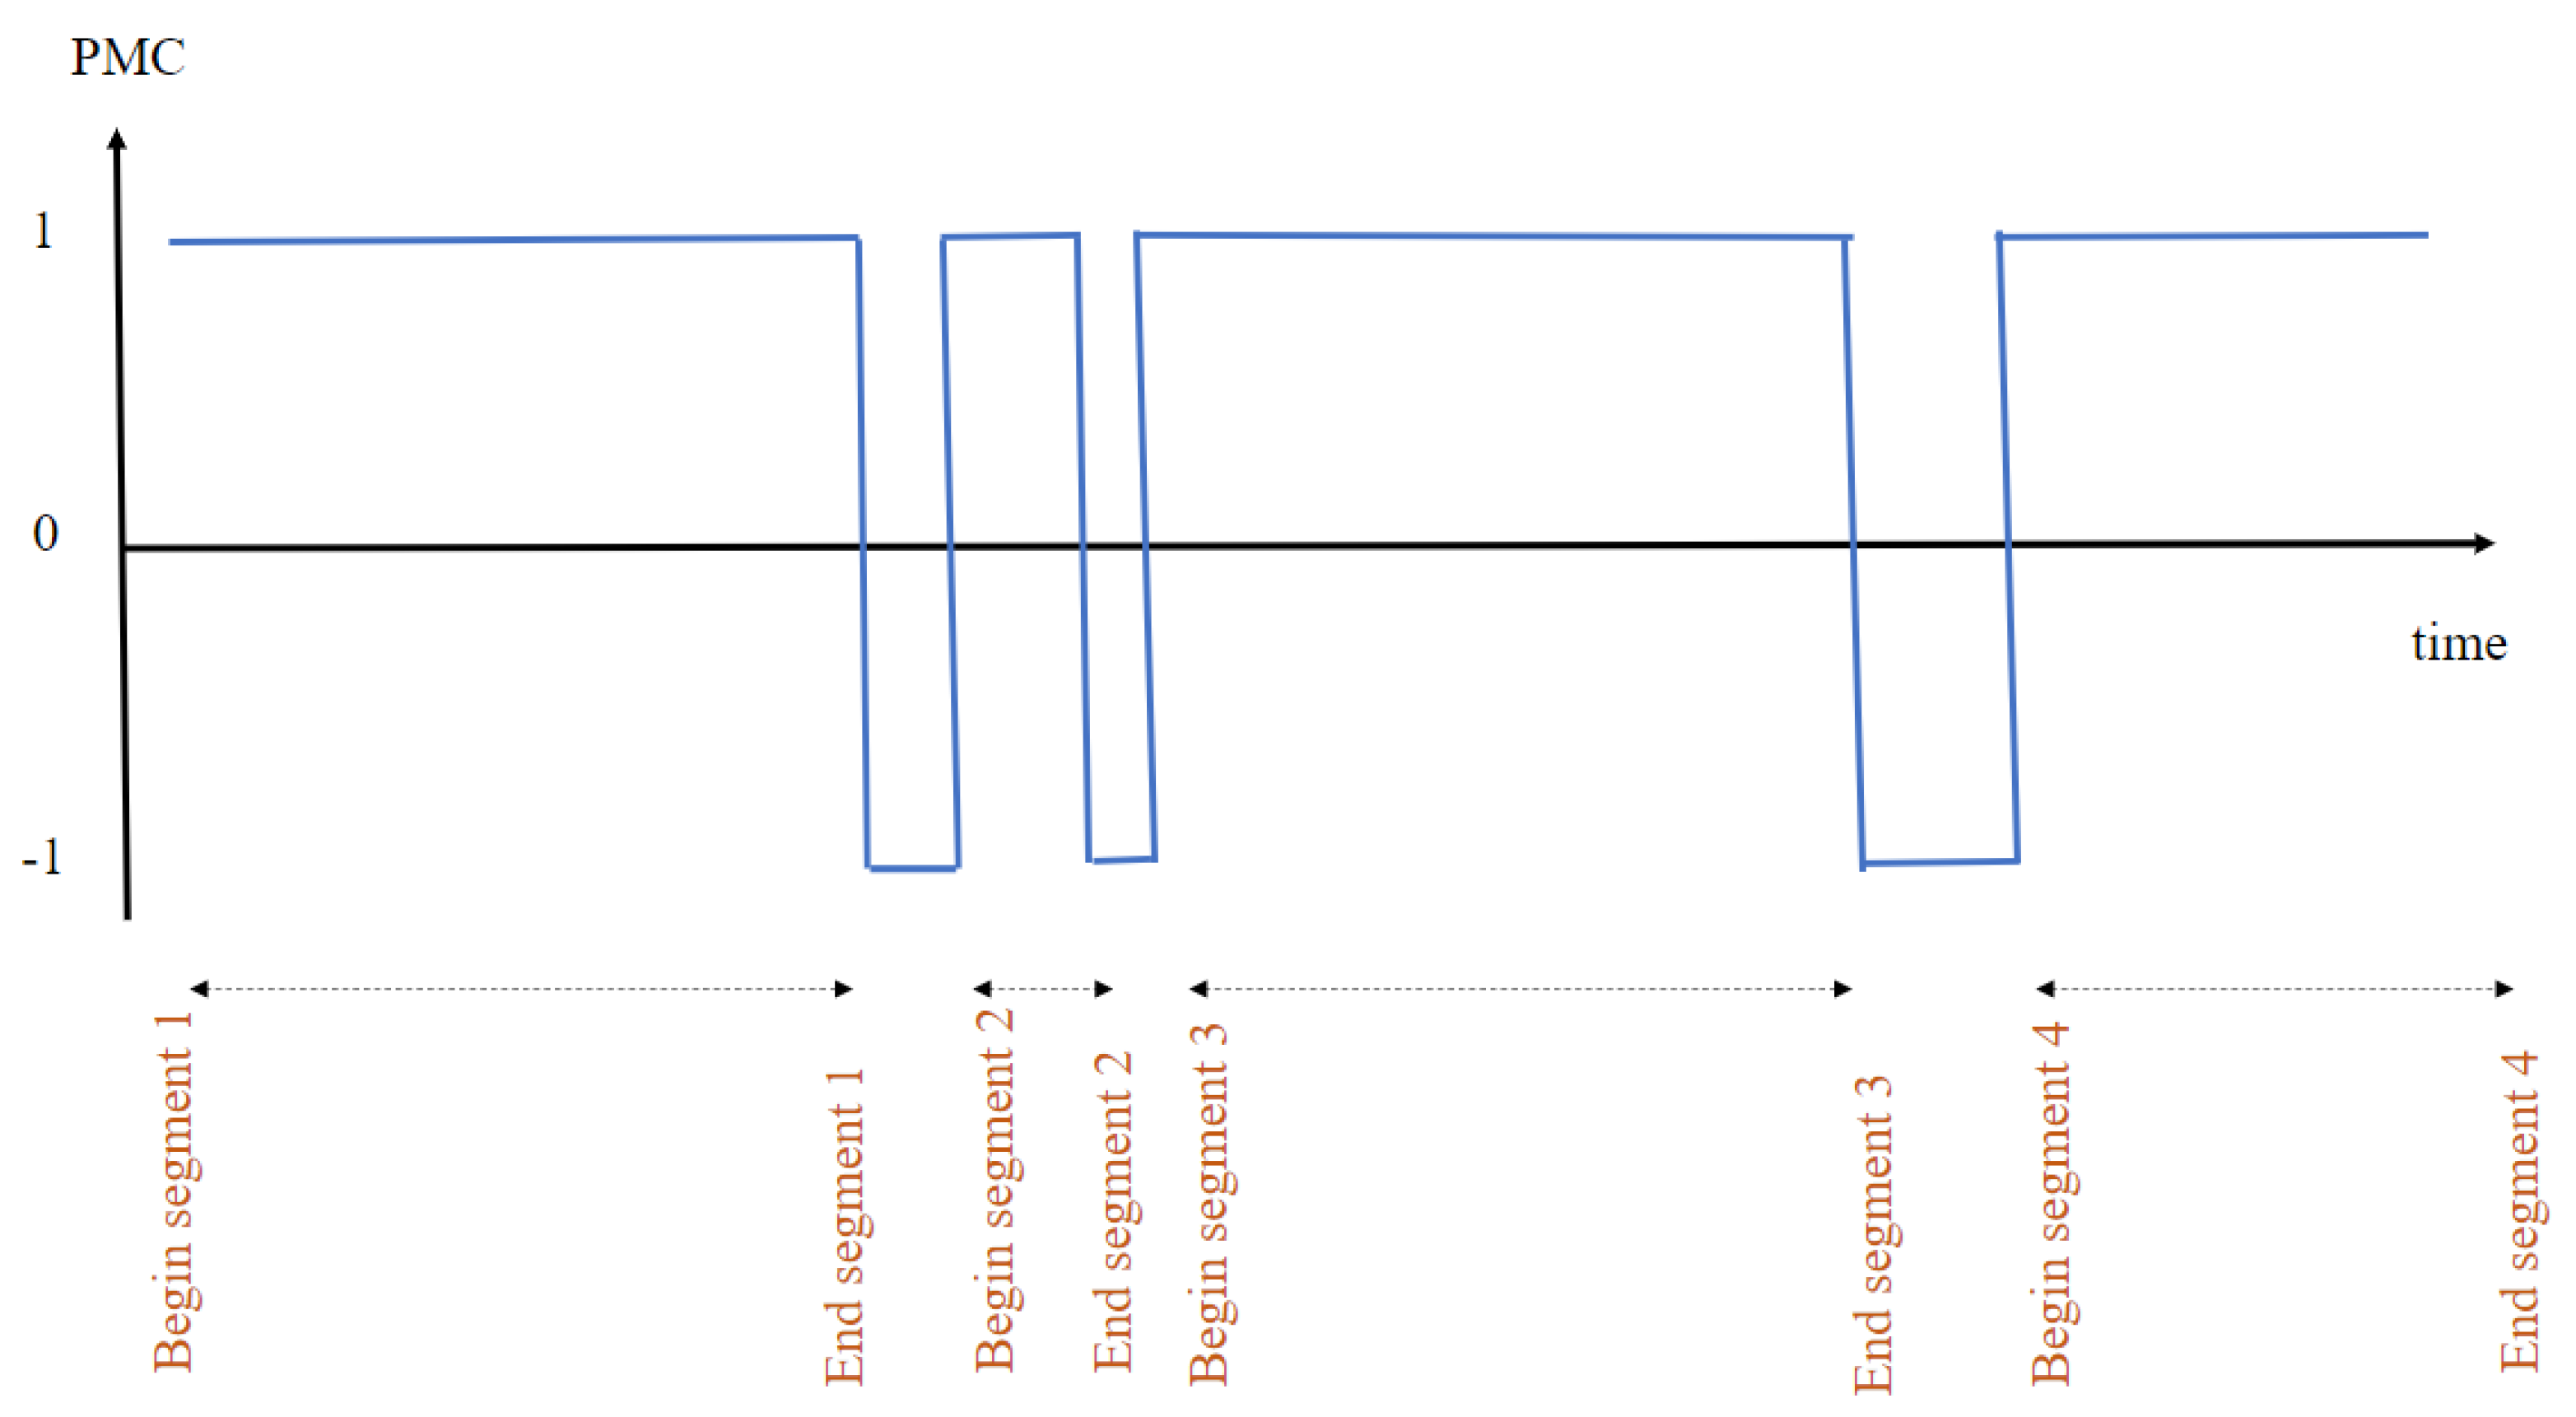
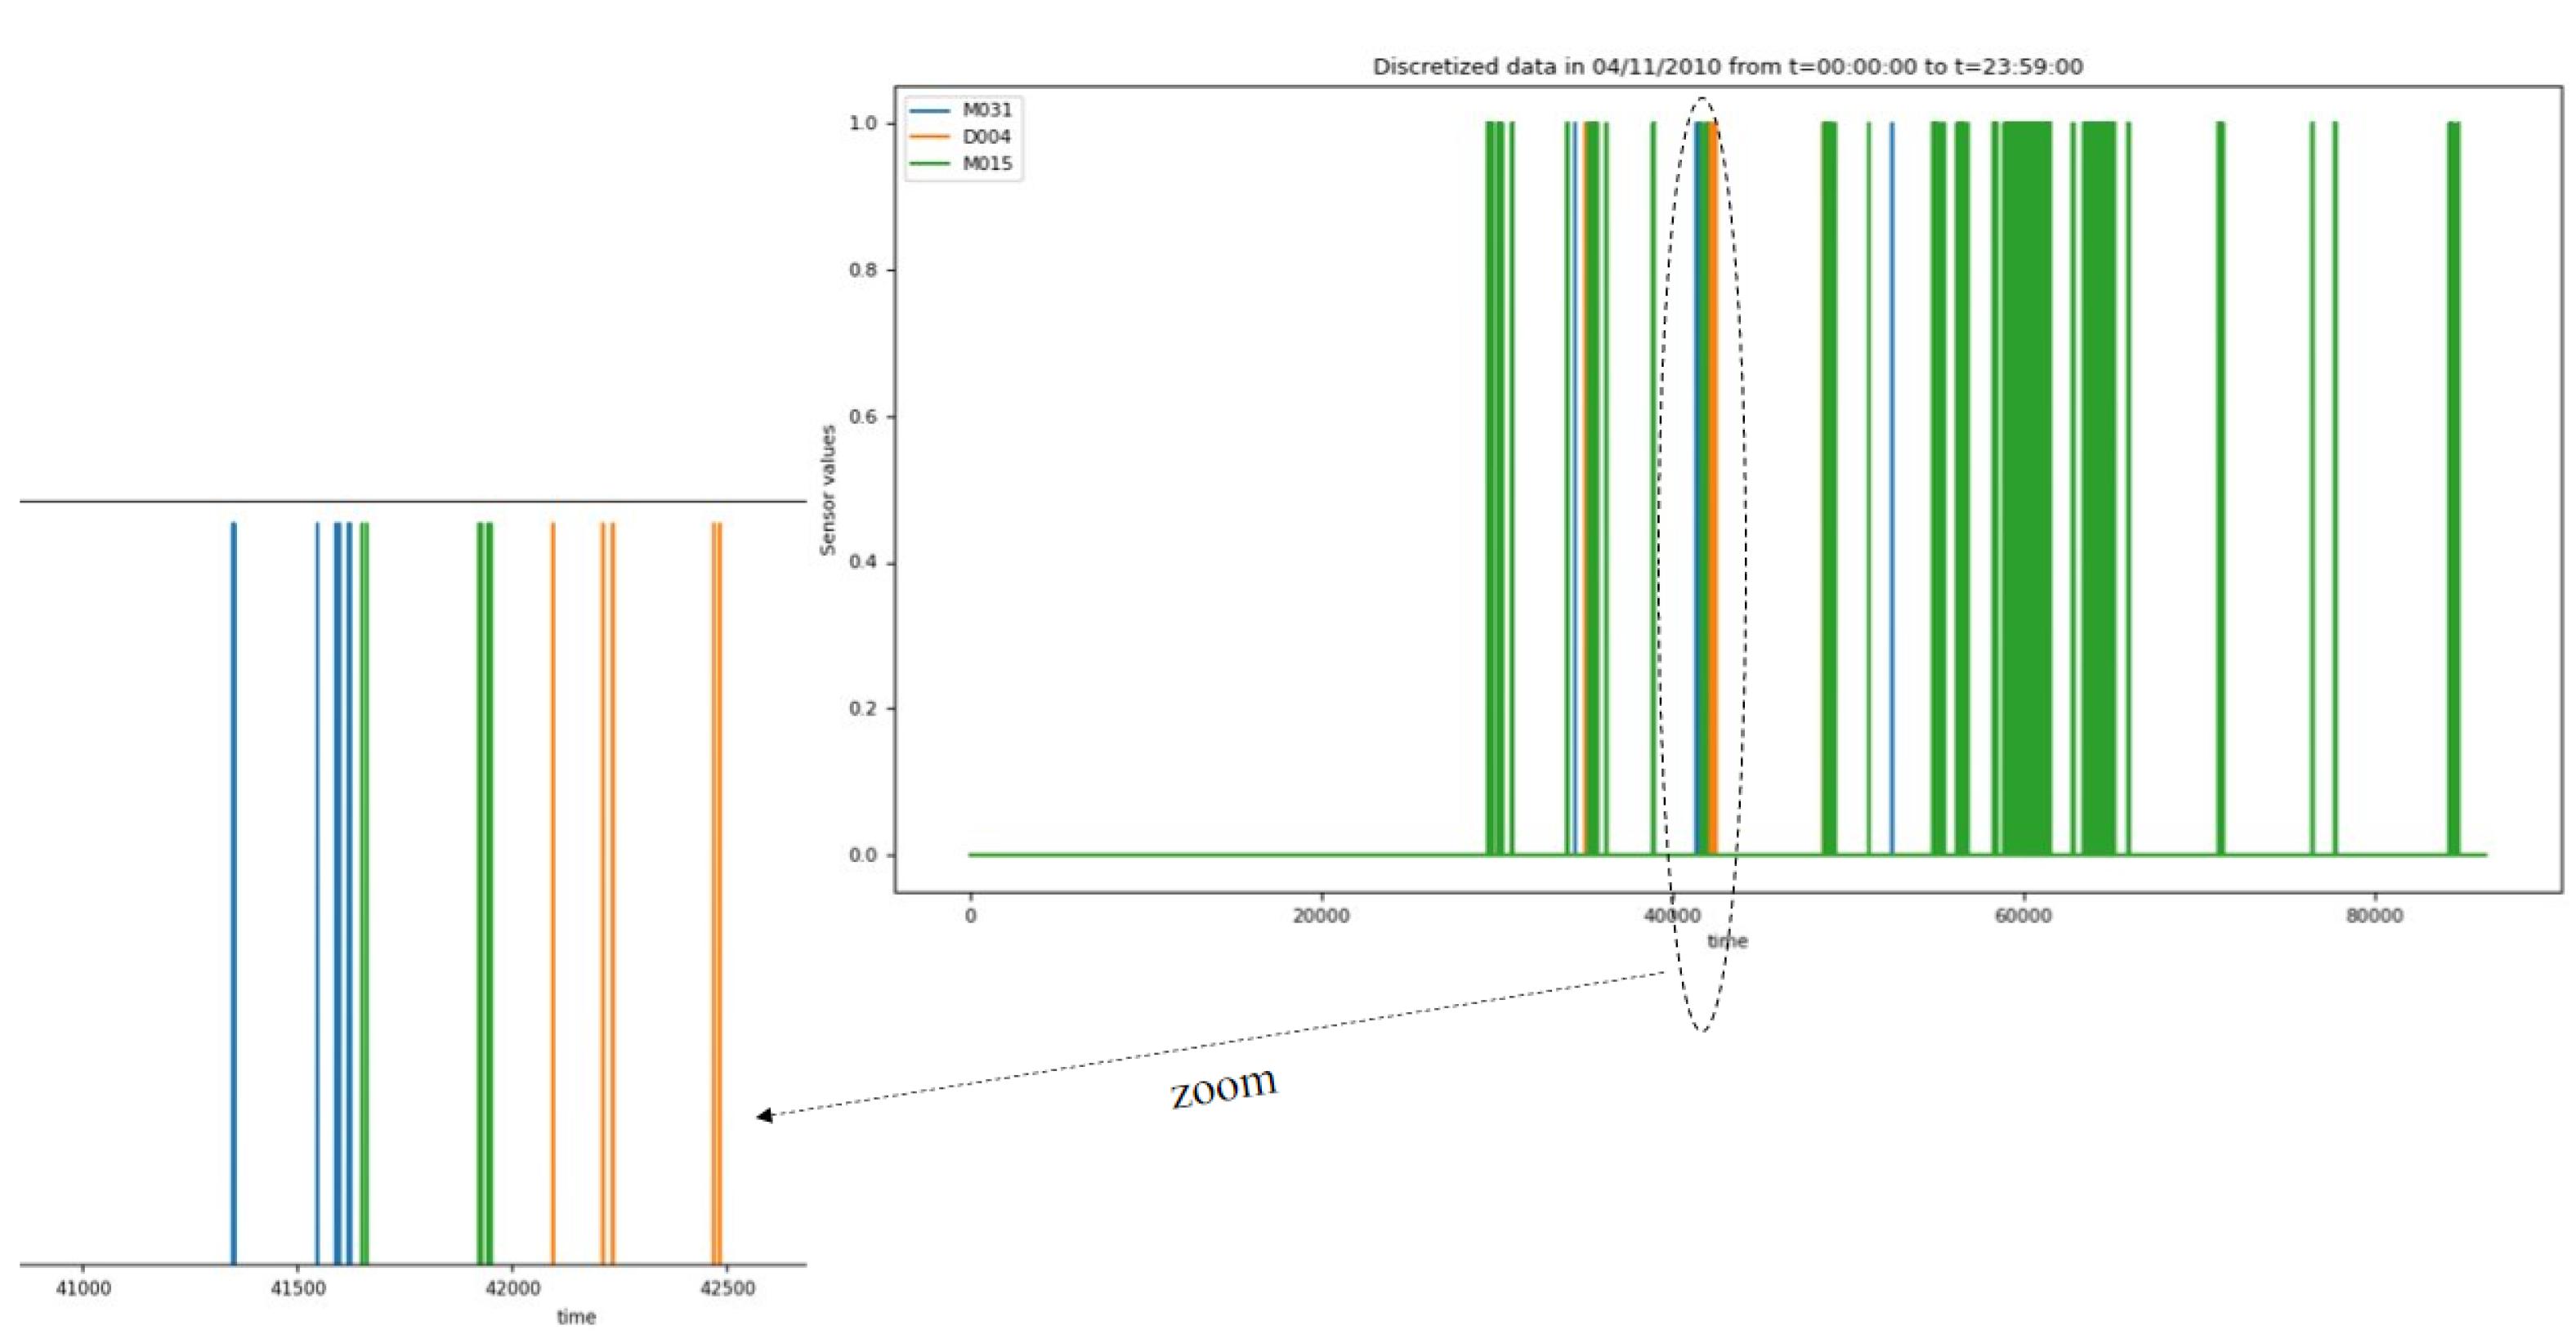
3.1. Segmentation
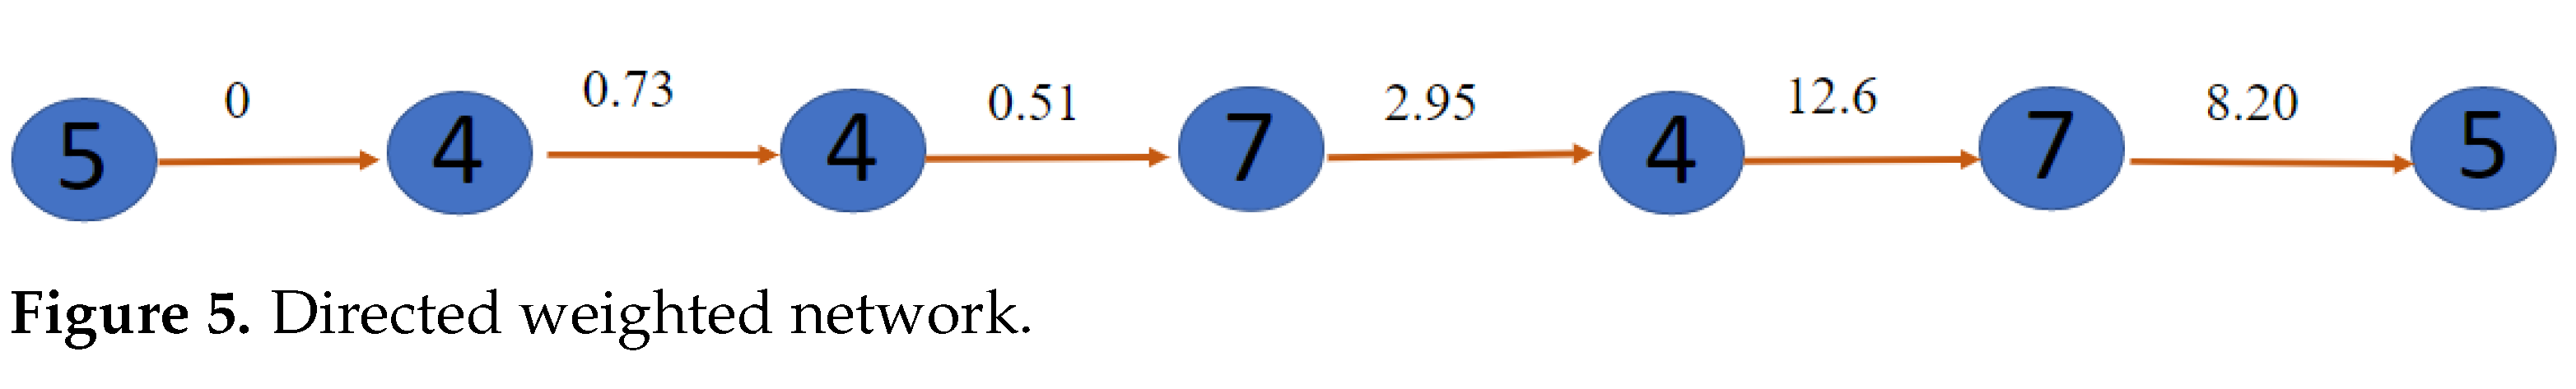
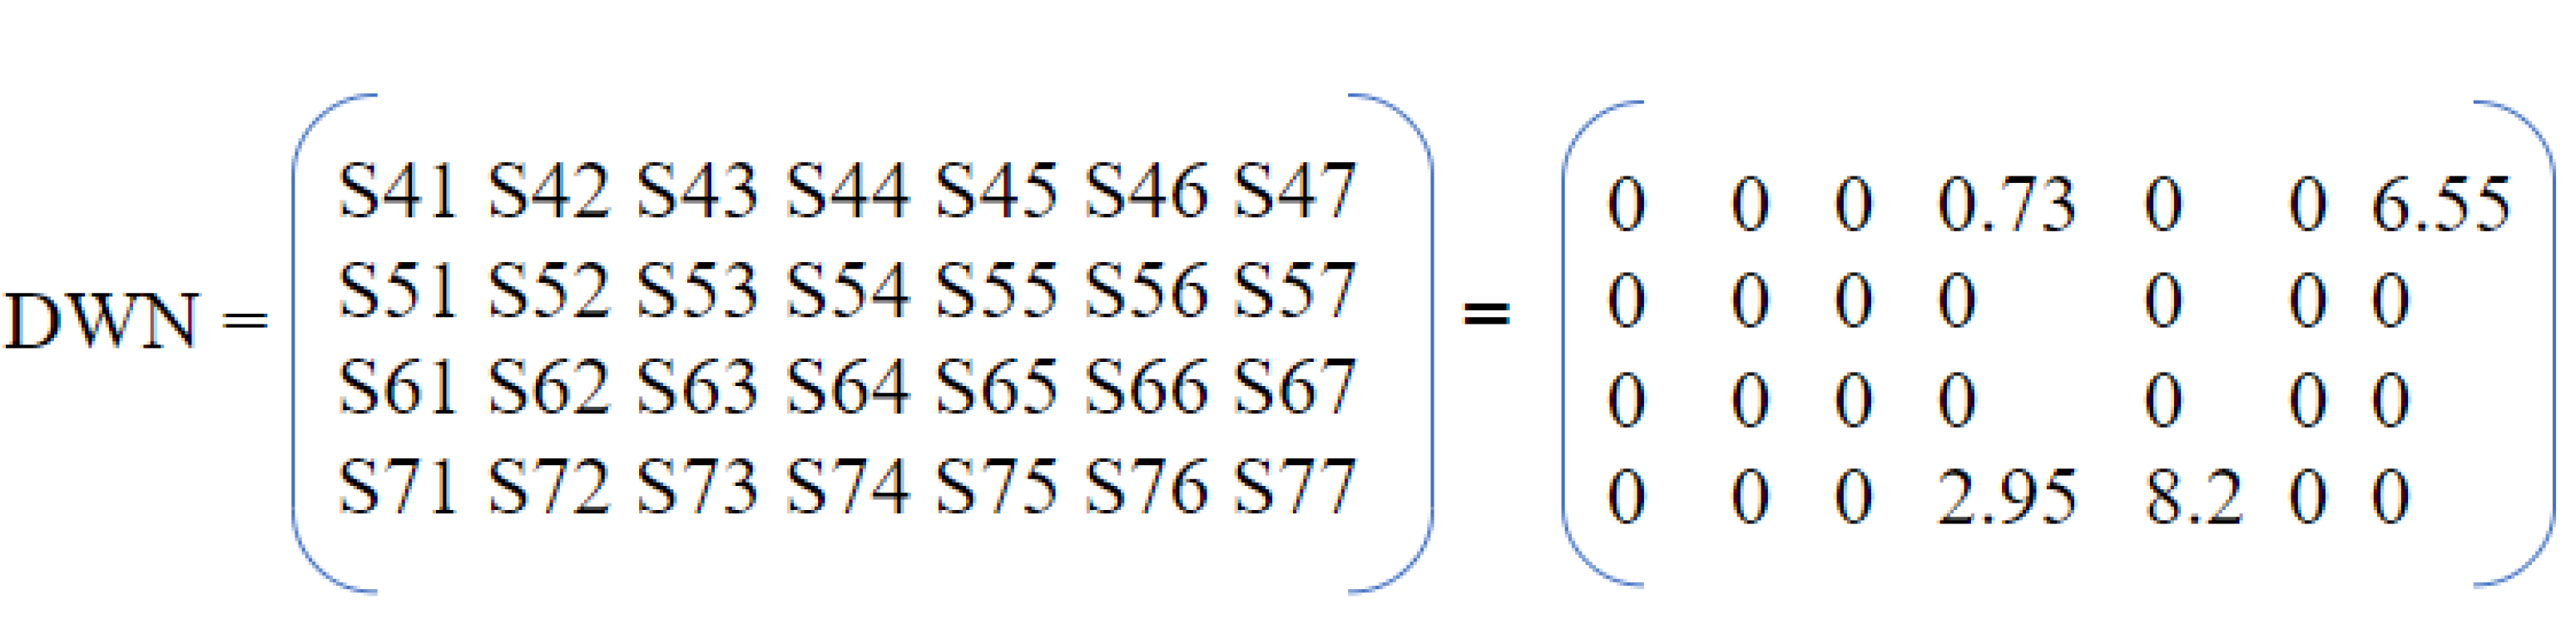
3.2. Encoding
- A CNN requires images with the same size as input, whereas this is not always the case because the size of activity segments differs from one activity to another. Consequently, the activity images may not be the same size in terms of duration, and we come across the padding problem mentioned on the CNN1D. In this work, we will make the best use of these encoding techniques, not with pixels but with matrices.
- The extraction of features that contain information related to behavioral semantics as well as spatio-temporal characteristics is a challenge. Establishing an efficient representation to define the activity related information is also challenging because there are different manners of doing a type of activity and the overlapping activities between different zones in the home can lead to confusion between activities.
- A self loop between the first sensor triggered in the segment and the sensor triggered just before.
- The remaining directed stops.
3.3. Classification
4. Case Study
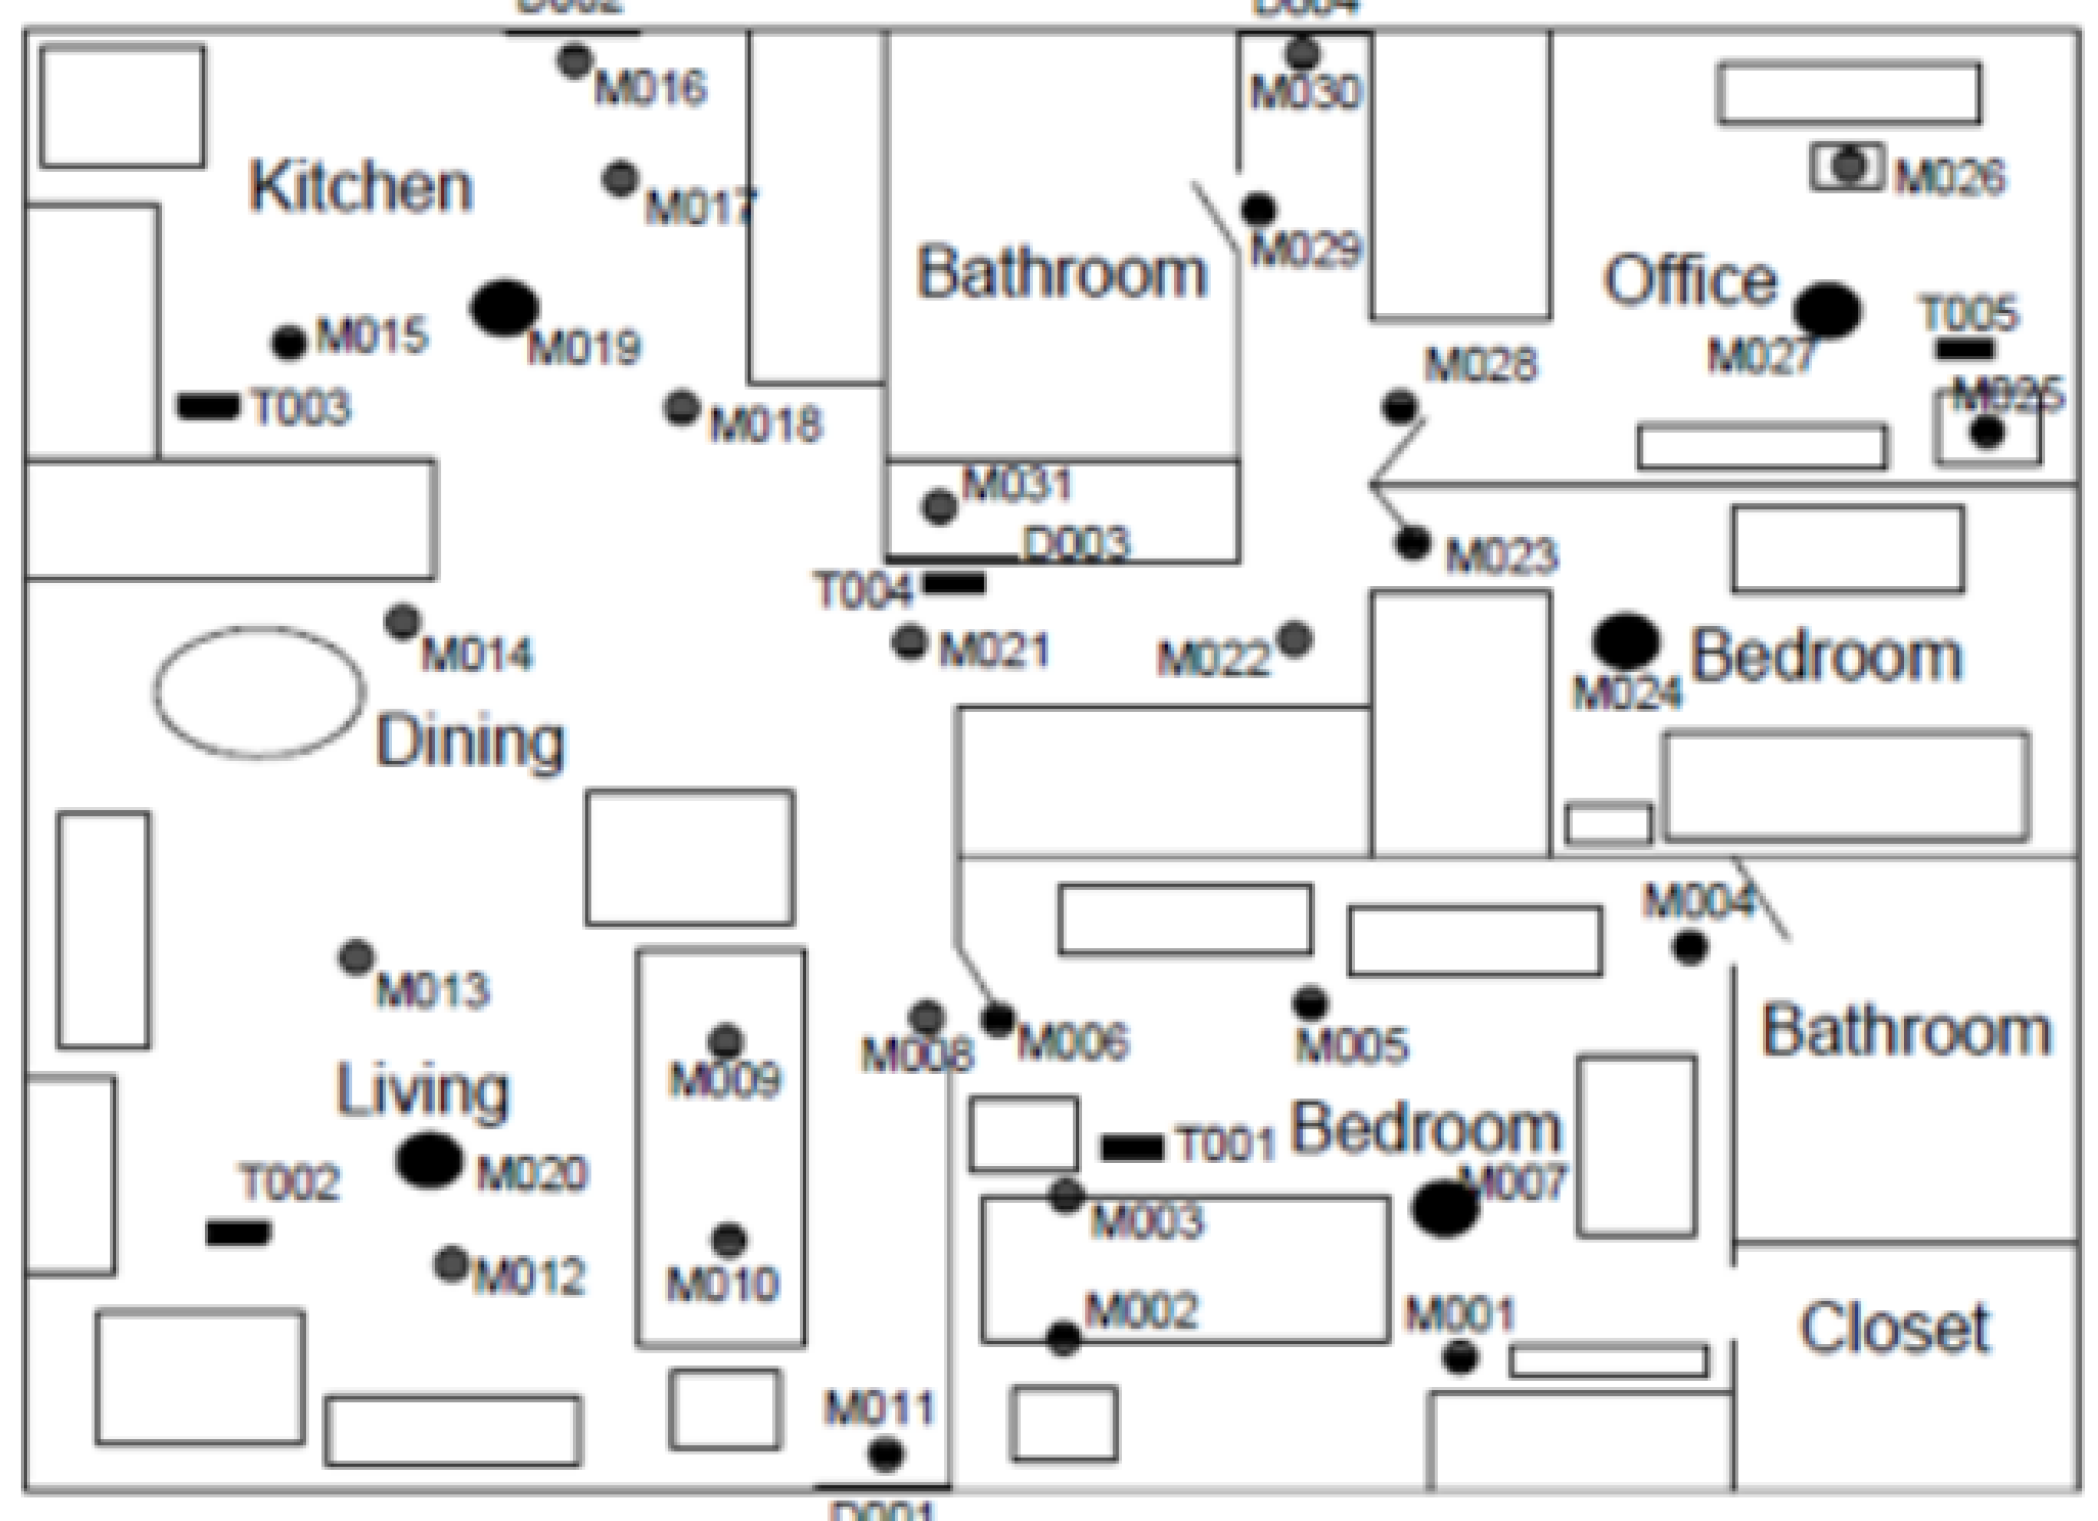
4.1. Test Bed and Data Set Description
- Datasets relabeling—although the Aruba dataset originally included numerous activities (11 daily activities) in a long period of time.
- Anomaly detection and cleaning—after a detailed analysis of the existing public datasets, we noticed that they can contain anomalies. In fact, they may contain duplicated data, full or partial days. Some rows in the file contains character errors, e.g., “Oc” instead of “ON” value. Also, sensor activation traces in the dataset are not correctly ordered temporarily, i.e., within the time series, events with a later timestamp may be recorded before events with an earlier timestamp. In the dataset, activities are labeled with a “begin” or “end” keyword to set the beginning and the end of activity. However, activities can be nested (i.e., begin1 begin2 end2 end1). Also, it appears that they are interleaved (i.e., begin1 begin2 end1 end2). According to these observations, it is therefore necessary to take into account these particular cases when pre-segmenting the dataset into sequences of activities.
4.2. Hypotheses and Key-words
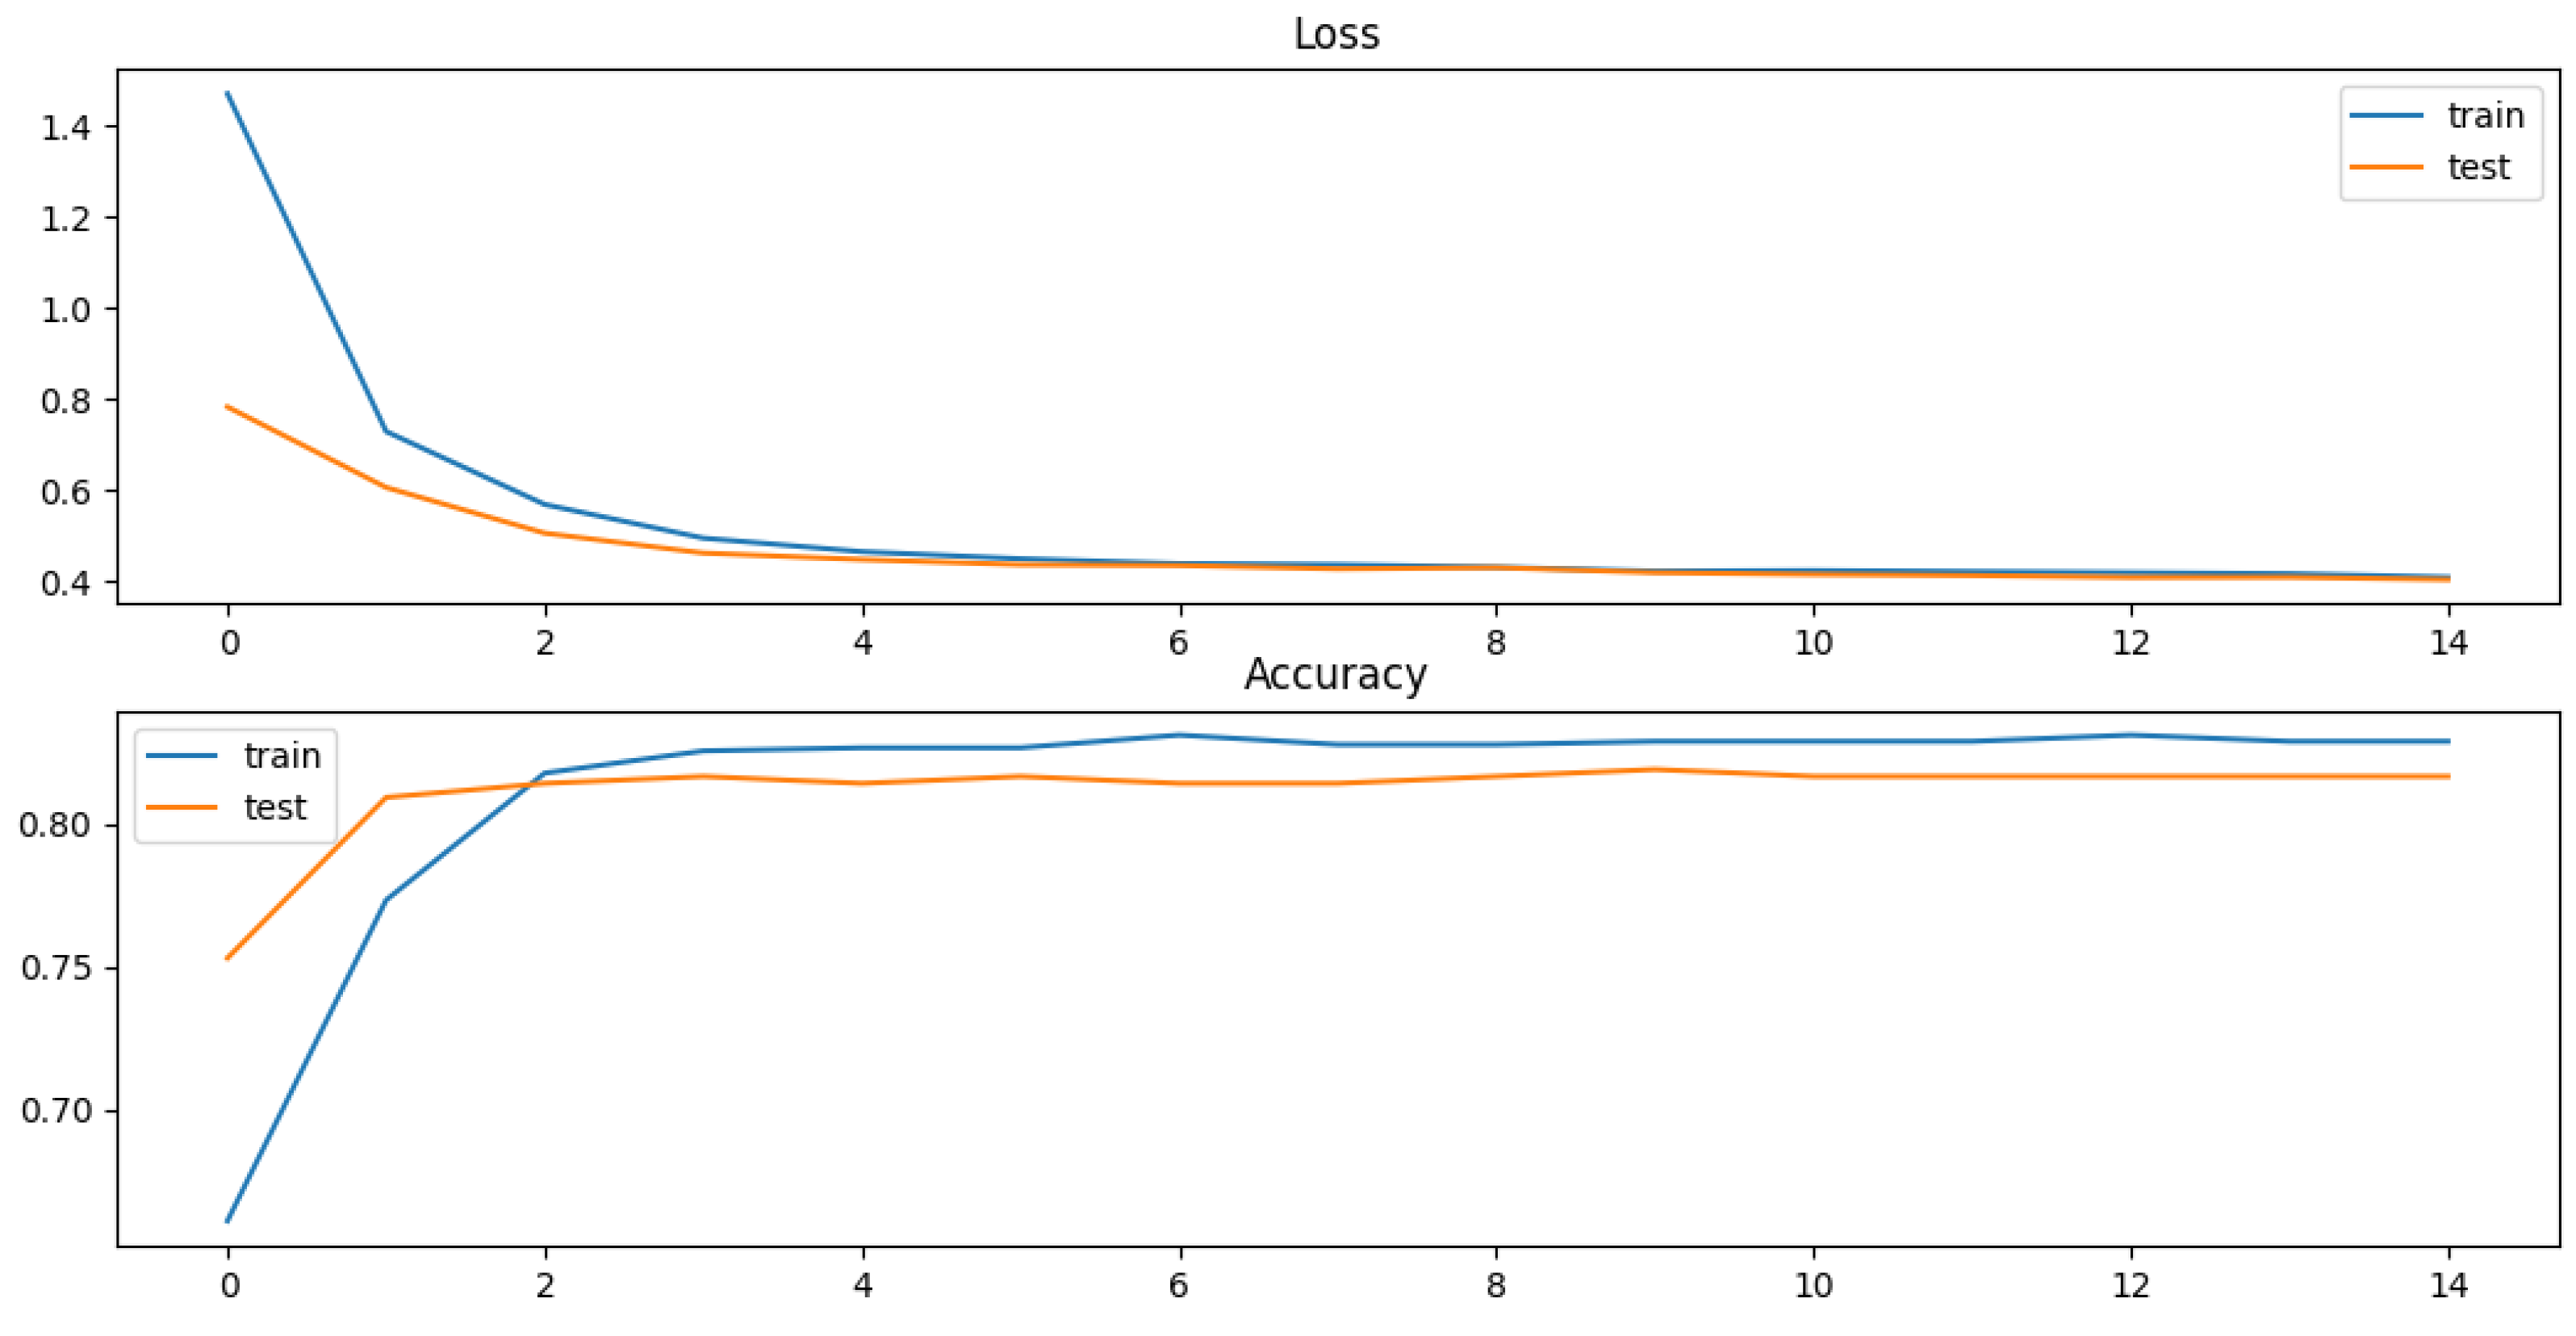
4.3. Simulation Results
- 1.
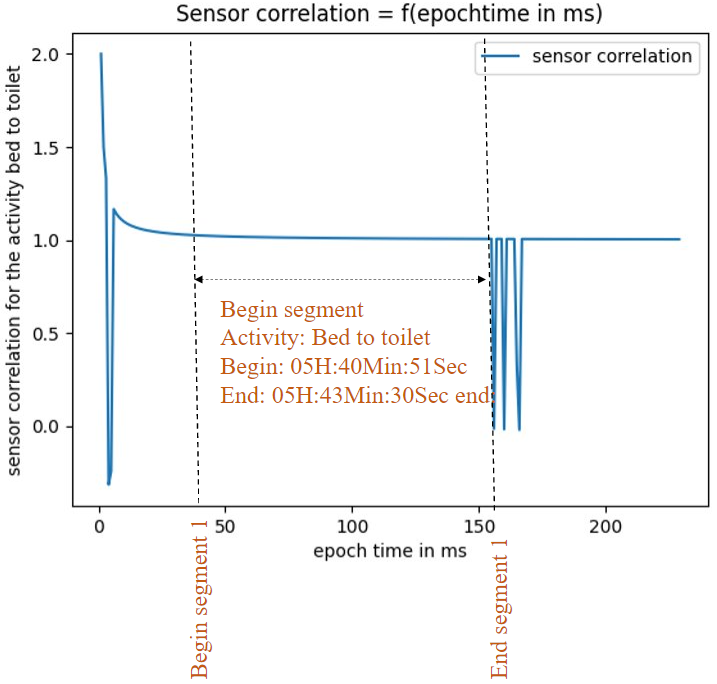
- Calculate the representative matrix of each segment of activity for different values of parameter using the concept of DWN. and represent, respectively, two matrices of two segments of activities “Meal Preparation” and “Wash Dishes” for = 0.02. The periods of these segments, respectively, are the following:
- Period 1: 4th November 2010 from 08: 11: 00 to 08: 27: 02 for meal preparation activity.
- Period 2: 4th November 2010 from 10: 03: 21 to 10: 04: 25 for wash dishes activity.
The Euclidean distance between and is equal to 1.65. - 2.
- Calculate the distance between the two matrix for each value of .
- 3.
- Choose the value of that maximizes the distance between two matrices. This value is calculated using Equation (3):
- Method 1: Time interval method. In order to divide the sequence of sensor events into a set of segments, this method uses equal time intervals as input [34]. The resulting accuracy of classification using this method is equal to 0.774.
- Method 2: Sensor event based windowing. This method is also investigated in [34]. In this method, each event contributes equally in the vector of features. The resulting accuracy of classification using this method is equal to 0.775
- Method 3: Sensor window–time window. This method is also investigated in [34]. This method used a time-based weighting factor to calculate the contributions of each event regarding the feature vector. In this technique, there are an equal number of events in each window. The resulting accuracy of classification using this method is 0.78.
- Method 4: Sensor window–mutual information (SWMI). This method is also investigated in [34]. It assumes that the size of windows is constant and each window contains an equal number of sensor events. The extraction of features is based on the concept of mutual information, which is defined as the probability of the fact that these two sensor events appear sequentially in the entire dataset. The resulting accuracy of classification using this method is 0.783.
- Method 5: Incremental SVM algorithms. This method is investigated in [37]. Two new methods for feature extraction that can be used for incremental learning HAR task are proposed.
- Modified dependency sensor (MDS) feature extraction method. The dependency between two sensors depends on the triggering order of sensors in the dataset. It is computed by calculating their frequency of occurrence within an interval of n sensor events along the entire data sequence (instead of tracking, consecutive occurrences only when a specific activity runs).
- Last-state (LS) sensor-based method. Considering the fact that segments of activities can contain sensors with active and inactive status (ON and OFF), sensors with high sensitivity can be triggered even if the occupant is not in the zone of these sensors. In this method, the authors made the hypothesis that the last-state of a sensor within a segment can be more informative and descriptive for the last event . In this method, the feature vector is computed as follows: For each sensor , if its last state within is [ON/OFF] then it will be represented by 1/, respectively, in the feature vector , otherwise it will be represented by 0 (i.e., absent). The evaluation of the results obtained by these two methods of feature extraction gives an F-score of 0.658 using MDS and 0.67 using LS method.
- Method 6: Dynamic segmentation proposed by [34]. The performance of this method is evaluated by an F-score of 0.607.
5. Conclusions and Future Works
- Testing the efficiency of this method on different hardware architectures considering the cost of each solution.
- In a “digital-twin” approach, use a simulator to surmount the problem of obtaining real data, generate synthetic data to introduce the different variations (different environment, user habits, and different sensors) according to a real-time use case.
Author Contributions
Funding
Data Availability Statement
Conflicts of Interest
Abbreviations
| HAR | Human Activity Recognition |
| CNN | Convolutional Neural Network |
| DWN | Directed Weighted Network |
| FTW | Fuzzy Time Interval |
| SC | Sensor Correlation |
| LSTM | Long Short Time Memory |
| SEW | Sensor Event Window |
| PMC | Pearson product moment correlation |
| HMM | Hidden Markov Model |
| DDA | Data Driven approach |
| KDA | Knowledge-Driven Approache |
References
- Tian, Z.; Zhang, X.; Jin, X.; Zhou, X.; Si, B.; Shi, X. Towards adoption of building energy simulation and optimization for passive building design: A survey and a review. Energy Build. 2018, 158, 1306–1316. [Google Scholar]
- Phan, H. Modélisation de l’Activité des Ménages dans le Bâtiment Résidentiel Instrumenté. Ph.D. Thesis, University of Bordeaux, Bordeaux, France, 2022. [Google Scholar]
- Alhamoud, A.; Xu, P.; Englert, F.; Reinhardt, A.; Scholl, P.; Boehnstedt, D.; Steinmetz, R. Extracting human behavior patterns from appliance-level power consumption data. In Proceedings of the European Conference on Wireless Sensor Networks; Springer: Berlin/Heidelberg, Germany, 2015; pp. 52–67. [Google Scholar]
- Akbari, S.; Haghighat, F. Occupancy and occupant activity drivers of energy consumption in residential buildings. Energy Build. 2021, 250, 111303. [Google Scholar]
- Bouchabou, D.; Nguyen, S.M.; Lohr, C.; LeDuc, B.; Kanellos, I. Using Language Model to Bootstrap Human Activity Recognition Ambient Sensors Based in Smart Homes. Electronics 2021, 10, 2498. [Google Scholar]
- Bouchabou, D.; Nguyen, S.M.; Lohr, C.; Leduc, B.; Kanellos, I. Fully convolutional network bootstrapped by word encoding and embedding for activity recognition in smart homes. In Proceedings of the International Workshop on Deep Learning for Human Activity Recognition; Springer: Berlin/Heidelberg, Germany, 2021; pp. 111–125. [Google Scholar]
- Quigley, B.; Donnelly, M.; Moore, G.; Galway, L. A comparative analysis of windowing approaches in dense sensing environments. Multidiscip. Digit. Publ. Inst. Proc. 2018, 2, 1245. [Google Scholar]
- Aminikhanghahi, S.; Cook, D.J. Enhancing activity recognition using CPD-based activity segmentation. Pervasive Mob. Comput. 2019, 53, 75–89. [Google Scholar]
- Van Kasteren, T.L.M. Activity Recognition for Health Monitoring Elderly Using Temporal Probabilistic Models; ASCI, University of Amsterdam: Amsterdam, The Netherlands, 2011. [Google Scholar]
- Medina-Quero, J.; Zhang, S.; Nugent, C.; Espinilla, M. Ensemble classifier of long short-term memory with fuzzy temporal windows on binary sensors for activity recognition. Expert Syst. Appl. 2018, 114, 441–453. [Google Scholar]
- Barsocchi, P.; Cimino, M.G.; Ferro, E.; Lazzeri, A.; Palumbo, F.; Vaglini, G. Monitoring elderly behavior via indoor position-based stigmergy. Pervasive Mob. Comput. 2015, 23, 26–42. [Google Scholar]
- Xu, Z.; Wang, G.; Guo, X. Sensor-based activity recognition of solitary elderly via stigmergy and two-layer framework. Eng. Appl. Artif. Intell. 2020, 95, 103859. [Google Scholar]
- Cook, D.J.; Crandall, A.S.; Thomas, B.L.; Krishnan, N.C. CASAS: A smart home in a box. Computer 2012, 46, 62–69. [Google Scholar]
- Phan, H.; Recht, T.; Mora, L.; Ploix, S. Contextualized model for occupants’ activities estimation in connected buildings. In Proceedings of the Conférence Francophone de l’International Building Performance Simulation Association 2020 (IBPSA), Chalons en Champaigne, France, 19–20 May 2020. [Google Scholar]
- Le, X.H.B.; Kashif, A.; Ploix, S.; Dugdale, J.; Di, M.; Mascolo, S.A. Simulating inhabitant behaviour to manage energy at home. In Proceedings of the International Building Performance Simulation Association Conference, Moret-sur-Loing, France, 9–10 November 2010. [Google Scholar]
- Henricksen, K.; Indulska, J. Developing context-aware pervasive computing applications: Models and approach. Pervasive Mob. Comput. 2006, 2, 37–64. [Google Scholar]
- Chen, L.; Nugent, C. Ontology-based activity recognition in intelligent pervasive environments. Int. J. Web Inf. Syst. 2009, 5, 410–430. [Google Scholar]
- Chen, L.; Nugent, C.D.; Wang, H. A knowledge-driven approach to activity recognition in smart homes. IEEE Trans. Knowl. Data Eng. 2011, 24, 961–974. [Google Scholar]
- Hawarah, L.; Ploix, S.; Jacomino, M. User behavior prediction in energy consumption in housing using Bayesian networks. In Proceedings of the International Conference on Artificial Intelligence and Soft Computing; Springer: Berlin/Heidelberg, Germany, 2010; pp. 372–379. [Google Scholar]
- Huynh, T.; Blanke, U.; Schiele, B. Scalable recognition of daily activities with wearable sensors. In Proceedings of the International Symposium on Location-and Context-Awareness; Springer: Berlin/Heidelberg, Germany, 2007; pp. 50–67. [Google Scholar]
- Patterson, D.J.; Fox, D.; Kautz, H.; Philipose, M. Fine-grained activity recognition by aggregating abstract object usage. In Proceedings of the 9th IEEE International Symposium on Wearable Computers (ISWC’05), Osaka, Japan, 18–21 October 2005; p. 44. [Google Scholar]
- Fan, C.; Gao, F. Enhanced human activity recognition using wearable sensors via a hybrid feature selection method. Sensors 2021, 21, 6434. [Google Scholar]
- Tapia, E.M.; Intille, S.S.; Larson, K. Activity recognition in the home using simple and ubiquitous sensors. In Proceedings of the International Conference on Pervasive Computing; Springer: Berlin/Heidelberg, Germany, 2004; pp. 158–175. [Google Scholar]
- Lee, S.W.; Mase, K. Activity and location recognition using wearable sensors. IEEE Pervasive Comput. 2002, 1, 24–32. [Google Scholar]
- SEDKY, M.; HOWARD, C.; Alshammari, T.; Alshammari, N. Evaluating machine learning techniques for activity classification in smart home environments. Int. J. Inf. Syst. Comput. Sci. 2018, 12, 48–54. [Google Scholar]
- Stazi, F.; Naspi, F.; D’Orazio, M. Modelling window status in school classrooms. Results from a case study in Italy. Build. Environ. 2017, 111, 24–32. [Google Scholar]
- Mehr, H.D.; Polat, H.; Cetin, A. Resident activity recognition in smart homes by using artificial neural networks. In Proceedings of the 2016 4th International Istanbul Smart Grid Congress and Fair (ICSG), Istanbul, Turkyie, 20–21 April 2016; pp. 1–5. [Google Scholar]
- Gochoo, M.; Tan, T.H.; Liu, S.H.; Jean, F.R.; Alnajjar, F.S.; Huang, S.C. Unobtrusive activity recognition of elderly people living alone using anonymous binary sensors and DCNN. IEEE J. Biomed. Health Inform. 2018, 23, 693–702. [Google Scholar]
- Tan, Z.; Xu, L.; Zhong, W.; Guo, X.; Wang, G. Online activity recognition and daily habit modeling for solitary elderly through indoor position-based stigmergy. Eng. Appl. Artif. Intell. 2018, 76, 214–225. [Google Scholar]
- Mutegeki, R.; Han, D.S. A CNN-LSTM approach to human activity recognition. In Proceedings of the 2020 International Conference on Artificial Intelligence in Information and Communication (ICAIIC), Fukuoka, Japan, 19–21 February 2020; pp. 362–366. [Google Scholar]
- Xu, Z.; Wang, G.; Guo, X. Online Activity Recognition Combining Dynamic Segmentation and Emergent Modeling. Sensors 2022, 22, 2250. [Google Scholar]
- Okeyo, G.; Chen, L.; Wang, H.; Sterritt, R. Dynamic sensor data segmentation for real-time knowledge-driven activity recognition. Pervasive Mob. Comput. 2014, 10, 155–172. [Google Scholar]
- Sfar, H.; Bouzeghoub, A. DataSeg: Dynamic streaming sensor data segmentation for activity recognition. In Proceedings of the 34th ACM/SIGAPP Symposium on Applied Computing, Limassol, Cyprus, 8–12 April 2019; pp. 557–563. [Google Scholar]
- Krishnan, N.C.; Cook, D.J. Activity recognition on streaming sensor data. Pervasive Mob. Comput. 2014, 10, 138–154. [Google Scholar]
- Najeh, H.; Lohr, C.; Leduc, B. Dynamic Segmentation of Sensor Events for Real-Time Human Activity Recognition in a Smart Home Context. Sensors 2022, 22, 5458. [Google Scholar]
- Mohmed, G.; Lotfi, A.; Pourabdollah, A. Employing a deep convolutional neural network for human activity recognition based on binary ambient sensor data. In Proceedings of the Proceedings of the 13th ACM International Conference on PErvasive Technologies Related to Assistive Environments, Online, 30 June 2020; pp. 1–7. [Google Scholar]
- Nawal, Y.; Oussalah, M.; Fergani, B.; Fleury, A. New incremental SVM algorithms for human activity recognition in smart homes. J. Ambient. Intell. Humaniz. Comput. 2022, 2022, 1–18. [Google Scholar]
- Liciotti, D.; Bernardini, M.; Romeo, L.; Frontoni, E. A sequential deep learning application for recognising human activities in smart homes. Neurocomputing 2020, 396, 501–513. [Google Scholar]


| Activity Name | Number of Activities |
|---|---|
| Meal Preparation | 1606 |
| Relax | 2910 |
| Eating | 257 |
| Work | 171 |
| Sleeping | 401 |
| Bed to Toilet | 157 |
| Enter Home | 431 |
| Leave Home | 431 |
| Housekeeping | 33 |
| Activity | Ground Truth Segment | Simulated Segment |
|---|---|---|
| Sleeping (1) | begin: 0 h: 3 min: 50 s | begin: 0 h: 3 min: 50 s |
| end: 5 h: 40 min: 43 s | end: 5 h: 40 min: 44 s | |
| Bed to Toilet | begin: 5 h: 40 min: 51 s | begin: 5 h: 40 min: 51 s |
| end: 5 h: 43 min: 30 s | end: 5 h: 43 min: 24 s | |
| Sleeping (2) | begin: 5 h: 43 min: 45 s | begin: 5 h: 43 min: 45 s |
| end: 8 h: 1 min: 12 s | end: 8 h: 1 min: 9 s | |
| Meal Preparation | begin: 8 h: 11 min: 9 s | begin 8 h: 11 min: 15 s |
| end: 8 h: 27 min: 2 s | end: 8 h: 24 min: 48 s |
| 0.02 | 0.09 | 0.2 | 0.5 | |
|---|---|---|---|---|
| 1.65 | 0.69 | 0.17 | 0 |
| Method | Accuracy |
|---|---|
| Proposed method | 0.816 |
| Time interval method | 0.774 |
| Sensor event based windowing | 0.775 |
| Sensor window–time window | 0.780 |
| SWMI | 0.783 |
| DS | 0.607 |
| MDS | 0.658 |
| LS | 0.67 |
| Liciotti | 0.89 |
Disclaimer/Publisher’s Note: The statements, opinions and data contained in all publications are solely those of the individual author(s) and contributor(s) and not of MDPI and/or the editor(s). MDPI and/or the editor(s) disclaim responsibility for any injury to people or property resulting from any ideas, methods, instructions or products referred to in the content. |
© 2023 by the authors. Licensee MDPI, Basel, Switzerland. This article is an open access article distributed under the terms and conditions of the Creative Commons Attribution (CC BY) license (https://creativecommons.org/licenses/by/4.0/).
Share and Cite
Najeh, H.; Lohr, C.; Leduc, B. Convolutional Neural Network Bootstrapped by Dynamic Segmentation and Stigmergy-Based Encoding for Real-Time Human Activity Recognition in Smart Homes. Sensors 2023, 23, 1969. https://doi.org/10.3390/s23041969
Najeh H, Lohr C, Leduc B. Convolutional Neural Network Bootstrapped by Dynamic Segmentation and Stigmergy-Based Encoding for Real-Time Human Activity Recognition in Smart Homes. Sensors. 2023; 23(4):1969. https://doi.org/10.3390/s23041969
Chicago/Turabian StyleNajeh, Houda, Christophe Lohr, and Benoit Leduc. 2023. "Convolutional Neural Network Bootstrapped by Dynamic Segmentation and Stigmergy-Based Encoding for Real-Time Human Activity Recognition in Smart Homes" Sensors 23, no. 4: 1969. https://doi.org/10.3390/s23041969