
A Pressure-Pad-Embedded Treadmill Yields Time-Dependent Errors in Estimating Ground Reaction Force during Walking


1
Department of Physical Education, Seoul National University, Seoul 08826, Korea
2
Institute of Sport Science, Seoul National University, Seoul 08826, Korea
*
Author to whom correspondence should be addressed.
Sensors 2021, 21(16), 5511; https://doi.org/10.3390/s21165511
Submission received: 7 July 2021
/
Revised: 11 August 2021
/
Accepted: 15 August 2021
/
Published: 17 August 2021
(This article belongs to the Collection Sensors for Human Movement Applications)
Abstract
:Accurate and reliable vertical ground reaction force (VGRF) measurement is essential in various biomechanical and clinical studies. Recently, pressure–pad-embedded treadmills have been widely used for VGRF measurement as a relatively less expensive option than the force platform-mounted treadmills. Prior studies have shown that the popular Zebris treadmill is reliable when used to measure peak VGRF for short walking sessions. However, comprehensive evaluation of human walking requires information of gait parameters over sufficient gait cycles. In this study, we quantify the long-term temporal changes in VGRF values measured by the Zebris treadmill. Twenty participants walked on the treadmill for 10 min twice, with 10 min rest between trials. We found an evident decline in the measured VGRF and impulse over time for both trials. The Zebris system also consistently yielded the lower VGRF values during the second trials. These results indicate that the Zebris treadmill is unreliable in measuring VGRF during walking, and a 10 min break is not enough for the embedded sensors to recover their sensitivity. We provided a way to resolve these time-dependent errors; using the impulse-momentum theorem and collected kinematics of the participants, we formulated a curve-fitting model encapsulating the growing VGRF estimation error.
1. Introduction
The vertical ground reaction force (VGRF) is the major component of a salient external force acting on the body during locomotion. Accurate and reliable measurement of VGRF is necessary for estimating the precise load exerted on the body segments and joints [1,2,3,4]. VGRF has been typically measured using a force platform fitted with load cells or force transducers mounted on the ground or a motorized treadmill. Numerous studies have shown that the measurement of VGRF using these types of force platforms is highly reliable [5,6,7,8]. However, continuous VGRF measurement using floor-mounted force platforms is difficult, and force plate-mounted motorized treadmills are costly. Relatively less expensive pressure-pad-embedded motorized treadmills are developed to overcome these drawbacks. Among numerous brands, capacitive pressure sensor-embedded Zebris treadmills are extensively used to measure spatiotemporal and kinetic gait parameters. Several studies have shown high reliability of Zebris treadmills for measuring spatiotemporal gait parameters [9,10,11,12]. However, studies verifying the reliability of such a system for measuring VGRF are limited.
Technologies that use capacitive sensors to measure plantar pressure show drift during VGRF measurement [13,14,15]. Common reasons behind the drift are temperature changes, hysteresis, and prolonged pressure-induced sensor deformation [15,16]. Several studies have assessed the reliability of such capacitive sensor-based systems, including Zebris treadmills. Item-Glatthorn et al. reported highly reliable peak forefoot and heel forces measured between-days when participants walked on a Zebris treadmill for 20 s with increasing speeds and inclinations [17]. In another study, Nüesch et al. reported highly reliable peak forefoot and heel forces measured between-trials and days when participants walked and ran on a Zebris treadmill for 2 min with increasing speeds [10]. In contrast, Van Alsenoy et al. reported only moderate reliability of peak VGRF measured between-trials and days when participants ran on a Zebris treadmill for 20 s with increasing speeds [18]. In addition, the peak VGRF values measured during the second trial were lower than the values during the first trial for all running speeds; the peak VGRF was underestimated in the subsequent trials. Considering that reliable assessment of gait stability and variability requires a sufficient number of gait cycles [19,20,21,22], these previous studies that addressed the reliability of VGRF measurement using a Zebris treadmill have an important drawback; the gait parameters were recorded only for a short period of time. Furthermore, the previous studies only used one single peak force during walking or running to check the reliability of VGRF measurement despite the fact that VGRF keeps changing with time.
In addition, the capacitance-based pressure sensors embedded into the Zebris treadmill have a spatial resolution of 8.5 mm [18,23], whereas the international guideline for the maximum spatial resolution of the pressure sensor for an accurate measure of plantar force is 5 mm [24]. Any system with a coarse spatial resolution plausibly underestimates the maximum plantar pressure because the total force is to be divided by a larger area [25,26]. Using experimental data, Lord modeled plantar pressure distribution during standing and found 67% accuracy when plantar pressure was measured using sensors with a spatial resolution of 10 mm [27]. Pataky estimated the accuracy for sensors with various values of the spatial resolution using the model proposed by Lord and standing plantar pressure data measured by Xsensor and Zebris pressure pads [28]. In contrast with the results from Lord’s study, Pataky found 90% accuracy for sensors with spatial resolution between 1.7 mm and 17.4 mm. However, he postulated that changes in the foot positioning could have non-trivial effects on the plantar pressure and force measurement accuracy.
Unlike standing, walking involves continuous changes in foot positioning. To our knowledge, no mathematical model or systematic method has been proposed to estimate the errors in pressure measurement during walking using a pressure-pad-embedded treadmill. Hence, in this study, we firstly aim to quantify any time-dependent estimation error of the Zebris treadmill when the device is used to measure the VGRF of walking for a prolonged time period. Our results show continuously growing but converging errors in VGRF estimation; Zebris treadmills are unreliable for long-term VGRF measurement during walking. Considering that the researchers in the field of human movement science widely utilize pressure-pad-embedded treadmills to measures VGRF during walking, we secondly aim to develop a viable method to compensate for these errors in VGRF measurement. Using the impulse-momentum theorem, we formulated curve-fitting models encapsulating the temporal declines in the VGRF with high goodness of fit. Our results suggest an effective method for compensating for the low reliability of the Zebris treadmill and similar capacitive pressure sensor-embedded treadmills for measuring VGRF during walking.
2. Materials and Methods
2.1. Participants
We recruited 20 healthy young adults (16 men and 4 women; age: 28 ± 4.68 years; height: 1.73 ± 0.08 m; weight: 72.10 ± 12.64 kg). This number of the participants is larger than the sample size required for a statistical power of 0.95. We conservatively set the effect size between small and medium values as 0.35 [29]. We then selected the expected power and p-value for statistical significance as 0.95 and 0.05, respectively. Under these conditions, G-power software calculated the required sample size as 12 [30]. The recruited participants had no known cardiovascular, orthopedic, or neuromuscular disorders. The participants were informed about all the aspects of the study, and they provided informed, written consent before participation. All aspects of the study adhered to the principles and guidelines described in the Declaration of Helsinki and approved by the Institute Review Board of Seoul National University (IRB No. 2007/001-009).
2.2. Equipment
We asked the participants to walk on a pressure-pad-embedded treadmill (Model Gait analysis FDM-TDSL-3i, Zebris Inc.®, Germany; belt length: 150 cm; belt width: 50 cm; maximum incline: 15%; maximum speed: 24 km/h), which was used to record VGRF at a sampling frequency of 50 Hz. A motion capture system consisting of ten infra-red cameras (Optitrack PrimeX 13, Natural Point, Inc., OR, USA) was used to record coordinates of the retro-reflective markers attached to the participant at a sampling frequency of 100 Hz. A sync box was used to synchronize the initiation of data acquisition from the two systems.
2.3. Experimental Procedure
Initially, we estimated the preferred walking speed (PWS) of the participants. To measure PWS, we asked each participant to walk on the treadmill, starting at a speed of 2.5 km/h. We then increased the speed by 0.1 km/h every 10 s and asked the participants to report once they perceived the speed that best described their normal walking speed. We further increased the speed by 1.0 km/h and decreased it by 0.1 km/h, again asking the participants to report once they perceived the speed that best described their normal walking speed. We repeated this process three times and used the average speed as PWS. We measured PWS within one week prior to the main experiment.
We attached 36 retro-reflective markers on the anatomical landmarks of the head: top, left, right, and front temple; and left and right sides of the upper and lower body: acromion, medial and lateral epicondyle of the humerus, radius- and ulna-styloid process, third metacarpal, posterior superior iliac spinae, anterior superior iliac spinae, greater trochanter, medial and lateral epicondyle, medial and lateral malleolus, first and fifth metatarsal, and heel. After attaching the retro-reflective markers, we measured the participant’s body weight (BW). We then asked the participants to perform two walking trials, 10 min each, on the treadmill at their PWS. Each 10 min trial consisted of two 5 min data acquisition sessions because the Zebris treadmill can record data only up to 5 min for a single session. It took 5 to 10 s to save the file for the first session and start the second data acquisition session. Participants were given 10 min to rest between trials. We also measured the participant’s BW between trials and right after the final trial to check for any possible change in the BW.
2.4. Data Processing
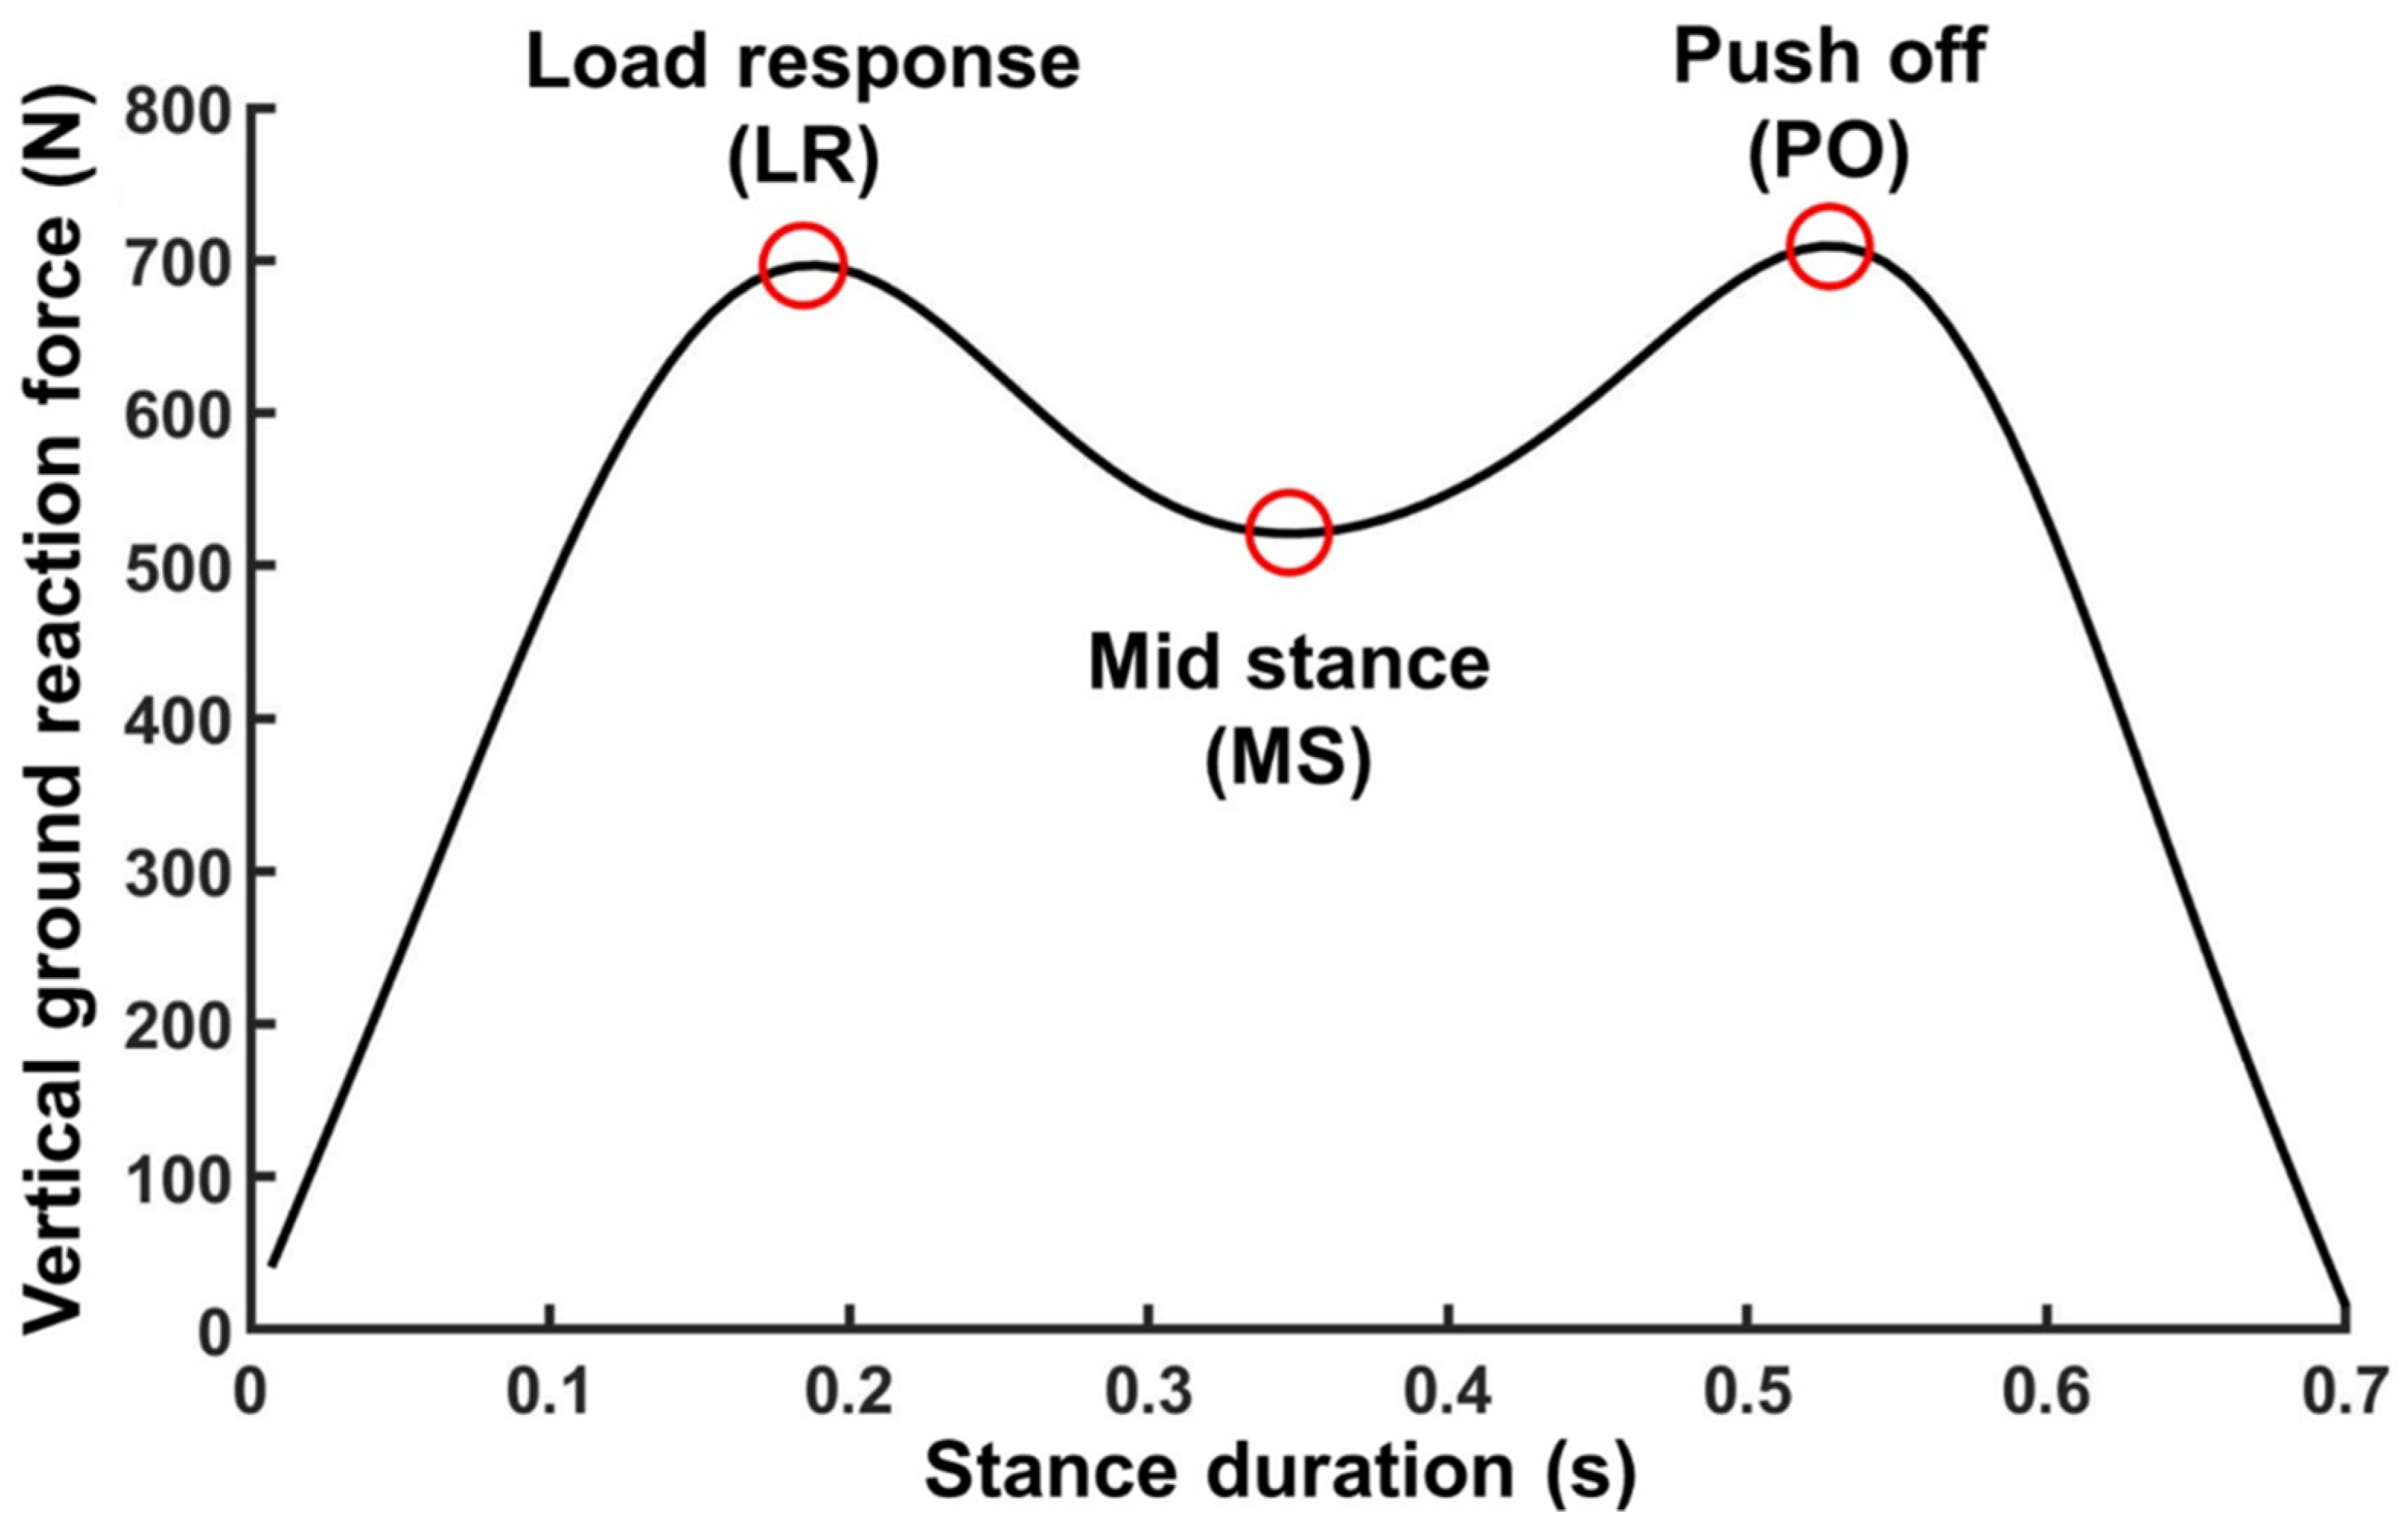
The VGRF curve was extracted for each step during the 10 min walking trials, separately for the left and right foot. We then extracted the specific VGRF values at three stereotypical time points for each step; the time point of load response (LR), mid stance (MS), and push off (PO). We selected LR and PO as the time points of two peaks of the double bump pattern of the VGRF curve and MS as the time point for the minimal value of VGRF between LR and PO (Figure 1). In addition, we calculated impulse by integrating VGRF over time. We also calculated the stance duration of each step (the elapsed time between initial contact and toe-off) and the stride duration. The VGRF values at each of the three time points, impulse, stance duration, and stride duration were separately averaged over every one-minute interval.
We filtered the raw coordinates of the retro-reflective markers using a zero-lag, fourth order low pass filter with a cut-off frequency of 10 Hz. Using biomechanical modeling software, Visual 3D (Visual3D v6TM, C-Motion, Inc., Germantown, MD, USA), we built a fifteen-segment model, which included left and right foot, shank, thigh, upper arm, forearm, and hand, trunk, and head segments. We identified the whole-body center of mass (COM) using this model, and calculated the vertical velocity of COM (VCOM).
2.5. Statistical Analysis
We conducted a two-way repeated measures analysis of variance (ANOVA) to evaluate any statistical differences between the VGRFs at LR, MS, and PO; impulses; stride durations; stance durations; and changes in the vertical velocities of COM for 20 participants depending on time (10 levels: 1 to 10 min) and trial (two levels: trials 1 and 2) separately for the left and right foot. We performed Mauchly’s sphericity test to evaluate the assumption of sphericity. If the assumption of sphericity was violated, the Greenhouse-Geisser criterion was used to reduce the degrees of freedom. Bonferroni correction was used as a post-hoc test for multiple pairwise comparisons over time and between trials. The level of statistical significance was set at p < 0.05. Additional statistical analysis methods used to evaluate the goodness of fit of the curve-fitting models to encapsulate the errors in the VGRF estimation are clarified in Section 5.
3. Results
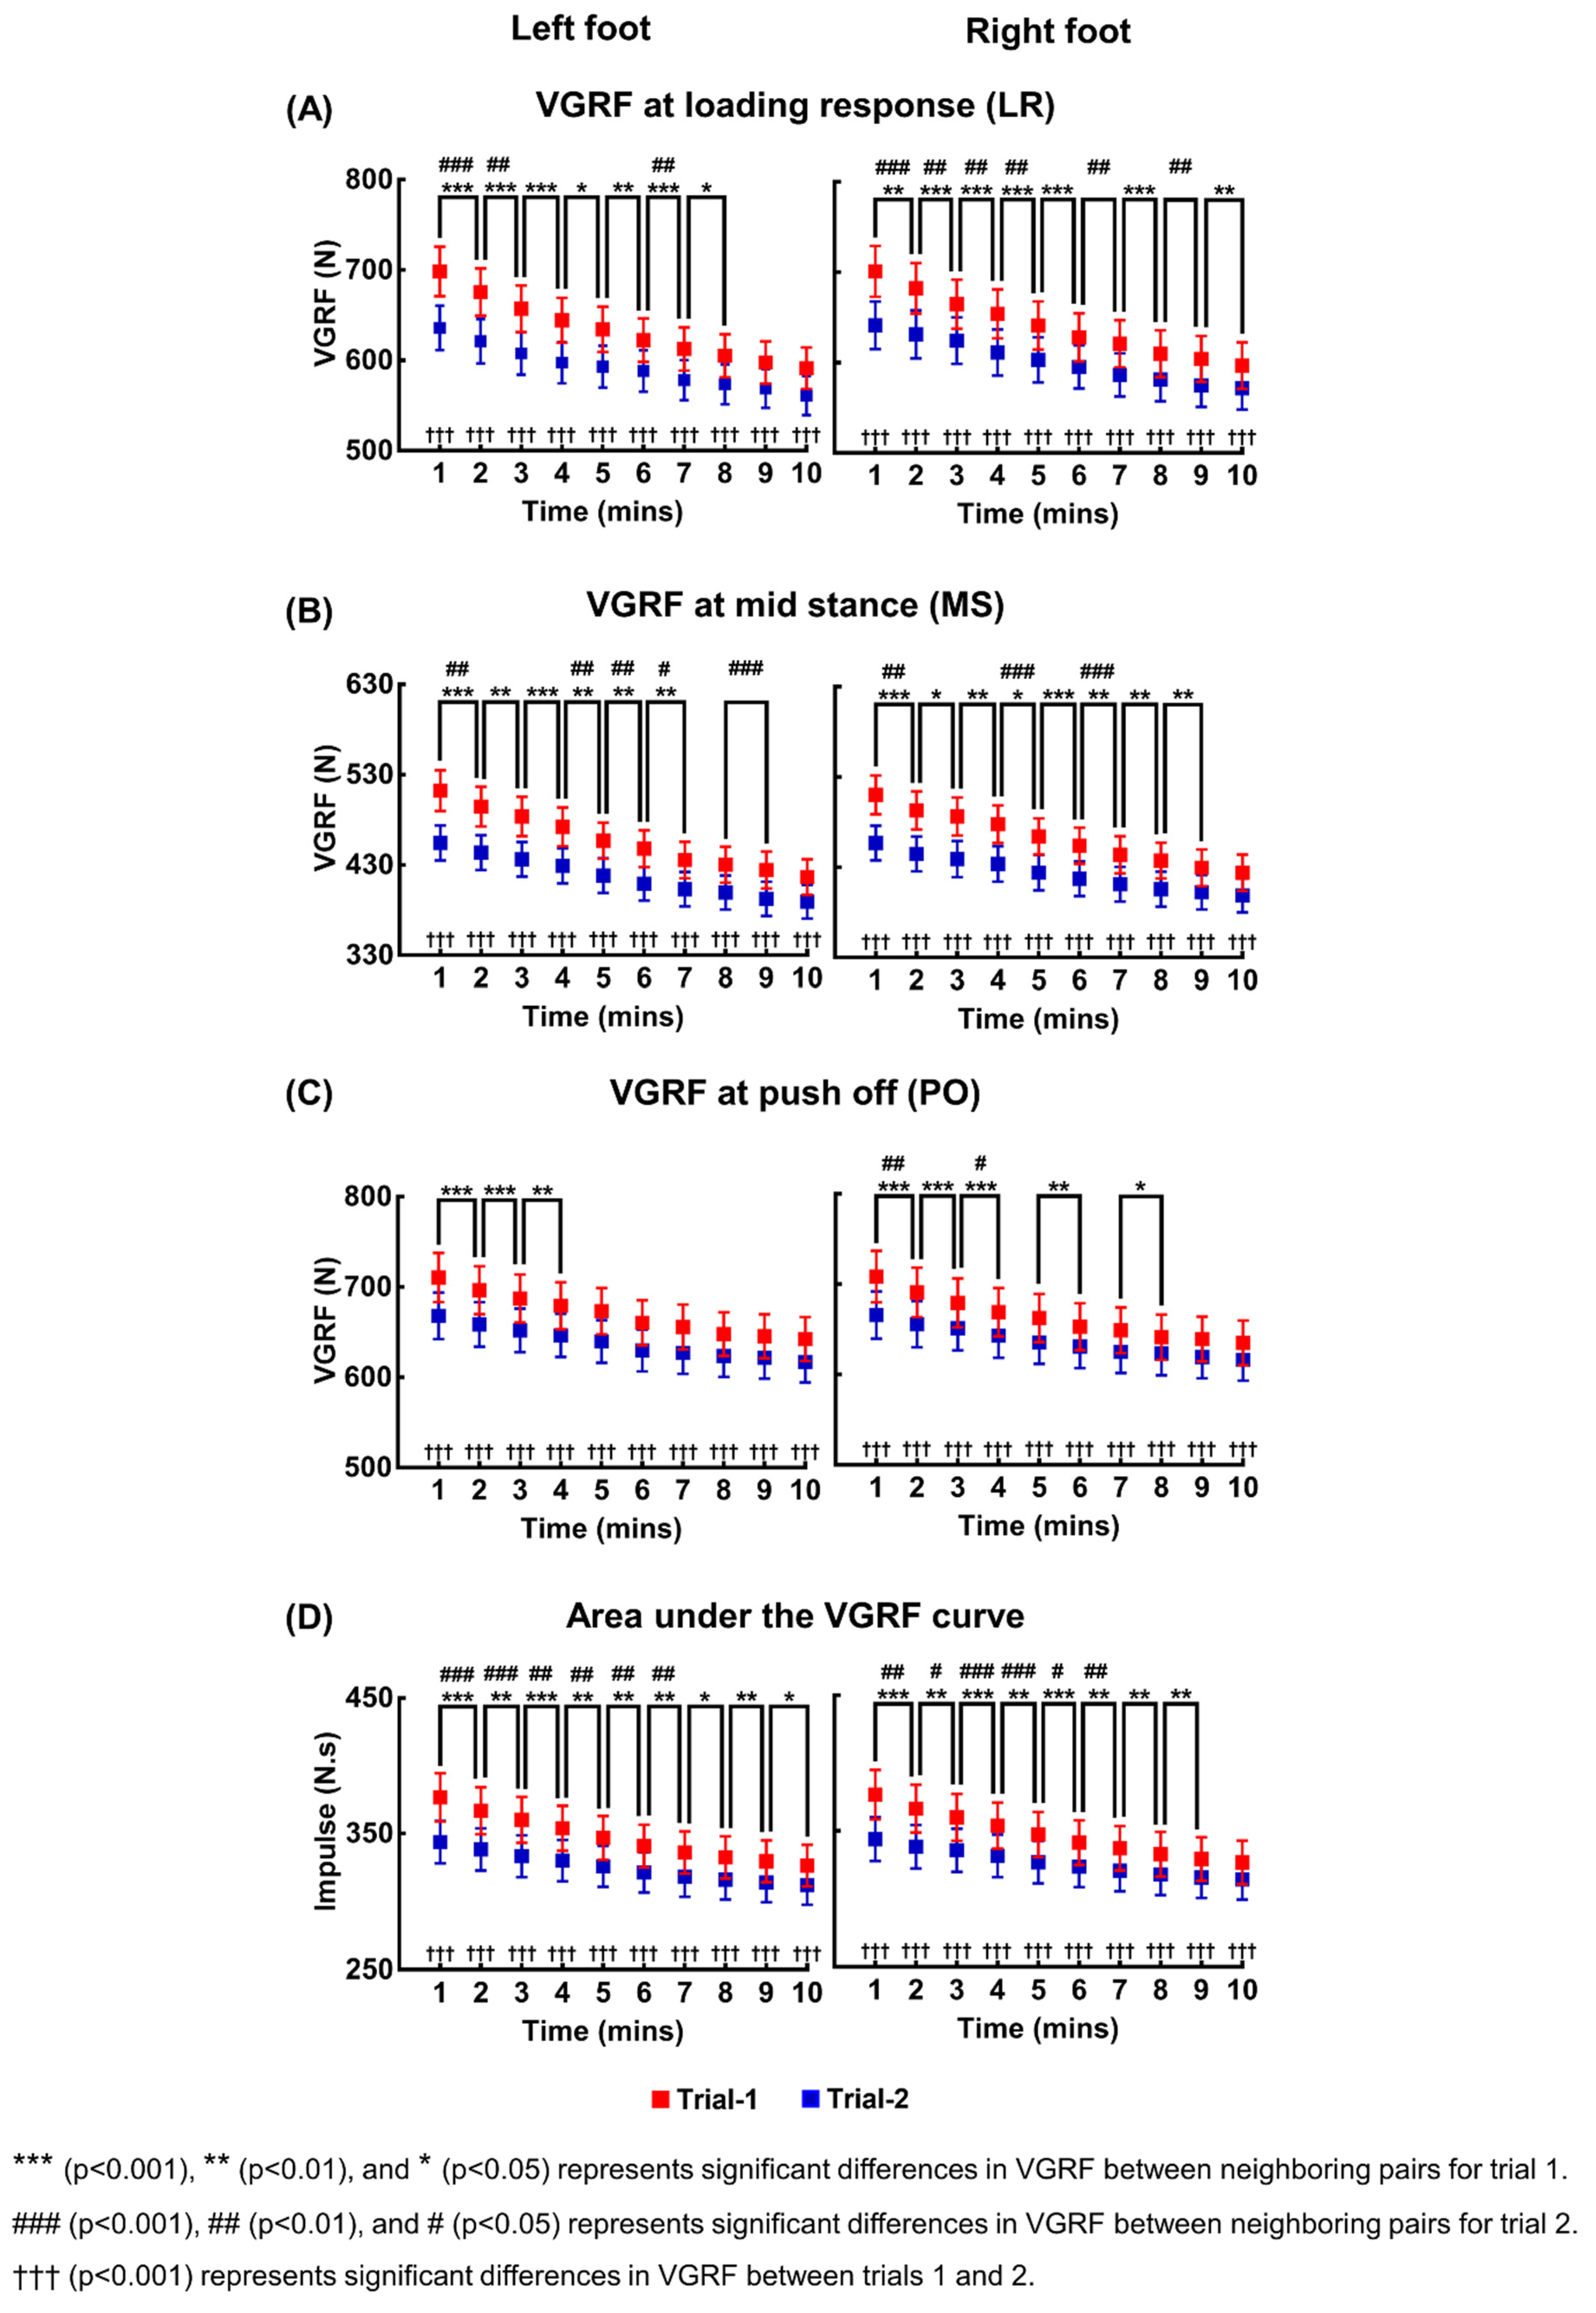
The means and standard errors of VGRFs at LR, MS, and PO, and the impulse due to VGRF of 20 participants, are shown in Figure 2. For all four measures (VGRFs at three time points and the impulse), two-way repeated measures ANOVA showed significant main effects of time and trial, and significant interaction between time and trial for both feet. The statistical results are summarized in Table 1.
For both trials and both feet, pairwise comparisons revealed that the estimated VGRFs and impulse during a time interval of one minute were less than the estimated values during the next minute with statistical significance in most neighboring pairs. The number of neighboring pairs without statistically significant change always increased in the second trial compared to the first trial for all the four measures and both feet. Pairwise comparisons between trials also revealed that the VGRFs and impulse of 20 participants in the first trial were significantly larger than those in the second trial at any one-minute time interval for both feet.
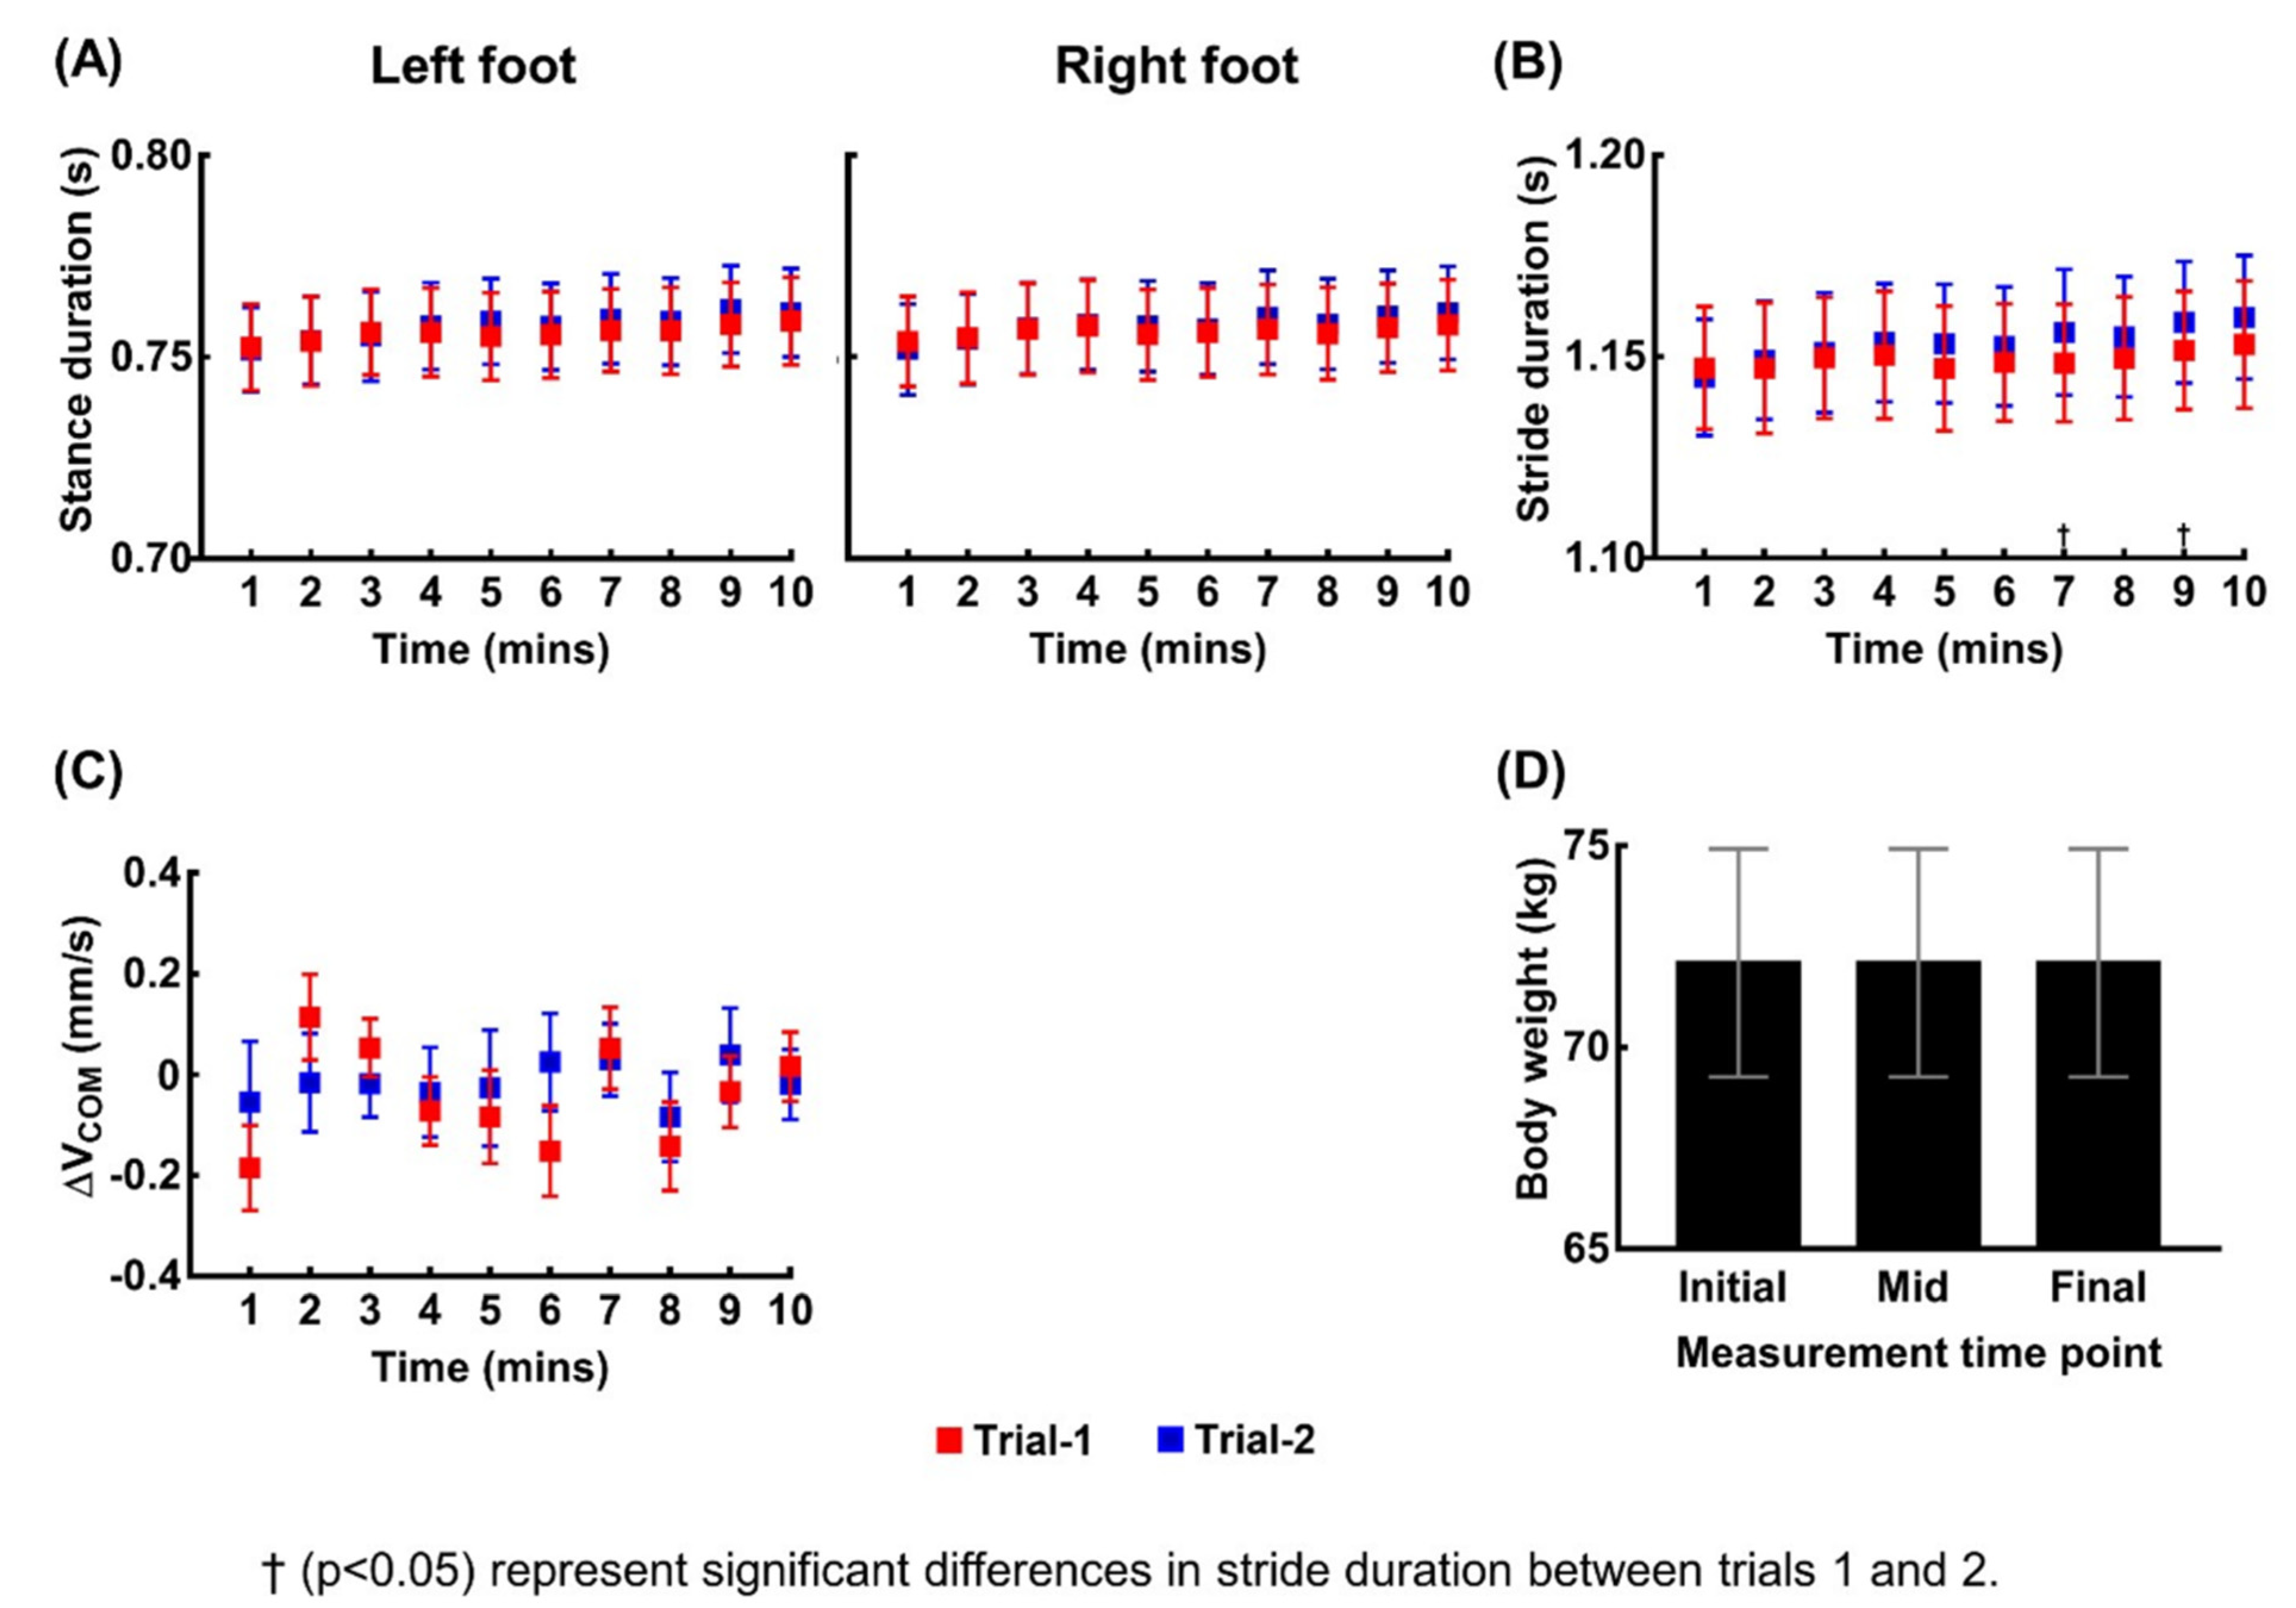
We confirmed that the temporal decline in the estimated VGRFs and impulses are due to imperfect sensing from the pressure pad rather than changes in walking kinematics and dynamics by assessing four measures: (1) BW, (2) stance duration, (3) stride duration, and (4) ΔVCOM (the difference between the VCOM values at the beginning of one stride and the next one). The mean and SE of these four measures of 20 participants are shown in Figure 3, and the results of the statistical analysis are summarized in Table 2. In contrast with the ANOVA results for VGRF and impulse, two-way repeated measures ANOVA concluded no significant main effect except for the effect of time on the stance duration of the left foot. Even for the only observed effect of time on the stance duration of the left foot, the post-hoc pairwise comparisons concluded no significant difference over each one-minute interval. In addition, BW remained exactly the same for all participants across the three BW measurement time points. Therefore, stance duration, stride duration, BW, and ΔVCOM were seldom affected either by walking duration or the trial number.
4. A Curve Fitting Model of the Estimation Error
According to the impulse-momentum theorem, the time integration of the net vertical force applied to the participant should be identical to the change in the vertical linear momentum of the participant, i.e.,
where the interval of integration is from a right heel strike to the subsequent right heel strike; VGRFtotal is the total VGRF on the left and right foot; m is the mass of the participant; and g is the gravitational acceleration. In typical walking, the kinematics is almost periodic, and therefore VCOM after one gait cycle is expected to remain similar to the value at the beginning of the cycle. Experimental data agree with this expectation; VCOM remains almost constant, making ΔVCOM close to zero throughout 10 min of walking (Figure 3C). However, experimental results also showed a time-dependent decline in VGRF, whereas BW remains almost constant. Hence, the left hand side of Equation (1) should decrease, whereas the right hand side remains close to zero. This discrepancy clarifies the time-dependent decline in the estimated impulse. Combined with the time-dependent decline in VGRFs and almost constant stance durations (Figure 3A), the experimental results conclude that the embedded pad underestimates the pressure, and the error grows as the operation time of the treadmill increases, i.e., if we calculate the error in the measured impulse as the difference between the impulse estimated from the Zebris system, which is , and the actual impulse obtained from kinematics, mΔVCOM, then, the magnitude of the error (ΔI) will grow as time, stride number, or the traveled distance increases.
We formulated a model encapsulating the evolving error. After inspecting the general shape of the curves in Figure 2, we assumed that exponential decay would be an appropriate approximation. Therefore, we fit the dynamics of the estimation error as,
where ΔIfit is the fitted value of the error in the impulse measurement; ΔIsteady is the steady-state value which ΔIfit will approach after sufficiently many strides; k is the exponential decay constant; x is the stride number; and xinitial and ΔIinitial are the initial values of the stride and the error, respectively. We set xinitial as one.
To find the optimal ΔIinitial, k, and ΔIsteady iteratively, we need to select their proper initial values for the iteration. We chose initial ΔIinitial as the error in the impulse measurement during the first stride. We chose the initial k as the overall slope of the impulse error with respect to stride, calculated between the last and first strides. Finally, we chose the initial ΔIsteady as the value of the error at the final stride. We iterated the values of ΔIinitial, k, and ΔIsteady using unconstrained multivariate optimization to find the values making ΔIfit closest to the true error, which we calculated as,
for each stride. The objective function of the optimization was the sum of the squared Euclidean distance between ΔI and ΔIfit, and the maximum number of iterations was set as 1000.
5. Goodness of Fit of the Model
We assessed the model’s goodness of fit by calculating the coefficient of determination (R2) between ΔI and ΔIfit after the iteration, separately for each participant and trial. The values of R2 indicate the proportion of variance explained by the curve-fitting model used to encapsulate the error between ΔI and ΔIfit. Considering that the model might be sensitive to a slight fluctuation in ΔI during each single stride, we additionally assessed the model’s goodness of fit after downsampling the data by averaging ΔI over 5, 10, 15, and 20 strides. It is also highly plausible that the error depends more directly on the distance traveled by the treadmill belt or the operation time of the treadmill rather than the stride number. To address this, we calculated the R2 values after fitting ΔI with respect to time and distance. Again, we performed the curve fitting after downsampling the data by averaging the ΔI over 5, 10, 15, and 20 s; and 5, 10, 15, and 20 m.
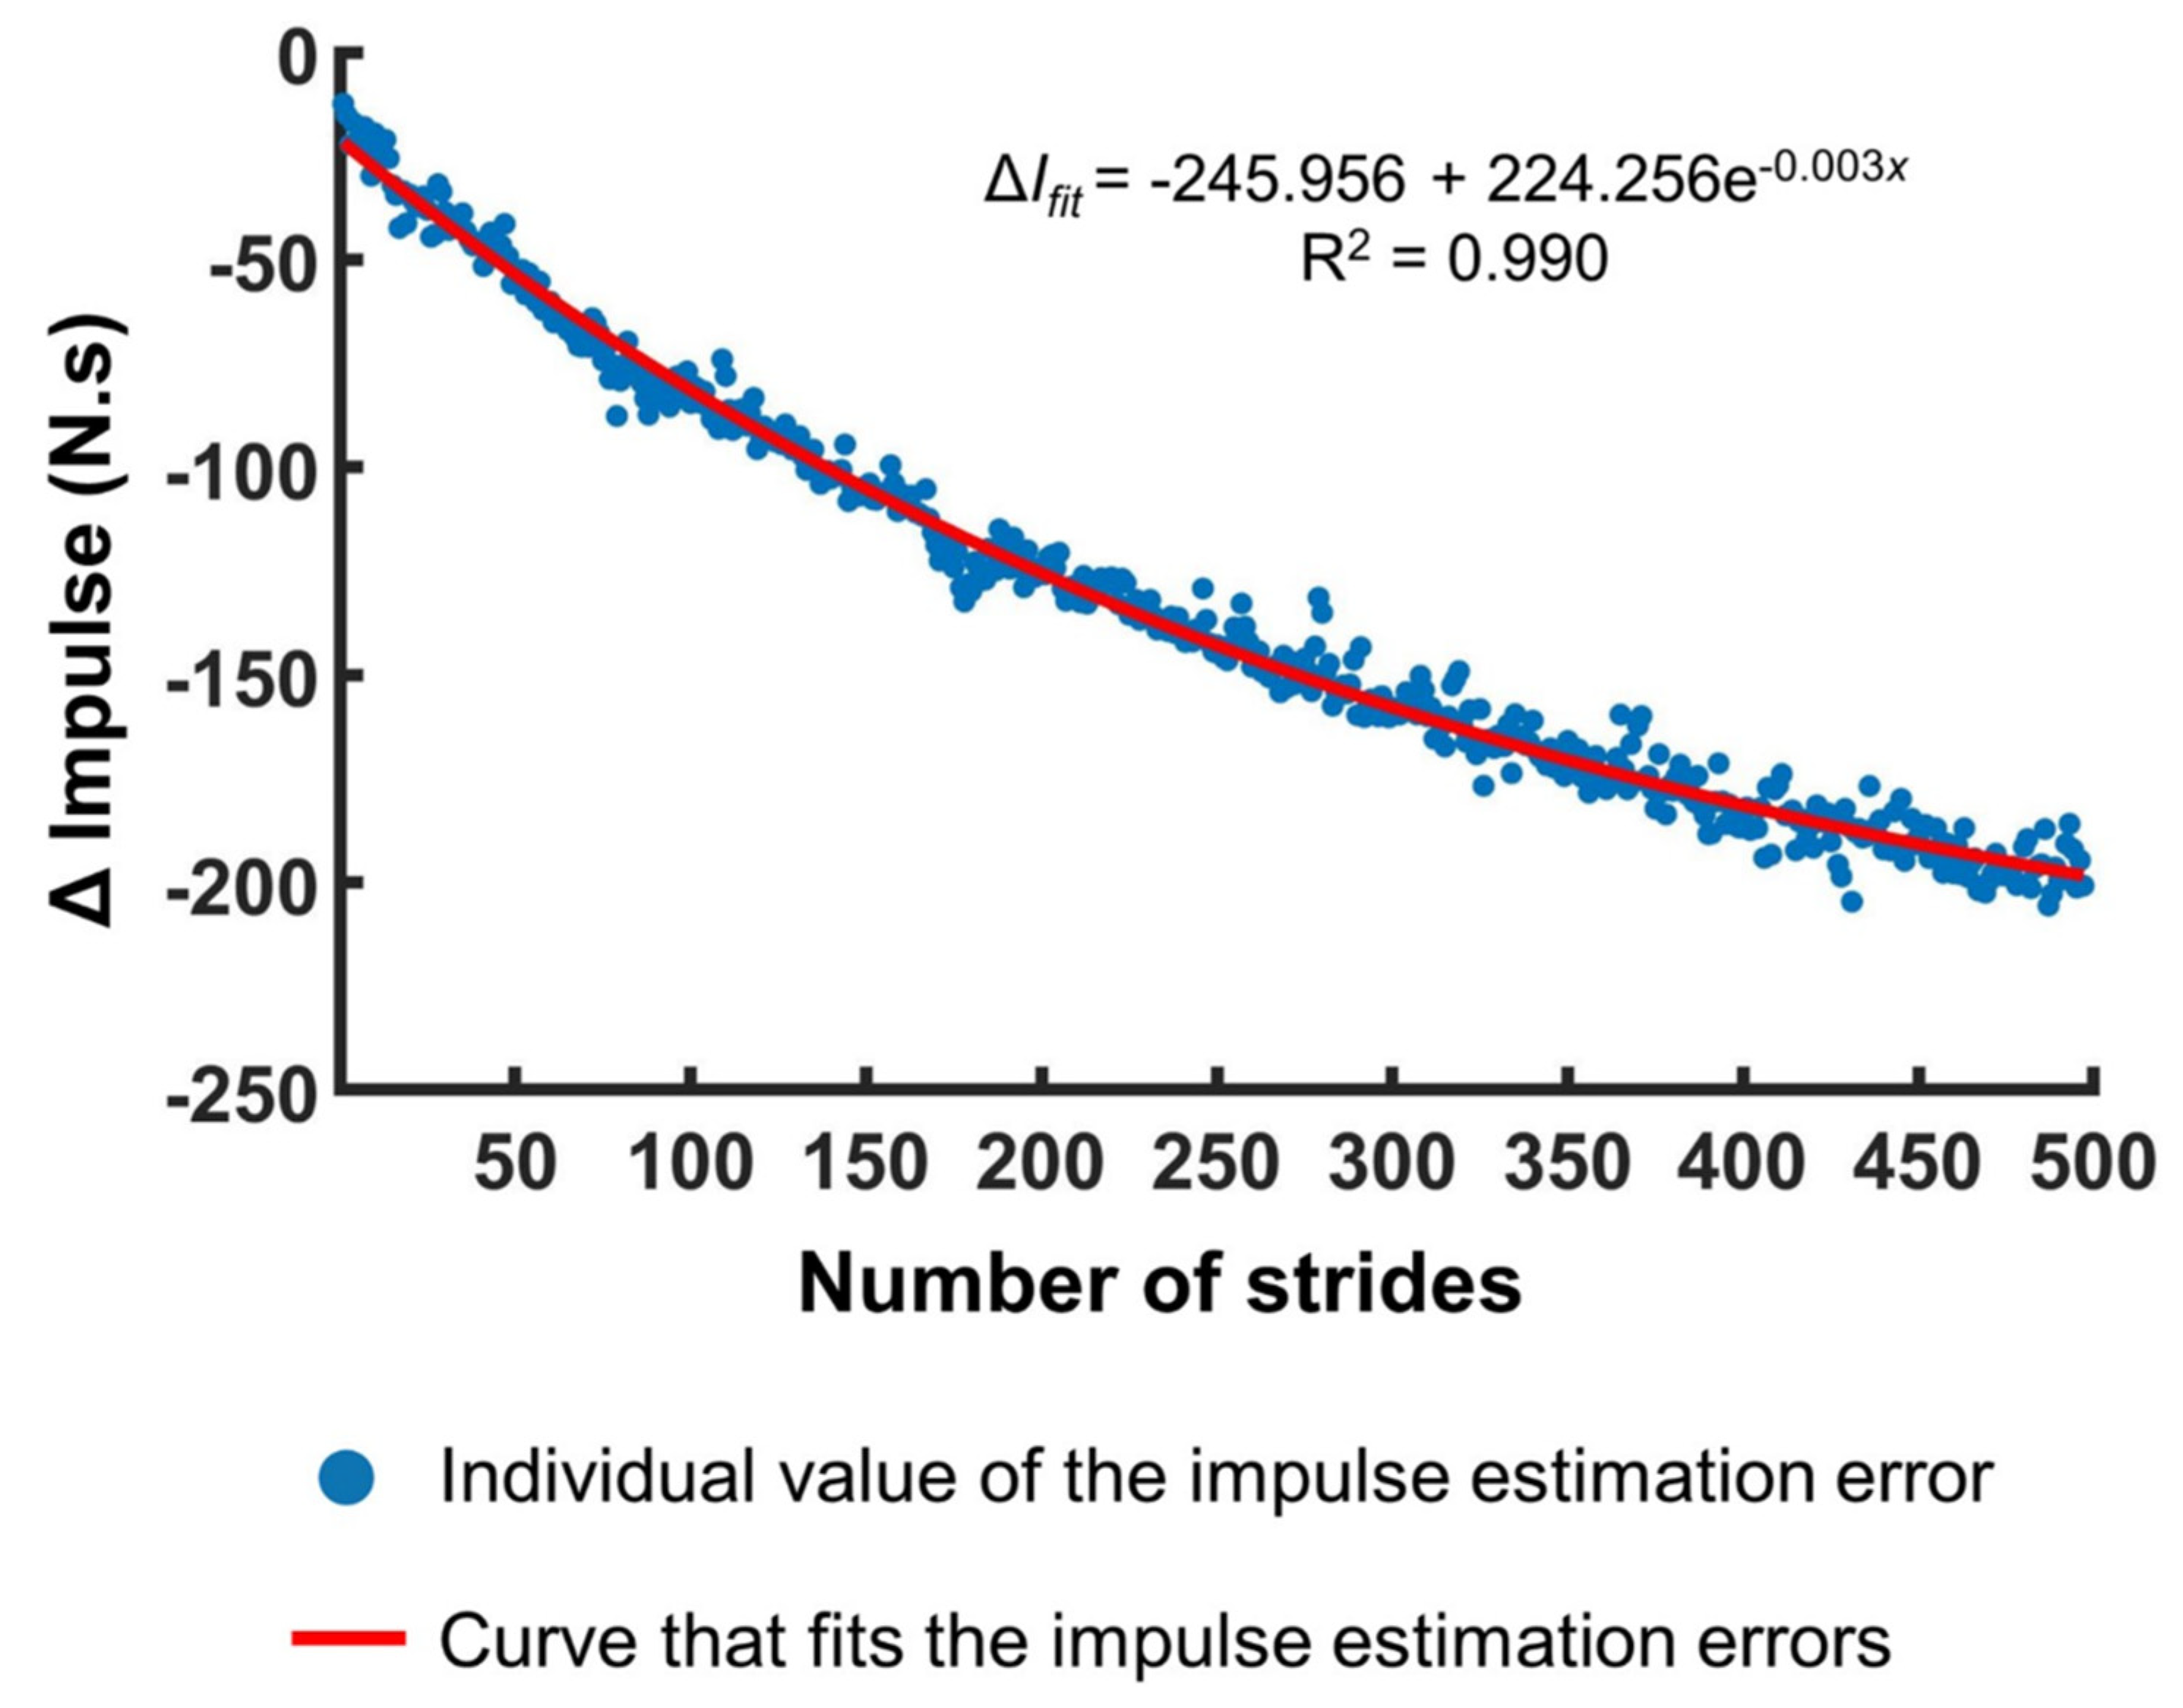
The means and standard errors of the R2 values for 20 participants when fitting ΔI with respect to strides, time, and distance are shown in Figure 4. The mean R2 of 20 participants was above 0.88 in every case and above 0.95 in most cases. A representative fitting curve that approximates the growing errors in VGRF estimation is shown in Figure 5. The R2 values for the first trials were larger than those for the second trial. Downsampling by averaging increased the R2 values. We performed two-way repeated measures ANOVA to evaluate any statistical differences between the values of R2 for 20 participants depending on the data resolution (stride: 1, 5, 10, 15, and 20 strides; time: 5, 10, 15, and 20 s; distance: 5, 10, 15, and 20 m) and trial (2 levels: trials 1 and 2). The results are summarized in Table 3. For all three variables (strides, time, and distance), there were significant main effects of data resolution and trial on R2, and there was a significant interaction between data resolution and trial.
6. Discussion
The capacitive pressure sensor-embedded treadmill has been widely used as a reliable alternative to expensive force platform-mounted treadmills. However, the plantar force measured by capacitive sensors inherently shows drift due to its sensitivity to temperature change, hysteresis, and prolonged pressure-induced sensor deformation. When we assessed the VGRF of 20 participants who walked on a capacitive pressure sensor-embedded treadmill, we found a continuous decline in the measured VGRF over time (Figure 1). In addition, when subsequent measurements were performed after 10 min, the latter measurement consistently yielded lower VGRF values compared to the former one.
We rigorously confirmed that the participants’ walking kinematics and bodyweight did not contribute to the decline in the measured VGRF. According to Newton’s 2nd law, the net external force should equal to mass times the acceleration of COM of any system. During walking on a treadmill, the net external force applied to the walker is the sum of the ground reaction force, body weight, and almost negligible air drag; the only remote force applied to the body of the walker is gravitational force or body weight, and the contact forces applied to the walker are only the ground reaction force and air drag. All other forces (e.g., from various muscles) are internal forces, and therefore cannot contribute to the kinematics of the center of mass by virtue of Newton’s 3rd law. Note that the air drag (in the vertical direction) is negligible (or at least almost zero on average per stride) during walking on a treadmill. Therefore, if we integrate Newton’s 2nd law with respect to time, the impulse in the vertical direction should be same as mΔVCOM; the right hand side of Equation (3) should be very close to zero if VGRF, body weight, and ΔVCOM are all measured correctly. However, this expectation directly contradicts the experimental results. To assess body weight and ΔVCOM, we used the gold-standards: a reliable and accurate scale and a motion capture system. Hence, the only possible explanation for the time-dependent errors is erroneous sensing of VGRF; capacitive sensor-embedded treadmills are not reliable in long-term VGRF measurement during walking.
In contrast with previous studies that evaluated the reliability of capacitive sensor-embedded treadmills only by assessing peak VGRF values for a short period of time, we quantified relatively long-term time-dependent errors in the measured VGRF. Although this finding has the merit of cautioning researchers to avoid long-term VGRF measurement using the Zebris treadmill or similar systems, we went a step further. We estimated the time-dependent errors using the impulse-momentum theorem and formulated curve-fitting models. It might be possible to model the underlying mechanism of the erroneous measure due to the repetitive mechanical stress that the foot exerts on the capacitive sensors during walking. However, to develop a competent model based on such physical mechanisms, it is necessary to know many parameter values that determine the sensor dynamics, which the treadmill company does not disclose. Further, it is extremely challenging to make an accurate model of the mechanical interaction between the foot and the sensors, and the detailed dynamics inevitably depends on the walking pattern of each participant. Therefore, rather than developing a model based on physical mechanisms, we developed a straightforward curve-fitting model customized to individual participant’s walking dynamics. Iteration of three parameters (rate of decay, initial, and steady-state VGRF estimation errors) enabled the resultant curve to fit the growing errors in VGRF estimation with high R2 values above 0.95 in most cases (Figure 4). Note that we developed one curve fitting model per each individual participant; the three parameters of the fitting model are different for each participant, which we summarized in the Supplementary Tables S1–S3. Considering that the experimenter should collect the walking data of each participant, deriving a curve-fitting model customized for each participant’s walking dynamics, rather than a general model with universal parameter values, is more adequate and efficient.
Another finding of this study is that the VGRF values measured during the second trials are significantly lower than those measured during the first trials. This finding is consistent with the result of a previous study by Van Alsenoy et al. [18], which reported that the peak VGRF values measured by a Zebris treadmill during the second trial were lower than the values during the first trial for all running speeds. A previous study by Item-Glatthorn et al. reported that a Zebris treadmill provided reliable peak forces measured between-days [17], but the participants walked on a Zebris treadmill only for 20 s in this study. Nüesch et al. also reported that peak forces measured by a Zebris system were consistent across trials and days when participants walked and ran on a Zebris treadmill for 2 min [10]. These studies support that a one-day break may be sufficiently long for the sensors to regain their sensitivity after being used for a short period, such as 20 s or 2 min. However, our result clearly indicates that the underestimation of VGRF becomes more severe as stride number increases during the 10 min of walking in the first trial, and a 10 min break between the trials is not long enough for the sensors to recover from the accumulated effects of mechanisms that cause the underestimation of pressure. It is plausible that the minimum duration of the break session necessary for the pressure pad to regain the original sensitivity depends on the strength of the actual mechanical stress and the time interval during which the sensors were exposed to the stress. This speculation leads to the need for considering the locomotion speed and weight of the participants and the length of the locomotion session to decide the length of the break session that secures a reliable measure of VGRF. Such a concrete design criterion for the experiment should be systematically addressed by additional future work.
In this initial study, we measured VGRF when the participants walked at their PWS, which was within a small range, between 3.1 and 4.2 km/h. For high speed locomotion such as running, VGRF increases substantially [31,32], and therefore may cause further sensor deformation, decreasing the reliability of VGRF measurement. A previous study actually reported underestimation of VGRF by a Zebris treadmill for high speed running [18]. In addition, the magnitude and trend of the measurement errors might depend on the foot strike pattern during running, which can be categorized as fore, mid, or rear foot strike [33,34]. Similarly, patients with foot pathologies or neurological dysfunctions alter pressure distribution and increase the center of pressure trajectory variability during the stance phase [35,36,37,38]. These plantar function irregularities during walking can also skew the time-dependent trend of VGRF estimation errors. Hence, without proper future work, the efficacy of our approach to developing a curve fitting model to encapsulate the VGRF estimation error is not guaranteed for running or pathological gait.
7. Conclusions
Measuring foot pressure using capacitive sensors is a cost effective way to obtain VGRF information during walking, but the affordability comes with the cost of inaccuracy. We clarified the time-dependent growing errors in VGRF values measured by a capacitive pressure sensor-embedded treadmill. Our results strongly suggest that researchers should be cautious when using the VGRF values obtained from such systems to evaluate time-dependent locomotor behaviors. As a quick solution to the identified problem, we propose formulating a curve-fitting model customized for each participant. Instead of developing a competent mathematical model of the sensor dynamics and the effect of the repetitive mechanical stress due to foot contact, we suggest simple, quick and straightforward curve fitting based on the obtained data and iteration. This approach may be an effective way to estimate VGRF values during walking more accurately using treadmills with capacitive pressure sensors. Hence, researchers in the field of human movement science can consider the model proposed in our study as a viable method to compensate for the low reliability of Zebris treadmills and similar capacitive sensor-embedded systems for VGRF measurement during walking.
Supplementary Materials
The followings are available online at https://www.mdpi.com/article/10.3390/s21165511/s1: Table S1: The equations of the curve-fitting model with respect to stride number and the corresponding coefficient of determination (R2) for each participant, Table S2: The equations of the curve-fitting model with respect to time and the corresponding coefficient of determination (R2) for each participant, and Table S3: The equations of the curve-fitting model with respect to distance and the corresponding coefficient of determination (R2) for each participant.
Author Contributions
Conceptualization, J.A.; Data curation and investigation, P.P.; Formal analysis, P.P.; Methodology, P.P. and J.A.; Visualization, P.P.; Writing, P.P. and J.A. Both authors have read and agreed to the published version of the manuscript.
Funding
This research was funded in part by the National Research Foundation of Korea (NRF) Grants funded by the Korean Government (MSIT) (No. 2016R1A5A1938472), Technology Innovation Program (20008912) and Industrial Technology Innovation Program (No. 20007058, Development of safe and comfortable human augmentation hybrid robot suit) funded by the Ministry of Trade, Industry & Energy (MOTIE, Korea), and Ministry of Education of the Republic of Korea and the National Research Foundation of Korea.
Institutional Review Board Statement
The participants were informed about all the aspects of the study, and they provided informed, written consent before participation. All aspects of the study adhered to the principles and guidelines described in the Declaration of Helsinki and approved by the Institute Review Board of Seoul National University. (IRB No. 2007/001-009).
Informed Consent Statement
Informed consent was obtained from all subjects involved in the study.
Data Availability Statement
All data sets generated and/or analyzed during the current study are available from the corresponding author (J.A.) on reasonable request.
Acknowledgments
We thank Chihyeong Lee, Seongwon Hwang, Ilseung Park, Beomdo Kim, and Junhyuk Lee for their assistance while performing the experiment. We also thank Ilhyeok Park for his helpful comments regarding measurement and statistics.
Conflicts of Interest
The authors declare no conflict of interest.
References
- Paoloni, M.; Mangone, M.; Fratocchi, G.; Murgia, M.; Saraceni, V.M.; Santilli, V. Kinematic and kinetic features of normal level walking in patellofemoral pain syndrome: More than a sagittal plane alteration. J. Biomech. 2010, 43, 1794–1798. [Google Scholar] [CrossRef]
- Creaby, M.W.; Hunt, M.A.; Hinman, R.S.; Bennell, K.L. Sagittal plane joint loading is related to knee flexion in osteoarthritic gait. Clin. Biomech. 2013, 28, 916–920. [Google Scholar] [CrossRef]
- De David, A.C.; Carpes, F.P.; Stefanyshyn, D. Effects of changing speed on knee and ankle joint load during walking and running. J. Sports Sci. 2015, 33, 391–397. [Google Scholar] [CrossRef]
- Sturdy, J.T.; Sessoms, P.H.; Silverman, A.K. A backpack load sharing model to evaluate lumbar and hip joint contact forces during shoulder borne and hip belt assisted load carriage. Appl. Ergon. 2021, 90, 103277. [Google Scholar] [CrossRef]
- Hamill, J.; McNiven, S.L. Reliability of selected ground reaction force parameters during walking. Hum. Mov. Sci. 1990, 9, 117–131. [Google Scholar] [CrossRef]
- Belli, A.; Bui, P.; Berger, A.; Geyssant, A.; Lacour, J.-R. A treadmill ergometer for three-dimensional ground reaction forces measurement during walking. J. Biomech. 2001, 34, 105–112. [Google Scholar] [CrossRef]
- Kesar, T.M.; Binder-Macleod, S.A.; Hicks, G.E.; Reisman, D.S. Minimal detectable change for gait variables collected during treadmill walking in individuals post-stroke. Gait Posture 2011, 33, 314–317. [Google Scholar] [CrossRef] [Green Version]
- Willems, P.A.; Gosseye, T.P. Does an instrumented treadmill correctly measure the ground reaction forces? BiO 2013, 2, 1421–1424. [Google Scholar] [CrossRef] [Green Version]
- Faude, O.; Donath, L.; Roth, R.; Fricker, L.; Zahner, L. Reliability of gait parameters during treadmill walking in community-dwelling healthy seniors. Gait Posture 2012, 36, 444–448. [Google Scholar] [CrossRef]
- Nüesch, C.; Overberg, J.-A.; Schwameder, H.; Pagenstert, G.; Mündermann, A. Repeatability of spatiotemporal, plantar pressure and force parameters during treadmill walking and running. Gait Posture 2018, 62, 117–123. [Google Scholar] [CrossRef]
- Lee, M.; Song, C.; Lee, K.; Shin, D.; Shin, S. Agreement between the spatio-temporal gait parameters from treadmill-based photoelectric cell and the instrumented treadmill system in healthy young adults and stroke patients. Med. Sci. Mon. 2014, 20, 1210–1219. [Google Scholar]
- Donath, L.; Faude, O.; Lichtenstein, E.; Nüesch, C.; Mündermann, A. Validity and reliability of a portable gait analysis system for measuring spatiotemporal gait characteristics: Comparison to an instrumented treadmill. J. Neuroeng. Rehabil. 2016, 13, 1–9. [Google Scholar] [CrossRef] [Green Version]
- Miyazaki, S.; Ishida, A. Capacitive transducer for continuous measurement of vertical foot force. Med. Biol. Eng. Comput. 1984, 22, 309–316. [Google Scholar] [CrossRef]
- Salpavaara, T.; Verho, J.; Lekkala, J. Capacitive insole sensor for hip surgery rehabilitation. In Proceedings of the 2008 Second International Conference on Pervasive Computing Technologies for Healthcare, Tampere, Finland, 30 January–1 February 2008. [Google Scholar]
- Sorrentino, I.; Andrade Chavez, F.J.; Latella, C.; Fiorio, L.; Traversaro, S.; Rapetti, L.; Tirupachuri, Y.; Guedelha, N.; Maggiali, M.; Dussoni, S. A Novel Sensorised Insole for Sensing Feet Pressure Distributions. Sensors 2020, 20, 747. [Google Scholar] [CrossRef] [Green Version]
- Lee, N.; Goonetilleke, R.S.; Cheung, Y.S.; So, G.M. A flexible encapsulated MEMS pressure sensor system for biomechanical applications. Microsyst Technol. 2001, 7, 55–62. [Google Scholar] [CrossRef]
- Item-Glatthorn, J.F.; Casartelli, N.C.; Maffiuletti, N.A. Reproducibility of gait parameters at different surface inclinations and speeds using an instrumented treadmill system. Gait Posture. 2016, 44, 259–264. [Google Scholar] [CrossRef]
- Van Alsenoy, K.; Thomson, A.; Burnett, A. Reliability and validity of the Zebris FDM-THQ instrumented treadmill during running trials. Sports Biomech. 2018, 18, 501–514. [Google Scholar] [CrossRef]
- Riva, F.; Bisi, M.C.; Stagni, R. Gait variability and stability measures: Minimum number of strides and within-session reliability. Comput. Biol. Med. 2014, 50, 9–13. [Google Scholar] [CrossRef]
- Bruijn, S.M.; van Dieën, J.H.; Meijer, O.G.; Beek, P.J. Statistical precision and sensitivity of measures of dynamic gait stability. J. Neurosci. Methods. 2009, 178, 327–333. [Google Scholar] [CrossRef]
- Owings, T.M.; Grabiner, M.D. Measuring step kinematic variability on an instrumented treadmill: How many steps are enough? J. Biomech. 2003, 36, 1215–1218. [Google Scholar]
- Ahn, J.; Hogan, N. Improved assessment of orbital stability of rhythmic motion with noise. PLoS ONE 2015, 10, e0119596. [Google Scholar] [CrossRef] [PubMed] [Green Version]
- Kalron, A.; Dvir, Z.; Frid, L.; Achiron, A. Quantifying gait impairment using an instrumented treadmill in people with multiple sclerosis. ISRN Neurol. 2013, 2013, 867575. [Google Scholar] [CrossRef] [Green Version]
- Giacomozzi, C.; Keijsers, N.; Pataky, T.; Rosenbaum, D. International scientific consensus on medical plantar pressure measurement devices: Technical requirements and performance. Ann. Ist. Super Sanita 2012, 48, 259–271. [Google Scholar] [CrossRef]
- Urry, S. Plantar pressure-measurement sensors. Meas. Sci. Technol. 1999, 10, R16–R32. [Google Scholar] [CrossRef]
- Abdul Razak, A.H.; Zayegh, A.; Begg, R.K.; Wahab, Y. Foot plantar pressure measurement system: A review. Sensors 2012, 12, 9884–9912. [Google Scholar] [CrossRef] [Green Version]
- Lord, M. Spatial resolution in plantar pressure measurement. Med. Eng. Phys. 1997, 19, 140–144. [Google Scholar] [CrossRef]
- Pataky, T.C. Spatial resolution in plantar pressure measurement revisited. J. Biomech. 2012, 45, 2116–2124. [Google Scholar] [CrossRef]
- Sawilowsky, S.S. New effect size rules of thumb. J. Mod. Appl. Stat. Methods 2009, 8, 597–599. [Google Scholar] [CrossRef]
- Faul, F.; Erdfelder, E.; Buchner, A.; Lang, A.-G. Statistical power analyses using G* Power 3.1: Tests for correlation and regression analyses. Behav. Res. Methods 2009, 41, 1149–1160. [Google Scholar] [CrossRef] [Green Version]
- Nilsson, J.; Thorstensson, A. Ground reaction forces at different speeds of human walking and running. Acta Physiol. Scand. 1989, 136, 217–227. [Google Scholar] [CrossRef] [PubMed]
- Weyand, P.G.; Sternlight, D.B.; Bellizzi, M.J.; Wright, S. Faster top running speeds are achieved with greater ground forces not more rapid leg movements. J. Appl. Physiol. 2000, 89, 1991–1999. [Google Scholar] [CrossRef] [PubMed] [Green Version]
- Hatala, K.G.; Dingwall, H.L.; Wunderlich, R.E.; Richmond, B.G. Variation in foot strike patterns during running among habitually barefoot populations. PLoS ONE 2013, 8, e52548. [Google Scholar] [CrossRef] [Green Version]
- Almeida, M.O.; Davis, I.S.; Lopes, A.D. Biomechanical differences of foot-strike patterns during running: A systematic review with meta-analysis. J. Orthop. Sports Phys. Ther 2015, 45, 738–755. [Google Scholar] [CrossRef] [Green Version]
- Pataky, Z.; Assal, J.P.; Conne, P.; Vuagnat, H.; Golay, A. Plantar pressure distribution in Type 2 diabetic patients without peripheral neuropathy and peripheral vascular disease. Diabet. Med. 2005, 22, 762–767. [Google Scholar] [CrossRef]
- Chisholm, A.E.; Perry, S.D.; McIlroy, W.E. Inter-limb centre of pressure symmetry during gait among stroke survivors. Gait Posture 2011, 33, 238–243. [Google Scholar] [CrossRef] [PubMed] [Green Version]
- Kalron, A.; Frid, L. The “butterfly diagram”: A gait marker for neurological and cerebellar impairment in people with multiple sclerosis. J. Neurol. Sci. 2015, 358, 92–100. [Google Scholar] [CrossRef] [PubMed]
- Sutkowska, E.; Sutkowski, K.; Sokołowski, M.; Franek, E.; Dragan, S. Distribution of the highest plantar pressure regions in patients with diabetes and its association with peripheral neuropathy, gender, age, and BMI: One centre study. J. Diabetes Res. 2019, 2019, 7395769. [Google Scholar] [CrossRef] [PubMed]
Figure 1.
An illustration of the VGRF curve for a single step. The red circles denote three stereotypical time points for each step; the time point of load response (LR), mid stance (MS), and push off (PO). The LR and PO are the time points of two peaks of the double bump pattern of the VGRF curve, and MS is the time point of the minimal value of VGRF between LR and PO.

Figure 2.
Changes in the VGRFs at the three stereotypical time points and the impulse due to VGRF with increase in time. (A–C) show the means and standard error bars of VGRFs for 20 participants at LR, MS, and PO, respectively, averaged over every one-minute time interval for the both feet and two trials. (D) shows the means and standard error bars of impulse for 20 participants averaged over every one-minute time interval for the both feet and two trials.

Figure 3.
The measures used to assess whether the time-dependent decrease in the VGRF is due to alterations in kinematics or dynamics during walking. (A–C) show the means and standard error bars of the stance durations of the both feet, stride durations, the difference in the values of the vertical center of mass velocity between the beginning of one stride and the next one (ΔVCOM) for 20 participants averaged over every one-minute time interval for the two trials. (D) shows the means and standard error bars of the body weights (BW) for 20 participants for three measurement time points: initial (before the first trial), mid (between the first and second trial), and final (after completion of the second trial). BW remained exactly same for all participants across the three time points.

Figure 4.
The goodness of fit of the curve fitting model of the VGRF estimation error. The figures from left to right are the means and standard error bars of the coefficient of determination (R2) for 20 participants when fitting the error (ΔI) with respect to the stride number (strides), the operation time of the treadmill (time), and the distance traveled by the treadmill belt (distance), respectively, for the two trials. We assessed the model’s goodness of fit for the curve fitting with respect to every single stride, every 5, 10, 15, and 20 strides. Similarly, we assessed model’s goodness of fit after downsampling ΔI by averaging it over 5, 10, 15, and 20 s; and 5, 10, 15, and 20 m for time and distance, respectively. Generally, downsampling the data increased the mean R2 of 20 participants. The mean R2 of 20 participants for the first trial was larger than the second trial.

Figure 5.
A representative figure illustrating the curve-fitting model that encapsulates the VGRF estimation error over strides. The blue circles are the individual impulse estimation error values for each stride, and the red line is the curve used to encapsulate the temporal changes in the impulse estimation errors.


Table 1.
The results of two-way repeated measures ANOVA for VGRFs and impulse.
| Measure | Within-Subjects Effects | ||||
|---|---|---|---|---|---|
| Time | Trial | Interaction | |||
| VGRF | LR | Left | F[1.675,31.821] = 182.775, p < 0.001 | F[1,19] = 62.029, p < 0.001 | F[2.365,44.938] = 14.034, p < 0.001 |
| Right | F[1.722,32.721] = 168.093, p < 0.001 | F[1,19] = 75.538, p < 0.001 | F[3.015,57.291] = 14.977, p < 0.001 | ||
| MS | Left | F[1.512,28.730] = 139.023, p < 0.001 | F[1,19] = 75.538, p < 0.001 | F[3.032,57.600] = 17.979, p < 0.001 | |
| Right | F[2.045,38.862] = 135.190, p < 0.001 | F[1,19] = 77.021, p < 0.001 | F[2.577,48.955] = 16.322, p < 0.001 | ||
| PO | Left | F[1.516,28.807] = 93.345, p < 0.001 | F[1,19] = 51.350, p < 0.001 | F[2.472,46.962] = 3.510, p = 0.029 | |
| Right | F[1.624,30.856] = 98.168, p < 0.001 | F[1,19] = 32.807, p < 0.001 | F[2.623,49.841] = 5.051, p = 0.006 | ||
| Impulse | Left | F[1.260,23.934] = 120.867, p < 0.001 | F[1,19] = 52.881, p < 0.001 | F[1.841,34.970] = 18.048, p < 0.001 | |
| Right | F[1.391,26.423] = 134.003, p < 0.001 | F[1,19] = 56.153, p < 0.001 | F[2.060,39.143] = 21.252, p < 0.001 | ||
Table 2.
The results of two-way repeated measures ANOVA performed for a sanity check.
| Measure | Within-Subjects Effects | |||
|---|---|---|---|---|
| Time | Trial | Interaction | ||
| Stance duration | Left | F[2.124,40.360] = 3.954, p = 0.025 | F[1,19] = 0.229, p = 0.638 | F[3.295,62.614] = 1.137, p = 0.343 |
| Right | F[2.121,40.299] = 2.273, p = 0.113 | F[1,19] = 0.228, p = 0.639 | F[3.623,68.835] = 1.178, p = 0.327 | |
| Stride duration | F[1.991,37.835] = 1.623, p = 0.211 | F[1,19] = 0.462, p = 0.505 | F[3.072,58.369] = 1.662, p = 0.184 | |
| ΔVCOM | F[5.029,95.557] = 0.990, p = 0.450 | F[1,19] = 1.718, p = 0.206 | F[4.626,87.902] = 0.491, p = 0.879 | |
Table 3.
The results of two-way repeated measures ANOVA for R2.
| Measure | Within-Subjects Effects | ||
|---|---|---|---|
| Resolution | Trial | Interaction | |
| Stride | F[1.017,19.317] = 21.053, p < 0.001 | F[1,19] = 17.089, p = 0.001 | F[1.225,23.269] = 12.716, p = 0.001 |
| Time | F[1.100,20.906] = 9.526, p = 0.005 | F[1,19] = 18.839, p < 0.001 | F[1.476,28.038] = 9.769, p = 0.002 |
| Distance | F[1.035,19.661] = 14.530, p = 0.001 | F[1,19] = 15.773, p = 0.001 | F[1.238,23.526] =4.702, p = 0.033 |
Publisher’s Note: MDPI stays neutral with regard to jurisdictional claims in published maps and institutional affiliations. |
© 2021 by the authors. Licensee MDPI, Basel, Switzerland. This article is an open access article distributed under the terms and conditions of the Creative Commons Attribution (CC BY) license (https://creativecommons.org/licenses/by/4.0/).
Share and Cite
MDPI and ACS Style
Pathak, P.; Ahn, J. A Pressure-Pad-Embedded Treadmill Yields Time-Dependent Errors in Estimating Ground Reaction Force during Walking. Sensors 2021, 21, 5511. https://doi.org/10.3390/s21165511
AMA Style
Pathak P, Ahn J. A Pressure-Pad-Embedded Treadmill Yields Time-Dependent Errors in Estimating Ground Reaction Force during Walking. Sensors. 2021; 21(16):5511. https://doi.org/10.3390/s21165511
Chicago/Turabian StylePathak, Prabhat, and Jooeun Ahn. 2021. "A Pressure-Pad-Embedded Treadmill Yields Time-Dependent Errors in Estimating Ground Reaction Force during Walking" Sensors 21, no. 16: 5511. https://doi.org/10.3390/s21165511
Note that from the first issue of 2016, this journal uses article numbers instead of page numbers. See further details here.