Optical Biosensors for the Detection of Rheumatoid Arthritis (RA) Biomarkers: A Comprehensive Review

 , , ,
, , ,
Abstract
:
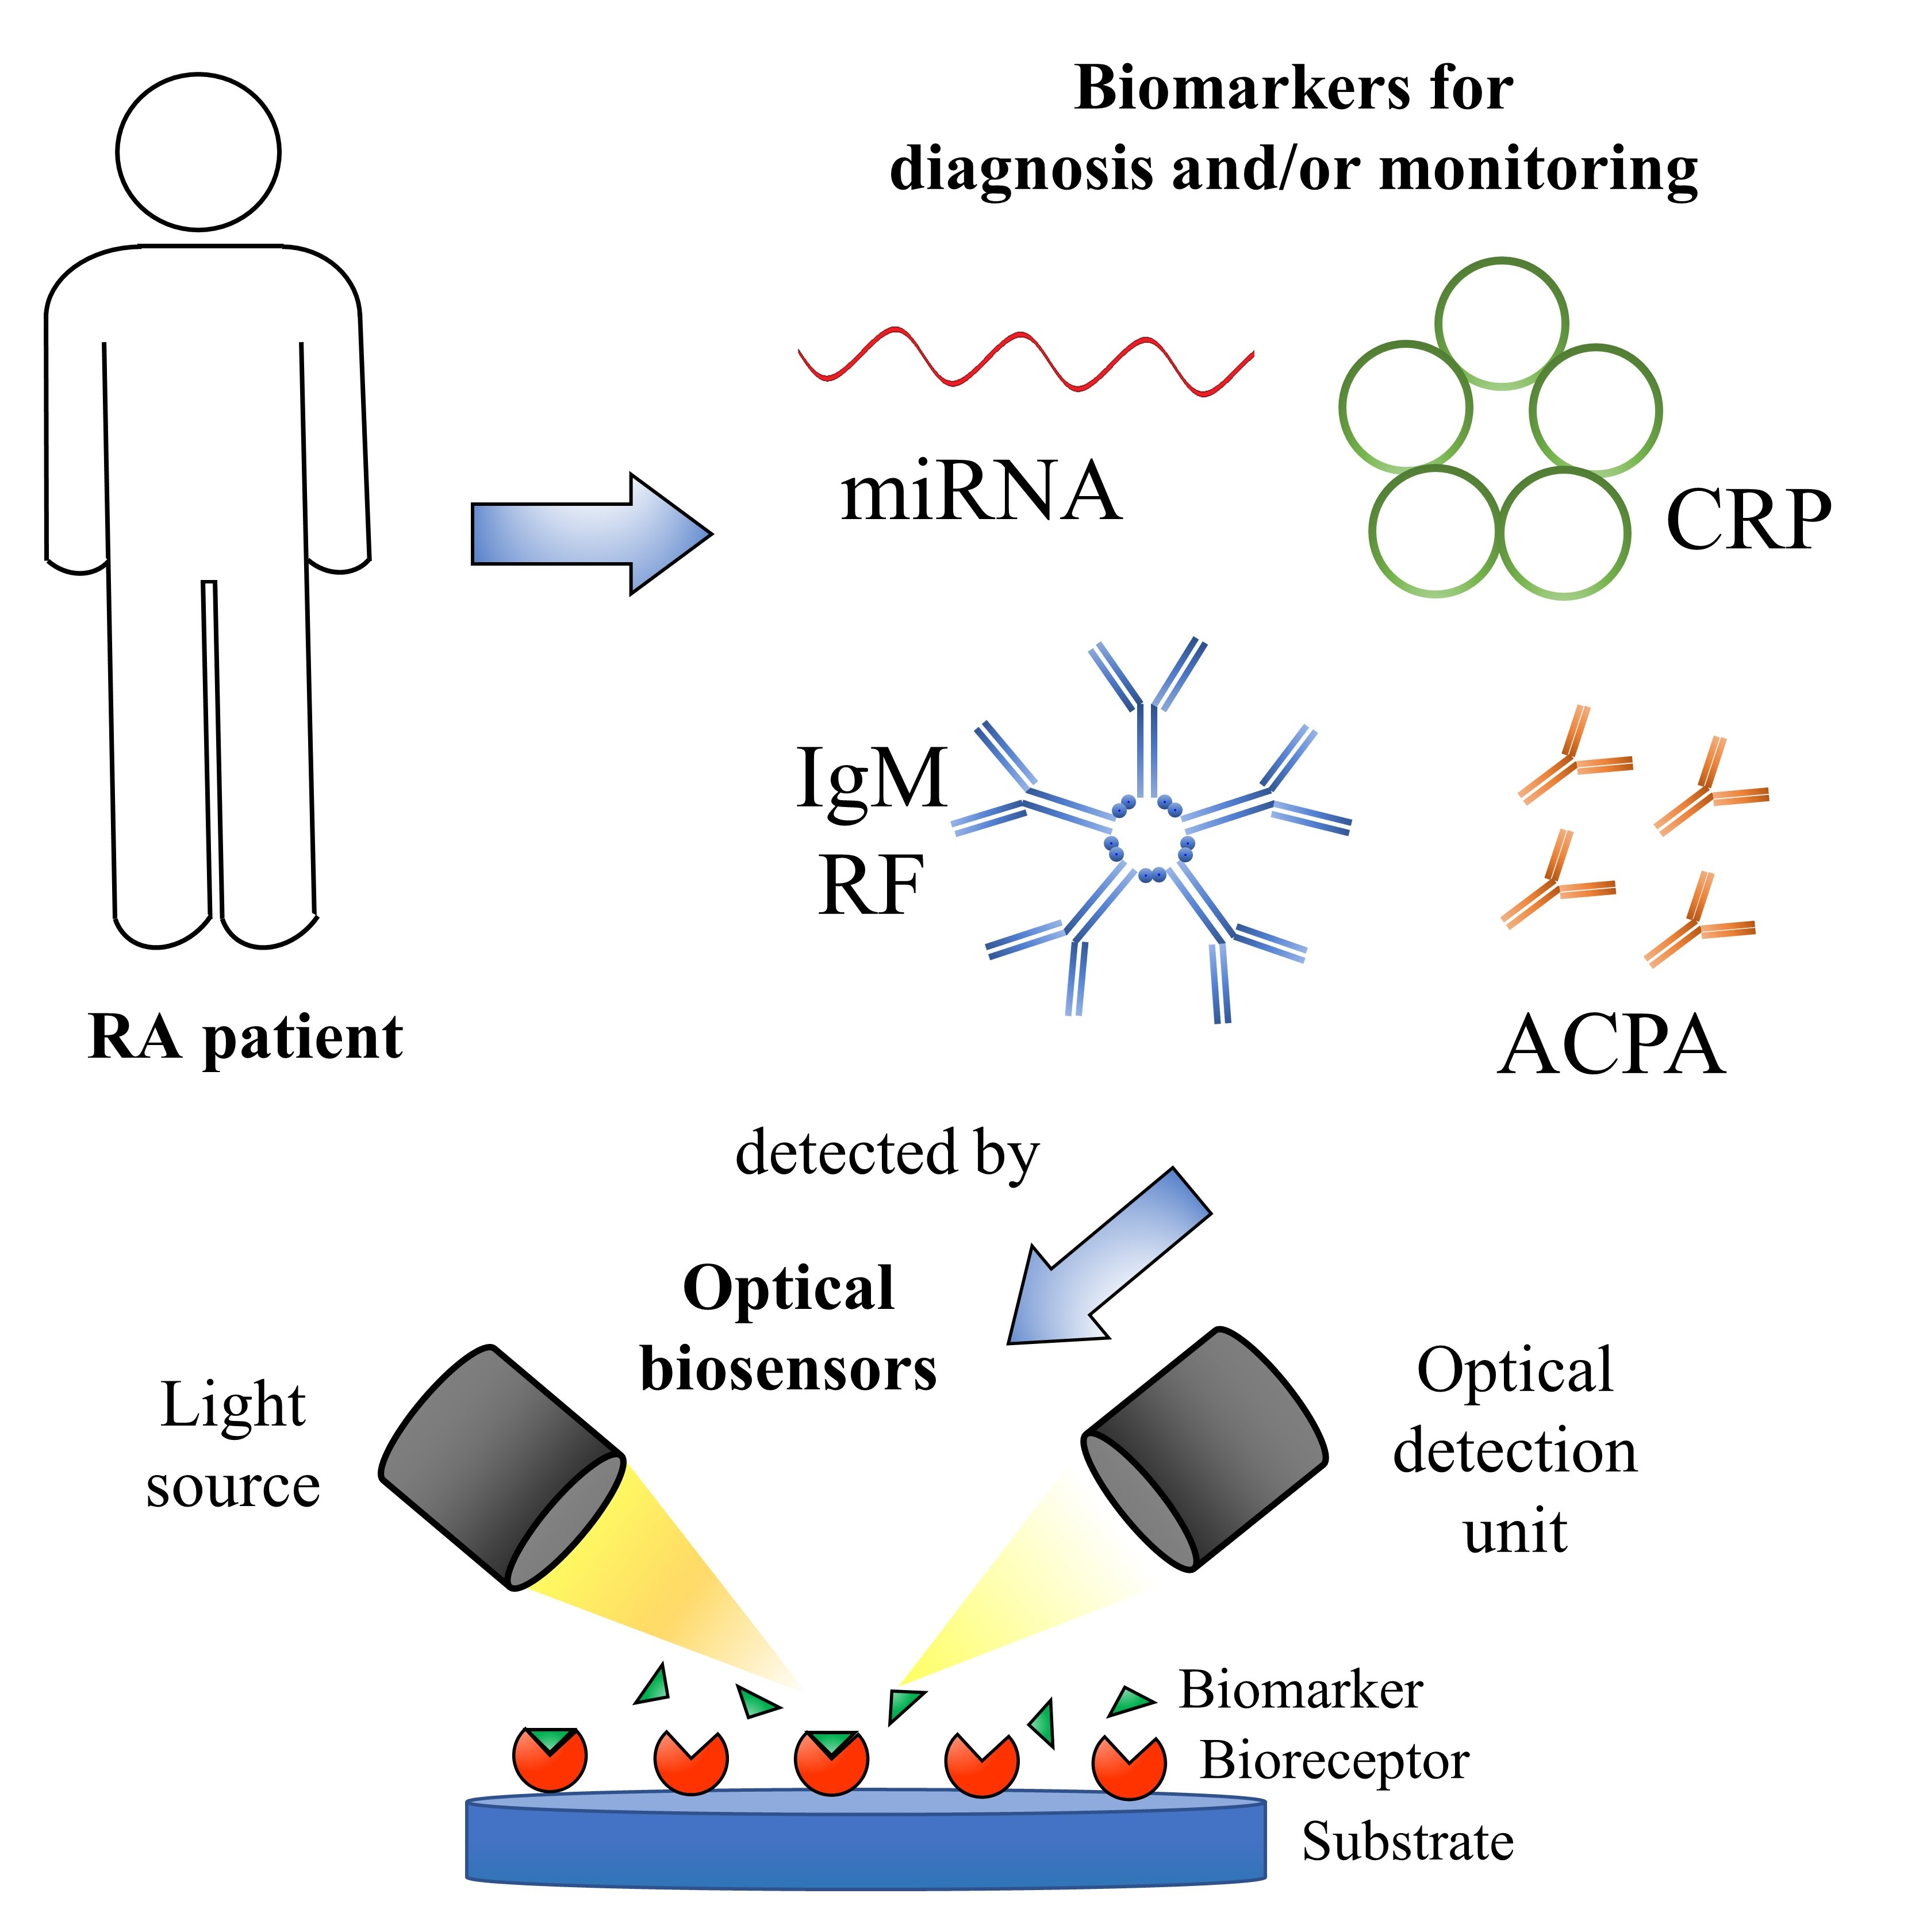
1. Introduction
- Disease Activity Score in 28 joints (DAS28) combined with Erythrocyte Sedimentation Rate (ESR) or C-reactive protein (CRP);
- Clinical Disease Activity Index (CDAI);
- Simplified Disease Activity Index (SDAI);
- Routine Assessment of Patient Index Data 3 (RAPID3);
- Patient Activity Scale-II (PAS-II).
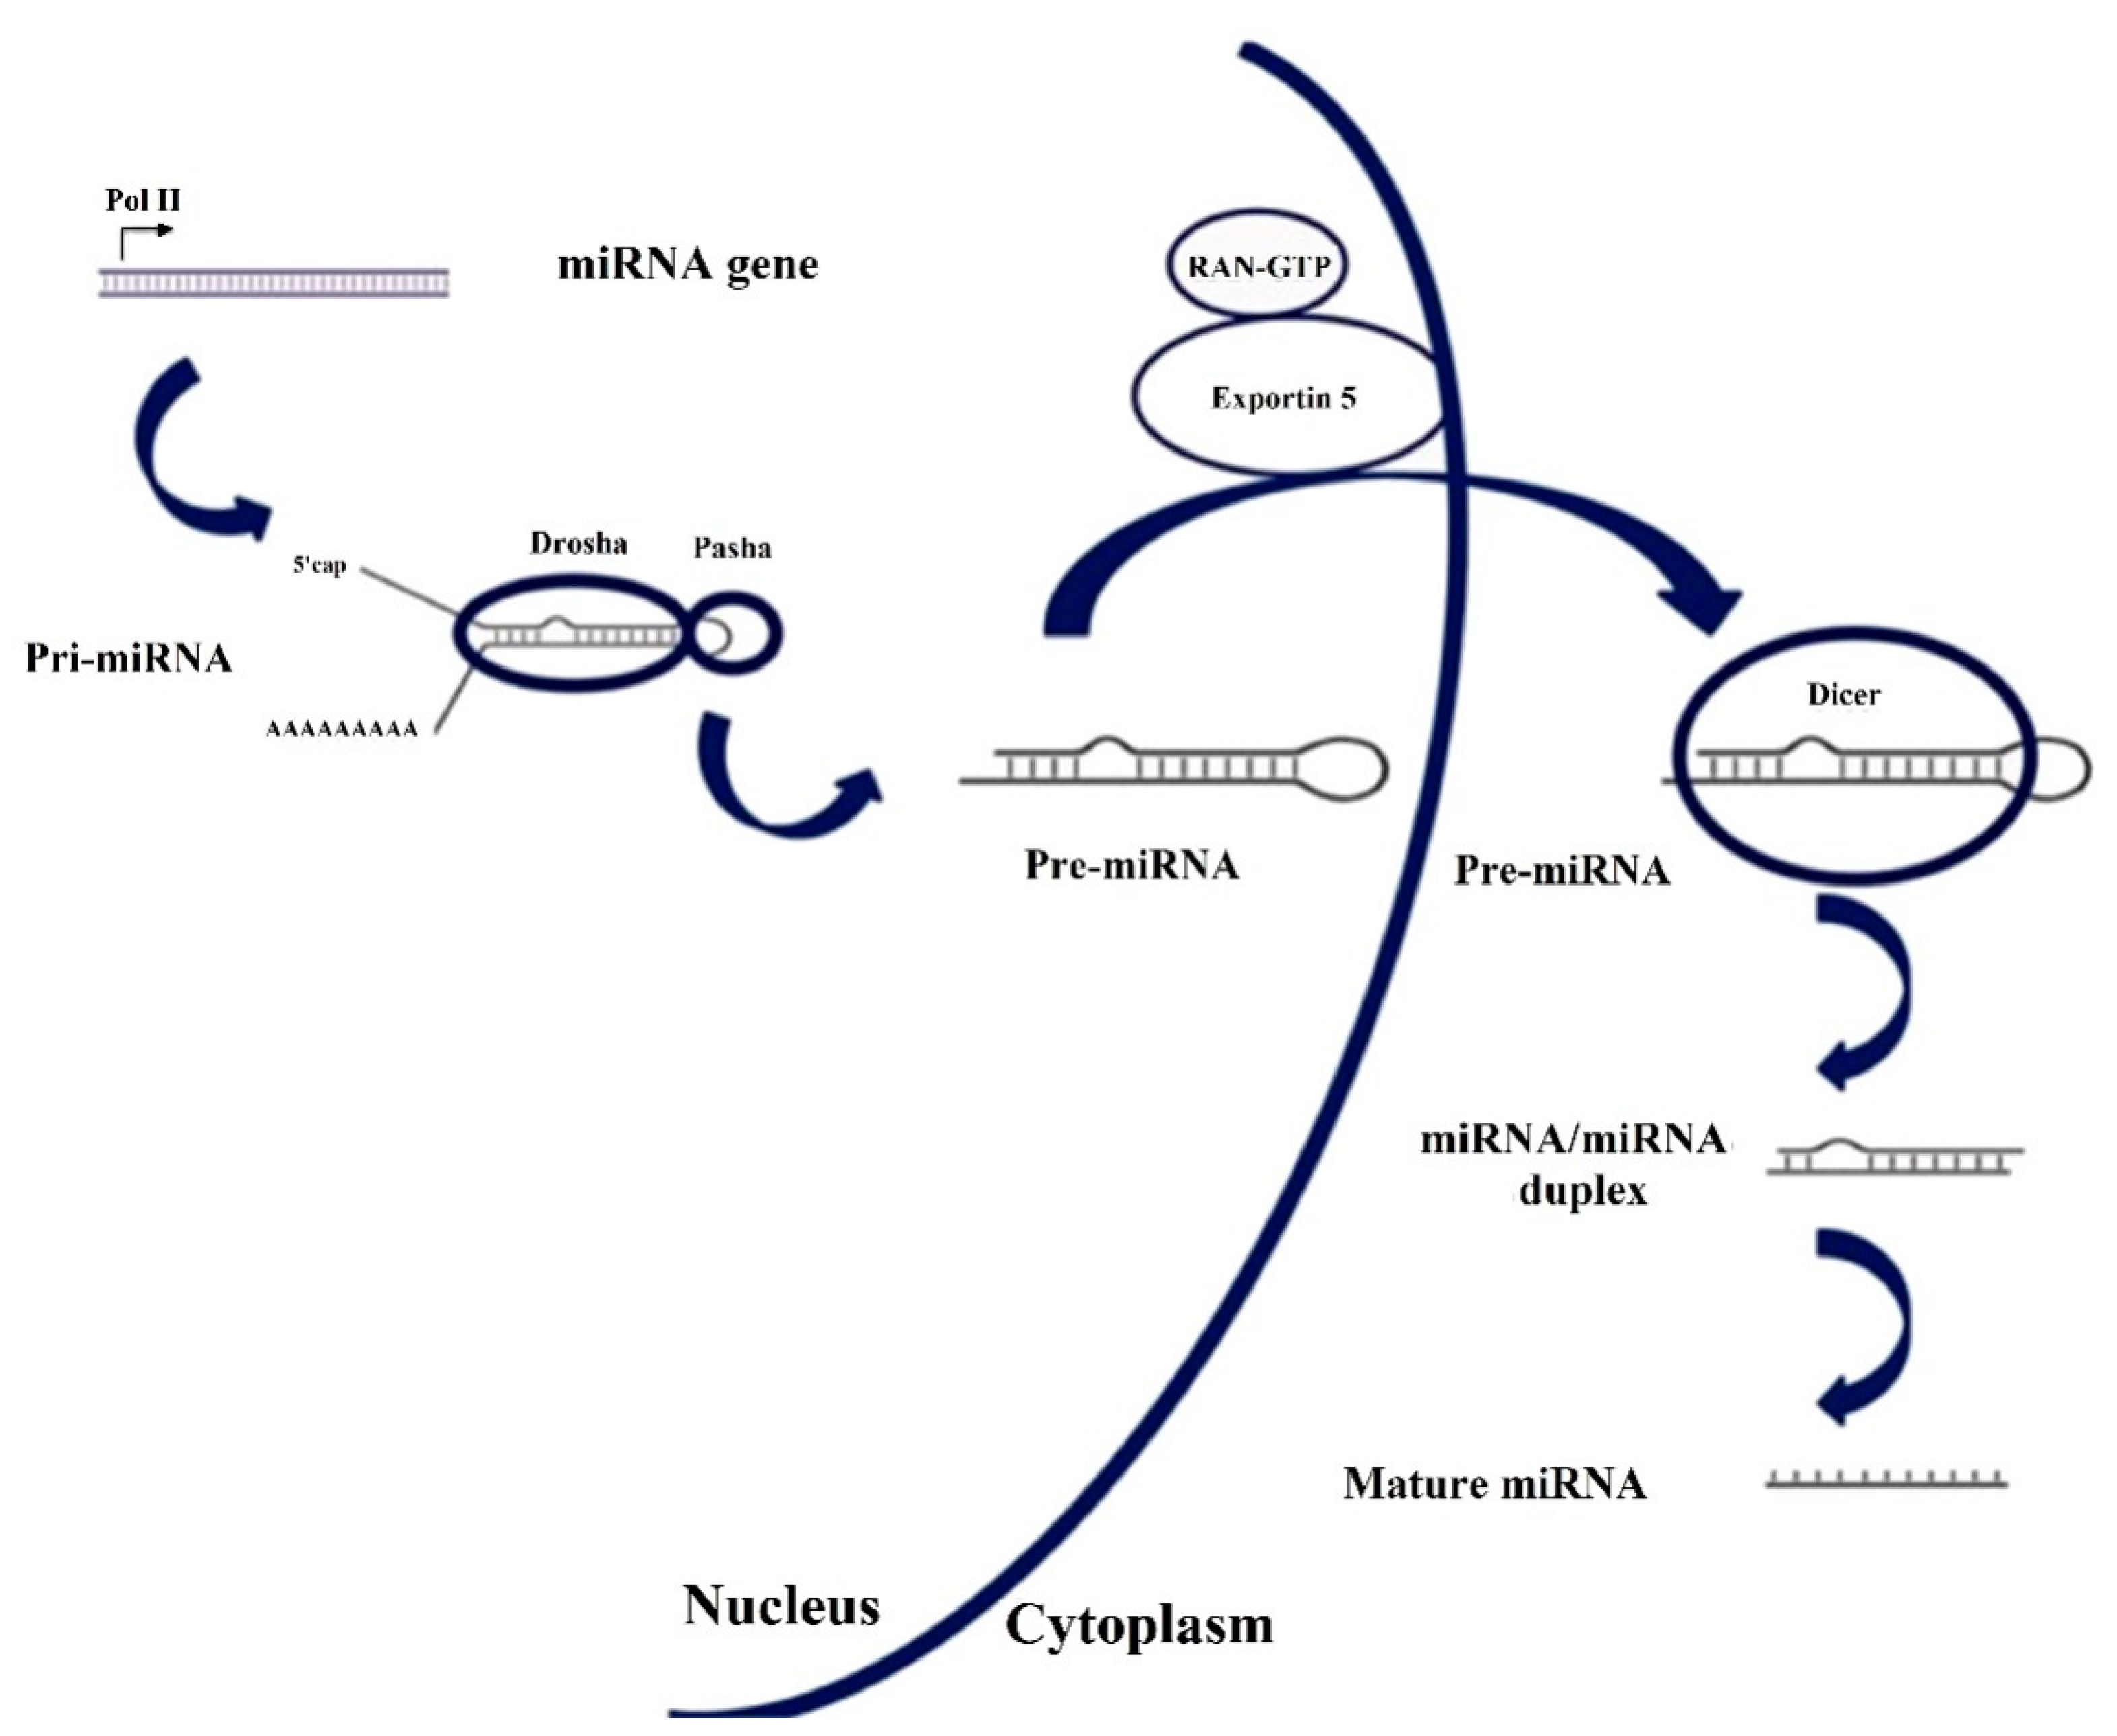
2. MicroRNAs or miRNAs
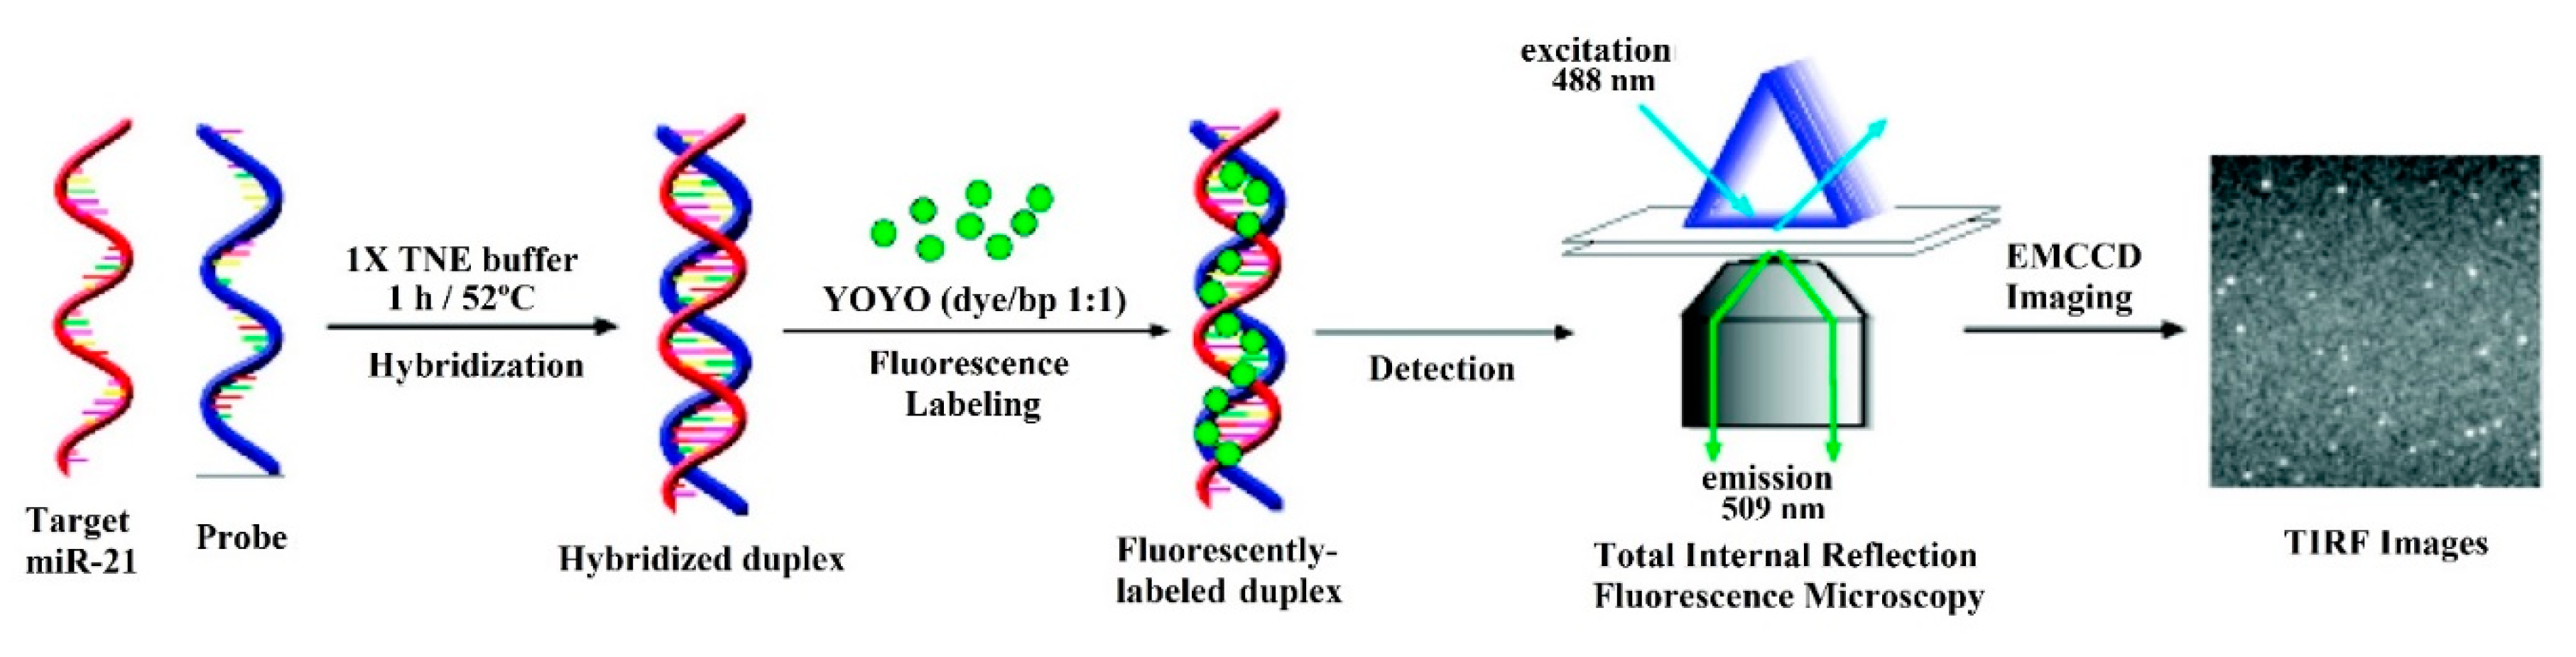
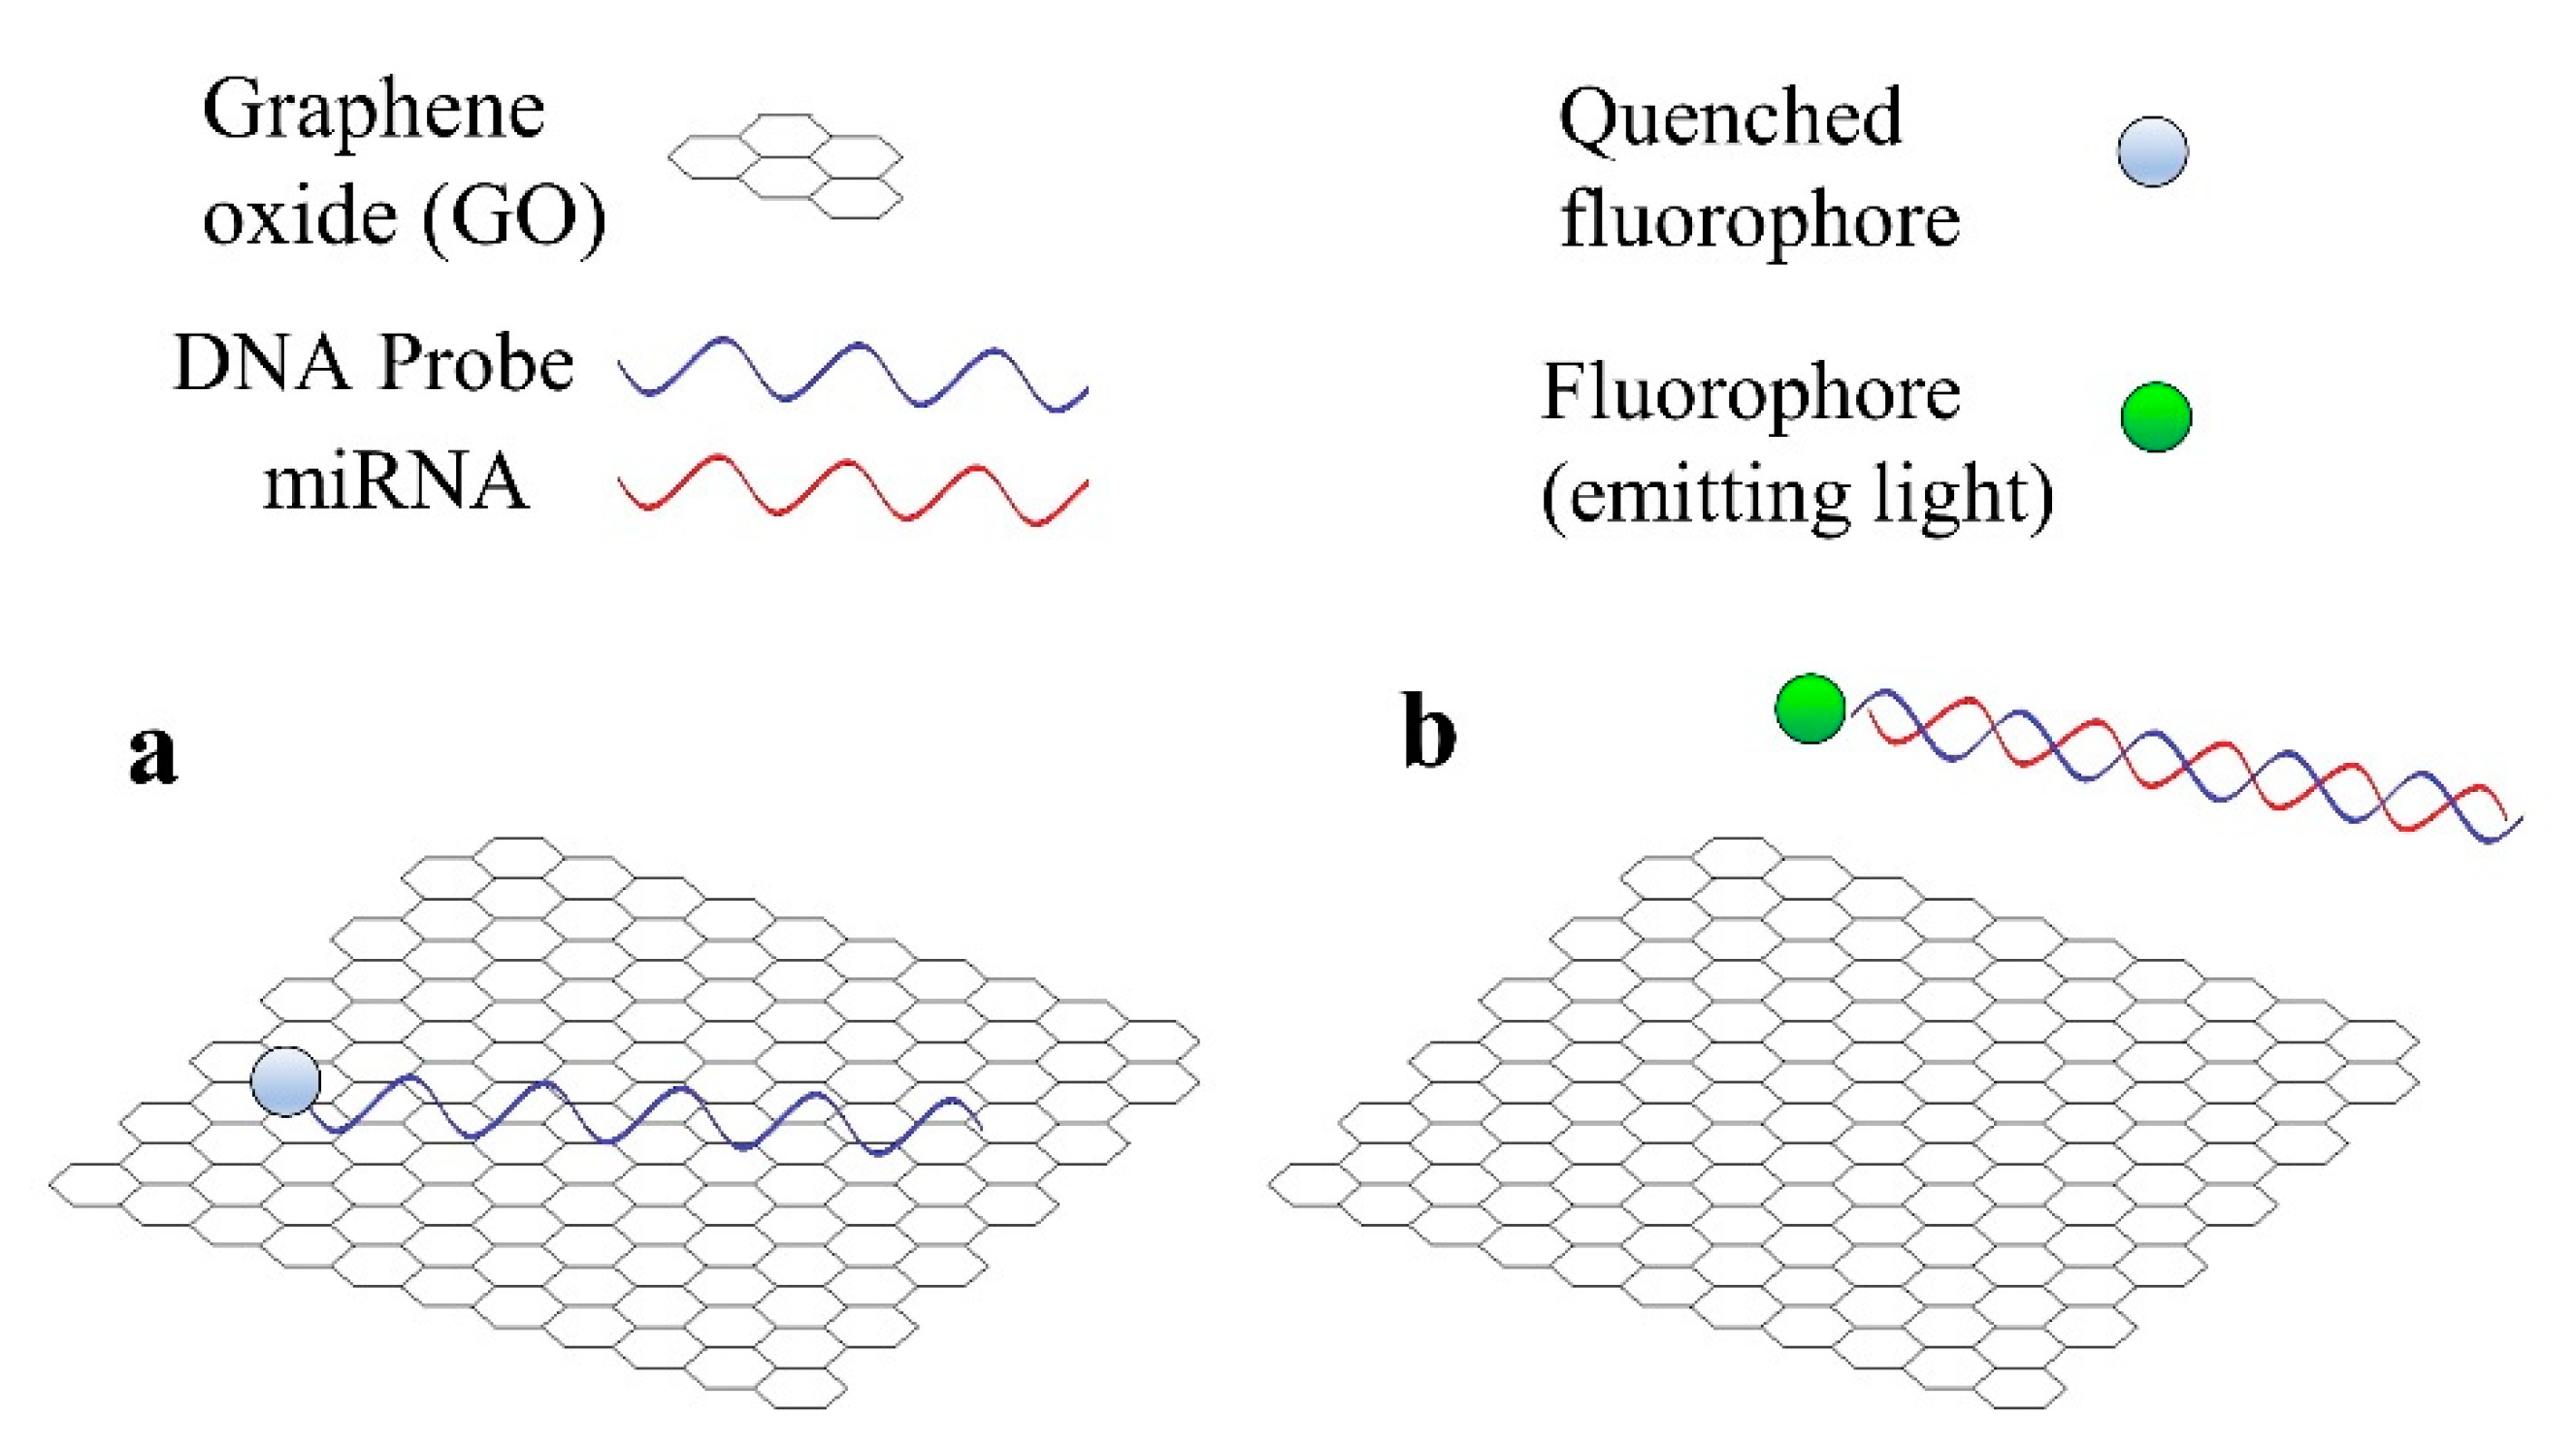
2.1. Fluorescence-Based Biosensors
2.1.1. MiR-21
2.1.2. Let-7a
2.1.3. Other miRNAs
2.2. Resonance-Based Biosensors
2.3. Other Optical Sensing Techniques: Interferometry and Surface-Enhanced Raman Spectroscopy (SERS)
3. CRP (C-Reactive Protein)
4. Other Biomarkers
4.1. Rheumatoid Factor (RF)
4.2. Anti-Citrullinated Protein Antibodies (ACPA)
4.3. Interleukin-6 (IL-6)
4.4. Histidine
5. Conclusions and Outlook
Author Contributions
Funding
Conflicts of Interest
References
- Duarte-Garcia, A.; reviewed by American Collegue of Rheumatology. Diseases & Conditions. Rheumatoid Arthritis. Available online: https://www.rheumatology.org/I-Am-A/Patient-Caregiver/Diseases-Conditions/Rheumatoid-Arthritis (accessed on 20 October 2020).
- Firestein, G.S. Evolving concepts of rheumatoid arthritis. Nature 2003, 423, 356–361. [Google Scholar] [CrossRef] [PubMed]
- Driver, C.B.; Stöppler, M.C. Rheumatoid Arthritis (RA): Early Signs, Symptoms, Causes, Treatment & Diet. Available online: https://www.emedicinehealth.com/rheumatoid_arthritis/article_em.htm#rheumatoid_arthritis_ra_definition_and_facts (accessed on 5 May 2020).
- Heidari, B. Rheumatoid arthritis: Early diagnosis and treatment outcomes. Casp. J. Intern. Med. 2011, 2, 161–170. [Google Scholar]
- England, B.R.; Tiong, B.K.; Bergman, M.J.; Curtis, J.R.; Kazi, S.; Mikuls, T.R.; O’Dell, J.R.; Ranganath, V.K.; Limanni, A.; Suter, L.G.; et al. 2019 Update of the American College of Rheumatology Recommended Rheumatoid Arthritis Disease Activity Measures. Arthritis Care Res. 2019, 71, 1540–1555. [Google Scholar] [CrossRef] [PubMed]
- Owens, G.M. Optimizing rheumatoid arthritis therapy: Using objective measures of disease activity to guide treatment. Am. Heal. Drug Benefits 2015, 8, 354–359. [Google Scholar]
- Strimbu, K.; Tavel, J.A. What are biomarkers? Curr. Opin. HIV AIDS 2010, 5, 463–466. [Google Scholar] [CrossRef] [PubMed]
- Centola, M.; Cavet, G.; Shen, Y.; Ramanujan, S.; Knowlton, N.; Swan, K.A.; Turner, M.; Sutton, C.; Smith, D.R.; Haney, D.J.; et al. Development of a Multi-Biomarker Disease Activity Test for Rheumatoid Arthritis. PLoS ONE 2013, 8, e60635. [Google Scholar] [CrossRef] [PubMed] [Green Version]
- Roodenrijs, N.M.T.; de Hair, M.J.H.; Wheater, G.; Elshahaly, M.; Tekstra, J.; Teng, Y.K.O.; Lafeber, F.P.J.G.; Hwang, C.C.; Liu, X.; Sasso, E.H.; et al. The multi-biomarker disease activity score tracks response to rituximab treatment in rheumatoid arthritis patients: A post hoc analysis of three cohort studies. Arthritis Res. Ther. 2018, 20, 256. [Google Scholar] [CrossRef] [Green Version]
- Bakker, M.F.; Cavet, G.; Jacobs, J.W.G.; Bijlsma, J.W.J.; Haney, D.J.; Shen, Y.; Hesterberg, L.K.; Smith, D.R.; Centola, M.; Van Roon, J.A.G.; et al. Performance of a multi-biomarker score measuring rheumatoid arthritis disease activity in the CAMERA tight control study. Ann. Rheum. Dis. 2012, 71, 1692–1697. [Google Scholar] [CrossRef]
- Fleischmann, R.; Connolly, S.E.; Maldonado, M.A.; Schiff, M. Brief Report: Estimating Disease Activity Using Multi-Biomarker Disease Activity Scores in Rheumatoid Arthritis Patients Treated With Abatacept or Adalimumab. Arthritis Rheumatol. 2016, 68, 2083–2089. [Google Scholar] [CrossRef]
- Santano, D.; Urrutia, A.; Zamarreno, C.R.; Del Villar, I. Advances in fiber optic DNA-based sensors: A Review. IEEE Sens. J. 2020. [Google Scholar] [CrossRef]
- Damborský, P.; Švitel, J.; Katrlík, J. Optical biosensors. Essays Biochem. 2016, 60, 91–100. [Google Scholar] [CrossRef] [Green Version]
- Clyne, B.; Olshaker, J.S. The C-reactive protein. J. Emerg. Med. 1999, 17, 1019–1025. [Google Scholar] [CrossRef]
- Dhingra, R.; Gona, P.; Nam, B.H.; D’Agostino, R.B.; Wilson, P.W.F.; Benjamin, E.J.; O’Donnell, C.J. C-Reactive Protein, Inflammatory Conditions, and Cardiovascular Disease Risk. Am. J. Med. 2007, 120, 1054–1062. [Google Scholar] [CrossRef] [Green Version]
- Mallya, R.K.; de Beer, F.C.; Berry, H.; Hamilton, E.D.; Mace, B.E.; Pepys, M.B. Correlation of clinical parameters of disease activity in rheumatoid arthritis with serum concentration of C-reactive protein and erythrocyte sedimentation rate. J. Rheumatol. 1982, 9, 224–228. [Google Scholar] [PubMed]
- Ghorbanmehr, N.; Gharbi, S.; Korsching, E.; Tavallaei, M.; Einollahi, B.; Mowla, S.J. miR-21-5p, miR-141-3p, and miR-205-5p levels in urine—Promising biomarkers for the identification of prostate and bladder cancer. Prostate 2019, 79, 88–95. [Google Scholar] [CrossRef]
- Quan, D.; Chen, K.; Zhang, J.; Guan, Y.; Yang, D.; Wu, H.; Wu, S.; Lv, L. Identification of lncRNA NEAT1/miR-21/RRM2 axis as a novel biomarker in breast cancer. J. Cell. Physiol. 2020, 235, 3372–3381. [Google Scholar] [CrossRef] [PubMed]
- Zhang, J.; Li, D.; Zhang, Y.; Ding, Z.; Zheng, Y.; Chen, S.; Wan, Y. Integrative analysis of mRNA and miRNA expression profiles reveals seven potential diagnostic biomarkers for non-small cell lung cancer. Oncol. Rep. 2020, 43, 99–112. [Google Scholar] [CrossRef] [PubMed]
- Dillhoff, M.; Liu, J.; Frankel, W.; Croce, C.; Bloomston, M. MicroRNA-21 is overexpressed in pancreatic cancer and a potential predictor of survival. J. Gastrointest. Surg. 2008, 12, 2171–2176. [Google Scholar] [CrossRef] [Green Version]
- Birlik, M.; Koçak, A.; Harmanci, D. Role of MicroRNAs in Rheumatoid Arthritis. In New Developments in the Pathogenesis of Rheumatoid Arthritis; InTech: London, UK, 2017. [Google Scholar]
- Moran-Moguel, M.C.; Rio, S.P.D.; Mayorquin-Galvan, E.E.; Zavala-Cerna, M.G. Rheumatoid arthritis and miRNAs: A critical review through a functional view. J. Immunol. Res. 2018, 2018, 2474529. [Google Scholar] [CrossRef]
- Dong, L.; Wang, X.; Tan, J.; Li, H.; Qian, W.; Chen, J.; Chen, Q.; Wang, J.; Xu, W.; Tao, C.; et al. Decreased expression of microRNA-21 correlates with the imbalance of Th17 and Treg cells in patients with rheumatoid arthritis. J. Cell. Mol. Med. 2014, 18, 2213–2224. [Google Scholar] [CrossRef]
- van der Geest, K.S.M.; Smigielska-Czepiel, K.; Park, J.-A.; Abdulahad, W.H.; Kim, H.-W.; Kroesen, B.-J.; van den Berg, A.; Boots, A.M.H.; Lee, E.-B.; Brouwer, E. SF Treg cells transcribing high levels of Bcl-2 and microRNA-21 demonstrate limited apoptosis in RA. Rheumatology 2015, 54, 950–958. [Google Scholar] [CrossRef] [PubMed] [Green Version]
- Ingegnoli, F.; Castelli, R.; Gualtierotti, R. Rheumatoid Factors: Clinical Applications. Dis. Mark. 2013, 35, 727–734. [Google Scholar] [CrossRef] [Green Version]
- Shrivastava, A.; Gupta, V. Methods for the determination of limit of detection and limit of quantitation of the analytical methods. Chronicles Young Sci. 2011, 2, 21. [Google Scholar] [CrossRef]
- MacFarlane, L.-A.R.; Murphy, P. MicroRNA: Biogenesis, Function and Role in Cancer. Curr. Genom. 2010, 11, 537–561. [Google Scholar] [CrossRef] [Green Version]
- Lee, R.C.; Feinbaum, R.L.; Ambros, V. The C. elegans heterochronic gene lin-4 encodes small RNAs with antisense complementarity to lin-14. Cell 1993, 75, 843–854. [Google Scholar] [CrossRef]
- Ardekani, A.M.; Naeini, M.M. The role of microRNAs in human diseases. Avicenna J. Med. Biotechnol. 2010, 2, 161–179. [Google Scholar] [PubMed]
- Guo, L.; Lu, Z. The Fate of miRNA* Strand through Evolutionary Analysis: Implication for Degradation As Merely Carrier Strand or Potential Regulatory Molecule? PLoS ONE 2010, 5, e11387. [Google Scholar] [CrossRef] [Green Version]
- Wang, J.; Chen, J.; Sen, S. MicroRNA as Biomarkers and Diagnostics. J. Cell. Physiol. 2016, 231, 25–30. [Google Scholar] [CrossRef]
- Huang, R.Y.; Wu, J.Q.; Liu, Z.H.; Sun, S.L. MicroRNAs in rheumatoid arthritis: What is the latest with regards to diagnostics? Expert Rev. Mol. Diagn. 2019, 19, 363–366. [Google Scholar] [CrossRef]
- Evangelatos, G.; Fragoulis, G.E.; Koulouri, V.; Lambrou, G.I. MicroRNAs in rheumatoid arthritis: From pathogenesis to clinical impact. Autoimmun. Rev. 2019, 18, 102391. [Google Scholar] [CrossRef]
- Churov, A.V.; Oleinik, E.K.; Knip, M. MicroRNAs in rheumatoid arthritis: Altered expression and diagnostic potential. Autoimmun. Rev. 2015, 14, 1029–1037. [Google Scholar] [CrossRef]
- Murata, K.; Furu, M.; Yoshitomi, H.; Ishikawa, M.; Shibuya, H.; Hashimoto, M.; Imura, Y.; Fujii, T.; Ito, H.; Mimori, T.; et al. Comprehensive microRNA Analysis Identifies miR-24 and miR-125a-5p as Plasma Biomarkers for Rheumatoid Arthritis. PLoS ONE 2013, 8, e069118. [Google Scholar] [CrossRef] [Green Version]
- Griffiths-Jones, S.; Kozomara, A.; Marshall, M.; Tate, J.; Daub, J.; Moxon, S.; Enright, A.; van Dongen, S.; Saini, H.K.; Grocock, R.; et al. miRBase. Available online: http://www.mirbase.org/ (accessed on 5 May 2020).
- Yildiz, U.H.; Alagappan, P.; Liedberg, B. Naked eye detection of lung cancer associated miRNA by paper based biosensing platform. Anal. Chem. 2013, 85, 820–824. [Google Scholar] [CrossRef]
- Huang, J.; Shangguan, J.; Guo, Q.; Ma, W.; Wang, H.; Jia, R.; Ye, Z.; He, X.; Wang, K. Colorimetric and fluorescent dual-mode detection of microRNA based on duplex-specific nuclease assisted gold nanoparticle amplification. Analyst 2019, 144, 4917–4924. [Google Scholar] [CrossRef] [PubMed]
- Liu, H.; Tian, T.; Ji, D.; Ren, N.; Ge, S.; Yan, M.; Yu, J. A Graphene-enhanced imaging of microRNA with enzyme-free signal amplification of catalyzed hairpin assembly in living cells. Biosens. Bioelectron. 2016, 85, 909–914. [Google Scholar] [CrossRef] [PubMed]
- Li, S.; He, K.; Liao, R.; Chen, C.; Chen, X.; Cai, C. An interference-free and label-free sandwich-type magnetic silicon microsphere -rGO-based probe for fluorescence detection of microRNA. Talanta 2017, 174, 679–683. [Google Scholar] [CrossRef]
- Jun Zhen, S.; Xiao, X.; Hong Li, C.; Zhi Huang, C. An Enzyme-Free DNA Circuit-Assisted Graphene Oxide Enhanced Fluorescence Anisotropy Assay for MicroRNA Detection with Improved Sensitivity and Selectivity. Anal. Chem. 2017, 89, 8766–8771. [Google Scholar] [CrossRef]
- Chan, H.M.; Chan, L.S.; Wong, R.N.S.; Li, H.W. Direct quantification of single-molecules of MicroRNA by total internal reflection fluorescence microscopy. Anal. Chem. 2010, 82, 6911–6918. [Google Scholar] [CrossRef]
- Zhang, Z.; Wang, Y.; Zhang, N.; Zhang, S. Self-assembly of nucleic acid molecular aggregates catalyzed by a triple-helix probe for miRNA detection and single cell imaging. Chem. Sci. 2016, 7, 4184–4189. [Google Scholar] [CrossRef] [Green Version]
- Duan, R.; Zhang, Z.; Zheng, F.; Wang, L.; Guo, J.; Zhang, T.; Dai, X.; Zhang, S.; Yang, D.; Kuang, R.; et al. Combining Protein and miRNA Quantification for Bladder Cancer Analysis. ACS Appl. Mater. Interfaces 2017, 9, 23420–23427. [Google Scholar] [CrossRef]
- Zhu, D.; Zhang, L.; Ma, W.; Lu, S.; Xing, X. Detection of microRNA in clinical tumor samples by isothermal enzyme-free amplification and label-free graphene oxide-based SYBR Green I fluorescence platform. Biosens. Bioelectron. 2015, 65, 152–158. [Google Scholar] [CrossRef]
- George, S.; Chaudhery, V.; Lu, M.; Takagi, M.; Amro, N.; Pokhriyal, A.; Tan, Y.; Ferreira, P.; Cunningham, B.T. Sensitive detection of protein and miRNA cancer biomarkers using silicon-based photonic crystals and a resonance coupling laser scanning platform. Lab Chip 2013, 13, 4053–4064. [Google Scholar] [CrossRef] [Green Version]
- Li, J.; Schachermeyer, S.; Wang, Y.; Yin, Y.; Zhong, W. Detection of MicroRNA by fluorescence amplification based on cation-exchange in nanocrystals. Anal. Chem. 2009, 81, 9723–9729. [Google Scholar] [CrossRef]
- Li, W.; Hou, T.; Wu, M.; Li, F. Label-free fluorescence strategy for sensitive microRNA detection based on isothermal exponential amplification and graphene oxide. Talanta 2016, 148, 116–121. [Google Scholar] [CrossRef]
- Deng, H.; Liu, Q.; Wang, X.; Huang, R.; Liu, H.; Lin, Q.; Zhou, X.; Xing, D. Quantum dots-labeled strip biosensor for rapid and sensitive detection of microRNA based on target-recycled nonenzymatic amplification strategy. Biosens. Bioelectron. 2017, 87, 931–940. [Google Scholar] [CrossRef]
- Wang, L.; Cheng, Y.; Wang, H.; Li, Z. A homogeneous fluorescence sensing platform with water-soluble carbon nanoparticles for detection of microRNA and nuclease activity. Analyst 2012, 137, 3667–3672. [Google Scholar] [CrossRef]
- Yang, L.; Liu, C.; Ren, W.; Li, Z. Graphene surface-anchored fluorescence sensor for sensitive detection of MicroRNA coupled with enzyme-free signal amplification of hybridization chain reaction. ACS Appl. Mater. Interfaces 2012, 4, 6450–6453. [Google Scholar] [CrossRef]
- Liu, H.; Li, L.; Wang, Q.; Duan, L.; Tang, B. Graphene fluorescence switch-based cooperative amplification: A sensitive and accurate method to detection MicroRNA. Anal. Chem. 2014, 86, 5487–5493. [Google Scholar] [CrossRef]
- Fan, X.; Qi, Y.; Shi, Z.; Lv, Y.; Guo, Y. A graphene-based biosensor for detecting microRNA with augmented sensitivity through helicase-assisted signal amplification of hybridization chain reaction. Sens. Actuators B Chem. 2018, 255, 1582–1586. [Google Scholar] [CrossRef]
- Zhou, H.; Peng, J.; Qiu, X.; Gao, Y.; Lu, L.; Wang, W. β-Ni(OH)2 nanosheets: An effective sensing platform for constructing nucleic acid-based optical sensors. J. Mater. Chem. B 2017, 5, 7426–7432. [Google Scholar] [CrossRef] [PubMed]
- Huang, R.; Liao, Y.; Zhou, X.; Fu, Y.; Xing, D. Multiplexed detection of microRNA biomarkers from tumor cells and tissues with a homogeneous nano-photon switch. Sens. Actuators B Chem. 2017, 247, 505–513. [Google Scholar] [CrossRef]
- Hong, C.; Baek, A.; Hah, S.S.; Jung, W.; Kim, D.E. Fluorometric Detection of MicroRNA Using Isothermal Gene Amplification and Graphene Oxide. Anal. Chem. 2016, 88, 2999–3003. [Google Scholar] [CrossRef] [Green Version]
- Neely, L.A.; Patel, S.; Garver, J.; Gallo, M.; Hackett, M.; McLaughlin, S.; Nadel, M.; Harris, J.; Gullans, S.; Rooke, J. A single-molecule method for the quantitation of microRNA gene expression. Nat. Methods 2006, 3, 41–46. [Google Scholar] [CrossRef]
- Zhu, X.; Shen, Y.; Cao, J.; Yin, L.; Ban, F.; Shu, Y.; Li, G. Detection of microRNA SNPs with ultrahigh specificity by using reduced graphene oxide-assisted rolling circle amplification. Chem. Commun. 2015, 51, 10002–10005. [Google Scholar] [CrossRef]
- Tu, Y.; Li, W.; Wu, P.; Zhang, H.; Cai, C. Fluorescence quenching of graphene oxide integrating with the site-specific cleavage of the endonuclease for sensitive and selective microRNA detection. Anal. Chem. 2013, 85, 2536–2542. [Google Scholar] [CrossRef]
- Hakimian, F.; Ghourchian, H.; Hashemi, A.S.; Arastoo, M.R.; Behnam Rad, M. Ultrasensitive optical biosensor for detection of miRNA-155 using positively charged Au nanoparticles. Sci. Rep. 2018, 8, 1–9. [Google Scholar] [CrossRef] [Green Version]
- Qiu, X.; Liu, X.; Zhang, W.; Zhang, H.; Jiang, T.; Fan, D.; Luo, Y. Dynamic Monitoring of MicroRNA-DNA Hybridization Using DNAase-Triggered Signal Amplification. Anal. Chem. 2015, 87, 6303–6310. [Google Scholar] [CrossRef] [PubMed]
- Hu, F.; Xu, J.; Chen, Y. Surface Plasmon Resonance Imaging Detection of Sub-femtomolar MicroRNA. Anal. Chem. 2017, 89, 10071–10077. [Google Scholar] [CrossRef]
- Xue, T.; Liang, W.; Li, Y.; Sun, Y.; Xiang, Y.; Zhang, Y.; Dai, Z.; Duo, Y.; Wu, L.; Qi, K.; et al. Ultrasensitive detection of miRNA with an antimonene-based surface plasmon resonance sensor. Nat. Commun. 2019, 10. [Google Scholar] [CrossRef]
- Joshi, G.K.; Deitz-Mcelyea, S.; Johnson, M.; Mali, S.; Korc, M.; Sardar, R. Highly specific plasmonic biosensors for ultrasensitive MicroRNA detection in plasma from pancreatic cancer patients. Nano Lett. 2014, 14, 6955–6963. [Google Scholar] [CrossRef] [Green Version]
- Qavi, A.J.; Bailey, R.C. Multiplexed detection and label-free quantitation of microRNAs using arrays of silicon photonic microring resonators. Angew. Chem. Int. Ed. 2010, 49, 4608–4611. [Google Scholar] [CrossRef] [PubMed] [Green Version]
- Graybill, R.M.; Para, C.S.; Bailey, R.C. PCR-Free, Multiplexed Expression Profiling of microRNAs Using Silicon Photonic Microring Resonators. Anal. Chem. 2016, 88, 10347–10351. [Google Scholar] [CrossRef] [PubMed] [Green Version]
- Qavi, A.J.; Kindt, J.T.; Gleeson, M.A.; Bailey, R.C. Anti-DNA:RNA Antibodies and Silicon Photonic Microring Resonators: Increased Sensitivity for Multiplexed microRNA Detection. Anal. Chem. 2011, 83, 5949–5956. [Google Scholar] [CrossRef] [Green Version]
- Liu, Q.; Shin, Y.; Kee, J.S.; Kim, K.W.; Mohamed Rafei, S.R.; Perera, A.P.; Tu, X.; Lo, G.Q.; Ricci, E.; Colombel, M.; et al. Mach-Zehnder interferometer (MZI) point-of-care system for rapid multiplexed detection of microRNAs in human urine specimens. Biosens. Bioelectron. 2015, 71, 365–372. [Google Scholar] [CrossRef]
- Liang, L.; Jin, L.; Ran, Y.; Sun, L.P.; Guan, B.O. Interferometric detection of microRNAs using a capillary optofluidic sensor. Sens. Actuators B Chem. 2017, 242, 999–1006. [Google Scholar] [CrossRef]
- Driskell, J.; Primera-Pedrozo, O.M.; Dluhy, R.A.; Zhao, Y.; Tripp, R.A. Quantitative surface-enhanced Raman spectroscopy based analysis of microRNA mixtures. Appl. Spectrosc. 2009, 63, 1107–1114. [Google Scholar] [CrossRef] [PubMed]
- Su, J.; Wang, D.; Nörbel, L.; Shen, J.; Zhao, Z.; Dou, Y.; Peng, T.; Shi, J.; Mathur, S.; Fan, C.; et al. Multicolor Gold-Silver Nano-Mushrooms as Ready-to-Use SERS Probes for Ultrasensitive and Multiplex DNA/miRNA Detection. Anal. Chem. 2017, 89, 2531–2538. [Google Scholar] [CrossRef]
- Yang, X.; Wang, S.; Wang, Y.; He, Y.; Chai, Y.; Yuan, R. Stimuli-Responsive DNA Microcapsules for SERS Sensing of Trace MicroRNA. ACS Appl. Mater. Interfaces 2018, 10, 12491–12496. [Google Scholar] [CrossRef]
- Lai, N.S.; Yu, H.C.; Yu, C.L.; Koo, M.; Huang, H.B.; Lu, M.C. Anti-citrullinated protein antibodies suppress let-7a expression in monocytes from patients with rheumatoid arthritis and facilitate the inflammatory responses in rheumatoid arthritis. Immunobiology 2015, 220, 1351–1358. [Google Scholar] [CrossRef]
- Niimoto, T.; Nakasa, T.; Ishikawa, M.; Okuhara, A.; Izumi, B.; Deie, M.; Suzuki, O.; Adachi, N.; Ochi, M. MicroRNA-146a expresses in interleukin-17 producing T cells in rheumatoid arthritis patients. BMC Musculoskelet. Disord. 2010, 11, 209. [Google Scholar] [CrossRef] [Green Version]
- Kim, S.J.; Chen, Z.; Essani, A.B.; Elshabrawy, H.A.; Volin, M.V.; Volkov, S.; Swedler, W.; Arami, S.; Sweiss, N.; Shahrara, S. Identification of a Novel Toll-like Receptor 7 Endogenous Ligand in Rheumatoid Arthritis Synovial Fluid That Can Provoke Arthritic Joint Inflammation. Arthritis Rheumatol. 2016, 68, 1099–1110. [Google Scholar] [CrossRef]
- Li, G.-Q.; Fang, Y.-X.; Liu, Y.; Meng, F.-R.; Wu, X.; Zhang, C.-W.; Zhang, Y.; Liu, Y.-Q.; Liu, D. Long Noncoding RNA XIST Binding to Let-7c-5p Contributes to Rheumatoid Arthritis Through Its Effects on Proliferation and Differentiation of Osteoblasts via Regulation of STAT3. SSRN Electron. J. 2020. [Google Scholar] [CrossRef]
- Li, Z.; Li, Y.; Li, Q.; Zhang, Z.; Jiang, L.; Li, X. Role of miR-9-5p in preventing peripheral neuropathy in patients with rheumatoid arthritis by targeting REST/miR-132 pathway. In Vitro Cell. Dev. Biol.-Anim. 2019, 55, 52–61. [Google Scholar] [CrossRef]
- Wang, W.; Zhang, Y.; Zhu, B.; Duan, T.; Xu, Q.; Wang, R.; Lu, L.; Jiao, Z. Plasma microRNA expression profiles in Chinese patients with rheumatoid arthritis. Oncotarget 2015, 6, 42557–42568. [Google Scholar] [CrossRef]
- Filková, M.; Aradi, B.; Šenolt, L.; Ospelt, C.; Vettori, S.; Mann, H.; Filer, A.; Raza, K.; Buckley, C.D.; Snow, M.; et al. Association of circulating miR-223 and miR-16 with disease activity in patients with early rheumatoid arthritis. Ann. Rheum. Dis. 2014, 73, 1898–1904. [Google Scholar] [CrossRef] [Green Version]
- Liu, J.; Fei, D.; Xing, J.; Du, J. MicroRNA-29a inhibits proliferation and induces apoptosis in rheumatoid arthritis fibroblast-like synoviocytes by repressing STAT3. Biomed. Pharmacother. 2017, 96, 173–181. [Google Scholar] [CrossRef] [PubMed]
- Khalifa, O.; Pers, Y.-M.; Ferreira, R.; Sénéchal, A.; Jorgensen, C.; Apparailly, F.; Duroux-Richard, I. X-Linked miRNAs Associated with Gender Differences in Rheumatoid Arthritis. Int. J. Mol. Sci. 2016, 17, 1852. [Google Scholar] [CrossRef] [Green Version]
- Maeda, Y.; Farina, N.H.; Matzelle, M.M.; Fanning, P.J.; Lian, J.B.; Gravallese, E.M. Synovium-Derived MicroRNAs Regulate Bone Pathways in Rheumatoid Arthritis. J. Bone Miner. Res. 2017, 32, 461–472. [Google Scholar] [CrossRef] [Green Version]
- Wang, J.; Wang, Y.; Zhang, H.; Chang, J.; Lu, M.; Gao, W.; Liu, W.; Li, Y.; Yin, L.; Wang, X.; et al. Identification of a novel microRNA-141-3p/Forkhead box C1/β-catenin axis associated with rheumatoid arthritis synovial fibroblast function in vivo and in vitro. Theranostics 2020, 10, 5412–5434. [Google Scholar] [CrossRef] [PubMed]
- Mookherjee, N.; El-Gabalawy, H.S. High degree of correlation between whole blood and PBMC expression levels of miR-155 and miR-146a in healthy controls and rheumatoid arthritis patients. J. Immunol. Methods 2013, 400–401, 106–110. [Google Scholar] [CrossRef]
- Abo ElAtta, A.S.; Ali, Y.B.M.; Bassyouni, I.H.; Talaat, R.M. Upregulation of miR-221/222 expression in rheumatoid arthritis (RA) patients: Correlation with disease activity. Clin. Exp. Med. 2019, 19, 47–53. [Google Scholar] [CrossRef]
- Ebrahimiyan, H.; Rezaei, N.; Vojdanian, M.; Aslani, S.; Jamshidi, A.; Mahmoudi, M. microRNA involvement in the regulation of survivin in peripheral blood mononuclear cells from rheumatoid arthritis patients. Int. J. Rheum. Dis. 2019, 22, 1107–1114. [Google Scholar] [CrossRef]
- Griffiths-Jones, S.; Kozomara, A.; Marshall, M.; Tate, J.; Daub, J.; Moxon, S.; Enright, A.; van Dongen, S.; Saini, H.K.; Grocock, R.; et al. miRBase: What Do the miRNA Names/Identifiers Mean? Available online: http://www.mirbase.org/help/nomenclature.shtml (accessed on 5 May 2020).
- Yang, P.; Zhang, M.; Wang, X.; Xu, A.L.; Shen, M.; Jiang, B.; Zhou, X.; Zhou, L. MicroRNA let-7g-5p alleviates murine collagen-induced arthritis by inhibiting Th17 cell differentiation. Biochem. Pharmacol. 2020, 174, 113822. [Google Scholar] [CrossRef] [PubMed]
- Yang, Z.; Wang, J.; Pan, Z.; Zhang, Y. miR-143-3p regulates cell proliferation and apoptosis by targeting IGF1R and IGFBP5 and regulating the Ras/p38 MAPK signaling pathway in rheumatoid arthritis. Exp. Ther. Med. 2018, 15, 3781–3790. [Google Scholar] [CrossRef]
- Hong, B.K.; You, S.; Yoo, S.A.; Park, D.; Hwang, D.; Cho, C.S.; Kim, W.U. MicroRNA-143 and-145 modulate the phenotype of synovial fibroblasts in rheumatoid arthritis. Exp. Mol. Med. 2017, 49, e363. [Google Scholar] [CrossRef] [Green Version]
- Abdul-Maksoud, R.S.; Sediq, A.M.; Kattaia, A.A.A.; Elsayed, W.S.H.; Ezzeldin, N.; Abdel Galil, S.M.; Ibrahem, R.A. Serum miR-210 and miR-155 expression levels as novel biomarkers for rheumatoid arthritis diagnosis. Br. J. Biomed. Sci. 2017, 74, 209–213. [Google Scholar] [CrossRef]
- Huang, Q.; Chen, S.S.; Li, J.; Tao, S.S.; Wang, M.; Leng, R.X.; Pan, H.F.; Ye, D.Q. miR-210 expression in PBMCs from patients with systemic lupus erythematosus and rheumatoid arthritis. Ir. J. Med. Sci. 2018, 187, 243–249. [Google Scholar] [CrossRef]
- Ligler, F.S. Fluorescence-Based Optical Biosensors. In Biophotonics; Springer: Berlin/Heidelberg, Germany, 2008; pp. 199–215. [Google Scholar]
- Strianese, M.; Staiano, M.; Ruggiero, G.; Labella, T.; Pellecchia, C.; D’Auria, S. Fluorescence-based biosensors. Methods Mol. Biol. 2012, 875, 193–216. [Google Scholar] [CrossRef] [PubMed]
- Zamarreño, C.R.; Socorro, A.B.; Sanchez, P.; Matias, I.R.; Arregui, F.J. Optical Fibers: Biosensors. In Encyclopedia of Optical and Photonic Engineering, 2nd ed.; CRC Press: Boca Raton, FL, USA, 2019; pp. 1–19. [Google Scholar]
- National Center for Biotechnology (NCBI) PubChem. Available online: https://pubchem.ncbi.nlm.nih.gov/ (accessed on 8 May 2020).
- Le Ru, E.C.; Etchegoin, P.G. Principles of Surface-Enhanced Raman Spectroscopy; Elsevier: Amsterdam, The Netherlands, 2009; ISBN 9780444527790. [Google Scholar]
- Hernaez, M.; Zamarreño, C.R.; Melendi-Espina, S.; Bird, L.R.; Mayes, A.G.; Arregui, F.J. Optical fibre sensors using graphene-based materials: A review. Sensors 2017, 17, 155. [Google Scholar] [CrossRef] [Green Version]
- Elosua, C.; Arregui, F.J.; Del Villar, I.; Ruiz-Zamarreño, C.; Corres, J.M.; Bariain, C.; Goicoechea, J.; Hernaez, M.; Rivero, P.J.; Socorro, A.B.; et al. Micro and nanostructured materials for the development of optical fibre sensors. Sensors 2017, 17, 2312. [Google Scholar] [CrossRef] [PubMed] [Green Version]
- Ozcariz, A.; Ruiz-Zamarreño, C.; Arregui, F.J. A Comprehensive Review: Materials for the Fabrication of Optical Fiber Refractometers Based on Lossy Mode Resonance. Sensors 2020, 20, 1972. [Google Scholar] [CrossRef] [Green Version]
- Zhang, C.; Miao, P.; Sun, M.; Yan, M.; Liu, H. Progress in miRNA Detection Using Graphene Material–Based Biosensors. Small 2019, 15, 1901867. [Google Scholar] [CrossRef] [PubMed]
- Korn, T.; Bettelli, E.; Oukka, M.; Kuchroo, V.K. IL-17 and Th17 Cells. Annu. Rev. Immunol. 2009, 27, 485–517. [Google Scholar] [CrossRef]
- Kondělková, K.; Vokurková, D.; Krejsek, J.; Borská, L.; Fiala, Z.; Ctirad, A. Regulatory T cells (TREG) and their roles in immune system with respect to immunopathological disorders. Acta Med. (Hradec Kralove) 2010, 53, 73–77. [Google Scholar] [CrossRef] [Green Version]
- Nuovo, G.J. (Ed.) The Basics of Molecular Pathology. In In Situ Molecular Pathology and Co-Expression Analyses; Elsevier: Amsterdam, The Netherlands, 2013; pp. 7–42. [Google Scholar]
- Mattiske, S.; Suetani, R.J.; Neilsen, P.M.; Callen, D.F. The oncogenic role of miR-155 in breast cancer. Cancer Epidemiol. Biomark. Prev. 2012, 21, 1236–1243. [Google Scholar] [CrossRef] [PubMed] [Green Version]
- Alsaleh, G.; François, A.; Philippe, L.; Gong, Y.-Z.; Bahram, S.; Cetin, S.; Pfeffer, S.; Gottenberg, J.-E.; Wachsmann, D.; Georgel, P.; et al. MiR-30a-3p Negatively Regulates BAFF Synthesis in Systemic Sclerosis and Rheumatoid Arthritis Fibroblasts. PLoS ONE 2014, 9, e111266. [Google Scholar] [CrossRef]
- Nakamachi, Y.; Kawano, S.; Takenokuchi, M.; Nishimura, K.; Sakai, Y.; Chin, T.; Saura, R.; Kurosaka, M.; Kumagai, S. MicroRNA-124a is a key regulator of proliferation and monocyte chemoattractant protein 1 secretion in fibroblast-like synoviocytes from patients with rheumatoid arthritis. Arthritis Rheum. 2009, 60, 1294–1304. [Google Scholar] [CrossRef]
- Pauley, K.M.; Satoh, M.; Chan, A.L.; Bubb, M.R.; Reeves, W.H.; Chan, E.K. Upregulated miR-146a expression in peripheral blood mononuclear cells from rheumatoid arthritis patients. Arthritis Res. Ther. 2008, 10, R101. [Google Scholar] [CrossRef] [PubMed] [Green Version]
- Murata, K.; Yoshitomi, H.; Tanida, S.; Ishikawa, M.; Nishitani, K.; Ito, H.; Nakamura, T. Plasma and synovial fluid microRNAs as potential biomarkers of rheumatoid arthritis and osteoarthritis. Arthritis Res. Ther. 2010, 12, R86. [Google Scholar] [CrossRef] [Green Version]
- Yang, S.; Yang, Y. Downregulation of microRNA‑221 decreases migration and invasion in fibroblast‑like synoviocytes in rheumatoid arthritis. Mol. Med. Rep. 2015, 12, 2395–2401. [Google Scholar] [CrossRef]
- Urrutia, A.; Del Villar, I.; Zubiate, P.; Zamarreño, C.R. A Comprehensive Review of Optical Fiber Refractometers: Toward a Standard Comparative Criterion. Laser Photonics Rev. 2019, 13, 1900094. [Google Scholar] [CrossRef]
- Socorro-Leránoz, A.B.; Santano, D.; Del Villar, I.; Matias, I.R. Trends in the design of wavelength-based optical fibre biosensors (2008–2018). Biosens. Bioelectron. X 2019, 1, 100015. [Google Scholar] [CrossRef]
- Del Villar, I.; Arregui, F.J.; Zamarreño, C.R.; Corres, J.M.; Bariain, C.; Goicoechea, J.; Elosua, C.; Hernaez, M.; Rivero, P.J.; Socorro, A.B.; et al. Optical sensors based on lossy-mode resonances. Sens. Actuators B Chem. 2017, 240, 174–185. [Google Scholar] [CrossRef]
- Spoto, G.; Minunni, M. Surface plasmon resonance imaging: What next? J. Phys. Chem. Lett. 2012, 3, 2682–2691. [Google Scholar] [CrossRef]
- Singh, P. SPR Biosensors: Historical Perspectives and Current Challenges. Sens. Actuators B Chem. 2016, 229, 110–130. [Google Scholar] [CrossRef]
- Zhou, J.; Qi, Q.; Wang, C.; Qian, Y.; Liu, G.; Wang, Y.; Fu, L. Surface plasmon resonance (SPR) biosensors for food allergen detection in food matrices. Biosens. Bioelectron. 2019, 142, 111449. [Google Scholar] [CrossRef] [PubMed]
- Špačková, B.; Wrobel, P.; Bocková, M.; Homola, J. Optical Biosensors Based on Plasmonic Nanostructures: A Review. Proc. IEEE 2016, 104, 2380–2408. [Google Scholar] [CrossRef]
- Xiao, G.; Tang, H.; Wei, W.; Li, J.; Ji, L.; Ge, J. Aberrant Expression of MicroRNA-15a and MicroRNA-16 Synergistically Associates with Tumor Progression and Prognosis in Patients with Colorectal Cancer. Gastroenterol. Res. Pract. 2014, 2014, 364549. [Google Scholar] [CrossRef] [Green Version]
- Hammond, J.; Bhalla, N.; Rafiee, S.; Estrela, P. Localized Surface Plasmon Resonance as a Biosensing Platform for Developing Countries. Biosensors 2014, 4, 172–188. [Google Scholar] [CrossRef] [Green Version]
- Liu, J.; Jalali, M.; Mahshid, S.; Wachsmann-Hogiu, S. Are plasmonic optical biosensors ready for use in point-of-need applications? Analyst 2020, 145, 364–384. [Google Scholar] [CrossRef] [Green Version]
- Zhao, W.; Brook, M.A.; Li, Y. Design of Gold Nanoparticle-Based Colorimetric Biosensing Assays. ChemBioChem 2008, 9, 2363–2371. [Google Scholar] [CrossRef]
- Arregui, F.J.; Del Villar, I.; Zamarreño, C.R.; Zubiate, P.; Matias, I.R. Giant sensitivity of optical fiber sensors by means of lossy mode resonance. Sens. Actuators B Chem. 2016, 232, 660–665. [Google Scholar] [CrossRef] [Green Version]
- Ozcariz, A.; Zamarreño, C.R.; Zubiate, P.; Arregui, F.J. Is there a frontier in sensitivity with Lossy mode resonance (LMR) based refractometers? Sci. Rep. 2017, 7, 1–7. [Google Scholar] [CrossRef]
- Zubiate, P.; Ciaurriz, P.; Tellechea, E.; Santano, D.; Del Villar, I.; Urrutia, A.; Arregui, F.J.; Matias, I.R.; Zamarreno, C.R. Short single strand DNA detection by means of Lossy Mode Resonance based fiber-optic sensor. In Proceedings of the 2019 IEEE Sensors, Montreal, QC, Canada, 27–30 October 2019; Institute of Electrical and Electronics Engineers Inc.: Piscataway, NJ, USA, 2019. [Google Scholar]
- Imas, J.J.; Ruiz Zamarreño, C.; Zubiate, P.; Campión, J.; Sánchez-Martín, L.; Matías, I.R. Rheumatoid Arthritis miRNA biomarker detection by means of LMR based fiber-optic biosensor. In Proceedings of the IEEE Sensors 2020, Rotterdam, The Netherlands, 25–28 October 2020; Institute of Electrical and Electronics Engineers Inc.: Piscataway, NJ, USA, 2020. [Google Scholar]
- Steglich, P.; Hülsemann, M.; Dietzel, B.; Mai, A. Optical biosensors based on silicon-on-insulator ring resonators: A review. Molecules 2019, 24, 519. [Google Scholar] [CrossRef] [PubMed] [Green Version]
- Luan, E.; Shoman, H.; Ratner, D.M.; Cheung, K.C.; Chrostowski, L. Silicon photonic biosensors using label-free detection. Sensors 2018, 18, 3519. [Google Scholar] [CrossRef] [Green Version]
- Bogaerts, W.; De Heyn, P.; Van Vaerenbergh, T.; De Vos, K.; Kumar Selvaraja, S.; Claes, T.; Dumon, P.; Bienstman, P.; Van Thourhout, D.; Baets, R. Silicon microring resonators. Laser Photonics Rev. 2012, 6, 47–73. [Google Scholar] [CrossRef]
- Kozma, P.; Kehl, F.; Ehrentreich-Förster, E.; Stamm, C.; Bier, F.F. Integrated planar optical waveguide interferometer biosensors: A comparative review. Biosens. Bioelectron. 2014, 58, 287–307. [Google Scholar] [CrossRef]
- Roy, S.; Jaiswal, A. SERS-based biosensors as potential next-generation point-of-care cancer diagnostic platforms. In Next Generation Point-of-Care Biomedical Sensors Technologies for Cancer Diagnosis; Springer: Singapore, 2017; pp. 173–204. ISBN 9789811047268. [Google Scholar]
- Tillett, W.S.; Francis, T. Serological reactions in pneumonia with a nonprotein somatic fraction of pneumococcus. J. Exp. Med. 1930, 52, 561–571. [Google Scholar] [CrossRef] [Green Version]
- Patel, D.N.; King, C.A.; Bailey, S.R.; Holt, J.W.; Venkatachalam, K.; Agrawal, A.; Valente, A.J.; Chandrasekar, B. Interleukin-17 stimulates C-reactive protein expression in hepatocytes and smooth muscle cells via p38 MAPK and ERK1/2-dependent NF-κB and C/EBPβ activation. J. Biol. Chem. 2007, 282, 27229–27238. [Google Scholar] [CrossRef] [Green Version]
- Shadick, N.A.; Cook, N.R.; Karlson, E.W.; Ridker, P.M.; Maher, N.E.; Manson, J.A.E.; Buring, J.E.; Lee, I.M. C-reactive protein in the prediction of rheumatoid arthritis in women. Arch. Intern. Med. 2006, 166, 2490–2494. [Google Scholar] [CrossRef] [PubMed]
- Yamane, T.; Hashiramoto, A.; Tanaka, Y.; Tsumiyama, K.; Miura, Y.; Shiozawa, K.; Chihara, K.; Shiozawa, S. Easy and accurate diagnosis of rheumatoid arthritis using anti-cyclic citrullinated peptide 2 antibody, swollen joint count, and C-reactive protein/rheumatoid factor. J. Rheumatol. 2008, 35, 414–420. [Google Scholar] [PubMed]
- Meyer, M.H.F.; Hartmann, M.; Keusgen, M. SPR-based immunosensor for the CRP detection—A new method to detect a well known protein. Biosens. Bioelectron. 2006, 21, 1987–1990. [Google Scholar] [CrossRef]
- Vashist, S.K.; Schneider, E.M.; Luong, J.H.T. Surface plasmon resonance-based immunoassay for human C-reactive protein. Analyst 2015, 140, 4445–4452. [Google Scholar] [CrossRef]
- Chammem, H.; Hafaid, I.; Meilhac, O.; Menaa, F.; Mora, L.; Abdelghani, A. Surface Plasmon Resonance for C-Reactive Protein Detection in Human Plasma. J. Biomater. Nanobiotechnol. 2014, 5, 47528. [Google Scholar] [CrossRef] [Green Version]
- Dang, T.; Hu, W.; Zhang, W.; Song, Z.; Wang, Y.; Chen, M.; Xu, H.; Liu, G.L. Protein binding kinetics quantification via coupled plasmonic-photonic resonance nanosensors in generic microplate reader. Biosens. Bioelectron. 2019, 142, 111494. [Google Scholar] [CrossRef]
- Kitayama, Y.; Takeuchi, T. Localized Surface Plasmon Resonance Nanosensing of C-Reactive Protein with Poly(2-methacryloyloxyethyl phosphorylcholine)-Grafted Gold Nanoparticles Prepared by Surface-Initiated Atom Transfer Radical Polymerization. Anal. Chem. 2014, 86, 5587–5594. [Google Scholar] [CrossRef] [PubMed]
- Oh, S.Y.; Heo, N.S.; Bajpai, V.K.; Jang, S.-C.; Ok, G.; Cho, Y.; Huh, Y.S. Development of a Cuvette-Based LSPR Sensor Chip Using a Plasmonically Active Transparent Strip. Front. Bioeng. Biotechnol. 2019, 7, 299. [Google Scholar] [CrossRef]
- Yeom, S.H.; Han, M.E.; Kang, B.H.; Kim, K.J.; Yuan, H.; Eum, N.S.; Kang, S.W. Enhancement of the sensitivity of LSPR-based CRP immunosensors by Au nanoparticle antibody conjugation. Sens. Actuators B Chem. 2013, 177, 376–383. [Google Scholar] [CrossRef]
- Zubiate, P.; Zamarreño, C.R.; Sánchez, P.; Matias, I.R.; Arregui, F.J. High sensitive and selective C-reactive protein detection by means of lossy mode resonance based optical fiber devices. Biosens. Bioelectron. 2017, 93, 176–181. [Google Scholar] [CrossRef] [PubMed]
- Kim, B.B.; Im, W.J.; Byun, J.Y.; Kim, H.M.; Kim, M.G.; Shin, Y.B. Label-free CRP detection using optical biosensor with one-step immobilization of antibody on nitrocellulose membrane. Sens. Actuators B Chem. 2014, 190, 243–248. [Google Scholar] [CrossRef]
- Sridevi, S.; Vasu, K.S.; Asokan, S.; Sood, A.K. Sensitive detection of C-reactive protein using optical fiber Bragg gratings. Biosens. Bioelectron. 2015, 65, 251–256. [Google Scholar] [CrossRef]
- Schulze, S.; Wehrhold, M.; Hille, C. Femtosecond-pulsed laser written and etched fiber bragg gratings for fiber-optical biosensing. Sensors 2018, 18, 2844. [Google Scholar] [CrossRef] [PubMed] [Green Version]
- Murata, A.; Ooya, T.; Takeuchi, T. Two-layer reflectometric interference spectroscopy-based immunosensing for C-reactive protein. Microchim. Acta 2015, 182, 307–313. [Google Scholar] [CrossRef]
- Ouyang, M.; Di Carlo, D. Nanoplasmonic swarm biosensing using single nanoparticle colorimetry. Biosens. Bioelectron. 2019, 132, 162–170. [Google Scholar] [CrossRef]
- Ghosh, S.; Metlushko, A.; Chaudhry, S.; Dutta, M.; Stroscio, M.A. Detection of c-reactive protein using network-deployable DNA aptamer based optical nanosensor. In Proceedings of the 2019 IEEE EMBS International Conference on Biomedical and Health Informatics, BHI 2019, Chicago, IL, USA, 19–22 May 2019; Institute of Electrical and Electronics Engineers Inc.: Piscataway, NJ, USA, 2019. [Google Scholar]
- Borse, V.; Srivastava, R. Fluorescence lateral flow immunoassay based point-of-care nanodiagnostics for orthopedic implant-associated infection. Sens. Actuators B Chem. 2019, 280, 24–33. [Google Scholar] [CrossRef]
- Islam, M.S.; Yu, H.; Lee, H.G.; Kang, S.H. Molecular switching fluorescence based high sensitive detection of label-free C-reactive protein on biochip. Biosens. Bioelectron. 2010, 26, 1028–1035. [Google Scholar] [CrossRef]
- Chiavaioli, F.; Zubiate, P.; Del Villar, I.; ZamarrenÌo, C.R.; Giannetti, A.; Tombelli, S.; Trono, C.; Arregui, F.J.; Matias, I.R.; Baldini, F. Femtomolar Detection by Nanocoated Fiber Label-Free Biosensors. ACS Sens. 2018, 3, 936–943. [Google Scholar] [CrossRef]
- Zubiate, P.; Santano, D.; Urrutia, A.; Zamarreño, C.R.; Díaz, S.; Matias, I.R.; Arregui, F.J.; Giannetti, A.; Baldini, F.; Fernández-Irigoyen, J.; et al. Fiber-optics: A new route towards ultra-low detection limit label-free biosensing. In Proceedings of the Seventh European Workshop on Optical Fibre Sensors, Limassol, Cyprus, 28 August 2019; Kalli, K., Brambilla, G., O’Keeffe, S.O., Eds.; SPIE: Bellingham, WA, USA, 2019; Volume 11199, p. 62. [Google Scholar]
- Chiavaioli, F.; Zubiate, P.; Del Villar, I.; Zamarreño, C.R.; Giannetti, A.; Tombelli, S.; Trono, C.; Matias, I.R.; Arregui, F.J.; Baldini, F. Lossy mode resonance fiber-optic biosensing allowing ultra-low detection limit. In Proceedings of the 2019 Conference on Lasers and Electro-Optics Europe and European Quantum Electronics Conference, CLEO/Europe-EQEC 2019, Munich, Germany, 23–27 June 2019; Institute of Electrical and Electronics Engineers Inc.: Piscataway, NJ, USA, 2019. [Google Scholar]
- Socorro, A.B.; Corres, J.M.; Del Villar, I.; Arregui, F.J.; Matias, I.R. Fiber-optic biosensor based on lossy mode resonances. Sens. Actuators B Chem. 2012, 174, 263–269. [Google Scholar] [CrossRef]
- Zubiate, P.; Urrutia, A.; Zamarreño, C.R.; Egea-Urra, J.; Fernández-Irigoyen, J.; Giannetti, A.; Baldini, F.; Díaz, S.; Matias, I.R.; Arregui, F.J.; et al. Fiber-based early diagnosis of venous thromboembolic disease by label-free D-dimer detection. Biosens. Bioelectron. X 2019, 2, 100026. [Google Scholar] [CrossRef]
- Beckham, J.C.; Caldwell, D.S.; Peterson, B.L.; Pippen, A.M.M.; Currie, M.S.; Keefe, F.J.; Weinberg, J.B. Disease severity in rheumatoid arthritis: Relationships of plasma tumor necrosis factor-α, soluble interleukin 2-receptor, soluble CD4/CD8 ratio, neopterin, and fibrin D-dimer to traditional severity and functional measures. J. Clin. Immunol. 1992, 12, 353–361. [Google Scholar] [CrossRef]
- Hill, K.O.; Meltz, G. Fiber Bragg grating technology fundamentals and overview. J. Light. Technol. 1997, 15, 1263–1276. [Google Scholar] [CrossRef] [Green Version]
- Libish, T.M.; Radhakrishnan, P. Design and Development of Fiber Grating Based Chemical and Bio-Sensors. Ph.D. Thesis, Fabrication of Etched FBGs and Refractive Index Sensing. Cochin University of Science and Technology, Kerala, India, 2015. Chapter 5. [Google Scholar]
- Chiavaioli, F.; Baldini, F.; Tombelli, S.; Trono, C.; Giannetti, A. Biosensing with optical fiber gratings. Nanophotonics 2017, 6, 663–679. [Google Scholar] [CrossRef]
- Gauglitz, G. Direct optical sensors: Principles and selected applications. Anal. Bioanal. Chem. 2005, 381, 141–155. [Google Scholar] [CrossRef]
- Song, Y.W.; Kang, E.H. Autoantibodies in rheumatoid arthritis: Rheumatoid factors and anticitrullinated protein antibodies. QJM 2010, 103, 139–146. [Google Scholar] [CrossRef] [Green Version]
- Humphreys, J.H.; van Nies, J.A.B.; Chipping, J.; Marshall, T.; Mil, H.H.M.H.; Symmons, D.P.M.; Verstappen, S.M.M. Rheumatoid factor and anti-citrullinated protein antibody positivity, but not level, are associated with increased mortality in patients with rheumatoid arthritis: Results from two large independent cohorts. Arthritis Res. Ther. 2014, 16, 483. [Google Scholar] [CrossRef] [Green Version]
- Pope, J.E.; Movahedi, M.; Rampakakis, E.; Cesta, A.; Sampalis, J.S.; Keystone, E.; Thorne, C.; Bombardier, C. ACPA and RF as predictors of sustained clinical remission in patients with rheumatoid arthritis: Data from the Ontario Best practices Research Initiative (OBRI). RMD Open 2018, 4, e000738. [Google Scholar] [CrossRef] [Green Version]
- Zeng, T.; Tan, L. 14-3-3η protein: A promising biomarker for rheumatoid arthritis. Biomark. Med. 2018, 12, 917–925. [Google Scholar] [CrossRef]
- Liu, N.J.; Chapman, R.; Lin, Y.; Mmesi, J.; Bentham, A.; Tyreman, M.; Abraham, S.; Stevens, M.M. Point of care testing of phospholipase A2 group IIA for serological diagnosis of rheumatoid arthritis. Nanoscale 2016, 8, 4482–4485. [Google Scholar] [CrossRef]
- Seoane, I.V.; Martínez, C.; García-Vicuña, R.; Ortiz, A.M.; Juarranz, Y.; Talayero, V.C.; González-Álvaro, I.; Gomariz, R.P.; Lamana, A. Vasoactive intestinal peptide gene polymorphisms, associated with its serum levels, predict treatment requirements in early rheumatoid arthritis. Sci. Rep. 2018, 8, 1–11. [Google Scholar] [CrossRef]
- Das, S.; Baruah, C.; Saikia, A.K.; Bose, S. Associative role of HLA-DRB1 SNP genotypes as risk factors for susceptibility and severity of rheumatoid arthritis: A North-east Indian population-based study. Int. J. Immunogenet. 2018, 45, 1–7. [Google Scholar] [CrossRef] [Green Version]
- Corgier, B.P.; Marquette, C.A.; Blum, L.J. Direct electrochemical addressing of immunoglobulins: Immuno-chip on screen-printed microarray. Biosens. Bioelectron. 2007, 22, 1522–1526. [Google Scholar] [CrossRef]
- Lokate, A.M.C.; Beusink, J.B.; Besselink, G.A.J.; Pruijn, G.J.M.; Schasfoort, R.B.M. Biomolecular interaction monitoring of autoantibodies by scanning surface plasmon resonance microarray imaging. J. Am. Chem. Soc. 2007, 129, 14013–14018. [Google Scholar] [CrossRef]
- van Beers, J.J.B.C.; Willemze, A.; Jansen, J.J.; Engbers, G.H.M.; Salden, M.; Raats, J. ACPA fine-specificity profiles in early rheumatoid arthritis patients do not correlate with clinical features at baseline or with disease progression. Arthritis Res. Ther. 2013, 15. [Google Scholar] [CrossRef] [Green Version]
- Qiu, S.; Miao, M.; Wang, T.; Lin, Z.; Guo, L.; Qiu, B.; Chen, G. A fluorescent probe for detection of histidine in cellular homogenate and ovalbumin based on the strategy of click chemistry. Biosens. Bioelectron. 2013, 42, 332–336. [Google Scholar] [CrossRef] [PubMed]
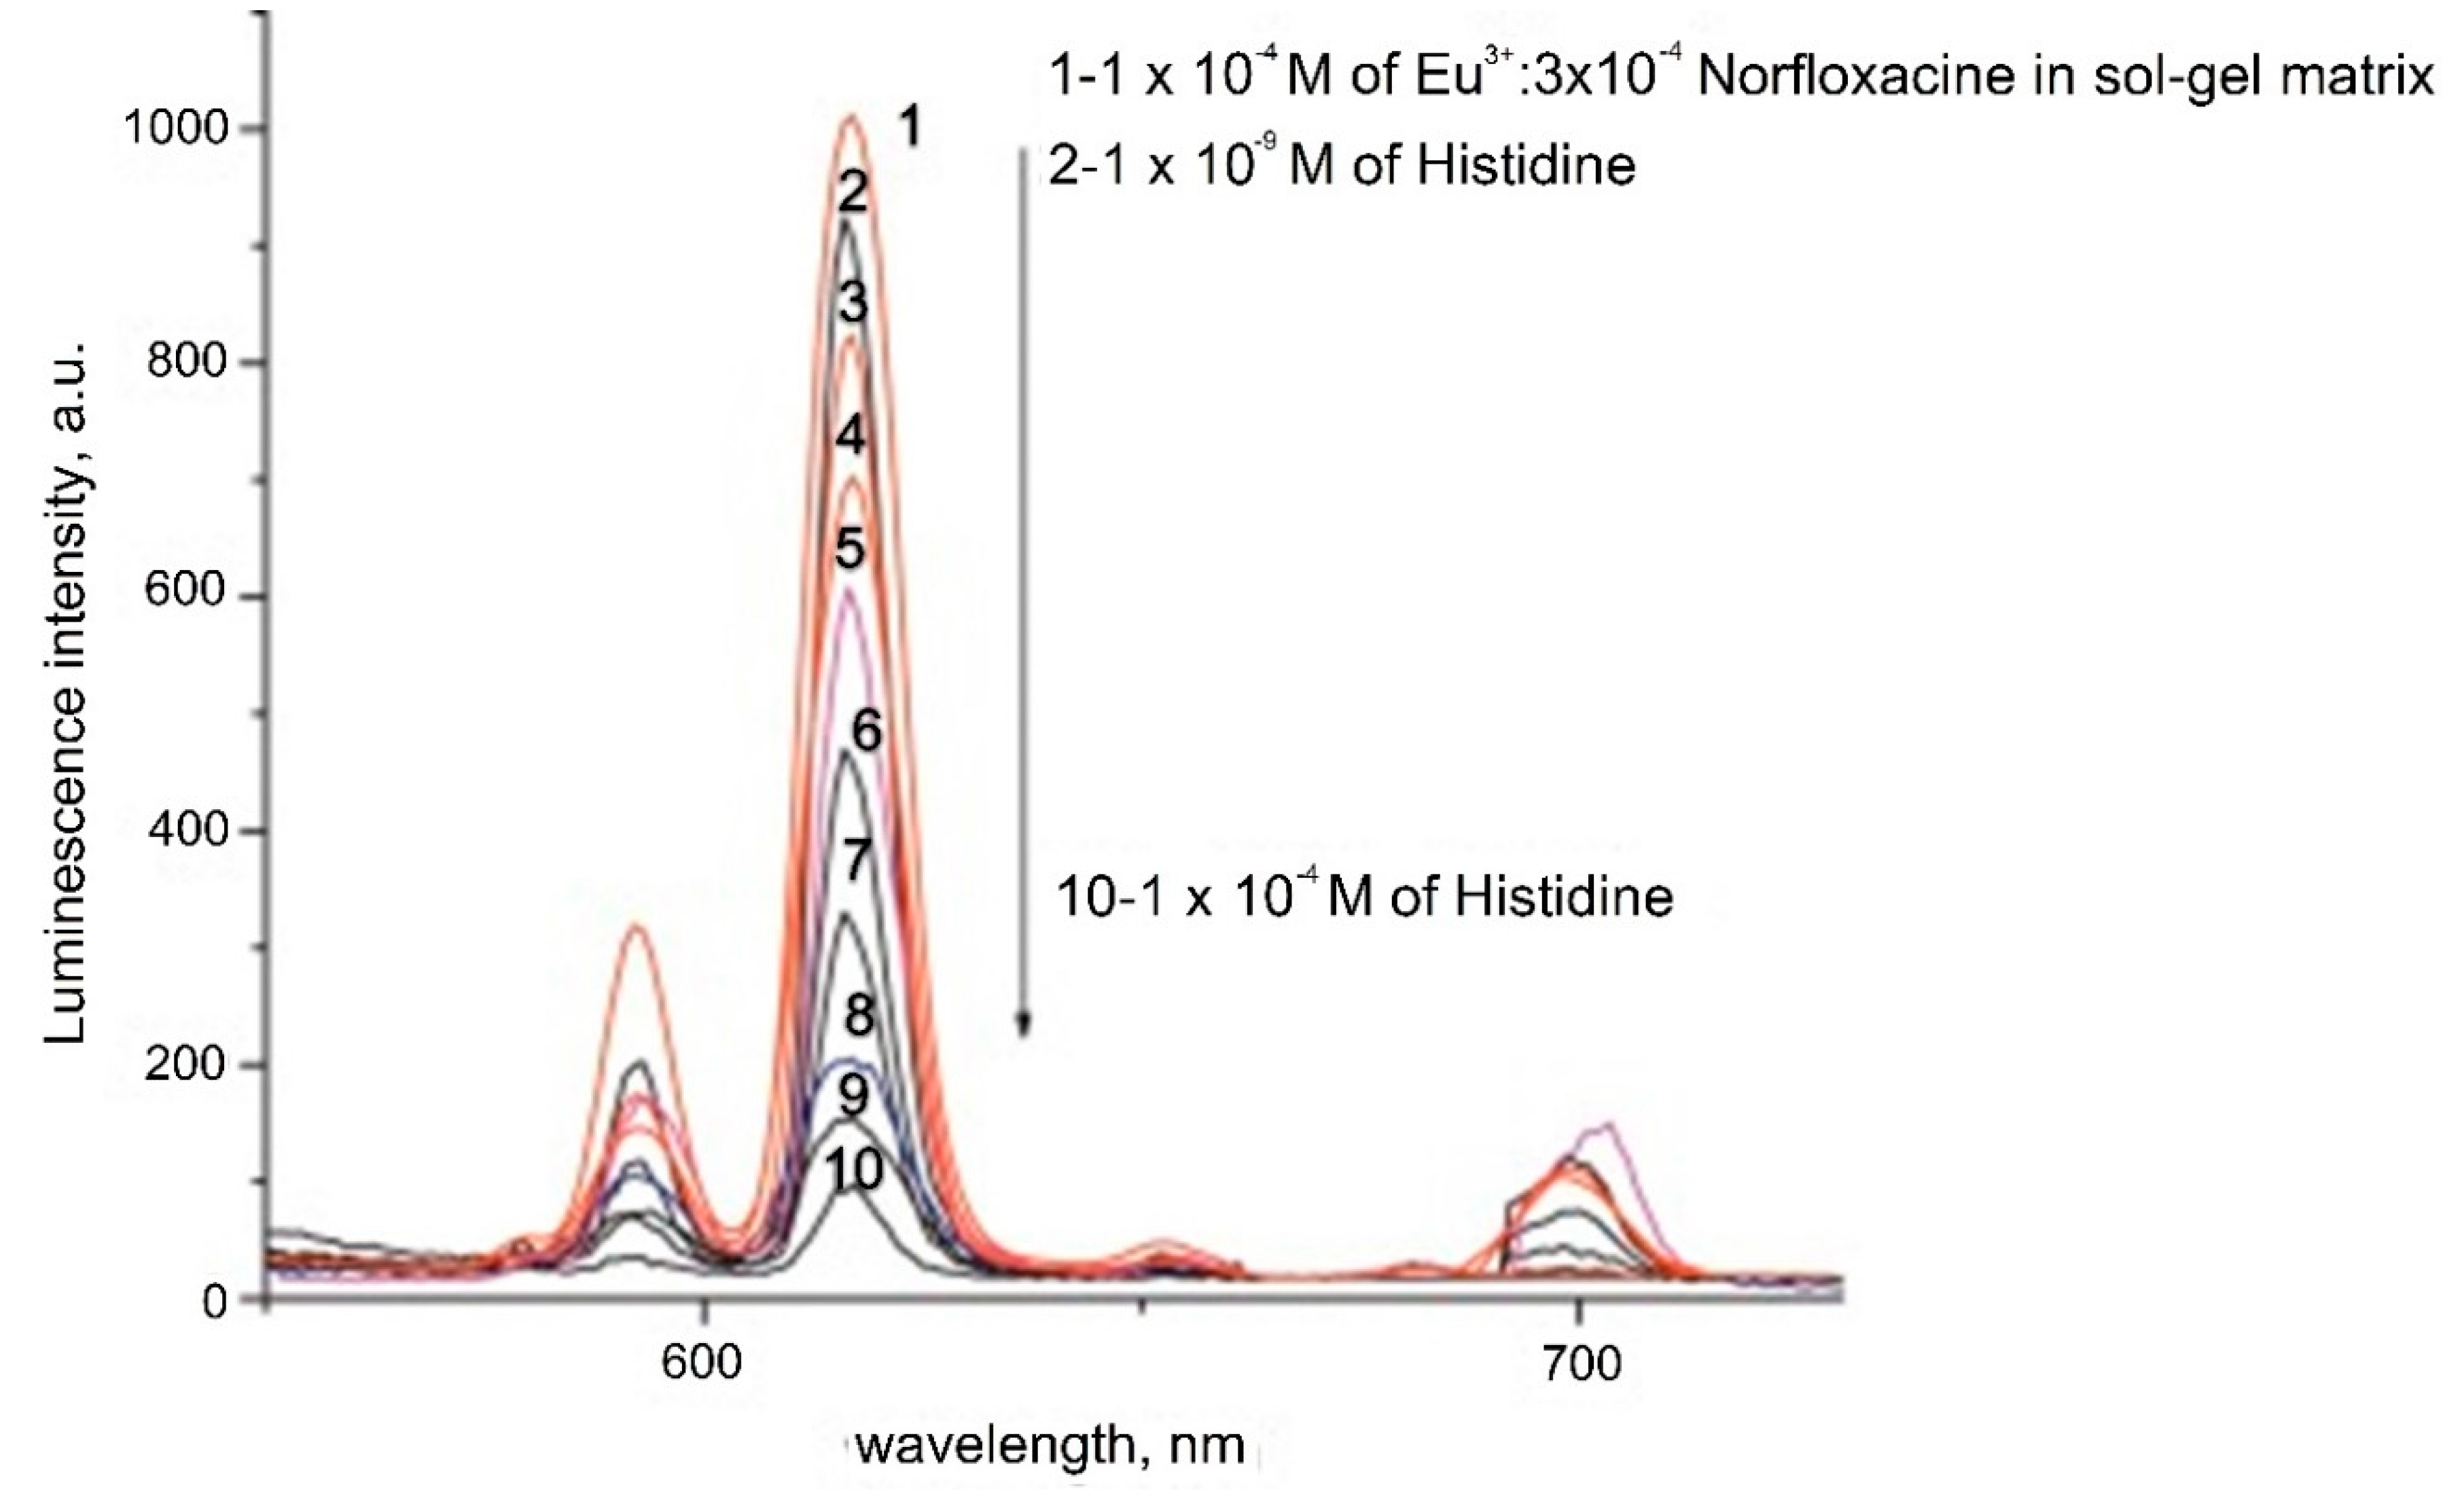
- Attia, M.S.; Diab, M.; El-Shahat, M.F. Diagnosis of some diseases related to the histidine level in human serum by using the nano optical sensor Eu-Norfloxacine complex. Sens. Actuators B Chem. 2015, 756–763. [Google Scholar] [CrossRef]
- Jónsson, T.; Steinsson, K.; Jónsson, H.; Geirsson, Á.J.; Thorsteinsson, J.; Valdimarsson, H. Combined elevation of IgM and IgA rheumatoid factor has high diagnostic specificity for rheumatoid arthritis. Rheumatol. Int. 1998, 18, 119–122. [Google Scholar] [CrossRef]
- Arnett, F.C.; Edworthy, S.M.; Bloch, D.A.; Mcshane, D.J.; Fries, J.F.; Cooper, N.S.; Healey, L.A.; Kaplan, S.R.; Liang, M.H.; Luthra, H.S.; et al. The american rheumatism association 1987 revised criteria for the classification of rheumatoid arthritis. Arthritis Rheum. 1988, 31, 315–324. [Google Scholar] [CrossRef] [PubMed]
- Aletaha, D.; Neogi, T.; Silman, A.J.; Funovits, J.; Felson, D.T.; Bingham, C.O.; Birnbaum, N.S.; Burmester, G.R.; Bykerk, V.P.; Cohen, M.D.; et al. 2010 Rheumatoid arthritis classification criteria: An American College of Rheumatology/European League Against Rheumatism collaborative initiative. Arthritis Rheum. 2010, 62, 2569–2581. [Google Scholar] [CrossRef]
- Saraux, A.; Berthelot, J.M.; Chalès, G.; Le Henaff, C.; Mary, J.Y.; Thorel, J.B.; Hoang, S.; Dueymes, M.; Allain, J.; Devauchelle, V.; et al. Value of laboratory tests in early prediction of rheumatoid arthritis. Arthritis Care Res. (Hoboken) 2002, 47, 155–165. [Google Scholar] [CrossRef]
- National Cancer Institute (NCI). Definition of International Unit—NCI Dictionary of Cancer Terms. Available online: https://www.cancer.gov/publications/dictionaries/cancer-terms/def/international-unit (accessed on 8 May 2020).
- Anderson, S.G.; Bentzon, M.W.; Houba, V.; Krag, P. International Reference Preparation of Rheumatoid Arthritis Serum. Bull. World Health Organ. 1970, 42, 311. [Google Scholar]
- World Health Organization. WHO Expert Committee on Biological Standardization Sixty-Eighth Report; World Health Organization: Geneva, Switzerland, 2018; ISBN 9789241210201. [Google Scholar]
- Aggarwal, R.; Liao, K.; Nair, R.; Ringold, S.; Costenbander, K.H. Anti-citrullinated peptide antibody assays and their role in the diagnosis of rheumatoid arthritis. Arthritis Care Res. (Hoboken) 2009, 61, 1472–1483. [Google Scholar] [CrossRef] [PubMed] [Green Version]
- Sanmartí, R.; Victoria Hernández, M.; Gómez-Puerta, J.A.; Graell, E.; Cañete, J.D. Serum autoantibodies in rheumatoid arthritis. Int. J. Adv. Rheumatol. 2008, 6, 47–52. [Google Scholar]
- Aletaha, D.; Alasti, F.; Smolen, J.S. Rheumatoid factor, not antibodies against citrullinated proteins, is associated with baseline disease activity in rheumatoid arthritis clinical trials. Arthritis Res. Ther. 2015, 17. [Google Scholar] [CrossRef] [PubMed] [Green Version]
- Srirangan, S.; Choy, E.H. The role of Interleukin 6 in the pathophysiology of rheumatoid arthritis. Ther. Adv. Musculoskelet. Dis. 2010, 2, 247–256. [Google Scholar] [CrossRef] [Green Version]
- Xie, K.; Dai, K.; Qu, X.; Yan, M. Serum and Synovial Fluid Interleukin-6 for the Diagnosis of Periprosthetic Joint Infection. Sci. Rep. 2017, 7, 1496. [Google Scholar] [CrossRef] [PubMed] [Green Version]
- Assier, E.; Boissier, M.C.; Dayer, J.M. Interleukin-6: From identification of the cytokine to development of targeted treatments. Jt. Bone Spine 2010, 77, 532–536. [Google Scholar] [CrossRef]
- Kim, G.W.; Lee, N.R.; Pi, R.H.; Lim, Y.S.; Lee, Y.M.; Lee, J.M.; Jeong, H.S.; Chung, S.H. IL-6 inhibitors for treatment of rheumatoid arthritis: Past, present, and future. Arch. Pharm. Res. 2015, 38, 575–584. [Google Scholar] [CrossRef]
- Burska, A.; Boissinot, M.; Ponchel, F. Cytokines as Biomarkers in Rheumatoid Arthritis. Mediators Inflamm. 2014, 2014. [Google Scholar] [CrossRef]
- National Center for Biotechnology Information (NCBI), PubChem Database. Histidine, CID = 6274. Available online: https://pubchem.ncbi.nlm.nih.gov/compound/Histidine (accessed on 8 May 2020).
- Borden, A.L.; Wallraff, E.B.; Brodie, E.C.; Holbrook, W.P.; Hill, D.F.; Stephens, C.A.L.; Kent, L.J.; Kemmerer, A.R. Plasma Levels of Free Amino Acids in Normal Subjects Compared with Patients with Rheumatoid Arthritis. Exp. Biol. Med. 1950, 75, 28–30. [Google Scholar] [CrossRef]
- Gerber, D.A.; Tanenbaum, L.; Ahrens, M. Free serum histidine levels in patients with rheumatoid arthritis and control subjects following an oral load of free L-histidine. Metabolism 1976, 25, 655–657. [Google Scholar] [CrossRef]
- Gerber, D.A. Low free serum histidine concentration in rheumatoid arthritis. A measure of disease activity. J. Clin. Investig. 1975, 55, 1164–1173. [Google Scholar] [CrossRef] [Green Version]
- Kirkham, J.; Lowe, J.; Bird, H.A.; Wright, V. Serum histidine in rheumatoid arthritis: A family study. Ann. Rheum. Dis. 1981, 40, 501–502. [Google Scholar] [CrossRef] [PubMed] [Green Version]
- Sasaki, C.; Hiraishi, T.; Oku, T.; Okuma, K.; Suzumura, K.; Hashimoto, M.; Ito, H.; Aramori, I.; Hirayama, Y. Metabolomic approach to the exploration of biomarkers associated with disease activity in rheumatoid arthritis. PLoS ONE 2019, 14, e0219400. [Google Scholar] [CrossRef] [Green Version]
- Madsen, R.K.; Lundstedt, T.; Gabrielsson, J.; Sennbro, C.J.; Alenius, G.M.; Moritz, T.; Rantapää-Dahlqvist, S.; Trygg, J. Diagnostic properties of metabolic perturbations in rheumatoid arthritis. Arthritis Res. Ther. 2011, 13, R19. [Google Scholar] [CrossRef] [Green Version]
- Kim, D.; Mun, S.; Lee, J.; Park, A.; Seok, A.E.; Chun, Y.T.; Kang, H.G. Proteomics analysis reveals differential pattern of widespread protein expression and novel role of histidine-rich glycoprotein and lipopolysaccharide-binding protein in rheumatoid arthritis. Int. J. Biol. Macromol. 2018, 109, 704–710. [Google Scholar] [CrossRef] [PubMed]


| Optical Technique/ Principle | Target miRNA Linked with RA | Linear Dynamic Range | LOD | Specificity Assays | Comments | Ref. |
|---|---|---|---|---|---|---|
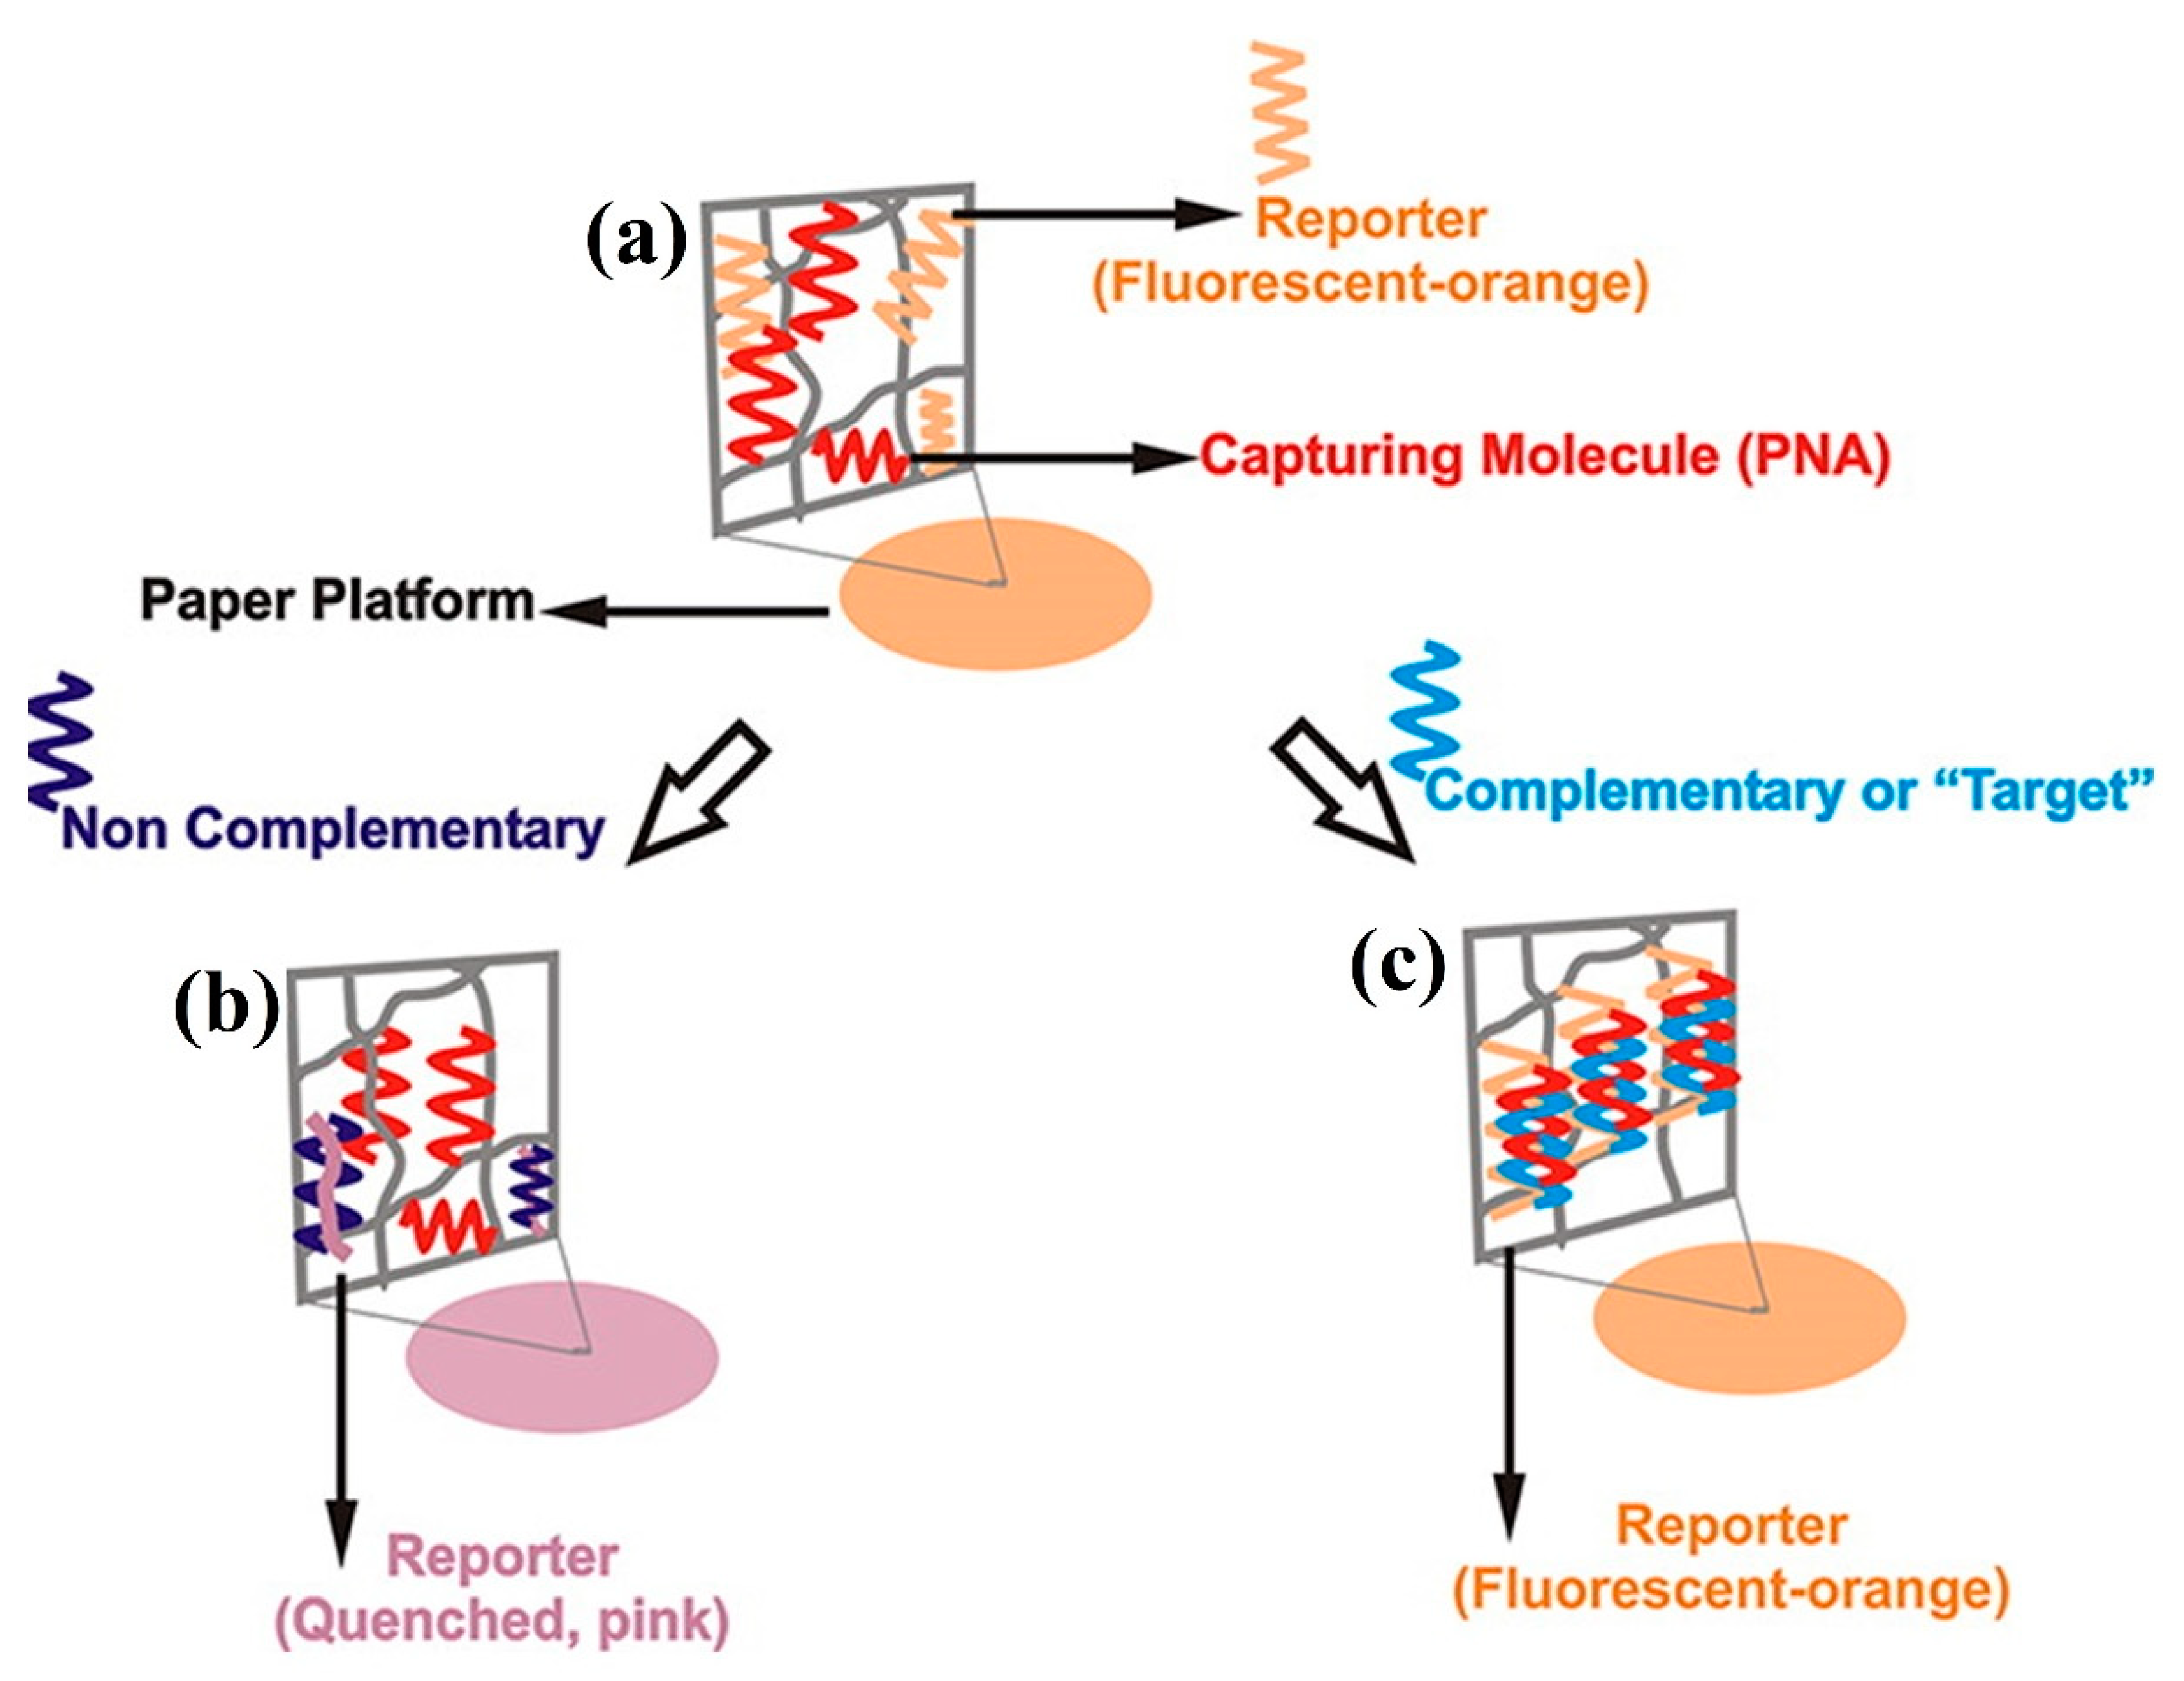
| Fluorescence | miR-21 | 10 nM–10 µM | 10 nM | One base mismatched miR-21 and other non-related sequence | Sensor based on PVDF paper impregnated with PT as luminescent reporter | [37] |
| 50 pM–1 nM (fluorescence) | 50 pM (fluores-cence) | let-7e, let-7i, miR-141, single-base-mismatched miR-21 | Dual mode sensor (fluorescence and colorimetry) based on FAM labelled hairpin probes, Au NPs and DSN signal amplification | [38] | ||
| 125 pM–1.5 nM | 125 pM (b) | Blank, let-7a, let-7b, let-7c-5p, miR-21 complementary seq. | Detection strategy that uses CHA, graphene oxide (GO) and hairpin probes with FAM | [39] | ||
| 0.2–20 nM | 98 pM | miR-26a, miR-122, miR-141* | Method based on rGO, Eosin Y and magnetic silicon microspheres. | [40] | ||
| 1–16 nM | 47 pM | Mismatched miRNAs (1, 2, 3 or 5 bases) and miR-126* | Sensor based on fluorescence anisotropy (FA) that uses GO-assisted CHA and TAMRA | [41] | ||
| 5–100 pM | 5 pM | miR-214 | Single molecule detection (SMD) assay based on total internal reflection fluorescence microscopy (TIRFM) that uses YOYO-1 | [42] | ||
| 2 pM–10 nM | 2 pM (b) | let-7a, let-7b, let-7c-5p | Sensor that employs GO nanoplates, RCA, triple-helix probes, and FAM. | [43] | ||
| 1 pM–10 nM (a) | 1 pM | Blank, one and two-base mismatched miR-21, miR-155 | MiRNA detection based on RCA reaction, GO and nicking enzyme amplification | [44] | ||
| 1 pM–1 nM | 1 pM (b) | Blank, miR-210-3p, miR-214 | Switch platform using GO and SYBR Green I based on isothermal enzyme free amplification | [45] | ||
| 0.6 pM–1.0 nM (a) | 0.6 pM | - | Sensor based on photonic crystal enhanced fluorescence (PCEF) that employs Cy5 | [46] | ||
| 100 fM–5 µM (a) | 35 fM | - | MiRNA detection by CXFluoAmp method with CdSe nanocrystals and Rhod-5N | [47] | ||
| 10 fM–10 pM | 3 fM | Blank, miR-210-3p, miR-214 | Sensor that combines isothermal exponential amplification, GO and SYBR Green I | [48] | ||
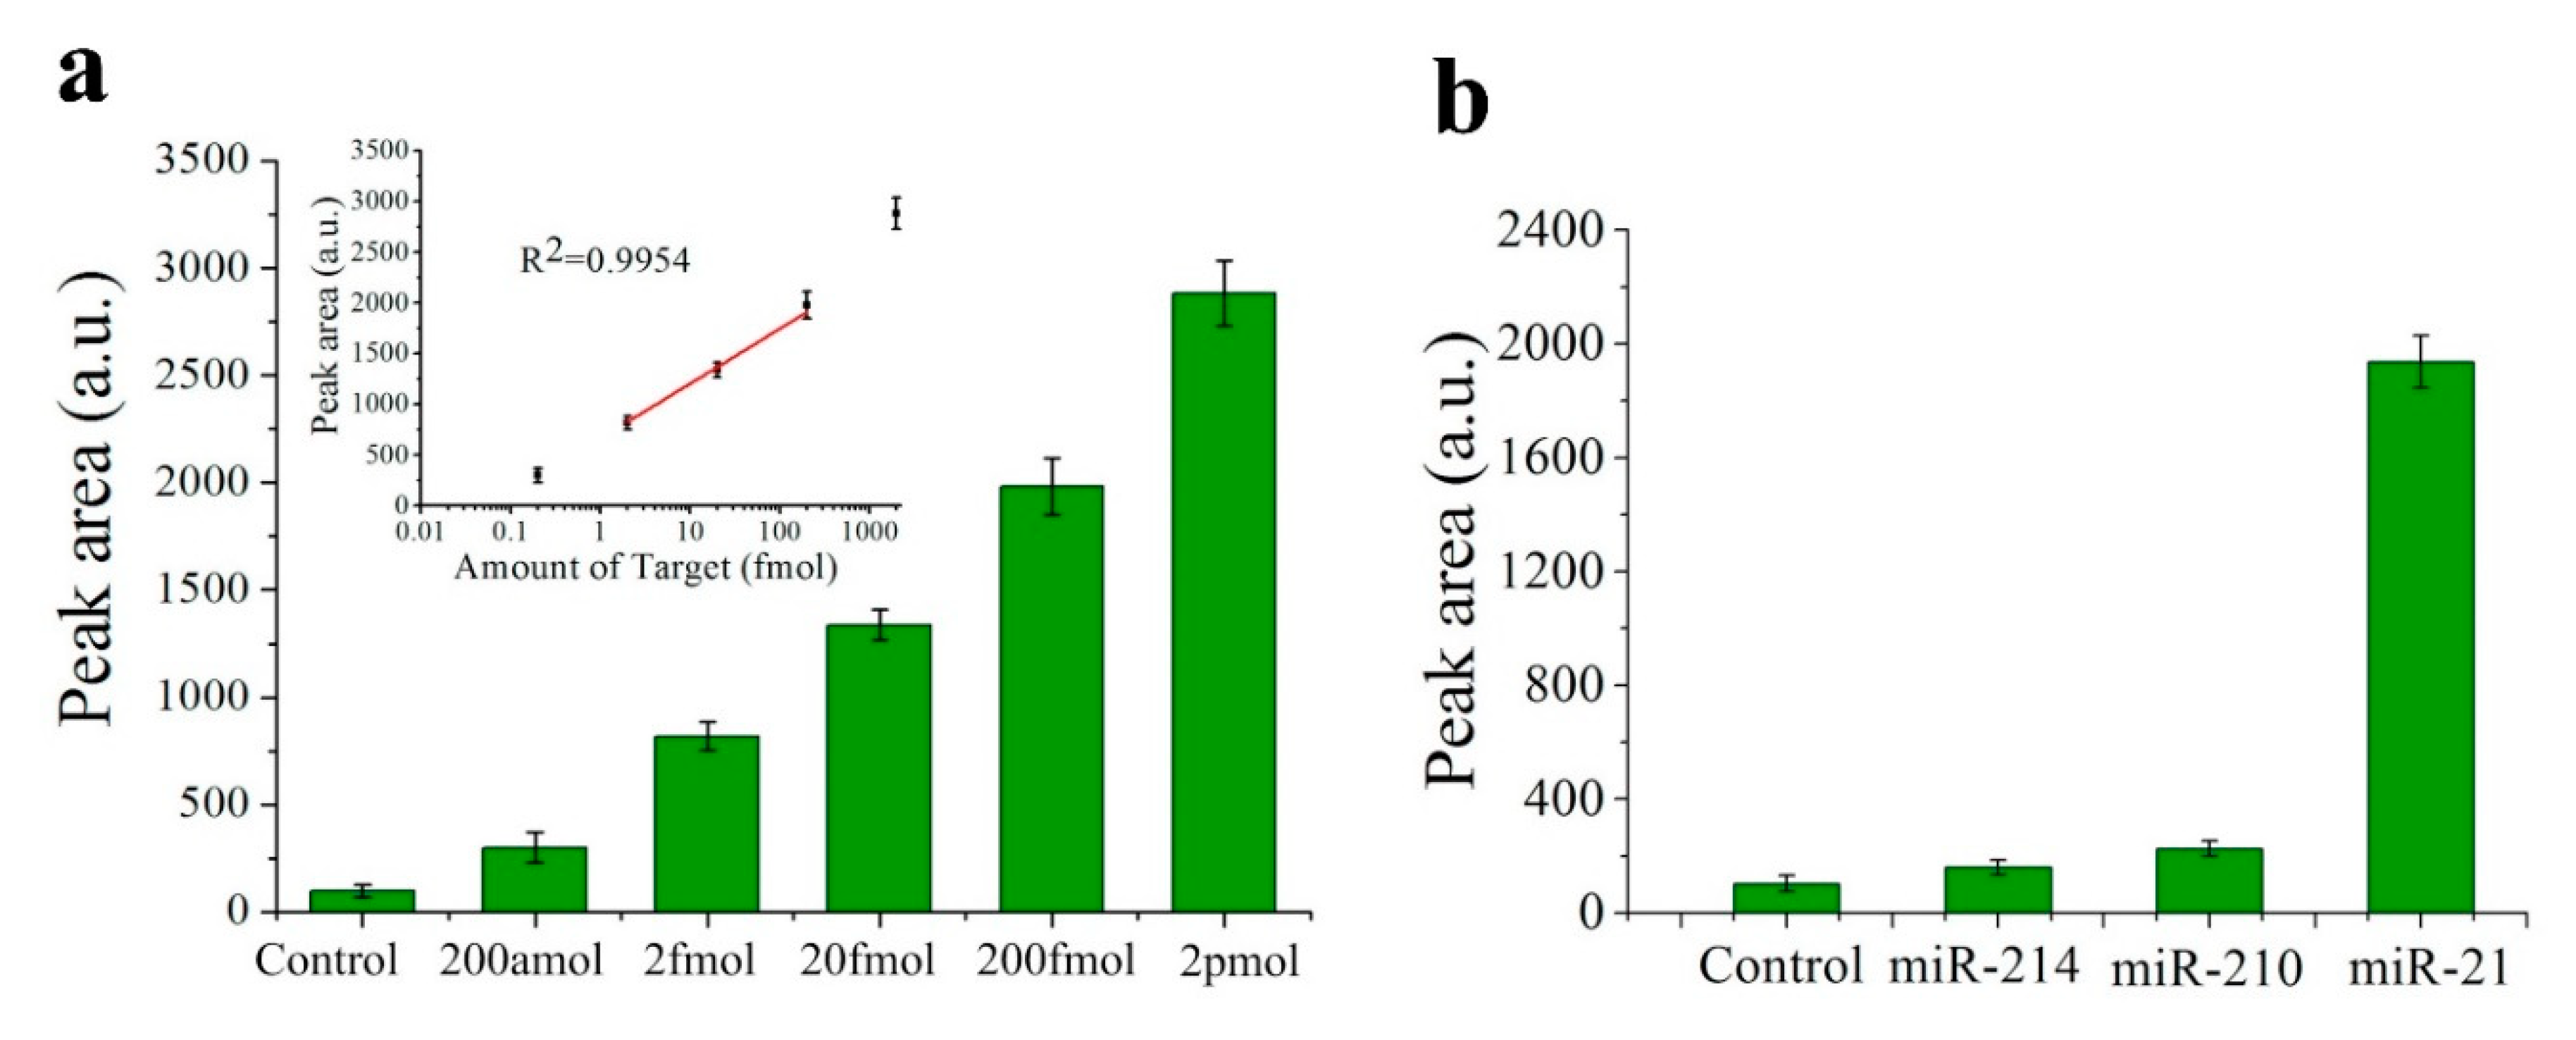
| 2–200 fM | 200 aM | Blank, miR-210-3p, miR-214 | QD labelled strip sensor based on target- recycled non-enzymatic amplification | [49] | ||
| let-7a | 5–300 nM (a) | 3.5 nM | let-7c-5p-5p, let-7e, let-7f (based on Tm) | MiRNA detection using carbon nanoparticles and DNA probes labelled with FAM | [50] | |
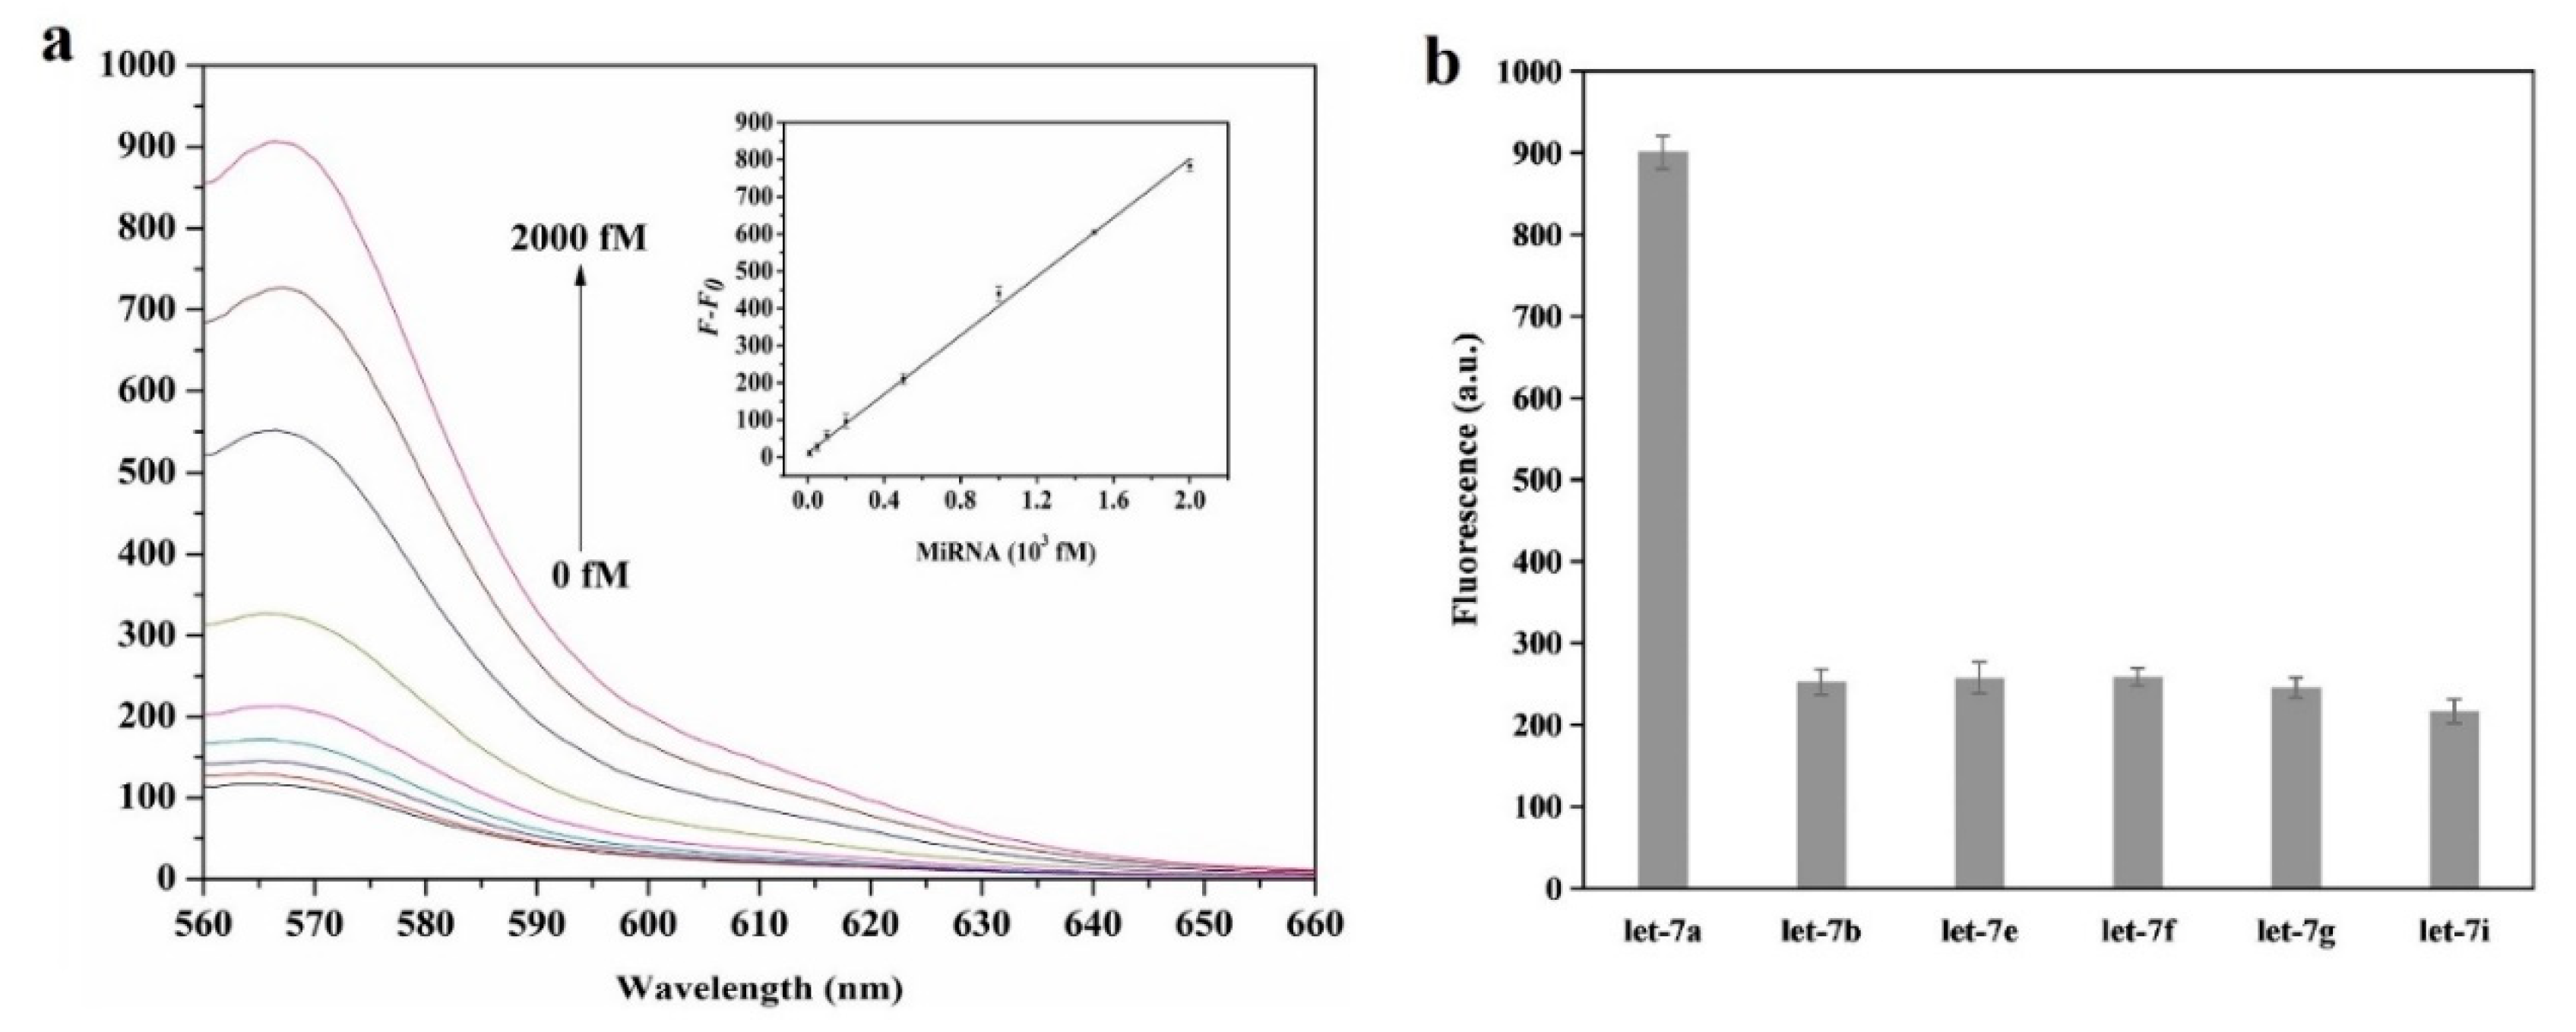
| 1 pM–5 nM (a) | 1 pM (b) | let-7b, let-7e, let-7f, let-7g, let-7i | Assay based on HCR reaction coupled with GO and DNA probes with FAM | [51] | ||
| 60 fM–12 pM | 10.8 fM | let-7b, let-7c-5p-5p, miR-21 | MiRNA detection based on amplification using GO and SYBR Green I | [52] | ||
| 10 fM–2 pM | 4.2 fM | let-7b, let-7e, let-7f, let-7g, let-7i | Detection platform that uses GO, helicase amplification of HCR and DNA with Cy3 | [53] | ||
| miR-141 | 1 pM–5 nM | 1 pM | Single mismatched miR-141, miR-21, miR-200b, miR-429 | Sensor based on a β-Ni(OH)2 nanosheet, DSN amplification with FAM and TAMRA | [54] | |
| miR-21 | - | 10 nM | - | |||
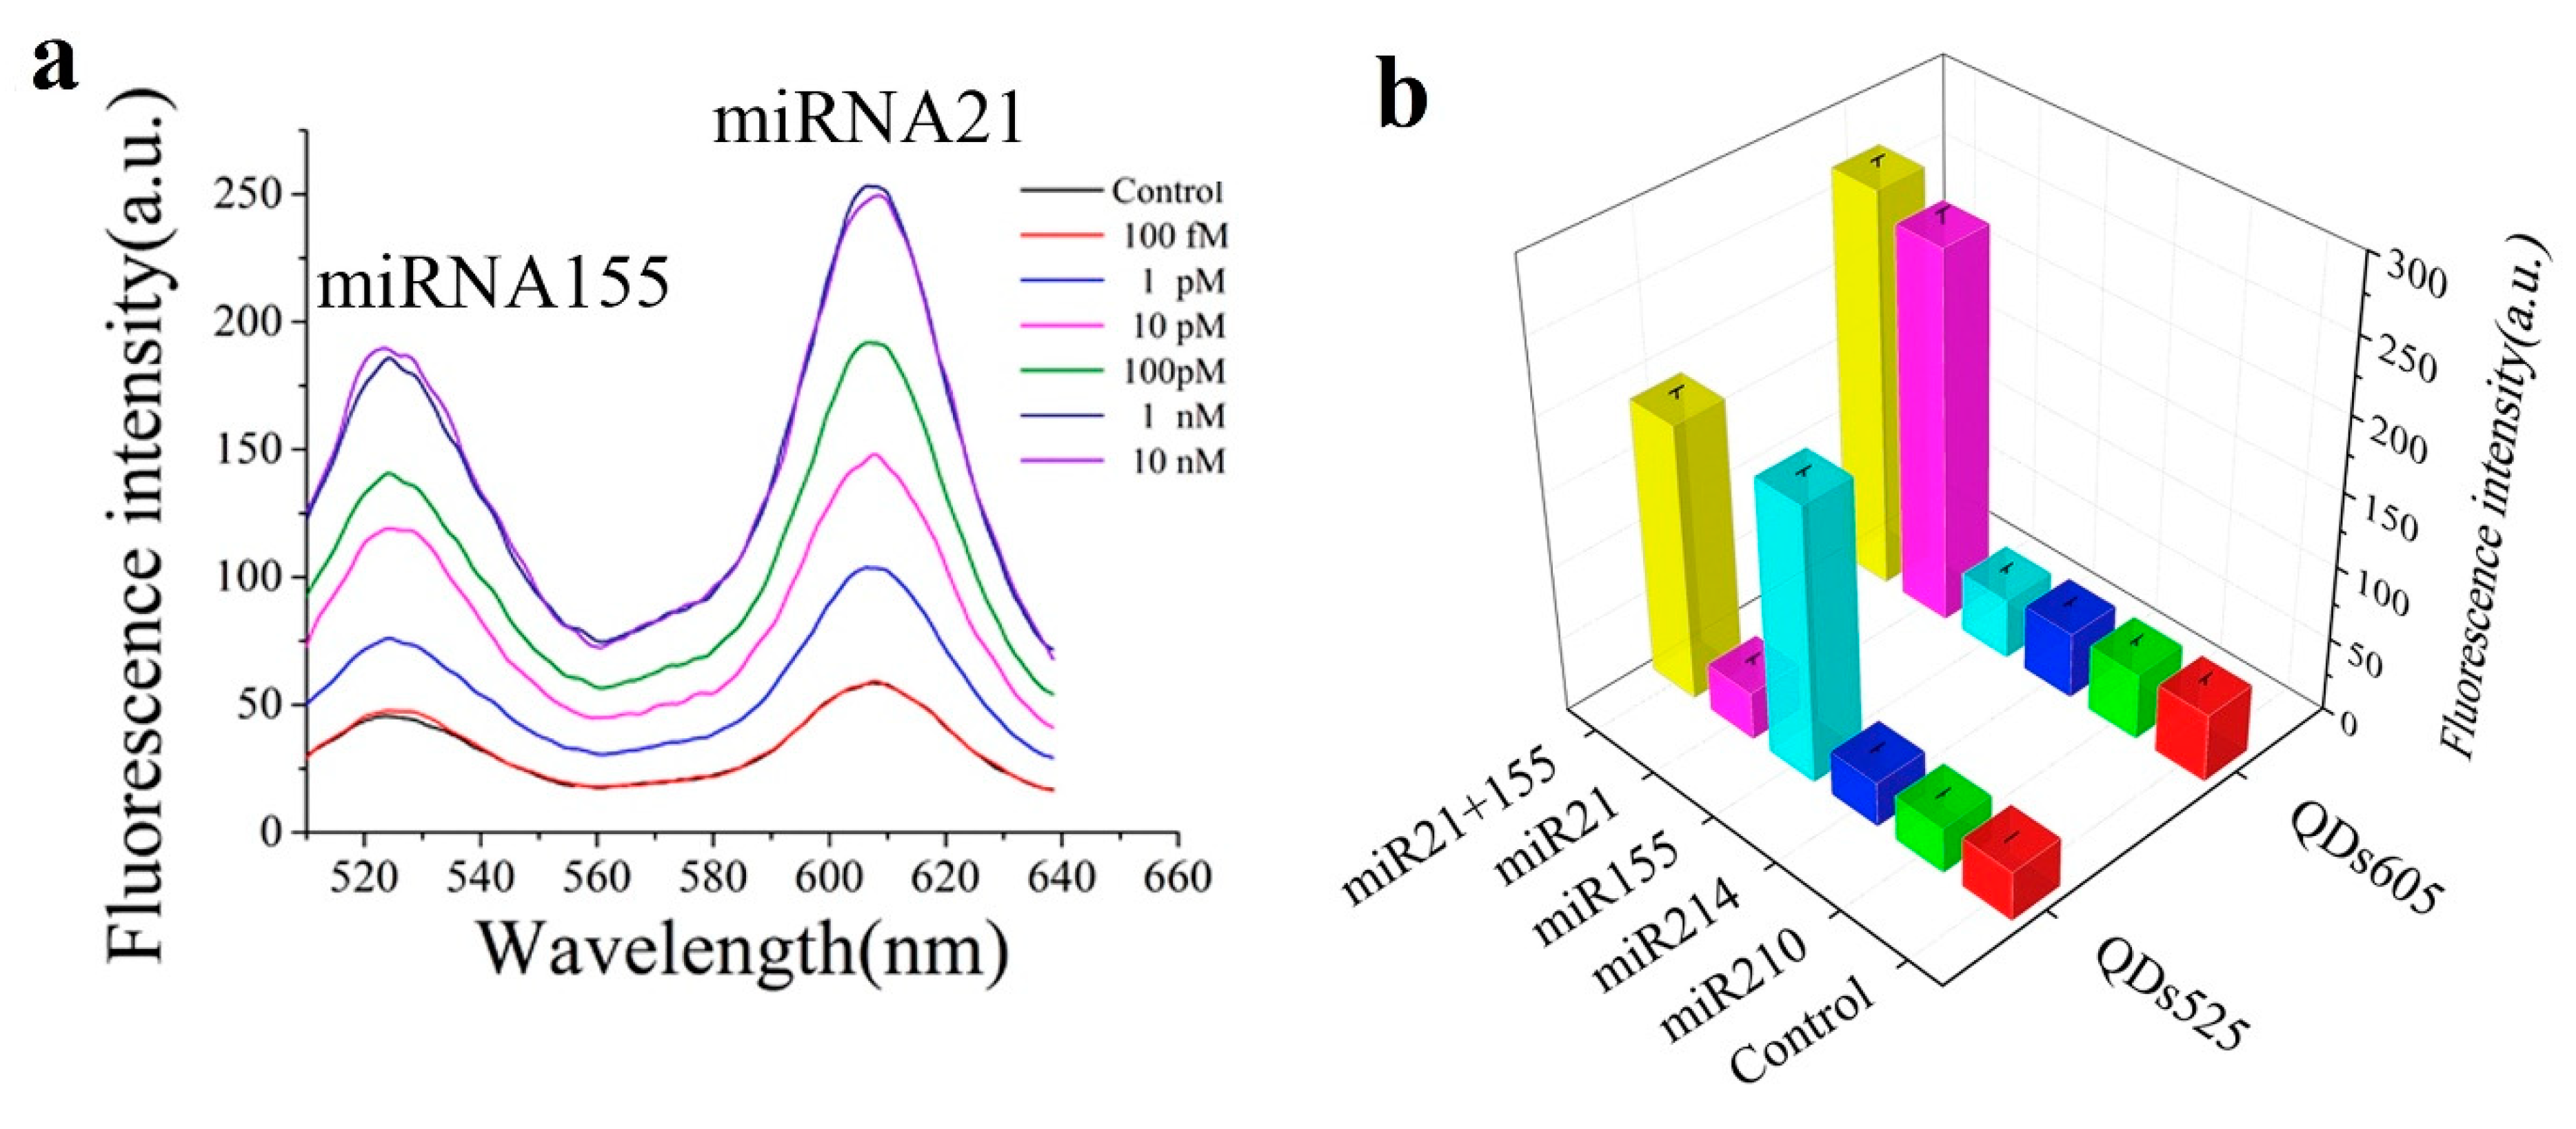
| miR-21, miR-155 | 1 pM–1 nM (both) | 1 pM (b) (both) | Blank, miR-210-3p, miR-214 | Nano-photon switch based on QD and GO for multiple miRNA detection by FRET | [55] | |
| miR-21 (c), miR-16, miR-31, miR-155 | 1 pM–10 nM (a) (miR-21) | 0.4 pM (miR-21) | Cross specificity among all, miR-16 and two one-base mismatched miR-21 (miR-21) | Fluorometric system using rolling circle amplification (RCA), GO and fluorophores. | [56] | |
| miR-9 (c) | 500 fM–300 pM | 500 fM (LOQ) | - | 45 miRNAs studied in 16 tissues using a 5-laser single molecule detection platform | [57] | |
| let-7a | - | 1 pM (b) | let-7b, let-7c-5p-5p, let-7d | |||
| miR-125a (c) | 10 fM–100 pM | 10.3 fM | One and two-base mismatched miR-125a | Detection based on rGO-assisted rolling circle amplification (RCA) and SYBR Green I | [58] | |
| let-7a | - | 100 fM (b) | let-7b, let-7c-5p, let-7d | |||
| cDNA miR-126 (miR-126 is fixed) | 20 fM–100 pM | ∼3.0 fM | cDNA miR-126 with mismatched bases (1, 2 or 3), cDNA let-7d, cDNA miR-21, cDNA miR-122, cDNA miR-141 | Method using GO, DNA probe with FAM and site specific cleavage using RsaI endonuclease | [59] | |
| Absorbance | miR-155 | 100 aM–100 fM | 100 aM | 3-base mismatched miR-155, other DNA | MiRNA detection with citrate-capped Au NPs and PEI capped-Au NPs | [60] |
| SPR | miR-21 (c) | 10 fM–100 pM | 3 fM | Blank, miR-141, miR-143 | SPR sensor with Au and rGO film that uses DSN for signal amplification | [61] |
| let-7b | - | 10 fM (b) | Blank, let-7a, let-7c-5p, let-7e | |||
| miR-15a | 5 fM–0.5 nM | 0.56 fM (LOQ: 5 fM) | Other DNA sequences | SPRi sensor with isolated Au islands that employs orthogonal signal amplification | [62] | |
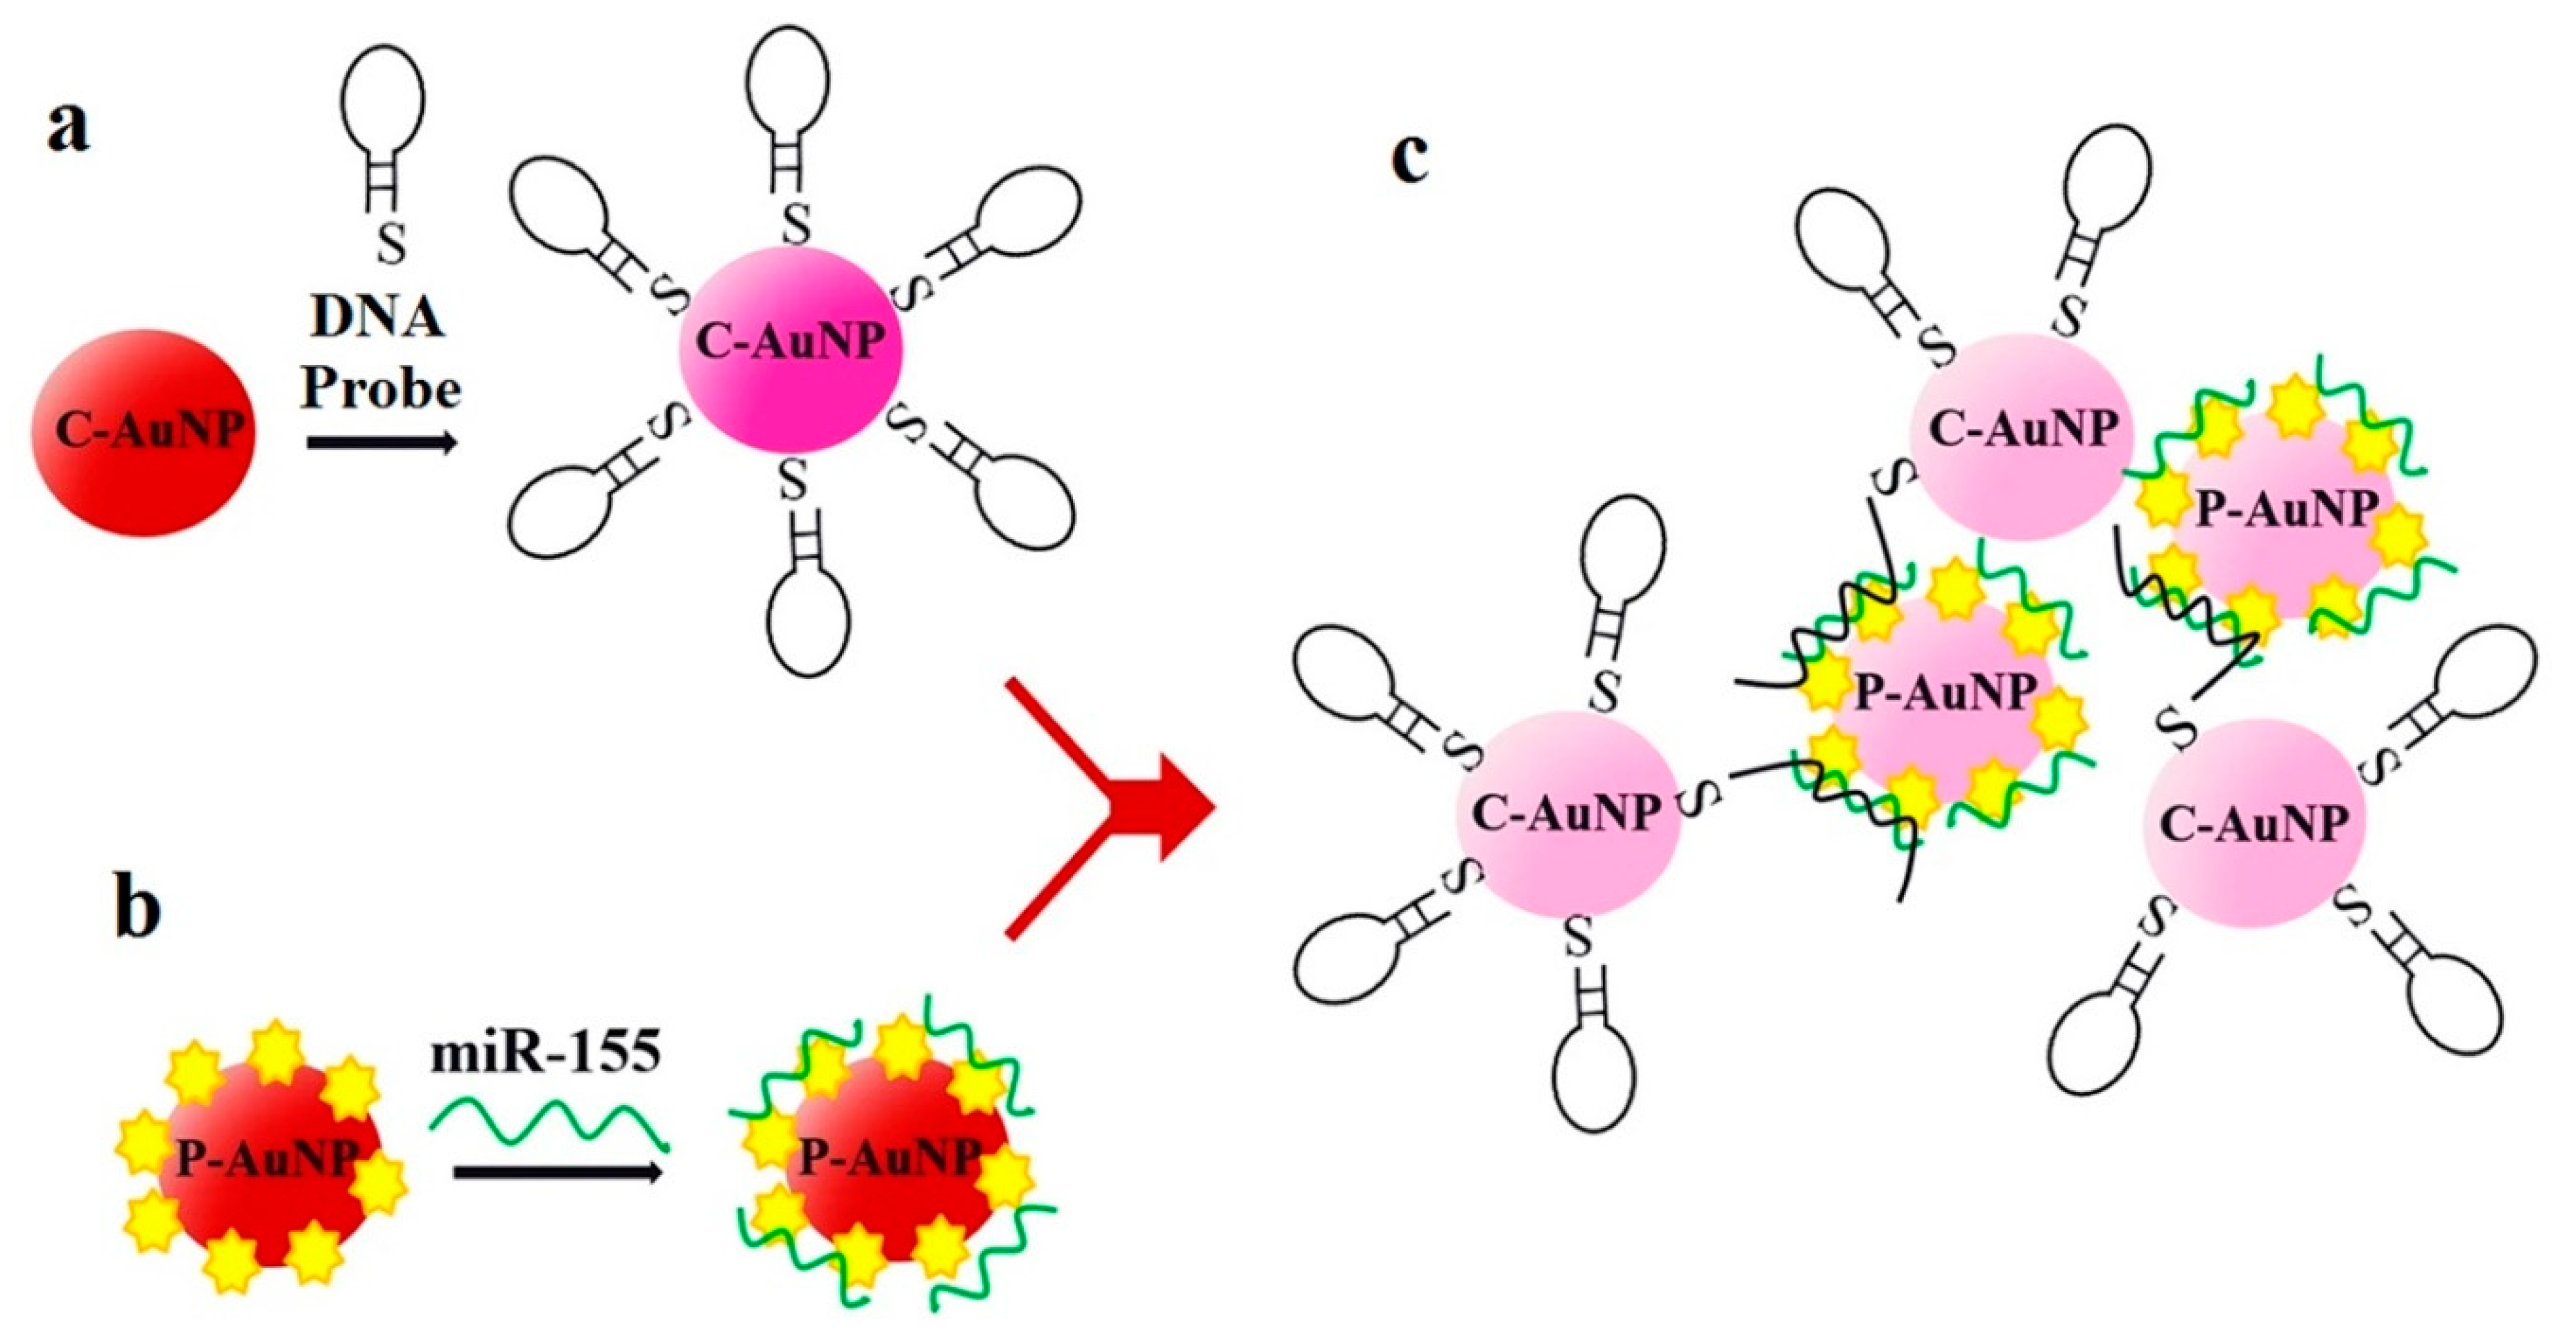
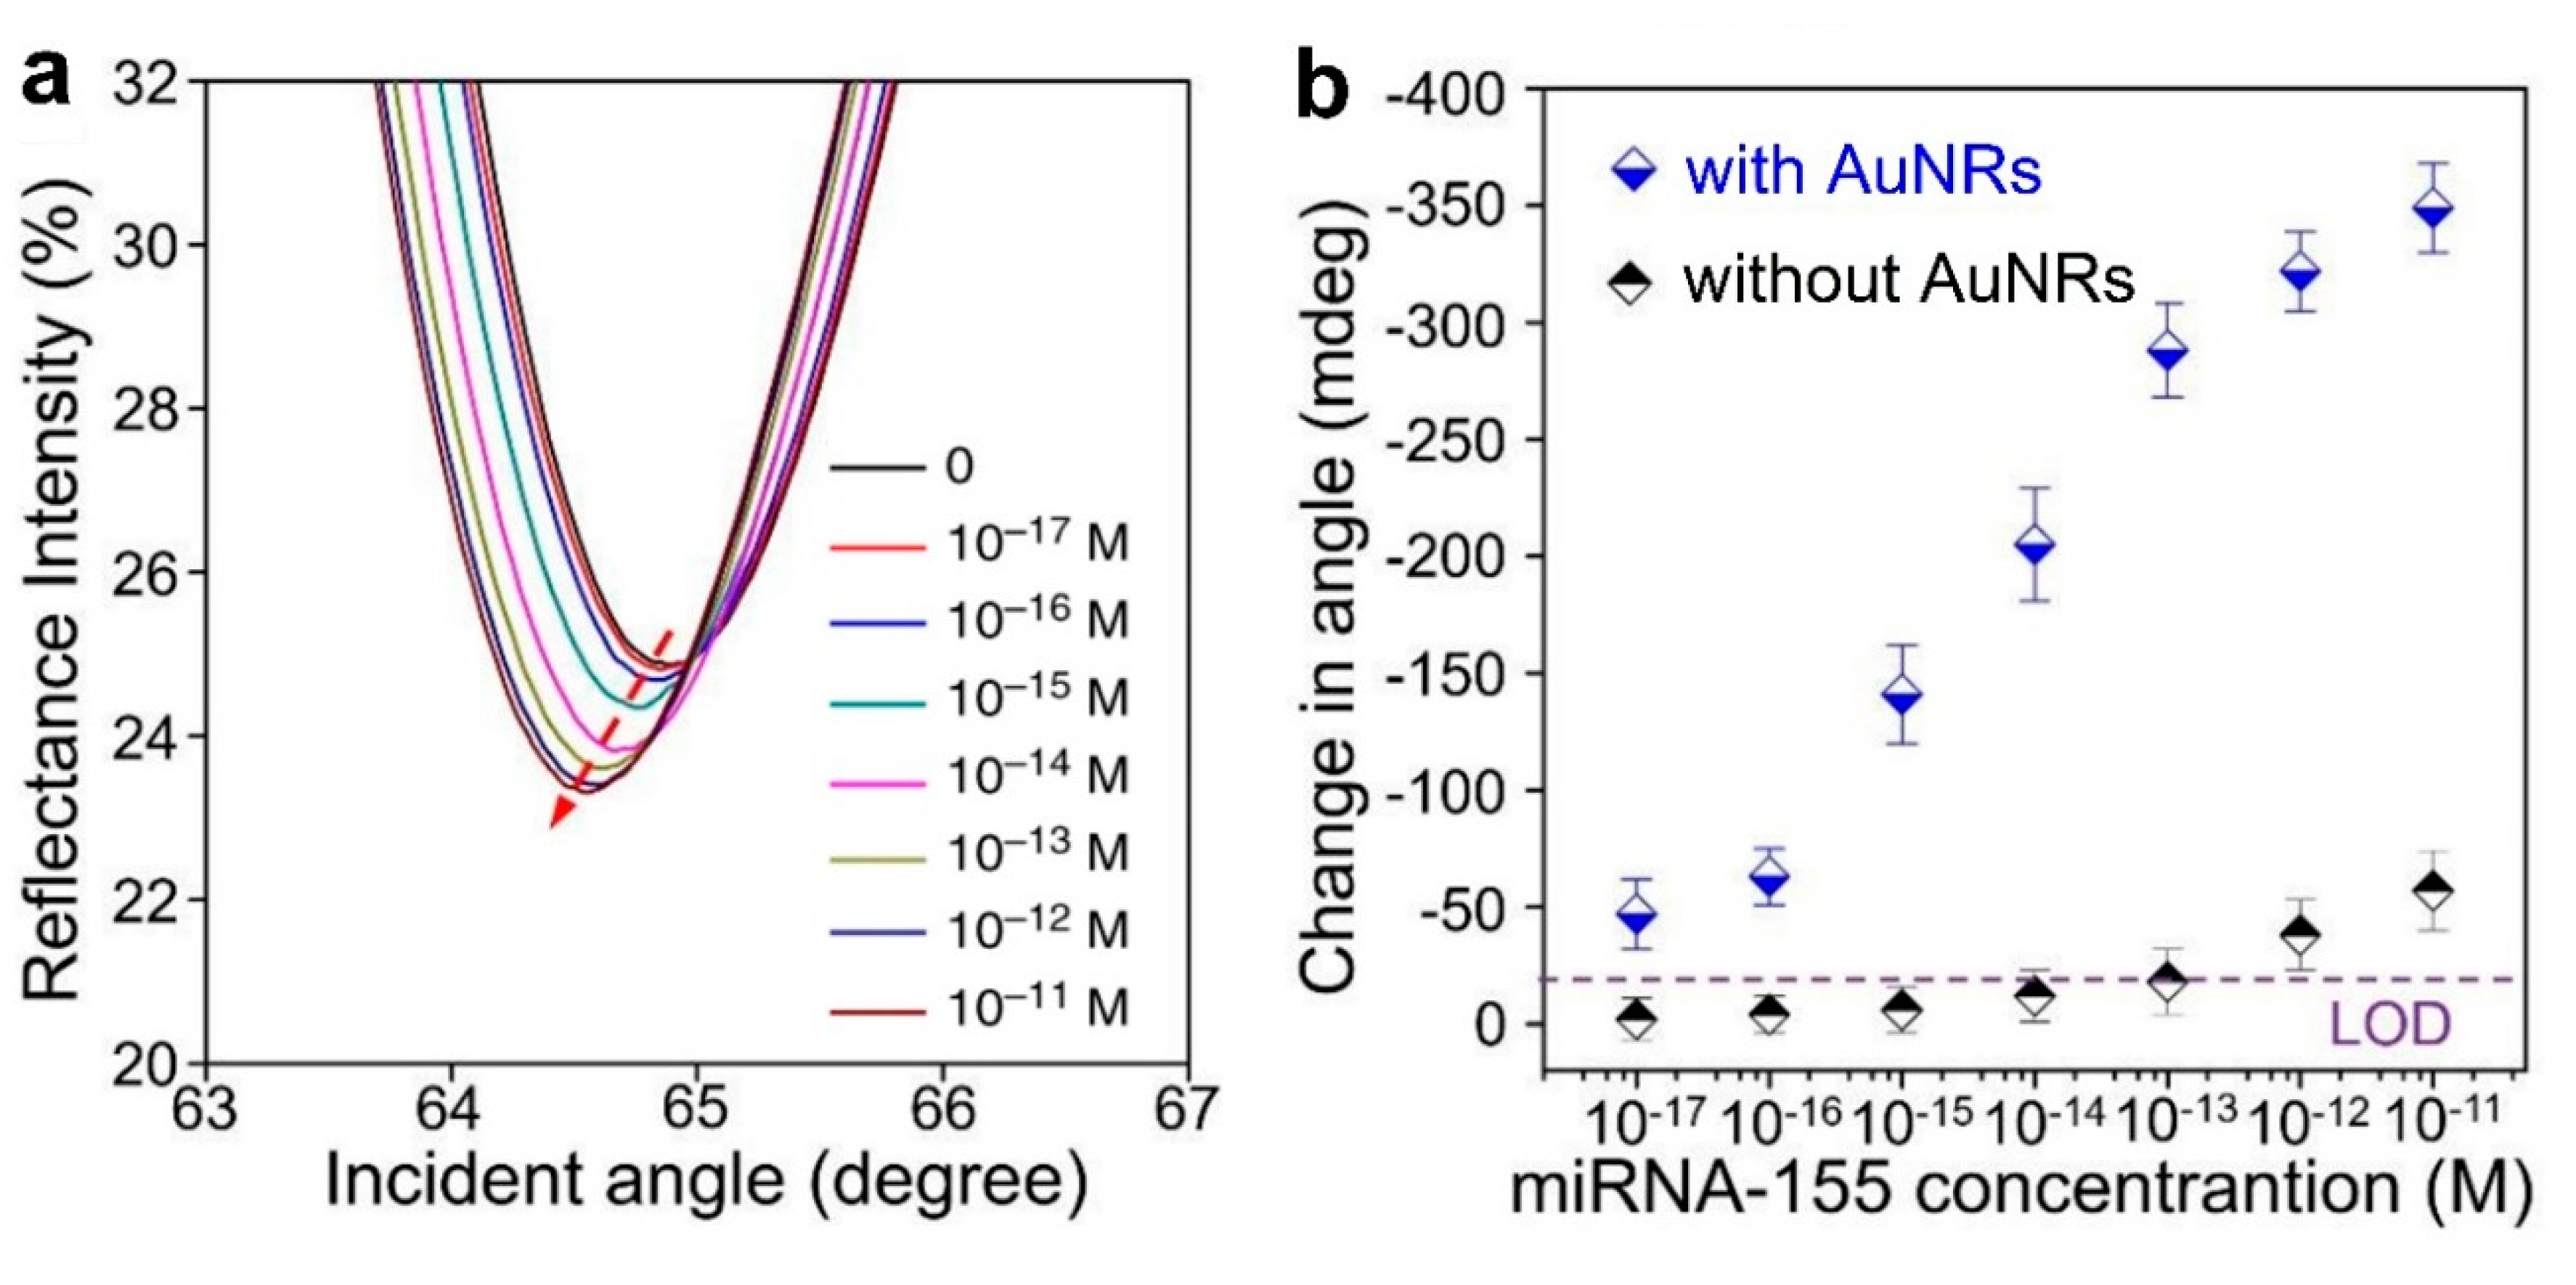
| miR-21, miR-155 | 10 aM–10 pM (a) (both) | 10 aM (both) | Mismatched miRNA that differs in 1 base (both) | SPR sensor based on two dimensional antimonene nanomaterial and Au nanorods | [63] | |
| LSPR | miR-21 | 10 pM–100 nM (a) | 23–35 fM | miR-16, miR-122, miR-126*, miR-141 | Regenerative label-free LSPR sensor based on Au nano prisms | [64] |
| Silicon Photonic Microring resonators | let-7c-5p | 4–250 nM | 4 nM (b) | Cross-specificity among the 4 miRNAs, let-7b (only for let-7c-5p) | Label-free miRNA detection in 10 min using arrays of microring resonators | [65] |
| miR-21 | 4–250 nM | 4 nM (b) | ||||
| miR-24 (d) | 1.95 nM–2 μM | 1.95 nM (b) | ||||
| miR-133b | 62.5 nM–1 μM | 62.5 nM (b) | ||||
| miR-21 | 20 nM–2 μM | 9 nM | Cross-specificity among the 7 miRNAs | Multiplexed miRNA detection via enzymatic signal amplification | [66] | |
| miR-26a | 20 nM–2 μM | 4 nM | ||||
| miR-29a | 2 nM–2 μM | <1 nM | ||||
| miR-106a | 2 nM–2 μM | 2 nM | ||||
| miR-222, miR-335 | 2 nM–2 μM | 1 nM | ||||
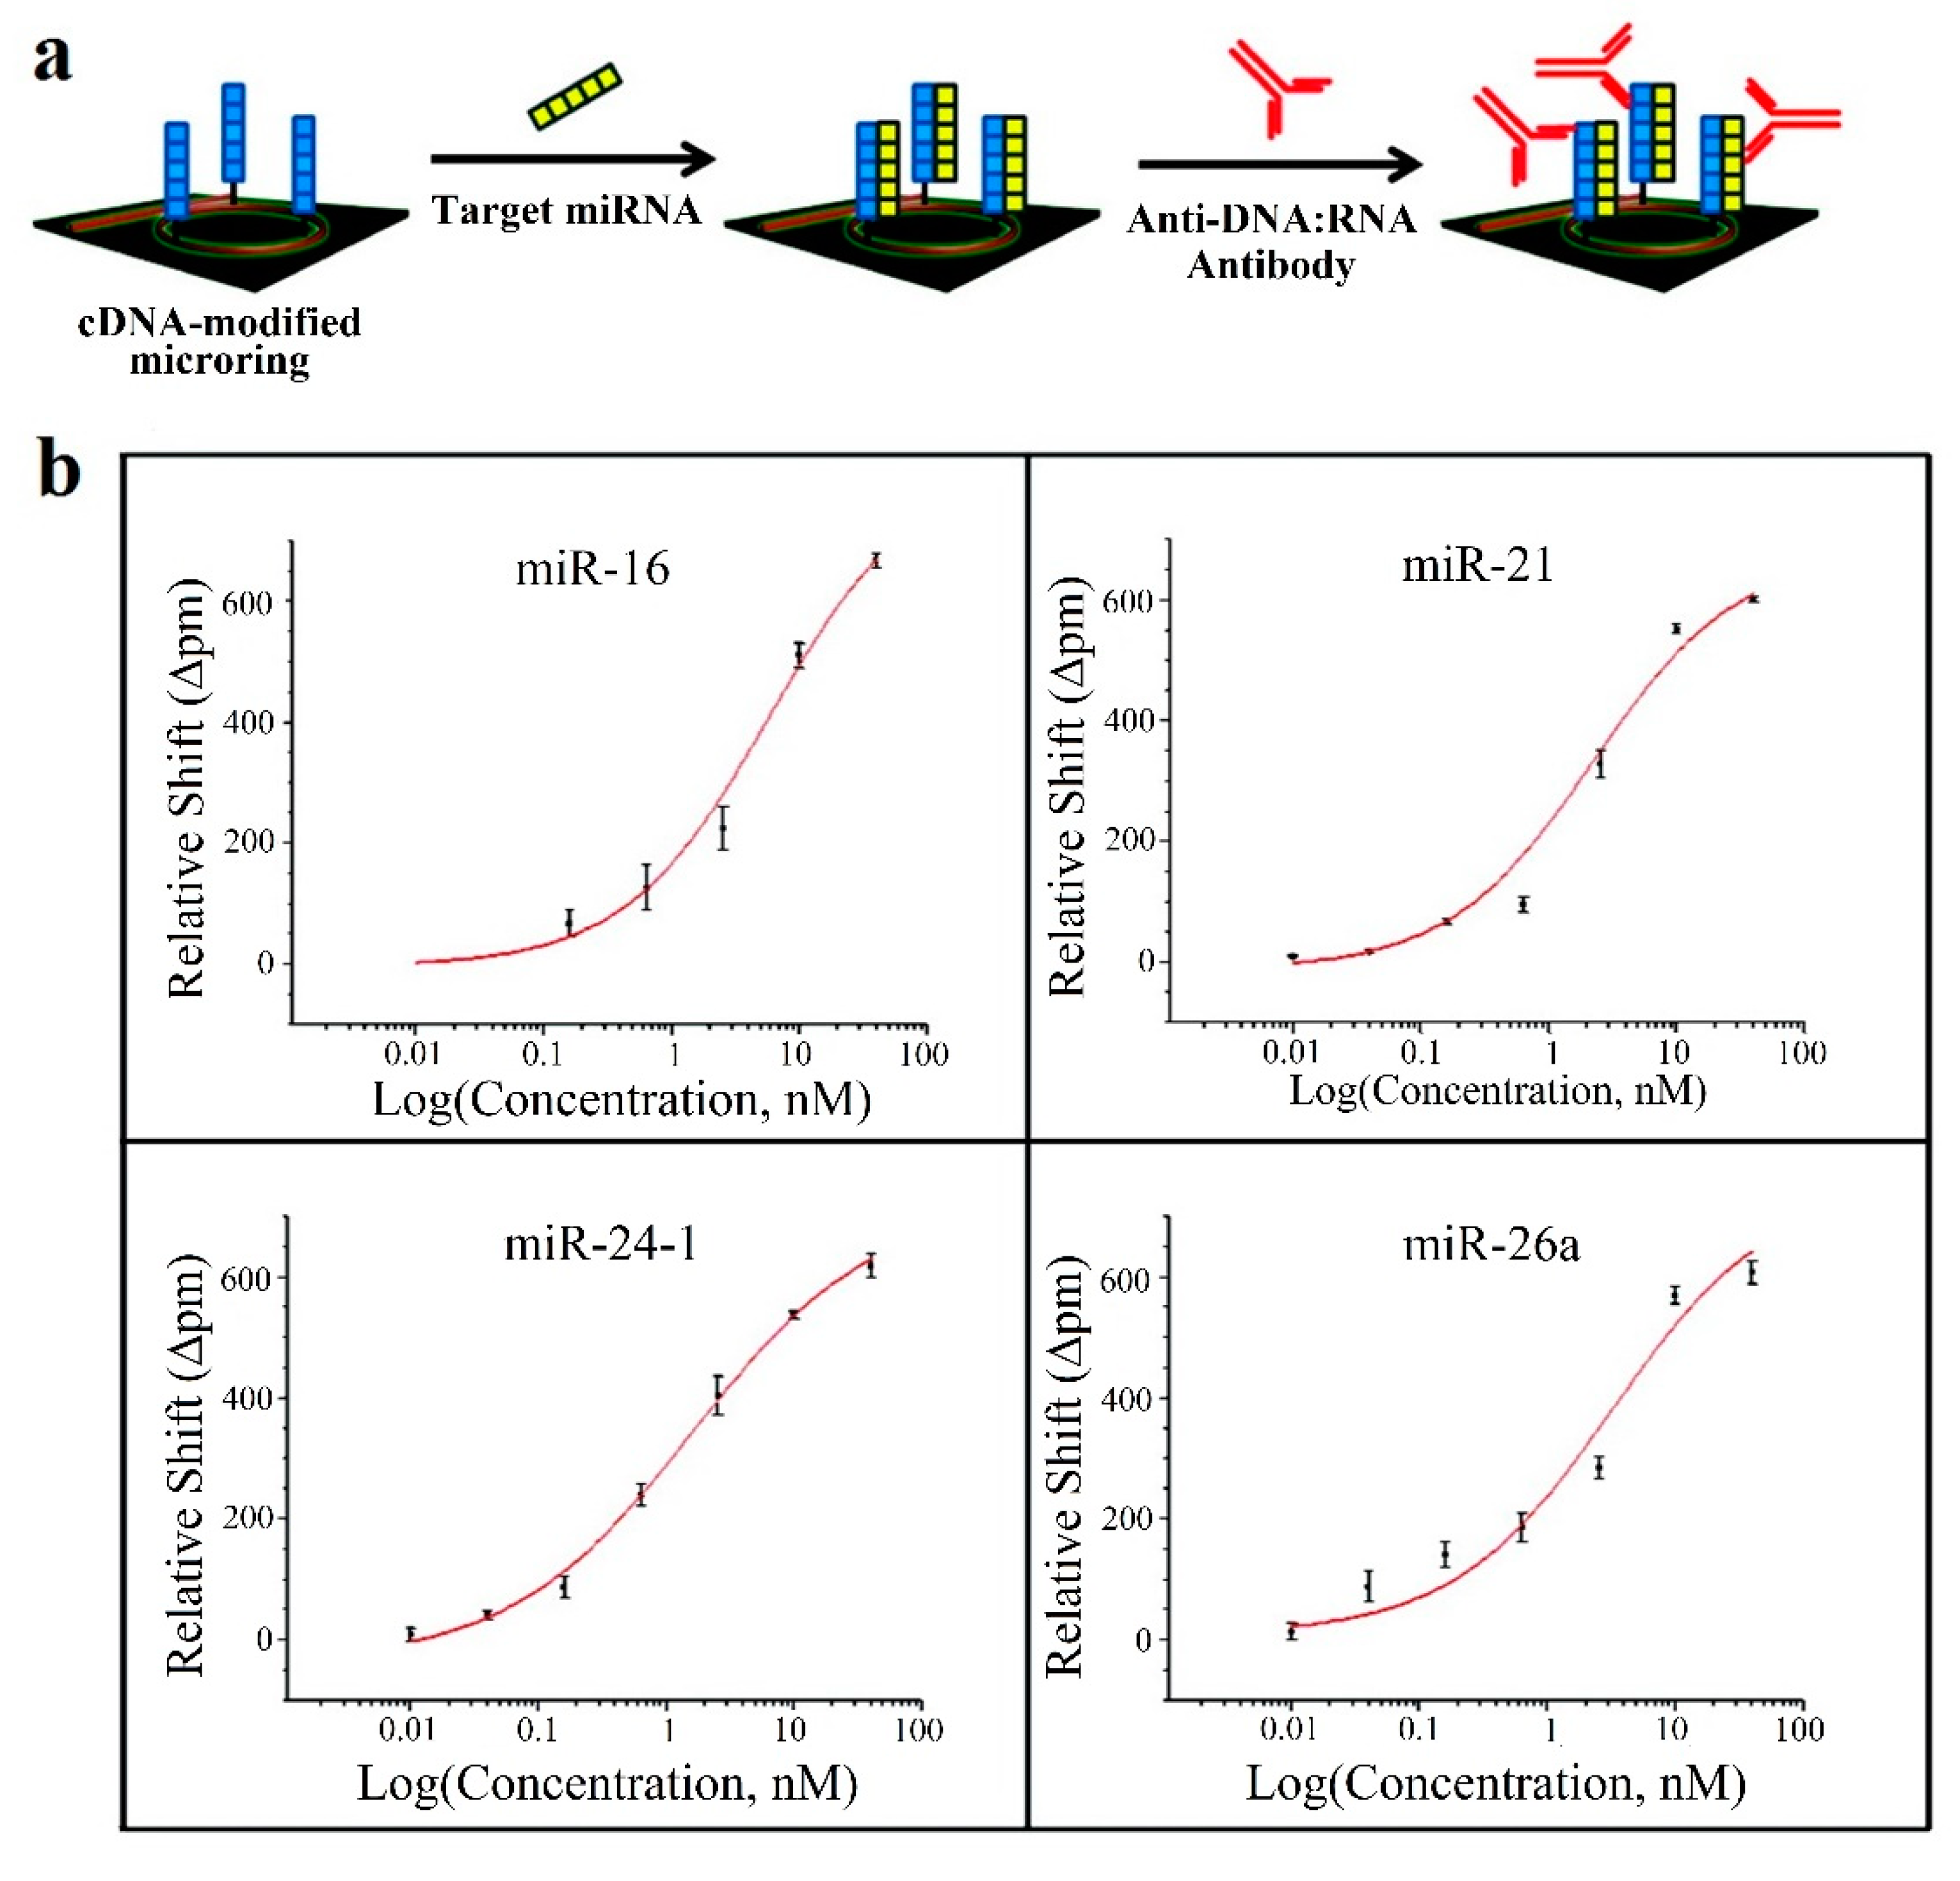
| miR-16 | 160 pM–40 nM (a) | 160 pM (b) | Cross-specificity among the 4 miRNAs | Microring resonator arrays with amplification using an anti DNA:RNA antibody | [67] | |
| miR-21, miR-24 (d), miR-26a | 10 pM–40 nM (a) | 10 pM (b) | ||||
| Interferometry | miR-21, let-7a | 1 nM–1 μM (both) | 1 nM (both) | miR-122 (miR-21), let-7c-5p (let-7a) | Label-free detection in 15 min with a Mach–Zehnder interferometer (MZI) | [68] |
| let-7a | 2 nM–20 μM | 212 pM | let-7b, let-7c-5p | Optofluidic sensor by assembling a μfiber in lateral contact with a silica capillary | [69] | |
| Surface Enhanced Raman Spectroscopy (SERS) | let-7a, miR-16 miR-133a-3p, (mixtures) | 6–150 μM (a) for all the miRNAs | - | let-7a is detected in a mixture that also contains miR-16, miR-21, miR-24 and miR-133a-3p | Ag nanorod-based SERS for miRNA identification in multicomponent mixtures | [70] |
| miR-21 | 10 fM–100 pM (a) | <10 fM | Blank, a random miRNA | SERS detection of multiple miRNAs using gold and silver nanoprobes and several dyes. | [71] | |
| miR-31 | 1 pM–10 nM (a) | 1 pM (b) | - | |||
| miR-141 | 1 pM–10 nM (a) | <10 fM | - | |||
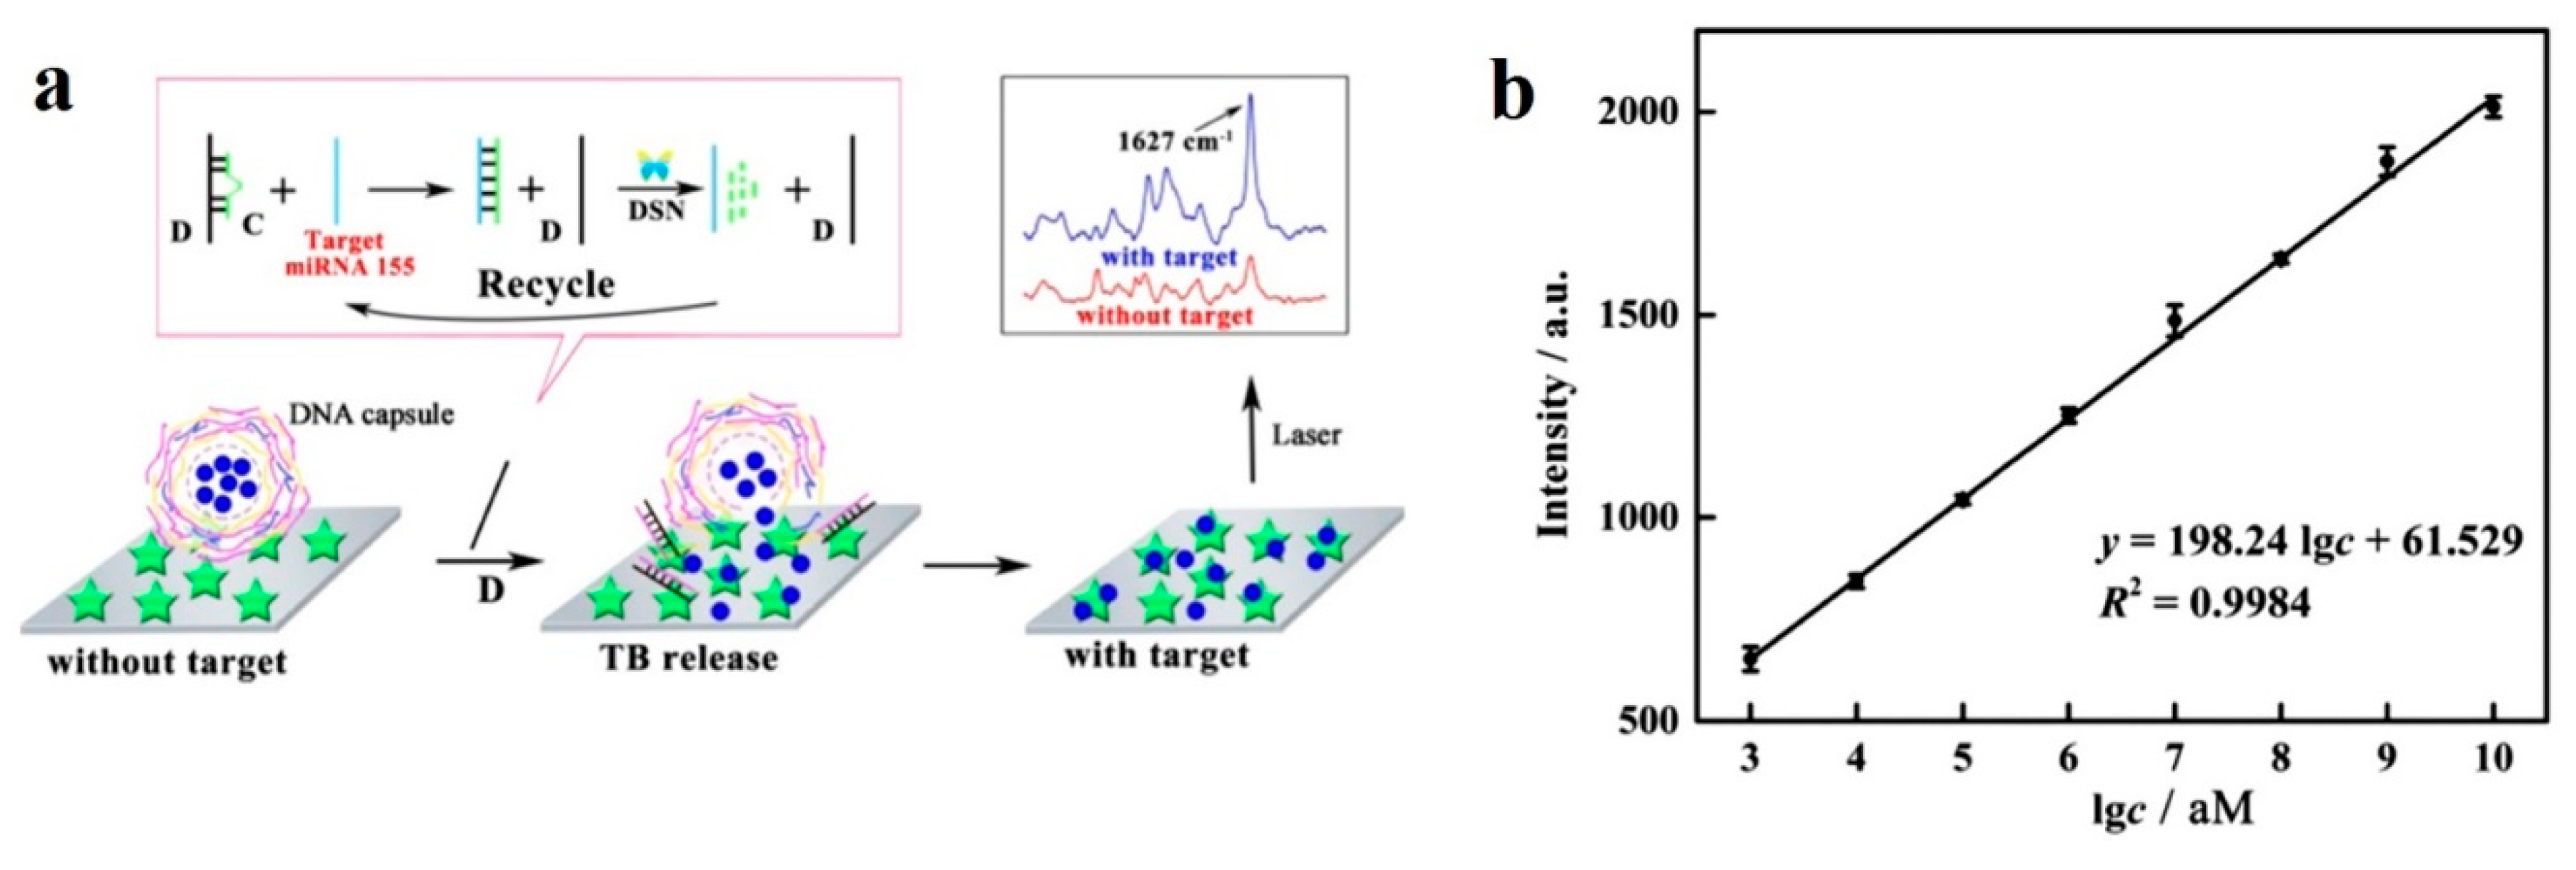
| miR-155 | 1 fM–10 nM | 0.67 fM | Blank, miR-21, miR-141, one base mismatched miR-155 | SERS combined with DSN amplification using toluidine blue (TB) and CaCO3 | [72] |
| miRNA | Other Names | Sequence | Ref. (Optical Sensors) | Ref. (RA) |
|---|---|---|---|---|
| hsa-miR-21-5p | hsa-miR-21 | UAGCUUAUCAGACUGAUGUUGA | [37,38,39,40,41,42,43,44,45,46,47,48,49,54,55,56,61,63,64,65,66,67,68,71], [52,70,72] (c), [59] (c),(d) | [21,23,24] |
| hsa-let-7a-5p | hsa-let-7a | UGAGGUAGUAGGUUGUAUAGUU | [50,51,52,53,57,58,68,69,70], [39,43,61] (c) | [73,74] |
| hsa-let-7b-5p (a) | hsa-let-7b | UGAGGUAGUAGGUUGUGUGGUU (2) | [61], [39,43,51,52,53,57,58,65,69] (c) | [75] |
| hsa-let-7c-5p (a),(b) | - | UGAGGUAGUAGGUUGUAUGGUU (1) | [65], [39,43,50,52,57,58,61,68,69] (c) | [76] |
| hsa-miR-9-5p | hsa-miR-9 | UCUUUGGUUAUCUAGCUGUAUGA | [57] | [77,78] |
| hsa-miR-15a-5p | hsa-miR-15a | UAGCAGCACAUAAUGGUUUGUG | [62] | [21] |
| hsa-miR-16-5p | hsa-miR-16 | UAGCAGCACGUAAAUAUUGGCG | [56,57,67,70], [64] (c) | [21,22,79] |
| hsa-miR-24-3p | hsa-miR-24 | UGGCUCAGUUCAGCAGGAACAG | [65,67], [70] (c) | [35] |
| hsa-miR-26a-5p | hsa-miR-26a | UUCAAGUAAUCCAGGAUAGGCU | [66,67], [40] (c) | [35,74] |
| hsa-miR-29a-3p | hsa-miR-29a | UAGCACCAUCUGAAAUCGGUUA | [66] | [80] |
| hsa-miR-31-5p | hsa-miR-31 | AGGCAAGAUGCUGGCAUAGCU | [56,71] | [22] |
| hsa-miR-106a-5p | hsa-miR-106a | AAAAGUGCUUACAGUGCAGGUAG | [66] | [81] |
| hsa-miR-125a-5p | hsa-miR-125a | UCCCUGAGACCCUUUAACCUGUGA | [58] | [35] |
| hsa-miR-126-3p | hsa-miR-126 | UCGUACCGUGAGUAAUAAUGCG | [59] (d) | [35] |
| hsa-miR-133a-3p | - | UUUGGUCCCCUUCAACCAGCUG | [70] | [82] |
| hsa-miR-133b | - | UUUGGUCCCCUUCAACCAGCUA | [65] | [35] |
| hsa-miR-141-3p | hsa-miR-141 | UAACACUGUCUGGUAAAGAUGG | [54,71], [38,61,64,72] (c), [59] (c),(d) | [83] |
| hsa-miR-155-5p | hsa-miR-155 | UUAAUGCUAAUCGUGAUAGGGGUU | [56,60,63,72], [44] (c) | [21,84] |
| hsa-miR-222-3p | hsa-miR-222 | AGCUACAUCUGGCUACUGGGU | [66] | [85] |
| hsa-miR-335-5p | hsa-miR-335 | UCAAGAGCAAUAACGAAAAAUGU | [66] | [86] |
| miRNA (a) | Other Names | Sequence | Ref (Optical Sensors) |
|---|---|---|---|
| hsa-let-7d-5p (b) | hsa-let-7d | AGAGGUAGUAGGUUGCAUAGUU (2) | [57,58], [59] (d) |
| hsa-let-7e-5p (b) | hsa-let-7e | UGAGGUAGGAGGUUGUAUAGUU (1) | [38,50,51,53,61] |
| hsa-let-7f-5p (b) | hsa-let-7f | UGAGGUAGUAGAUUGUAUAGUU (1) | [50,51,53] |
| hsa-let-7g-5p (b) | hsa-let-7g | UGAGGUAGUAGUUUGUACAGUU (2) | [51,53] |
| hsa-let-7i-5p (b) | hsa-let-7i | UGAGGUAGUAGUUUGUGCUGUU (4) | [38,51,53] |
| hsa-miR-122-5p | hsa-miR-122a, hsa-miR-122 | UGGAGUGUGACAAUGGUGUUUG | [40,64,68], [59] (d) |
| hsa-miR-126-5p | hsa-miR-126* | CAUUAUUACUUUUGGUACGCG | [41,64] |
| hsa-miR-141-5p | hsa-miR-141* | CAUCUUCCAGUACAGUGUUGGA | [40] |
| hsa-miR-143-3p | hsa-miR-143 | UGAGAUGAAGCACUGUAGCUC | [61] |
| hsa-miR-200b-3p | hsa-miR-200b | UAAUACUGCCUGGUAAUGAUGA | [54] |
| hsa-miR-210-3p (c) | - | CUGUGCGUGUGACAGCGGCUGA | [45,48,49,55] |
| hsa-miR-214-3p | hsa-miR-214 | ACAGCAGGCACAGACAGGCAGU | [42,45,48,49,55] |
| hsa-miR-429 | - | UAAUACUGUCUGGUAAAACCGU | [54] |
| Optical Technique/Principle | Linear Dynamic Range | LOD | Matrix | Specificity Assays | Comments | Ref. |
|---|---|---|---|---|---|---|
| SPR | 2–5 mg/L | 1 mg/L | PBS buffer | - | SPR chip with Au surface that uses 2 CRP antibodies for entrapment and detection | [135] |
| 1.25–80 μg/L (a) | 1.2 μg/L (LOQ: 4.6 μg/L) | HBS buffer, diluted human plasma, diluted human serum, diluted human whole blood | HSA, LCN2, HFA, IL-1β, IL-6, IL-8, TNF-α | Au coated SPR chip functionalized with protein A/G | [136] | |
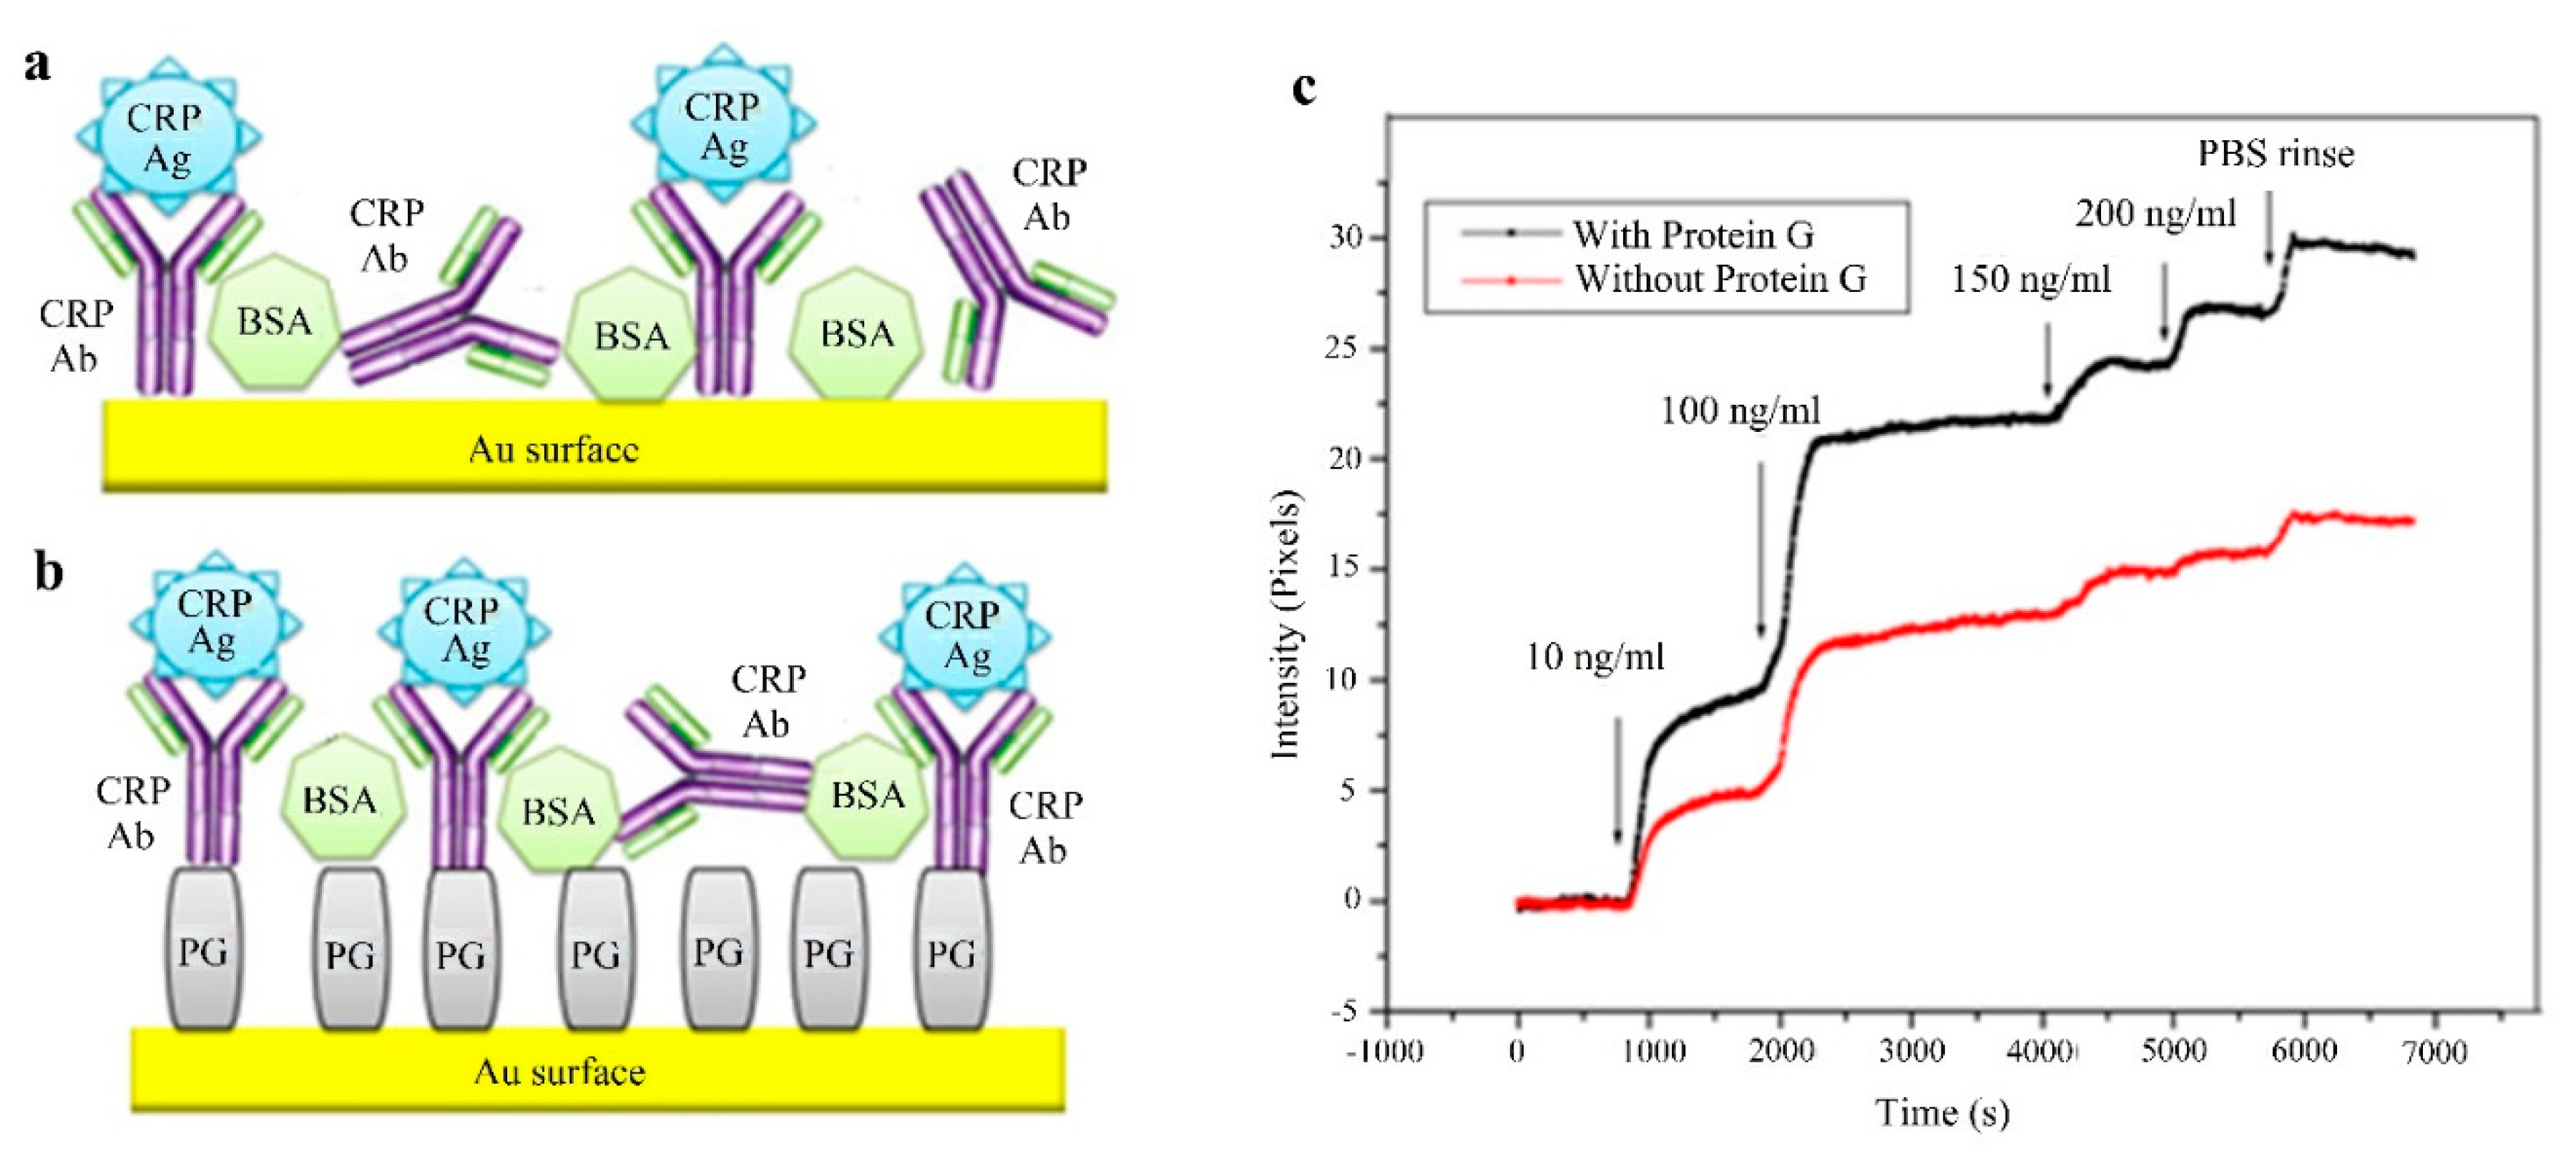
| 10 ng/L–100 μg/L (a) (with PG in PBS), 10 μg/L–200 μg/L (a) (with PG in plasma) | 10 ng/L (with PG in PBS), 5 μg/L (with PG in plasma) | PBS buffer and diluted human plasma in PBS | Rabbit antigen | SPRi biosensor with Au surface with immobilized Ab without and with protein G | [137] | |
| LSPR | 50 μg/L–25 mg/L (PBS) | 50 μg/L (PBS) | PBS buffer and diluted blood serum (10 times) in PBS | - | Label-free sensor that measures the OD change with 2 antibodies for capture and detection | [138] |
| 50 μg/L–3 mg/L (a) (buffer) | ~50 μg/L (buffer) | Tris-HCl modified buffer and 1% diluted human serum in buffer | HSA | LSPR sensor based on Au NPs on which PMPC was grafted using ATR polymerization | [139] | |
| 10 μg/L–10 mg/L | 11.28 μg/L | PBS buffer | Hb, TF and HSA (separately and in mixture) | Cuvette cell system that uses Au NPs and a substrate modified with APTES | [140] | |
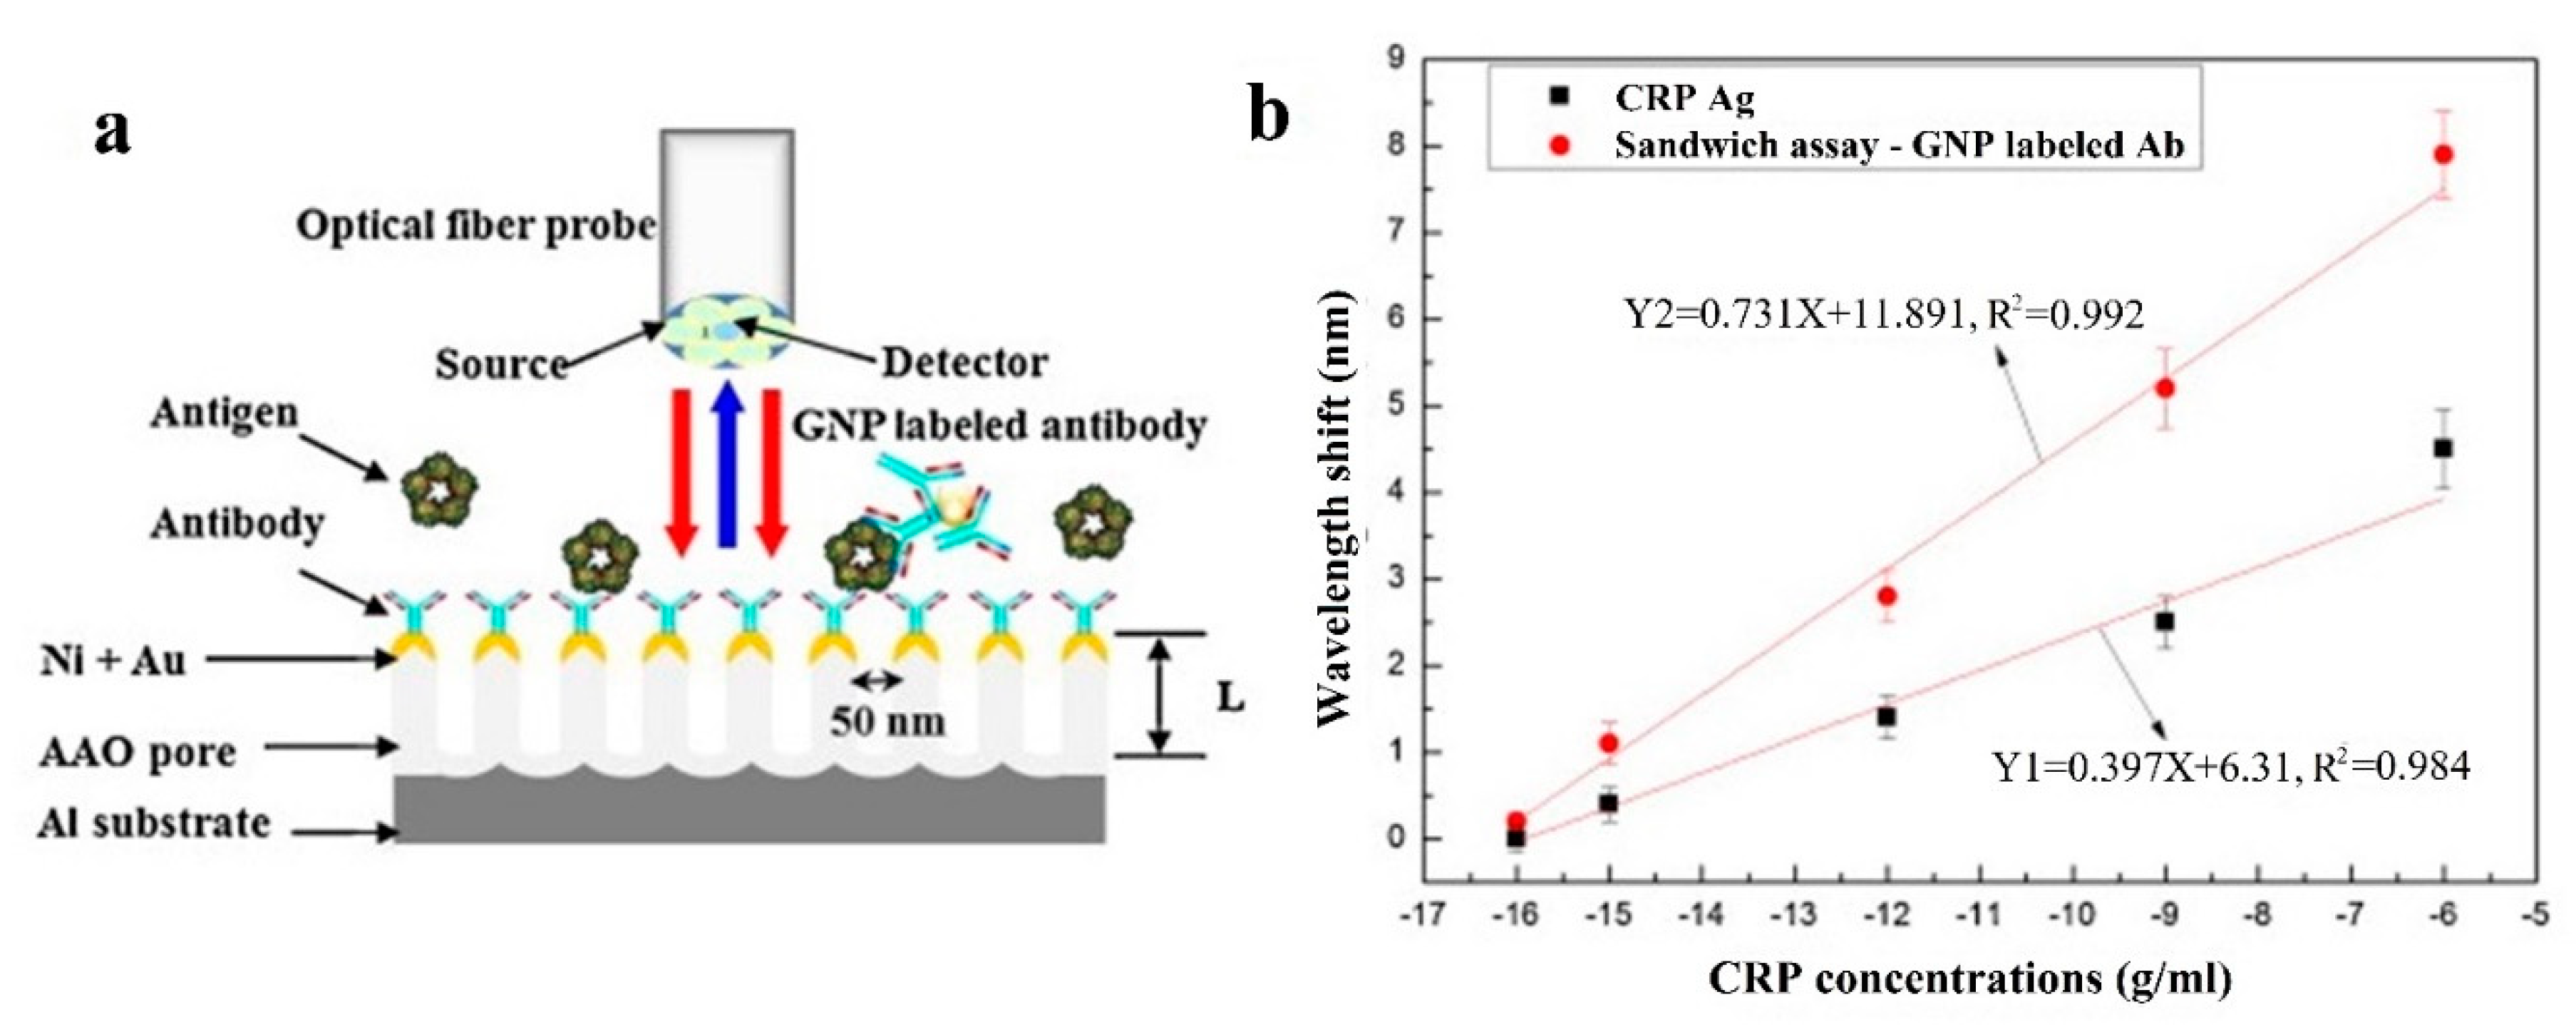
| 100 fg/L–1 mg/L | 100 fg/L | Tris-HCl buffer | - | LSPR biosensor based on nanostructured AAO substrates with Au NP labelled Ab | [141] | |
| LMR | 62.5 µg/L–1 mg/L (a) | 62.5 µg/L | TBS buffer | Urea and creatinine | LMR sensor with ITO film using the layer by layer (LbL) technique | [142] |
| Refractive index change | 100 μg/L–10 mg/L (a) | 100 μg/L (b) | Diluted human serum (10 times) in PBS buffer | - | Label-free metal clad leaky waveguide (MCLW) sensor with nitrocellulose | [143] |
| Etched Fiber Bragg gratings (eFBG) | 10 μg/L–100 mg/L | 10 µg/L | Deionized water | Urea, glucose, and creatinine | Graphene oxide (GO) coated eFBG sensor | [144] |
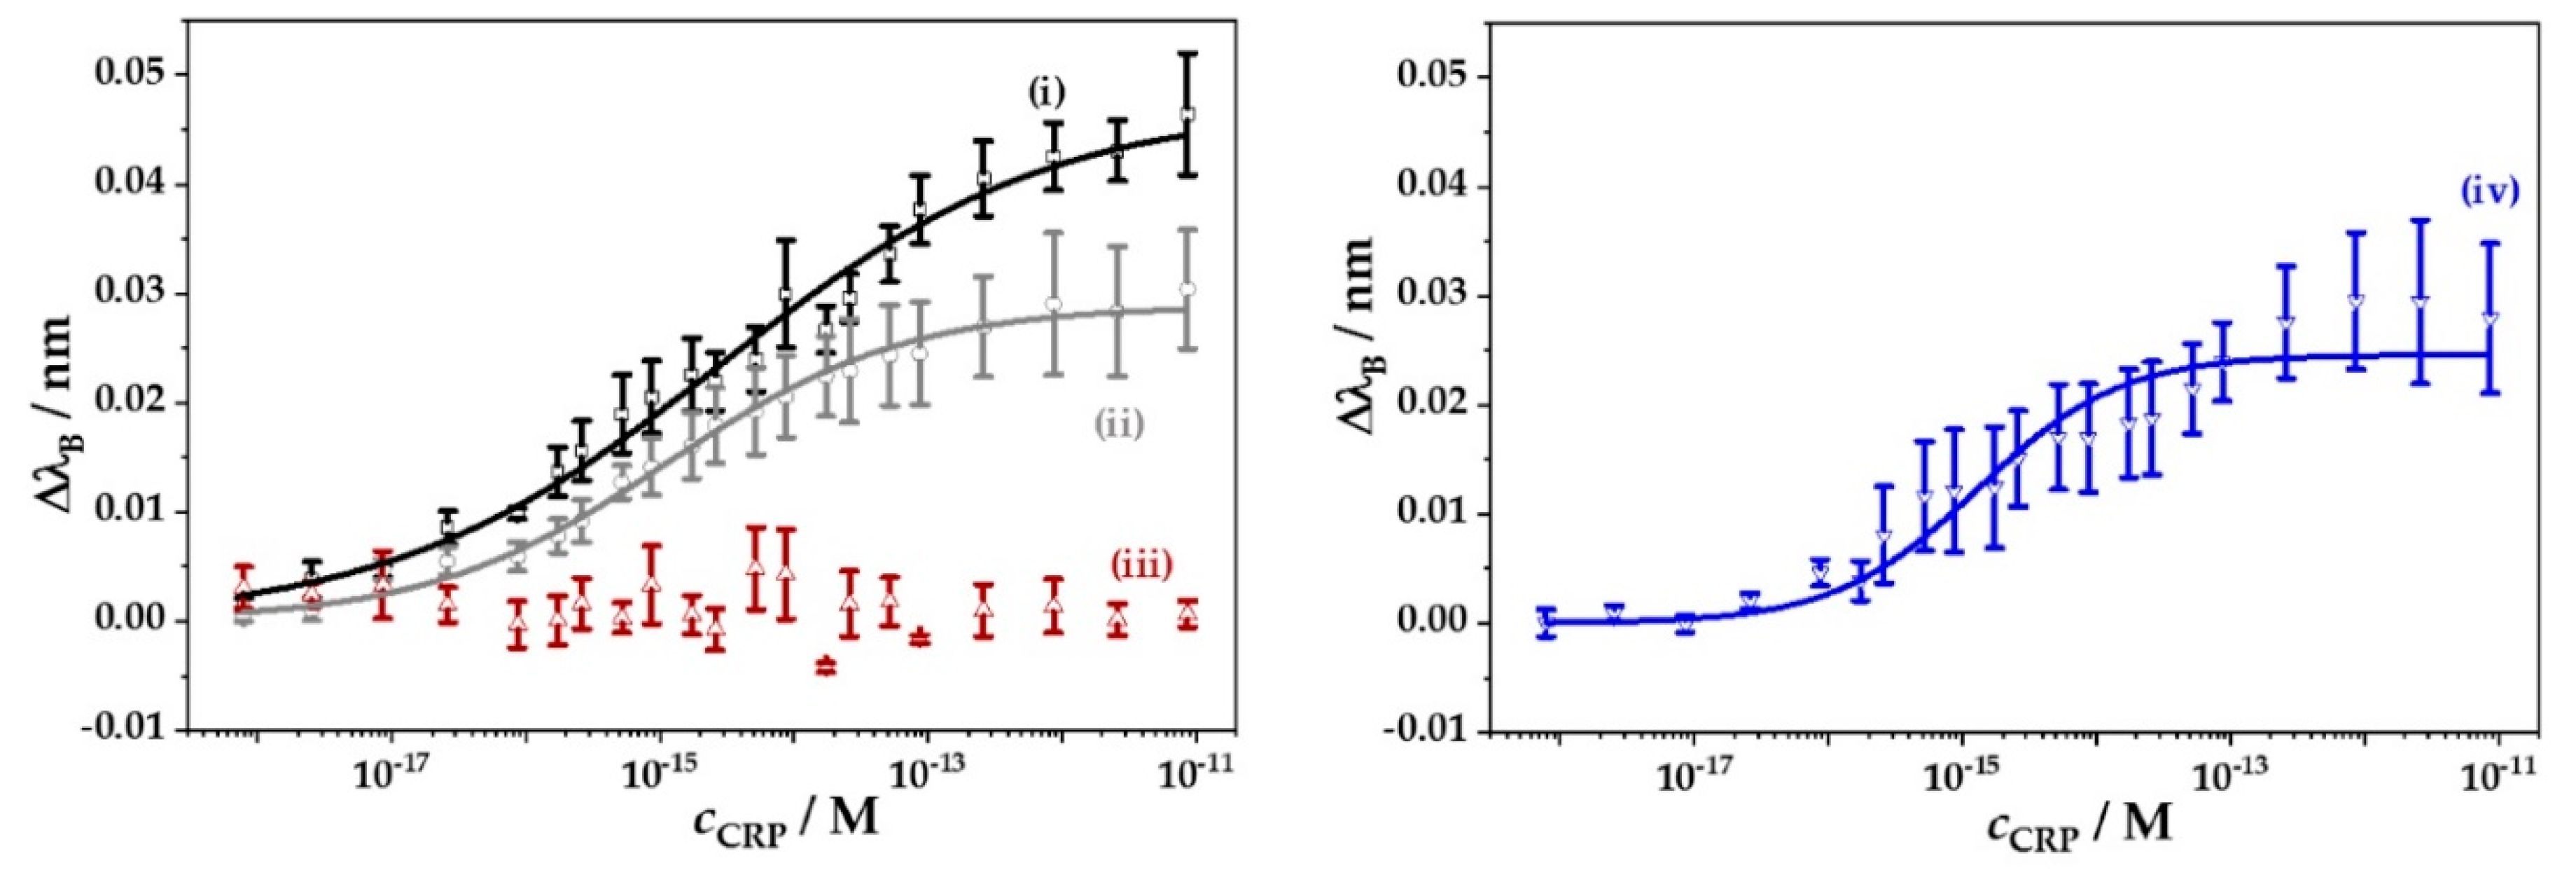
| 0.8 pg/L–1.2 µg/L (c) (buffer) | 0.82 pg/L (buffer), 27.6 pg/L (plasma) | Modified aptamer buffer and diluted CRP deficient human plasma | Urea and ascorbic acid | Gratings fabricated using a femtosecond pulsed laser and etching done with hydrofluoric acid | [145] | |
| Reflectometric interference spectroscopy (RIfS) | 50–400 µg/L | 63.8 µg/L | HBS-P buffer | BSA, HSA | RIfS based sensor with two TiO2 layers prepared by liquid phase deposition (LPD), sensitive layer includes anti-CRP and PL | [146] |
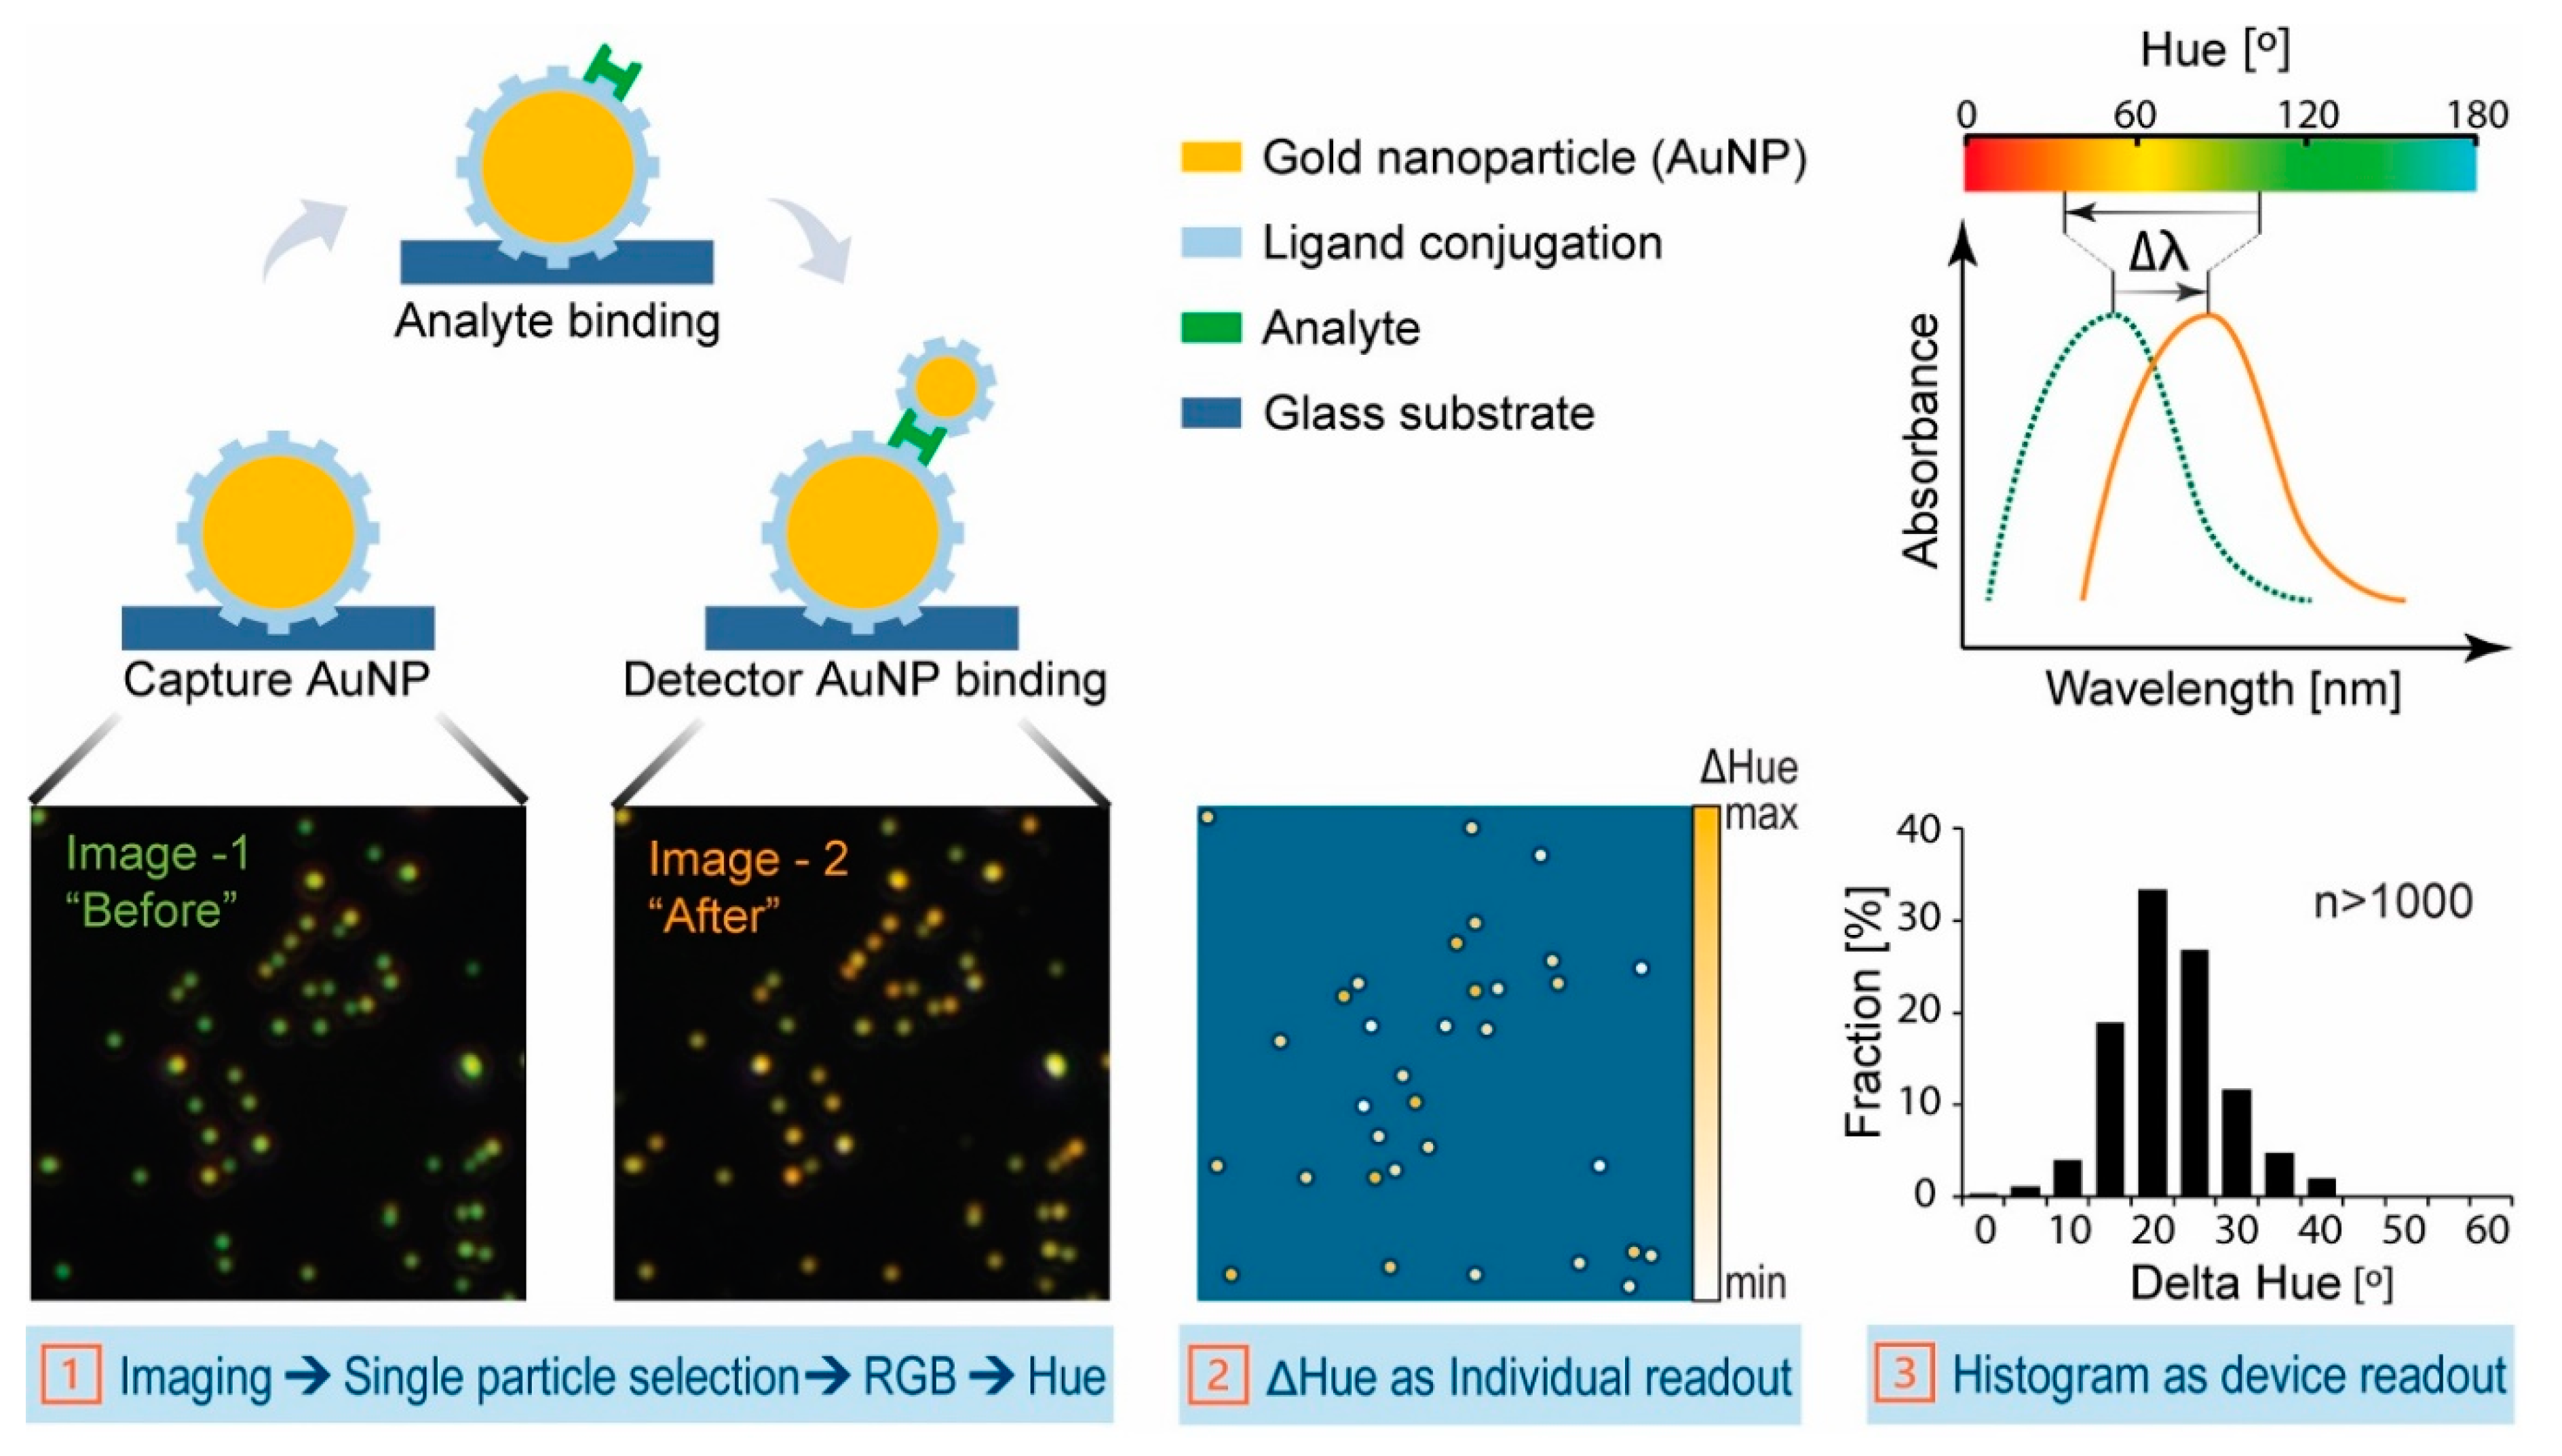
| Colorimetry | 1 μg/L–10 mg/L (DI water) | 1 µg/L (DI water) | Deionized water and human serum spiked with CRP | - | Swarm biosensing platform based on the plasmonic signal from Au NPs sensors. | [147] |
| Photoluminescence | 75 ng/L–1.65 mg/L (diluted PBS) | 45 ng/L (diluted PBS) | 100 times diluted PBS and human serum spiked with CRP | GA, thrombin, TF, TNF-α used as control proteins | Nanosensor based on DNA aptamer attached to a QD and a Au NP | [148] |
| Fluorescence | 1–300 mg/L (buffer) | 0.3 mg/L (buffer) | Tris buffer, human serum spiked with CRP | - | Lateral flow immunoassay based on double Ab sandwich technique using CdTe QDs | [149] |
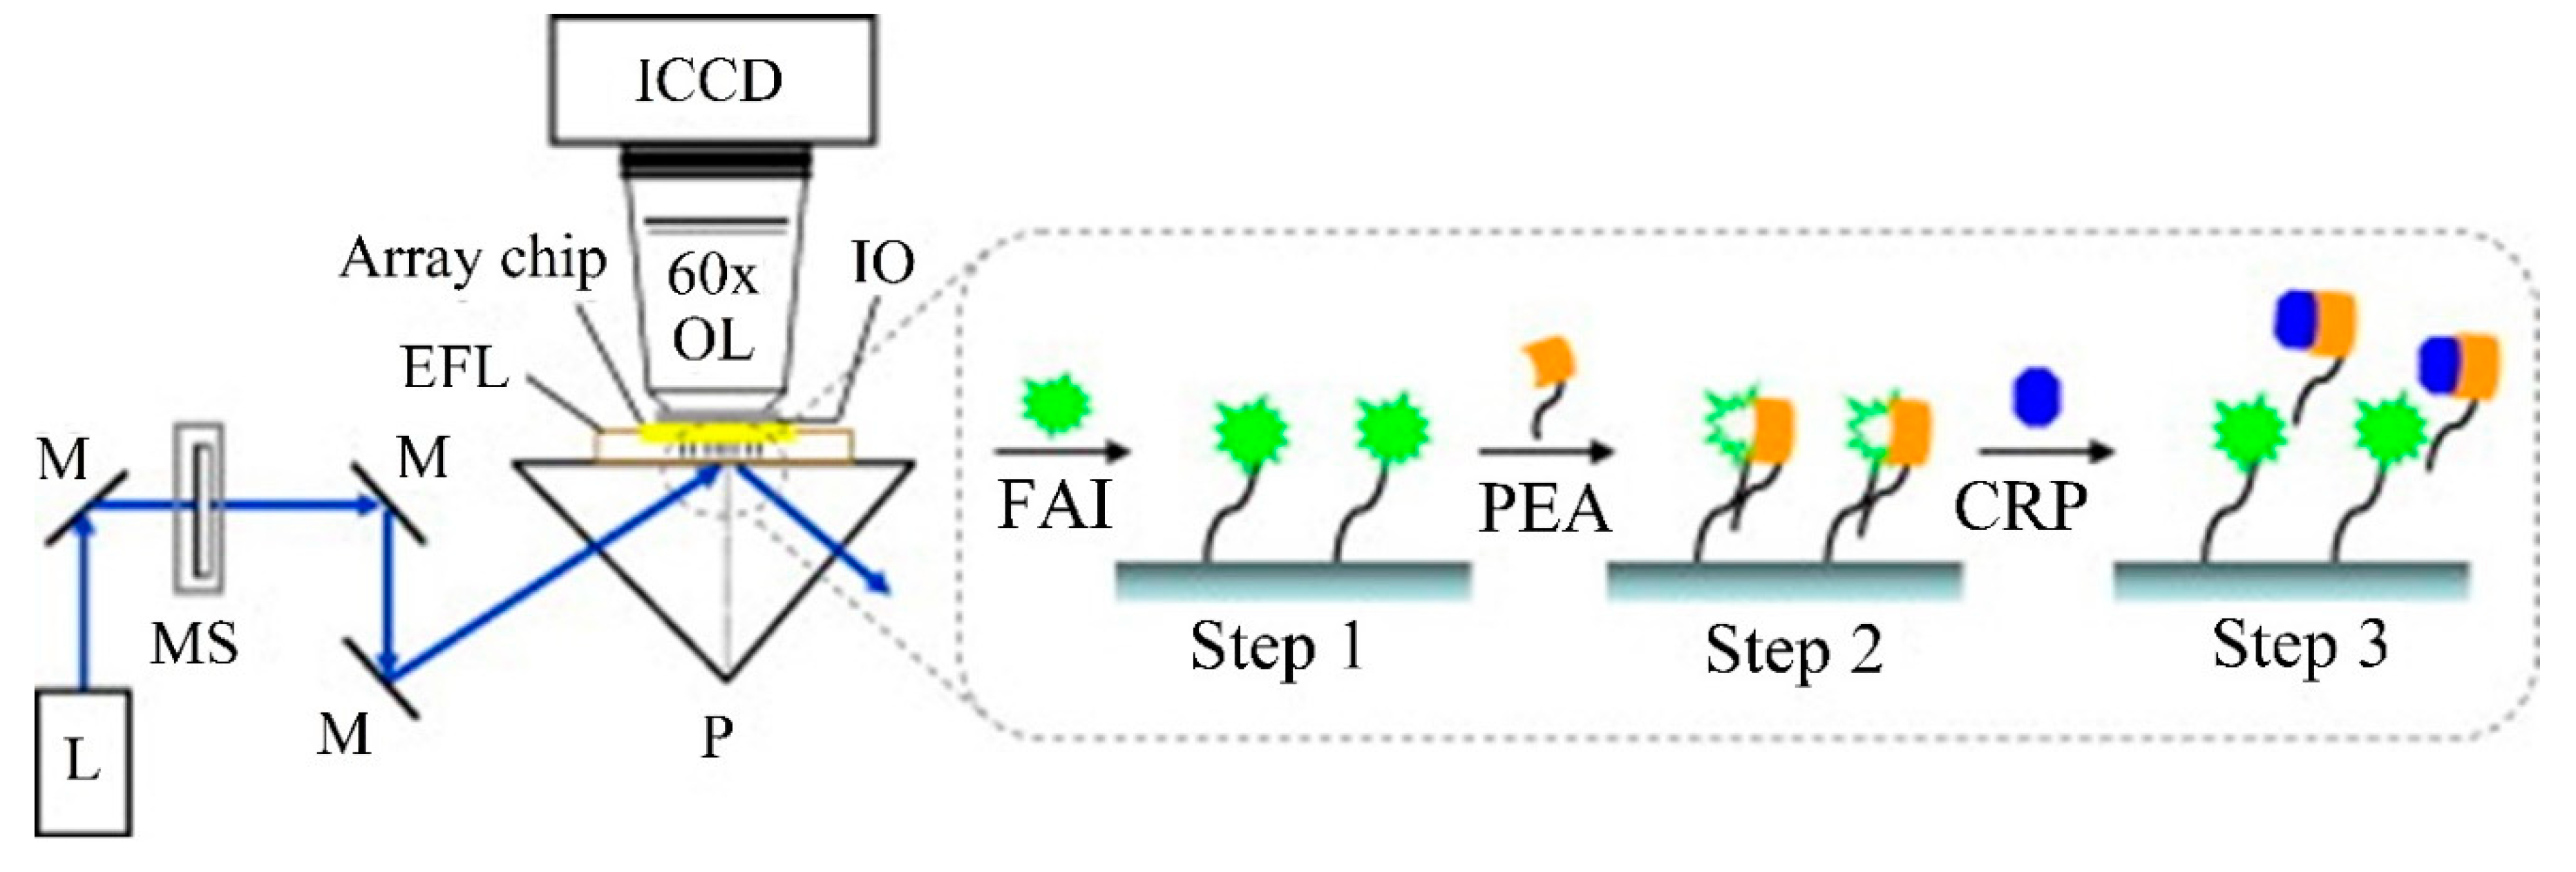
| 20 pg/L–12.5 ng/L (PBS) | 20 pg/L (PBS) | PBS buffer and human serum | Albumin | Label-free biochip based on MSF that alters fluorescence of FAI using its ligand PEA | [150] |
| Biomarker | Optical Technique/Principle | Linear Dynamic Range | LOD | Matrix | Comments | Ref. |
|---|---|---|---|---|---|---|
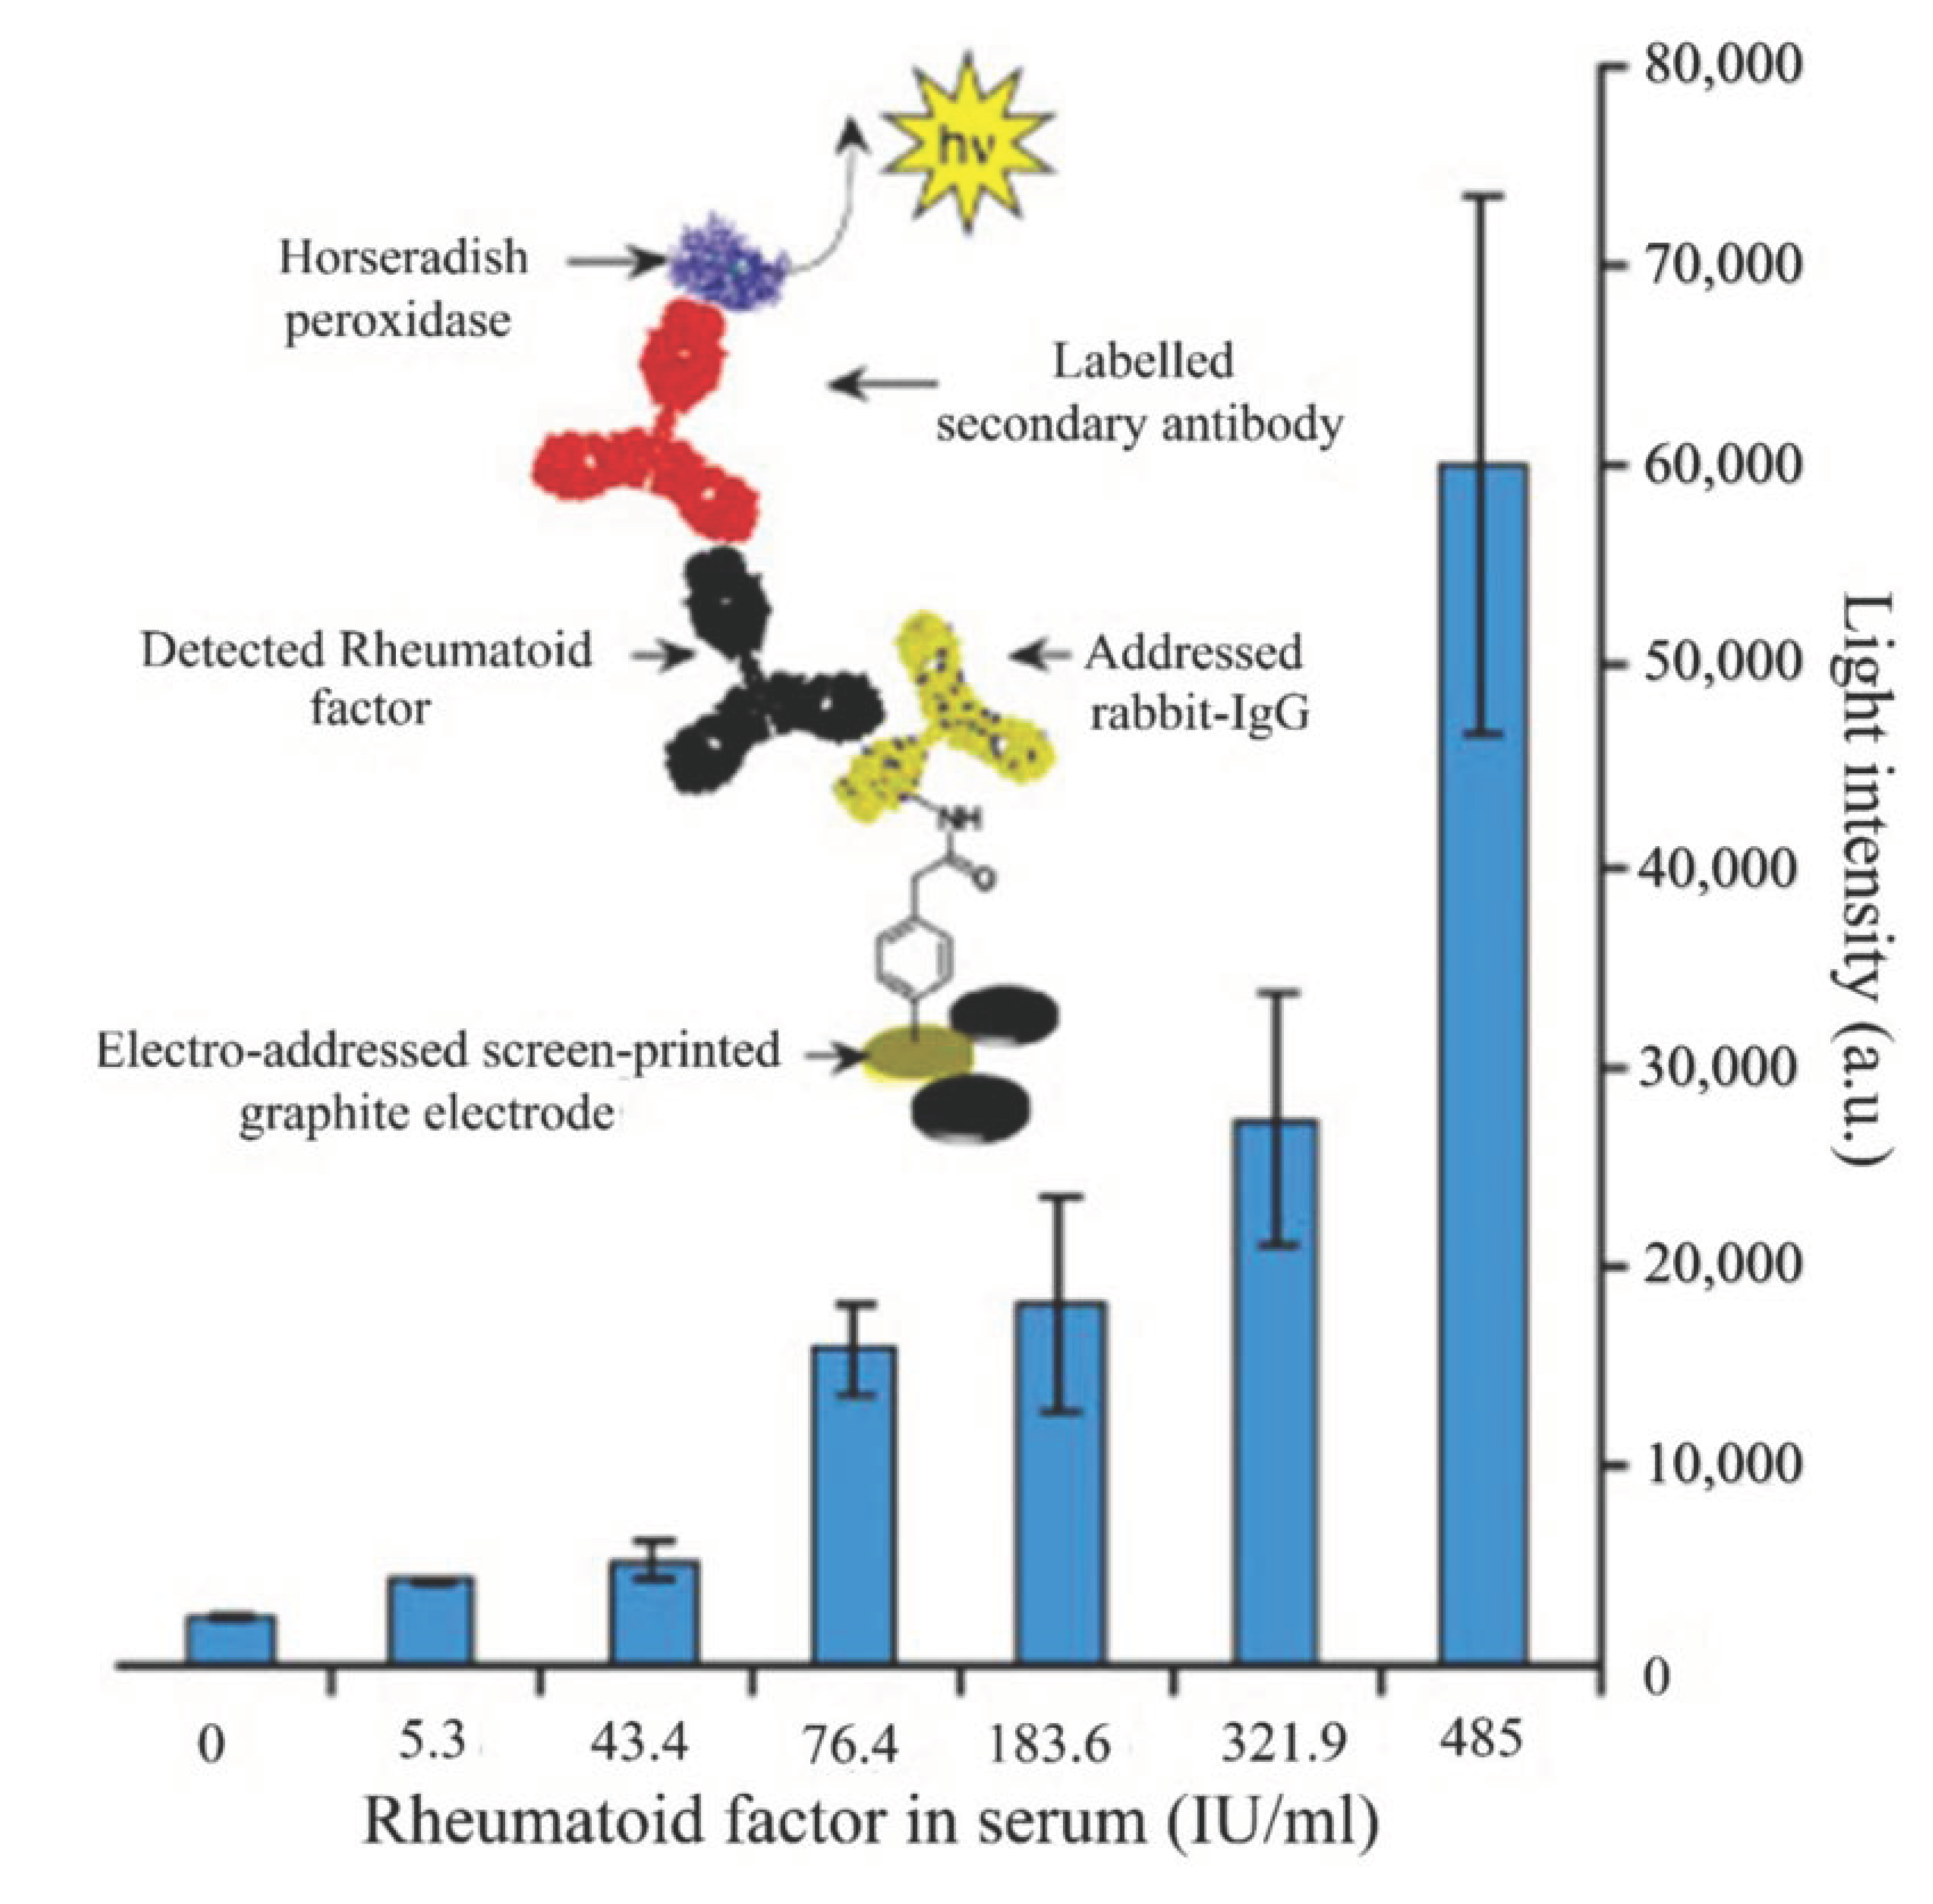
| RF | Chemiluminescence | 5.3–485 IU/mL (a) | 5.3 IU/mL (b) | Human sera (1:10 dilution in modified PBST) | Screen printed microarray, immobilization strategy based on an aniline derivative | [168] |
| ACPA | SPR imaging (SPRi) | - | 0.5 pM (b) | Huma sera (1:50 dilution in PBS) from 50 RA patients and 29 controls) | Label-free sensor based on SPR dip angle scanning | [169] |
| - | - | Human sera (1:50 dilution in PBS) from 374 early RA patients | SPRi analysis in a sensor chip with gold surface consisting of a 48 spot microarray | [170] | ||
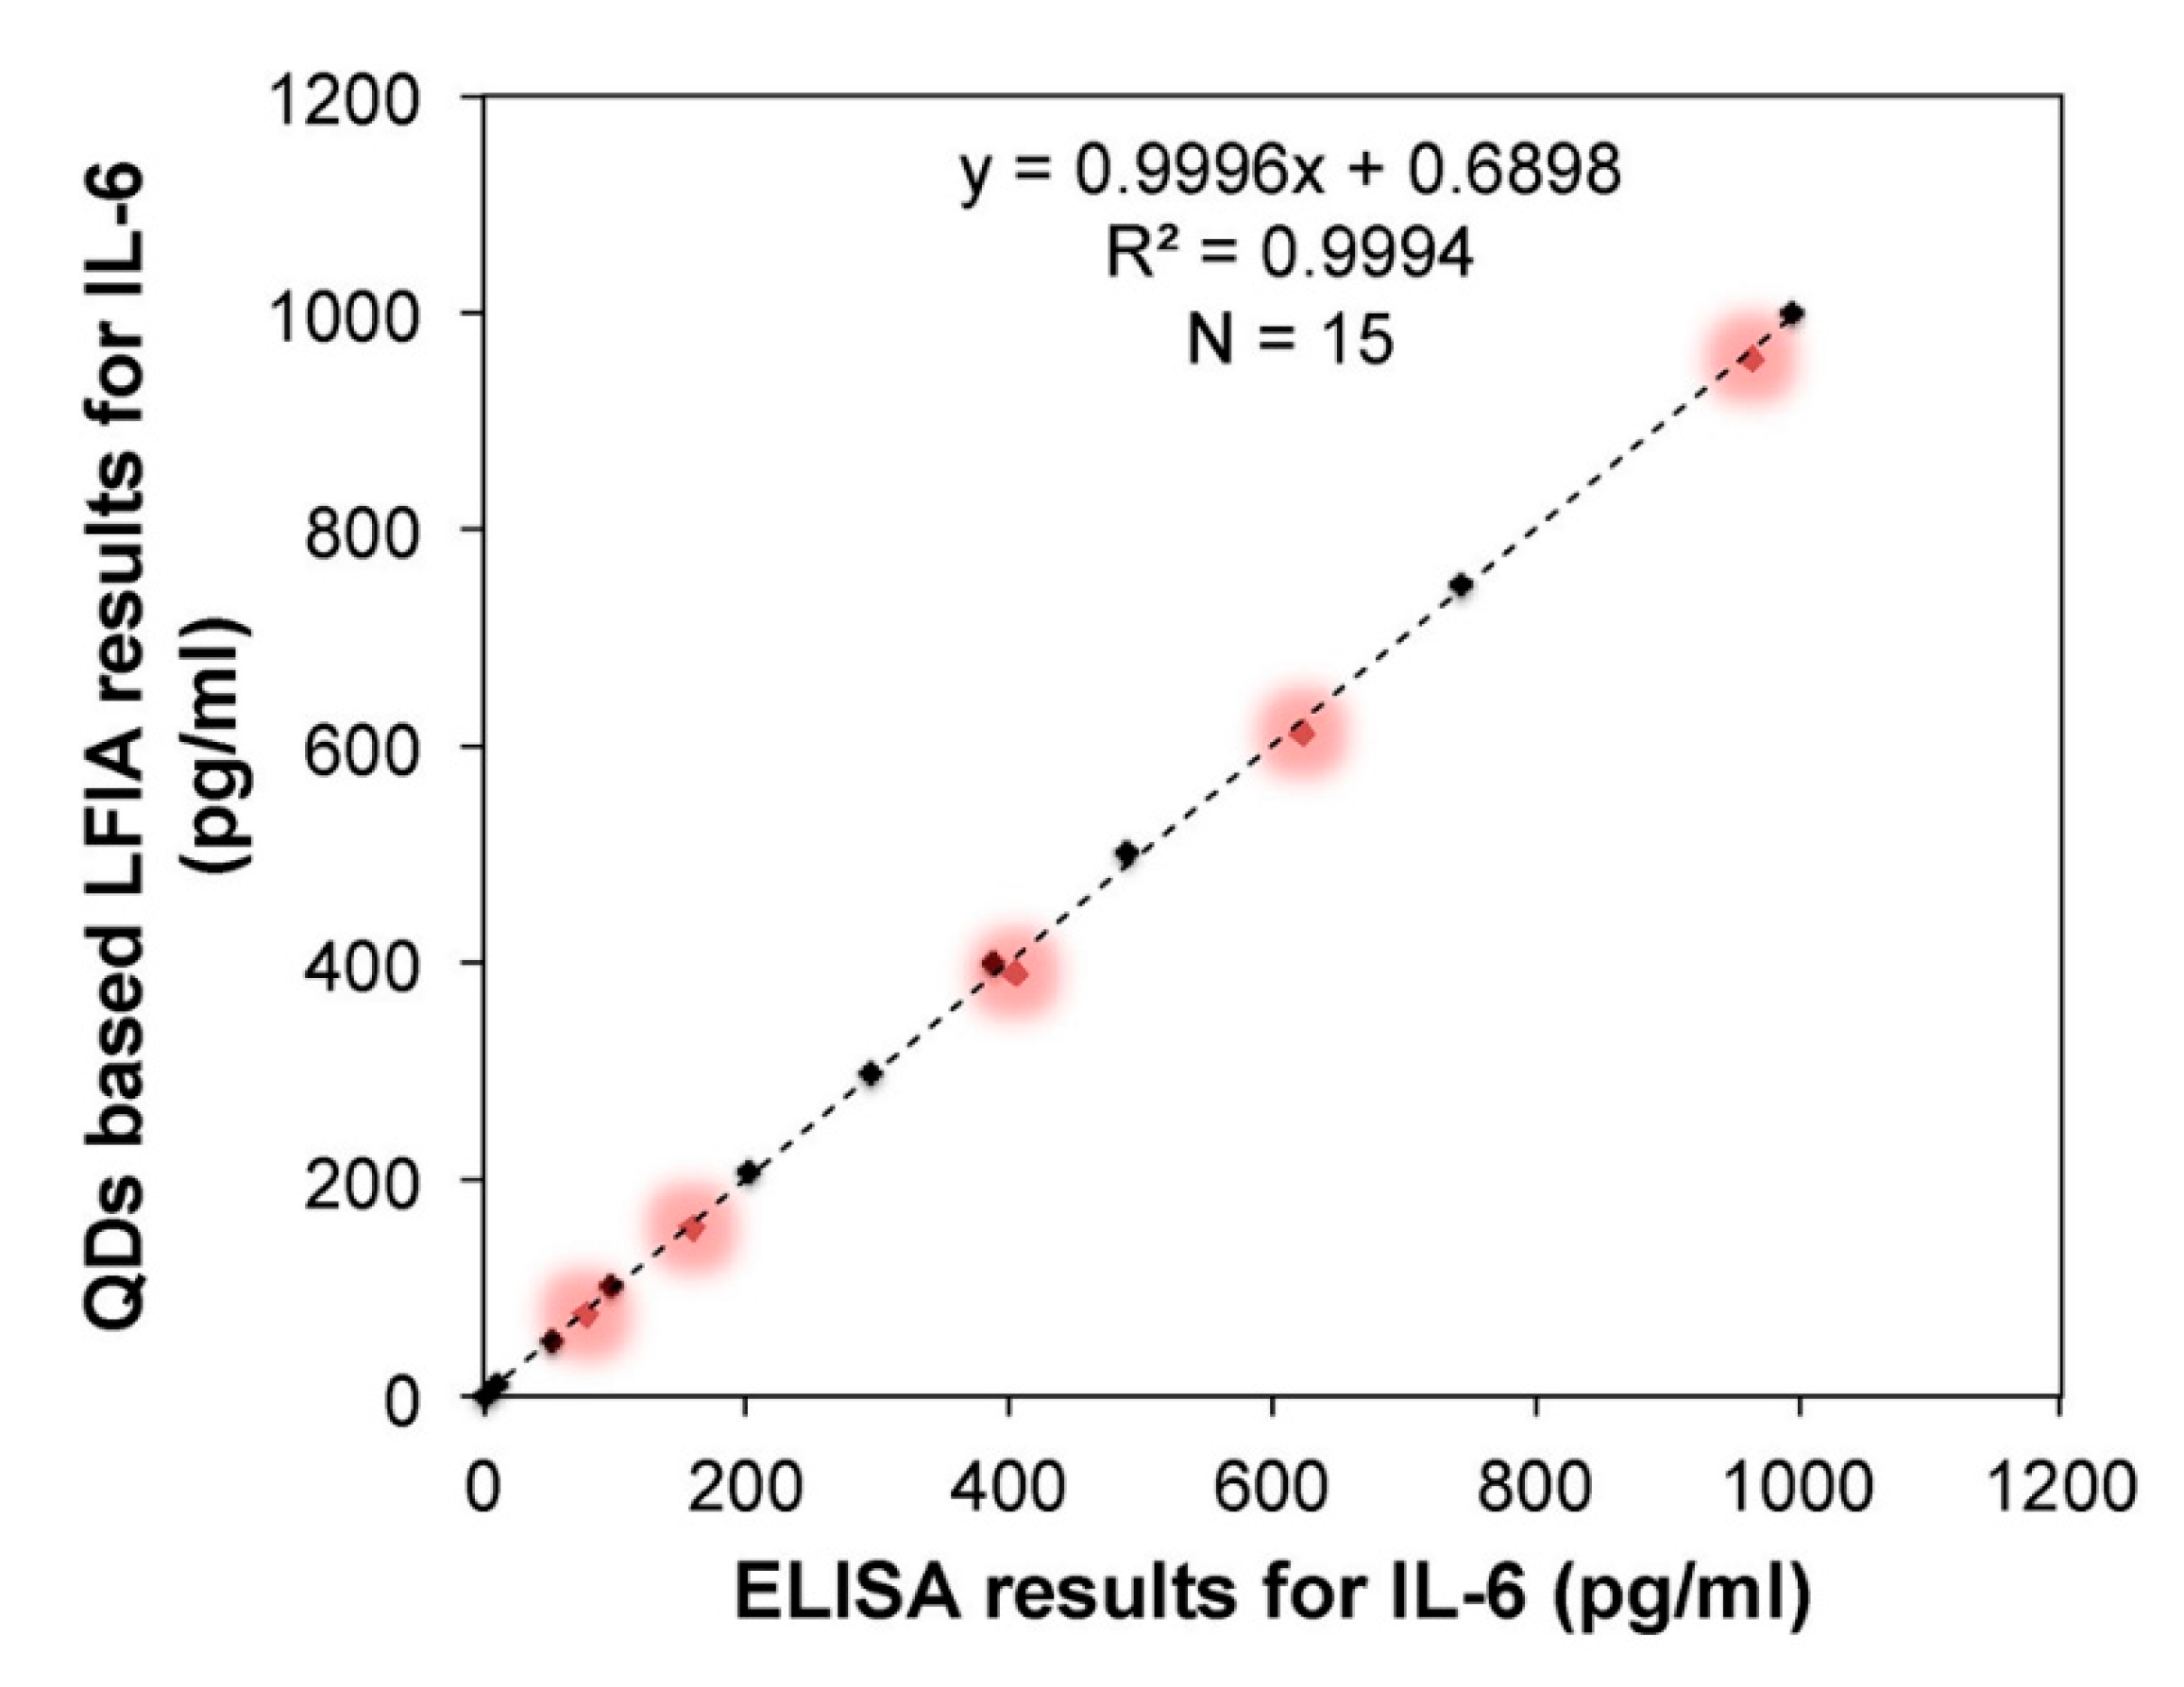
| IL-6 | Fluorescence | 1 pg/mL–1 ng/mL (buffer) | 0.9 pg/mL (buffer) | Tris buffer, human serum spiked with IL-6 | Lateral flow immunoassay based on double Ab sandwich technique using CdTe QDs | [149] |
| Histidine | Fluorescence | 500 nM–100 μM | 76 nM | PBS buffer | Fluorescence sensor based on CuAAC, a type of click reaction. | [171] |
| 1 nM–5 μM | 0.6 nM | Human plasma (diluted with citrate solution PBS and acetonitrile) | Optical sensor that uses Eu-Norfloxacine complex doped in a sol-gel matrix | [172] |
Publisher’s Note: MDPI stays neutral with regard to jurisdictional claims in published maps and institutional affiliations. |
© 2020 by the authors. Licensee MDPI, Basel, Switzerland. This article is an open access article distributed under the terms and conditions of the Creative Commons Attribution (CC BY) license (http://creativecommons.org/licenses/by/4.0/).
Share and Cite
Imas, J.J.; Ruiz Zamarreño, C.; Zubiate, P.; Sanchez-Martín, L.; Campión, J.; Matías, I.R. Optical Biosensors for the Detection of Rheumatoid Arthritis (RA) Biomarkers: A Comprehensive Review. Sensors 2020, 20, 6289. https://doi.org/10.3390/s20216289
Imas JJ, Ruiz Zamarreño C, Zubiate P, Sanchez-Martín L, Campión J, Matías IR. Optical Biosensors for the Detection of Rheumatoid Arthritis (RA) Biomarkers: A Comprehensive Review. Sensors. 2020; 20(21):6289. https://doi.org/10.3390/s20216289
Chicago/Turabian StyleImas, José Javier, Carlos Ruiz Zamarreño, Pablo Zubiate, Lorena Sanchez-Martín, Javier Campión, and Ignacio Raúl Matías. 2020. "Optical Biosensors for the Detection of Rheumatoid Arthritis (RA) Biomarkers: A Comprehensive Review" Sensors 20, no. 21: 6289. https://doi.org/10.3390/s20216289