Article

Impact of Think-Aloud on Eye-Tracking: A Comparison of Concurrent and Retrospective Think-Aloud for Research on Decision-Making in the Game Environment

Department of Management, Faculty of Economics and Management, Czech University of Life Sciences Prague, 165 21 Prague, Czech Republic
*
Author to whom correspondence should be addressed.
Sensors 2020, 20(10), 2750; https://doi.org/10.3390/s20102750
Submission received: 30 March 2020 / Revised: 8 May 2020 / Accepted: 11 May 2020 / Published: 12 May 2020

Abstract

:
Simulations and games bring the possibility to research complex processes of managerial decision-making. However, this modern field requires adequate methodological procedures. Many authors recommend the use of a combination of concurrent think-aloud (CTA) or retrospective think-aloud (RTA) with eye-tracking to investigate cognitive processes such as decision-making. Nevertheless, previous studies have little or no consideration of the possible differential impact of both think-aloud methods on data provided by eye-tracking. Therefore, the main aim of this study is to compare and assess if and how these methods differ in terms of their impact on eye-tracking. The experiment was conducted for this purpose. Participants were 14 managers who played a specific simulation game with CTA use and 17 managers who played the same game with RTA use. The results empirically prove that CTA significantly distorts data provided by eye-tracking, whereas data gathered when RTA is used, provide independent pieces of evidence about the participants’ behavior. These findings suggest that RTA is more suitable for combined use with eye-tracking for the purpose of the research of decision-making in the game environment.

Graphical Abstract

1. Introduction

Nowadays, managers face challenging conditions, dynamic environments, and complex processes [1,2]. Their decision skills affect the success of the companies [3,4] and determines their economic results [5]. Although human decision-making is described by a number of theories, it still remains a complex process that is difficult to research [6,7,8]. Moreover, to perform such research in the real world, where a significant sample of participants face identical conditions and situations, is almost impossible. Modern technologies, however, bring the possibility to use computer simulations and games for the decision-making research [1,9,10,11,12]. Games provide an adequate and safe space for experimentation [13,14,15]. Their use for the research of decision-making is based on the idea, that respondents reflect their knowledge, experience, and skills during play [11,12,16,17,18]. Nevertheless, the research of decision-making using games is still a little researched area. In addition, it requires adequate methodological procedures as different methods reveal different aspects of decision-making. Thus a description of their pros and cons will enable their better utilization [6]. In the field of decision-making research, a number of methods have been generally applied as questionnaires, observation, interviews, eye-tracking, think-aloud, decision analysis, etc. [6,19,20].
A few studies, which included the use of games, agree in particular on the use of eye-tracking [10,11]. It is the method of recording eye movements by a special apparatus (eye-tracker) [21,22]. This technique is commonly used in a human-computer interaction studies [21] and finds application in many areas of research [23]. The use of eye-tracking for research purposes is based on the assumption that humans perceive and cognitively work with what they see [24]. Vision is the most important sense in terms of acquiring information [25,26]. People perceive information by the sensory system [27] and then they integrate and compare it with expectations and knowledge, which results in a behavioral response [28]. Therefore eye-tracking is considered a valuable tool to study the cognitive processes that accompany various human mental activities, ranging from less demanding ones such as reading [26,29,30], writing [31,32,33], and perception of images and objects [34,35,36,37,38], up to the more complex ones such as learning [39,40,41,42,43,44,45], and decision-making [10,28,46,47,48]. In the case of decision-making it was proved that the method significantly contributes to the accumulation of evidence about this process [28] and improves its understanding [49]. However, there are also studies mentioning relevant shortcomings of the use of eye-tracking in decision-making research [21,47,50,51,52,53,54]. Eye-tracking cannot reveal by far all aspects of the decision-making [50], because it is not entirely clear if humans comprehend the information they watch [51], and whether watched information is incorporated into the decision-making process [52].
Therefore, the combination of eye-tracking with other methods is necessary [21,47,50]. Especially a combined use of thinking-aloud and eye-tracking data can provide deeper insights into cognitive processes [53] and help to solve the limitations associated with eye-tracking [54]. Think-aloud (often also referred to as verbal protocols) is a methodology for studying behavioral and cognitive processes while people solve problems [55]. However, there are two main types (methods) of think-aloud: (1) Concurrent think-aloud (CTA), where subjects are asked to do the tasks and verbalize thoughts simultaneously; and (2) Retrospective think-aloud (RTA) where subjects are asked to do the task silently first and then retrospectively report on the solving process [56]. Over time, both methods have penetrated many fields of science, which gives rise to constant discussions of their advantages and disadvantages, as well as their applicability and validity for various research fields [53,55,57,58,59,60,61,62]. The related problem of CTA is the dual cognitive load when the thinking process and the verbalization process compete with each other [63]. Thus, the cognitive workload of respondents can be too high [62] and it can impact on their standard working process [56]. Therefore, some ideas may be lost as they cannot be expressed in real-time [63]. The data omissions occur especially when the presented information is difficult to verbalize or the processes are automatic for participants [55,56,64,65]. RTA use does not disturb participants during the task [56,66]. Nevertheless, it has also limitations like forgetting information or omitting its interpretation [55,56,58,67] and post-rationalization or fabrication of thoughts [68,69,70]. Therefore, many scientists overcome the RTA shortcomings by re-playing recordings to participants [53,58,60,62,70].
Interestingly, many authors, who deal with think-aloud, also recommend combining them with eye-tracking [47,54,64,65,67,71]. The involvement of eye-tracking can help solve the shortcomings of think-aloud because it allows one to confirm and extend the gathered data [47] or to complete omitted and forgotten points [54].
On the other hand, these studies take little or no account of the possible impact of thinking aloud on eye-tracking data. This impact is expected specifically in the case of CTA [67,70], as this method may bring the unnatural behavior of humans during task solving [72]. Although these statements can be considered as logical, it has not been empirically verified to what extent this may be the case.
Therefore, the main aim of this study, which is focused on decision-making research in the game environment, is to compare and assess if and how CTA and RTA methods differ in terms of their impact on data provided by eye-tracking. In addition, with the respect that the game is a process, where a player approaches can evolve, the research is not only concerned with the overall final assessment and comparison of both methods but also examines whether the potential differences gradually change during the game progress or not. Based on the findings it will be possible to discuss which of the think-aloud methods in combination with eye-tracking is more suitable for decision-making process research in the game environment.

2. Materials and Methods

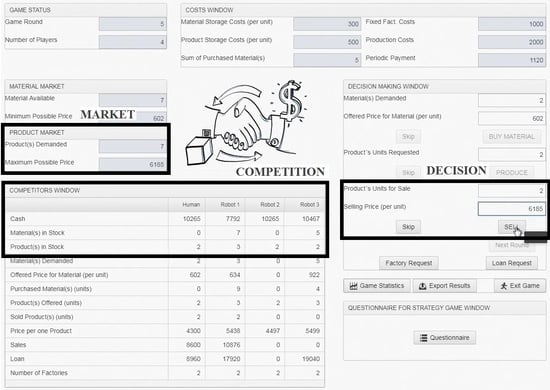
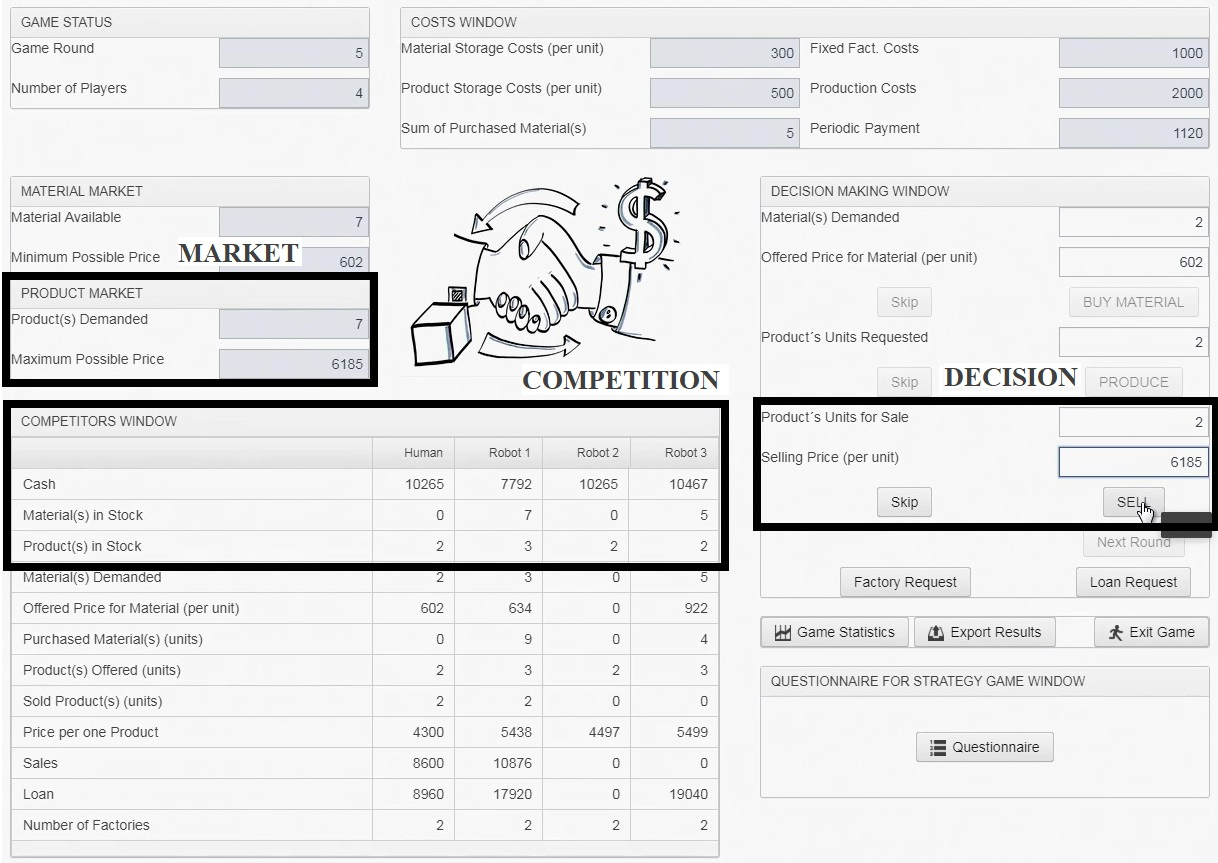
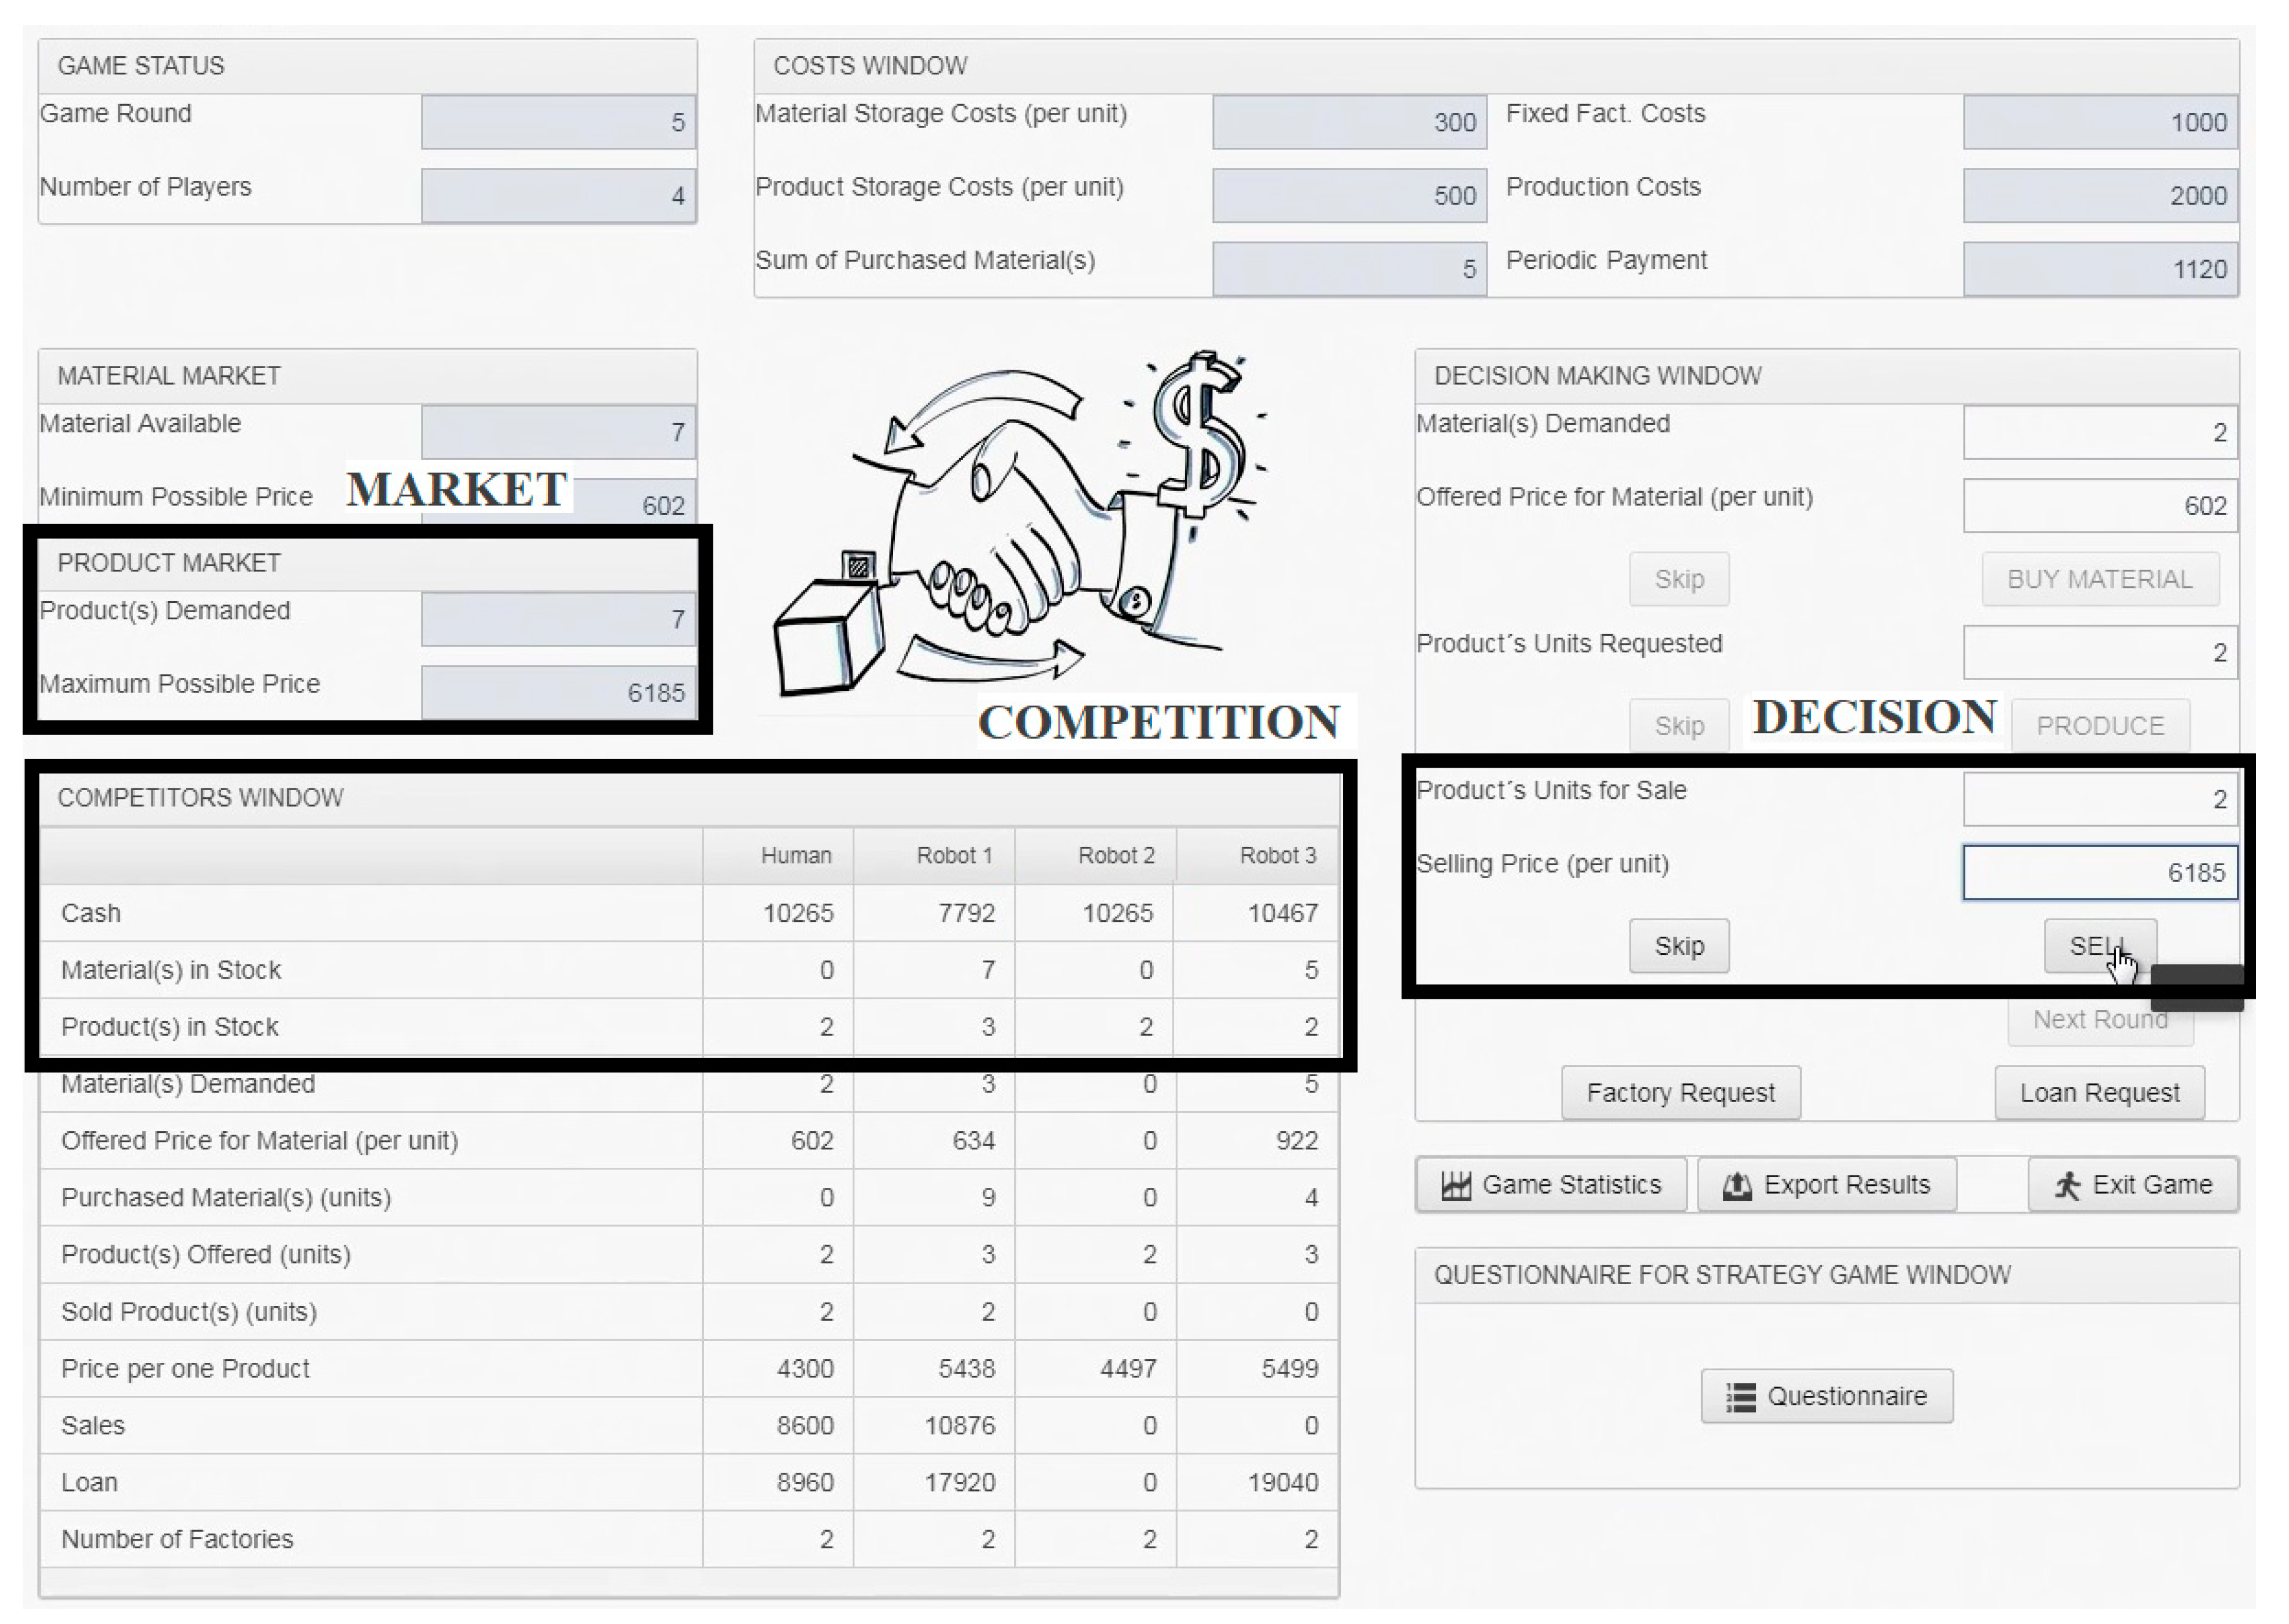
2.1. Simulation Game

The research was conducted through the experiment in which participants played the FactOrEasy® game (FEM CZU, Prague, Czech Republic) and described their behavior using think-aloud methods. FactOrEasy® is a simulation game of decision-making in financial, operational or strategic management. The user runs a virtual enterprise there and makes three mandatory decisions (Material Purchase, Production, Product Sale), and two optional decisions (Production Expansion, Taking Loan) in each round. The simulation consists of 12 rounds unless it ends earlier due to bankruptcy. The game goal is to achieve maximum “net cash” at the end of the game and beat three virtual competitors [73]. FactOrEasy® is used in the teaching of managerial decision-making [73] and previous studies with managers [74] or farmers [11] proved that the game is also an appropriate tool for testing managerial decision-making skills.

2.2. Research Group

Thirty four (34) participants attended the experiment, each one individually. This number of participants corresponds to previous studies, which deal with think-aloud [53,57,60,61,68], eye-tracking [10,28,37,41,54,75,76], or with a combination of both [64,65,70,71]. The condition for participation was that the participant must be a manager, or business owner who has an active managerial role in their business. All subjects gave their informed consent for inclusion before they participated in the study. The study was conducted in accordance with the Declaration of Helsinki, and the protocol was approved by the Ethics Committee of CZU Prague University.
The research was conducted in two periods. In the 1st, an experiment was performed using CTA (16 participants) in the 2nd RTA took place (18 participants). Participants were randomly assigned to both groups. Each one participated only once, either in the RTA group or in the CTA group (between-subjects study design). The results of three managers have been excluded from further analysis. Two showed exceedingly poor quality of the understanding of the given task (game rules and method used). One has been excluded because of eye-tracker failure. After that eliminations, the CTA group consisted of 14 managers (nine men, five women, average age 34.8 years), the RTA group consisted of 17 players (14 men, three women, average age 30.7 years).

2.3. Course of Experiment

The experiment was performed in the lab of human behavior research (HUBRU) at CZU Prague University. Participants received an e-mail with links to a video tutorial and demo version of the game before the official start. They had three attempts to try the game on their own. When they arrived, the researcher firstly verified their understanding of the game and provided clarification when necessary. The instructions included only information about rules and control elements, but no advice on the procedure or strategies in the game.
After that, the researcher proceeded to explain the requirements for think-aloud in line with the standards described by Ericsson and Simon [56]. However, the RTA and CTA had to be adjusted for use in the game and for the purpose of the present study. Adjusting is nothing uncommon, and many scientists in the past had to redesign or modify these methods for their research purposes [77]. In addition, some flexibility in the process of data collection is inevitable in the methodological approaches that are used to study decision-making [6].
CTA adaptation consisted only of the prompts when the player pauses verbalization. Ericsson and Simon [56] recommend prompts after 10-15 s of silence. Most authors used reminders after just 5 s [53,64,71], but some used longer gaps [57] or did not explicitly state the time used [60]. The form of alerts used in this study is closest to Cotton and Gresty [69], who used prompts when needed, without any time fixation. We decided to alert the participants to pauses and asked them for improvement in the next verbalization always at the end of the game rounds. The aim was to do not disturb the gaming process and to avoid distorting eye-tracking metrics that could be affected during communication with the researcher.
Before applying RTA, it was necessary to consider the time needed to complete the full game (12 laps), which is usually in the range of 20–40 min [11,74]. In such a case, the participant’s memory cannot include the evidences of individual decisions in each round, even with the possible use of playback of recordings. This presumption was verified on two pilot participants (outside the research set), who were able to describe only the general strategies and procedures. In this respect, comparing CTA and RTA would not make sense, as they would provide significantly different data. Therefore, it was decided to ask participants to verbalize at the end of each round, after they finished all decisions in the given round. Following this, it was refrained from replaying the recordings to participants. This would mean stopping the game after each round and performing this action. The estimated time demands and negative impact on the gaming process were considered as inadmissible. However, the game itself allows participants to recall their previous steps. Until the player clicks the “next round” button, all figures from the given round remain on the screen. These numbers imply the results of the player’s decisions and thus can remind their circumstances. This fact was explained to RTA’s participants. With this measure, it is possible to provide a higher number of verbalizations received by the RTA in line with Olsen et al. [67] assertion that any reminder of own actions is better for participants than none. After explaining the use of CTA and RTA, the researcher verified their understanding by a few simple mathematical tasks in Microsoft Excel (Microsoft Corporation, Redmond, WA, USA).
The last step before the game started was to set up an eye-tracking. The lab is equipped with a Tobii X2-60 Eye Tracker (Tobii Pro AB, Stockholm, Sweden) and Tobii Pro Studio 3.4.8. software. The eye-tracker was situated under the 24” monitor (1920 × 1080 px, 60 Hz). “Screen record” as working mode and “I-VT” as fixation filter were set in the software. 5-point calibration was performed. The participants were seated approximately 60 cm away from the screen. They were also asked to keep their heads as still as possible in the same way to minimize inaccuracy caused by head movements.
After explaining all experiment procedures and setting up eye-tracking, the researcher left the room. Participants were observed from the control room. Mutual communication was possible using loudspeakers and microphones but was limited only to situations when the participant asked for a rule to be repeated; when the verbalization stopped (prompts) and/or in moments between two games (request for a break). Video, eye-tracking and audio records were recorded from all sessions. The number of game attempts was not limited but the length of one session (including welcome, initial briefing, equipment settings, and breaks) was limited to two hours.

2.4. Data Processing

2.4.1. Comparison of Game Results Achieved by RTA and CTA Players

Several studies [10,39,40] claim a significant difference in data gathered by eye-tracking when a monitored task is performed by participants with different levels of skills, experience, or education. To play FactOrEasy® represents a complex task that may reflect the decision-making skills of players [11,74,78]. We selected a relatively homogeneous group of participants for the experiment and distributed them evenly into CTA and RTA groups. Even so, both groups of players could have shown significantly different performances in the game. This would mean that eye-tracking metrics might have been affected not only by the use of CTA and RTA methods but also by the ability of participants to solve a given task (to play the game). In such a case, it would be very difficult to separate the two mentioned influences and draw conclusions about the different impact of CTA and RTA on the data provided by eye-tracking. Therefore, it was first necessary to assess whether the performance of players among groups did not differ significantly.
We assume that the performance of players, and thus their decision-making skills, can be indirectly evaluated using the results they have achieved in the game [74,78]. Thus, we used the analysis of the game results to compare the players’ performance of both groups. However, the simulation is stochastic, which means that even if a player faces repeating actions, their conditions may be different [73]. In order to make the comparison of players’ performance more independent of the stochastic nature of the game, we decided to compare three different indicators:
(1)
The amount of “net cash”, which maximization is the main game goal. Nevertheless, this indicator cannot be calculated in bankrupt games. Therefore, it includes only completed games.
(2)
The comparison of the numbers of bankruptcy games is presented as a separate indicator.
(3)
The overall standings of the player at the end of the game. To beat three competitors is the second game goal. However, players with different strategies can reach different but still the highest net cash [73,78]. Therefore, the overall standings, as the indicator, is less dependent on stochastic game conditions.
The differences between indicators were statistically verified. In the case of net cash and the overall standings, the significance of the differences was tested using t-test and/or Mann-Whitney test. The test choice was based on the validation of data normality (Shapiro-Wilk). The numbers of bankruptcy games are expressed absolutely as their count within both groups, and relatively (%) in the form of the proportion of bankruptcy games to the total number of game attempts of each group. The difference was tested by the Z-test for two proportions.

2.4.2. Comparison of the Impact of CTA and RTA on Eye-Tracking

In order to compare the impact of CTA and RTA on eye-tracking, it was first necessary to choose time segments of gathered records, which would be appropriate for comparison of eye-tracking metrics. One game attempt is not a suitable segment due to their low gathered number (2.32 on average per player). This option wouldn’t allow a more detailed comparison of metrics’ development over time. One game round seemed a better choice (22.45 on average per player) but is not suitable for analysis as a whole due to two assumptions. The 1st is the abovementioned modification of CTA. Although prompts were realized at the end of rounds, they were still part of eye-tracking records. In such cases, the records are influenced by communications with the researcher. These moments occurred in different numbers for different players and with different duration. Therefore, it is difficult to separate and exclude them from records. The 2nd problem is that game rounds can involve a different number of decisions. Three are always mandatory, but Loan and Factory can bring a higher number of decisions in one round. Those could bring a higher number of eye-movements that cannot be excluded from records. Therefore, including the rounds with more decisions can distort results.
In view of the above limitations, the choice of an appropriate segment was limited to one phase of the game that is mandatory in each round. This measure provides a sufficient number of segments (same as the number of game rounds) and relatively independent eye movement data (associated with only one decision). The selling phase (Product Sale) was evaluated as the best option for this purpose due to the easy extraction of its segments from the eye-tracking records and clear rules and circumstances of this phase. The start of the segment was determined by clicking the “Produce” button (ending the production decision and the start of the selling phase) and the end by clicking the “Sell” button (which ends the phase). In this phase, the player usually offers products for sale (if he/she have some). The sale takes the form of a reverse auction. There are three important areas of interest (AOIs) (see Figure 1), which is necessary to follow to decide about the sale: (1) the market situation (Market) shows the demand; (2) the stocks of competitors (Competition), where the player should consider overall supply; and (3) the area where the player makes a decision (Decision). The selling phase is considered as the most independent of other circumstances. Product Sale is the last mandatory decision and thus it is not needed to consider future steps in the round (unlike in Material Purchase and Production). Therefore, the player should focus his/her gaze mainly on the three mentioned AOIs since the other areas on screen are irrelevant to the decision. In addition, either irregular decisions should not occur during these segments, because they are also irrelevant during this game period. Finally, segments are free of CTA’s prompts and RTA’s comments because they happen, at the earliest, after clicking the “Sell” button.
334 CTA and 362 RTA segments were gathered. Nevertheless, some of them had to be excluded from further analysis. First, 37 CTA and 25 RTA segments, when the player decided to skip the decision, were excluded. This occurs when one has no products to sell. In these circumstances, the player is forced to skip the sale. This case is accompanied by a much lower number of measured phenomena, as it is not necessary to follow the mentioned AOIs. The second exclusion included nine CTA segments (from one player) and eight RTA segments (from two players: 5 and 3). In these cases, the players significantly changed the sitting position, resulting in the loss of eye-tracking records. In the end, 288 CTA’s and 329 RTA’s segments remained for the purpose of analysis.
The next issue was to select appropriate metrics for analysis as eye-tracking offers many options [43,45]. Nevertheless, all are based on two basic eye movements—saccades and fixations [22]. Therefore, the comparison of the RTA and CTA in this study starts with two elementary indicators:
  • Number of fixations. Eye-tracking offers the possibility to measure both the number of fixations and the number of saccades, but both counts can be interpreted identically. They show the number of places viewed by the observer [75]. Nevertheless, the first indicator was preferred in this study as fixations relate to the cognitive processing of information [24], whereas the information is not acquired during saccades [29]. In the game, the players look for cues for the right decision. The number of fixations may indicate how difficult the task is for them, because, during more difficult decisions, participants tend to show a higher number of fixations [79].
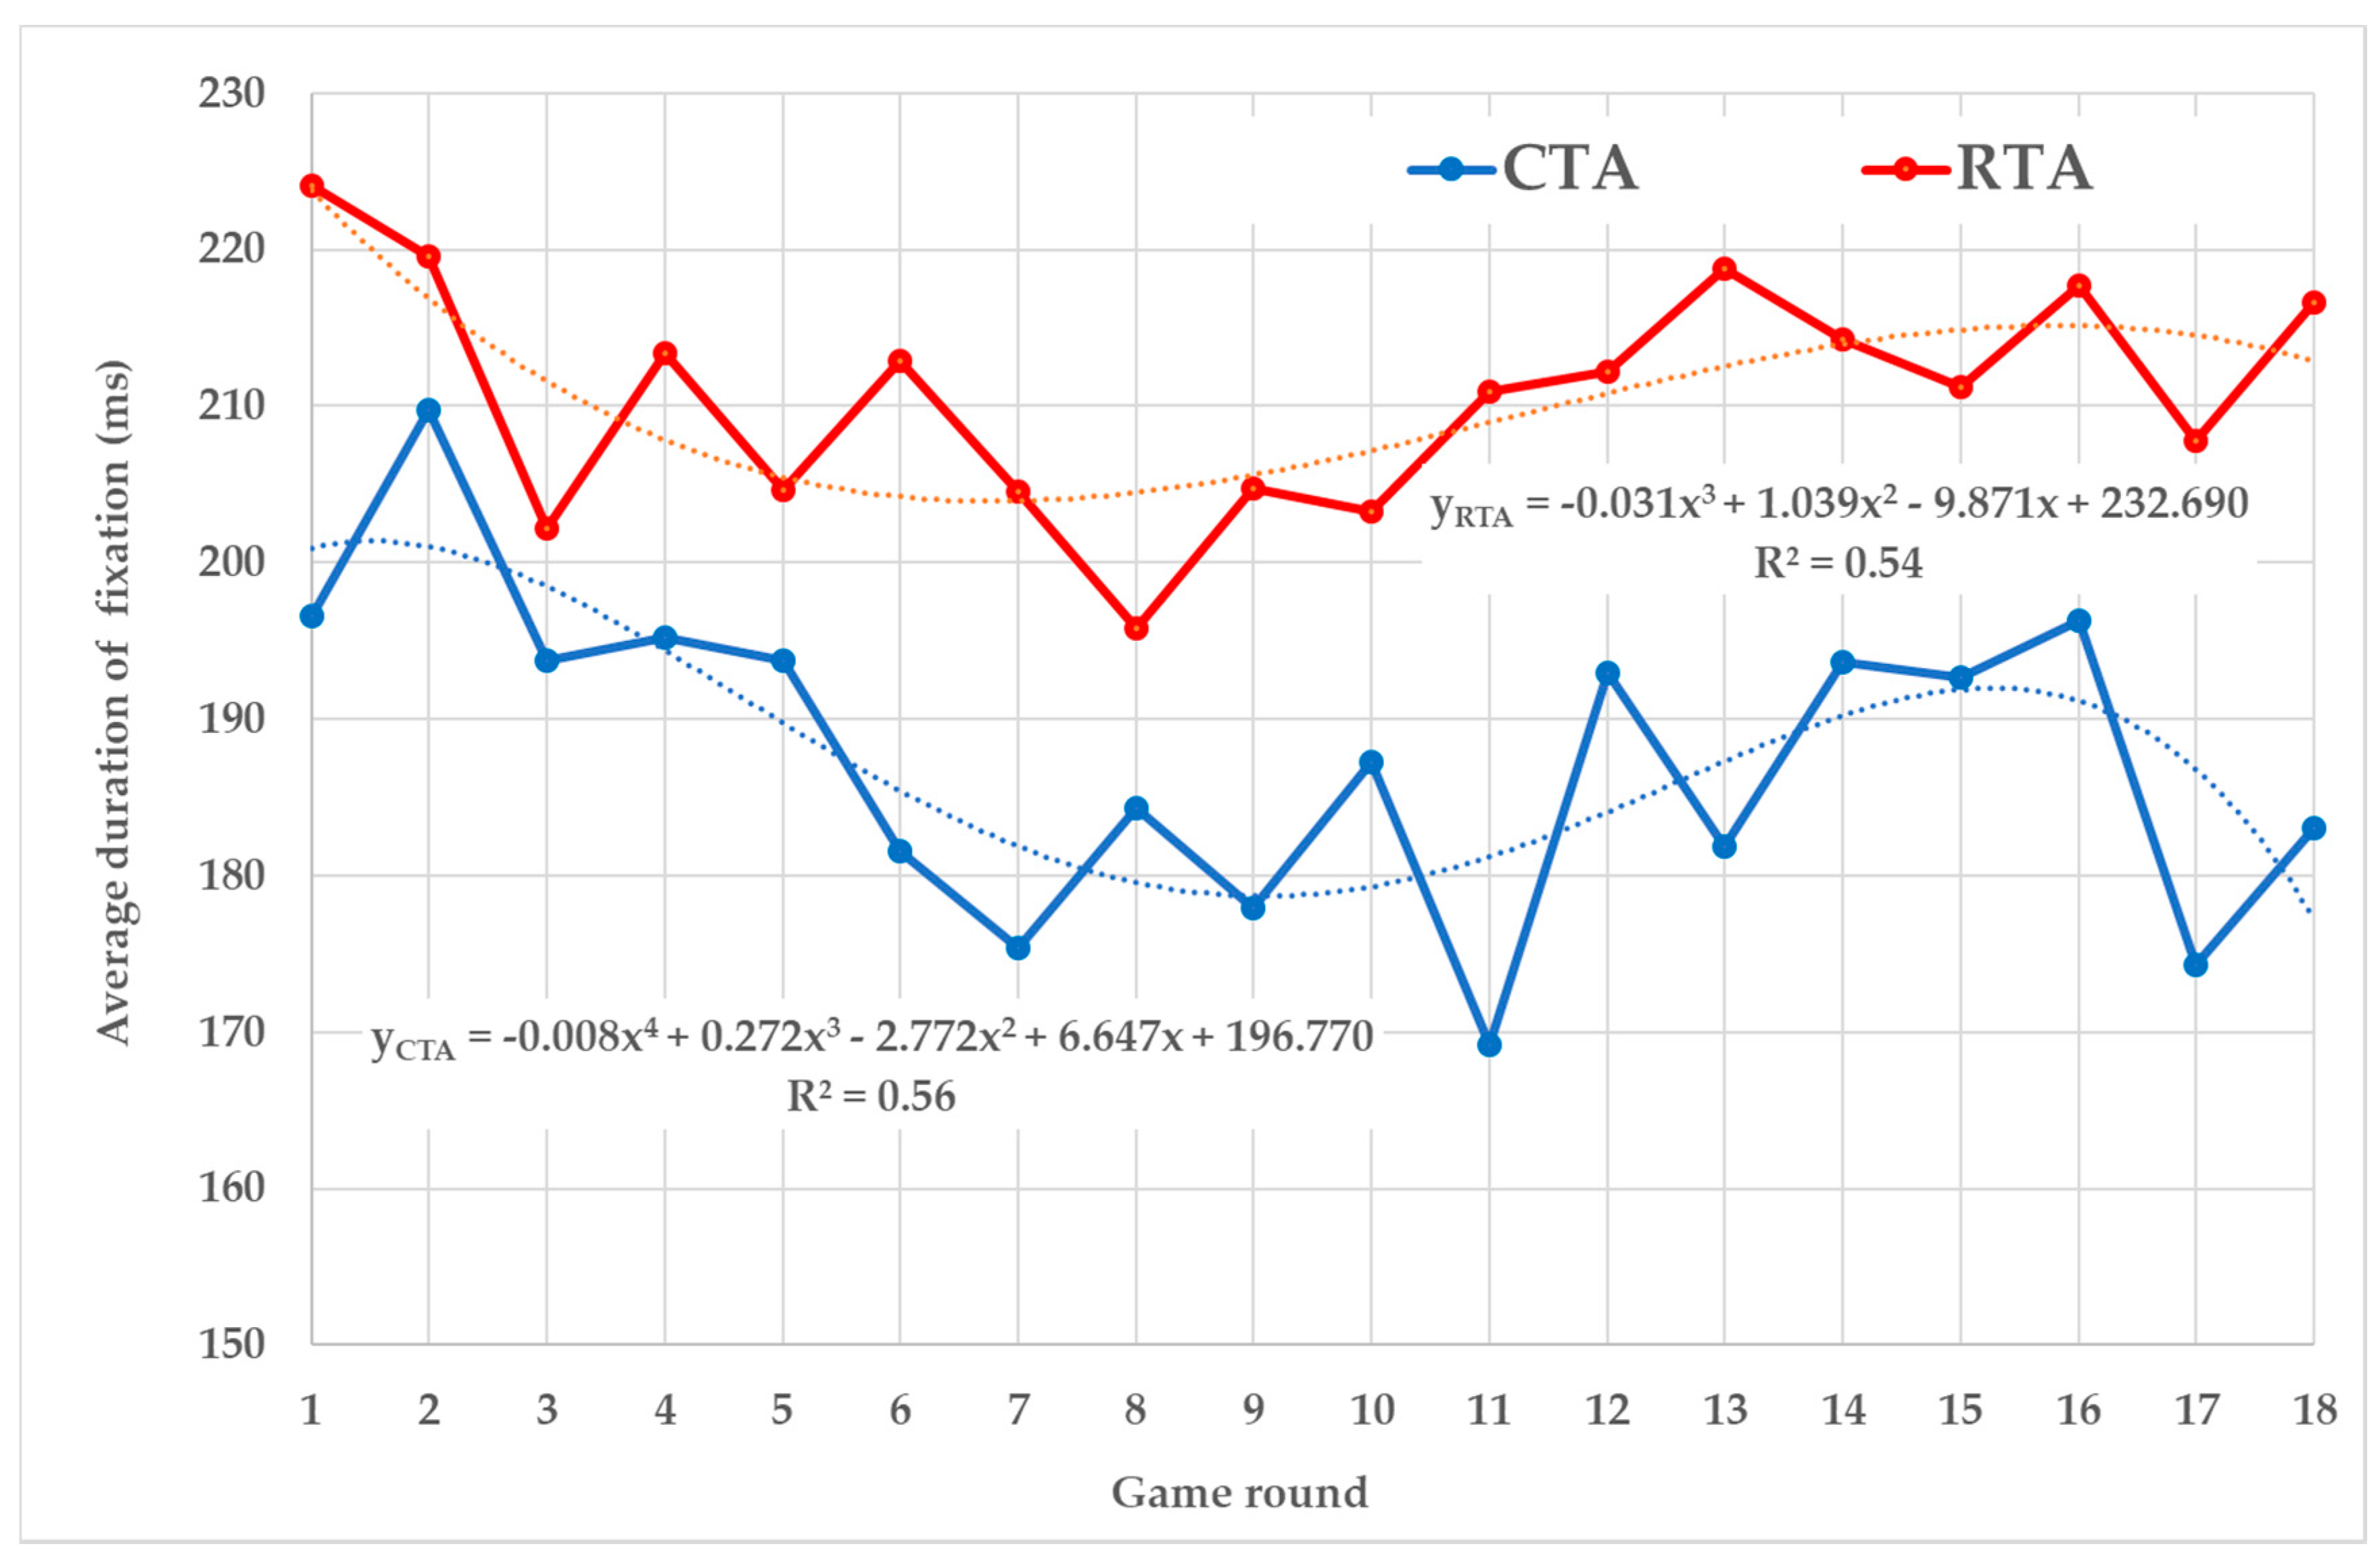
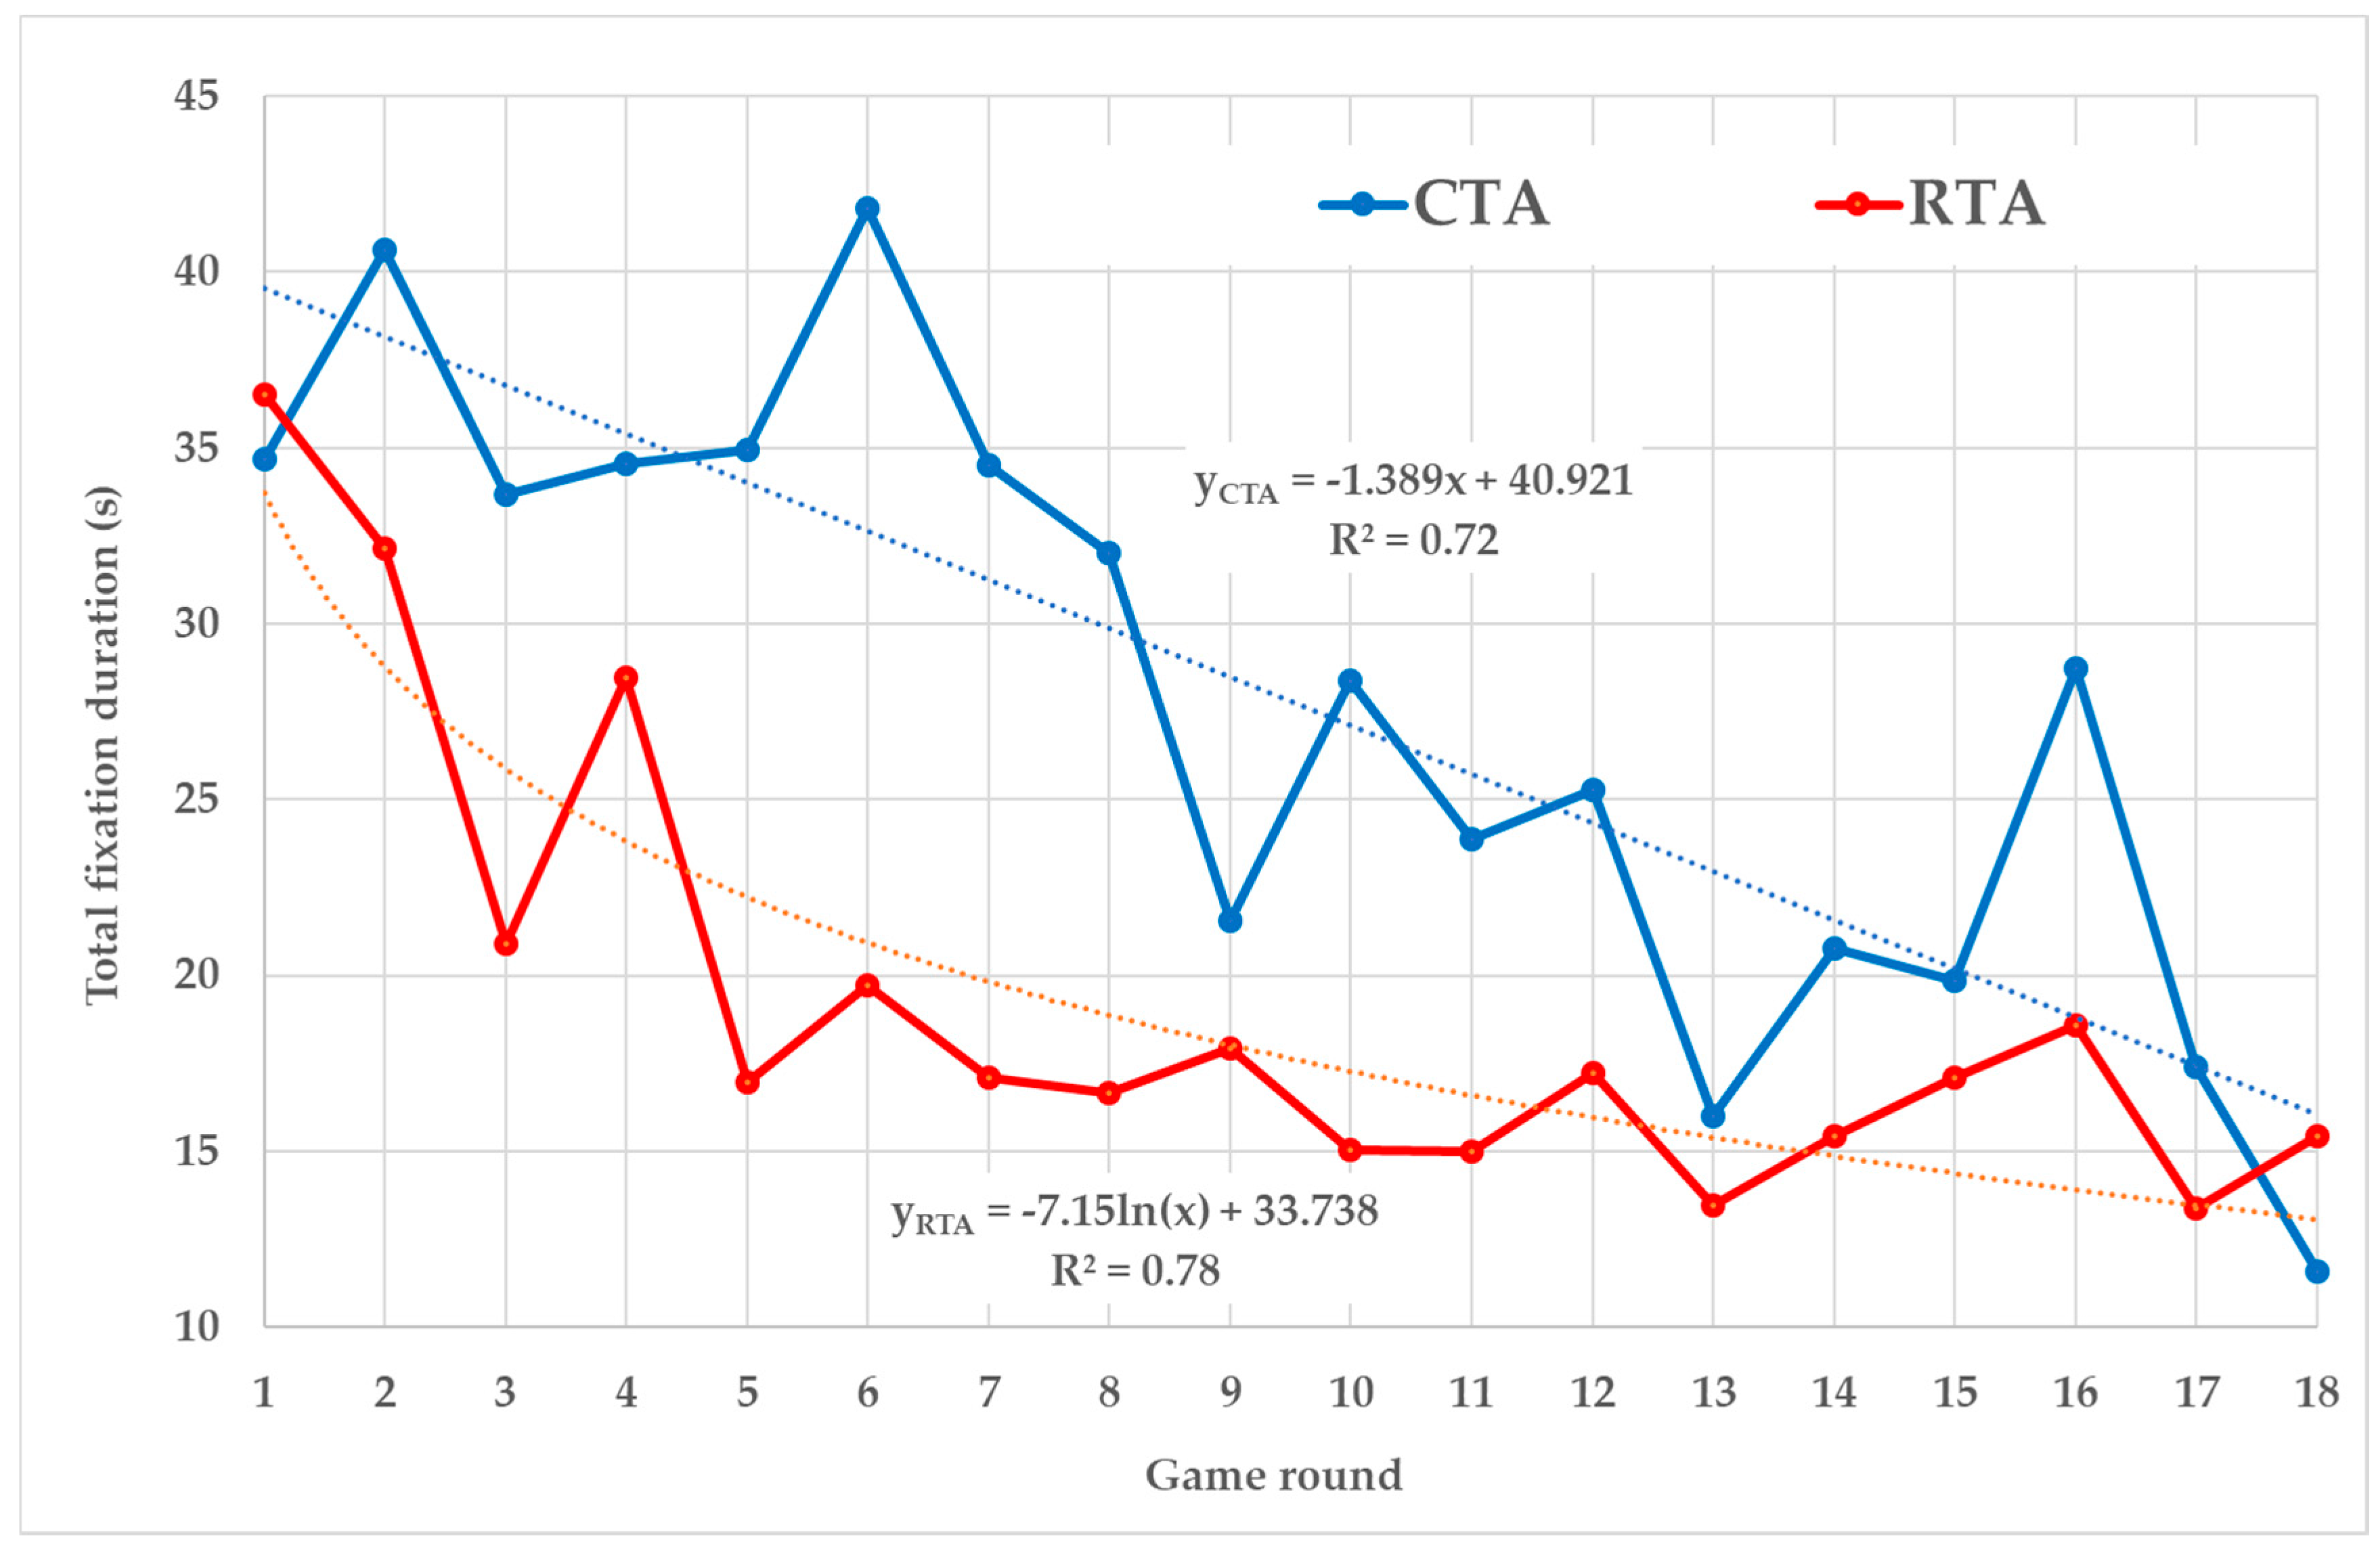
  • Fixation duration. This metric can be interpreted in two ways. The first presumption is that a longer duration means greater interest in an object. The second states that it is associated with the complexity of the cognitive processing of information. Therefore, fixation duration can be understood as an index of the cognitive effort degree needed for information processing [21,80]. The fixation duration is expressed in two ways: (1) as the Average duration of (one) fixation in milliseconds (ms) and (2) the Total duration of (all) fixations in seconds (s).
However, eye-tracking offers many other methods, metrics, and indicators. Their right choice must be always adequate to research intentions [43,45]. For the purposes of this research, we designed and added one own indicator:
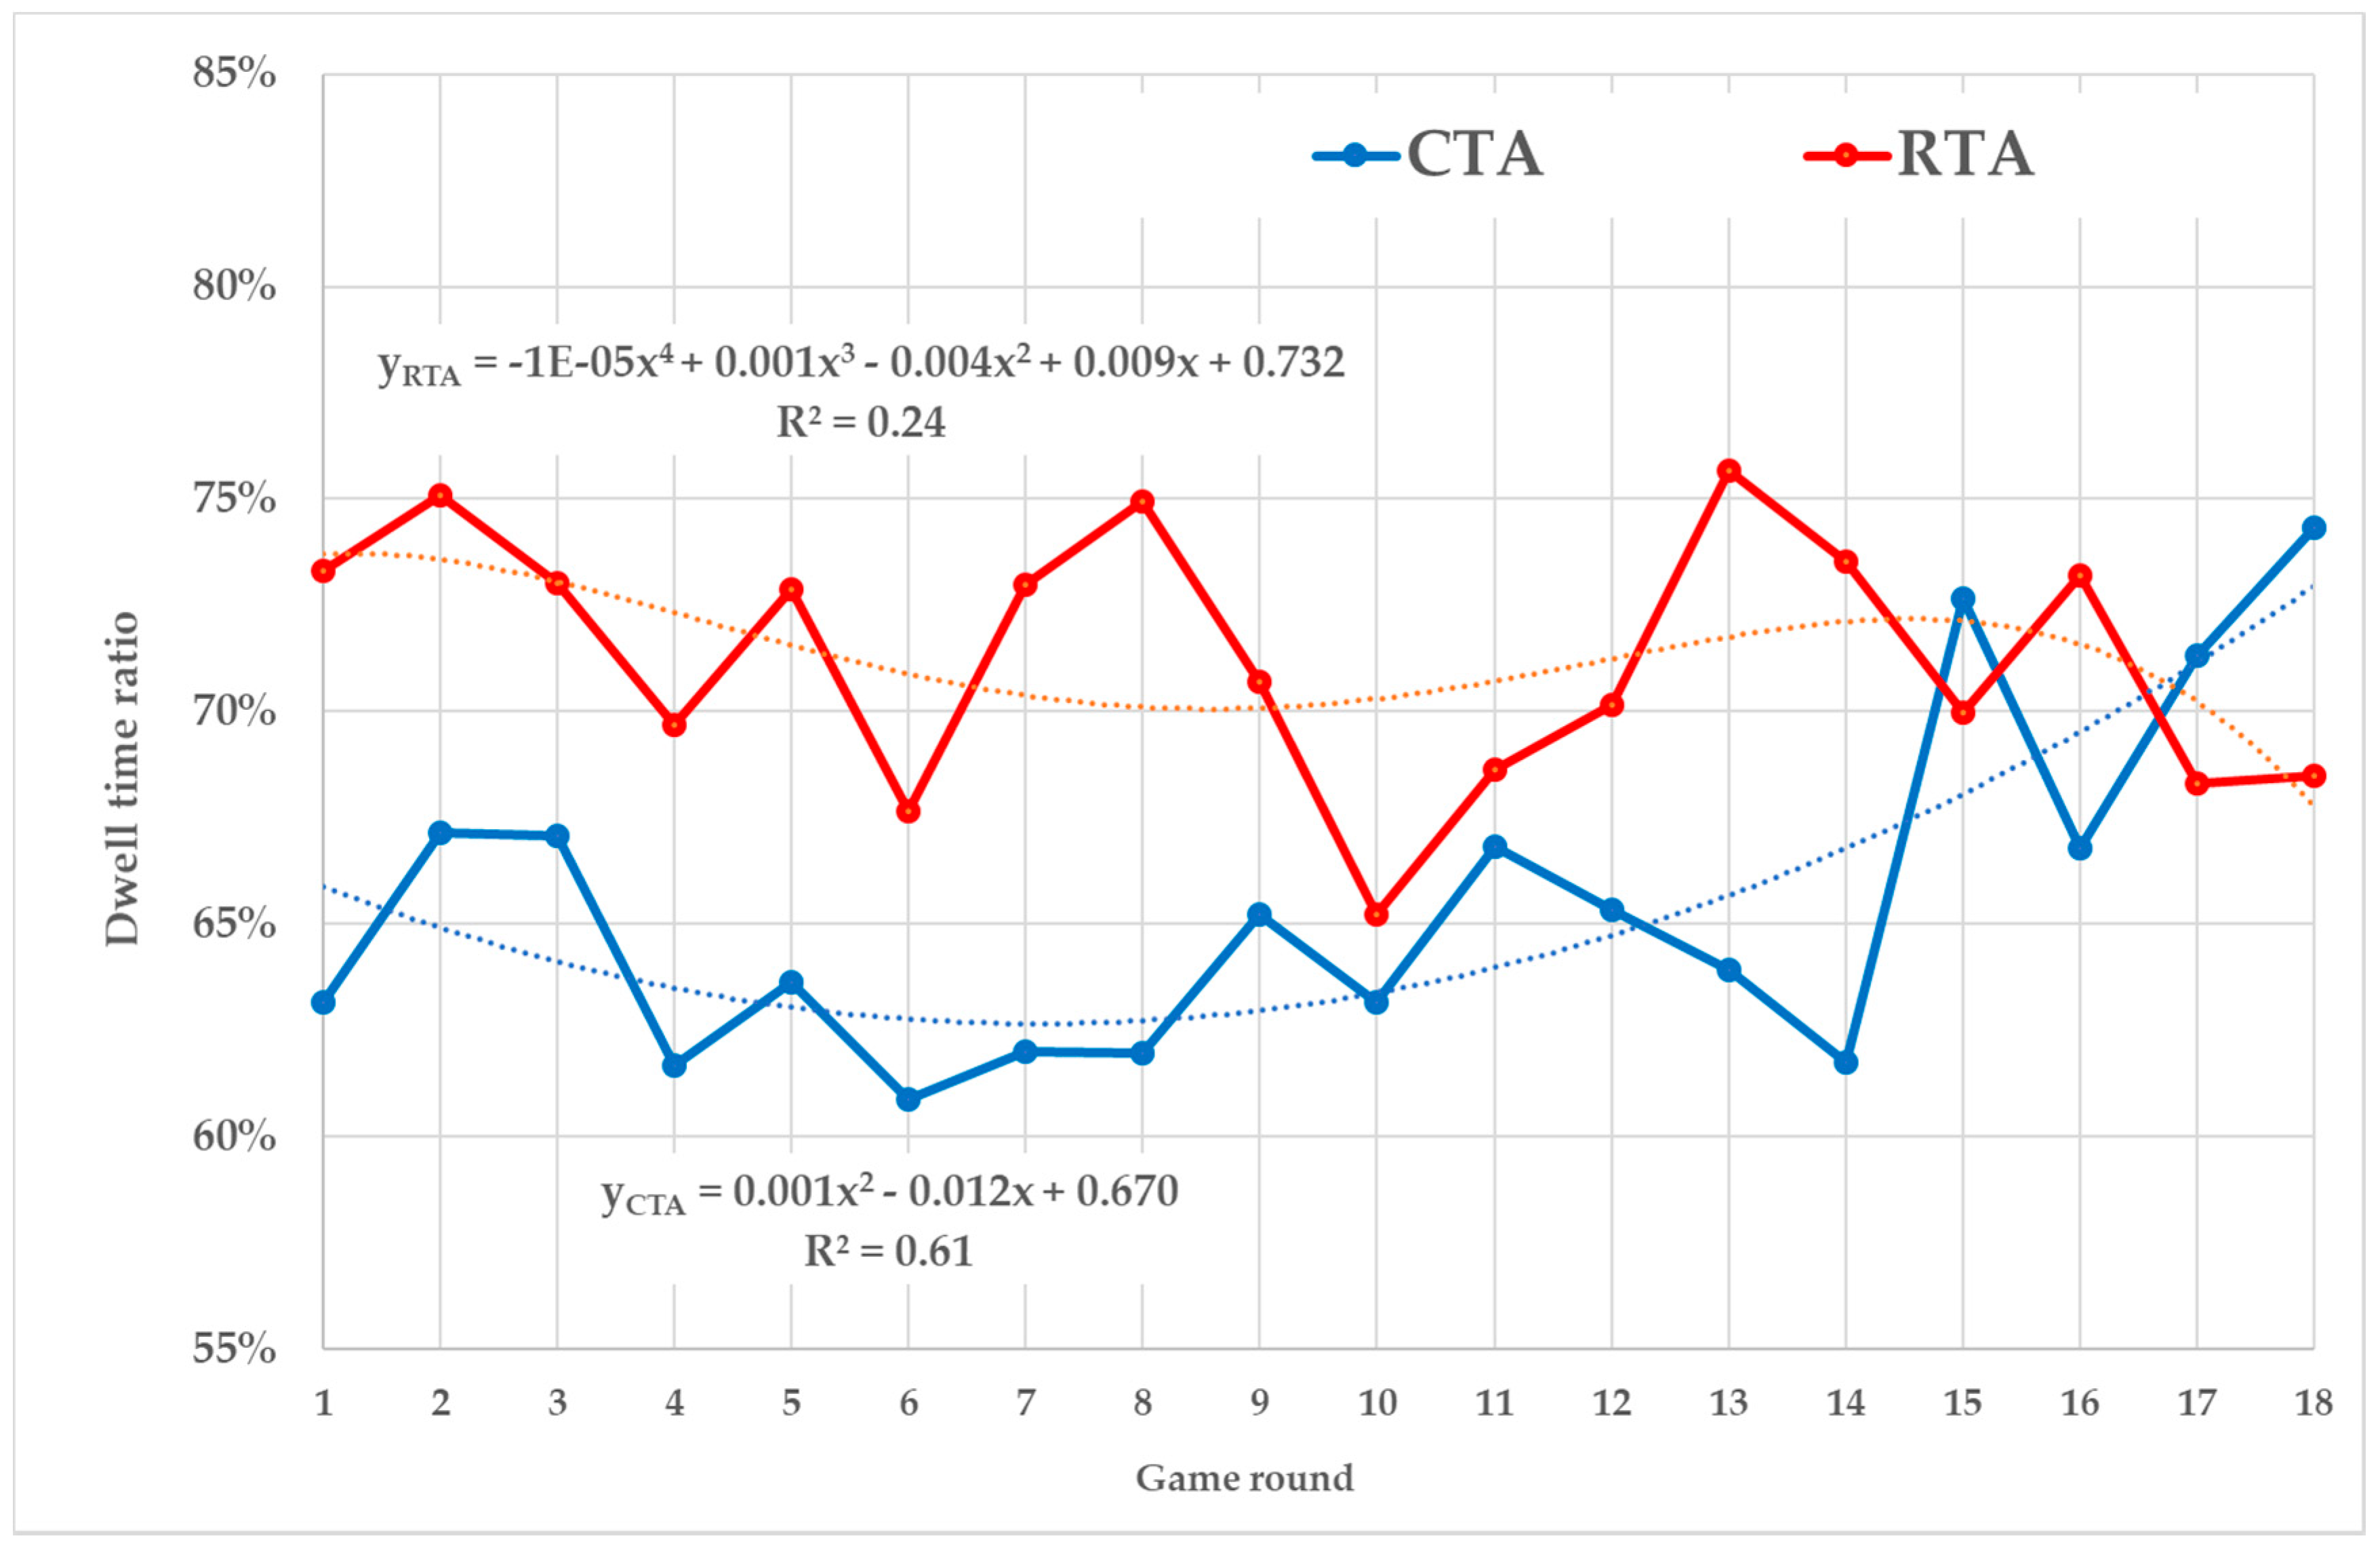
  • Dwell time ratio. The time spent within AOI is defined as one visit (duration of all fixations and saccades are counted) from entry to exit [22]. It is also called the dwell time. The count of all dwell times within one AOI is called total dwell time [21]. Thus, based on this metric, the proposed Dwell time ratio (Rdw) is defined as the ratio which includes several total dwell times:
    R d w = T d w m + T d w c + T d w d T d w s × 100   ( % )
    where the numerator of the ratio is the sum of three total dwell times (Tdwm, Tdwc, Tdwd), which represents the sum of visits in Market, Decision, and Competition (Figure 1). The denominator includes one AOI that represents the total dwell time in the whole game window (Tdws). The ratio result then indicates the percentage of the time the players spent watching AOIs necessary to the decision. The purpose of this metric is to assess which players are better able to focus their gaze only on important AOIs.
The comparison of all eye-tracking metrics between CTA and RTA is examined from two perspectives. First is the overall comparison, which includes data from all segments within groups. Means and medians of each metric were computed and the statistical significance of the differences among groups was tested by the Mann-Whitney test, with respect, that there was no normal distribution of data within most groups (p < 0.05, tested by Shapiro-Wilk).
The second perspective is the comparison of metrics’ development over time—during the game progress—based on the order of rounds (segments) played. It was assumed that selected metrics may change with increasing number of finished rounds. Therefore first, for each player, the individual values of metrics were arranged in chronological order according to the order of rounds in the game. This was done regardless of what game attempt the round was part of, i.e., regardless of eventually early termination of the game due to bankruptcy (e.g., if a player went bankrupt in 8th round and started a new game, the first round of the new game was marked as 9th). Then, for both think-aloud groups, the means of the given metrics in each round were calculated. The segments which were excluded from analysis (due to skipped selling phase and missing eye-tracking data) were not included in the computation of means. Nevertheless, they were excluded only from computation, there was no influence on arranged round order. In a practical application, this means that e.g., the mean of the 4th round of CTA was calculated from the values of 14 players, the 5th round includes the only 13 values (because one player skipped the sale) and 6th round includes again 14 values (everyone solve the decision again). We assumed the arranged rounds’ order should be maintained, despite the fact of segment exclusion. In these cases, the player still gained some experience with the playing. Therefore, the continuity of progress should be maintained.
Table 1 shows the number of segments, which are included in the analysis of each round. The numbers decrease as different players have played a different number of rounds. After the 18th round, less than half of CTA’s segments are included in results. Therefore, we consider the explanatory power of data in the following rounds as low. As a result, we limited the results shown in charts to 18 rounds.

2.4.3. Comparison of the Data Gathered by CTA and RTA

Although the main aim of the study is to compare the data gathered by eye-tracking, this assessment should not remain entirely isolated. To compare RTA and CTA, it is also important to consider the potential differences in comments provided by both methods. Therefore, at least a basic comparison of the data gathered by both verbalization methods should be provided.
Differences in the gathered data are usually assessed by qualitative analysis of transcripts of audio recordings. This is usually happened by coding texts according to the type of content [58,61,64,65]. Many different types of coding have been developed—either for particular environments in which they were used or according to the particular research intentions of their creators. As a result, the findings of studies across different research fields often differ significantly. Therefore, it is questionable how useful it would be to replicate some of the previous forms of qualitative coding in our specific environment. In addition, for a basic comparison of the gathered data, we consider suchlike analysis to be disproportionately extensive and extending beyond the aims of this study.
Therefore, we decided to assess the data gathered by CTA and RTA less sophisticatedly, but on the other hand, in a way that is more related to the topic of the present study. The way of our analysis is based on the study of Guan et al. [70], who used a similar approach for verification of data provided by RTA. For both methods, we examined whether participants’ explanations include information, which is necessary to consider for a decision. As in the case of the comparison of eye-tracking metrics, we limited the analysis to the selling phase. As was mentioned there are three AOIs that are necessary to follow during the making of this decision—Market, Competition, Decision. Therefore, we examined if players verbalized the content of these three AOIs when they describe their decisions. In other words, we compared which of the think-aloud methods provides more evidence about what information from the game screen were considered during decision-making. Among other things, this comparison allows us to find out how both methods are connected with the risk of the loss of such information. Based on this, it will be possible to better assess the need for a combination of CTA and/or RTA with eye-tracking.
The analysis was performed as follows. For each individual decision, it was necessary to check whether the AOIs were really watched and then to compare these findings with the data gathered by verbal protocols. Four combinations may happen:
(1)
Valid information—AOI is watched and its content is verbalized
(2)
Omitted information—AOI is watched but its content is not verbalized
(3)
Fabricated information—this phenomenon is connected only with RTA [68,69,70], respectively is very unlikely in the case of CTA. It means that AOI was not watched but a participant talks about its content.
(4)
Unidentified information—AOI is not watched and verbalized. This is, in a way, also valid information. However, it is of a different type from the first-mentioned combination. It provides evidence of the non-inclusion of AOI in the decision-making process. Therefore, these cases are included in a separate category.
Each of the 288 CTA and 329 RTA decisions was analyzed in the abovementioned way, which meant the assessment of 864 and 987 AOIs, respectively (three for each decision). The result of the assessment of each AOI was classified into one of four categories created according to defined combinations (watching vs. verbalizing). These categories were then used for comparison of the data gathered by CTA and RTA. The overall results (categories) are expressed in the form of absolute (count) and relative (%) frequencies. The statistical differences were tested by the Z-test for two proportions.

3. Results

3.1. Comparison of Game Results Achieved by RTA and CTA Players

CTA participants played 36 games (average 2.57 per player). The RTA group played 36 games too (average 2.12 per player). Table 2 gives a comparison of “net cash” achieved by players and their overall standings at the end of the game. Table 3 provides a comparison of the numbers of bankruptcy games. No statistically significant difference was found between the “net cash” (t(48) = −0.447; p = 0.657), the player’s overall standing (U = 632; p = 0.844), and the number of bankruptcies (z = 0.512; p < 0.610).

3.2. Overall Comparison of the Impact of CTA and RTA on Eye-Tracking

Table 4 shows the overall comparison of the monitored metrics. The number of fixations and total fixation duration are higher for CTA than for RTA (p < 0.001). The average duration of fixation and dwell time ratio are lower for CTA than for RTA (p < 0.001).

3.3. Comparison of the Impact of CTA and RTA on Eye-Tracking over Time (in the Game Progress)

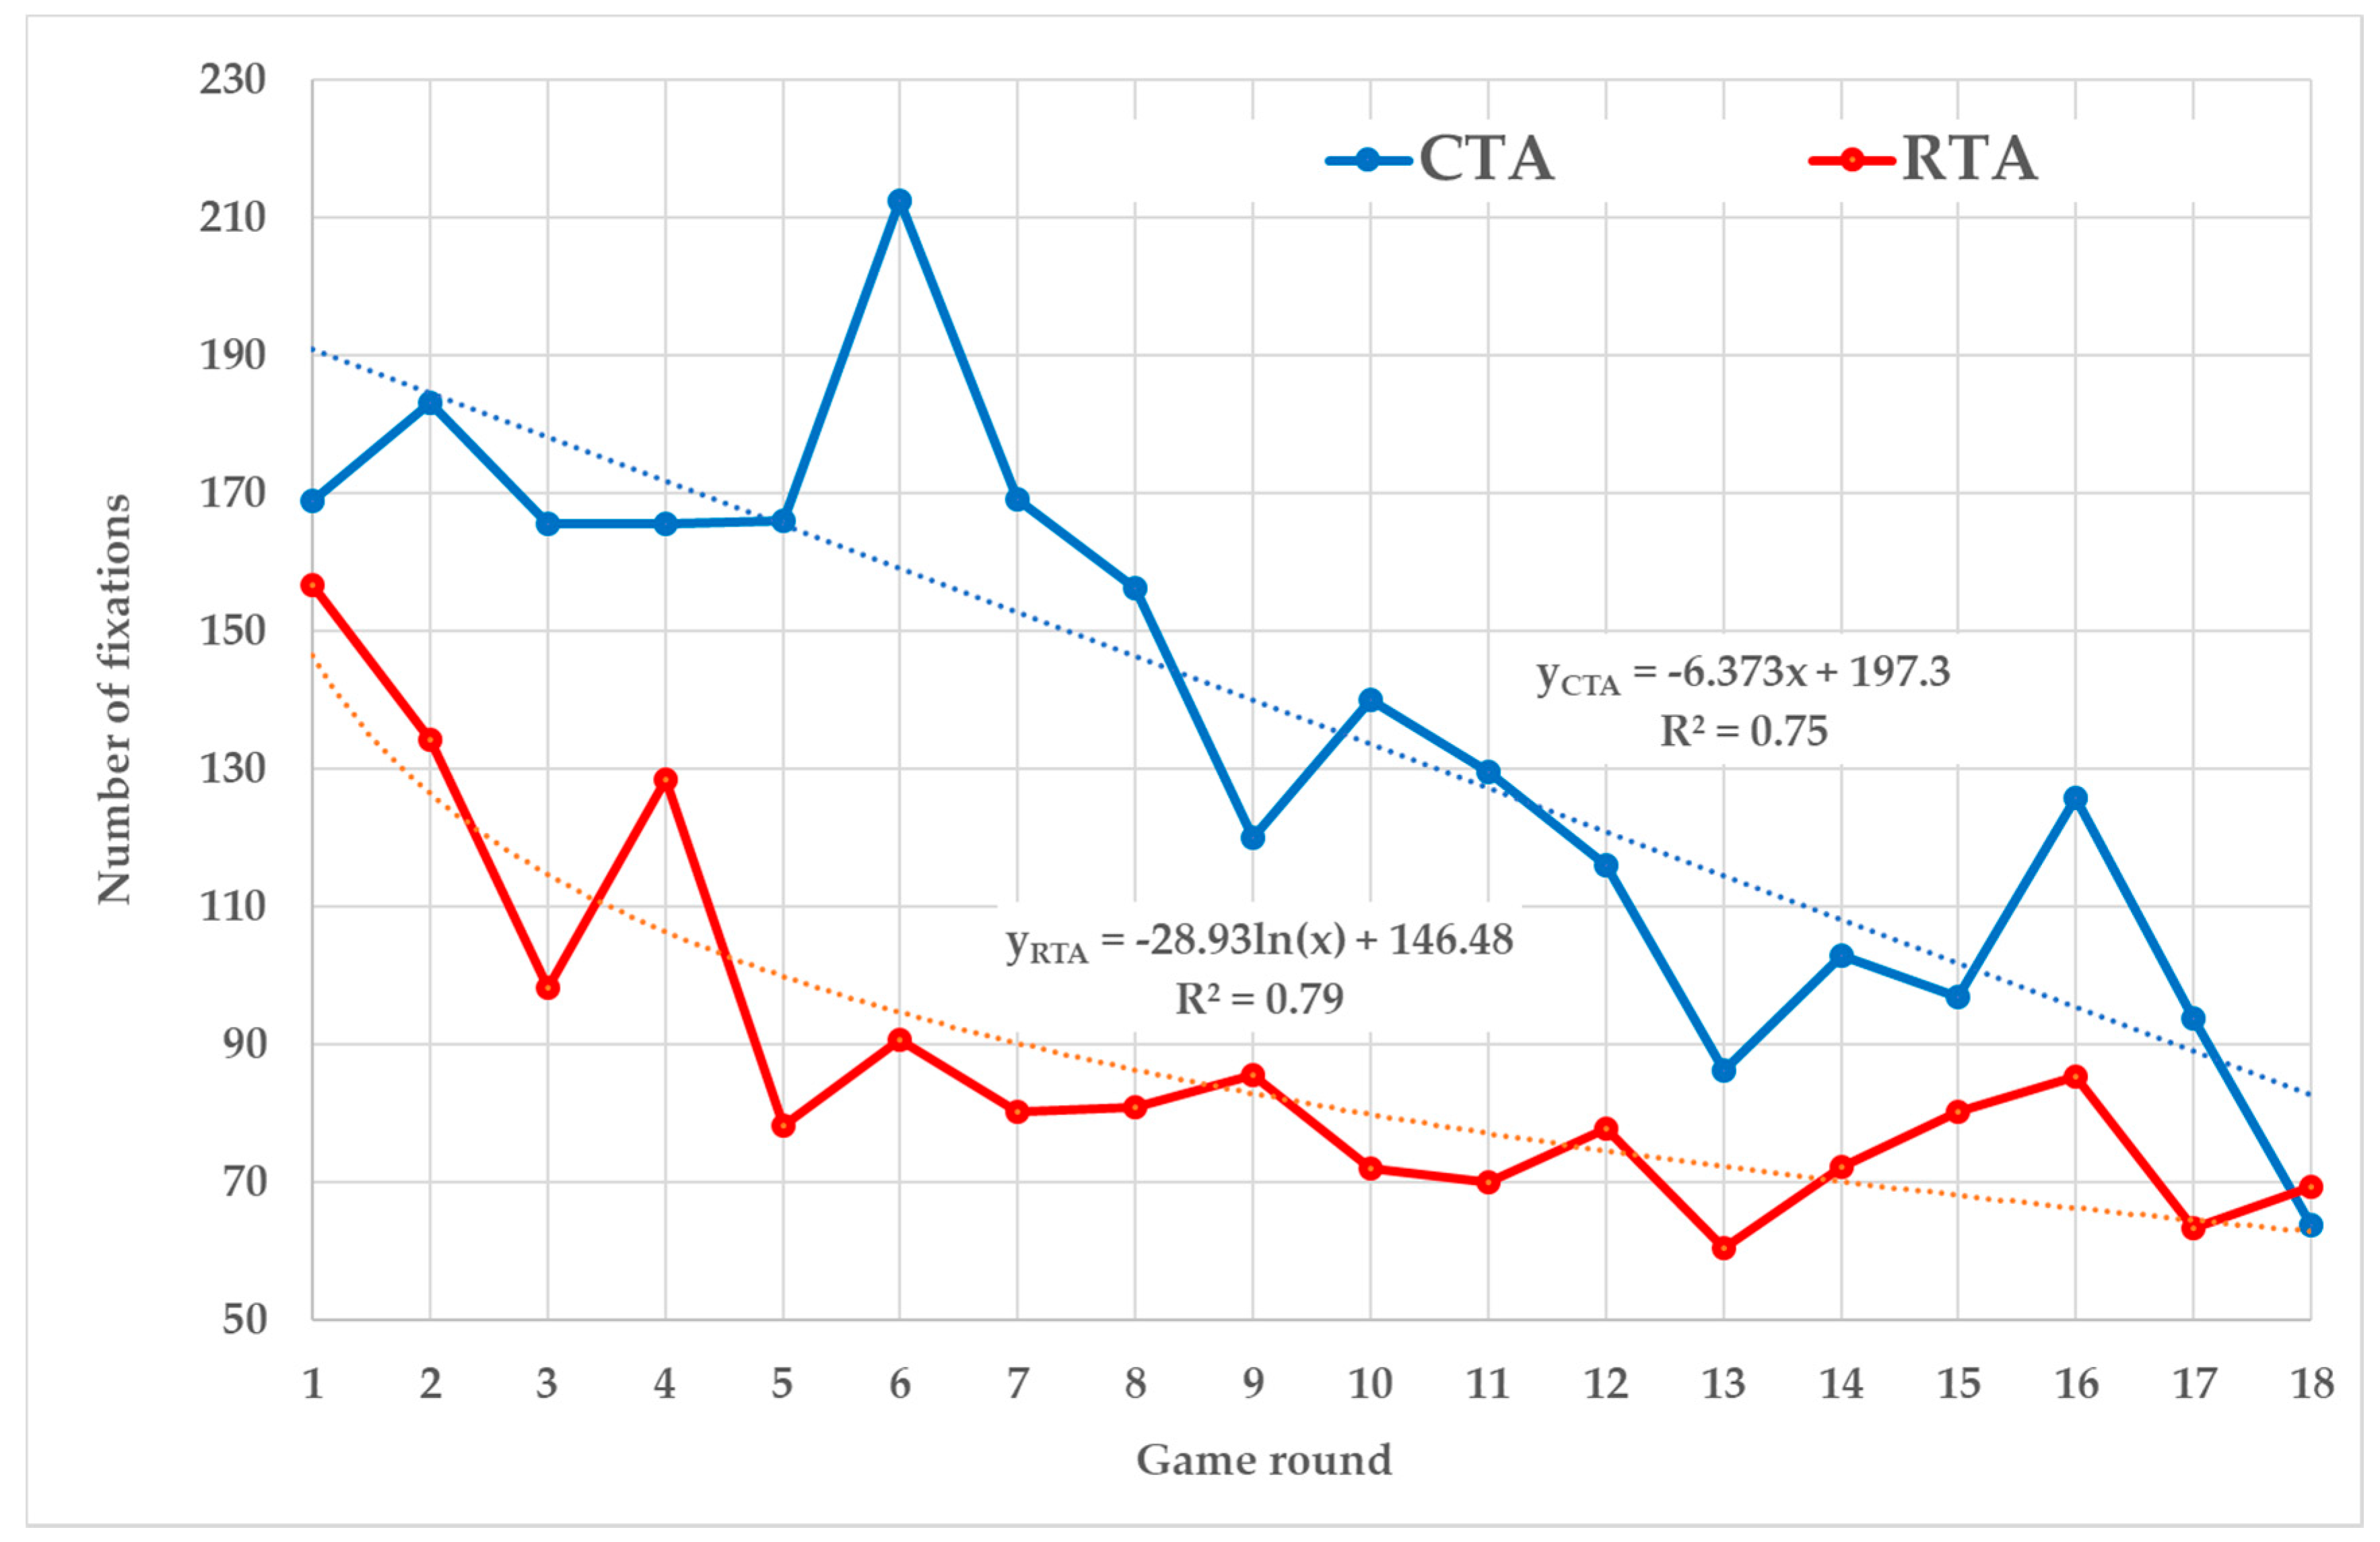
3.3.1. The Number of Fixations

CTA players achieved more fixations than the RTA players in all rounds, except the last one (Figure 2). The CTA players’ trend is best represented by a linear line (R2 = 0.75) when the number of fixations decreases by 6.37 in each round. The RTA’s trend is described by the logarithmic function (R2 = 0.79) when the number of fixations decreases faster in the first rounds. Differences among values of both curves decrease during the game.

3.3.2. Fixation Duration

The average fixation duration of the CTA’s group kept lower than the RTA’s group during all rounds (Figure 3). Both trends are described by sophisticated power functions, which show that the average duration of fixation does not change distinctly during the rounds, only fluctuates within a certain range.
Total fixation duration trend patterns of the CTA and RTA groups (Figure 4) are close to trend patterns of the number of fixations (Figure 2). The reason is that the total fixation duration in each round is the product of the number of fixations (which are gradually change through the rounds) and the average duration of fixation (what is the relatively unchangeable variable). The CTA group has a lower total fixation duration than the RTA group in all rounds, except the first and the last one. The CTA’s trend is represented by a linear line (R2 = 0.72) when the total fixation duration decreases by 1.38 s in each round. The RTA trend is described by the logarithmic function (R2 = 0.78) when the total fixation duration decreases faster in the first rounds.

3.3.3. Dwell Time Ratio

The progress of Dwell time ratio is shown in Figure 5. The RTA curve fluctuates greatly, and the best-found trend function does not describe its development well (R2 = 0.24). The power function of the CTA trend has a higher explanatory power (R2 = 0.61). The slight downward trend during the first rounds is alternated by the upward trend starting with the 7th round. The RTA ratio is higher than CTA up to 14th round. Then the values are equalized (the order alternates).

3.4. Comparison of the Data Gathered by CTA and RTA

The comparison of the data gathered by CTA and RTA is summarized in Table 5. Only four cases for CTA and four for RTA, when players did not watch some AOI, were found. In all these cases, the content of AOIs was not verbalized as well. This means both a very low proportion of unidentified information (CTA: 0.5%, RTA: 0,4%) and no occurrence of fabricated information for both think-aloud methods. No statistically significant difference was found between these two categories (unidentified information: z = 0.189; p = 0.85, fabricated information: z and p are not available).
On the other hand, a significant difference between the methods was found in the case of the count of gathered valid information (z = 8.988; p < 0.001), respectively in case of the omitted information (z = 9.095; p < 0.001). CTA’s participants verbalized the content of AOIs in 89.1% of cases, while RTA’s participants only in 72.4%. It means that RTA results in a higher share of the omitted information (27,2%) then CTA (10,4%).

4. Discussion

Existing studies have provided much evidence of differences between CTA and RTA. One of the frequently discussed topics is the quality and quantity of data provided by these methods [55,56,59,60,61,68]. Scientists, who have described deficiencies of verbal protocols, recommend their combination with eye-tracking, which helps to complete missing data and insights [47,54,64,65]. However, they often do not consider the possible impact of think-aloud on eye movements. In this study, it was empirically verified that there is a significant difference in data provided by eye-tracking when using CTA or RTA.

4.1. Overall Comparison of the Impact of CTA and RTA on Eye-Tracking

The total fixation duration is significantly higher when using CTA than when the task is carried out in silence (RTA). Longer fixation duration can indicate two types of cognitive processes: (1) an object is interesting to a participant or (2) the cognitive processing of data is more difficult [21,80]. In the case of this study, the 1st assumption can be rejected. Both groups of respondents faced the same experimental environment, the same game’s design with the same layout and data structure on the screen. There is no indication that the CTA players considered some parts of the game to be more attractive.
The 2nd assumption is much more likely. The higher total fixation duration of CTA is mainly due to their higher number because the average length of fixation is conversely a little higher for the RTA than for CTA. A higher number of fixations then also indicate a higher cognitive effort [79]. It seems that revealed higher cognitive processing is evidence of the presence of the CTA’s dual cognitive load, described by Ericsson and Simon [56]. The cognitive effort is divided among the process of task solving and the process of verbalization. Therefore, it can be considered that the number of fixations can also be divided between these processes. In other words, the part of the CTA’s fixations arises during the decision-making process itself when the player concentrates on the task, and part of the fixations arises during the verbalization when the player concentrates on speaking. The reason for this assertion is based on fact, that CTA and RTA players achieved the same game results (Table 2 and Table 3), which suggests their similar decision-making skills. Thus, it cannot be assumed that the task itself was more demanding for one or another group. Therefore, we assume, that the decision-making process itself needed the same cognitive effort, and thus also a similar number of fixations of CTA’s and RTA’s players.
The task solving process during the selling phase can be divided into several sub-processes with different demands on cognitive processing. The extent to which the fixations are divided between two cognitive processes can then be related to the complexity of these sub-processes and may vary among them. Verbalizing simple tasks carries a lower risk of the dual load than more demanding tasks [56]. Studies that investigate CTA validation by eye-tracking [65,81] suggest that for simple tasks such as reading or describing procedures, fixations take place simultaneously with verbalizations. Thus, it can be assumed that when a player reads data from the screen or performs simple tasks (mouse-clicking, decision writing), fixations may correlate to verbalizations. Contrarily, Elling et al. [64] argue that verbalization may not correlate with fixation in many cases of more demanding tasks when many verbalized thoughts cannot be associated with fixations at all. Therefore, the distribution of fixations between two cognitive processes may occur especially in cases of more complex tasks (e.g., decision-making), when participants verbalize some cognitively more demanding thoughts. In such cases, the participants performing complex tasks can also pause their speech [64,65], but this does not necessarily mean that task circumstances would not be verbalized at all. We noticed many short moments where CTA players themselves redressed the pauses. They added comments immediately after the actions during which they were silent for a few seconds. This usually happened when they needed more cognitive capacity as they thought deeply about something. This suggests that in these short periods of increased cognitive stress, players can naturally switch from CTA to RTA, by commenting on the actions, they have just completed. As a result, the number of fixations increases during these “delayed verbalizations”. The participants either observed again cues needed for the already done decision—“repeated fixations” happen, or watched some part of the screen, without a higher cognitive perception of what is observed, because they were focused only on the verbalization of previous steps—“purposeless fixations” happen. The evidence of the presence of purposeless fixations while CTA use is also provided by the Dwell time ratio, where CTA participants did more fixations outside the AOIs important for the decision.
Nevertheless, the presence and more detailed analysis of repeated and purposeless fixations should be subject to future research, as the abovementioned evidence in this study is not quite direct and unambiguous. In fact, such situations can occur in very short time periods and they may quickly alternate or partially overlap. Therefore, it may not be easy to separate the eye-tracking data accompanying individual cognitive processes when CTA is used. In addition, the negative impact on eye-tracking may not be caused by only dual cognitive load. The unnatural physical behavior of CTA participants can also contribute to the increased number of fixations as speaking may influence the head movements and thus also the eyes [67,70,72]. CTA players in the present study achieved a lower average fixation duration, but the number of fixations was much higher. This could indicate that keeping a stable gaze at an exact point of the screen was more difficult for them and a higher number of shorter fixations can occur in a certain area of this point.

4.2. Comparison of the Impact of CTA and RTA on Eye-Tracking over Time (in the Game Progress)

Eye-tracking data subdivided into individual game rounds offer another view on the task-solving process as well as on the verbalization process. Eye-tracking is widely used also in the education field, where several studies evidenced that there are significant differences in eye movements between experienced and less experienced participants [10,39,40]. The development of number of fixations and total fixation duration in the present study has a decreasing trend over time, which applies to the use of both think-aloud methods. As fixations indicates cognitive load [24,79], it can be assumed, that their decreasing number and total duration relates to increasing experience. Players’ performance during the game increases with experience gathered in each round. During the first rounds, players think about decisions more and therefore they paid more attention to various objects on the screen. When players’ orientation in the game and decision knowledge are getting better, then they need less time to grasp data from the screen and they are more focused only on cues necessary for the decision. Therefore, a decreasing number and total duration of fixations are evidence of the learning process within the game. The original complex and cognitively demanding processes are becoming more and more simple depending on the number of repetitions of the situation they are associated with. This is in line with the purpose of the used simulation FactOrEasy®, which is not only reflects the knowledge and experience of the participants [11,74,78] but also serves as a learning tool [73].
Nevertheless, the comparison of RTA and CTA curves of number of fixations (Figure 2) and total fixation duration (Figure 4) suggest that differences among the methods’ impact on eye-tracking metrics are also developed during the game progress. Higher values on the CTA curves are caused by the fact that CTA fixations are affected by both the task-solving process and the verbalization process, while the RTA curves contain the only fixations connected with task-solving. It means that eye-tracking metrics recorded in silence (when RTA is used) provide independent evidence about player’s behavior in the simulation game.
RTA’s logarithmic trends of the mentioned metrics confirm this conclusion as they correspond with the usual course of FactOrEasy®. In the first rounds, players try to better understand the circumstances of each decision and they set an overall strategy. This needs more cognitive effort, which is accompanied by higher values of monitored metrics. In the following rounds, players try to follow their strategies and they are more focused on individual decisions that are becoming more and more routine. This is accompanied by the lower values of monitored metrics.
In the case of CTA, it is too difficult to separate fixations associated with a task-solving process from fixations associated with verbalizations. Therefore, eye-tracking in combination with the CTA cannot be considered as accurate, for the purpose of monitoring player’s progress in the game. On the other hand, the results suggest that both cognitive processes are also undergoing certain development during the game. CTA brings higher values of the number of fixations and total fixation duration during the opening rounds than RTA. Nevertheless, the CTA values quickly decrease in the linear trend and they are getting closer to those of RTA in the latter rounds. This development allows to confirm or further extend several assumptions about CTA mentioned in the paper:
  • The CTA can make participants feel unnatural and confused. It may take some time while they get used to the task, especially at the beginning of the experiment.
  • Both cognitive processes become less and less demanding depending on the experience gained. As well as players repeat the process of task-solving in each round, they also repeat verbal comments on what they do. At the beginning of the game, participants must create verbal expressions, name objects and thoughts, and interpret logical connections among them. This process is optimized during the game, comments are shortened, and the verbalization becomes more natural.
  • When the task-solving process is becoming easier (the original complex and cognitively demanding processes of decision-making are getting simple), participants can be better focused on verbalizations. The verbalizations of simpler tasks are more natural and therefore, they start to correlate more frequently simultaneously with eye movements.
The abovementioned findings are also supported by the results of dwell time ratio. The CTA’s trend has been increasing over the rounds and has been reaching the same values as in the RTA case in recent rounds. This indicates that CTA players are increasingly focusing only on substantial AOIs and the number of purposeless fixations is reduced over the game.

4.3. Comparison of the Data Gathered by CTA and RTA

The latest analysis of our study aimed to compare the data gathered by CTA and RTA. It was examined whether participants really verbalized data of the game screen, which they considered during the decision-making. In this regard, we found that RTA players omitted significantly more information (27.2%) than CTA players (10.4%). Thus, we can confirm claims of a number of scholars [55,56,58], that RTA is associated with a higher risk of forgetting information. Therefore, if researchers considering the use of RTA want to have sufficient evidence of which screen information is considered by participants during the decision-making process, then they always should combine this method with eye-tracking. In the case of CTA, the risk of losing such evidence is lower because it is more natural for participants to verbalize the information, which they can read from the screen while solving the task [64,65,81].
However, a choice of the appropriate verbal protocol may depend on the specific aspects of the decision-making which are an object of the intended research. We are aware, that there are other points of view such as references about knowledge, inner conviction, justifications of thoughts, used strategies, etc. These aspects are not empirically assessed in the present study, which is one of the main paper’s limitations. Nevertheless, several previous studies proved that explanations of these aspects are better provided by the RTA method while CTA provides mainly comments on basic actions (reading, writing) and their outcomes [61,68]. Even though an accurate qualitative analysis of CTA and RTA transcripts by text coding has not been performed, the verbalizations collected during our study appear to suggest similar findings. CTA players verbalized more screen information because they read them loudly. However, they provided subsequently fewer explanations of how they cognitively worked with them. Given that both groups have achieved similar game results, this does not necessarily mean that CTA players thought about these cues less than RTA players. A much more likely explanation is that it was difficult for them to express all thoughts when they were concurrently focused on playing the game. This is consistent with previous findings that claim that some ideas may be lost during CTA use because they cannot be expressed in real-time [82]; and that cognitive processes are quicker than verbal processes, which means that people can think more about something then they are able to concurrently express [83].
In view of the abovementioned findings, we can afford to make the recommendation that a combination of RTA with eye-tracking is a more appropriate way to study the decision-making processes in a game environment. Despite the fact RTA results in more omissions of what screen information was considered during decision-making, eye-tracking can easily add this evidence. On the other hand, CTA, unlike RTA, provides less evidence of how this information is cognitively processed, which is a shortcoming that cannot be solved by adding eye-tracking.

4.4. Limitations of the Study

The results of this study and their validity are limited by several factors, which indicate some other possibilities for further research. First, the experiment was conducted in the specific simulation game FactOrEasy®. Applying think-aloud methods in different games can produce different results of eye-tracking metrics. These results may depend on game designs and on the level of the difficulty of the tasks, which participants face. Secondly, the present study deals mainly with differences in eye-tracking metrics when combining this method with verbal protocols. Therefore, it provides only a basic assessment of data obtained by verbal protocols. Accurate examination of CTA and RTA players’ transcripts by coding of the text was not performed. However, we assume that the scope of such an analysis is beyond the aims of the present study. For instance, it is very likely that such an analysis will require the development of a specific encoding method, which would be suitable for the game environment and research purposes. Therefore, we consider this topic as an appropriate topic to create a further separate study. Thirdly, only the general use of the mentioned methods for the given purpose is described. We do not provide any conclusions about the specific decision-making processes of participants, any assessment of their decision-making skills, etc. The choice of the appropriate verbal protocol, its combination with eye-tracking, and the choice of right metrics may depend on the specific aims, which will be objects of the intended research of further studies.

5. Conclusions

Many authors recommend using a combination of verbal protocols and eye-tracking to investigate cognitive processes [47,54,64,65,67,71] However, so far there have been few references to a possible difference in the use of CTA and RTA in terms of their impact on data gathered by eye-tracking. In this study, we empirically verified that there is a significant difference in data provided by eye-tracking when using CTA or RTA.
Gerjets et al. [71] state that eye-tracking brings an extension of think-aloud findings by pieces of evidence of fine-grained or implicit cognitive processes. However, the findings in this study suggest that such an extension makes sense only in the case of RTA use. All examined indicators empirically confirm the claims, that RTA has no impact on eye-tracking metrics, while CTA distorts them significantly [67,70,72]. Metrics recorded in silence provide independent evidence about player progress in the game. Thus, our results suggest that RTA is more suitable for combined use with eye-tracking for the purpose of decision-making research in this environment. When using CTA, eye-tracking metrics are affected by dual cognitive load and unnatural physical behavior of participants. A combination of the task-solving process with the verbalization process brings repeated and purposeless fixations, which are redundant and distorting.
However, the development of monitored metrics over time suggests that the problem of the dual cognitive load decrease in the game progress. In later game rounds, the CTA players achieved the same number of fixations as RTA players. In addition, they were also able to concentrate equally well only on important cues. It means that if participants repeat the same or similar task multiple times, the negative effect of the dual load on CTA may decrease. This is in line with studies [56,61], which recommend performing a suitable training task before the experimental one and repeating it until participants prove sufficient ability of concurrent verbalization. However, the question remains whether this recommendation is also valid for decision-making research, especially if the participants are dealing with a series of several different decisions (like in game). Frequent repetition of the training task, which is similar to the experimental one, can distort the results of the experiment itself.
Nonetheless, even the comparison of the data gathered by both think-aloud methods suggested that a combination of RTA with eye-tracking should be a more appropriate method for the research of decision-making processes in the game environment. The reason is that CTA provides more evidence about what screen information is considered during decision-making, while RTA verbalizations contain more evidence about how this information is cognitively processed during decision-making. In the case of RTA, the omissions of “what” can be resolved by adding eye-tracking data, whereas, in the case of CTA, eye-tracking cannot help to explain missing “how”.
However, the findings of the present study do not either mean a definitive rejection of the CTA for research purposes in the field of simulations and games. The final choice of method always depends on the aims of the intended research [6,56]. The conducted research was focused only on the examination of aspects of the decision-making process in the game environment. There are other fields, like usability testing [60,62,66] or education [68,84], where CTA has added value. The gathered results suggest the potential of the application, in particular, in the second-mentioned field. The CTA is often associated with reactivity [56,66] that may have a positive impact on the learning process [85,86]. Eye-tracking metrics indicate that the learning process in a game environment may have different development depending on whether the RTA or CTA is being performed. Thus, future research could focus on whether thinking-aloud can support the learning process in the environment of simulations and games, and on what benefits CTA and RTA brings for this purpose.

Author Contributions

Conceptualization, M.P. and I.T.; methodology, M.P.; validation, M.P.; formal analysis, M.P.; investigation, M.P.; resources, M.P. and L.P.; data curation, M.P.; writing—original draft preparation, M.P., L.P. and I.T.; writing—review and editing, M.P., L.P. and I.T.; visualization, M.P.; supervision, I.T.; project administration, M.P. and L.P. All authors have read and agreed to the published version of the manuscript.

Funding

This article was created with the support of the IGA PEF CZU (CULS) Prague, number 2019A0001—Analysis of the managers’ error behaviour in the decision-making process using the business simulation game FactOrEasy®.

Conflicts of Interest

The authors declare no conflict of interest. The funders had no role in the design of the study; in the collection, analyses, or interpretation of data; in the writing of the manuscript, or in the decision to publish the results.

References

  1. Grund, C.K.; Meier, M.C. Towards game-based management decision support: Using serious games to improve the decision process. In Proceedings of the Multikonferenz Wirtschaftsinformatik, MKWI 2016, Universitatsverlag Ilmenau, Ilmenau, Germany, 9–11 March 2016; Volume 1, pp. 155–166. [Google Scholar]
  2. Zeike, S.; Choi, K.-E.; Lindert, L.; Pfaff, H. Managers’ Well-Being in the Digital Era: Is it Associated with Perceived Choice Overload and Pressure from Digitalization? An Exploratory Study. Int. J. Environ. Res. Public Health 2019, 16, 1746. [Google Scholar] [CrossRef] [Green Version]
  3. Abubakar, A.M.; Elrehail, H.; Alatailat, M.A.; Elçi, A. Knowledge management, decision-making style and organizational performance. J. Innov. Knowl. 2019, 4, 104–114. [Google Scholar] [CrossRef]
  4. Trevis Certo, S.; Connelly, B.L.; Tihanyi, L. Managers and their not-so rational decisions. Bus. Horiz. 2008, 51, 113–119. [Google Scholar] [CrossRef]
  5. Thywissen, C.; Pidun, U.; zu Knyphausen-Aufseß, D. Process matters—The relevance of the decision making process for divestiture outcomes. Long Range Plann. 2018, 51, 267–284. [Google Scholar] [CrossRef]
  6. Aitken, L.M.; Marshall, A.; Elliott, R.; McKinley, S. Comparison of ‘think aloud’ and observation as data collection methods in the study of decision making regarding sedation in intensive care patients. Int. J. Nurs. Stud. 2011, 48, 318–325. [Google Scholar] [CrossRef] [Green Version]
  7. Franco-Watkins, A.M.; Johnson, J.G. Decision moving window: Using interactive eye tracking to examine decision processes. Behav. Res. Methods 2011, 43, 853–863. [Google Scholar] [CrossRef] [Green Version]
  8. Robinson, J.; Sinclair, M.; Tobias, J.; Choi, E. More Dynamic Than You Think: Hidden Aspects of Decision-Making. Adm. Sci. 2017, 7, 23. [Google Scholar] [CrossRef] [Green Version]
  9. Coovert, M.D.; Winner, J.; Bennett, W.; Howard, D.J. Serious Games are a Serious Tool for Team Research. Int. J. Serious Games 2017, 4. [Google Scholar] [CrossRef]
  10. Lee, J.Y.; Donkers, J.; Jarodzka, H.; van Merriënboer, J.J.G. How prior knowledge affects problem-solving performance in a medical simulation game: Using game-logs and eye-tracking. Comput. Hum. Behav. 2019, 99, 268–277. [Google Scholar] [CrossRef]
  11. Prokop, M.; Vrábelová, T.; Nováková, M.; Šímová, T. Evaluation of managerial and decision-making skills of small-scale farmers. In Agrarian Perspectives XXVIII, Business Scale in Relation to Economics, Proceedings of the 28th International Scientific Conference, Prague, Czech Republic, 18–19 September 2019; Czech University Life Sciences Prague: Prague, Czech Republic, 2019; Volume 28, pp. 218–225. [Google Scholar]
  12. Shute, V.J.; Wang, L. Measuring Problem Solving Skills in Portal 2. In E-Learning Systems, Environments and Approaches; Isaías, P., Spector, J.M., Ifenthaler, D., Sampson, D.G., Eds.; Springer International Publishing: Cham, Switzerland, 2015; pp. 11–24. ISBN 978-3-319-05824-5. [Google Scholar]
  13. Arnold, U.; Söbke, H.; Reichelt, M. SimCity in Infrastructure Management Education. Educ. Sci. 2019, 9, 209. [Google Scholar] [CrossRef] [Green Version]
  14. Bekebrede, G.; van Bueren, E.; Wenzler, I. Towards a Joint Local Energy Transition Process in Urban Districts: The GO2Zero Simulation Game. Sustainability 2018, 10, 2602. [Google Scholar] [CrossRef] [Green Version]
  15. Gogg, T.J.; Mott, J.R.A. Introduction to Simulation. In Proceedings of the 25th Conference on Winter Simulation, Los Angeles, CA, USA, 12–15 December 1993; ACM: New York, NY, USA, 1993; pp. 9–17. [Google Scholar]
  16. Kato, P.M.; de Klerk, S. Serious Games for Assessment: Welcome to the Jungle. J. Appl. Test. Technol. 2017, 18, 1. [Google Scholar]
  17. Peña Miguel, N.; Corral Lage, J.; Mata Galindez, A. Assessment of the Development of Professional Skills in University Students: Sustainability and Serious Games. Sustainability 2020, 12, 1014. [Google Scholar] [CrossRef] [Green Version]
  18. Ritterfeld, U.; Cody, M.J.; Vorderer, P. (Eds.) Serious Games: Mechanisms and Effects; Routledge: New York, NY, USA, 2009; ISBN 978-0-415-99369-2. [Google Scholar]
  19. Cooke, N.J. Varieties of knowledge elicitation techniques. Int. J. Hum. Comput. Stud. 1994, 41, 801–849. [Google Scholar] [CrossRef]
  20. Schulte-Mecklenbeck, M.; Johnson, J.G.; Böckenholt, U.; Goldstein, D.G.; Russo, J.E.; Sullivan, N.J.; Willemsen, M.C. Process-Tracing Methods in Decision Making: On Growing Up in the 70s. Curr. Dir. Psychol. Sci. 2017, 26, 442–450. [Google Scholar] [CrossRef]
  21. Berger, T. Using eye-tracking to for analyzing case study materials. Int. J. Manag. Educ. 2019, 17, 304–315. [Google Scholar] [CrossRef]
  22. Holmqvist, K.; Nystrom, M.; Andersson, R.; Dewhurst, R.; Jarodzka, H.; van de Weijer, J. Eye Tracking: A Comprehensive Guide to Methods and Measures; First Published in Paperback; Oxford University Press: Oxford, UK, 2015; ISBN 978-0-19-873859-6. [Google Scholar]
  23. Gegenfurtner, A.; Lehtinen, E.; Säljö, R. Expertise Differences in the Comprehension of Visualizations: A Meta-Analysis of Eye-Tracking Research in Professional Domains. Educ. Psychol. Rev. 2011, 23, 523–552. [Google Scholar] [CrossRef]
  24. Just, M.A.; Carpenter, P.A. A theory of reading: From eye fixations to comprehension. Psychol. Rev. 1980, 87, 329–354. [Google Scholar] [CrossRef]
  25. Russo, J.E. Eye fixations as a process trace. In A Handbook of Process Tracing Methods for Decision Research: A Critical Review and User’s Guide; Society for Judgment and Decision Making Series; Psychology Press: New York, NY, USA, 2011; pp. 43–64. ISBN 978-1-84872-864-6. [Google Scholar]
  26. Zhan, Z.; Zhang, L.; Mei, H.; Fong, P. Online Learners’ Reading Ability Detection Based on Eye-Tracking Sensors. Sensors 2016, 16, 1457. [Google Scholar] [CrossRef] [Green Version]
  27. Yamauchi, T.; Seo, J.; Sungkajun, A. Interactive Plants: Multisensory Visual-Tactile Interaction Enhances Emotional Experience. Mathematics 2018, 6, 225. [Google Scholar] [CrossRef] [Green Version]
  28. Brunyé, T.T.; Gardony, A.L. Eye tracking measures of uncertainty during perceptual decision making. Int. J. Psychophysiol. 2017, 120, 60–68. [Google Scholar] [CrossRef]
  29. Rayner, K. Eye movements in reading and information processing: 20 years of research. Psychol. Bull. 1998, 124, 372–422. [Google Scholar] [CrossRef]
  30. Rayner, K. The 35th Sir Frederick Bartlett Lecture: Eye movements and attention in reading, scene perception, and visual search. Q. J. Exp. Psychol. 2009, 62, 1457–1506. [Google Scholar] [CrossRef]
  31. Balling, L.W. Does good writing mean good reading? An eye-tracking investigation of the effect of writing advice on reading. Fachsprache 2013, 35, 2–23. [Google Scholar] [CrossRef]
  32. Anson, C.M.; Schwegler, R.A. Tracking the Mind’s Eye: A New Technology for Researching Twenty-First-Century Writing and Reading Processes. Coll. Compos. Commun. 2012, 64, 151. [Google Scholar]
  33. Hacker, D.J.; Keener, M.C.; Kircher, J.C. TRAKTEXT: Investigating writing processes using eye-tracking technology. Methodol. Innov. 2017, 10, 205979911668957. [Google Scholar] [CrossRef] [Green Version]
  34. Berni, A.; Maccioni, L.; Borgianni, Y. Observing Pictures and Videos of Creative Products: An Eye Tracking Study. Appl. Sci. 2020, 10, 1480. [Google Scholar] [CrossRef] [Green Version]
  35. Lisińska-Kuśnierz, M.; Krupa, M. Suitability of Eye Tracking in Assessing the Visual Perception of Architecture—A Case Study Concerning Selected Projects Located in Cologne. Buildings 2020, 10, 20. [Google Scholar] [CrossRef] [Green Version]
  36. Popelka, S.; Vondrakova, A.; Hujnakova, P. Eye-tracking Evaluation of Weather Web Maps. ISPRS Int. J. Geo-Inf. 2019, 8, 256. [Google Scholar] [CrossRef] [Green Version]
  37. Hercegfi, K.; Komlodi, A.; Koles, M.; Tovolgyi, S. Eye-Tracking-based Wizard-of-Oz Usability Evaluation of an Emotional Display Agent Integrated to a Virtual Environment. ACTA Polytech. Hung. 2019, 16, 145–162. [Google Scholar]
  38. Burian, J.; Popelka, S.; Beitlova, M. Evaluation of the Cartographical Quality of Urban Plans by Eye-Tracking. ISPRS Int. J. Geo-Inf. 2018, 7, 192. [Google Scholar] [CrossRef] [Green Version]
  39. Jarodzka, H.; Holmqvist, K.; Gruber, H. Eye tracking in Educational Science: Theoretical frameworks and research agendas. J. Eye Mov. Res. 2017, 10. [Google Scholar] [CrossRef]
  40. Muir, M.; Conati, C. An Analysis of Attention to Student—Adaptive Hints in an Educational Game. In Intelligent Tutoring Systems; Cerri, S.A., Clancey, W.J., Papadourakis, G., Panourgia, K., Eds.; Lecture Notes in Computer Science; Springer: Berlin/Heidelberg, Germany, 2012; Volume 7315, pp. 112–122. ISBN 978-3-642-30949-6. [Google Scholar]
  41. Kővári, A.; Katona, J.; Pop, C.A. Evaluation of Eye-Movement Metrics in a Software Debbuging Task using GP3 Eye Tracker. ACTA Polytech. Hung. 2020, 17, 57–76. [Google Scholar] [CrossRef]
  42. Sharma, K.; Leftheriotis, I.; Giannakos, M. Utilizing Interactive Surfaces to Enhance Learning, Collaboration and Engagement: Insights from Learners’ Gaze and Speech. Sensors 2020, 20, 1964. [Google Scholar] [CrossRef] [Green Version]
  43. Liu, X.; Zhang, X.; Chen, W.-W.; Yuan, S.-M. Eye Movement Analysis of Digital Learning Content for Educational Innovation. Sustainability 2020, 12, 2518. [Google Scholar] [CrossRef] [Green Version]
  44. Sáiz Manzanares, M.C.; Rodríguez Diez, J.J.; Marticorena Sánchez, R.; Zaparaín Yáñez, M.J.; Cerezo Menéndez, R. Lifelong Learning from Sustainable Education: An Analysis with Eye Tracking and Data Mining Techniques. Sustainability 2020, 12, 1970. [Google Scholar] [CrossRef] [Green Version]
  45. Lai, M.-L.; Tsai, M.-J.; Yang, F.-Y.; Hsu, C.-Y.; Liu, T.-C.; Lee, S.W.-Y.; Lee, M.-H.; Chiou, G.-L.; Liang, J.-C.; Tsai, C.-C. A review of using eye-tracking technology in exploring learning from 2000 to 2012. Educ. Res. Rev. 2013, 10, 90–115. [Google Scholar] [CrossRef]
  46. Gidlof, K.; Wallin, A.; Dewhurst, R.; Holmqvist, K. Using Eye Tracking to Trace a Cognitive Process: Gaze Behaviour During Decision Making in a Natural Environment. J. Eye Mov. Res. 2013, 6, 1–14. [Google Scholar] [CrossRef]
  47. Zuschke, N. An analysis of process-tracing research on consumer decision-making. J. Bus. Res. 2019, 305–320. [Google Scholar] [CrossRef]
  48. Orquin, J.L.; Mueller Loose, S. Attention and choice: A review on eye movements in decision making. Acta Psychol. (Amst.) 2013, 144, 190–206. [Google Scholar] [CrossRef] [Green Version]
  49. Barrafrem, K.; Hausfeld, J. Tracing risky decisions for oneself and others: The role of intuition and deliberation. J. Econ. Psychol. 2019, 73, 89–110. [Google Scholar] [CrossRef]
  50. Al-Moteri, M.O.; Symmons, M.; Plummer, V.; Cooper, S. Eye tracking to investigate cue processing in medical decision-making: A scoping review. Comput. Hum. Behav. 2017, 66, 52–66. [Google Scholar] [CrossRef]
  51. Hyönä, J. The use of eye movements in the study of multimedia learning. Learn. Instr. 2010, 20, 172–176. [Google Scholar] [CrossRef]
  52. Jiang, T.; Potters, J.; Funaki, Y. Eye-tracking Social Preferences: Eye-tracking Social Preferences. J. Behav. Decis. Mak. 2016, 29, 157–168. [Google Scholar] [CrossRef]
  53. Van Gog, T.; Paas, F.; van Merriënboer, J.J.G.; Witte, P. Uncovering the Problem-Solving Process: Cued Retrospective Reporting Versus Concurrent and Retrospective Reporting. J. Exp. Psychol. Appl. 2005, 11, 237–244. [Google Scholar] [CrossRef] [PubMed] [Green Version]
  54. Tanner, S.A.; McCarthy, M.B.; O’Reilly, S.J. Exploring the roles of motivation and cognition in label-usage using a combined eye-tracking and retrospective think aloud approach. Appetite 2019, 135, 146–158. [Google Scholar] [CrossRef]
  55. Branch, J.L. Investigating the Information-Seeking Processes of Adolescents. Libr. Inf. Sci. Res. 2000, 22, 371–392. [Google Scholar] [CrossRef]
  56. Ericsson, K.A.; Simon, H.A. Protocol Analysis: Verbal Reports as Data, Rev. ed.; MIT Press: Cambridge, MA, USA, 1993; ISBN 978-0-262-05047-0. [Google Scholar]
  57. Alshammari, T.; Alhadreti, O.; Mayhew, P.J. When to Ask Participants to Think Aloud: A Comparative Study of Concurrent and Retrospective Think-Aloud Methods. Int. J. Hum. Comput. Interact. IJHCI 2015, 6, 48–64. [Google Scholar]
  58. Gero, J.S.; Tang, H.-H. The differences between retrospective and concurrent protocols in revealing the process-oriented aspects of the design process. Des. Stud. 2001, 22, 283–295. [Google Scholar] [CrossRef]
  59. Jääskeläinen, R. Verbal Reports. In The Handbook of Translation and Cognition; Schwieter, J.W., Ferreira, A., Eds.; Wiley: Hoboken, NJ, USA, 2017; pp. 213–231. ISBN 978-1-119-24143-0. [Google Scholar]
  60. Peute, L.W.P.; de Keizer, N.F.; Jaspers, M.W.M. The value of Retrospective and Concurrent Think Aloud in formative usability testing of a physician data query tool. J. Biomed. Inform. 2015, 55, 1–10. [Google Scholar] [CrossRef] [Green Version]
  61. Taylor, K.L.; Dionne, J.-P. Accessing problem-solving strategy knowledge: The complementary use of concurrent verbal protocols and retrospective debriefing. J. Educ. Psychol. 2000, 92, 413–425. [Google Scholar] [CrossRef]
  62. Van den Haak, M.J.; de Jong, M.D.T.; Schellens, P.J. Evaluating municipal websites: A methodological comparison of three think-aloud variants. Gov. Inf. Q. 2009, 26, 193–202. [Google Scholar] [CrossRef] [Green Version]
  63. Preece, J.; Rogers, Y.; Sharp, H.; Benyon, D.; Holland, S.; Carey, T. Human-Computer Interaction; Addison-Wesley Longman Ltd.: Essex, UK, 1994; ISBN 978-0-201-62769-5. [Google Scholar]
  64. Elling, S.; Lentz, L.; de Jong, M. Combining Concurrent Think-Aloud Protocols and Eye-Tracking Observations: An Analysis of Verbalizations and Silences. IEEE Trans. Prof. Commun. 2012, 55, 206–220. [Google Scholar] [CrossRef] [Green Version]
  65. Cooke, L. Assessing Concurrent Think-Aloud Protocol as a Usability Test Method: A Technical Communication Approach. IEEE Trans. Prof. Commun. 2010, 53, 202–215. [Google Scholar] [CrossRef]
  66. Van den Haak, M.J.; de Jong, M.D.T. Exploring two methods of usability testing: Concurrent versus retrospective think-aloud protocols. In Proceedings of the IEEE International Professional Communication Conference, Orlando, FL, USA, 21–24 September 2003; IEEE: Orlando, FL, USA, 2003; p. 3. [Google Scholar]
  67. Olsen, A.; Smolentzov, L.; Strandvall, T. Comparing different eye tracking cues when using the retrospective think aloud method in usability testing. In Proceedings of the HCI 2010, 24th BCS Conference on Human Computer Interaction, Dundee, UK, 6–10 September 2010. [Google Scholar]
  68. Bowers, V.A.; Snyder, H.L. Concurrent versus Retrospective Verbal Protocol for Comparing Window Usability. Proc. Hum. Factors Soc. Annu. Meet. 1990, 34, 1270–1274. [Google Scholar] [CrossRef] [Green Version]
  69. Cotton, D.; Gresty, K. Reflecting on the think-aloud method for evaluating e-learning. Br. J. Educ. Technol. 2006, 37, 45–54. [Google Scholar] [CrossRef]
  70. Guan, Z.; Lee, S.; Cuddihy, E.; Ramey, J. The validity of the stimulated retrospective think-aloud method as measured by eye tracking. In Proceedings of the SIGCHI Conference on Human Factors in Computing Systems—CHI ’06, Montreal, QC, Canada, 22–27 April 2006; ACM Press: Montreal, QC, Canada, 2006; p. 1253. [Google Scholar]
  71. Gerjets, P.; Kammerer, Y.; Werner, B. Measuring spontaneous and instructed evaluation processes during Web search: Integrating concurrent thinking-aloud protocols and eye-tracking data. Learn. Instr. 2011, 21, 220–231. [Google Scholar] [CrossRef]
  72. Kim, B.; Dong, Y.; Kim, S.; Lee, K.-P. Development of Integrated Analysis System and Tool of Perception, Recognition, and Behavior for Web Usability Test: With Emphasis on Eye-tracking, Mouse-tracking, and Retrospective Think Aloud. In Proceedings of the 2nd International Conference on Usability and Internationalization, Beijing, China, 22–27 July 2007; Springer: Berlin/Heidelberg, Germany, 2007; pp. 113–121. [Google Scholar]
  73. Švec, V.; Pavlicek, J.; Ticha, I.; Kreckova, J. FactOrEasy (c): ART AND CRAFT OF MANAGEMENT? In Proceedings of the 13th International Conference Efficiency and Responsibility in Education, Prague, Czech Republic, 2–3 June 2016; Czech University Life Sciences Prague: Prague, Czech Republic, 2016; pp. 567–577. [Google Scholar]
  74. Prokop, M.; Švec, V. Flawless Managers: Myth or Reality? In Proceedings of the 15th International Conference Efficiency and Responsibility in Education 2018 (ERIE), Prague, Czech Republic, 7–8 June 2018; Czech University Life Sciences Prague: Prague, Czech Republic, 2018; pp. 281–289. [Google Scholar]
  75. Abdi Sargezeh, B.; Tavakoli, N.; Daliri, M.R. Gender-based eye movement differences in passive indoor picture viewing: An eye-tracking study. Physiol. Behav. 2019, 206, 43–50. [Google Scholar] [CrossRef]
  76. Kovari, A.; Katona, J.; Costescu, C. Quantitative Analysis of Relationship Between Visual Attention and Eye-Hand Coordination. Acta Polytech. Hung. 2020, 17, 77–95. [Google Scholar] [CrossRef]
  77. Boren, T.; Ramey, J. Thinking aloud: Reconciling theory and practice. IEEE Trans. Prof. Commun. 2000, 43, 261–278. [Google Scholar] [CrossRef]
  78. Švec, V.; Flegl, M.; Pavlicek, J.; Prokop, M.; Kreckova, J. Factoreasy (r): Do Students Take a Risk? In Proceedings of the 14th International Conference Efficiency and Responsibility in Education 2017 (ERIE), Prague, Czech Republic, 8–9 June 2017; Czech University Life Sciences Prague: Prague, Czech Republic, 2017; pp. 451–459. [Google Scholar]
  79. Fiedler, S.; Glöckner, A. The Dynamics of Decision Making in Risky Choice: An Eye-Tracking Analysis. Front Psychol. 2012, 3. [Google Scholar] [CrossRef] [PubMed] [Green Version]
  80. Franěk, M.; Šefara, D.; Petružálek, J.; Cabal, J.; Myška, K. Differences in eye movements while viewing images with various levels of restorativeness. J. Environ. Psychol. 2018, 57, 10–16. [Google Scholar] [CrossRef]
  81. Rhenius, D.; Deffner, G. Evaluation of Concurrent Thinking Aloud Using Eye-tracking Data. Proc. Hum. Factors Soc. Annu. Meet. 1990, 34, 1265–1269. [Google Scholar] [CrossRef]
  82. Nielsen, J.; Clemmensen, T.; Yssing, C. Getting access to what goes on in people’s heads? Reflections on the think-aloud technique. In Proceedings of the 2nd Nordic Conference on Human-Computer Interaction—NordiCHI ’02, Aarhus, Denmark, 19–23 October 2002; ACM Press: Aarhus, Denmark, 2002; p. 101. [Google Scholar]
  83. Eger, N.; Ball, L.J.; Stevens, R.; Dodd, J. Cueing retrospective verbal reports in usability testing through eye-movement replay. In Proceedings of the 21st British HCI Group Annual Conference on People and Computers: HCI… But Not as We Know It-Volume 1, Lanchester, UK, 3–7 September 2007; British Computer Society: Swindon, UK, 2007; pp. 129–137. [Google Scholar]
  84. Hu, J.; Gao, X.A. Using think-aloud protocol in self-regulated reading research. Educ. Res. Rev. 2017, 22, 181–193. [Google Scholar] [CrossRef] [Green Version]
  85. Baumann, J.F.; Seifert-Kessell, N.; Jones, L.A. Effect of Think-Aloud Instruction on Elementary Students’ Comprehension Monitoring Abilities. J. Read. Behav. 1992, 24, 143–172. [Google Scholar] [CrossRef]
  86. Bowles, M.A. The Think-Aloud Controversy in Second Language Research; Second Language Acquisition Research; Monographs on Research Methodology; Routledge: New York, NY, USA, 2010; ISBN 978-0-415-99483-5. [Google Scholar]
Figure 1. The game window of FactOrEasy® with the areas of interest (AOIs), that contain figures necessary for the decision in the selling phase.
Sensors 20 02750 g001
Figure 2. Number of fixations.
Sensors 20 02750 g002
Figure 3. Average duration of fixation.
Sensors 20 02750 g003
Figure 4. Total fixation duration.
Sensors 20 02750 g004
Figure 5. Dwell time ratio.
Sensors 20 02750 g005
Table 1. The number of segments included in the analysis.
Round123456789101112131415161718
CTA14141414131413141213111210109897
RTA171717161716151514141512131514111212
Round192021222324252627282930313233343536
CTA666465555554532123
RTA1111108910231110000000
Table 2. Net cash in finished games and overall standings.
IndicatorCTARTATest of Statistical Difference
MedianMeanSDTest of Normality
(Shapiro-Wilk)
MedianMeanSDTest of Normality
(Shapiro-Wilk)
Net cash in finished games197761945810540W(24) = 0.952
p = 0.300
190321793513288W(26) = 0.962
p = 0.438
t-test
t(48) = −0.447
p = 0.657
Overall standings22.251.36W(36) = 0.730
p < 0.001
1.52.361.477W(36) = 0.730
p < 0.001
Mann-Whitney
U = 632
p = 0.844
Table 3. Number of bankruptcy games.
IndicatorCTARTATest of Statistical Difference
(Z-Test for 2 Proportions)
Count%Count%
Bankruptcy games1233.32%1027.78%z = 0.512; p < 0.610
Total games36100%36100%-
Table 4. Overall comparison of eye-tracking metrics.
IndicatorCTARTATest of Statistical Difference (Mann-Whitney)
MedianMeanSDTest of Normality (Shapiro-Wilk)MedianMeanSDTest of Normality (Shapiro-Wilk)
Number of fixations92128.31116.91W(288) = 0.768
p < 0.001
6482.2969.68W(329) = 0.734
p < 0.001
U = 34823.5
p < 0.001
Average duration of fixation187 ms184 ms44 msW(288) = 0.978
p < 0.001
208 ms211 ms47 msW(329) = 0.963
p < 0.001
U = 33022
p < 0.001
Total fixation duration17.02 s25.83 s25.9 sW(288) = 0.773
p < 0.001
13.04 s17.89 s17.21sW(329) = 0.699
p < 0.001
U = 39602.5
p < 0.001
Dwell time ratio0.67%0.66%0.16%W(288) = 0.992
p = 0.106
0.75%0.72%0.17%W(329) = 0.929
p < 0.001
U = 35326
p < 0.001
Table 5. Comparison of the data gathered by CTA and RTA.
Data AssessmentCTARTATest of Statistical Difference
(Z-Test for 2 Proportion)
Count%Count%
Valid information77089.1%71572.4%z = 8.988; p < 0.001
Omitted information9010.4%26827.2%z = 9.095; p < 0.001
Fabricated information00%00%N/A
Unidentified information40.5%40.4%z = 0.189; p = 0.85
Total864100%987100%-

