A Comprehensive Review of Microfluidic Water Quality Monitoring Sensors


Department of Mechanical and Electrical Engineering, SF&AT, Massey University, Auckland 0632, New Zealand
*
Author to whom correspondence should be addressed.
Sensors 2019, 19(21), 4781; https://doi.org/10.3390/s19214781
Submission received: 23 September 2019
/
Revised: 29 October 2019
/
Accepted: 31 October 2019
/
Published: 3 November 2019
(This article belongs to the Section Chemical Sensors)
Abstract
:Water crisis is a global issue due to water contamination and extremely restricted sources of fresh water. Water contamination induces severe diseases which put human lives at risk. Hence, water quality monitoring has become a prime activity worldwide. The available monitoring procedures are inadequate as most of them require expensive instrumentation, longer processing time, tedious processes, and skilled lab technicians. Therefore, a portable, sensitive, and selective sensor with in situ and continuous water quality monitoring is the current necessity. In this context, microfluidics is the promising technology to fulfill this need due to its advantages such as faster reaction times, better process control, reduced waste generation, system compactness and parallelization, reduced cost, and disposability. This paper presents a review on the latest enhancements of microfluidic-based electrochemical and optical sensors for water quality monitoring and discusses the relative merits and shortcomings of the methods.
1. Introduction
In this century, one of the major challenges that human beings are likely to face is water quality. Due to pollution, the amount of drinkable water is reducing day by day. This water pollution or contamination occurs due to various sources. These sources can be categorized as point sources and nonpoint sources [1,2]. Dumping of organic and inorganic wastes from industrial and domestic discards form the point sources of drinking water contaminants, whereas the nonpoint sources are land runoff, applying chemicals, or leaks from buried solid waste landfills [3]. These sources add dangerous materials such as heavy metals, nutrients, and pathogens to the surface water. Heavy metals (e.g., arsenic (As), lead (Pb), mercury (Hg), etc.) naturally exist in the surroundings, and various anthropogenic actions are also responsible for adding heavy metals to the environment [4]. Most of these heavy metals may cause fatal effects on public health due to their potentially mutagenic or carcinogenic effects on the human body [5,6,7,8]. Nutrient contamination is also a concern for water pollution. A key source of nutrients (mostly phosphorus and nitrogen) is land runoff since the nitrate and phosphorus ions are not held by soil particles. Pathogen contamination is another cause for concern [9]. Water polluted with organic waste and human and animal excrement is a potent source of pathogenic bacteria, protozoa, viruses, and parasitic worms. It results in gastrointestinal illness and can be a potential risk to human health. Escherichia coli (E. coli) is generally considered a faecal indicator bacteria (FIB). Bacterial counts are typically used to evaluate the influence of sewage pollution [10,11,12]. Higher concentrations of contaminants in water are responsible for fatalities across the world. The complications from water contamination are discussed in detail in the subsequent section.
The harmful outcomes of water pollution are increasing due to two main reasons: first, the level of contaminants in the water is continuously rising and there are no current practical methods to keep track of the natural changes, and the second is human growth, which leads to the need of expansion to new water sources of unknown quality. For this purpose, periodic water quality monitoring becomes very essential [13]. The traditional methods used for water monitoring are sensitive and reliable. However, mostly, they are expensive as they rely on specific instrumentation (laboratory based and not portable). Also, the samples used in these methods require transportation from the site to the laboratory, which is time consuming and, most importantly, is not field-effective. Hence, there is an increasing need to develop prompt, portable, and inexpensive sensors with high sensitivity and reliability. An ideal sensor should have a low cost, high sensitivity and selectivity, and a high throughput; should be user-friendly; and should provide in-field operation ability. It should also meet the WHO guidelines for portable sensor requirements [14]. From these perspectives, microfluidic devices are significantly appealing technologies to achieve the Lab-on-a-chip (LoC)-based point-of-care applications [15].
Microfluidics is the technology that precisely manipulates a small volume of fluids, using channels with dimensions of tens to hundreds of micrometers [16,17,18,19]. This technology has advantages such as faster reaction times, better process control, reduced waste generation, system compactness and parallelization, reduced cost, and disposability [16,20,21,22,23]. Most microfluidic devices are disposable and are used for one-time measurements. Earlier, microfluidics mainly focused on integration of microsensors with fluidic components (actuators, pumps, valves, etc.) and on miniaturization of analytical assays. Thereafter, Micro Total Analysis Systems (TAS) evolved using micro-fabricated structures. The miniaturization with microfluidics flourished in many life science fields such as genetic analysis, cell biology, and protein analysis [24]. Currently, these devices are widely applied in all branches of science such as chemistry, biology, engineering, and biomedical sciences, etc. In earlier days, silicon was used to fabricate the microfluidic devices [25,26,27]. Then, glass and polydimethylsiloxane (PDMS) were used for fabrication purpose. Nowadays, even thermoplastic and paper are accepted as fabrication materials [15,28,29]. Several manufacturing techniques are available for microfluidic sensors such as injection moulding, softlithography, and mass-production technologies like etching. Among these methods, the softlithography technique using polydimethylsiloxane (PDMS) is a highly popular method [30,31]. However, this process requires special equipment and, in many cases, access to a clean room [32]. Currently, researchers are also making use of commercial 3-D printers to fabricate microfluidic sensors as it is possible to fabricate the microstructures in one step from a computer-based design. The frequently used approaches are inkjet printing, stereolithography (SLA), extrusion printing, etc. [33,34].
Microfluidic sensors can be categorised in two types: one in which the microfluidic system measures the parameters inside it and the other in which the measurement of parameters takes place with the help of external integrated equipment [35,36,37]. Figure 1 represents the microfluidic system in two main parts: the sensing unit and the detection unit. The sensing unit involves elements such as biological entities, functionalized nanoparticles, and metal electrodes, etc., whereas the most commonly used detection systems with microfluidics are optical- and electrochemical-based systems [36,38]. It is possible to perform multiple analyses on the microfluidic platform by just modifying its microchannel patterns. Micromixers have a pivotal point in enhancing the sensitivity of the microfluidic-based sensors [32,39,40]. Any extensive pre-analysis is not necessary while detecting the pollutants using microfluidic sensors. Hence, microfluidic LoC devices have been broadly studied as a substitute for the conventional lab-based methods. Recent reviews presented contamination related to heavy metal [41], nutrients [42], and pathogens [43,44] individually.
This paper describes the current developments in microfluidic sensors for overall water quality monitoring that includes heavy metals, nutrients, and pathogenic detection. Specific emphasis is given on the role of microstructures in sensors. Methods outlined here are categorized on the basis of the transduction system including electrochemical and optical detection. Electrochemical detection covers techniques like electrochemical impedance spectroscopy (EIS), cyclic voltammetry (CV), and square-wave anodic stripping voltammetry (SWASV), etc. On the other hand, optical detection covers colorimetric, fluorescent, chemiluminescence (CL), surface-enhanced Raman scattering (SERS), and surface plasmon resonance (SPR) sensors. The advantages and limitations of each method along with their challenges while implementing field-effective sensors are also discussed in this review.
2. The Consequences of Water Pollutants on the Human Body
Water pollution is a widespread problem across the world. It impacts human life in all its aspects including mental, social, economic, physical, and emotional development. Diseases caused by contaminated drinking water result in the death of a million people every year—the majority of which are children [45]. The basic water pollutants are chemical and biological elements. Chemical pollutants include nutrients and organic and inorganic constituents, whereas biological contaminants include pathogens. Inorganic constituents include heavy metals [46]. Table 1 summarizes some effects among populations exposed to these impurities [47,48] and also includes the maximum permissible limit of the contaminant along with contamination sources [49,50,51,52,53].
Environmental vulnerability resulting from heavy metals is gaining awareness worldwide due to extensive pollution in different parts of the world [8]. Heavy metals are commonly present in most surroundings. Their physiological and chemical characteristics make them extensively useful in various industrial fields. Industrial waste enhances the possibility of heavy metal exposure, which leads to environmental pollution [83], such as for surface water, and to soil contamination. Almost all heavy metals contain toxic substances. The presence of heavy metal ions like cadmium, arsenic, chromium, lead, and mercury in water produce harmful long-term effects on human health [5,84]. Arsenic (As) exists in both the organic and inorganic form in nature, and it has different types [85]. Among all the types, As(III) and As(V) are present abundantly in natural water and are highly toxic [86,87,88]. Arsenic exposure occurs through air, food, and water [89]. Long-term inorganic arsenic toxicity can affect the cardiovascular, nervous, endocrine, and renal systems. It leads to skin lesions, pulmonary disease, hypertension, etc. [54]. Furthermore, arsenic toxicity causes different types of cancers [55,56,57,59]. Cadmium (Cd) is a malleable silver-white toxic metal that appears in the earth’s outermost layer. Its pollution naturally occurs due to volcanic eruptions, weathering, and river transport. Man-made activities like mining, smelting, tobacco smoking, disposal of sewage, etc. are equally responsible for pollution [65]. The International Agency for Research on Cancer has classified Cd and its compounds as Group 1 carcinogens. Cd toxicity causes osteoporosis, renal dysfunction, preterm birth, and low birth weights [58,66,67]. Chromium (Cr) is a steely-grey shiny metal that naturally is present in rocks, soil, animals, and plants. Industrial sources such as magnetic tapes, metal alloys, protective metal coatings, paint pigments, paper, rubber, and cement, etc. release Cr in the environment [68]. Low-level Cr toxicity can cause types of ulcers and low blood sugar. Severe chromium toxicity can develop into lung cancer, gastrointestinal cancer, and DNA damage [47,58,69]. Lead (Pb) is a shiny bluish-gray soft metal naturally present in the earth’s crust. However, mostly, it is accumulated in the environment due to activities like manufacturing, mining, and fossil fuel burning [61]. The Environmental Protection Agency (EPA) has considered Pb to be a carcinogen. Acute or short-term exposure to Pb may result in appetite loss, loss of hunger, headache, elevated blood pressure, stomachache, kidney dysfunction, exhaustion, insomnia, painful inflammation and stiffness of the joints, and vertigo. Chronic or long-term exposure to Pb can cause mental abnormality, congenital disorder, allergies, weight loss, paralysis, weak muscles, dementia, and renal damage and may even be fatal [58,60]. Mercury (Hg) is a silvery liquid metal. Its contamination occurs in its surroundings due to industrial activities like paper and pulp preservatives, pharmaceuticals, cement production, and agriculture industry, etc. [64]. Increased levels of metallic, organic, and inorganic mercury can lead to impairment of the brain, kidneys, muscles, and the fetus. It causes hypertension, cardiovascular consequences (coronary heart disease, myocardial infarction, cardiac arrhythmia, etc.), and sudden death [63]. EPA has reported methyl mercury and mercuric chloride as extremely carcinogenic compounds [58,62].
Nutrients like nitrogen and phosphorous are significant contributors to water body pollution. Abundant nitrogen occurs naturally in our surroundings as approximately 80% of the air is comprised of nitrogen. When this atmospheric nitrogen encounters rainwater, it produces nitrate and ammonium [90,91]. Further, a reduction of nitrate results in nitrite ions [74,92]. These ions can enter into the soil or surface water. The excessive use of fertilizers in agriculture is the principal nonpoint source of nitrogen and phosphorus. Another source of agricultural pollution is animal dung. In addition to this, the disposal of industrial waste and sewage is a significant anthropogenic source of nitrate pollution [7,93]. The excessive presence of nitrite and nitrate ions causes adverse health effects [76,77,78,79].
Nitrate is an essential ion for the human body to decrease blood pressure and to improve blood flow. Still, its unnecessary intake can affect the human body. It can develop diseases like gastric cancer and Parkinson’s disease. Newborns can be afflicted with blue baby syndrome [74]. It also provides a risk of thyroid cancer [75]. In rivers or lakes, the presence of excessive nitrate produces unnecessary algae and phytoplankton, which causes eutrophication. This unwanted growth of algae and phytoplankton absorbs more marine oxygen through the decomposition process and badly affects aquatic life [90].
Domestic wastewater handling and disposal methods provoke the pathogenic contamination of water bodies. Pathogenic contamination results in developing viruses, bacteria, and protozoa in water [82]. Bacteria like Escherichia coli, Enterococci, Bacteroides, etc. are present in the intestines of warm-blooded animals. These are recognized as indicators of faecal pollution [94,95]. These bacteria can enter into the ground water due to sewage leakage from septic tanks [80] and are responsible for waterborne diseases such as severe cholera, diarrhea, legionellosis, and typhoid fever [81]. Additionally, in the contaminated water supply, rotaviruses, hepatitis A and E viruses, and the parasitic protozoa Giardia lamblia are frequently observed [46]. Monitoring of pathogenic pollution is also equally important as many outbreaks of E. coli have been reported worldwide to result in infections and deaths [96,97].
3. Microfluidic with Electrochemical Detection
Generally, the conventional electrochemical methods include a three-electrode system containing a reference electrode, a working electrode, and a counter electrode. An interaction between the analyte and electrode surface produces an electrical signal. According to this working principle, the detection method can be classified as amperometric, voltammetric, and potentiometric [98]. Measuring micro-volumes of the sample was difficult with the silver (Ag) electrode-based methods though it has a high sensitivity towards heavy metal detection [99]. The majority of these methods needed equipment like a rotator, stirrer, etc. Such limitations have been eliminated with the help of microfabrication technologies by incorporating them on the microfluidic platform. The reference, measuring, and working electrode can be included in a microfluidic channel [100]. This miniaturization provides many advantages such as higher processing speed, mass production, portability, reduced cost, multiple analysis, and simplicity [41]. These microfluidic electrochemical sensors can be used in point-of-care (POC) applications for water quality monitoring. For the last decade, microfluidic-based electrochemical sensors have been the subject of considerable study. Several research based sensors are discussed and listed in Table 2, and commercially available sensors are listed in Table 3.
3.1. Heavy Metal Detection
Chen et al. [101] developed a Hg+2 detector with high sensitivity and reproducibility. A three-electrode system (Au–Ag–Au) was integrated with a microfluidic channel, as illustrated in Figure 2a. A novel microfabrication technology (two-step photolithography) was used to develop the sensor. It turned out to be a disposable sensor due to reduced cost and less reactant consumption. Anodic stripping voltametry and differential pulse voltametry electrochemical analysis were used for detecting the Hg+2 ions. The low detection limit (3 ppb) was achieved by this sensor [101]. A similar three-electrode-based reusable polymer lab chip sensor was developed by Jung et al. [99] for Pb+2 detection, as shown in Figure 2b. A SWASV was used to perform Pb+2 analysis; the sensor was highly sensitive and environmentally friendly. The achieved limit of detection (LOD) was 0.55 ppb with 300-second deposition time. Another three-electrode system was used in As detection, as shown in Figure 2c. In this system, a disposable plastic substrate was used to print the electrodes (carbon, silver, and silver/silver chloride ink). When a water drop was introduced at the electrodes, the induced current was measured with the help of CV. The method could detect As with LOD of 1 ppb [102]. One more unique method was reported in which the integration of gold nanoparticles with a microfluidic channel was performed using electrochemical deposition. It consisted of three electrodes, gold nanoparticles, and a microfluidic channel. Electrodes were constructed with single-walled carbon nanotubes (SWCNTs) and placed into a microfluidic device as shown in Figure 2d. Gold nanoparticles were used as an electrolyte material for glucose and arsenic detection. SWASV measurements were done for ultratrace As(III) analysis. The device provided rapid and sensitive results; it could detect up to 4.5 ppb within 60 s [103]. In 2016, a electrochemical sensor was screen-printed on flexible polyethylene terephthalate material. It was demonstrated for selective monitoring of Pb+2 and Hg+2 metal ions, where electrodes were metalized by carbon- and silver-based inks. The results were reported using CV. The average peak current’s shift was noticed at 50 M of Hg+2 and Pb+2. However, the system was not portable as it did not consist of a readout circuit [104].
In the last few years, paper-based microfluidics has became popular due to the following benefits: first, no need of components like pumps and tubes as it works on capillary forces and, secondly, its cost-effectiveness [105,106,107,108,109,110]. As an example, an economical and simple microfluidic paper-based electrochemical sensing device (PED) has been fabricated by Shi et al. [111] for detecting Pb+2 and Cd+2 in aqueous samples. They have integrated commercial screen-printed carbon electrodes with filter paper strips as shown in Figure 3. The electrochemical technique was also linked with biological engineering. In such a combined system, the signal produced by a biosensor is analyzed through a three-electrode system. The detection was carried out with the help of SWASV and found a very good limit of detection (2.0 ppb for Pb+2 and 2.3 ppb for Cd+2). The device also exhibited high sensitivity and stability with real samples without pretreatment of the water sample. Some researchers have also recommended the use of bioreporters for heavy metal detection. For example, Cortés-Salazar et al. [112] utilized the natural E. coli defence system against toxic As(III).
In this method, they used a commercially available disposable microchip. It contained 16 independent electrochemical cells. The E. coli reporter strain was filled in the microchip. When the bioreporter encountered arsenic, -Gal activity was produced within 25 min–50 min. The reported LOD for the method was 0.8 ppb. The principle of bioreporter is illustrated in Figure 4. Thus, this microfluidic biosensor has potential to detect arsenic with high sensitivity.
3.2. Nutrients
Gartia et al. [113] fabricated an economical, sensitive, and portable electrochemical-based measurement system for quantitative detection of nitrate in a groundwater sample (Figure 5a). The sensor chip was fabricated on a glass substrate. The working and reference electrodes were made up of a thin layer of silver. The counter electrode was a gold-deposited thin layer. The uniformity of current distribution between electrodes was enhanced using a concentric layout for the counter and working electrodes. They fabricated a miniaturized potentiostat circuit with wireless interface to make the sensor field-deployable. When the performances of a microsensor and a macroelectrode-based electrochemical system were compared, the precise examination proved that the convention macroelectrodes had far less sensitivity than the microsensor. The CV determination of nitrate ions in numerous water specimens was performed using the sensor. The LOD for the microsensor was approximately 25 ppb.
In a similar manner, Wang et al. [114] developed a mobile phone electrochemical sensing platform for nitrate quantification, as shown in Figure 5c. A mobile phone sensing platform included a plug-n-play microelectronic ionic sensor, which performed electrochemical computation utilizing the smartphone audio jack. A LOC sensing system incorporated a microelectrochemical sensor, a mobile app, and a controlling unit to control the microfluidics along with the sensor and to manage the liquid specimens. On the glass substrate, reference and working electrodes were constructed from a silver layer, and gold layer was used to create the counter electrode. The assay utilized an audio jack to interface the sensor instead of a camera. A user-friendly mobile application interface made the testing procedure very simple to use. This compact smartphone-based application could determine nitrate concentration with a LOD of 0.2 ppm in 60 s. Additionally, the mobile app could save the data on cloud servers.
Calvo-López et al. [115] developed a compact low-temperature co-fired ceramics (LTCC)-based continuous flow potentiometric microanalyzer prototype to concurrently detect the occurrence of nitrate and potassium ions in the specimens of water recycling process (Figure 6b). The microsystem combined microfluidics with the sensing mechanism within the same substrate. The detection system comprised of two ion-selective electrodes that were constructed using a screen-printed Ag/AgCl reference electrode and ion-selective membranes. Detection limits were 0.81 mg/L and 9.56 mg/L for potassium and nitrate ions, respectively.
Generally, voltammetric procedures are easy, quick, and inexpensive and do not require specimen pretreatment before the investigation of the ions in the real specimens. Still, the production of electrodes that are modified chemically is the main obstruction in such sensors. Enhancing the ability to transfer electrons between the electrode surfaces and the electroactive analytes is the principal objective of modified electrodes. Many carbon nanostructured materials like multiwall carbon nanotubes (MWCNTs), graphene, and metal nanoparticles have been adopted extensively for accomplishing this purpose [133]. Cuartero et al. [116] reported the use of such carbon nanotubes in their method. They developed a technique to determine nitrate in seawater using the direct potentiometric method by in-line coupling to an electrochemical desalination module. Generally, the presence of highly concentrated sodium chloride in seawater causes difficulties in determining nutrient nitrite, dihydrogen phosphate, and nitrate at low micromolar levels. In traditional analytical procedures like colorimetry, UV absorption, fluorescence, chemiluminescence, and ion chromatography applied for estimating nitrate levels in seawater, very complex pretreatment is necessary. In this method, a different strategy was accomplished for the reduction of chloride concentration with a simple electrochemical transformation. A custom-made microfluidic-based flat desalination cell was combined with the potentiometric sensor (flow cell). The flow cell included an ion-to-electron transducer and a miniaturized reference electrode, where the transducer was made of lipophilic carbon nanotube (f-MWCNT)-based nitrate-selective electrode. The LOD of this assay was −7 M. Bagheri et al. [77] fabricated a novel method in which they deposited CuNPs upon MWCNT-reduced graphene oxide nanosheets (Cu/MWCNT/RGO) and detected nitrite and nitrate ions individually and simultaneously. The sensitivity and selectivity of GCE was improved due to the nanoparticles deposition on the MWCNT-RGO nanocomposite. The output recorded the concentrations of both ions within a span of 0.1 to 75 M while determining the analyte simultaneously. The LOD for nitrite ion was 30 nM and for nitrate ion was 20 nM.
Ali et al. [117] described a microfluidic sensor in which nitrate monitoring was performed with the help of the EIS technique. The electrochemical electrode used in the method was a porous graphene foam (GF) scaffold. Electrochemical response was improved by modifying the GF scaffold with electrospun nTiO2, and nitrate selectivity was increased by modifying the scaffold with nitrate reductase (NiR) enzyme molecules. Nitrate solutions passed over the nTiO2-activated porous GF, and very good interaction with distinct receptor NiR bound at the scaffold surfaces occurred for nitrate detection (Figure 5d). The sensor had high sensitivity and selectivity and a rapid detection time in nitrate ion quantification.
3.3. Pathogens
Pathogen detection can be performed with a DNA/protein/cell-based probe. Nucleic acid detection has been recognized as a highly sensitive and selective technology. DNA-based pathogen analysis can be obtained either by direct target probing or after target amplification. Kim et al. [118] designed a compact, low-cost, electrochemical DNA-based sensor to provide real-time, continuous monitoring of pathogens. A mobile interface was coupled with the sensor that provided the analysis in terms of safe or unsafe water. The electrochemical sensor consisted of two working electrodes with platinum-based reference and counter electrode (Figure 6a). Immobilization of the working electrode was done with a DNA probe in the stem-loop structure. The methylene blue (MB) provided the electron transfer, which resulted in the current peak. When E. coli was introduced into the chamber, hybridization of the DNA probe took place. This resulted in the opening of the stem-loop structure which further resulted in a reduction of the current peak. This method provided qualitative results and was suitable for POC use. Li et al. [119] fabricated another electrochemical DNA-based sensor to detect hepatitis B virus (HBV). It was a simple paper-based biosensor designed with an origami paper structure and was functionalized with a DNA-modified AgNP. The use of DNA increased the speed, stability, and robustness of the biosensor. Its LOD was 85 pM.
Altintas et al. [120] fabricated a custom-made fully automatic biosensor for pathogen quantification. This device involved a novel biochip design integrated with the microfluidic system along with real-time amperometric measurements. The microfluidic system consisted of a plug-and-play-type biochip docking station that also served as a flow cell for the electrode array along with the electronic connections (Figure 6b). The sensor surface was modified with the self-assembled monolayer (SAM) of mercaptoundecanoic acid and placed. SAM-coated electrode arrays were then activated with polyclonal rabbit anti-E. Coli antibody. Then, an E. coli sample was introduced on the electrode surface. Subsequently, a horse radish peroxidase-coupled detector antibody was injected. Thus, the sandwich immunoassay was used for determination of E. coli. This work reported a rapid, sensitive, and specific detection of a waterborne pathogen E. coli. The sensor output was enhanced through the use of gold nanoparticles when compared with the standard sandwich method. The detection limit was 50 colony forming units (CFU)/mL.
The EIS method can illustrate various characteristics of electrochemical technique such as adsorption, capacitance, diffusion coefficients, electron transfer rate constants, and charge transfer resistances. Its cost-effectiveness, simplicity, and sensitivity have allowed researchers in the recent past to use it in a bio-sensing platform with many label-free transduction methods including impedance flow cytometers and Coulter counters [134,135,136].
A sample of particles scattered in a liquid is guided in the direction of electrodes through a microfluidic channel when an alternating electric field is applied in EIS. The size and configuration of the particles are responsible for alterations in electric field to particle displacements. Electrical current analysis is used to measure these alterations [136]. Several such examples of EIS-based detection methods are reviewed in the following paragraph.
Kim et al. [121] reported a label-free E. coli detection method that utilized positive dielectrophoretic (pDEP) focusing, capturing, and impedance measurement. This (pDEP)-based system consisted of an E. coli-focusing and -sensing electrode. Inclusion of the passivation layer avoided the adhesion of E. coli to the electrode. The change in impedance occurred due to trapping of the E. coli cell on the sensor electrode. The assay evaluated 300 CFU/mL within 1 min. Jiang et al. [122] designed a portable microfluidic smartphone-based EIS sensor with Bluetooth connectivity. The microfluidic sensor consisted of a microhole array silicon substrate with interdigitated sensing electrodes on it and a sensing microfluidic chamber aligned with a nano-porous filter paper. This filter paper allowed bacteria to pass through while blocking big dirt particles in water samples. The unit also included an impedance network analyzer chip with a microcontroller to perform EIS measurement and analysis. The developed android-based software app was able to remotely control the microcontroller through Bluetooth. The app could perform functions like a commercially available LCR meter. The LOD for the bacteria sensing was 10 E. coli cells per milliliter. Clausen et al. [123] developed another impedance-based real time microfluidic sensor to measure the bacteria levels in water samples with the water samples flowing continuously through the sensor. This method could discriminate E. coli from solid particles with the help of an electrical response in the high-frequency phase. Additionally, the method was able to recognize different bacteria cells: Staphylococcus aureus (S. aureus) and E. coli. It provided LOD of 522 cells/mL with real-time continuous monitoring of bacteria in aqueous sample utilizing impedance flow cytometry. Maw et al. [124] utilized a submicron-resistive pulse sensor based on the Coulter principle for E. coli monitoring. The sensitivity of this method was improved due to sample handling in a microfluidic chip and the phenomena of microscale hydrodynamic flow. The unit was made up of a supply section, base unit, detection system, data acquisition system, signal processing unit, and display unit. The base unit comprised of a PDMS microfluidic chip and four electrodes, and detection occurred at the microfluidic platform. This label-free and automatic method provided a rapid result and appeared to be a user-friendly device.
Ghosh et al. [125] presented an economical and easy microfluidic biosensor for quick and accurate measurement of salmonella typhimurium. The microfluidic chip involved the interdigitated electrode array. The electrode array surface was immobilized with anti-salmonella antibodies. The biosensor provided qualitative as well as quantitative impedance analyses within 3 h. Its LOD was CFU/mL. The authors also compared the performance of the microfluidic biosensor with the non-microfluidic biosensor. They found two to three times higher impedance response for the microfluidic biosensor with lower LOD compared to the non-microfluidic biosensor.
4. Microfluidic with Optical Detection
Many electrochemical methods have been presented for water quality monitoring in this review paper. The optical strategies due to their simplicity and cost-effectiveness are equally popular too. In optical-based microfluidic devices, the optical changes happen due to the chelation between the recognition element and the target constituents. These optical-based microfluidic devices are based on various techniques such as colorimerty, CL, fluorescence, SERS, and SPR. The colorimetric devices include measurement of the colour change associated with the reaction between the analyte and the sensing element. The colour variation can be observed by eye or with the help of an optical detection method [137]. In the fluorescence detection method, the analyte-induced changes are responsible for variations in characteristics of fluorochromes including fluorescence intensity, fluorescence polarization, and lifetime [41]. Several research-based examples of such detection methods are considered in the following paragraphs and are described in Table 4.
Some commercially available sensors are listed in Table 5.
4.1. Heavy Metal
Colorimetry is the most commonly used technique in microfluidics. The majority of the studied optical-based microfluidic devices used in heavy metal detection are paper-based colorimetric sensors. Colorimetric detection is performed in the dark, and so it is free from ambient light interference [171]. Mentele et al. [172] reported a paper-based colorimetric device (PADs) for metal ion (Fe, Cu, and Ni) detection (Figure 7a). This method provides a rapid and an inexpensive way of metal ion detection. The possibility of utilizing paper microfluidics as a 3-D device was proved by Wang et al. (Figure 7b) [138]. They developed a 3-D paper-based microfluidic device for multiplex heavy metal (Cu (II), Ni (II), Cd (II), and Cr (VI)) detection through a simple combination of patterned paper by wax printing, tape, and stacking. The colorimetric determination was performed in association with a smartphone camera. The developed technique was rapid, low-cost, and user-friendly.
To avoid toxic chemical reactions in arsenic analysis, researchers have investigated and found gold nanoparticles (AuNPs) to be promising sensor materials in the colorimetric probe. Nath et al. [141] determined the use of As(III) with the help of simple paper-based microfluidics along with a gold nano-sensor (Au–TA–TG). The steady flow rate of the paper substrate pores allowed a very low concentration of arsenic to remain in a microchannel for a long enough period so that it interacted with the nano-sensor. A rapid reaction of Au–TA–TG with arsenic ions resulted in a visible dark bluish-black precipitate at the interfacial zone. The working principle is illustrated in Figure 7c. However, these PADs were not tested against groundwater samples. When a similar implementation was tested with groundwater samples, the interference from several naturally occurring metals was observed [142]. To eliminate this limitation, Chowdury et al. [142] developed a T-shaped PAD using the same functionalized gold nanoparticles (Au–TA–Au) as illustrated in Figure 7d. Additionally, they adjusted the pH value of the water sample to avoid other metal interferences. However, this assay provided just a qualitative result. Chen et al. [139] reported one more user-friendly and rapid PAD for mercury(II) ion (Hg2+) measurement in water, for which they made use of oxidization of tetramethylbenzidine due to platinum nanoparticles and suppression of the reaction due to the presence of (Hg2+) ion. The whole interaction resulted in a visible colour change that was provided as a digital readout through the fiber optic module (Figure 7e). The sensor was capable of measuring (Hg2+) concentrations up until 0.01M.
Fan et al. [140] designed a portable, power-free microfluidic device to detect lead (Pb2+). They detected Pb2+ with MUA-modified AuNPs (MUA-AuNPs). The chemical reaction between Pb2+ and MUA caused the aggregation of the modified nanoparticles, which in turn produced the solution colour change from red to purple. The output could be observed with the bare eye with the help of water drops. It was a rapid and inexpensive method with an LOD of 10 M. In 2017, Bonyar et al. [143] developed a custom-tailored colorimetric semiautomated portable device for As(III) detection in drinking water. They integrated a commercially available arsenic test kit into a disposable microfluidic cartridge, as shown in Figure 8a. The Gutzeit reaction was carried out in the cartridge with automatic camera-based colour evaluation. The entire operation was easy to perform due to its user-friendly semiautomatic action and required approximately 1 h to obtain a result.
Miniaturization of fluorescence detection was possible due to the use of the light-emitting diodes (LEDs) in the optical detection system. LEDs can emit at various wavelengths, and they can easily fit into typical chip features [37]. Fluorescence detection is an extremely sensitive technique. However, according to Li et al. [37], its major limitation is that it can be used with the analytes that have native fluorescence or that can easily be fluorescently labelled. Still, many researchers have employed fluorescence detection to determine water pollutants. Qi et al. [144] developed a 3-D paper-based fluorescence sensor to determine Cu2+ and Hg2+ ions. It was based on a combination of quantum dots (QDs) and an ion imprinting technique on 3-D origami paper. CdTe QDs were implanted on the exterior of the glass fiber paper (Figure 8a). The change in fluorescence was produced due to the transfer of the photo luminescent energy of the QDs to its ion imprinting–QD complex. Bacterial bioassays have shown better performance in arsenic detection compared to a chemical field kit [173]. Theytaz et al. [146] created a microfluidic chip containing immobilized E. coli biosensor bacteria (Figure 8b). The E. coli generated green fluorescent protein in response to As(III). The major drawbacks of the developed method were its low LOD (50 g/L) and the use of an epifluorescence microscope that made it a lab-based method. Similarly, Buffi et al. [174] demonstrated fluorescence detection of As(III) with the help of a bacteria-based bioassay.
The natural defence system of E. coli against As(III) was used to produce a fluorescence signal. The E. coli was embedded in small agarose beads. These beads were stored on a microfluidic chip; the fluorescence microscope was then used for signal detection. Hence, the bioassay cannot be considered as a portable device. Further, in 2014, this assay was enhanced by Truffer et al. [145]. They incorporated an electronic device with a small optical setup to measure fluorescence from bacterial reporter cells (Figure 8c). As a result, the device displayed significant potential for field measurements.
Currently, SERS integration with LoC devices is rapidly being adopted in biological and environmental analysis. Qi et al. [147] displayed prominent potential in integrating SERS technology with microfluidics in the field of water quality monitoring. They implemented a continuous flow detection of As(III) ions rapidly. Silver nanoparticles were modified with glutathione/4-mercaptopyridine (GSH/4-MPY). As(III) has a high affinity towards GSH. Hence, as As(III) came in contact with GSH/4-MPY, aggregation of nanoparticles occurred that produced a Raman signal. The developed assay was highly sensitive and reproducible with the LOD of 0.67 ppb.
Som-Aum et al. [148] developed a highly sensitive microfluidic sensor based on the CL method that could detect As(III) in water. In this method, sorption of a As(V) pre-concentration in the form of vanadomolybdoarsenate heteropoly acid (VMoAs-HPA) ion-paired with hexadecyltrimethylammonium bromide on the surface of polystyrene beads packed in the microfluidic tool was observed. The matrix effect was removed by adding −8 M ethylenediaminetetraacetic acid to all work solutions. Additionally, the interference from phosphate and chromate was eliminated by the synthesis of sorption pre-concentration. That also helped to enhance the sensitivity. The method obtained LOD of −8 M within 5 min.
4.2. Nutrients
Most of the available spectrophotometric methods for nitrate measurement in natural waters need conversion to the more reactive nitrite before detection. Different types of nitrate reduction methods have been presented, using a variety of reduction materials like hydrazine, copperized cadmium, zinc, nitrate reductase, and irradiation by ultraviolet light. Among all the methods available, the Griess assay is the most established method of colorimetric nitrite analysis [175]. Beaton et al. [153] first reported such a microfluidic-based colorimetric nitrate analysis using the Griess method. It was an in situ stand-alone system which was compact and consumed low power (1.5 W). Use of colored polymethylmethacrylate (PMMA) helped to reduce background light interference which made it a high-sensitivity system. The system displayed detection with high-resolution and produced a better output with detection limit of 0.02 M for nitrite and 0.025 M for nitrate. Another microfluidic method was developed by Khanfar et al. [151] to detect nitrate ions in water in an inexpensive and portable way. It was based on the Griess procedure. The microfluidic chip had a long-coated PMMA channel constructed with layers of different thicknesses. The detection system included an LED and photodiode. However, its LOD was low (0.0782 ppm). Jayawardane et al. [152] developed a cost-effective disposable PAD to determine nitrite and nitrate (Figure 9a). This method also used a Griess reaction for nitrite determination. However, for nitrate detection, nitrate was reduced to nitrite using zinc microparticles inside the PAD channel. The PAD was fabricated by an inkjet printing method. The hydrophilic PAD channel was integrated with zinc microparticles and worked as a virtual flow-through solid-phase reactor, which was a unique concept. The LODs of this method were 1.0 M and 19 M for nitrite and nitrate, respectively. This user-friendly method was suitable for a filed measurement. Recently, Vincent et al. [154] deployed a sensor within the Seaglider. The sensor employed colorimetric detection, using the Griess assay to determine nitrate and nitrite. The sensor was comprised of a three-layer PMMA chip. The chip included microchannels, mixers, photodiodes, and LED. The chip was installed with electronics, valves, and syringe pump. Eventually, the chip was covered in a housing that was filled with mineral oil and consisted of internally fitted pressure-compensating bladder. The LOD of the system was 20 nM. Cogan et al. [149] constructed a low-cost, robust microfluidic sensing platform and an LED-based optical detection system to determine nitrate in natural waters and wastewater. It was a complete system consisting of colorimetric measurement unit, a power unit, wireless communication, storage for sampling, reagent, and waste in a small unit. The chromotropic method for nitrate analysis was applied. The colorimetric measurement unit included a LED and a photodiode (Figure 9b). The author claimed advantages such as ease of operation, inexpensive, low consumption of power, high throughput, limited waste generation, and compactness in design. Xiong et al. [150] designed a novel miniaturized cost-effective colorimetric fiber-optic chemical sensor (FOCS) system for nitrite detection through interfacing with a microfluidic capillary waveguide. It was based on the Griess–Ilosvay reaction. When the reaction occurred between nitrite and Griess reagents, it generated colorimetric azo dye. The light intensity was changed when the light interacted with the azo dye. The method achieved LOD of 7 g/L. The sensor comprised three sections: a capillary waveguide flow cell, a light source connected with an excitation fiber, and a detector connected with a detection fiber, as shown in Figure 9c. The microfluidic capillary waveguide also acted like a disposable sampling vessel, a reagent flow-through cell, and a light transmission element.
4.3. Pathogens
A colorimetric method is commonly used in optical detection of various pathogens due to its simplicity and easy readouts. Many times, imaging devices (cell phone camera, portable scanner, and digital camera) are incorporated with the colorimetric methods to provide the analysis interpretation. Wang et al. [176] demonstrated a paper-based E. coli detection method. They used methylsilsesquioxane (MSQ) barriers to lyse the bacterial cells before the analysis. They also compared MSQ with other barrier materials, wax and alkylketene dimer (AKD). For this purpose, they printed circular barriers of MSQ, AKD, and wax. They found MSQ barriers better than the other materials. The change in colour was recorded with the help of the iPhone 4S camera. Although the assay was affordable and rapid, it was just a qualitative indicator. Boehle et al. [161] developed a cost-effective paper-based colorimetric method to detect antimicrobial-resistant bacteria. This method could identify the presence of b-lactamase-mediated resistance. An array of paper wells was used to optimize the reaction between b-lactamase and nitrocefin. The time required for the analysis was approximately 1 h with LOD of 10 mU/mL. San et al. [158] developed another paper-based method to detect E. coli from field water samples in association with a smartphone. The multichannel paper chip was preloaded with antibody-conjugated beads. The water sample was applied to the inlet of the paper chip, which allowed passing of the bacterial antigens. The smartphone was used to capture the digital images at some angle and to measure the light scatter intensity coming from microbead immunoagglutination (Figure 10). The entire analysis time was just 90 s. The assay was simple to use and did not require any external hardware. The only necessary device was a smartphone with a built-in gyro-sensor and an installed software application.
Fluorescence detection is another common method in optical pathogen detection. Golberg et al. [156] reported specific capture and detection of bacterial contamination in water. They developed a unit which consisted of E. coli seizing along with droplet microfluidics, portable proprietary fluorescence microscopy, and cloud-based data management and sharing. In this scheme, they used magnetic beads coupled with specific antibodies to capture E. coli. Further, the seized E. coli were conjugated fluorescently labeled antibodies. Subsequently, automated optical fluorescence microscopy was used for the purpose of detection. The entire water quality analysis took place within eight hours from sample collection to online result display. Malec et al. [157] proposed a labelled base biosensor where the E. coli was labelled with streptavidin-coated magnetic markers developing compounds. Video microscopy along with particle tracking software were utilised for quantitative measurement. The developed microfluidic platform was integrated with microconductors that generated a magnetic field gradient.
When the fluid with the magnetically labelled bacteria (MLB) was brought into the microfluidic platform, a magnetic field gradient accelerated the MLB towards the outlet. The method was able to provide a real-time approach for the detection of pathogens from a small-volume liquid sample.
Many researchers implemented integration of a polymerase chain reaction (PCR) test on a microfluidic platform. For example, Dharmasiri et al. [155] developed a PMMA microfluidic chip with eight parallel inputs covalently bonded with polyclonal antibodies. The chip was used for the isolation and detection of E. coli. The quantification was performed after isolation by an off-chip real-time quantitative PCR test. Fluorescent microscopy was used to examine the fluorescently labelled cells in the microfluidic chip’s channels. This entire process took just under five hours. The LOD was approximately 6 CFU. Li et al. [160] developed an integrated microfluidic device for rapid detection of pathogenic rotavirus. The device integrated reverse transcription (RT) and PCR with an online fluorescence detection technique. The microfluidic section incorporated the grooved copper heating block for RT and a heated cylinder for amplification. The RT-PCR technique with fluorescence microscopy was able to amplify and measure rotavirus RNA within one hour.
Tokel et al. [159] presented a portable, multiplex, inexpensive microfluidic-integrated SPR platform for rapid detection of bacteria such as E. coli and S. aureus. It was a label-free pathogen detection platform consisting of microfluidic and SPR technologies. This method utilized a Protein G-based surface chemistry for E. coli determination that allowed immobilization of antibodies in a favourable orientation. However, the result was presented as a graph, whereas a direct readout could have been more appropriate (Figure 11).
5. Discussion and Outlook
Regular water quality monitoring is a “must” due to the harmful effects of water contaminants on the various functional systems of a human body. A microfluidic-based sensor is the most suitable method for this purpose. The sensor comprises of a sensing and detection unit on the microfluidic substrate. This review explores several sensors mainly with the sensing unit mostly based on chemicals, biological elements, electrodes, and nanomaterials. The materials used for the sensing unit and substrates are listed in Figure 12.
Furthermore, the review includes the sensors based on two signal transduction methods: electrochemical and optical detection.
Electrochemical detection is a big hope for microfluidic devices considering its high sensitivity, selectivity, miniaturization, and the possibility of mass production. Its adaptability with different microfabricated electronic parts leads to a portable device. To increase the sensitivity of electrochemical sensors, modification of electrodes with bioreporters or nanomaterials is advisable. However, a significant concern in regard to these sensors is the fabrication of chemically modified electrodes since it involves a very complicated process. Various optical sensing methods are successfully used in association with microfluidics including colorimetry, chemiluminescence, fluorescence, SPR, etc. The colorimetric analysis provides simple qualitative results in terms of a colour change. The colorimetric methods give relative results; they cannot yield exact quantitative results. These methods also require washing or rinsing steps before the next measurement can be taken in the microfluidic chip. Compared to colorimetric methods, chemiluminescence techniques have higher sensitivity. Also, the elimination of an external light source makes the instrumentation simple. However, the availability of a limited number of chemiluminescence reagents is the main disadvantage of this technique. The fluorescence detection is another highly sensitive method. Still, it is limited to analytes that possess inherent fluorescence or that can be labelled fluorescently. SPR and SERS are highly sensitive and selective optical detection methods. However, integration of these methods with a microfluidic platform can be an issue due to non-portable instrumentation. An optical diffraction method is yet another sensitive detection method, though it still remains unaddressed in water quality monitoring. This method can produce highly sensitive results and can be incorporated with microfluidic technology. Table 6 summarizes advantages and disadvantages of electrochemical and optical methods individually.
Field implementation is also an important aspect of discussion while discussing sensitivity and selectivity. Though there are a few challenges while implementing these sensors in the real world, the major hurdle associated with these sensors is field deployability. Many sensors discussed here represent the possibility of in situ and real-time measurement. However, those remain lab-based methods due to interfacing of lab-based measuring devices. Another challenge is in real sample measurement due to interference of the matrix effect. Usually, insoluble particles are suspended in the natural samples, which can influence the detection methods. In the case of optical detection, such particles can change the analyte concentration due to the stimulation of light scattering, while in electrochemical detection, such particles can modify the chemical electrodes. These challenges can be addressed by incorporating suitable measuring as well as filtering devices along with the sensing mechanism using microfluidics.
Microfluidic technology plays an important role in making the water quality sensors field effective, as size reduction and automation are highly possible through this technology. However, the technology has its own challenges such as improper mixing in microchannels caused by laminar flows through it, which can potentially be addressed by implementing passive mixing microfluidic structures. Another challenge is the fabrication of microchannels with random geometries. Additionally, fabrication of the microfluidic sensor may sometimes remain a laboratory prototype that needs access to clean room equipment and trained staff to operate. It is possible to overcome these challenges with the help of rapidly emerging 3-D printing technology.
6. Conclusions
In the present review, microfluidic-based sensors for water quality monitoring have been extensively discussed in detail. This includes a comparison of microfluidic-based electrochemical and optical methods with advantages and disadvantages for the detection of contaminants such as heavy metals, nutrients, and pathogens in water that have been published in the last decade. Water quality analysis with microfluidics is a flourishing technology as it contributes to rapid, economical, and user-friendly detection methods. It is especially suitable for in situ testing, particularly in limited-resource circumstances. The current challenges with in situ testing and real samples are also discussed in the review. Such challenges can be addressed by including 3-D printing technology along with the microfluidic platform.
Author Contributions
Conceptualization, methodology, investigation, S.A.J. and K.M.A.; writing—original draft preparation, S.A.J.; writing—review and editing, S.A.J. and K.M.A.; visualization, S.A.J. and K.M.A; supervision, project administration, K.M.A.
Funding
The APC was funded by the School of Food and Advanced Technology, Massey University, New Zealand.
Conflicts of Interest
The authors declare no conflict of interest.
Abbreviations
The following abbreviations are used in this manuscript:
| AKD | alkylketene dimer |
| ASV | anodic stripping voltammetry |
| AuNP | gold nanoparticles |
| BNC | Bayonet Neill–Concelman |
| CFU | colony forming units |
| CL | chemiluminescence |
| CV | cyclic voltammetry |
| E. coli | Escherichia coli |
| EDC | ethyl-3-(3-dimethy-laminopropyl) carbodiimide hydrochloride |
| EIP | electrochemical impedance spectroscopy |
| EIS | electrochemical impedance spectroscopy |
| f-MWCNT | functionalised- multiwall carbon nanotube |
| FOCS | fiber-optic chemical sensor |
| GCE | glassy carbon electrode |
| GF | graphene foam |
| LCR | inductance, capacitance, resistance |
| LEDs | light-emitting diodes |
| LoC | Lab-on-a-chip |
| LOD | limit of detection |
| LPS | lipopolysaccharide |
| LTTC | low-temperature co-fired ceramics |
| MB | methylene blue |
| MCL | maximum contamination level |
| MLB | magnetically labelled bacteria |
| MSQ | methylsilsesquioxane |
| MUA | 11-mercaptoundecanoic acid |
| MWCNTs | multiwall carbon nanotubes |
| NHS | n-hydrosuccinimide |
| NiR | nitrate reductase |
| OCC | occult cancer |
| PDMS | polydimethylsiloxane |
| PMMA | polymethylmethacrylate |
| pDEP | positive dielectrophoretic |
| POC | point-of-care |
| QRE | quasi-reference electrode |
| RGO | reduced graphene oxide |
| SAM | self-assembled monolayer |
| SERS | surface-enhanced Raman scattering |
| SPR | surface plasmon resonance |
| S. aureus | Staphylococcus aureus |
| SWASV | square-wave anodic stripping voltammetry |
| SWCNTs | single-walled carbon nanotubes |
| SWV | square-wave voltammetry |
| PADs | paper-based analytical devices |
| PED | microfluidic paper-based electrochemical sensing device |
References
- Gholizadeh, M.H.; Melesse, A.M.; Reddi, L. Water quality assessment and apportionment of pollution sources using APCS-MLR and PMF receptor modeling techniques in three major rivers of South Florida. Sci. Total Environ. 2016, 566, 1552–1567. [Google Scholar] [CrossRef]
- Yao, H.; Qian, X.; Yin, H.; Gao, H.; Wang, Y. Regional Risk Assessment for Point Source Pollution Based on a Water Quality Model of the Taipu River, China. Risk Anal. Int. J. 2015, 35, 265–277. [Google Scholar] [CrossRef]
- Calderon, R.L. The Epidemiology of Chemical Contaminants of Drinking Water. Food Chem. Toxicol. 2000, 38, S13–S20. [Google Scholar] [CrossRef]
- Sekabira, K.; Origa, H.O.; Basamba, T.; Mutumba, G.; Kakudidi, E. Assessment of heavy metal pollution in the urban stream sediments and its tributaries. Int. J. Environ. Sci. Technol. 2010, 7, 435–446. [Google Scholar] [CrossRef] [Green Version]
- Lu, S.Y.; Zhang, H.M.; Sojinu, S.O.; Liu, G.H.; Zhang, J.Q.; Ni, H.G. Trace elements contamination and human health risk assessment in drinking water from Shenzhen, China. Environ. Monit. Assess. 2015, 187, 4220. [Google Scholar] [CrossRef] [PubMed]
- Jang, A.; Zou, Z.; Lee, K.K.; Ahn, C.H.; Bishop, P.L. State-of-the-art lab chip sensors for environmental water monitoring. Meas. Sci. Technol. 2011, 22, 032001. [Google Scholar] [CrossRef]
- Jan, A.; Azam, M.; Siddiqui, K.; Ali, A.; Choi, I.; Haq, Q. Heavy metals and human health: Mechanistic insight into toxicity and counter defense system of antioxidants. Int. J. Mol. Sci. 2015, 16, 29592–29630. [Google Scholar] [CrossRef]
- Varol, M. Assessment of heavy metal contamination in sediments of the Tigris River (Turkey) using pollution indices and multivariate statistical techniques. J. Hazard. Mater. 2011, 195, 355–364. [Google Scholar] [CrossRef]
- Weller, M. Immunoassays and biosensors for the detection of cyanobacterial toxins in water. Sensors 2013, 13, 15085–15112. [Google Scholar] [CrossRef]
- Ahmed, W.; Hughes, B.; Harwood, V. Current status of marker genes of Bacteroides and related taxa for identifying sewage pollution in environmental waters. Water 2016, 8, 231. [Google Scholar] [CrossRef]
- Kuczynski, D. Occurrence of pathogenic bacteria in surface water of an urban river in Argentina (Reconquista River, Buenos Aires). Int. J. Aquat. Sci. 2016, 7, 30–38. [Google Scholar]
- Schreiber, C.; Rechenburg, A.; Rind, E.; Kistemann, T. The impact of land use on microbial surface water pollution. Int. J. Hyg. Environ. Health 2015, 218, 181–187. [Google Scholar] [CrossRef] [PubMed]
- Ma, J.; Meng, F.; Zhou, Y.; Wang, Y.; Shi, P. Distributed water pollution source localization with mobile UV-visible spectrometer probes in wireless sensor networks. Sensors 2018, 18, 606. [Google Scholar] [CrossRef] [PubMed]
- Edition, F. Guidelines for drinking-water quality. WHO Chron. 2011, 38, 104–108. [Google Scholar]
- Yang, K.; Peretz-Soroka, H.; Liu, Y.; Lin, F. Novel developments in mobile sensing based on the integration of microfluidic devices and smartphones. Lab Chip 2016, 16, 943–958. [Google Scholar] [CrossRef] [PubMed] [Green Version]
- Whitesides, G.M. The origins and the future of microfluidics. Nature 2006, 442, 368. [Google Scholar] [CrossRef]
- Lafleur, J.P.; Joensson, A.; Senkbeil, S.; Kutter, J.P. Recent advances in lab-on-a-chip for biosensing applications. Biosens. Bioelectron. 2016, 76, 213–233. [Google Scholar] [CrossRef]
- Kou, S.; Cheng, D.; Sun, F.; Hsing, I.M. Microfluidics and microbial engineering. Lab Chip 2016, 16, 432–446. [Google Scholar] [CrossRef]
- Liao, Z.; Wang, J.; Zhang, P.; Zhang, Y.; Miao, Y.; Gao, S.; Deng, Y.; Geng, L. Recent advances in microfluidic chip integrated electronic biosensors for multiplexed detection. Biosens. Bioelectron. 2018, 121, 272–280. [Google Scholar] [CrossRef]
- Dutse, S.W.; Yusof, N.A. Microfluidics-based lab-on-chip systems in DNA-based biosensing: An overview. Sensors 2011, 11, 5754–5768. [Google Scholar] [CrossRef]
- Zhang, J.; Yan, S.; Yuan, D.; Alici, G.; Nguyen, N.T.; Warkiani, M.E.; Li, W. Fundamentals and applications of inertial microfluidics: A review. Lab Chip 2016, 16, 10–34. [Google Scholar] [CrossRef] [PubMed]
- Samiei, E.; Tabrizian, M.; Hoorfar, M. A review of digital microfluidics as portable platforms for lab-on a-chip applications. Lab Chip 2016, 16, 2376–2396. [Google Scholar] [CrossRef] [PubMed]
- Yi-Qiang, F.; Hong-Liang, W.; Ke-Xin, G.; Jing-Ji, L.; Dong-Ping, C.; ZHANG, Y.J. Applications of Modular Microfluidics Technology. Chin. J. Anal. Chem. 2018, 46, 1863–1871. [Google Scholar]
- Andersson, H.; Van den Berg, A. Microfluidic devices for cellomics: A review. Sens. Actuators B Chem. 2003, 92, 315–325. [Google Scholar] [CrossRef]
- Du, G.; Fang, Q.; den Toonder, J.M. Microfluidics for cell-based high throughput screening platforms—A review. Anal. Chim. Acta 2016, 903, 36–50. [Google Scholar] [CrossRef]
- Reverté, L.; Prieto-Simón, B.; Campàs, M. New advances in electrochemical biosensors for the detection of toxins: Nanomaterials, magnetic beads and microfluidics systems. A review. Anal. Chim. Acta 2016, 908, 8–21. [Google Scholar] [CrossRef]
- Mashaghi, S.; Abbaspourrad, A.; Weitz, D.A.; van Oijen, A.M. Droplet microfluidics: A tool for biology, chemistry and nanotechnology. TrAC Trends Anal. Chem. 2016, 82, 118–125. [Google Scholar] [CrossRef] [Green Version]
- Fiorini, G.S.; Chiu, D.T. Disposable microfluidic devices: Fabrication, function, and application. BioTechniques 2005, 38, 429–446. [Google Scholar] [CrossRef]
- Ren, K.; Zhou, J.; Wu, H. Materials for microfluidic chip fabrication. Acc. Chem. Res. 2013, 46, 2396–2406. [Google Scholar] [CrossRef]
- Bhattacharjee, N.; Urrios, A.; Kang, S.; Folch, A. The upcoming 3D-printing revolution in microfluidics. Lab Chip 2016, 16, 1720–1742. [Google Scholar] [CrossRef] [Green Version]
- Lee, K.G.; Park, K.J.; Seok, S.; Shin, S.; Park, J.Y.; Heo, Y.S.; Lee, S.J.; Lee, T.J. 3D printed modules for integrated microfluidic devices. RSC Adv. 2014, 4, 32876–32880. [Google Scholar] [CrossRef]
- Martínez-López, J.; Mojica, M.; Rodríguez, C.; Siller, H. Xurography as a rapid fabrication alternative for point-of-care devices: Assessment of passive micromixers. Sensors 2016, 16, 705. [Google Scholar] [CrossRef] [PubMed]
- Yazdi, A.A.; Popma, A.; Wong, W.; Nguyen, T.; Pan, Y.; Xu, J. 3D printing: An emerging tool for novel microfluidics and lab-on-a-chip applications. Microfluid. Nanofluid. 2016, 20, 50. [Google Scholar] [CrossRef]
- Waheed, S.; Cabot, J.M.; Macdonald, N.P.; Lewis, T.; Guijt, R.M.; Paull, B.; Breadmore, M.C. 3D printed microfluidic devices: Enablers and barriers. Lab Chip 2016, 16, 1993–2013. [Google Scholar] [CrossRef]
- Antony, R.; Nandagopal, M.G.; Sreekumar, N.; Selvaraju, N. Detection principles and development of microfluidic sensors in the last decade. Microsyst. Technol. 2014, 20, 1051–1061. [Google Scholar] [CrossRef]
- Jokerst, J.C.; Emory, J.M.; Henry, C.S. Advances in microfluidics for environmental analysis. Analyst 2012, 137, 24–34. [Google Scholar] [CrossRef]
- Li, H.F.; Lin, J.M. Applications of microfluidic systems in environmental analysis. Anal. Bioanal. Chem. 2009, 393, 555–567. [Google Scholar] [CrossRef]
- Pol, R.; Céspedes, F.; Gabriel, D.; Baeza, M. Microfluidic lab-on-a-chip platforms for environmental monitoring. TrAC Trends Anal. Chem. 2017, 95, 62–68. [Google Scholar] [CrossRef]
- Ward, K.; Fan, Z.H. Mixing in microfluidic devices and enhancement methods. J. Micromech. Microeng. 2015, 25, 094001. [Google Scholar] [CrossRef]
- Lynn, N.S., Jr.; Martínez-López, J.I.; Bocková, M.; Adam, P.; Coello, V.; Siller, H.R.; Homola, J. Biosensing enhancement using passive mixing structures for microarray-based sensors. Biosens. Bioelectron. 2014, 54, 506–514. [Google Scholar] [CrossRef]
- Li, M.; Gou, H.; Al-Ogaidi, I.; Wu, N. Nanostructured sensors for detection of heavy metals: A review. ACS Sustain. Chem. Eng. 2013, 1, 713–723. [Google Scholar] [CrossRef]
- Azmi, A.; Azman, A.A.; Ibrahim, S.; Yunus, M.A.M. Techniques in advancing the capabilities of various nitrate detection methods: A review. Int. J. Smart Sens. Intell. Syst. 2017, 10, 223–261. [Google Scholar] [CrossRef]
- Mairhofer, J.; Roppert, K.; Ertl, P. Microfluidic systems for pathogen sensing: A review. Sensors 2009, 9, 4804–4823. [Google Scholar] [CrossRef] [PubMed]
- Nasseri, B.; Soleimani, N.; Rabiee, N.; Kalbasi, A.; Karimi, M.; Hamblin, M.R. Point-of-care microfluidic devices for pathogen detection. Biosens. Bioelectron. 2018, 117, 112–128. [Google Scholar] [CrossRef] [PubMed]
- Fernandez-Luqueno, F.; López-Valdez, F.; Gamero-Melo, P.; Luna-Suárez, S.; Aguilera-González, E.; Martínez, A.; García-Guillermo, M.; Hernández-Martínez, G.; Herrera-Mendoza, R.; Álvarez-Garza, M.; et al. Heavy metal pollution in drinking water-a global risk for human health: A review. Afr. J. Environ. Sci. Technol. 2013, 7, 567–584. [Google Scholar]
- Schwarzenbach, R.P.; Egli, T.; Hofstetter, T.B.; Von Gunten, U.; Wehrli, B. Global water pollution and human health. Annu. Rev. Environ. Resour. 2010, 35, 109–136. [Google Scholar] [CrossRef]
- Chowdhury, S.; Mazumder, M.A.J.; Al-Attas, O.; Husain, T. Heavy metals in drinking water: Occurrences, implications, and future needs in developing countries. Sci. Total Environ. 2016, 569, 476–488. [Google Scholar] [CrossRef]
- Tchounwou, P.B.; Yedjou, C.G.; Patlolla, A.K.; Sutton, D.J. Heavy metal toxicity and the environment. In Molecular, Clinical and Environmental Toxicology; Springer: Basel, Switzerland, 2012; pp. 133–164. [Google Scholar]
- Kumar, M.; Puri, A. A review of permissible limits of drinking water. Indian J. Occup. Environ. Med. 2012, 16, 40–44. [Google Scholar]
- Testa, S.M.; Guertin, J.; Jacobs, J.; Avakian, C. Sources of Chromium Contamination in Soil and Groundwater; CRC Press: Boca Raton, FL, USA, 2004; pp. 143–164. [Google Scholar]
- Cempel, M.; Nikel, G. Nickel: A review of its sources and environmental toxicology. Polish J. Environ. Stud. 2006, 15, 375–382. [Google Scholar]
- Armah, F.A.; Obiri, S.; Yawson, D.O.; Onumah, E.E.; Yengoh, G.T.; Afrifa, E.K.; Odoi, J.O. Anthropogenic sources and environmentally relevant concentrations of heavy metals in surface water of a mining district in Ghana: A multivariate statistical approach. J. Environ. Sci. Health Part A 2010, 45, 1804–1813. [Google Scholar] [CrossRef]
- Borah, K.K.; Bhuyan, B.; Sarma, H.P. Lead, arsenic, fluoride, and iron contamination of drinking water in the tea garden belt of Darrang district, Assam, India. Environ. Monit. Assess. 2010, 169, 347–352. [Google Scholar] [CrossRef] [PubMed]
- Phan, K.; Sthiannopkao, S.; Kim, K.W.; Wong, M.H.; Sao, V.; Hashim, J.H.; Yasin, M.S.M.; Aljunid, S.M. Health risk assessment of inorganic arsenic intake of Cambodia residents through groundwater drinking pathway. Water Res. 2010, 44, 5777–5788. [Google Scholar] [CrossRef] [PubMed]
- Hughes, M.F. Arsenic toxicity and potential mechanisms of action. Toxicol. Lett. 2002, 133, 1–16. [Google Scholar] [CrossRef] [Green Version]
- Tchounwou, P.B.; Centeno, J.A.; Patlolla, A.K. Arsenic toxicity, mutagenesis, and carcinogenesis—A health risk assessment and management approach. Mol. Cell. Biochem. 2004, 255, 47–55. [Google Scholar] [CrossRef]
- Wang, N.X.; Liu, Y.Y.; Wei, Z.B.; Yang, L.Y.; Miao, A.J. Waterborne and Dietborne toxicity of inorganic arsenic to the freshwater zooplankton Daphnia magna. Environ. Sci. Technol. 2018, 52, 8912–8919. [Google Scholar] [CrossRef]
- Jaishankar, M.; Tseten, T.; Anbalagan, N.; Mathew, B.B.; Beeregowda, K.N. Toxicity, mechanism and health effects of some heavy metals. Interdiscip. Toxicol. 2014, 7, 60–72. [Google Scholar] [CrossRef] [Green Version]
- Fan, Y.; Jiang, Y.; Hu, P.; Chang, R.; Yao, S.; Wang, B.; Li, X.; Zhou, Q.; Qiao, Y. Modification of association between prior lung disease and lung cancer by inhaled arsenic: A prospective occupational-based cohort study in Yunnan, China. J. Exposure Sci. Environ. Epidemiol. 2016, 26, 464. [Google Scholar] [CrossRef]
- Gillis, B.S.; Arbieva, Z.; Gavin, I.M. Analysis of lead toxicity in human cells. BMC Genom. 2012, 13, 344. [Google Scholar] [CrossRef]
- Wani, A.L.; Ara, A.; Usmani, J.A. Lead toxicity: A review. Interdiscip. Toxicol. 2015, 8, 55–64. [Google Scholar] [CrossRef]
- Budnik, L.T.; Casteleyn, L. Mercury pollution in modern times and its socio-medical consequences. Sci. Total Environ. 2019, 654, 720–734. [Google Scholar] [CrossRef]
- Houston, M.C. Role of mercury toxicity in hypertension, cardiovascular disease, and stroke. J. Clin. Hypertens. 2011, 13, 621–627. [Google Scholar] [CrossRef] [PubMed]
- Carocci, A.; Rovito, N.; Sinicropi, M.S.; Genchi, G. Mercury toxicity and neurodegenerative effects. In Reviews of Environmental Contamination and Toxicology; Springer: Cham, Switzerland, 2014; pp. 1–18. [Google Scholar]
- Bernhoft, R.A. Cadmium toxicity and treatment. Sci. World J. 2013, 2013. [Google Scholar] [CrossRef] [PubMed]
- Moulis, J.M.; Thévenod, F. New perspectives in cadmium toxicity: An introduction. BioMetals 2010, 23, 763–768. [Google Scholar] [CrossRef] [PubMed]
- Sarkar, A.; Ravindran, G.; Krishnamurthy, V. A brief review on the effect of cadmium toxicity: From cellular to organ level. Int. J. Biotechnol. Res. 2013, 3, 17–36. [Google Scholar]
- Mohanty, M.; Patra, H.K. Attenuation of chromium toxicity by bioremediation technology. In Reviews of Environmental Contamination and Toxicology Volume 210; Springer: New York, NY, USA, 2011; pp. 1–34. [Google Scholar]
- Dotaniya, M.; Thakur, J.; Meena, V.; Jajoria, D.; Rathor, G. Chromium pollution: A threat to environment—A review. Agric. Rev. 2014, 35. [Google Scholar] [CrossRef]
- Das, K.K.; Das, S.N.; Dhundasi, S.A. Nickel, its adverse health effects & oxidative stress. Indian J. Med. Res. 2008, 128, 412. [Google Scholar]
- Yeganeh, M.; Afyuni, M.; Khoshgoftarmanesh, A.H.; Khodakarami, L.; Amini, M.; Soffyanian, A.R.; Schulin, R. Mapping of human health risks arising from soil nickel and mercury contamination. J. Hazard. Mater. 2013, 244, 225–239. [Google Scholar] [CrossRef]
- Klotz, K.; Weistenhöfer, W.; Neff, F.; Hartwig, A.; van Thriel, C.; Drexler, H. The health effects of aluminum exposure. Deutsches Ärzteblatt Int. 2017, 114, 653. [Google Scholar] [CrossRef]
- Panhwar, A.H.; Kazi, T.G.; Afridi, H.I.; Arain, S.A.; Arain, M.S.; Brahaman, K.D.; Arain, S.S. Correlation of cadmium and aluminum in blood samples of kidney disorder patients with drinking water and tobacco smoking: Related health risk. Environ. Geochem. Health 2016, 38, 265–274. [Google Scholar] [CrossRef]
- Agrawal, A.; Pandey, R.S.; Sharma, B. Water pollution with special reference to pesticide contamination in India. J. Water Resour. Protect. 2010, 2, 432. [Google Scholar] [CrossRef]
- Kilfoy, B.A.; Zhang, Y.; Park, Y.; Holford, T.R.; Schatzkin, A.; Hollenbeck, A.; Ward, M.H. Dietary nitrate and nitrite and the risk of thyroid cancer in the NIH-AARP Diet and Health Study. Int. J. Cancer 2011, 129, 160–172. [Google Scholar] [CrossRef] [PubMed]
- Fajerwerg, K.; Ynam, V.; Chaudret, B.; Garçon, V.; Thouron, D.; Comtat, M. An original nitrate sensor based on silver nanoparticles electrodeposited on a gold electrode. Electrochem. Commun. 2010, 12, 1439–1441. [Google Scholar] [CrossRef]
- Bagheri, H.; Hajian, A.; Rezaei, M.; Shirzadmehr, A. Composite of Cu metal nanoparticles-multiwall carbon nanotubes-reduced graphene oxide as a novel and high performance platform of the electrochemical sensor for simultaneous determination of nitrite and nitrate. J. Hazard. Mater. 2017, 324, 762–772. [Google Scholar] [CrossRef] [PubMed]
- Badea, M.; Amine, A.; Palleschi, G.; Moscone, D.; Volpe, G.; Curulli, A. New electrochemical sensors for detection of nitrites and nitrates. J. Electroanal. Chem. 2001, 509, 66–72. [Google Scholar] [CrossRef] [Green Version]
- Chen, J.; Wu, H.; Qian, H.; Gao, Y. Assessing nitrate and fluoride contaminants in drinking water and their health risk of rural residents living in a semiarid region of Northwest China. Expo. Health 2017, 9, 183–195. [Google Scholar] [CrossRef]
- Lipp, E.K.; Farrah, S.A.; Rose, J.B. Assessment and impact of microbial fecal pollution and human enteric pathogens in a coastal community. Mar. Pollut. Bull. 2001, 42, 286–293. [Google Scholar] [CrossRef]
- Cabral, J.P. Water microbiology. Bacterial pathogens and water. Int. J. Environ. Res. Public Health 2010, 7, 3657–3703. [Google Scholar] [CrossRef]
- Pandey, P.K.; Kass, P.H.; Soupir, M.L.; Biswas, S.; Singh, V.P. Contamination of water resources by pathogenic bacteria. Amb Express 2014, 4, 51. [Google Scholar] [CrossRef]
- Islam, M.S.; Ahmed, M.K.; Raknuzzaman, M.; Habibullah-Al-Mamun, M.; Islam, M.K. Heavy metal pollution in surface water and sediment: A preliminary assessment of an urban river in a developing country. Ecol. Indic. 2015, 48, 282–291. [Google Scholar] [CrossRef]
- Kim, H.S.; Kim, Y.J.; Seo, Y.R. An overview of carcinogenic heavy metal: Molecular toxicity mechanism and prevention. J. Cancer Prev. 2015, 20, 232. [Google Scholar] [CrossRef]
- Chung, J.Y.; Yu, S.D.; Hong, Y.S. Environmental source of arsenic exposure. J. Prev. Med. Public Health 2014, 47, 253. [Google Scholar] [CrossRef] [PubMed]
- Liu, Z.G.; Huang, X.J. Voltammetric determination of inorganic arsenic. TrAC Trends Anal. Chem. 2014, 60, 25–35. [Google Scholar] [CrossRef]
- Francesconi, K.A.; Kuehnelt, D. Determination of arsenic species: A critical review of methods and applications, 2000–2003. Analyst 2004, 129, 373–395. [Google Scholar] [CrossRef] [PubMed]
- Gunduz, O.; Simsek, C.; Hasozbek, A. Arsenic pollution in the groundwater of Simav Plain, Turkey: Its impact on water quality and human health. Water Air Soil Pollut. 2010, 205, 43. [Google Scholar] [CrossRef]
- Bhattacharya, P.; Samal, A.; Majumdar, J.; Santra, S. Arsenic contamination in rice, wheat, pulses, and vegetables: A study in an arsenic affected area of West Bengal, India. Water Air Soil Pollut. 2010, 213, 3–13. [Google Scholar] [CrossRef]
- Alahi, M.E.E.; Mukhopadhyay, S.C. Detection methods of nitrate in water: A review. Sens. Actuators A Phys. 2018, 280, 210–221. [Google Scholar] [CrossRef]
- Bridle, H.; Miller, B.; Desmulliez, M.P. Application of microfluidics in waterborne pathogen monitoring: A review. Water Res. 2014, 55, 256–271. [Google Scholar] [CrossRef]
- Sobota, D.J.; Compton, J.E.; McCrackin, M.L.; Singh, S. Cost of reactive nitrogen release from human activities to the environment in the United States. Environ. Res. Lett. 2015, 10, 025006. [Google Scholar] [CrossRef]
- Puckett, L.J. Identifying the major sources of nutrient water pollution. Environ. Sci. Technol. 1995, 29, 408A–414A. [Google Scholar] [CrossRef]
- Payment, P.; Locas, A. Pathogens in water: Value and limits of correlation with microbial indicators. Groundwater 2011, 49, 4–11. [Google Scholar] [CrossRef]
- Ashbolt, N.J. Microbial contamination of drinking water and human health from community water systems. Curr. Environ. Health Rep. 2015, 2, 95–106. [Google Scholar] [CrossRef] [PubMed]
- Ishii, S.; Sadowsky, M.J. Escherichia coli in the environment: Implications for water quality and human health. Microbes Environ. 2008, 23, 101–108. [Google Scholar] [CrossRef] [PubMed]
- Figueras, M.; Borrego, J.J. New perspectives in monitoring drinking water microbial quality. Int. J. Environ. Res. Public Health 2010, 7, 4179–4202. [Google Scholar] [CrossRef] [PubMed]
- Lacher, N.A.; Garrison, K.E.; Martin, R.S.; Lunte, S.M. Microchip capillary electrophoresis/electrochemistry. Electrophoresis 2001, 22, 2526–2536. [Google Scholar] [CrossRef]
- Jung, W.; Jang, A.; Bishop, P.L.; Ahn, C.H. A polymer lab chip sensor with microfabricated planar silver electrode for continuous and on-site heavy metal measurement. Sens. Actuators B Chem. 2011, 155, 145–153. [Google Scholar] [CrossRef]
- Kudr, J.; Zitka, O.; Klimanek, M.; Vrba, R.; Adam, V. Microfluidic electrochemical devices for pollution analysis—A review. Sens. Actuators B Chem. 2017, 246, 578–590. [Google Scholar] [CrossRef]
- Chen, C.; Zhang, J.; Du, Y.; Yang, X.; Wang, E. Microfabricated on-chip integrated Au–Ag–Au three-electrode system for in situ mercury ion determination. Analyst 2010, 135, 1010–1014. [Google Scholar] [CrossRef]
- Kim, U.; VanderGiessen, J.; Demaree, B.; Reynolds, M.; Perricone, K. Development of low-cost plastic microfluidic sensors toward rapid and point-of-use detection of arsenic in drinking water for global health. In Proceedings of the 2013 IEEE Biomedical Circuits and Systems Conference (BioCAS), Rotterdam, The Netherlands, 31 October–2 November 2013; pp. 113–117. [Google Scholar]
- Han, K.N.; Li, C.A.; Bui, M.P.N.; Pham, X.H.; Kim, B.S.; Choa, Y.H.; Lee, E.K.; Seong, G.H. On-chip electrochemical detection of bio/chemical molecule by nanostructures fabricated in a microfluidic channel. Sens. Actuators B Chem. 2013, 177, 472–477. [Google Scholar] [CrossRef]
- Avuthu, S.G.R.; Wabeke, J.T.; Narakathu, B.B.; Maddipatla, D.; Arachchilage, J.S.; Obare, S.O.; Atashbar, M.Z. A screen printed phenanthroline-based flexible electrochemical sensor for selective detection of toxic heavy metal ions. IEEE Sens. J. 2016, 16, 8678–8684. [Google Scholar] [CrossRef]
- Lin, Y.; Gritsenko, D.; Feng, S.; Teh, Y.C.; Lu, X.; Xu, J. Detection of heavy metal by paper-based microfluidics. Biosens. Bioelectron. 2016, 83, 256–266. [Google Scholar] [CrossRef]
- Busa, L.; Mohammadi, S.; Maeki, M.; Ishida, A.; Tani, H.; Tokeshi, M. Advances in microfluidic paper-based analytical devices for food and water analysis. Micromachines 2016, 7, 86. [Google Scholar] [CrossRef] [PubMed]
- Lisowski, P.; Zarzycki, P.K. Microfluidic paper-based analytical devices (μPADs) and micro total analysis systems (μTAS): Development, applications and future trends. Chromatographia 2013, 76, 1201–1214. [Google Scholar] [CrossRef] [PubMed]
- Fu, L.M.; Wang, Y.N. Detection methods and applications of microfluidic paper-based analytical devices. TrAC Trends Anal. Chem. 2018. [Google Scholar] [CrossRef]
- Carrell, C.; Kava, A.; Nguyen, M.; Menger, R.; Munshi, Z.; Call, Z.; Nussbaum, M.; Henry, C. Beyond the lateral flow assay: A review of paper-based microfluidics. Microelectron. Eng. 2019, 206, 45–54. [Google Scholar] [CrossRef]
- Akyazi, T.; Basabe-Desmonts, L.; Benito-Lopez, F. Review on microfluidic paper-based analytical devices towards commercialisation. Anal. Chim. Acta 2018, 1001, 1–17. [Google Scholar] [CrossRef] [PubMed]
- Shi, J.; Tang, F.; Xing, H.; Zheng, H.; Lianhua, B.; Wei, W. Electrochemical detection of Pb and Cd in paper-based microfluidic devices. J. Braz. Chem. Soc. 2012, 23, 1124–1130. [Google Scholar] [CrossRef]
- Cortés-Salazar, F.; Beggah, S.; van der Meer, J.R.; Girault, H.H. Electrochemical As (III) whole-cell based biochip sensor. Biosens. Bioelectron. 2013, 47, 237–242. [Google Scholar] [CrossRef]
- Gartia, M.R.; Braunschweig, B.; Chang, T.W.; Moinzadeh, P.; Minsker, B.S.; Agha, G.; Wieckowski, A.; Keefer, L.L.; Liu, G.L. The microelectronic wireless nitrate sensor network for environmental water monitoring. J. Environ. Monit. 2012, 14, 3068–3075. [Google Scholar] [CrossRef]
- Wang, X.; Gartia, M.R.; Jiang, J.; Chang, T.W.; Qian, J.; Liu, Y.; Liu, X.; Liu, G.L. Audio jack based miniaturized mobile phone electrochemical sensing platform. Sens. Actuators B Chem. 2015, 209, 677–685. [Google Scholar] [CrossRef]
- Calvo-López, A.; Arasa-Puig, E.; Puyol, M.; Casalta, J.M.; Alonso-Chamarro, J. Biparametric potentiometric analytical microsystem for nitrate and potassium monitoring in water recycling processes for manned space missions. Anal. Chim. Acta 2013, 804, 190–196. [Google Scholar] [CrossRef]
- Cuartero, M.; Crespo, G.A.; Bakker, E. Tandem electrochemical desalination–potentiometric nitrate sensing for seawater analysis. Anal. Chem. 2015, 87, 8084–8089. [Google Scholar] [CrossRef]
- Ali, M.A.; Jiao, Y.; Tabassum, S.; Wang, Y.; Jiang, H.; Dong, L. Electrochemical detection of nitrate ions in soil water using graphene foam modified by TiO2 nanofibers and enzyme molecules. In Proceedings of the 2017 19th International Conference on Solid-State Sensors, Actuators and Microsystems (TRANSDUCERS), Kaohsiung, Taiwan, 18–22 June 2017; pp. 238–241. [Google Scholar]
- Kim, U.; Ghanbari, S.; Ravikumar, A.; Seubert, J.; Figueira, S. Rapid, affordable, and point-of-care water monitoring via a microfluidic DNA sensor and a mobile interface for global health. IEEE J. Transl. Eng. Health Med. 2013, 1, 3700207. [Google Scholar] [PubMed]
- Li, X.; Scida, K.; Crooks, R.M. Detection of hepatitis B virus DNA with a paper electrochemical sensor. Anal. Chem. 2015, 87, 9009–9015. [Google Scholar] [CrossRef] [PubMed]
- Altintas, Z.; Akgun, M.; Kokturk, G.; Uludag, Y. A fully automated microfluidic-based electrochemical sensor for real-time bacteria detection. Biosens. Bioelectron. 2018, 100, 541–548. [Google Scholar] [CrossRef] [PubMed]
- Kim, M.; Jung, T.; Kim, Y.; Lee, C.; Woo, K.; Seol, J.H.; Yang, S. A microfluidic device for label-free detection of Escherichia coli in drinking water using positive dielectrophoretic focusing, capturing, and impedance measurement. Biosens. Bioelectron. 2015, 74, 1011–1015. [Google Scholar] [CrossRef] [PubMed]
- Jiang, J.; Wang, X.; Chao, R.; Ren, Y.; Hu, C.; Xu, Z.; Liu, G.L. Smartphone based portable bacteria pre-concentrating microfluidic sensor and impedance sensing system. Sens. Actuators B Chem. 2014, 193, 653–659. [Google Scholar] [CrossRef]
- Clausen, C.; Dimaki, M.; Bertelsen, C.; Skands, G.; Rodriguez-Trujillo, R.; Thomsen, J.; Svendsen, W. Bacteria Detection and Differentiation Using Impedance Flow Cytometry. Sensors 2018, 18, 3496. [Google Scholar] [CrossRef]
- Maw, M.; Wang, J.; Yu, K.; Wang, Y.; Dai, B.; Wu, X.; Pan, X. An Examination of the Validity of MRPS Method for the Detection of Label-free E. Coli and Enterococci in Ships Ballast Water. In IOP Conference Series: Earth and Environmental Science; IOP Publishing: Bristol, UK, 2018; Volume 171, p. 012032. [Google Scholar]
- Ghosh Dastider, S.; Barizuddin, S.; Yuksek, N.S.; Dweik, M.; Almasri, M.F. Efficient and rapid detection of Salmonella using microfluidic impedance based sensing. J. Sens. 2015, 2015, 293461. [Google Scholar] [CrossRef]
- Bio Nano Consulting Product Page. Available online: http://www.bio-nano-consulting.com/product-developmentdrinksafe (accessed on 22 October 2019).
- PalmSense Compact Electrochemical Interfaces ItalSens IS-C Page. Available online: https://www.palmsens.com/product/italsens-is-c/ (accessed on 22 October 2019).
- gtq silicon technologies for sensing Services and Product Page. Available online: http://gtq.imb-cnm.csic.es/en/services-and-products/technology-offer/fv00620231869 (accessed on 22 October 2019).
- MEDIRAY+ Ion Selective Electrodes Page. Available online: https://www.mediray.co.nz/laboratory/shop/the-hanna-range/ion-selective-electrodes-ises/ion-selective-electrodes/nitrate-combination-ion-selective-electrode-hi4113/ (accessed on 22 October 2019).
- xylem Let’s Solve Water Product Page. Available online: https://www.xylemanalytics.com/en/general-product/id-151/ISE-combination-sensor-for-ammonium-and-nitrate—WTW (accessed on 22 October 2019).
- Vernier Nitrate Ion-Selective Electrode Page. Available online: https://www.vernier.com/products/sensors/ion-selective-electrodes/labquest-ise/no3-bta/ (accessed on 22 October 2019).
- HANNA instruments Nitrate Combination Ion Selective Electrode Page. Available online: https://hannainst.com/hi4113-nitrate-combination-ion-selective-electrode.html (accessed on 22 October 2019).
- Khoshsafar, H.; Bagheri, H.; Rezaei, M.; Shirzadmehr, A.; Hajian, A.; Sepehri, Z. Magnetic carbon paste electrode modified with a high performance composite based on molecularly imprinted carbon nanotubes for sensitive determination of levofloxacin. J. Electrochem. Soc. 2016, 163, B422–B427. [Google Scholar] [CrossRef]
- Randviir, E.P.; Banks, C.E. Electrochemical impedance spectroscopy: an overview of bioanalytical applications. Anal. Methods 2013, 5, 1098–1115. [Google Scholar] [CrossRef]
- Boehm, D.A.; Gottlieb, P.A.; Hua, S.Z. On-chip microfluidic biosensor for bacterial detection and identification. Sens. Actuators B Chem. 2007, 126, 508–514. [Google Scholar] [CrossRef]
- Sun, T.; Morgan, H. Single-cell microfluidic impedance cytometry: A review. Microfluid. Nanofluid. 2010, 8, 423–443. [Google Scholar] [CrossRef]
- Luka, G.; Ahmadi, A.; Najjaran, H.; Alocilja, E.; DeRosa, M.; Wolthers, K.; Malki, A.; Aziz, H.; Althani, A.; Hoorfar, M. Microfluidics integrated biosensors: A leading technology towards lab-on-a-chip and sensing applications. Sensors 2015, 15, 30011–30031. [Google Scholar] [CrossRef] [PubMed]
- Wang, H.; Li, Y.J.; Wei, J.F.; Xu, J.R.; Wang, Y.H.; Zheng, G.X. Based three-dimensional microfluidic device for monitoring of heavy metals with a camera cell phone. Anal. Bioanal. Chem. 2014, 406, 2799–2807. [Google Scholar] [CrossRef] [PubMed]
- Chen, W.; Fang, X.; Li, H.; Cao, H.; Kong, J. A simple paper-based colorimetric device for rapid mercury (II) assay. Sci. Rep. 2016, 6, 31948. [Google Scholar] [CrossRef] [PubMed]
- Fan, C.; He, S.; Liu, G.; Wang, L.; Song, S. A Portable and Power-Free Microfluidic Device for Rapid and Sensitive Lead (Pb2+) Detection. Sensors 2012, 12, 9467–9475. [Google Scholar] [CrossRef] [PubMed]
- Nath, P.; Arun, R.K.; Chanda, N. A paper based microfluidic device for the detection of arsenic using a gold nanosensor. RSC Adv. 2014, 4, 59558–59561. [Google Scholar] [CrossRef]
- Chowdury, M.; Walji, N.; Mahmud, M.; MacDonald, B. Paper-based microfluidic device with a gold nanosensor to detect arsenic contamination of groundwater in Bangladesh. Micromachines 2017, 8, 71. [Google Scholar] [CrossRef]
- Bonyar, A.; Nagy, P.; Mayer, V.; Vitéz, A.; Gerecs, A.; Sántha, H.; Harsányi, G. A colorimetry based, semi-automated portable sensor device for the detection of arsenic in drinking water. Sens. Actuators B Chem. 2017, 251, 1042–1049. [Google Scholar] [CrossRef] [Green Version]
- Qi, J.; Li, B.; Wang, X.; Zhang, Z.; Wang, Z.; Han, J.; Chen, L. Three-dimensional paper-based microfluidic chip device for multiplexed fluorescence detection of Cu2+ and Hg2+ ions based on ion imprinting technology. Sens. Actuators B Chem. 2017, 251, 224–233. [Google Scholar] [CrossRef]
- Truffer, F.; Buffi, N.; Merulla, D.; Beggah, S.; Van Lintel, H.; Renaud, P.; van der Meer, J.R.; Geiser, M. Compact portable biosensor for arsenic detection in aqueous samples with Escherichia coli bioreporter cells. Rev. Sci. Instrum. 2014, 85, 015120. [Google Scholar] [CrossRef] [PubMed] [Green Version]
- Theytaz, J.; Braschler, T.; Van Lintel, H.; Renaud, P.; Diesel, E.; Merulla, D.; Van der Meer, J. Biochip with E. coli bacteria for detection of arsenic in drinking water. Procedia Chem. 2009, 1, 1003–1006. [Google Scholar] [CrossRef]
- Qi, N.; Li, B.; You, H.; Zhang, W.; Fu, L.; Wang, Y.; Chen, L. Surface-enhanced Raman scattering on a zigzag microfluidic chip: Towards high-sensitivity detection of As (III) ions. Anal. Methods 2014, 6, 4077–4082. [Google Scholar] [CrossRef]
- Som-Aum, W.; Li, H.; Liu, J.; Lin, J.M. Determination of arsenate by sorption pre-concentration on polystyrene beads packed in a microfluidic device with chemiluminescence detection. Analyst 2008, 133, 1169–1175. [Google Scholar] [CrossRef] [PubMed]
- Cogan, D.; Fay, C.; Boyle, D.; Osborne, C.; Kent, N.; Cleary, J.; Diamond, D. Development of a low cost microfluidic sensor for the direct determination of nitrate using chromotropic acid in natural waters. Anal. Methods 2015, 7, 5396–5405. [Google Scholar] [CrossRef]
- Xiong, Y.; Wang, C.J.; Tao, T.; Duan, M.; Fang, S.W.; Zheng, M. A miniaturized fiber-optic colorimetric sensor for nitrite determination by coupling with a microfluidic capillary waveguide. Anal. Bioanal. Chem. 2016, 408, 3413–3423. [Google Scholar] [CrossRef]
- Khanfar, M.; Al-Faqheri, W.; Al-Halhouli, A.A. Low cost lab on chip for the colorimetric detection of nitrate in mineral water products. Sensors 2017, 17, 2345. [Google Scholar] [CrossRef]
- Jayawardane, B.M.; Wei, S.; McKelvie, I.D.; Kolev, S.D. Microfluidic paper-based analytical device for the determination of nitrite and nitrate. Anal. Chem. 2014, 86, 7274–7279. [Google Scholar] [CrossRef]
- Beaton, A.D.; Cardwell, C.L.; Thomas, R.S.; Sieben, V.J.; Legiret, F.E.; Waugh, E.M.; Statham, P.J.; Mowlem, M.C.; Morgan, H. Lab-on-chip measurement of nitrate and nitrite for in situ analysis of natural waters. Environ. Sci. Technol. 2012, 46, 9548–9556. [Google Scholar] [CrossRef]
- Vincent, A.G.; Pascal, R.W.; Beaton, A.D.; Walk, J.; Hopkins, J.E.; Woodward, E.M.S.; Mowlem, M.; Lohan, M.C. Nitrate drawdown during a shelf sea spring bloom revealed using a novel microfluidic in situ chemical sensor deployed within an autonomous underwater glider. Mar. Chem. 2018, 205, 29–36. [Google Scholar] [CrossRef]
- Dharmasiri, U.; Witek, M.A.; Adams, A.A.; Osiri, J.K.; Hupert, M.L.; Bianchi, T.S.; Roelke, D.L.; Soper, S.A. Enrichment and detection of Escherichia coli O157: H7 from water samples using an antibody modified microfluidic chip. Anal. Chem. 2010, 82, 2844–2849. [Google Scholar] [CrossRef] [PubMed]
- Golberg, A.; Linshiz, G.; Kravets, I.; Stawski, N.; Hillson, N.J.; Yarmush, M.L.; Marks, R.S.; Konry, T. Cloud-enabled microscopy and droplet microfluidic platform for specific detection of Escherichia coli in water. PLoS ONE 2014, 9, e86341. [Google Scholar] [CrossRef] [PubMed]
- Malec, A.; Kokkinis, G.; Haiden, C.; Giouroudi, I. Biosensing system for concentration quantification of magnetically labeled E. coli in water samples. Sensors 2018, 18, 2250. [Google Scholar] [CrossRef]
- San Park, T.; Yoon, J.Y. Smartphone detection of Escherichia coli from field water samples on paper microfluidics. IEEE Sens. J. 2014, 15, 1902–1907. [Google Scholar] [CrossRef]
- Tokel, O.; Yildiz, U.H.; Inci, F.; Durmus, N.G.; Ekiz, O.O.; Turker, B.; Cetin, C.; Rao, S.; Sridhar, K.; Natarajan, N.; et al. Portable microfluidic integrated plasmonic platform for pathogen detection. Sci. Rep. 2015, 5, 9152. [Google Scholar] [CrossRef] [PubMed]
- Li, Y.; Zhang, C.; Xing, D. Integrated microfluidic reverse transcription-polymerase chain reaction for rapid detection of food-or waterborne pathogenic rotavirus. Anal. Biochem. 2011, 415, 87–96. [Google Scholar] [CrossRef]
- Boehle, K.E.; Gilliand, J.; Wheeldon, C.R.; Holder, A.; Adkins, J.A.; Geiss, B.J.; Ryan, E.P.; Henry, C.S. Utilizing Paper-Based Devices for Antimicrobial-Resistant Bacteria Detection. Angew. Chem. Int. Ed. 2017, 56, 6886–6890. [Google Scholar] [CrossRef]
- FONDRIEST ENVIRONMENTAL PRODUCTS Hach Arsenic Test Kit Page. Available online: https://www.fondriest.com/hach-arsenic-test-kit.htm (accessed on 22 October 2019).
- FilterWater.com Arsenic Quick Test Kit Page. Available online: http://www.filterwater.com/p-209-arsenic-quick-test-kit-100-tests.aspx (accessed on 22 October 2019).
- Palintest Water analysis technology Arsenator—Digital Arsenic Test Page. Available online: https://www.palintest.com/products/arsenator/ (accessed on 22 October 2019).
- P S Analytical “Applying the Power of Atomic Fluorescence” ARSENIC Page. Available online: http://psanalytical.com/information/asarsenic.html (accessed on 22 October 2019).
- ChemSee HEAVY METAL DETECTORS Page. Available online: https://www.chemsee.com/residential/heavy-metal-detector-products/ (accessed on 22 October 2019).
- HANNA instruments Nitrate-Nitrogen Portable Photometer Page. Available online: https://hannainst.com/hi96728-nitrate-portable-photometer.html (accessed on 22 October 2019).
- HydroMetrics Home Page. Available online: http://www.hydrometrics.co.nz/ (accessed on 22 October 2019).
- OTT HydroMet Product Page. Available online: https://www.ott.com/products/water-quality-2/ott-econ-2439/ (accessed on 22 October 2019).
- BioVision Incorporated PCR Detection Kits Page. Available online: https://www.biovision.com/pcr-campylobacter-detection-kit.html (accessed on 22 October 2019).
- Li, X.; Ballerini, D.R.; Shen, W. A perspective on paper-based microfluidics: Current status and future trends. Biomicrofluidics 2012, 6, 011301. [Google Scholar] [CrossRef]
- Mentele, M.M.; Cunningham, J.; Koehler, K.; Volckens, J.; Henry, C.S. Microfluidic paper-based analytical device for particulate metals. Anal. Chem. 2012, 84, 4474–4480. [Google Scholar] [CrossRef]
- Trang, P.T.K.; Berg, M.; Viet, P.H.; Mui, N.V.; van der Meer, J.R. Bacterial bioassay for rapid and accurate analysis of arsenic in highly variable groundwater samples. Environ. Sci. Technol. 2005, 39, 7625–7630. [Google Scholar] [CrossRef]
- Buffi, N.; Merulla, D.; Beutier, J.; Barbaud, F.; Beggah, S.; Van Lintel, H.; Renaud, P.; van der Meer, J.R. Development of a microfluidics biosensor for agarose-bead immobilized Escherichia coli bioreporter cells for arsenite detection in aqueous samples. Lab Chip 2011, 11, 2369–2377. [Google Scholar] [CrossRef] [PubMed]
- Dutt, J.; Davis, J. Current strategies in nitrite detection and their application to field analysis. J. Environ. Monit. 2002, 4, 465–471. [Google Scholar] [CrossRef] [PubMed]
- Wang, J.; Monton, M.R.N.; Zhang, X.; Filipe, C.D.; Pelton, R.; Brennan, J.D. Hydrophobic sol–gel channel patterning strategies for paper-based microfluidics. Lab Chip 2014, 14, 691–695. [Google Scholar] [CrossRef] [PubMed]
Figure 1.
Illustration of a microfluidic sensing system.

Figure 2.
Different orientations of electrodes in electrochemical detection methods: (a) Schematic of an Au–Ag–Au electrode integrated with a microfluidic channel to detect Hg+2 [101]; (b) illustration of a reusable polymer chip for detection of Pb+2 [99]; (c) electrodes printed on a plastic substrate to detect As(III) [102]; and (d) single-walled carbon nanotube (SWCNT) electrodes for As(III) detection [103].

Figure 3.
Schematic of paper-based method including integrated commercial screen-printed carbon electrodes with filter paper strips for detection of Pb+2 and Cd+2 [111].
Figure 3.
Schematic of paper-based method including integrated commercial screen-printed carbon electrodes with filter paper strips for detection of Pb+2 and Cd+2 [111].

Figure 4.
Pictorial presentation of the working scheme of the As(III) bioreporter [112].
Figure 4.
Pictorial presentation of the working scheme of the As(III) bioreporter [112].

Figure 5.
(a) Nitrate sensor chip with wireless communication interface [113]; (b) experimental set up of low-temperature co-fired ceramics (LTCC)-based continuous flow potentiometric microanalyzer to determine potassium and nitrate [115]; (c) a mobile sensing platform with a plug-n-play microelectronic ionic sensor to detect nitrate [114]; and (d) nTiO2-modified graphene foam (GF)-based nitrate sensor [117].

Figure 6.
(a) Electrochemical DNA-based sensor for E. coli determination [118] and (b) custom-made automatic biosensor for pathogenic detection [120].

Figure 7.
(a) Wax-printed PADs for colorimetric detection of Fe, Cu, and Ni [172]; (b) 3-D paper microfluidics for metal ion detection [138]; (c) working principle of As(III) detector based on modified AuNP [141]; (d) T-shaped PAD with functionalized AuNp for As(III) detection [142]; and (e) rapid detection of Pb2+ with MUA-modified AuNP [140].

Figure 8.
(a) Three-dimensional paper-based fluorescence detection of Cu2+ and Hg2+ [144]; (b) E. coli-based fluorescence detection of As(III) [146]; and (c) fluorescence detection of As(III) using portable bioreporter [145].

Figure 9.
(a) Quantification of nitrite and nitrate using disposable PAD [152]; (b) schematic of the flow system and detection cell of LED-based nitrate sensors [149]; and (c) schematic of the fiber-optic chemical sensor (FOCS) method for nitrite measurement [150].

Figure 10.
Scheme indicating a mobile-based multichannel paper chip for rapid E. coli detection [158].
Figure 10.
Scheme indicating a mobile-based multichannel paper chip for rapid E. coli detection [158].

Figure 11.
Schematic of SPR-based pathogenic detection [159].
Figure 11.
Schematic of SPR-based pathogenic detection [159].

Figure 12.
Summary.


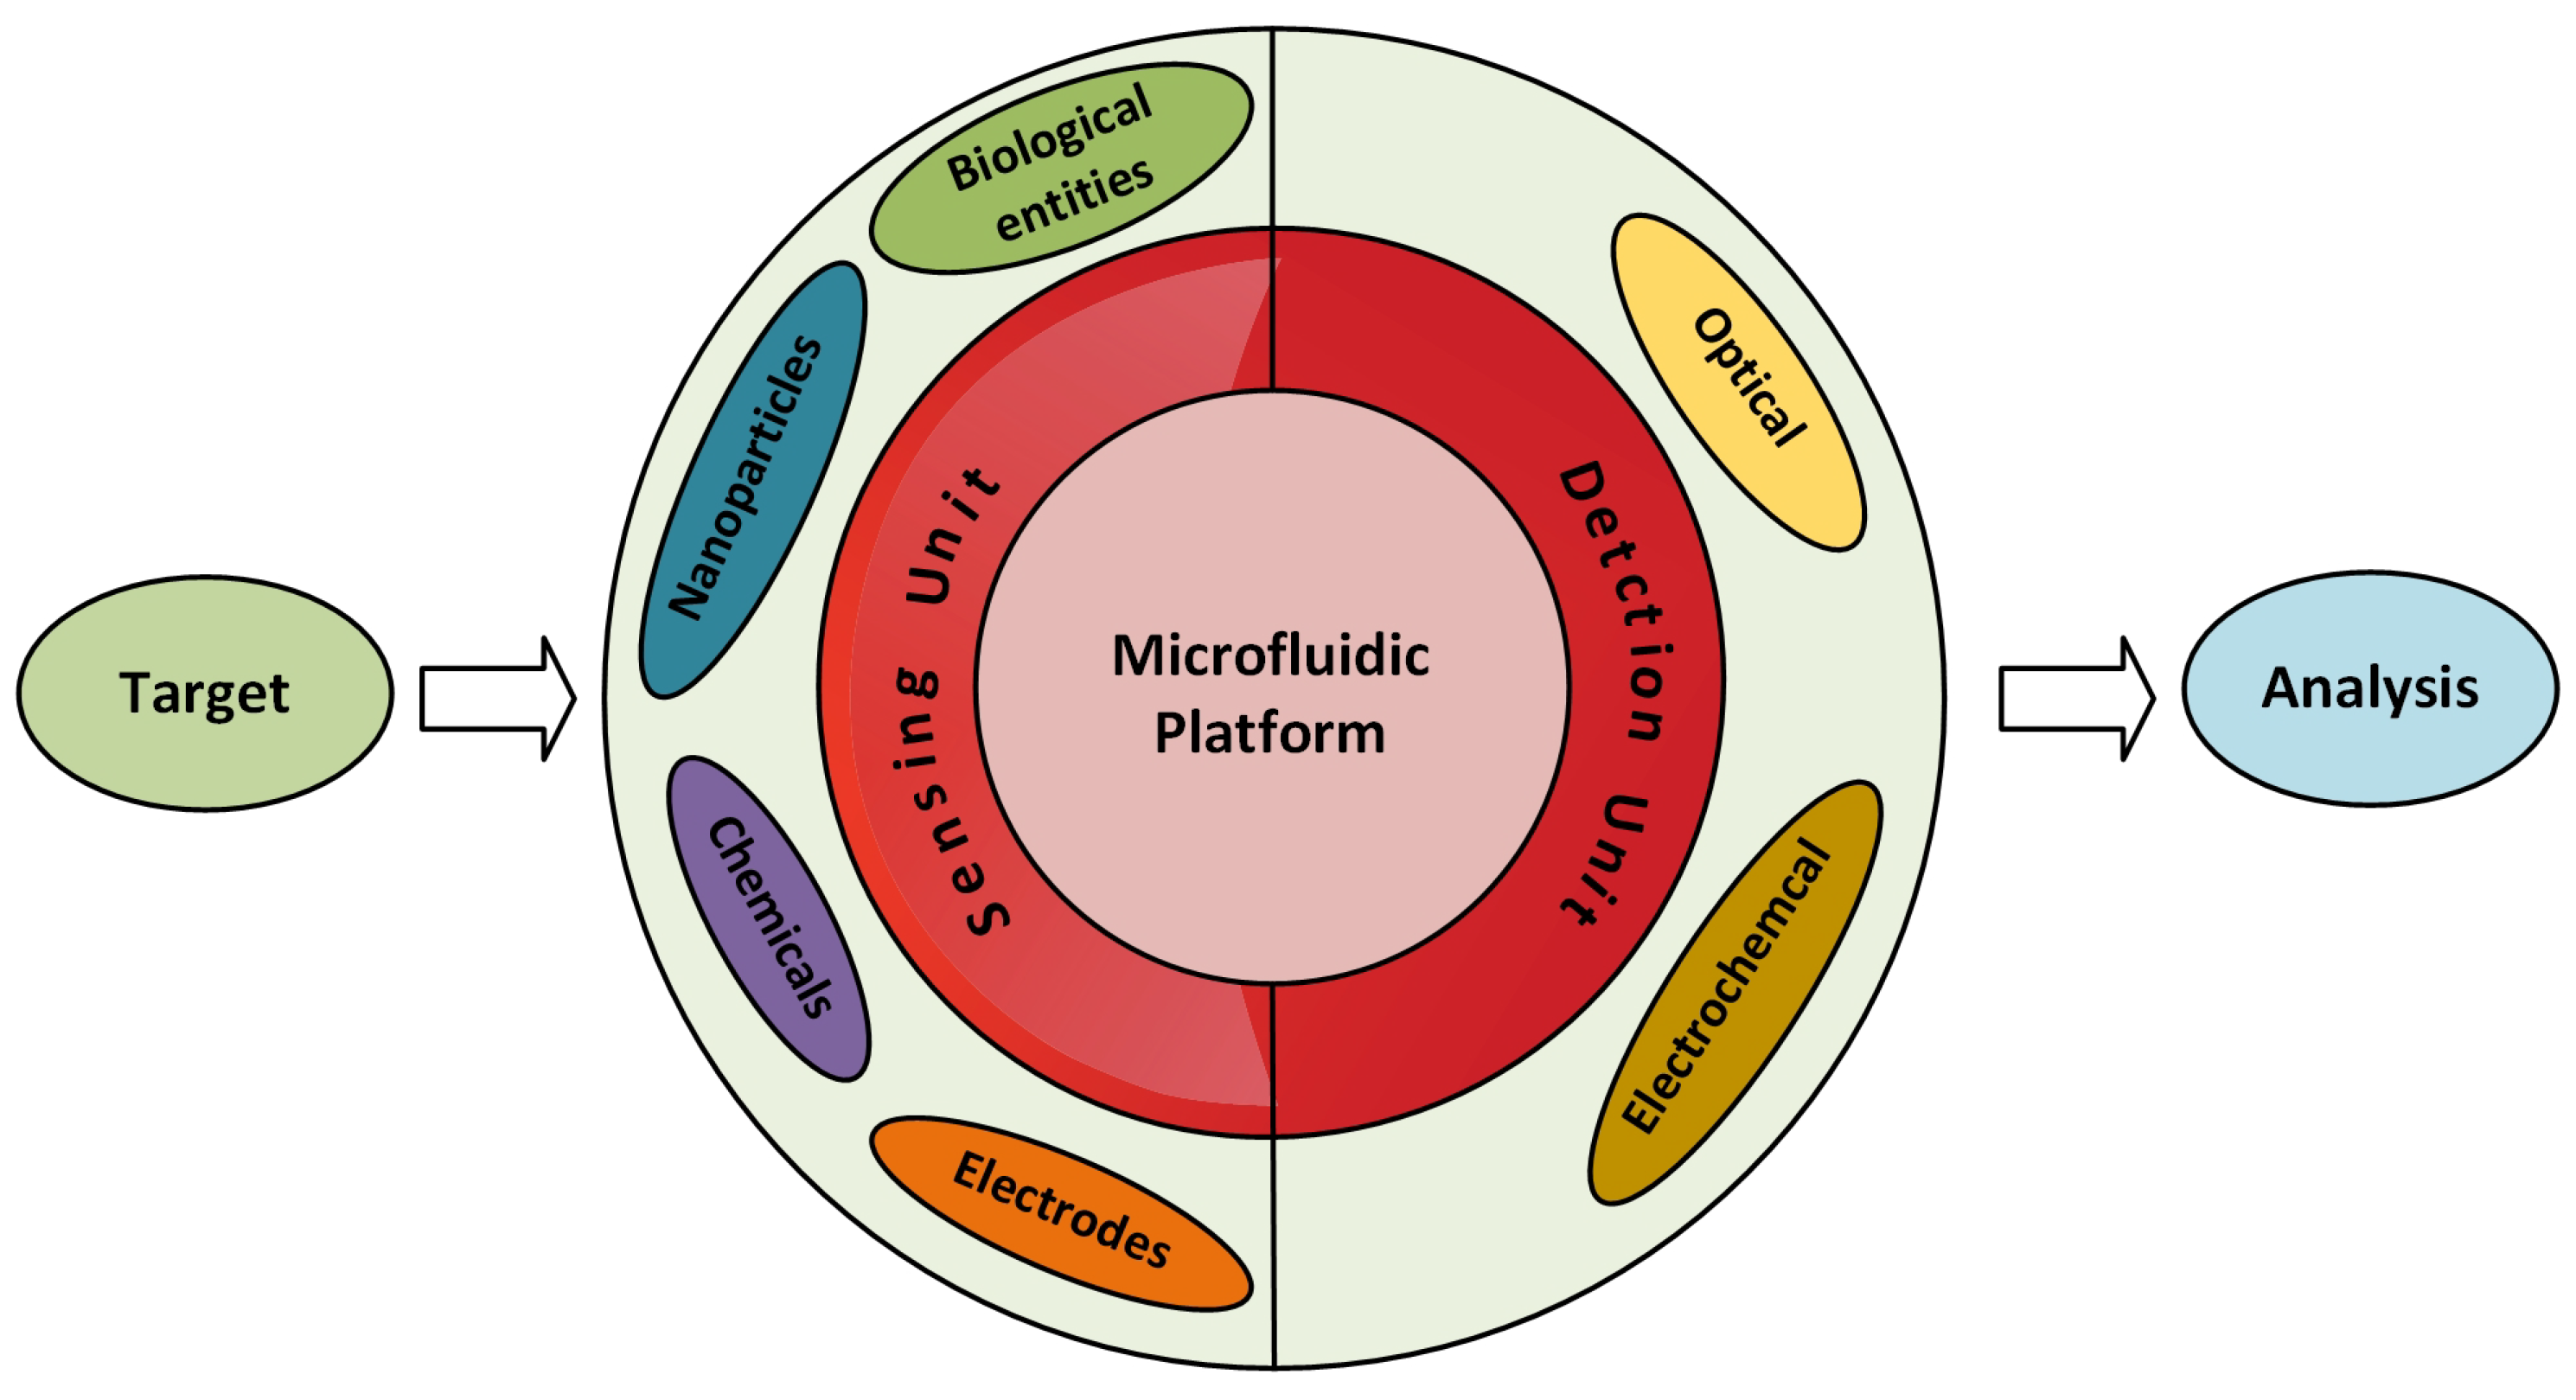
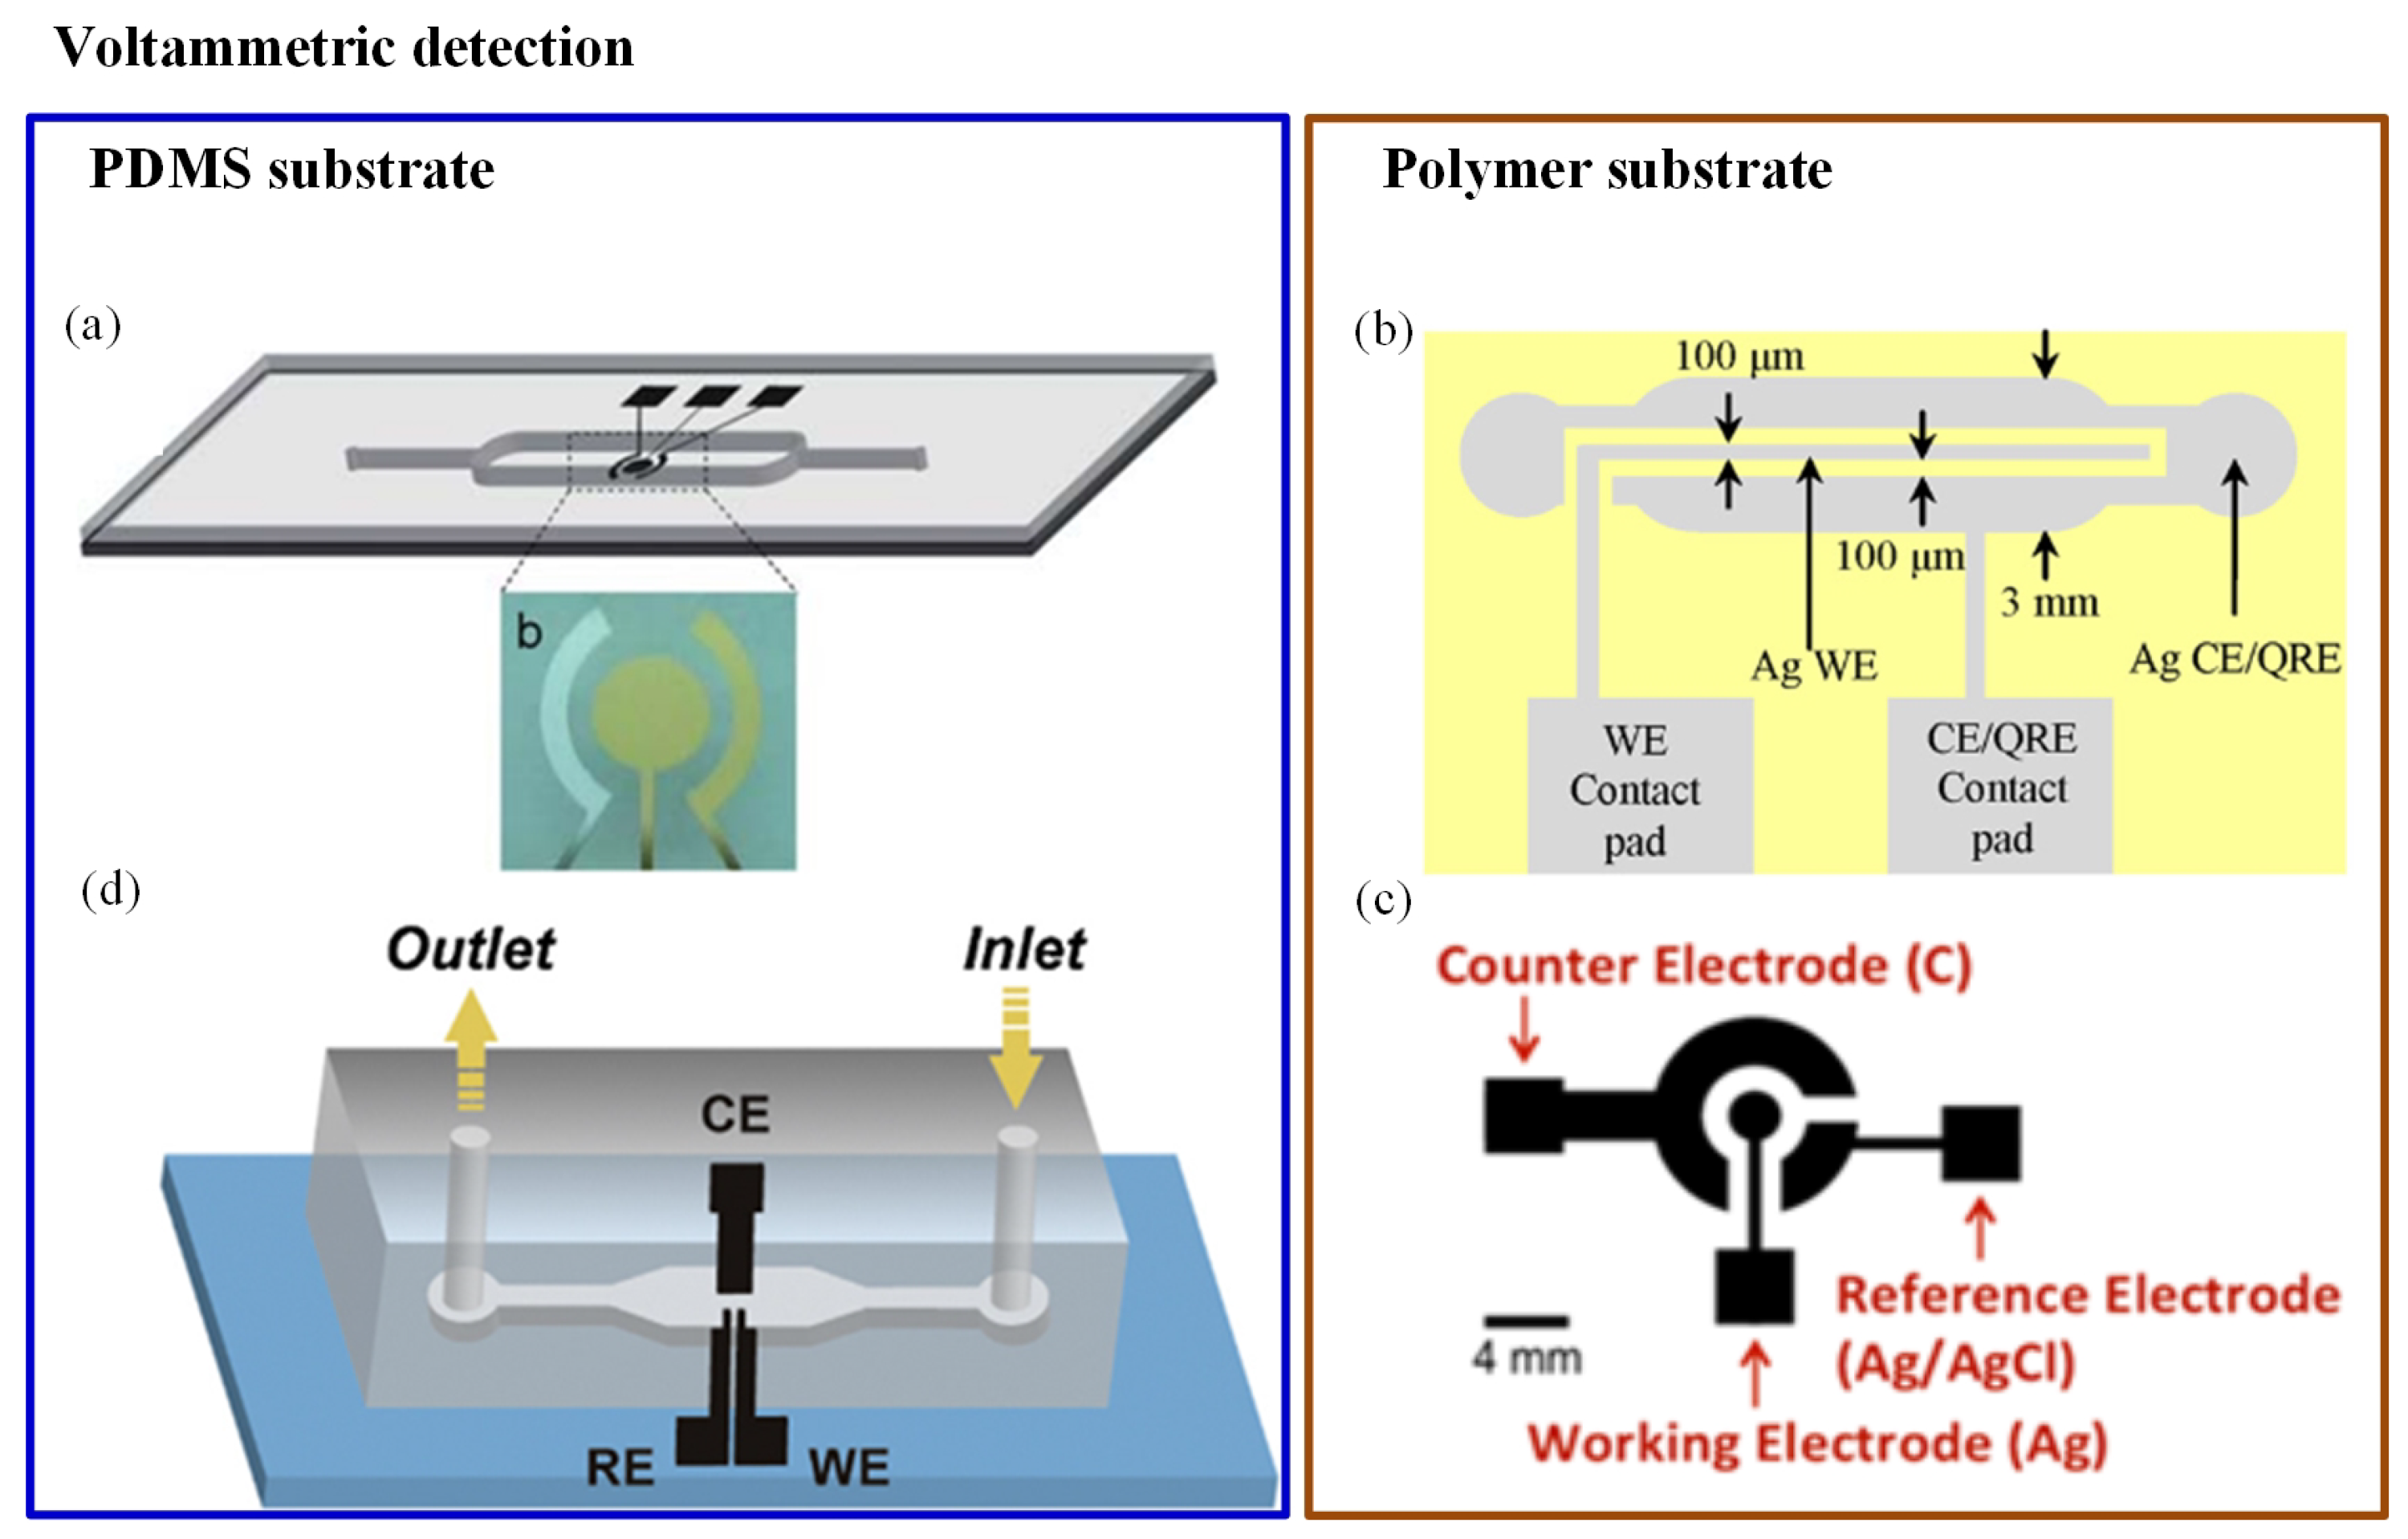
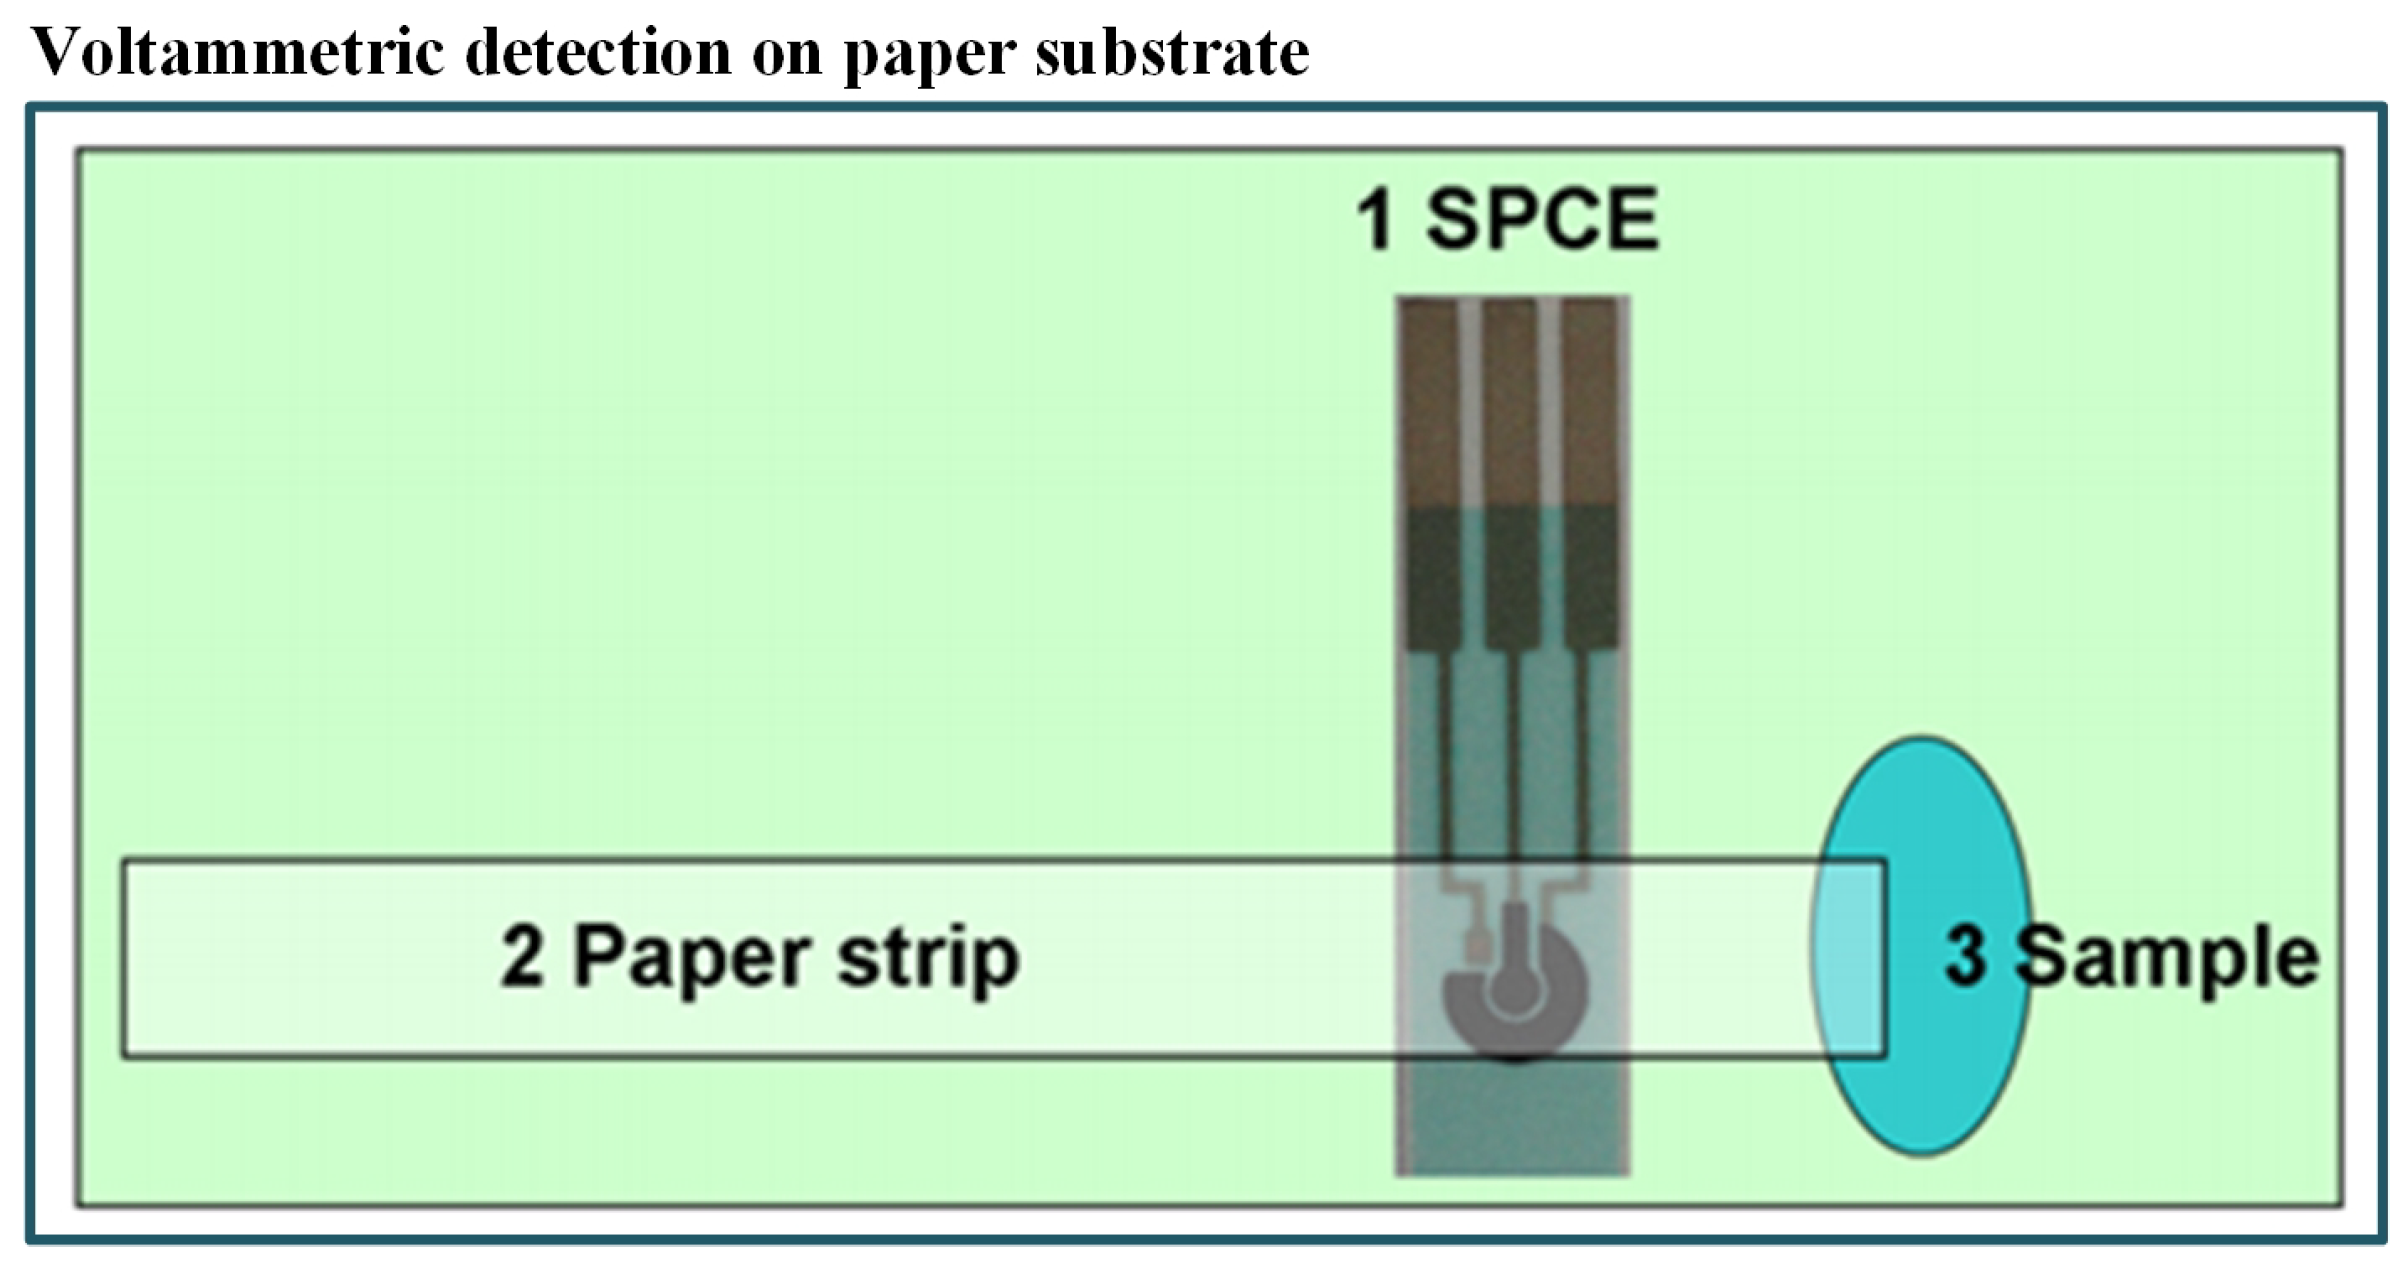
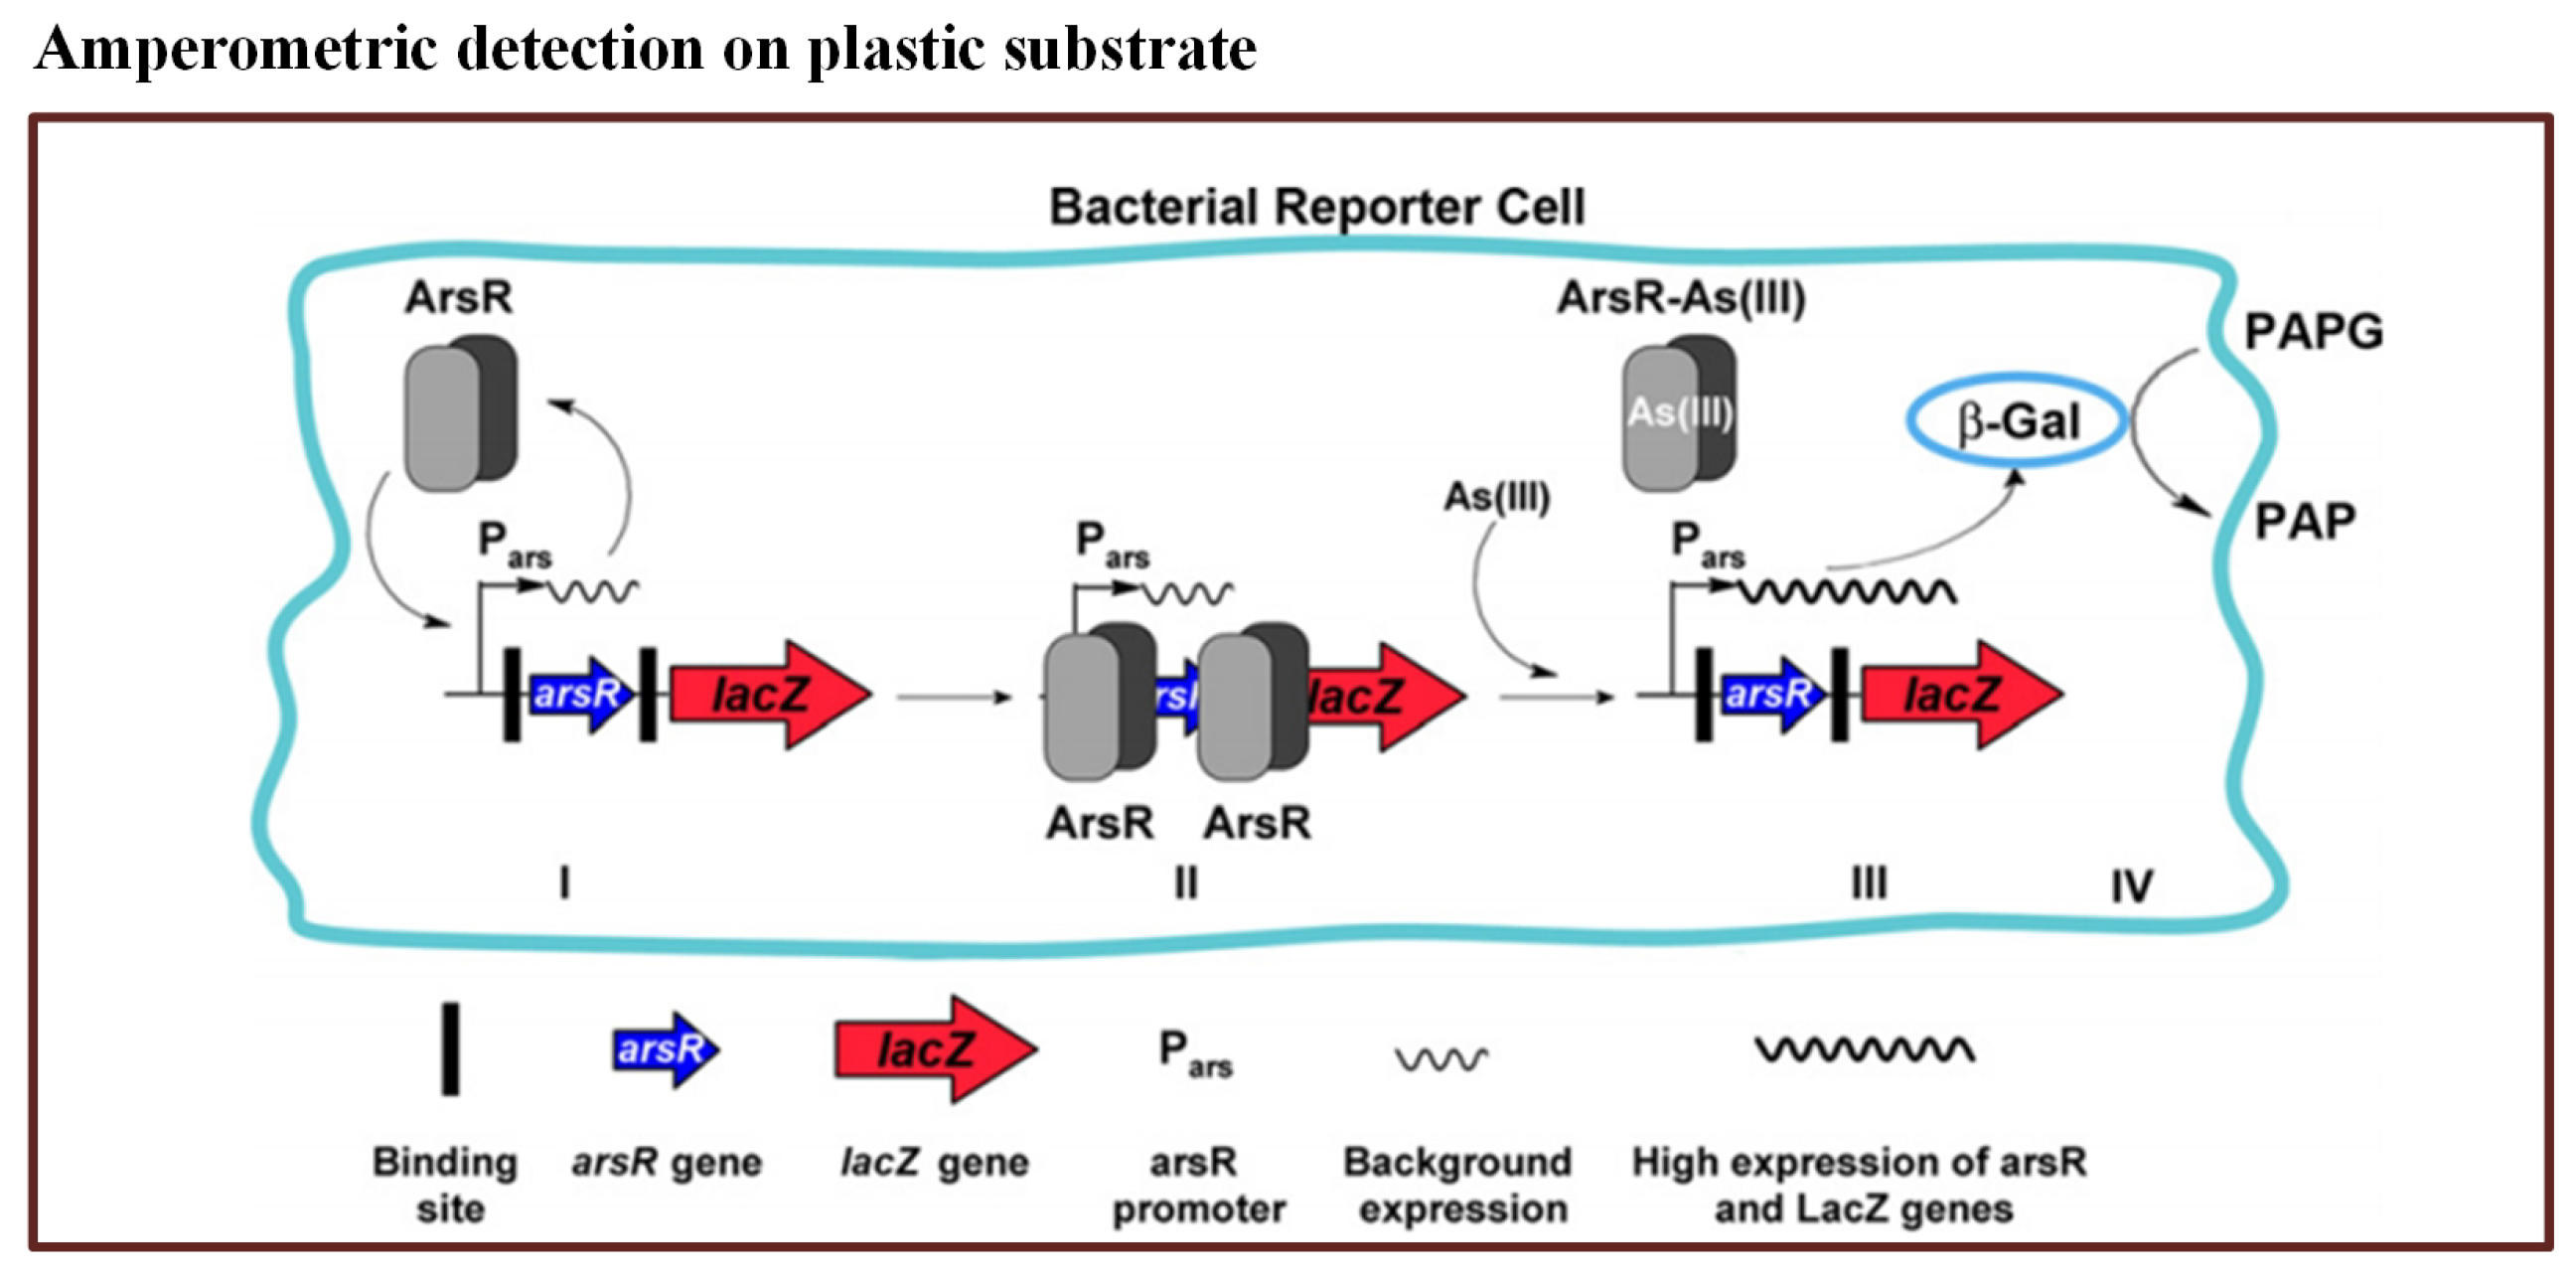
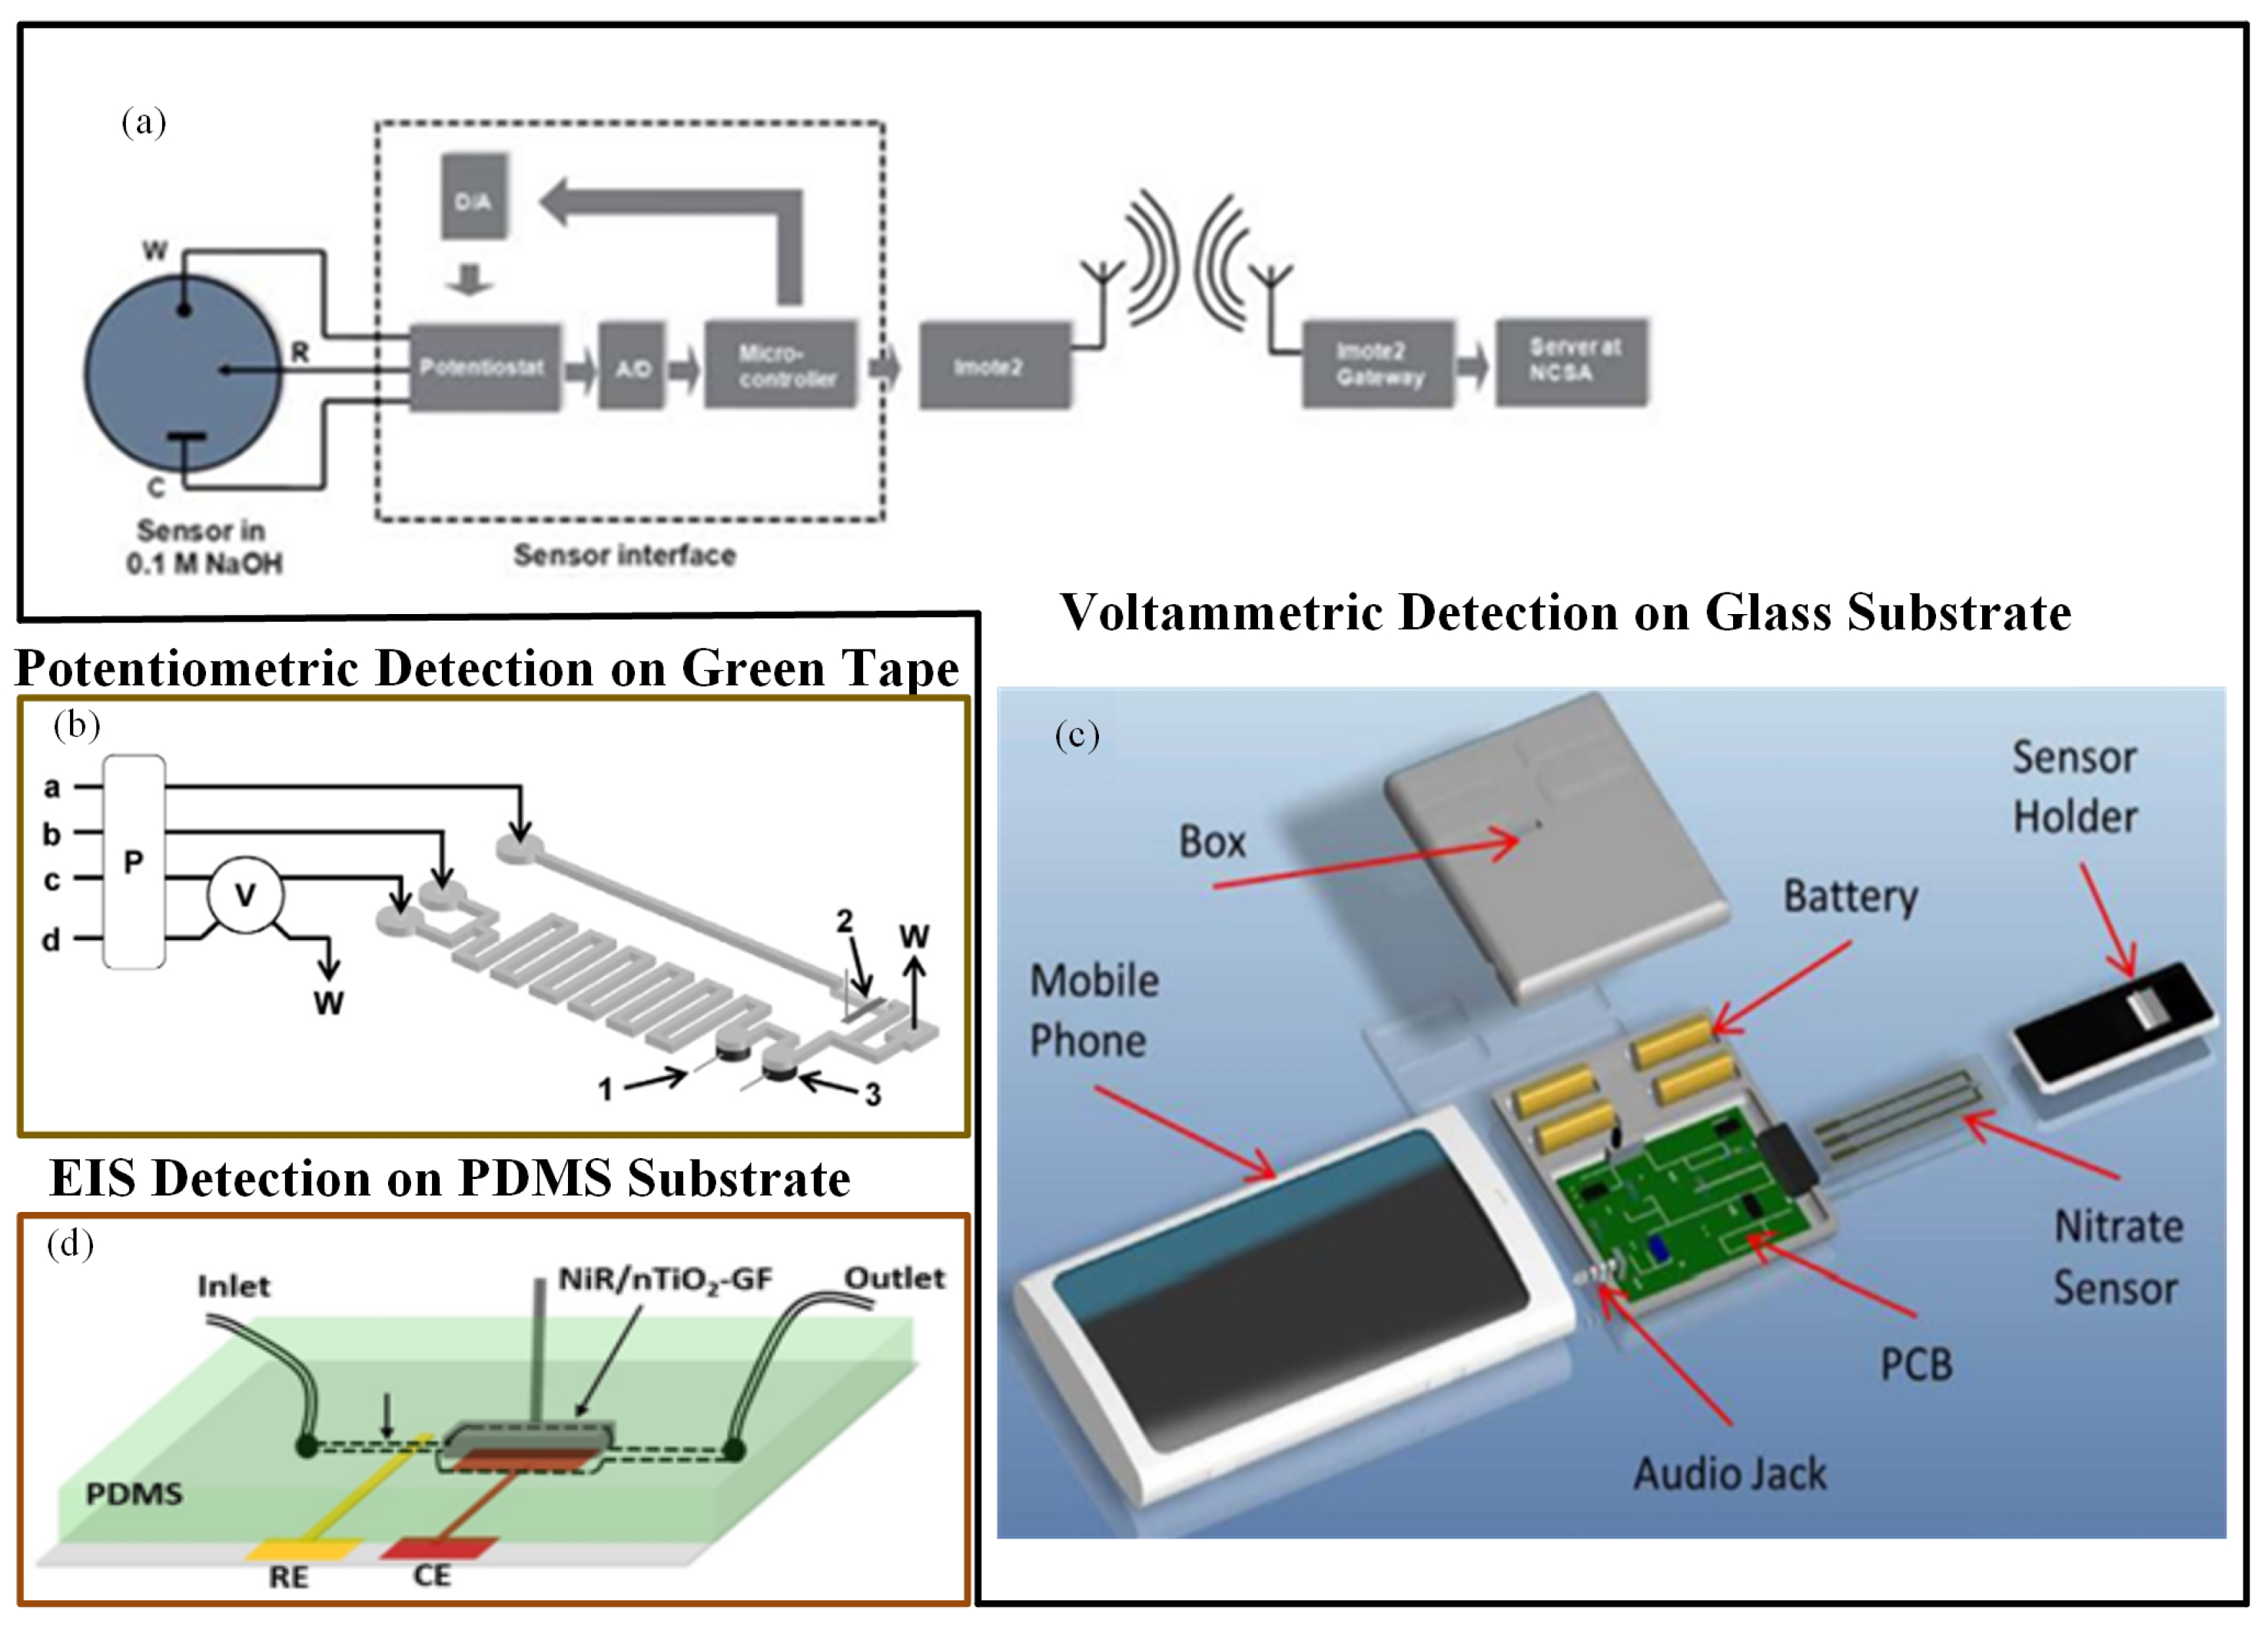
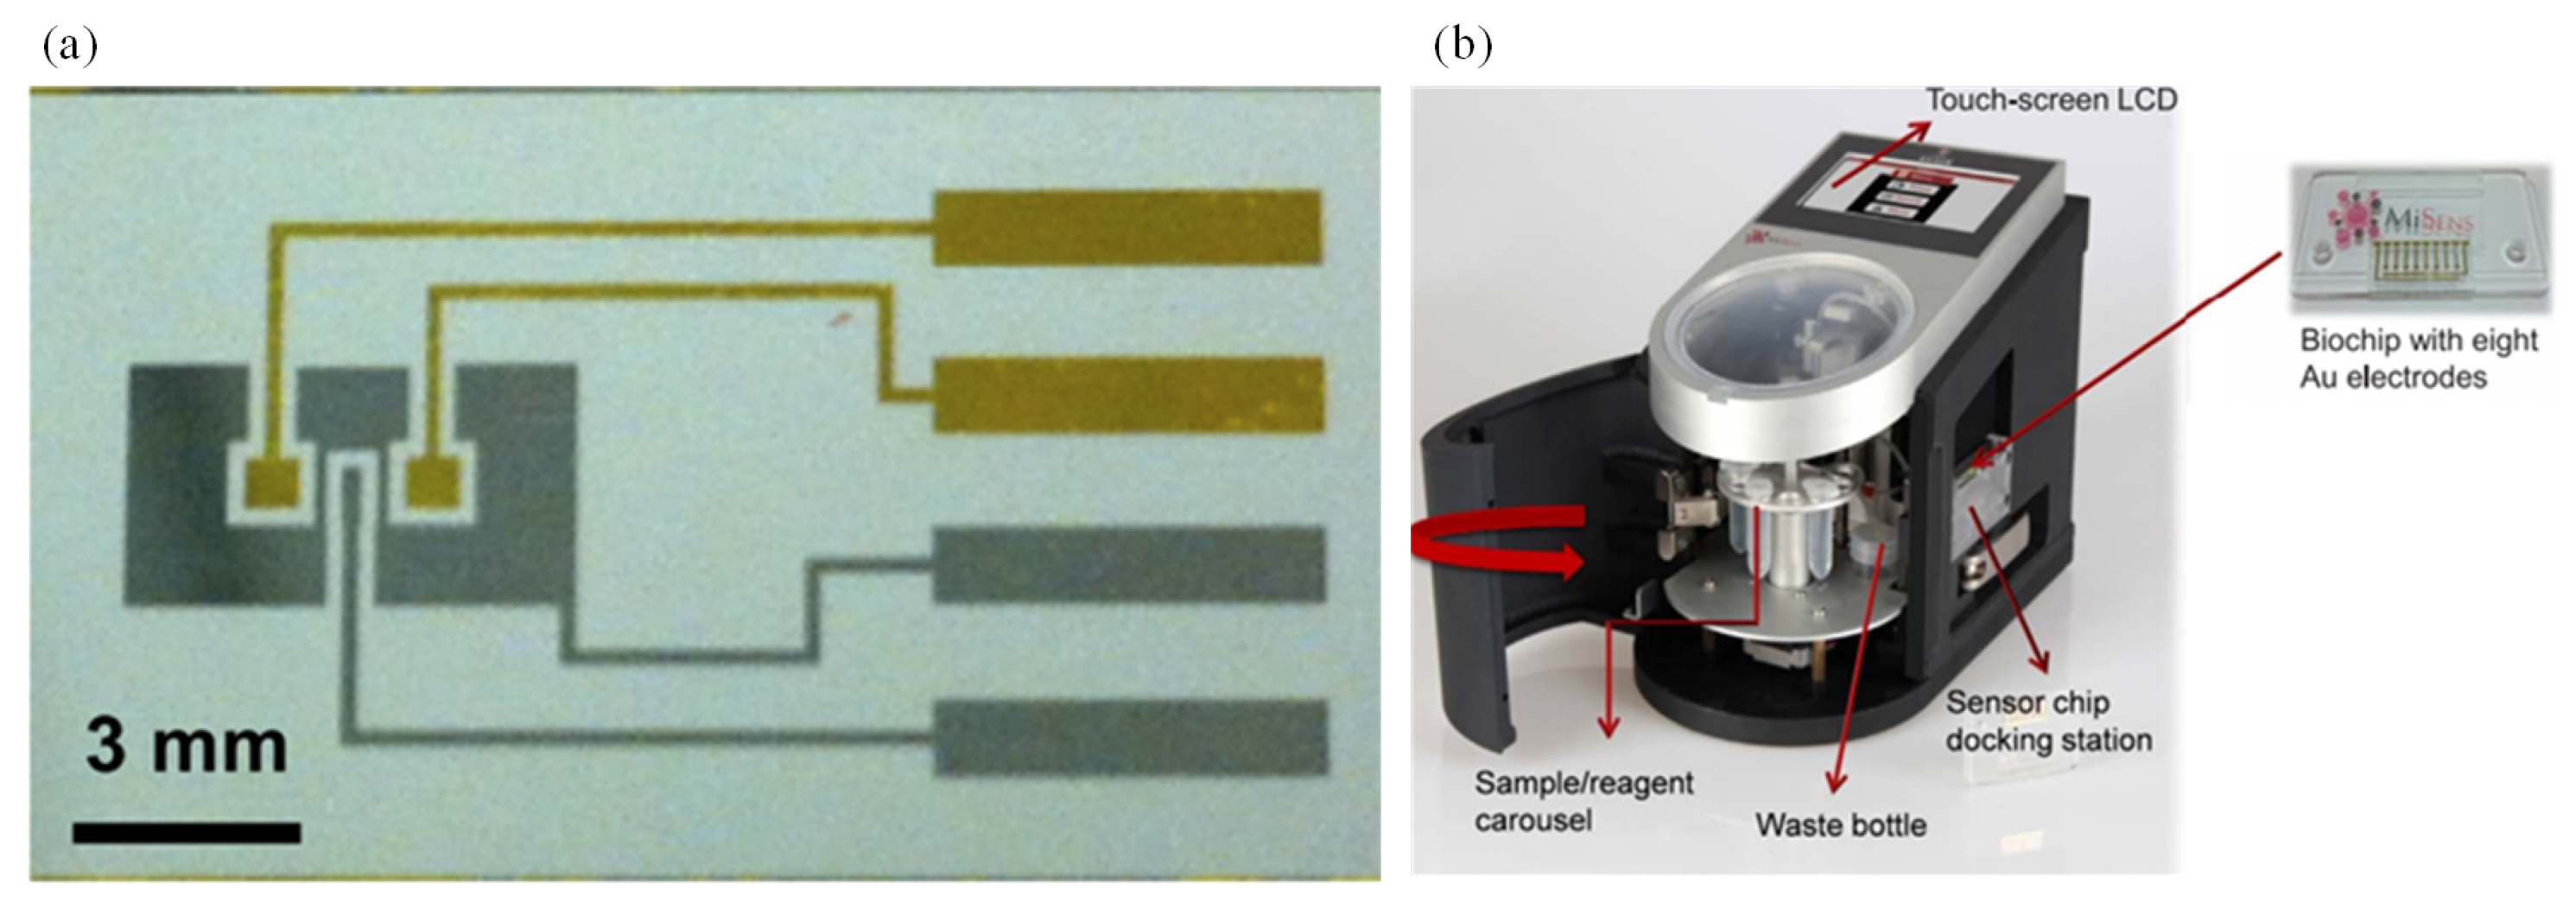
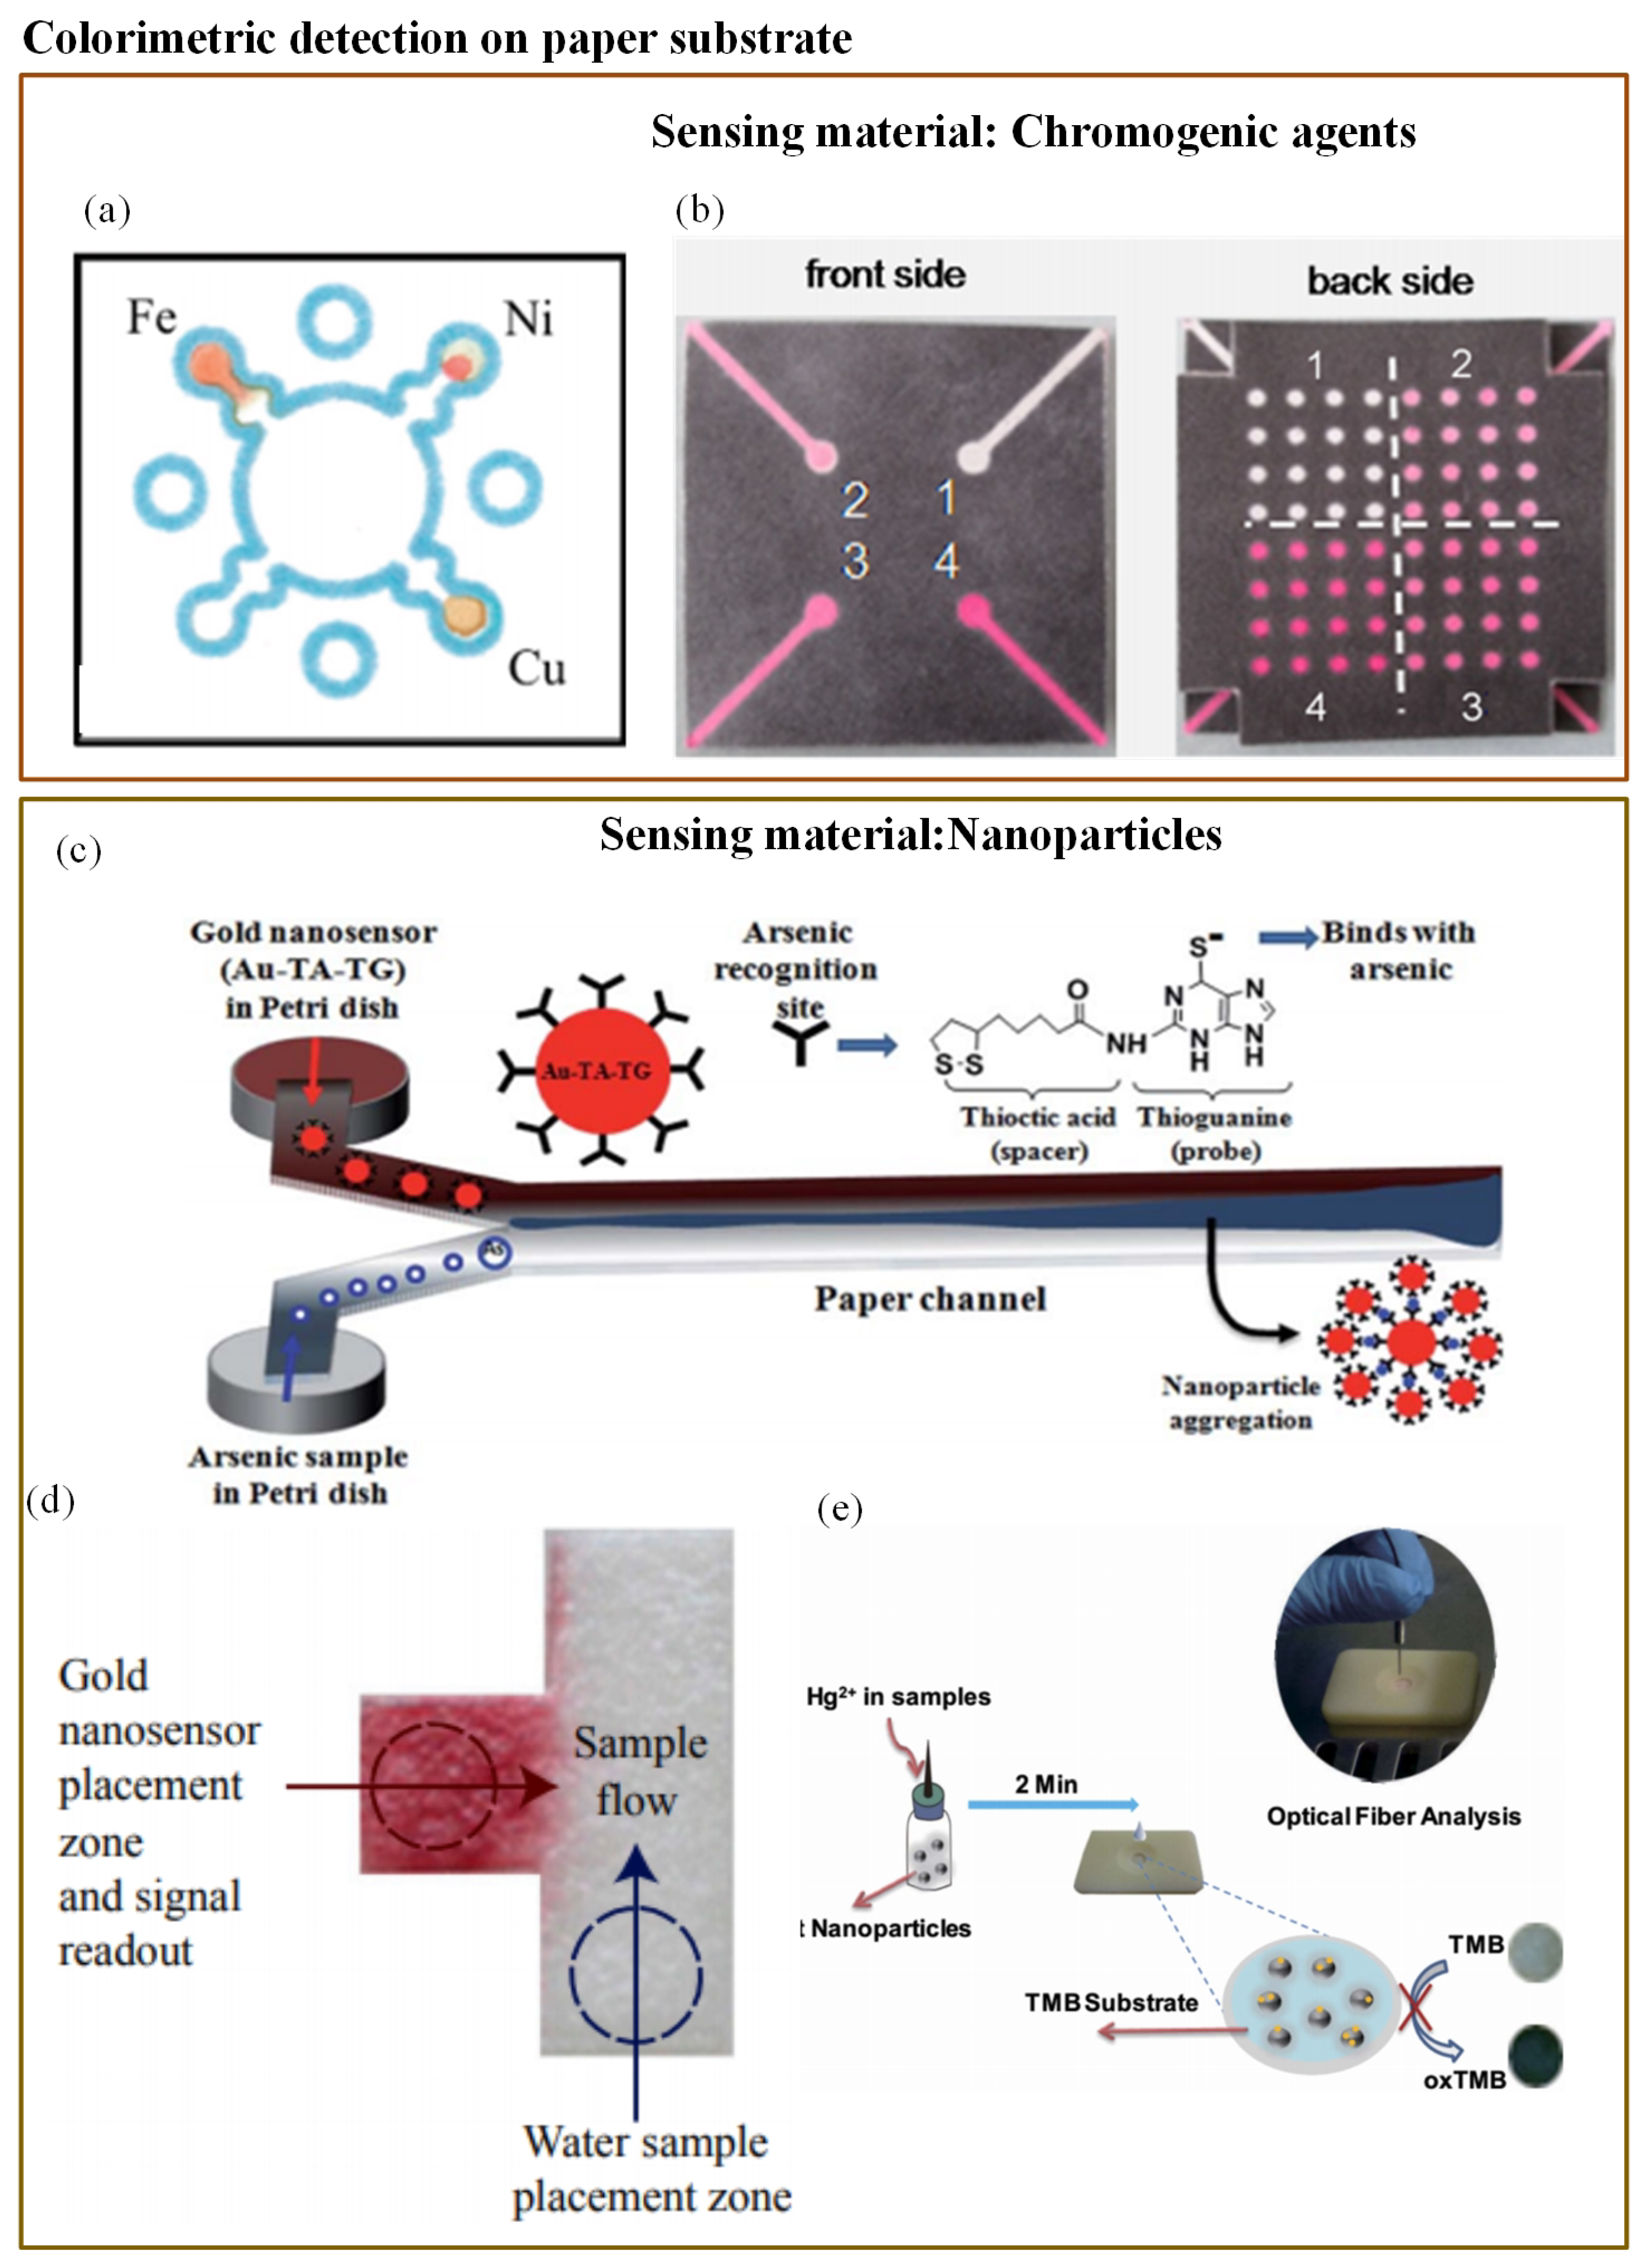
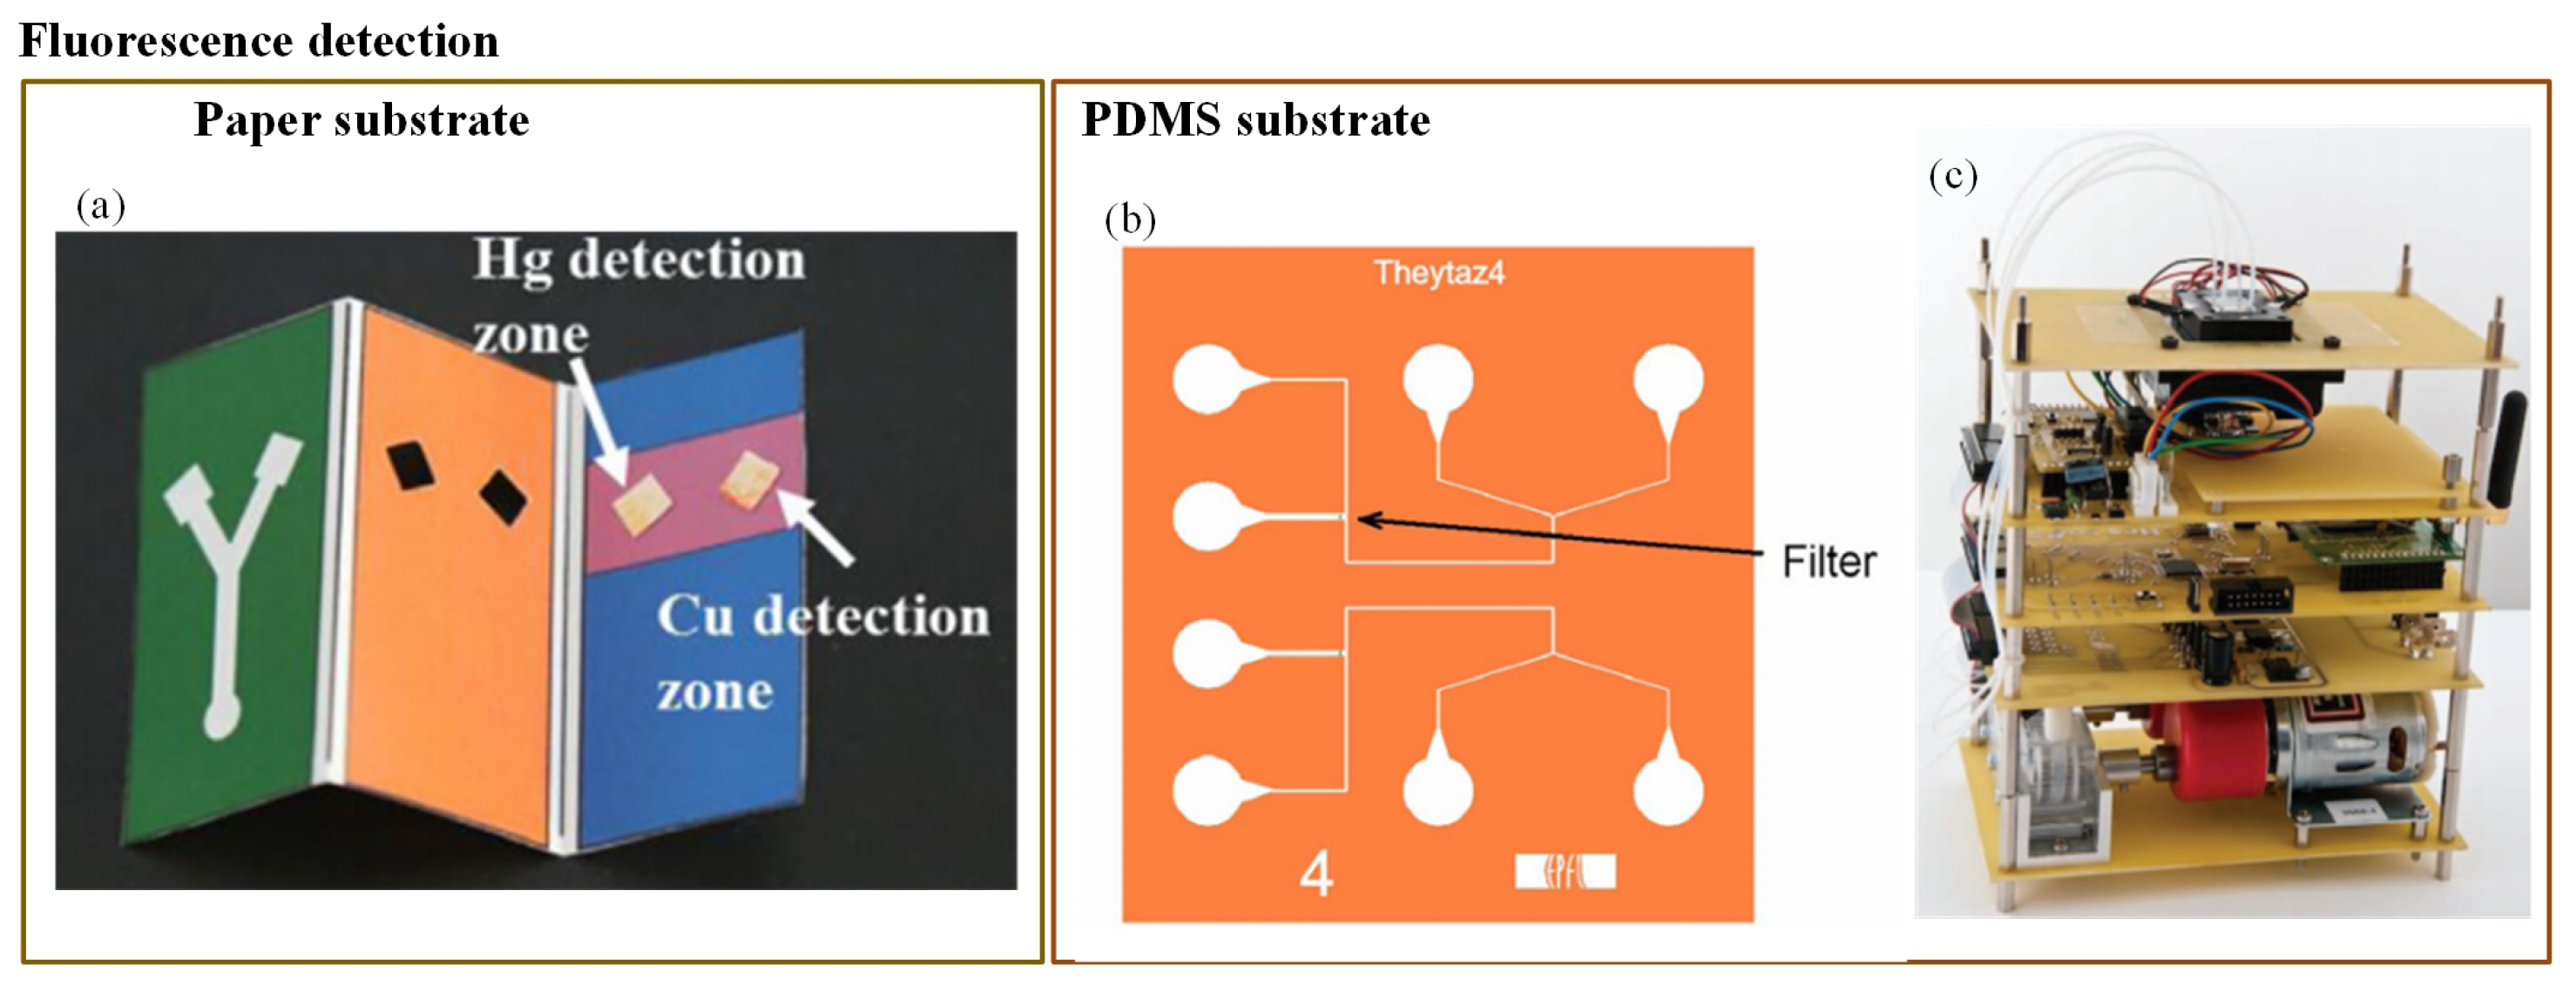
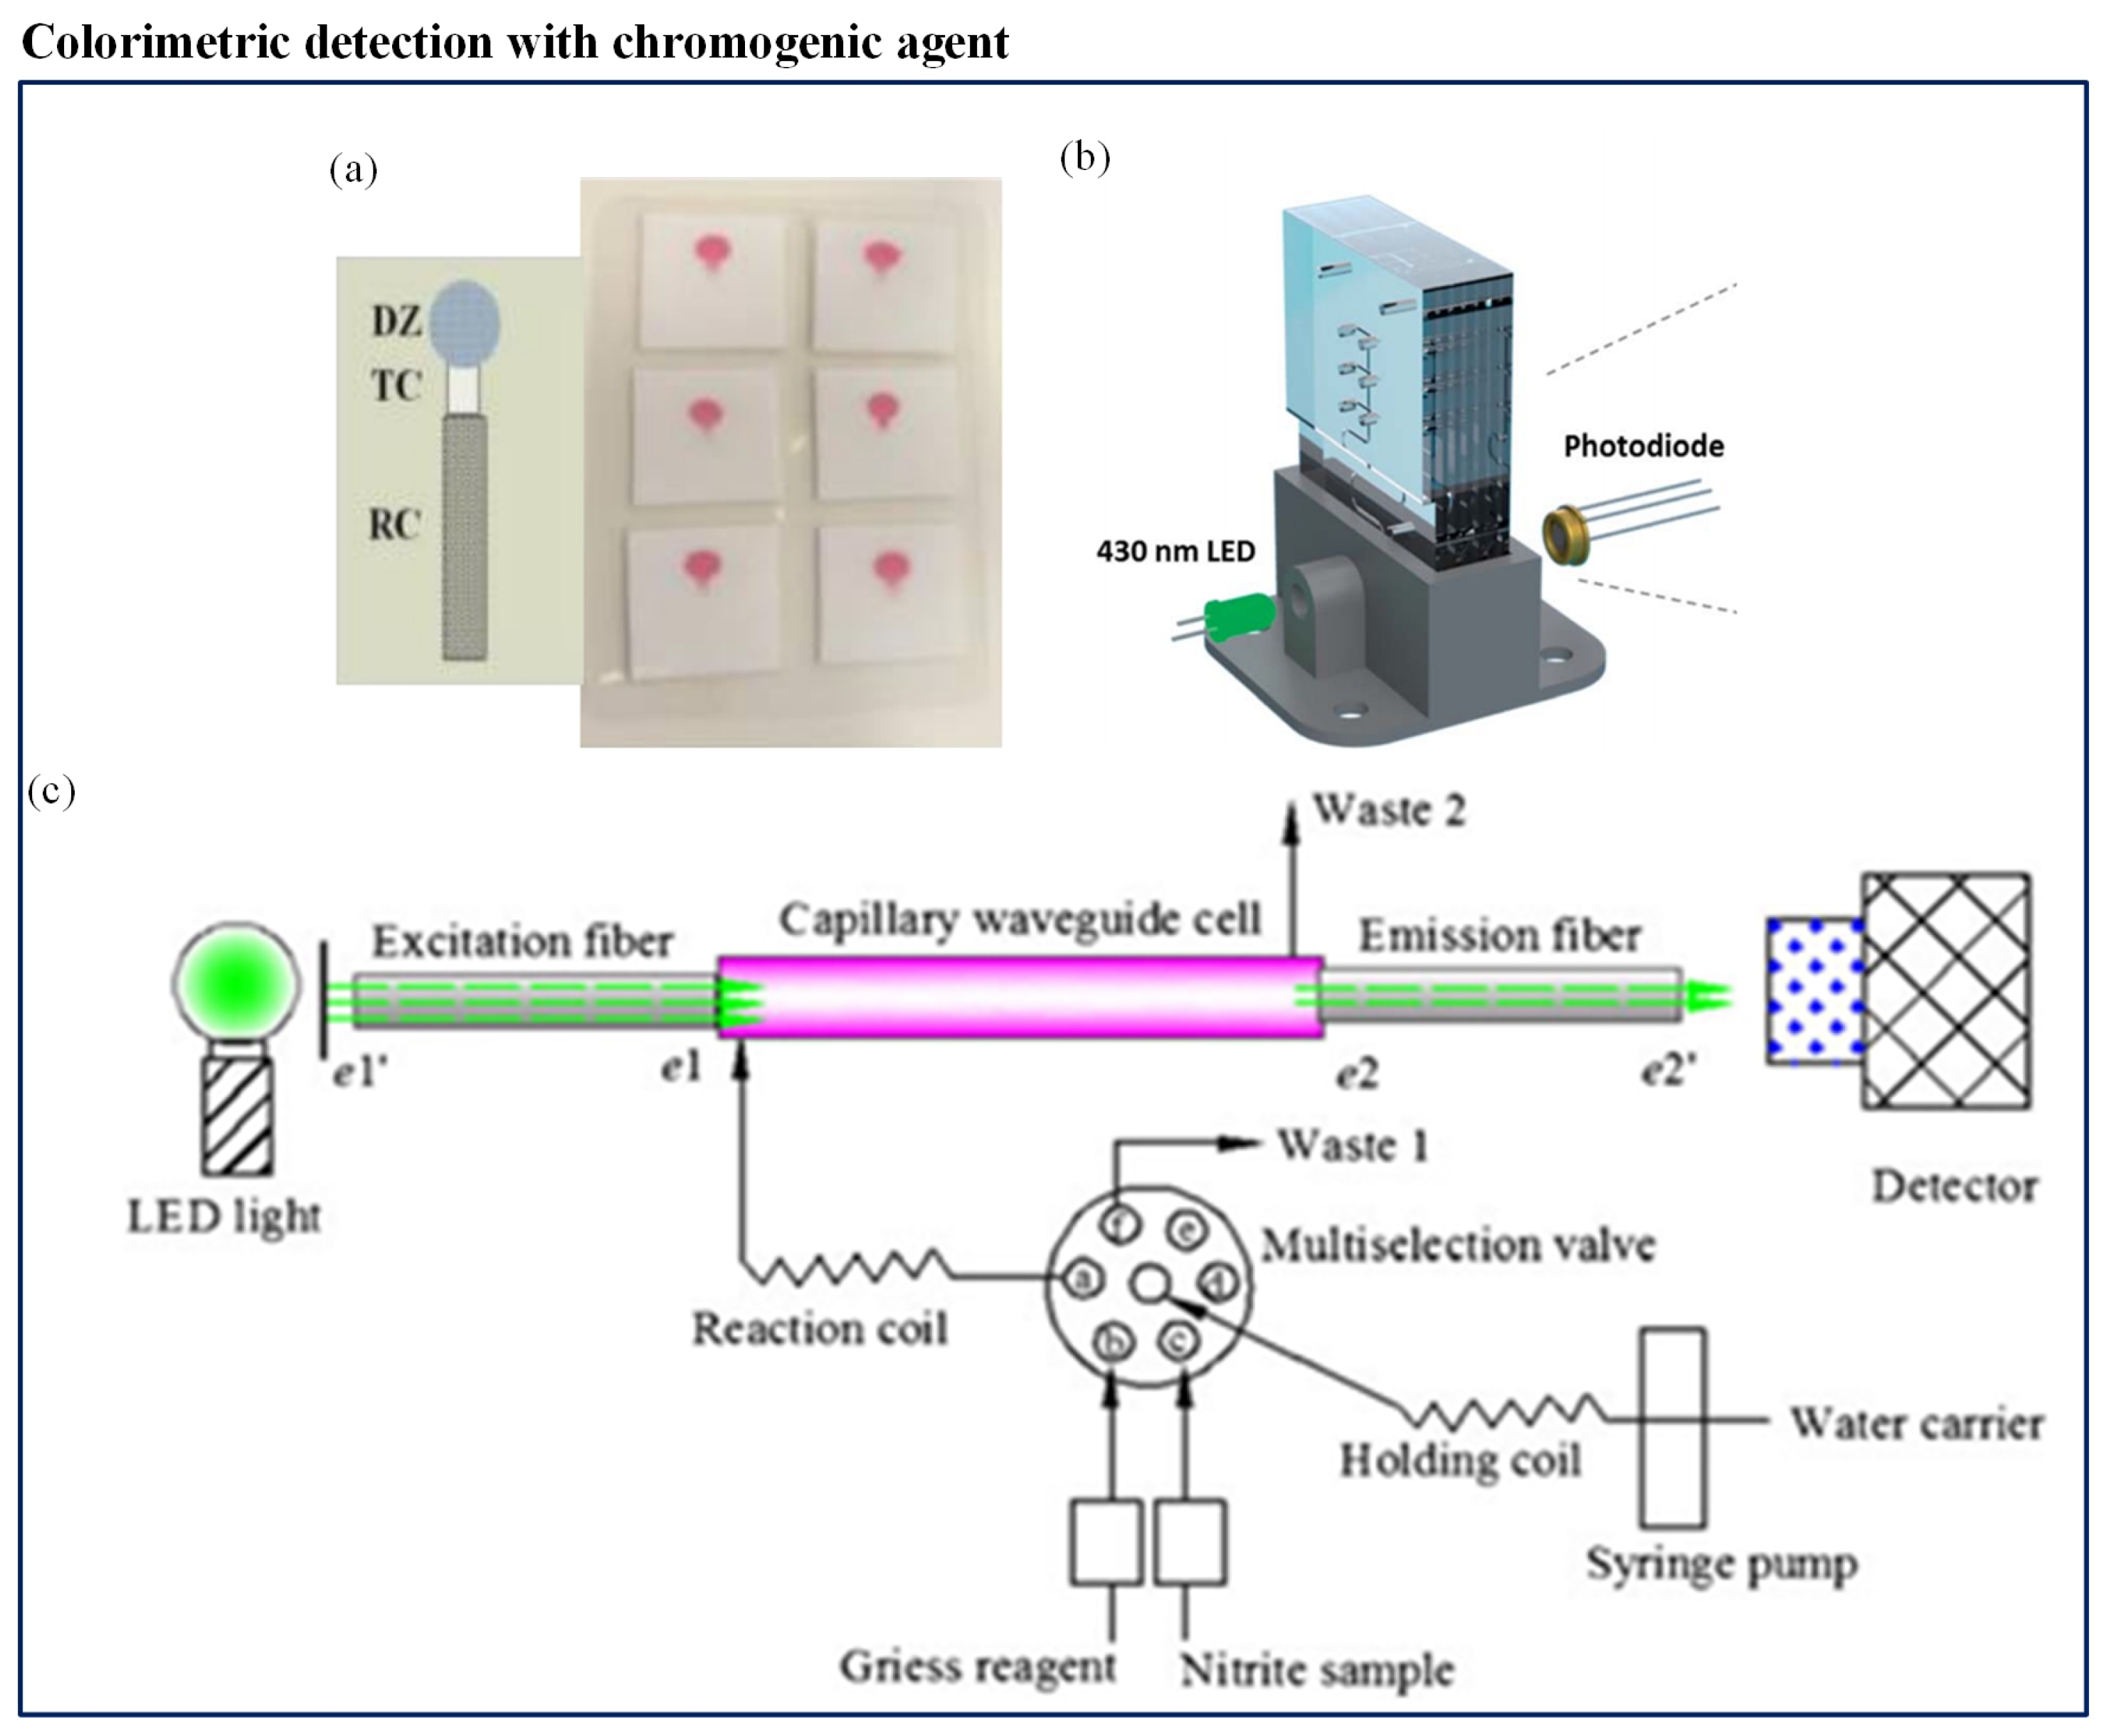
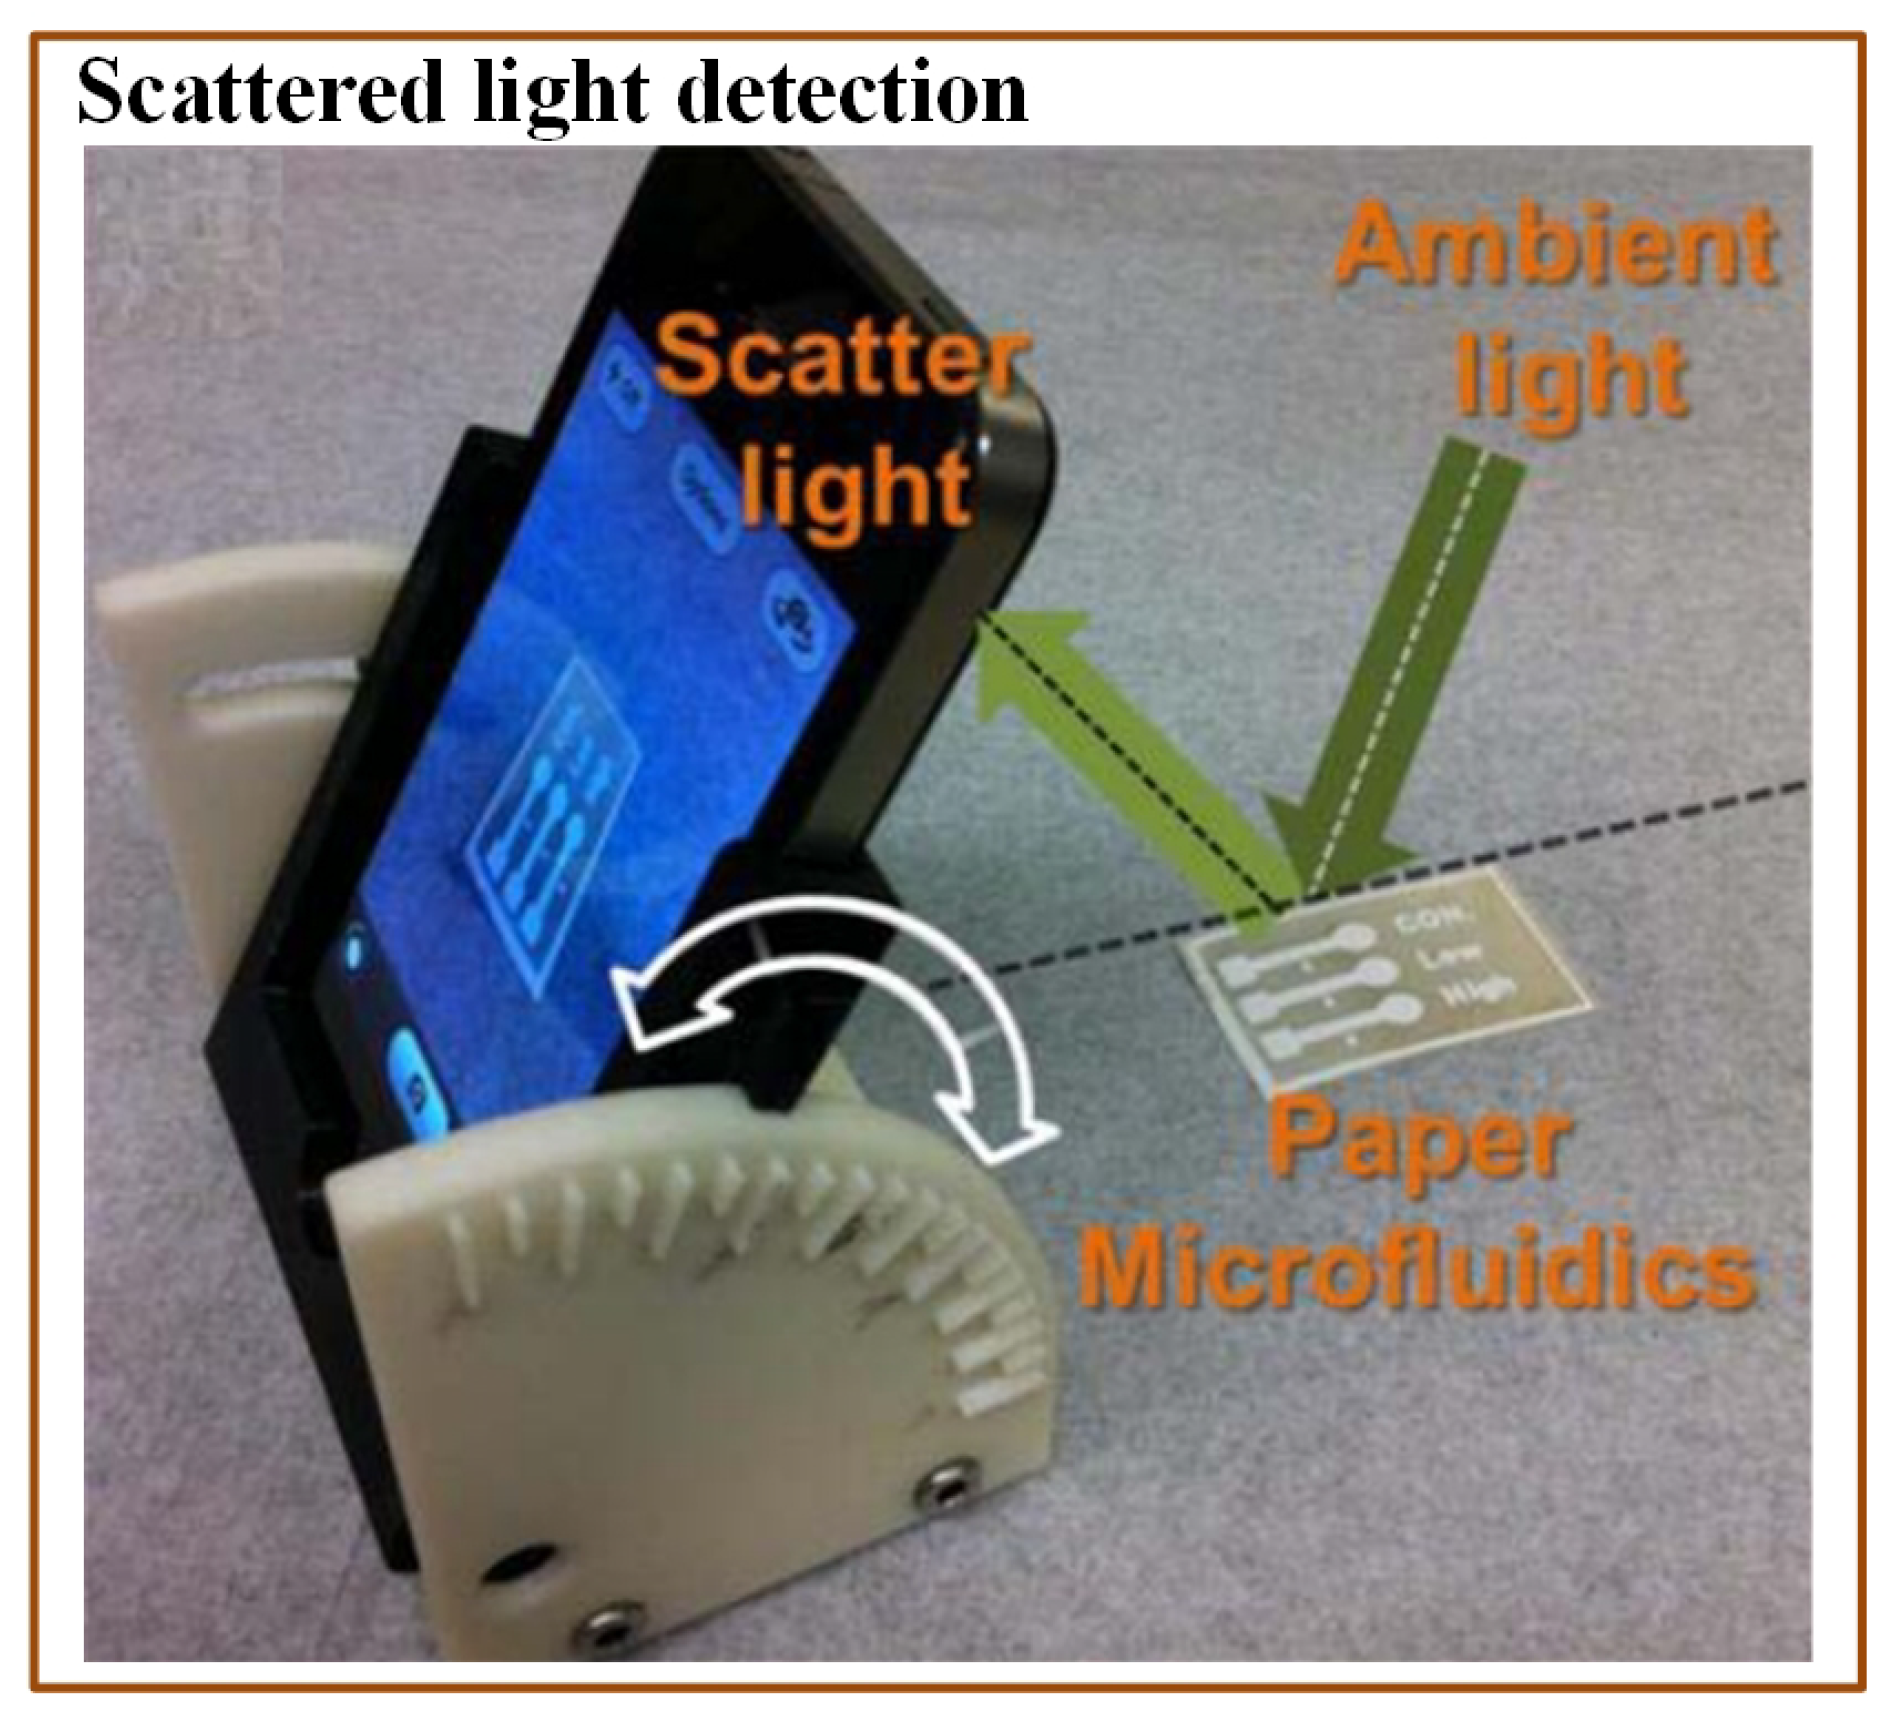
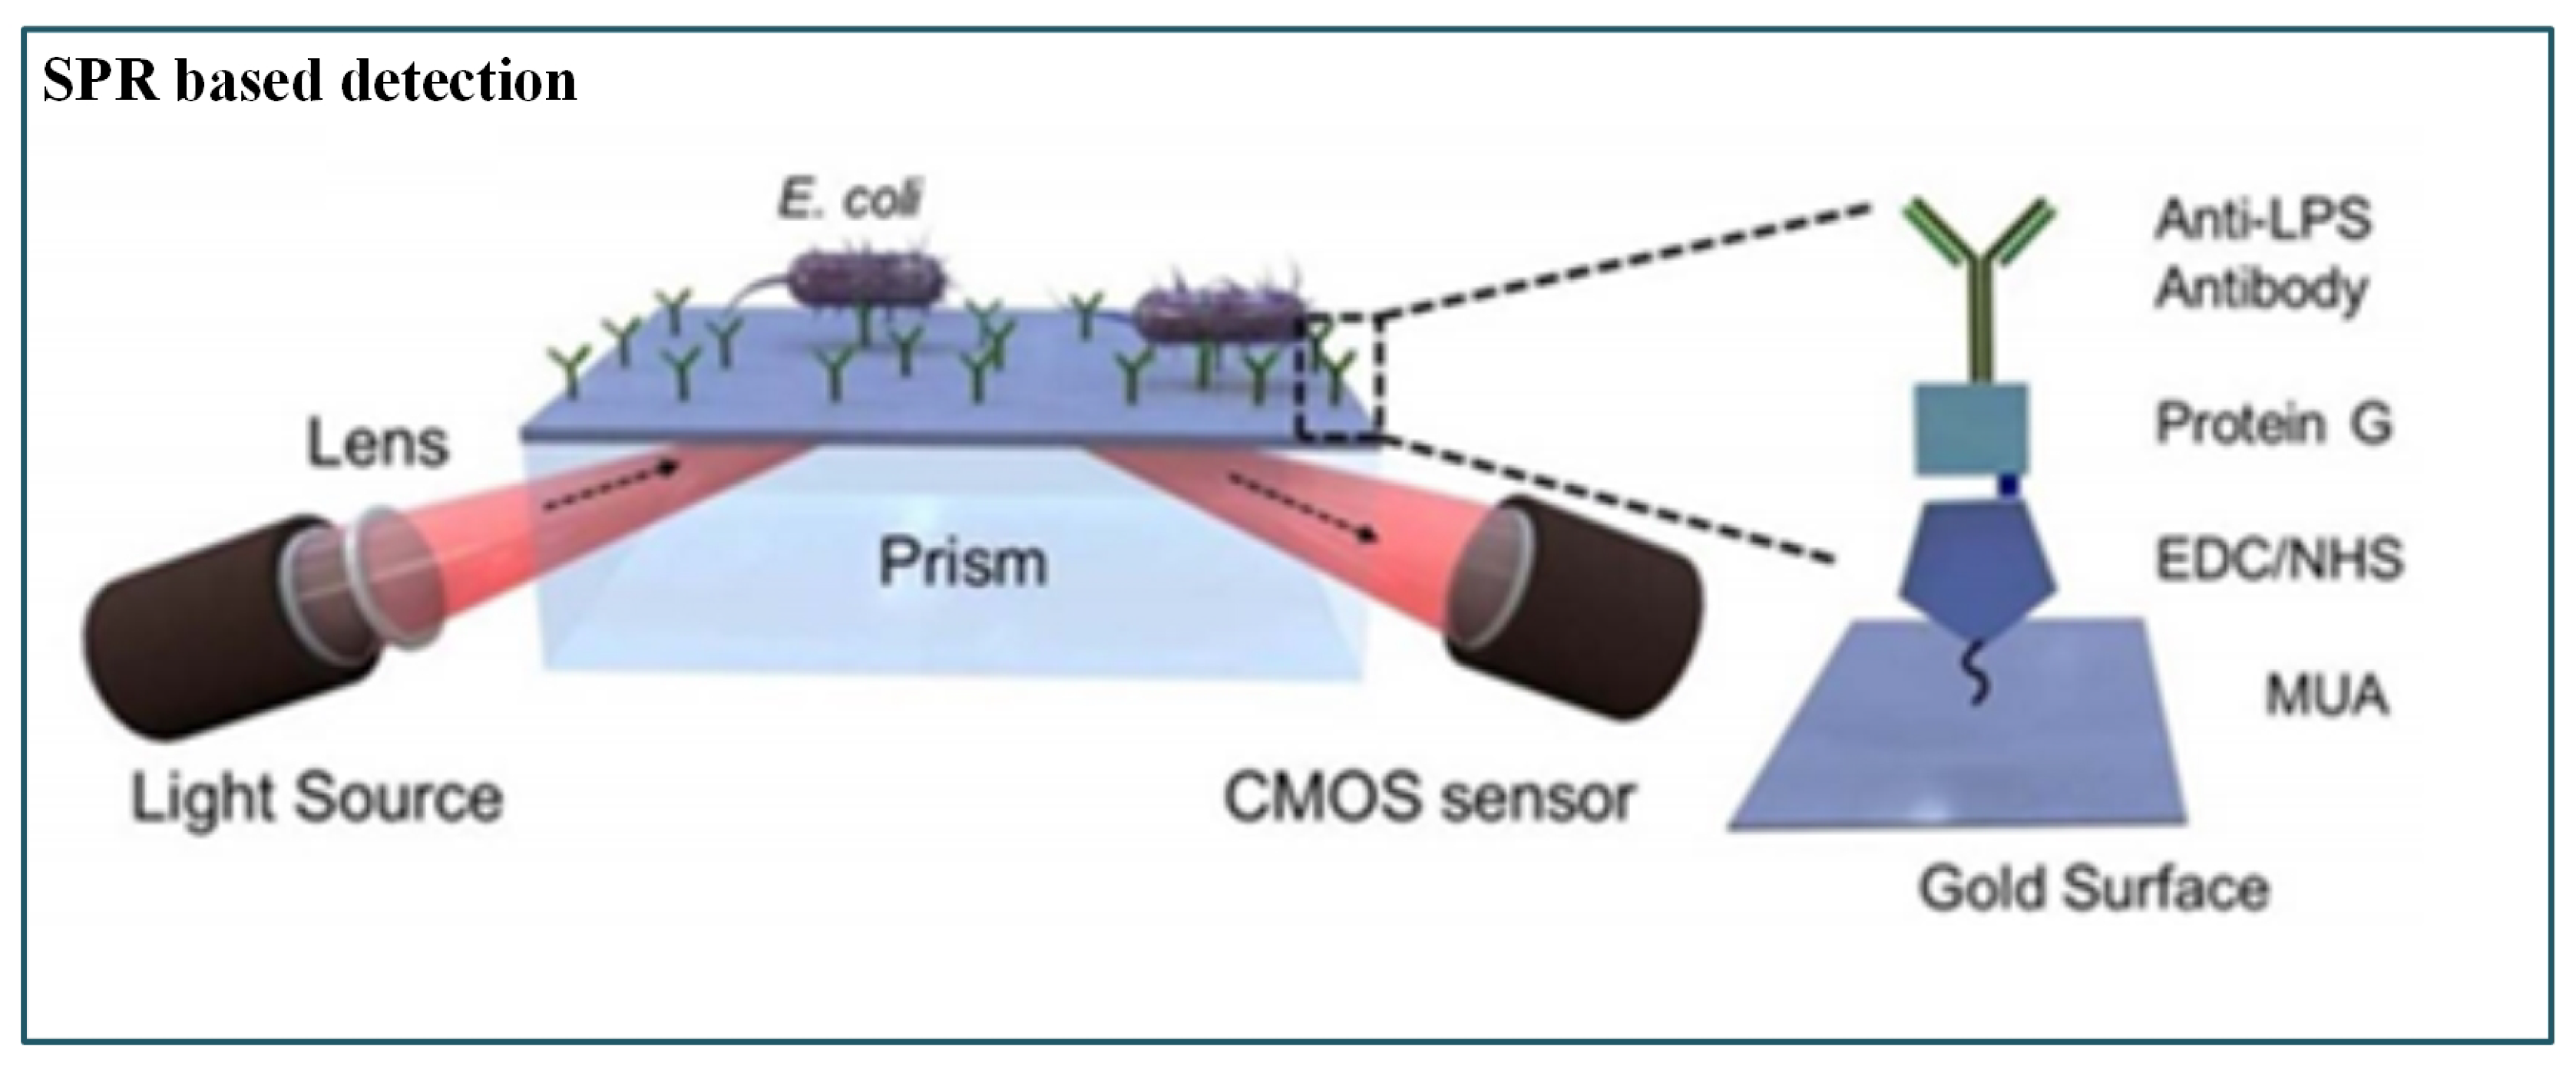
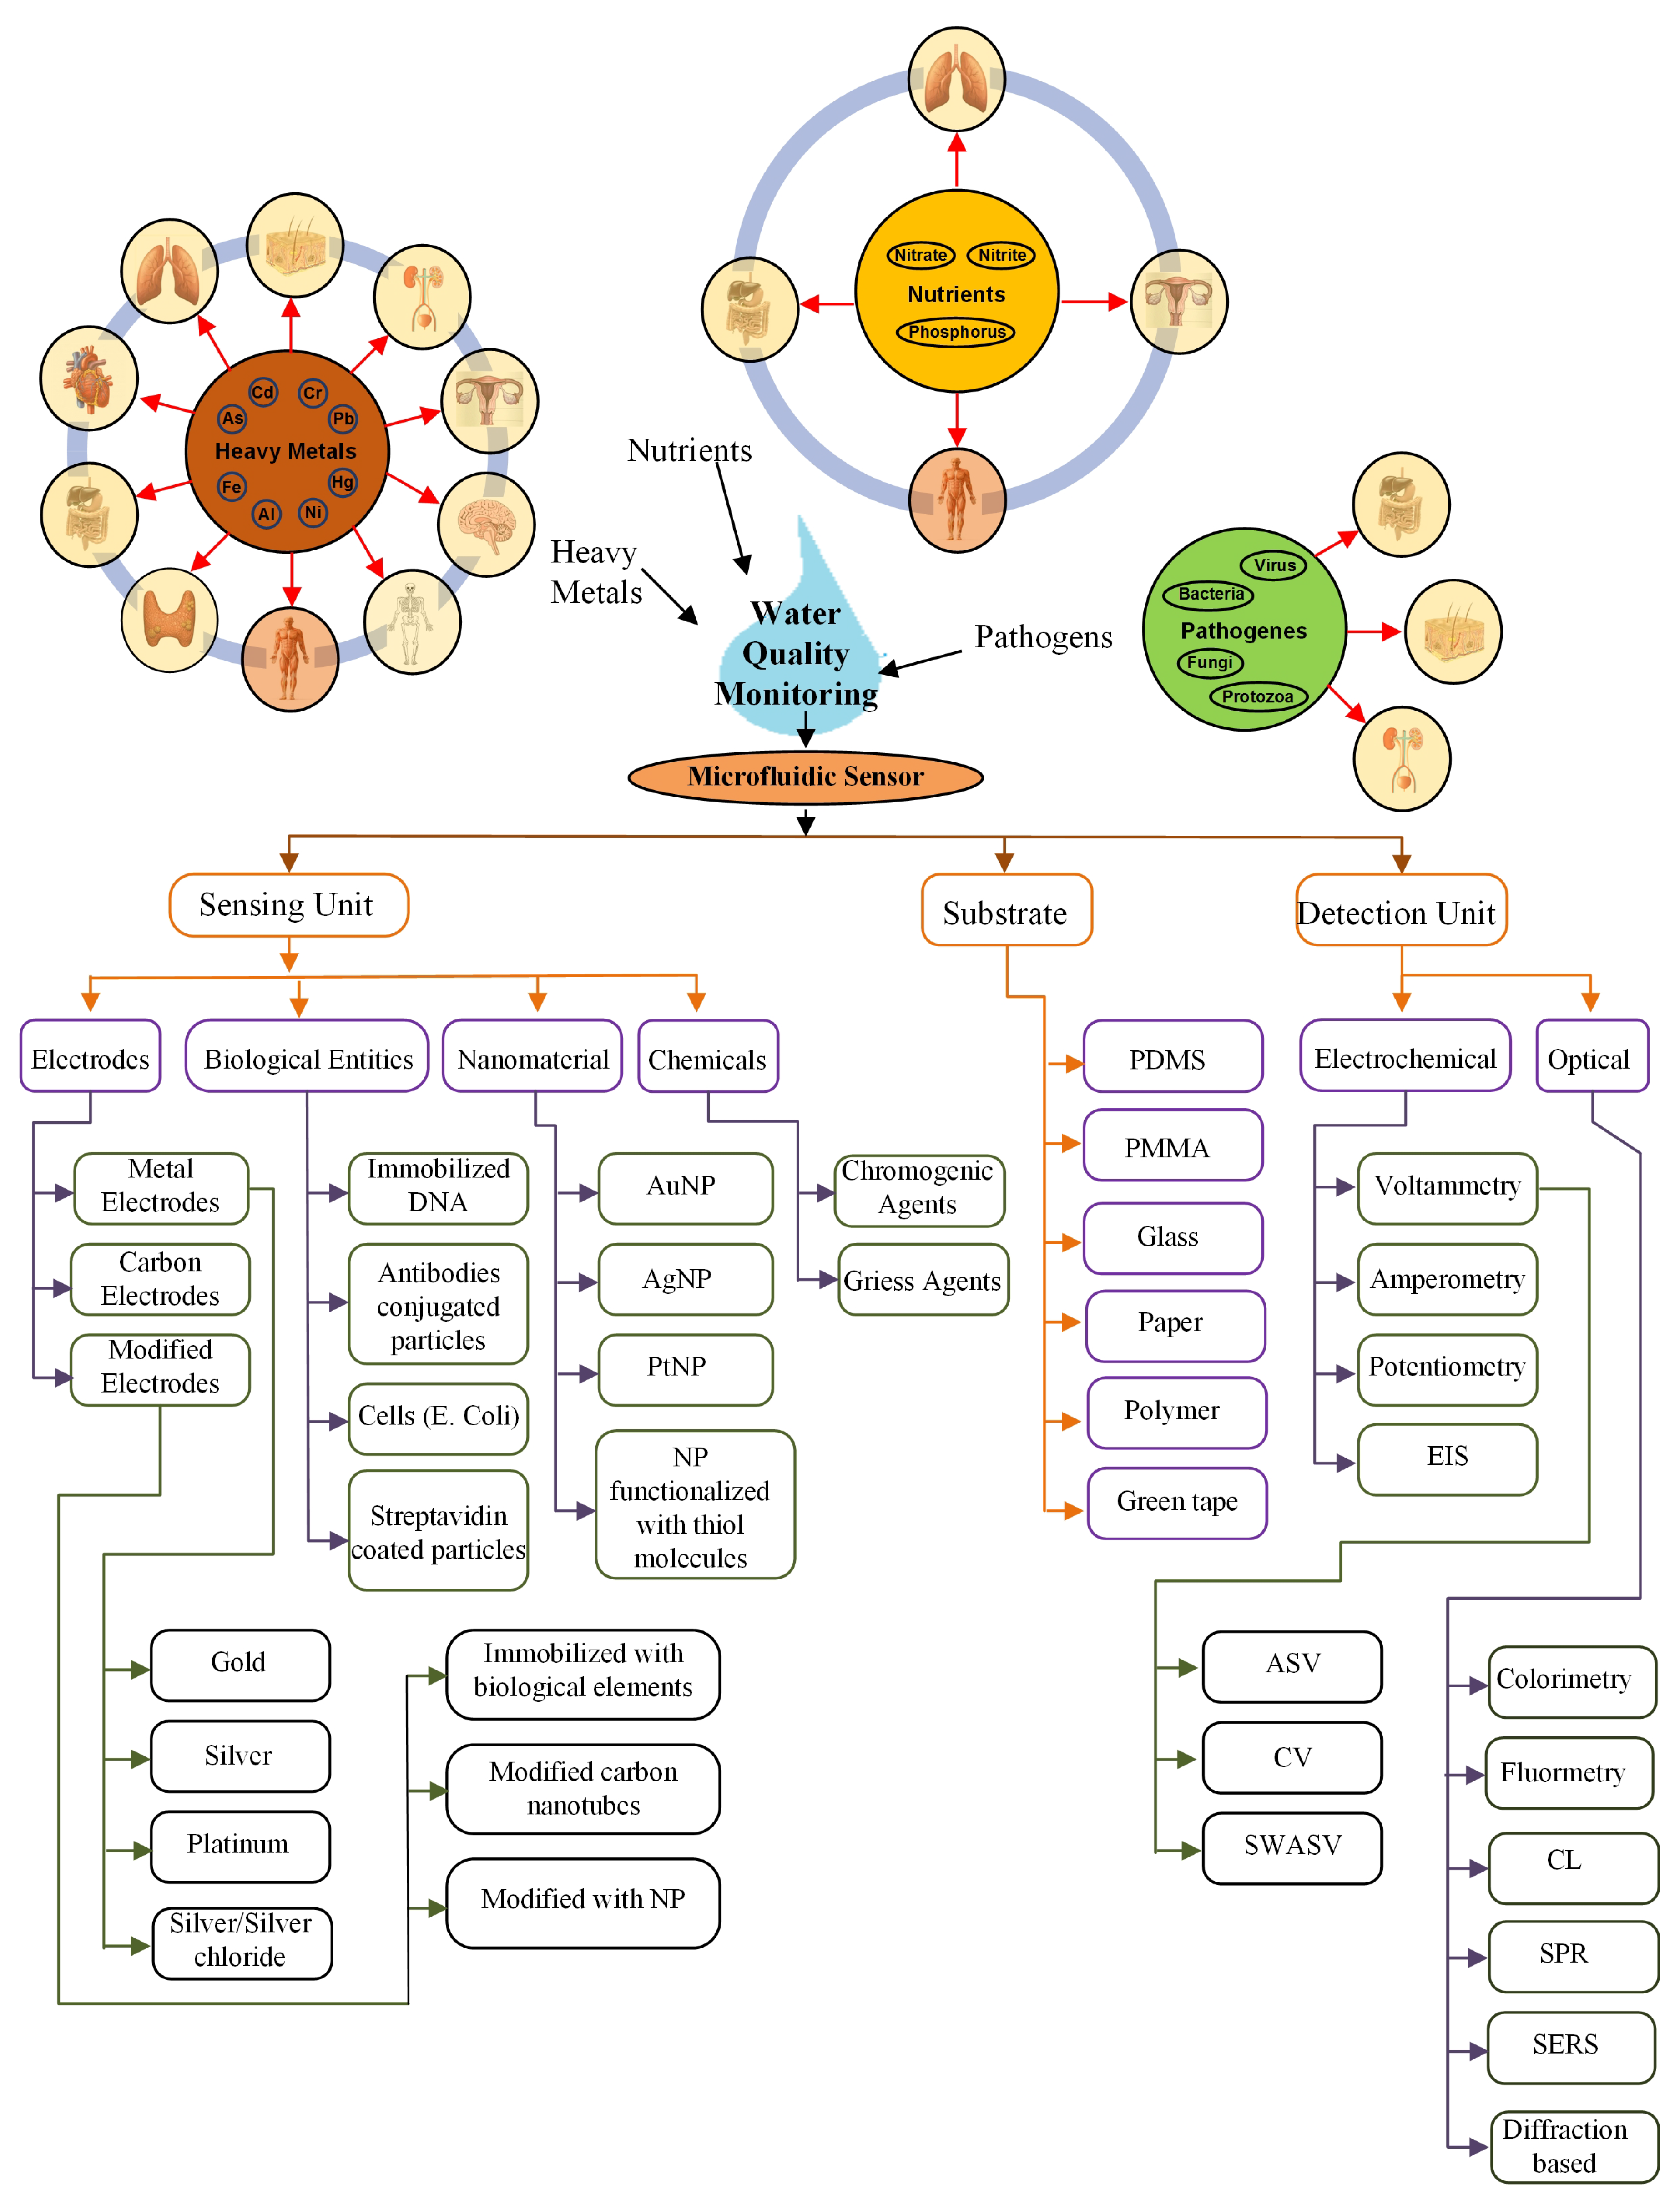
Table 1.
Contaminants and their potential health effects.
| Contaminant MCL (mg/L) | Cancer | Developmental/ Reproductive | Neurologic | Other | Sources | Ref. |
|---|---|---|---|---|---|---|
| Arsenic (0.01) | Skin, internal | SAB | Peripheral | Cardiovascular, immunologic, dermatologic | Geothermal activity, agricultural application, mining and smelting, industrial applications, industrial and electronics wastes | [54,55,56,57,58,59] |
| Lead (0.01) | Internal (OCC) | Birth defects | Autism, dyslexia, hyperactivity | Haemoprotein, weight loss, muscular weakness, paralysis, kidney damage | Natural deposits, mining, manufacturing process, and fossil fuel burning | [58,60,61] |
| Mercury (0.002) | Internal | Damage to fetus | Neurobehavioral disorders | Cardiovascular, thyroid, asthma, nausea and vomiting, diarrhea, skin rashes, cardiovascular | Natural deposits, land runoff agricultural and industrial applications, paper and pulp preservatives | [58,62,63,64] |
| Cadmium (0.004) | Pancreatic ovarian breast | Preterm birth, LBW | Neuron cell death | Leading to kidney disease, oxidative stress, osteoporosis, DNA damage | Natural deposits, mining, smelting, tobacco smoking, disposal of sewage | [58,65,66,67] |
| Chromium (0.05) | Lung and gastrointestinal | NA | NA | Nausea and vomiting, low blood sugar, damage to liver and kidney, dermatological | Natural deposits in soil and rocks, volcano irruption, coal and oil combustion, sewage sludge, cement production | [47,58,68,69] |
| Nickel (0.02) | Lung and nasal | NA | NA | Lung disease, skin diseases, liver toxicity | Volcanic eruption, forest fires, industrial and domestic wastewater, sewage sludge | [70,71] |
| Aluminum (0.05 to 0.2) | NA | NA | NA | Nausea and vomiting, mouth ulcers, diarrhea, skin rashes, arthritic pain | Industrial applications | [58,72,73] |
| Iron (0.3) | Lung | NA | NA | Gastrointestinal bleeding, vomiting and diarrhea | Natural deposits, corroded iron pipes | [58] |
| Nitrate (50) | Internal | SAB blue baby syndrome | NA | Gastric problems, Parkinson’s disease | Natural deposits, agricultural usage, animal waste, septic tanks, sewage sludge | [74,75] |
| Nitrite (0.2) | Blue baby syndrome | Gastric problems | Natural deposits, agricultural usage, animal waste, septic tanks | [76,77,78,79] | ||
| Pesticide- 1,3-dichloropropene (0.02) | Carcinogenic | LBW | NA tumors | Skin irritations | Agricultural applications | [74] |
| E. coli (less than 1/100 mL) | NA | NA | NA | Kidney failure, anemia, diarrhea, and other serious health problems | sewage leakage, animal waste | [80,81] |
| Rotavirus Zero | NA | NA | NA | Vomiting, dehydration, severe fatigue | disposal of untreated wastewater | [46] |
| Protozoa (Less than 1(oo) cyst/100L) | NA | NA | NA | Diarrhea, fatigue, nausea, abdominal cramps | Faecal contamination | [82] |
NA: Not Applicable; LBW: Low birth weight; MCL: Maximum contamination level; OCC: Occult cancer; SAB: Spontaneous abortion.
Table 2.
Comparison of electrochemical methods.
| Electrochemical Methods | |||||||
|---|---|---|---|---|---|---|---|
| Target Analyte | Detection Principle | Sensing Element | Sensing Material | Substrate | LOD | Real Sample | Ref. |
| Hg+2 | ASV | Electrode system | WE: Au | PDMS | 3 ppb | No | [101] |
| CE: Au | |||||||
| RE: Ag | |||||||
| Pb+2 and Hg+2 | CV | Electrode system | WE: carbon | Polyethylene terephthalate | 50 M each | No | [104] |
| CE: Ag | |||||||
| RE: Ag/Cl | |||||||
| Pb+2 | SWASV | Electrode system | WE: Ag | Polymer | 0.55 ppb | No | [99] |
| CE/QRE: Ag | |||||||
| Pb+2 and Hg+2 | SWASV | Electrode system | WE: carbon | Paper | 2.0 and 2.3 ppb, resp. water | Soda water and dirty ground | [111] |
| CE: carbon | |||||||
| RE: Ag pseudo | |||||||
| As | CV | Electrode system | WE: Ag | Plastic | 1 ppb | No | [102] |
| CE: Carbon | |||||||
| RE: Ag/AgCl | |||||||
| As | SWASV | Electrode system | WE: Au/SWCNT | PDMS | 4.5 ppb | No | [103] |
| CE and RE: SWCNT | |||||||
| As(III) | Amperometry | Bioreporter with electrode system | WE: Au | Plastic | 0.8 ppb | Tap and ground water | [112] |
| CE and RE: Ag and E. coli | |||||||
| Nitrate | CV | Electrode system | WE and RE: Ag | Glass | 25 ppb | [113] | |
| CE: Au | |||||||
| Nitrate | CV | Electrode system | WE: Ag | Glass | 0.2 ppm | Field and environmental water | [114] |
| CE: Au | |||||||
| RE: Ag | |||||||
| Nitrate and Potassium | Potentiometric | Electrode system | WE: Polymeric membrane | Green tapes | 9.56 and 0.81 mg/L, respectively | Water from recycling unit | [115] |
| RE: Ag/AgCl | |||||||
| Nitrate | Potentiometric | Electrode system with modified working electrode | WE: f-MWCNTs RE:Ag/AgCl | Lipophilic carbon nanotubes | −7 M | Desalinated seawater | [116] |
| Nitrate | EIS | Electrode system with modified working electrode | WE: NiR/nTiO2-GF CE: Au RE: Ag/AgCl | PDMS | 1 M | No | [117] |
| Nitrate and Nitrite | SWV | Electrode system with modified working electrode | WE: Cu/MWCNT/RGO/GCE CE: Pt-wire RE: Ag/AgCl | GCE | 20 and 30 nM, resp. | Tap and mineral water | [77] |
| E. coli | Voltammetry | Electrode system with modified working electrode | WE: immobilized DNA probe on Au CE and RE: Pt | Glass | 100 nM | No | [118] |
| Hepatitis B | ASV | Electrode system | WE: GCE CE: Pt wire RE: Ag/AgCl and DNA modified AgNP | Paper | 85 pM | No | [119] |
| E. coli | Amperometry | Immunoassays | Antibody | PMMA | 50 CFU/mL | Real sample | [120] |
| E.coli | Positive dielectrophoresis | Sensing and focusing electrode | Not specified | PDMS | 300 CFU/mL | No | [121] |
| E. coli | EIS | Interdigitated electrodes | Modified silicon sensor chip | Silicon and PDMS | 10 cells/mL | No | [122] |
| E. coli and S. aureus | EIS | Coplanar electrode | Au electrode | Silicon | 522 cells/mL | No | [123] |
| E. coli and Enterococci | Coulter principle | Microfluidic sensing chip | Resistance detection circuit | PDMS | Individual cell | Ballast water sample | [124] |
| Salmonella typhimurium | Impedance analyzer | Interdigitated electrodes | Au electrode with immobilized antibodies | PDMS | 3 CFU/mL | No | [125] |
LOD: Limit of detection; ASV: Anodic stripping voltammetry; PDMS: Polydimethylsiloxane; PMMA: Poly(methyl methacrylate); CV: Cyclic voltammetry; SWASV: Square-wave anodic stripping voltammetry; QRE: Quasi-reference electrode; WE:Working electrode; CE: Counter electrode; RE: Reference electrode; EIS: Electrochemical impedance spectroscopy; SWV: Square-wave voltammetry; RGO: Reduced graphene oxide; GCE: Glassy carbon electrode; -MWCNTs: Functionalised- multiwall carbon nanotube.
Table 3.
Commercially available electrochemical sensors.
| Target Analyte | Measurement Principle | Measuring Range | Features | Company | Ref. |
|---|---|---|---|---|---|
| Arsenic | Paper-based electrochemistry test strips | Not specified | Easy-to-use, quantitative, fast, low cost, nontoxic, disposable | Bio Nano Consulting | [126] |
| Copper, lead, and cadmium | Stripping square wave voltammetry with carbon–carbon–silver electrodes | Not specified | Easy-to-use, quantitative, simple, easy to use, cost-effective | PalmSense | [127] |
| Heavy metals | Potentiometric cell with carbon–bismuth electrodes | Not specified | Simultaneous analysis, portable systems, in situ results, low cost | GTQ (Chemical transducers research Group) | [128] |
| Nitrate | Potentiometric cell with liquid membrane ion selective electrodes | 0.6 to 200.0 ppm | Detection of nitrate–nitrogen in freshwater samples | MEDIRAY | [129] |
| Nitrate | Potentiometric cell with ion-selective electrodes | 0.5 to 450.0 mg/L | Simple to use, callibration-free operation | Xylem | [130] |
| Nitrate | Potentiometric cell with ion-selective electrodes | 1 to 14,000 mg/L | Easy to use, portable | Vernier | [131] |
| Nitrate | Potentiometric cell with ion-selective electrodes | 0.62 to 6200 ppm | Replaceable sensing modules, durable polyetherimide (PEI) body, BNC(Bayonet Neill–Concelman) connection | HANNA instruments | [132] |
Table 4.
Comparison of optical methods.
| Optical Methods | |||||||
|---|---|---|---|---|---|---|---|
| Target Analyte | Detection Principle | Sensing Element | Sensing Material | Substrate | LOD | Real Sample | Ref. |
| Cu(II) Ni(II) Cd(II) Cr(VI) | Colorimetric | Chemical compound | Sodium diethyldithiocarbamate Dimethylglyoxime Cadion Diphenylcarbazide | Paper | 0.29 ppm 0.33 ppm 0.19 ppm 0.35 ppm | Distilled water Reservoir water Beach water | [138] |
| Hg2+ | Colorimetric | Nanoparticles | Platinum nanoparticles and 3,3,5,5-tetramethylbenzidine | Paper | 0.01 uM | Pond and tap water | [139] |
| Pb2+ | Colorimetric | Functionalized nanoparticles | AuNP functionalized with 11-mercaptoundecanoic acid | PDMS | 10 M | No | [140] |
| As(III) | Colorimetric | Functionalized nanoparticles | AuNP functionalized with -lipoic acid and thioguanine | Paper | 1.0 ppb | No | [141] |
| As | Colorimetric | Functionalized nanoparticles | AuNP functionalized with -lipoic acid | Paper | Quality analysis | Bangladesh groundwater | [142] |
| As(III) | Colorimetric | Hach®EZ Arsenic Test Kit | Standard Gutzeit reaction reagents | Plastic | 3 g/L | No | [143] |
| Cu2+ and Hg2+ | Fluorescence | Quantum dots | CdTe quantum dots | Paper | 0.035 g/L 0.056 g/L | Lake and sea water | [144] |
| As(III) | Fluorescence | Bioreporter cell | E. coli | PDMS | 10 g/L | Tap water | [145] |
| As(III) | Fluorescence | Bioreporter cell | E. coli | PDMS | 50 g/L | No | [146] |
| As(III) | SERS | Functionalized nanoparticles | AgNP functionalized with glutathione/4-mercaptopyridine | PDMS | 0.67 ppb | Tap water Mineral water | [147] |
| As(IV) | CL | Chemical compound | Luminol and Vanadomolybdoarsenate heteropoly acid | PDMS | −8 M | Tap water | [148] |
| Nitrate | Colorimetric | Chromogenic agent | Chromotropic acid and Sulphuric acid | PDMS | 0.70 mg/L | Drinking water, freshwater, wastewater, and sea water | [149] |
| Nitrate | Colorimetric | Chromogenic agent | Griess reagent | Fiber | 7 g/L | Lake water Tap water | [150] |
| Nitrate | Colorimetric | Chromogenic agent | Griess reagent | PMMA | 0.0782 ppm | Tap water Bottled drinking water Home-filtered water | [151] |
| Nitrite and Nitrate | Colorimetric | Chromogenic agent | Griess reagent Zinc microparticles | Paper | 1.0 M 19 M | Tap water and synthetic water | [152] |
| Nitrite and Nitrate | Colorimetric | Chromogenic agent | Griess reagent Imidazole buffer | PMMA | 0.02 M 0.025 M | River water | [153] |
| Nitrite and Nitrate | Colorimetric | Chromogenic agent | Griess reagent Copper-activated cadmium column | PMMA | 20 nM | Sea water | [154] |
| E. coli | PCR | Biological elements | Polyclonal antibodies | PMMA | 6 CFU | Recreational lake water, waste water | [155] |
| E. coli | Fluorescence | Biological elements | Magnetic beads conjugated with antibodies | PDMS | ?? | Drinking water | [156] |
| E. coli | Fluorescence | Biological elements | Streptavidin-coated magnetic markers | PDMS | ?? | [157] | |
| E. coli | Light scattering | Biological elements | Antibody-conjugated beads | Paper | 10 CFU/mL | Field water | [158] |
| E. coli S. aureus | SPR | Biological elements | Au surface modified with MUA, EDC/NHS, Protein G and anti-LPS antibody | PMMA | ?? | No | [159] |
| Roravirus | Fluorescence | Graphene oxide | Glass | 105 PFU/mL | No | [160] | |
| Antimicrobial- resistant bacteria | Colorimetric | Chromogenic agent | Nitrocefin | Paper | 10 mU/mL | Sewage water, river water | [161] |
CL: Chemiluminescence; ??: Not specified; SPR: Surface plasmon resonance; MUA: 11-mercaptoundecanoic acid; LPS: Lipopolysaccharide; EDC/NHS: Ethyl-3-(3-dimethy-laminopropyl) carbodiimide hydrochloride/N-Hydrosuccinimide.
Table 5.
Commercially available optical sensors.
| Target Analyte | Measurement Principle | Measuring Range | Features | Company | Ref. |
|---|---|---|---|---|---|
| Arsenic | Kit-based colorimetric | 0 to 500 ppb | Easy-to-use, effective way | Hach | [162] |
| Arsenic | Kit-based colorimetric | 0 to 500 ppb | Result in 12 min, 100 tests per kit | FilterWater.com | [163] |
| Arsenic | Kit-based digital colorimetric | 2 to 100 ppb | Reaction time 20 mins | Palintest Water analysis technology | [164] |
| Arsenic | Atomic fluorescence spectrometry | 10 ppt | Easy-to-learn and easy-to-use system, can be automated | P S Analytical | [165] |
| Lead, thallium, mercury, cadmium iron, nickel, and zinc | Color-based visual detection | Not specified | Simple to use, results in 15 to 60 s, low-cost analysis | ChemSee | [166] |
| Nitrate | Portable photometer | 0.0 to 30.0 ppm | Easy to use, not suitable for seawater | HANNA instruments | [167] |
| Nitrate | UV absorbance with | 0 to 50 mg/L | Modern communication systems allow data to be accessed in real-time | HydroMetrics | [168] |
| Nitrate | UV absorbance with | 0.05 to 200 mg/L | Access with web browser, optional anti-fouling wiper, flexible sensor options | OTT ecoN | [169] |
| C. jejuni, C. coli, C. upsaliensis, and C. lari | PCR-campylobacter detection kit | Not specified | Specific, rapid, and reliable detection; amplification limit of one copy per reaction; ready-to-use kit | BioVision | [170] |
Table 6.
Advantages and disadvantages of detection methods.
| Method | Advantages | Disadvantages |
|---|---|---|
| Electrochemical | High selectivity High selectivity Miniaturized electrodes makes the system portable Possibility of mass production | Tedious fabrication process of electrode |
| Colorimetric | Simple analysis Provides qualitative results Quick response | Provides relative output |
| CL | High sensitivity Does not require external light source Portable | Limited number of CL reagents available |
| Fluorescence | High sensitivity High selsectivity Portable | Limited to analytes that possess inherent fluorescence External light source necessary |
| SPR | High sensitivity High selsectivity Label-free detection | Portability may be an issue |
| SERS | High sensitivity High selsectivity | Highly sensitive to environmental changes |
| Optical diffraction | High sensitivity High selsectivity ortable | Occasionally, signal enhancement by sequential amplification is necessary |
© 2019 by the authors. Licensee MDPI, Basel, Switzerland. This article is an open access article distributed under the terms and conditions of the Creative Commons Attribution (CC BY) license (http://creativecommons.org/licenses/by/4.0/).
Share and Cite
MDPI and ACS Style
Jaywant, S.A.; Arif, K.M. A Comprehensive Review of Microfluidic Water Quality Monitoring Sensors. Sensors 2019, 19, 4781. https://doi.org/10.3390/s19214781
AMA Style
Jaywant SA, Arif KM. A Comprehensive Review of Microfluidic Water Quality Monitoring Sensors. Sensors. 2019; 19(21):4781. https://doi.org/10.3390/s19214781
Chicago/Turabian StyleJaywant, Swapna A., and Khalid Mahmood Arif. 2019. "A Comprehensive Review of Microfluidic Water Quality Monitoring Sensors" Sensors 19, no. 21: 4781. https://doi.org/10.3390/s19214781
Note that from the first issue of 2016, this journal uses article numbers instead of page numbers. See further details here.