Discriminating between Different Heavy Metal Ions with Fullerene-Derived Nanoparticles

 , ,
, ,  , , , , and
Abstract
:1. Introduction
2. Materials and Methods
2.1. Materials
2.2. Synthesis of UFQDs
2.3. Instrumentation and Procedure for Detection of Heavy Metal Ions
3. Results and Discussion
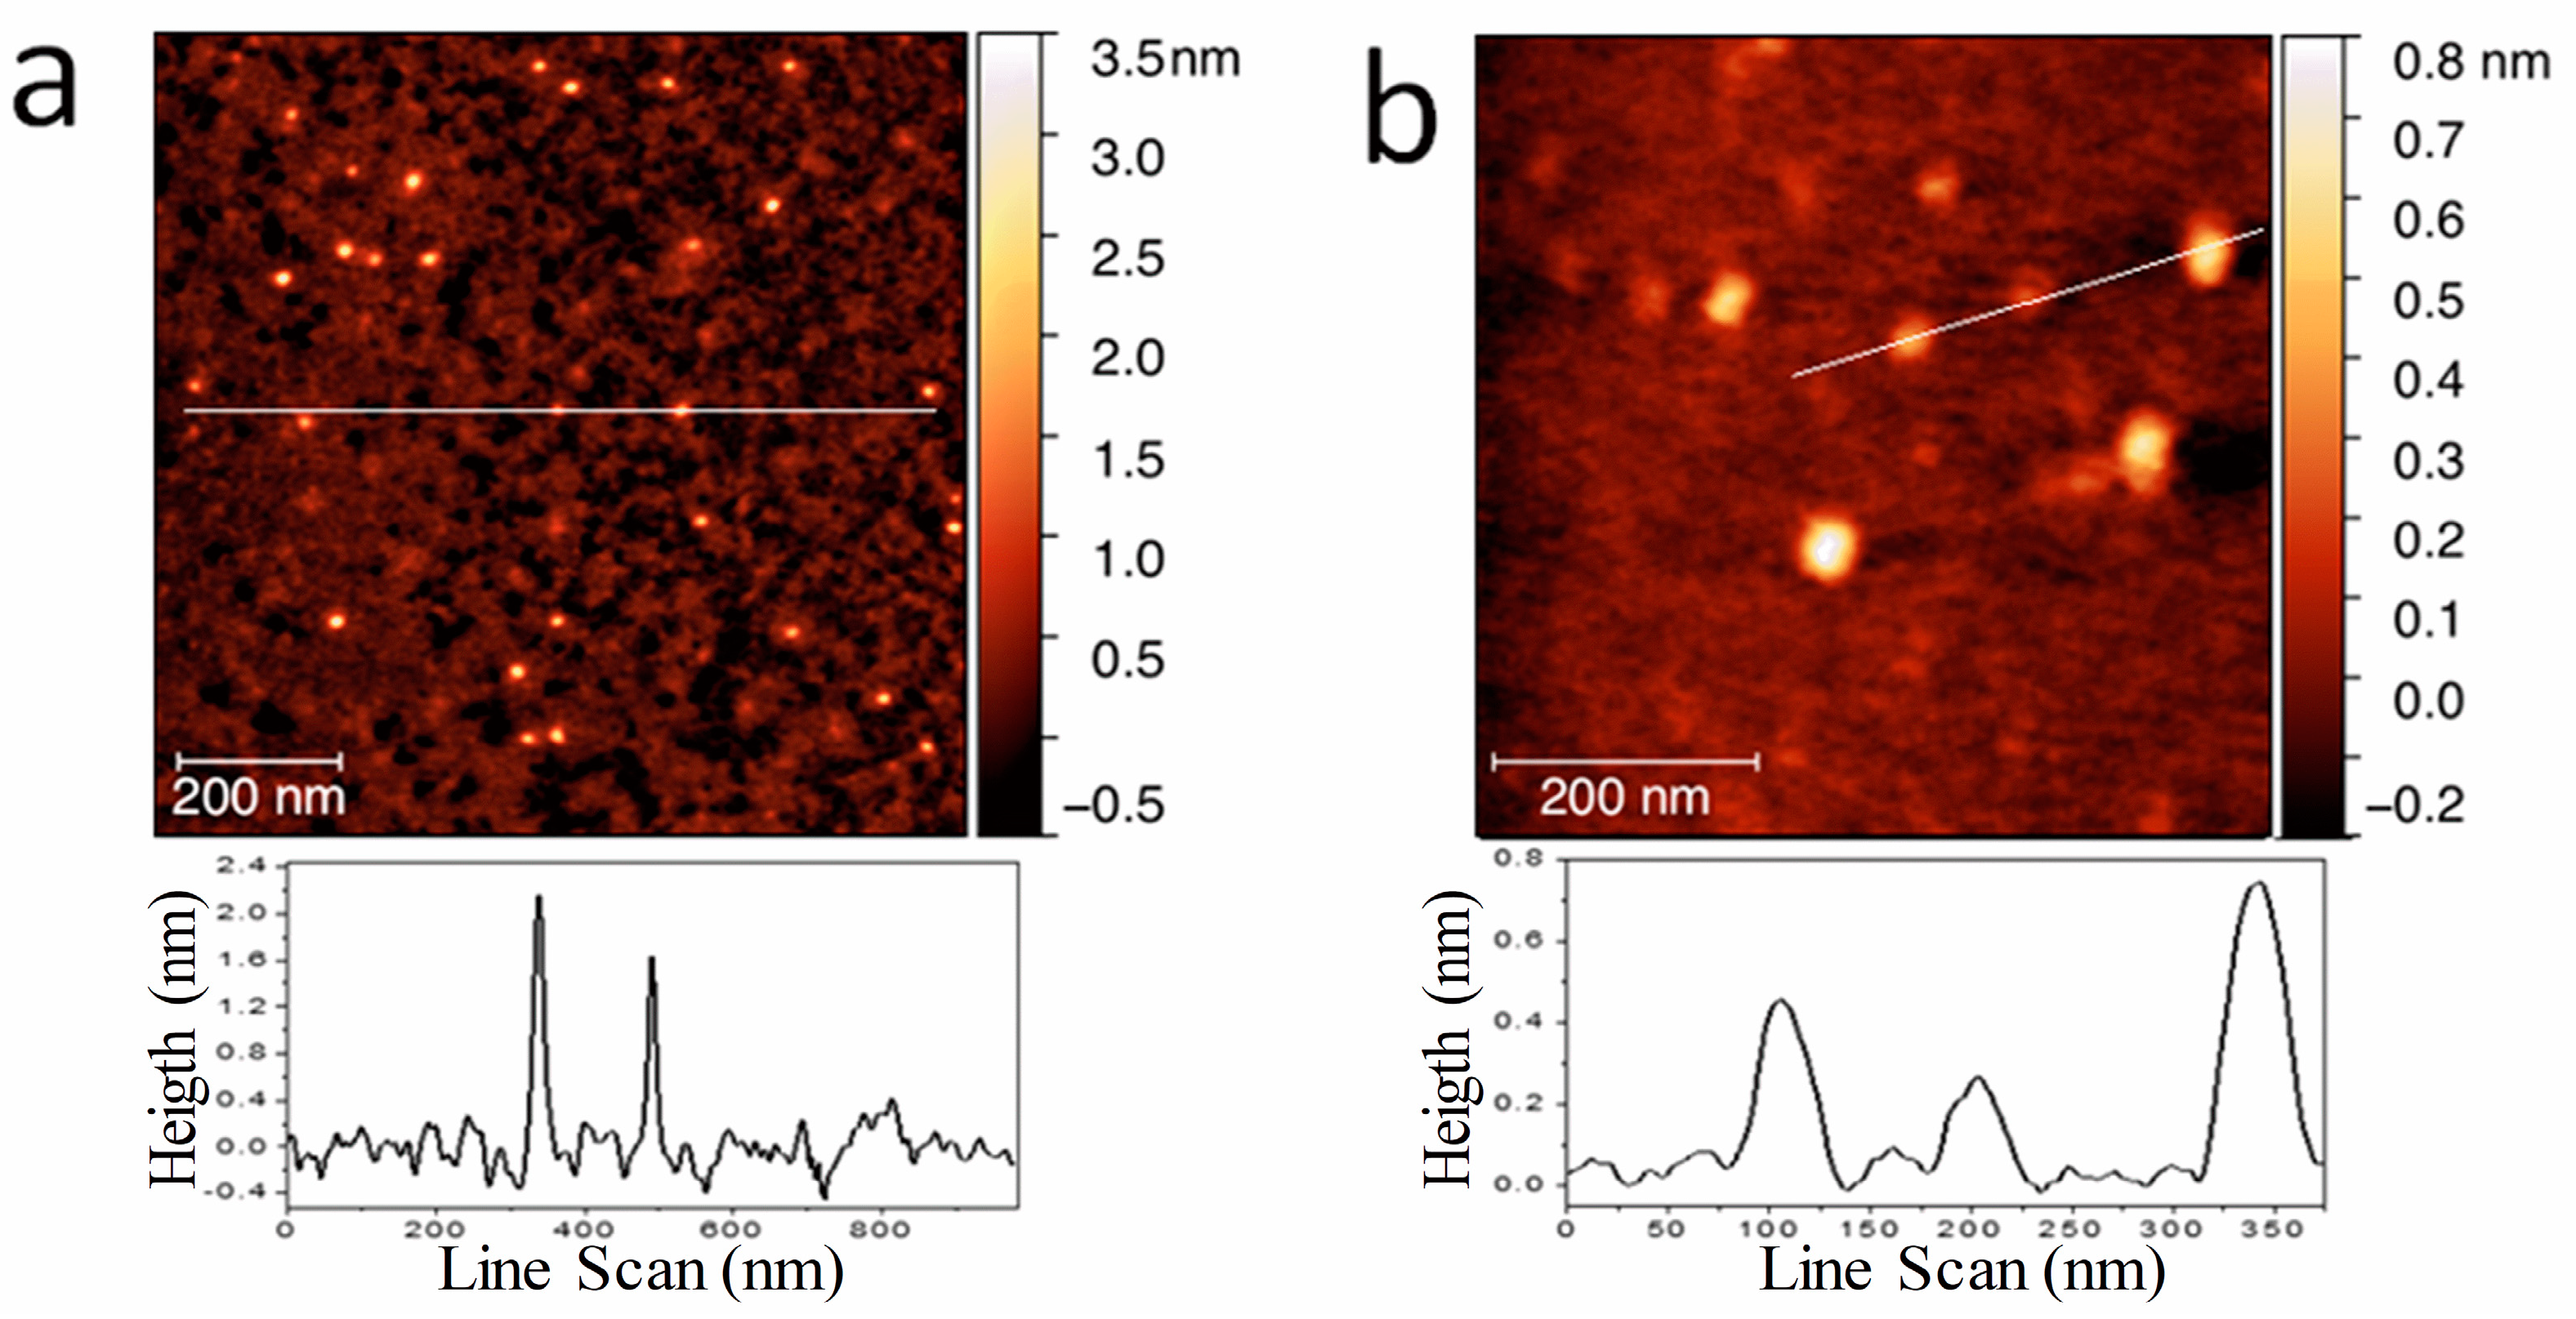
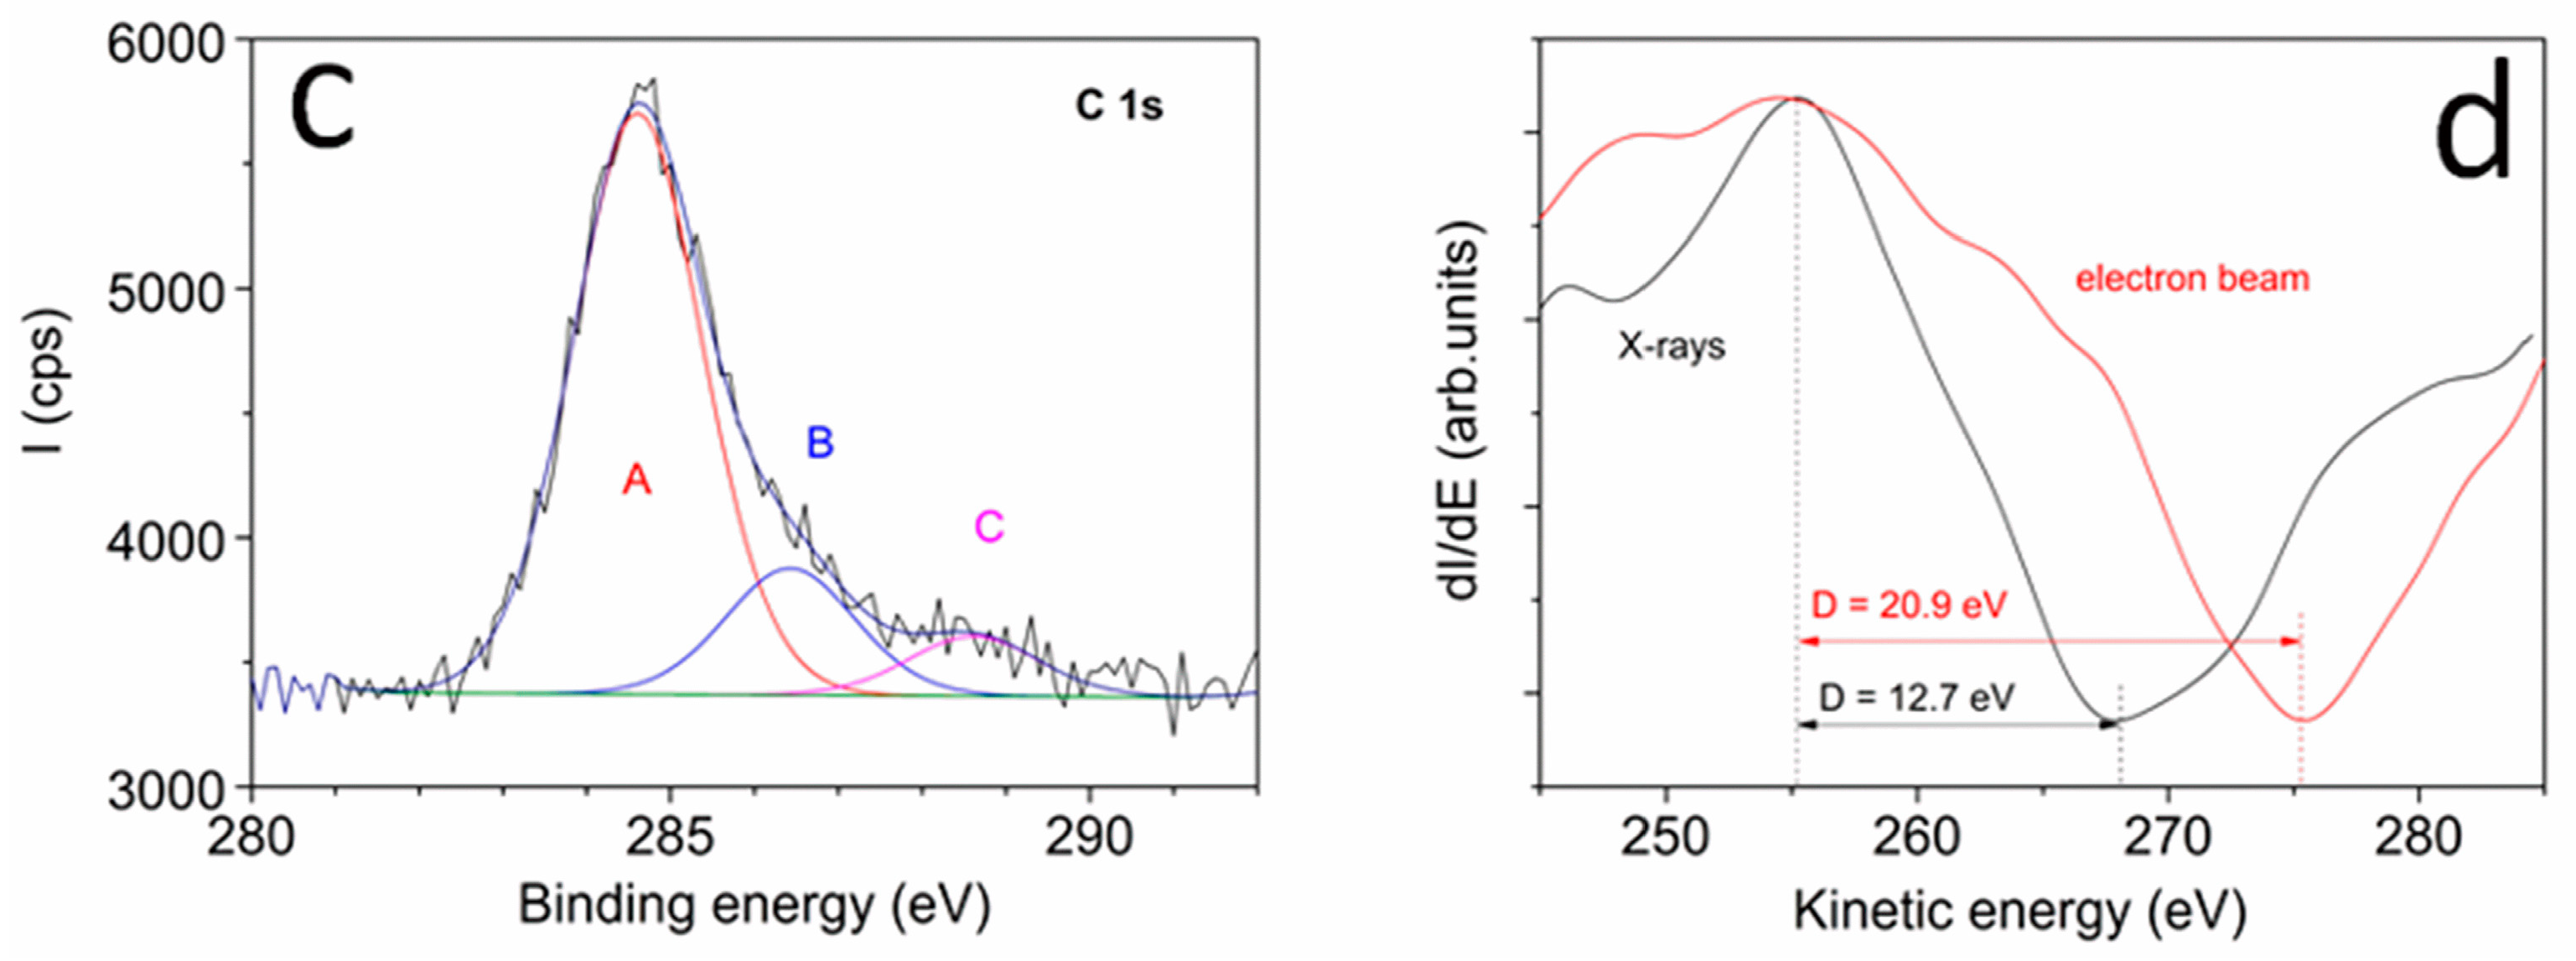
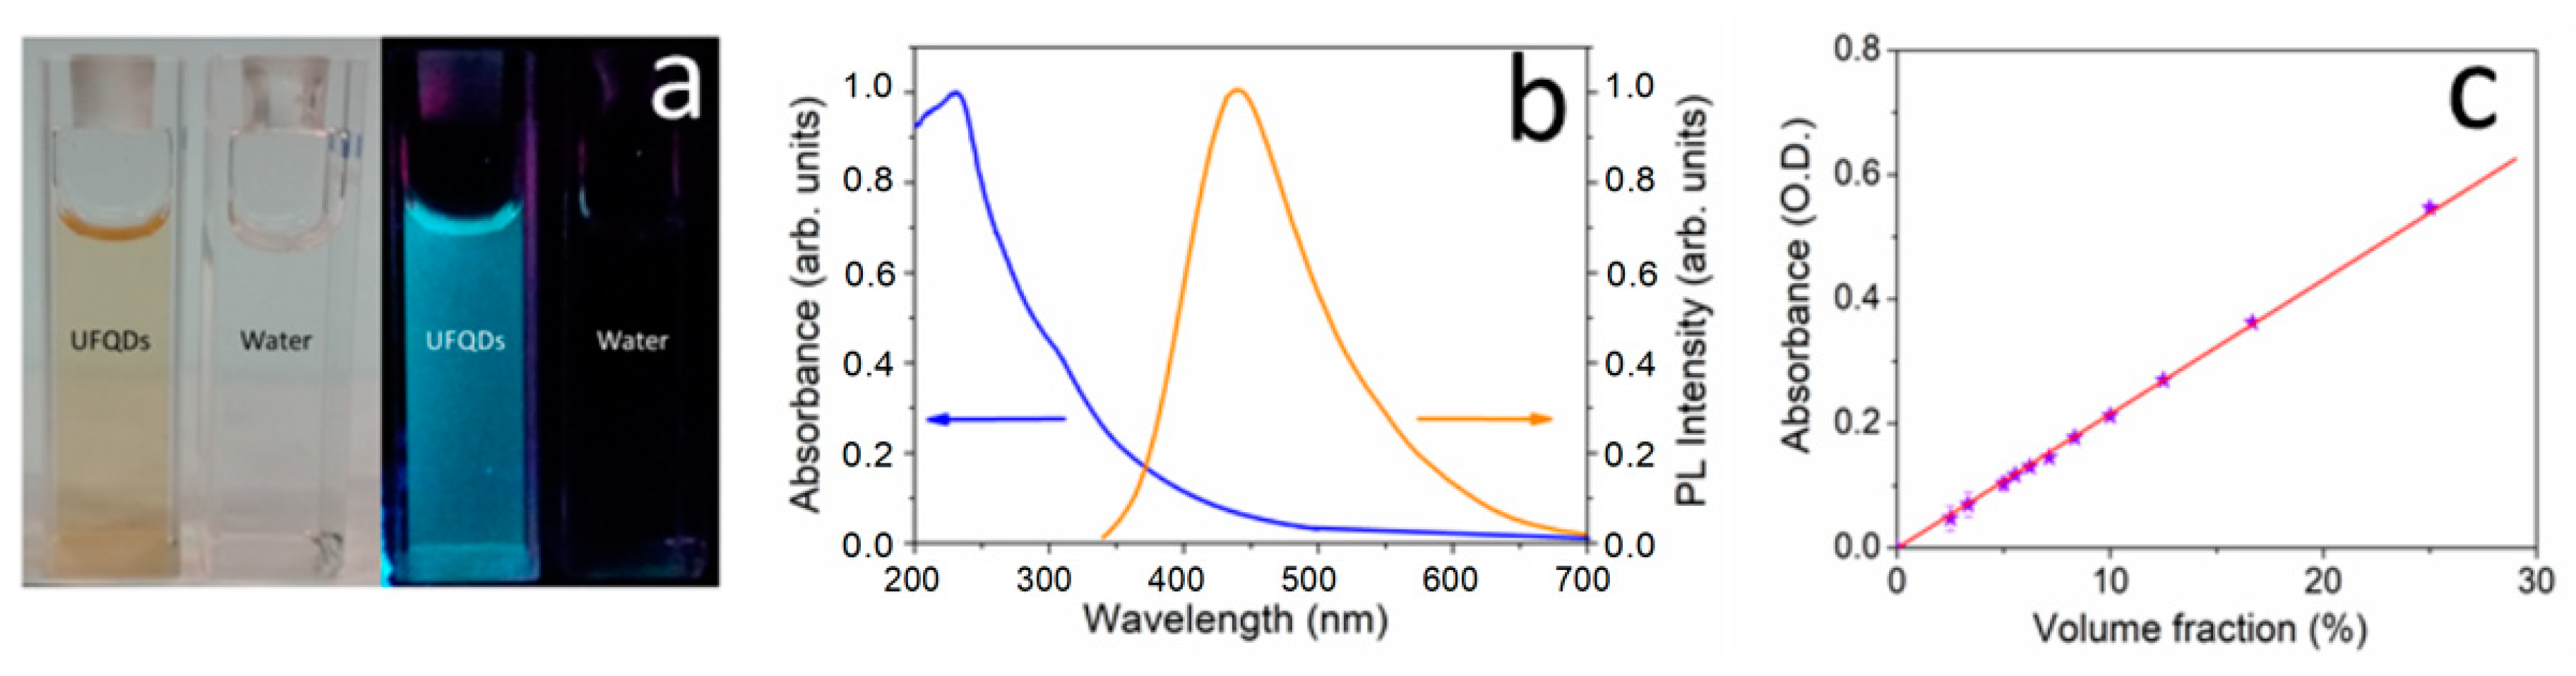
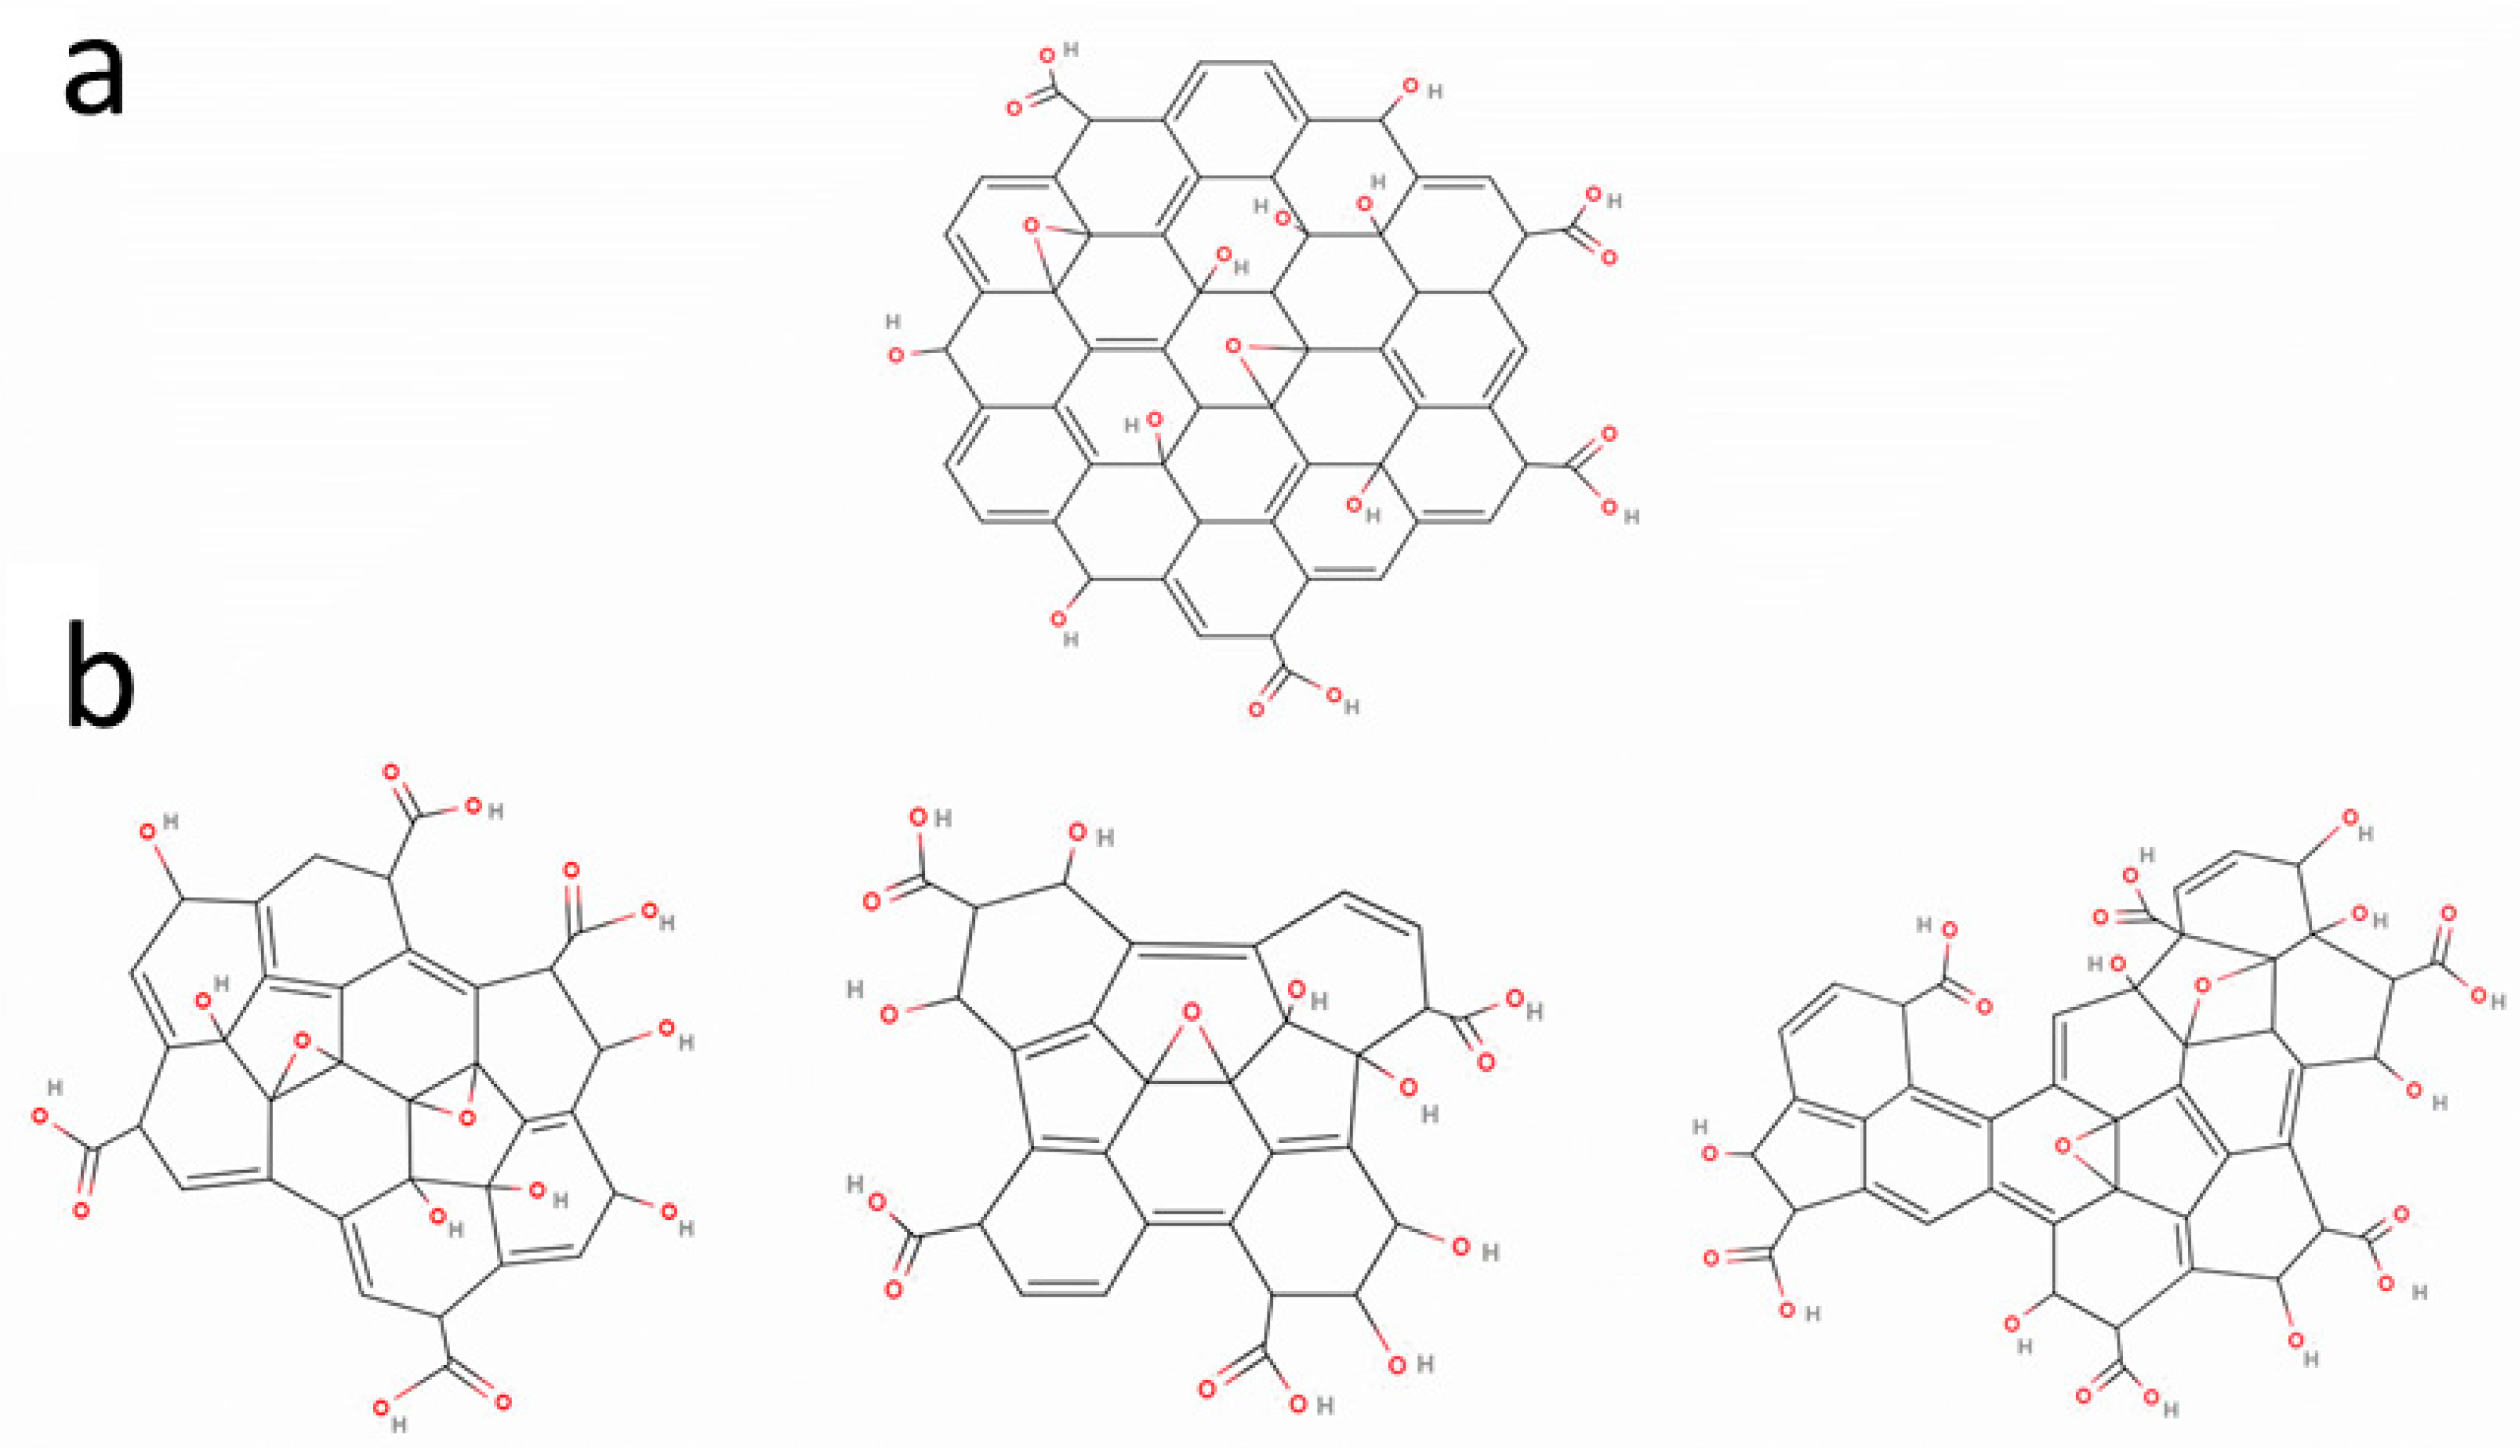
3.1. Morphological and Optical Characterization of UFQDs
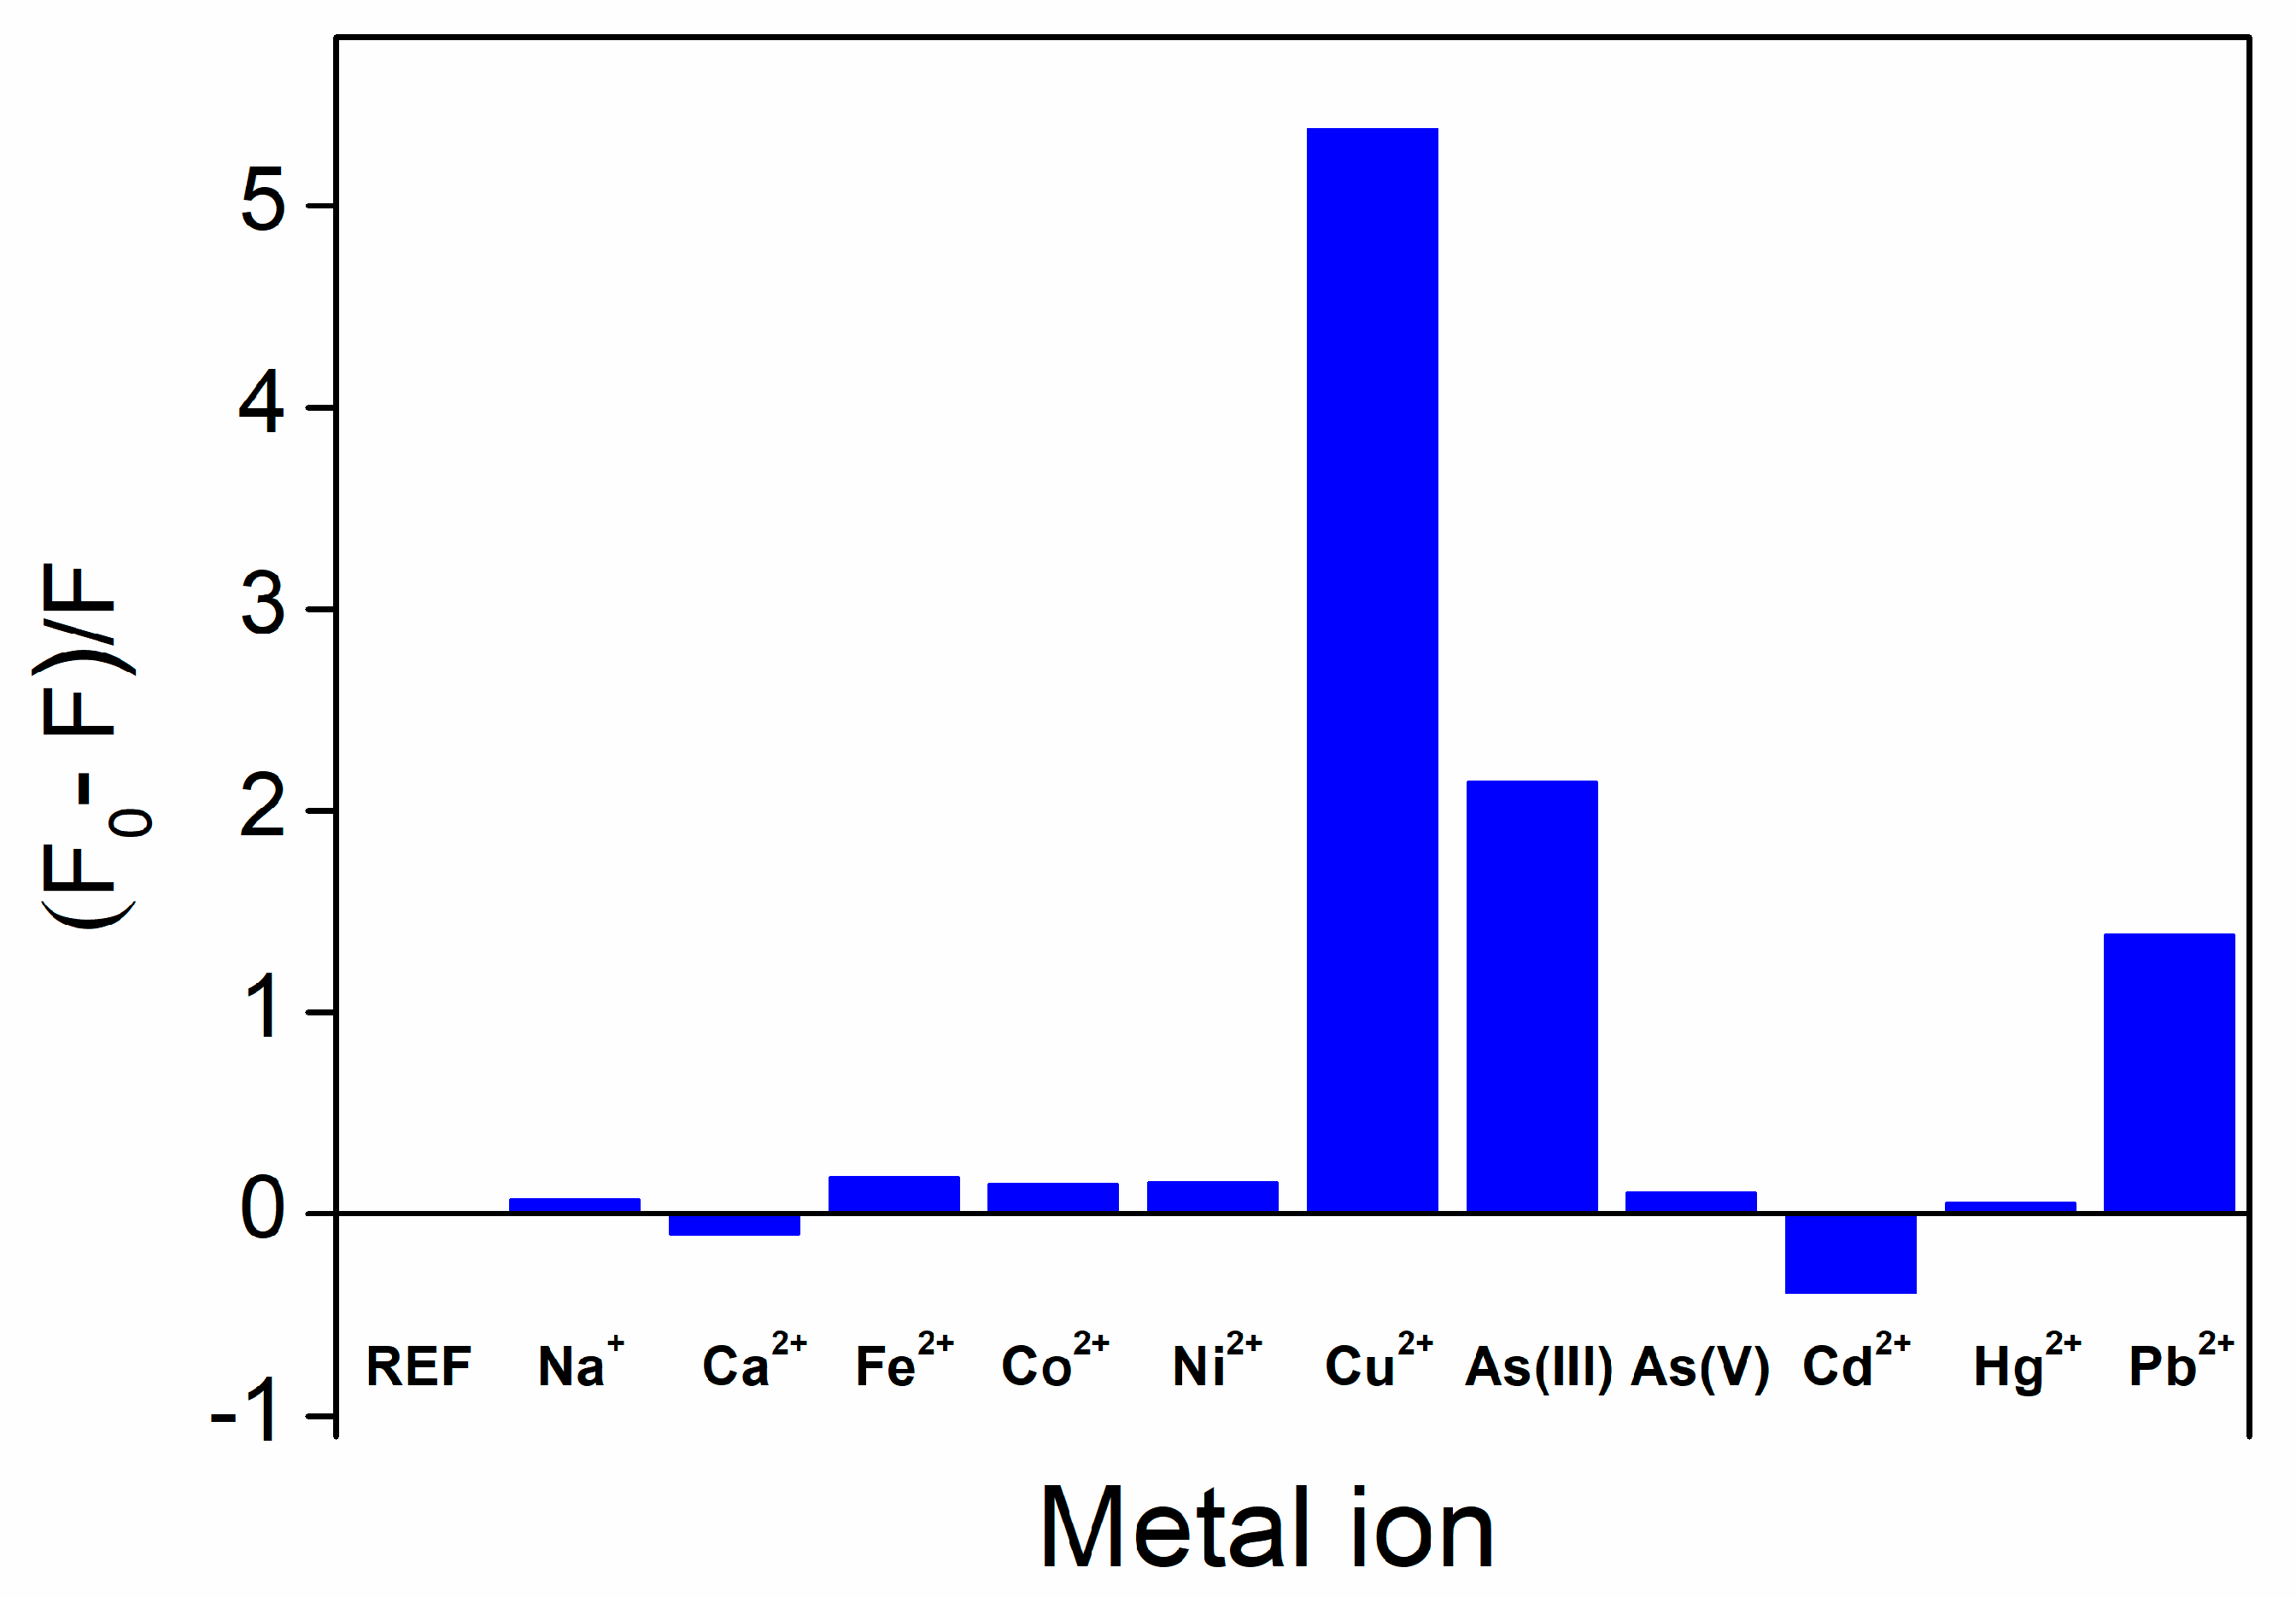
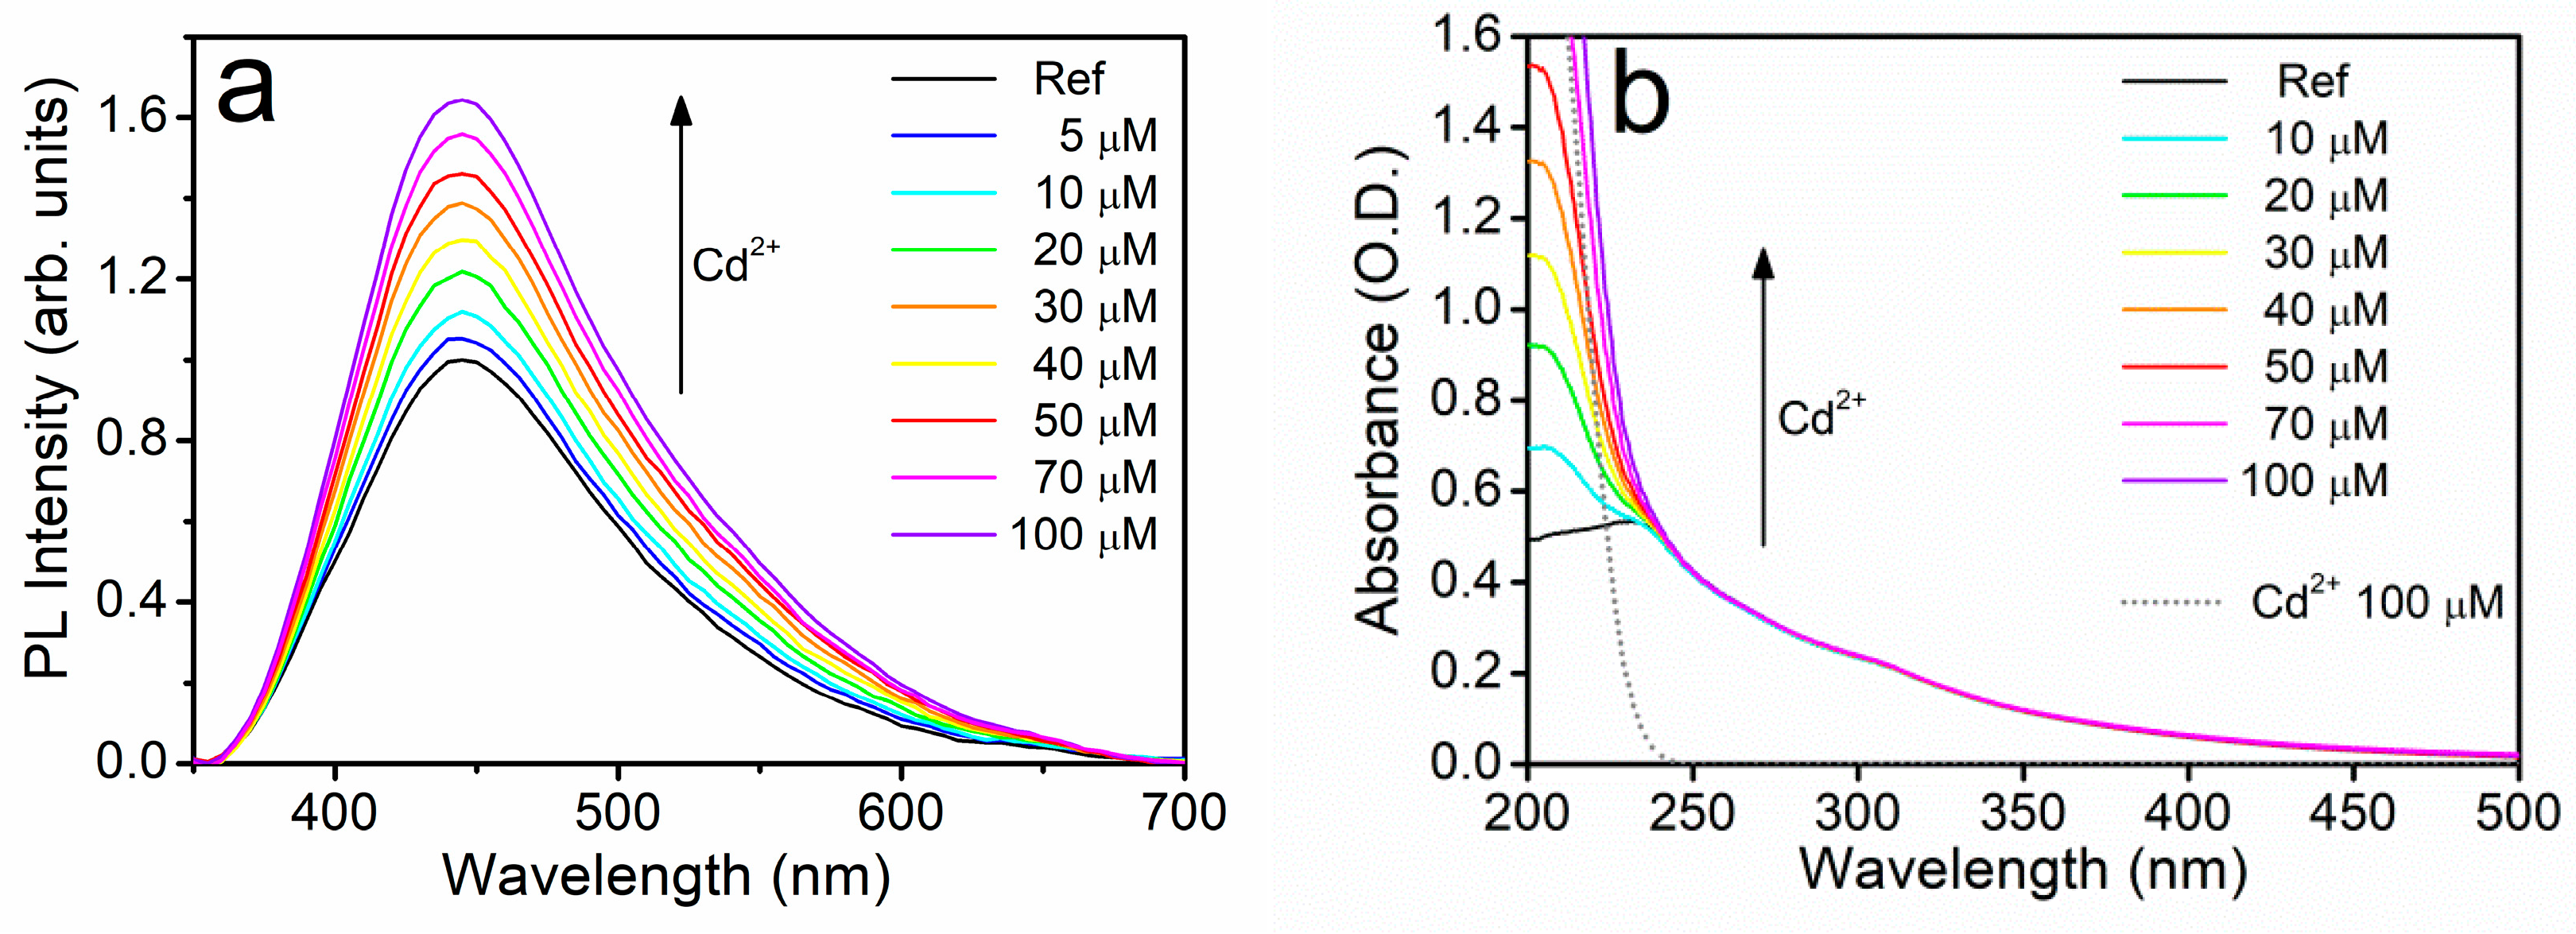
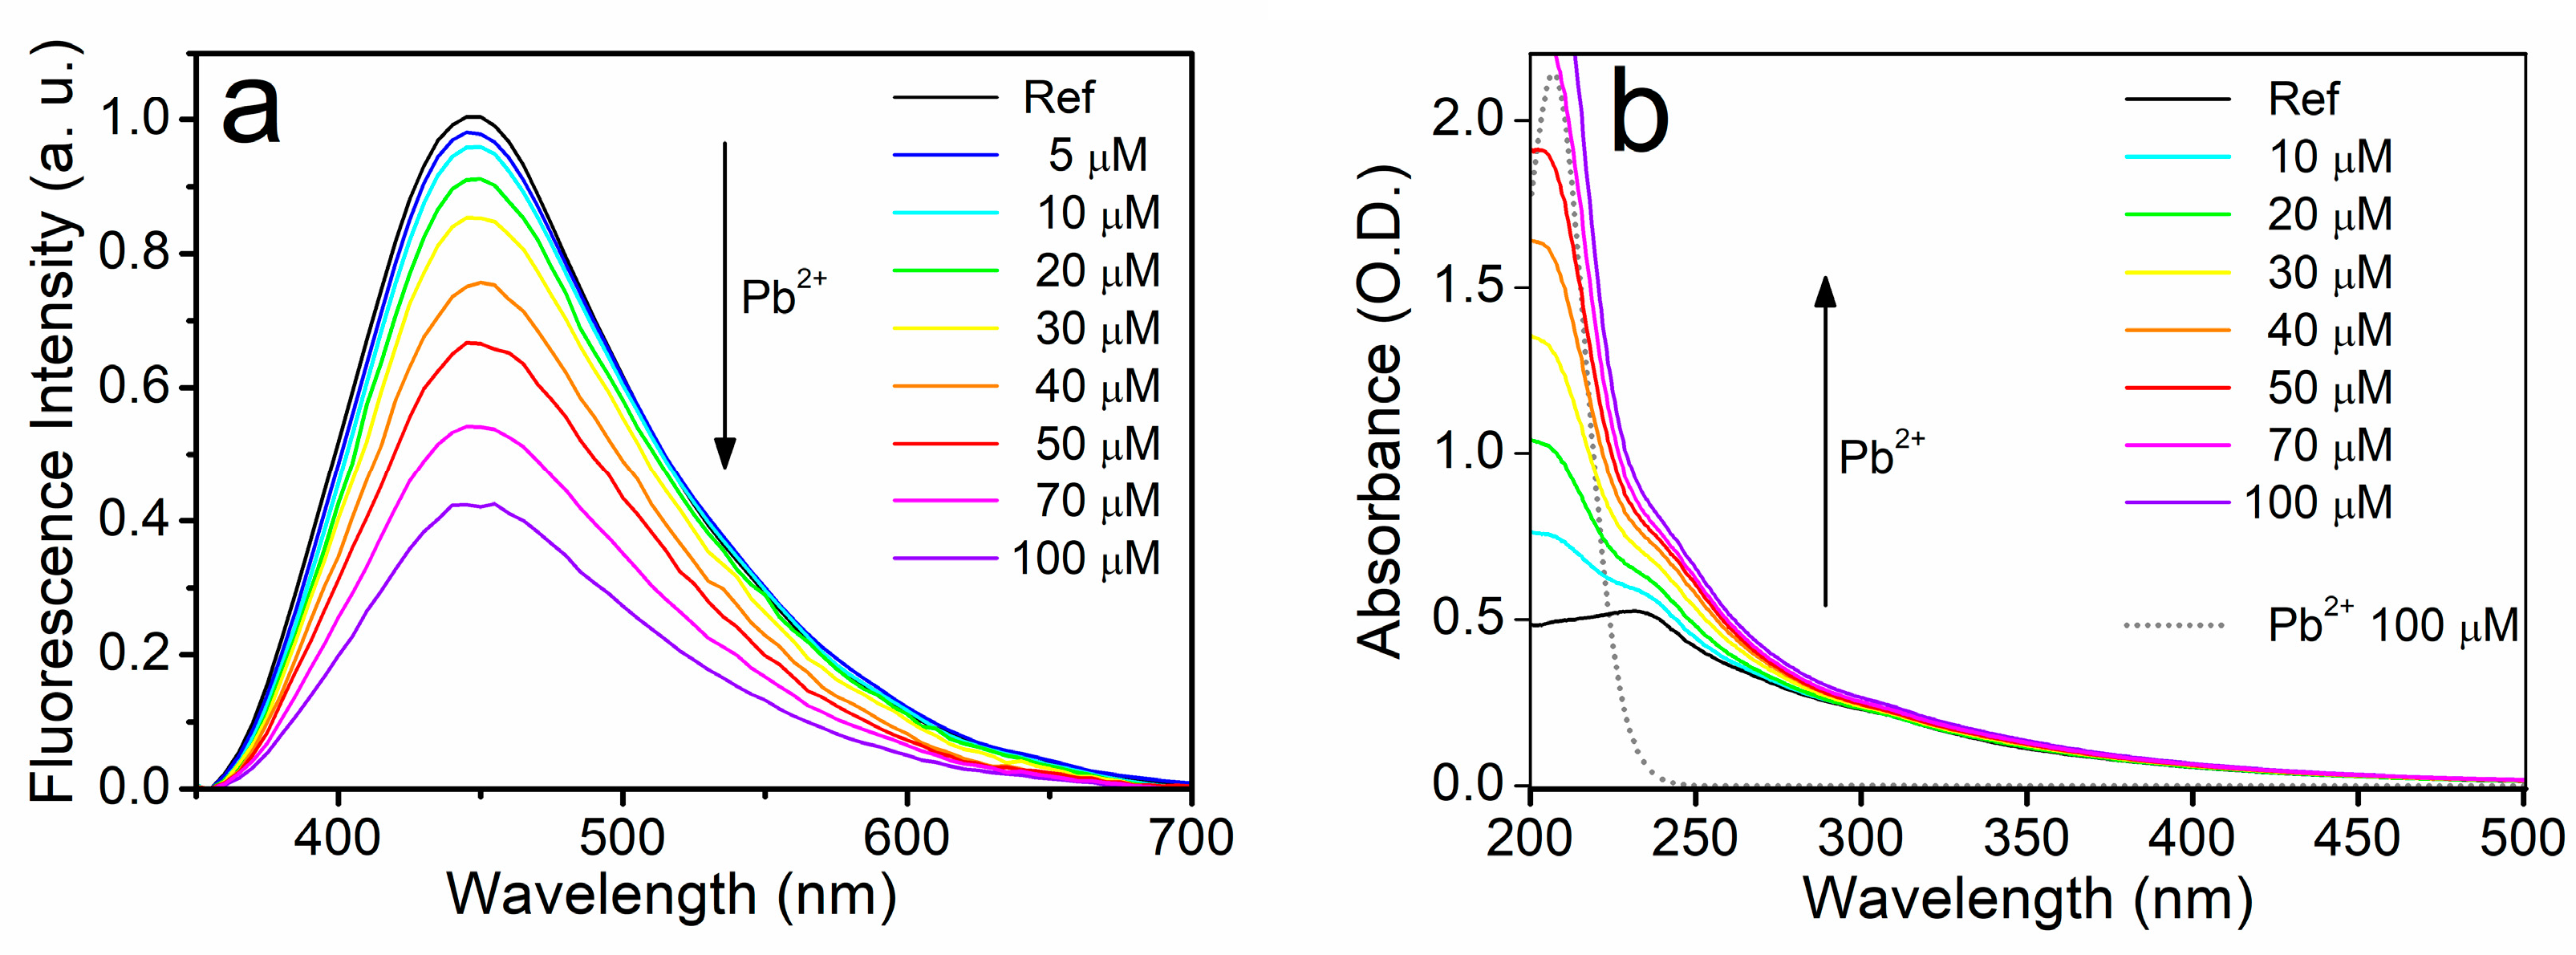
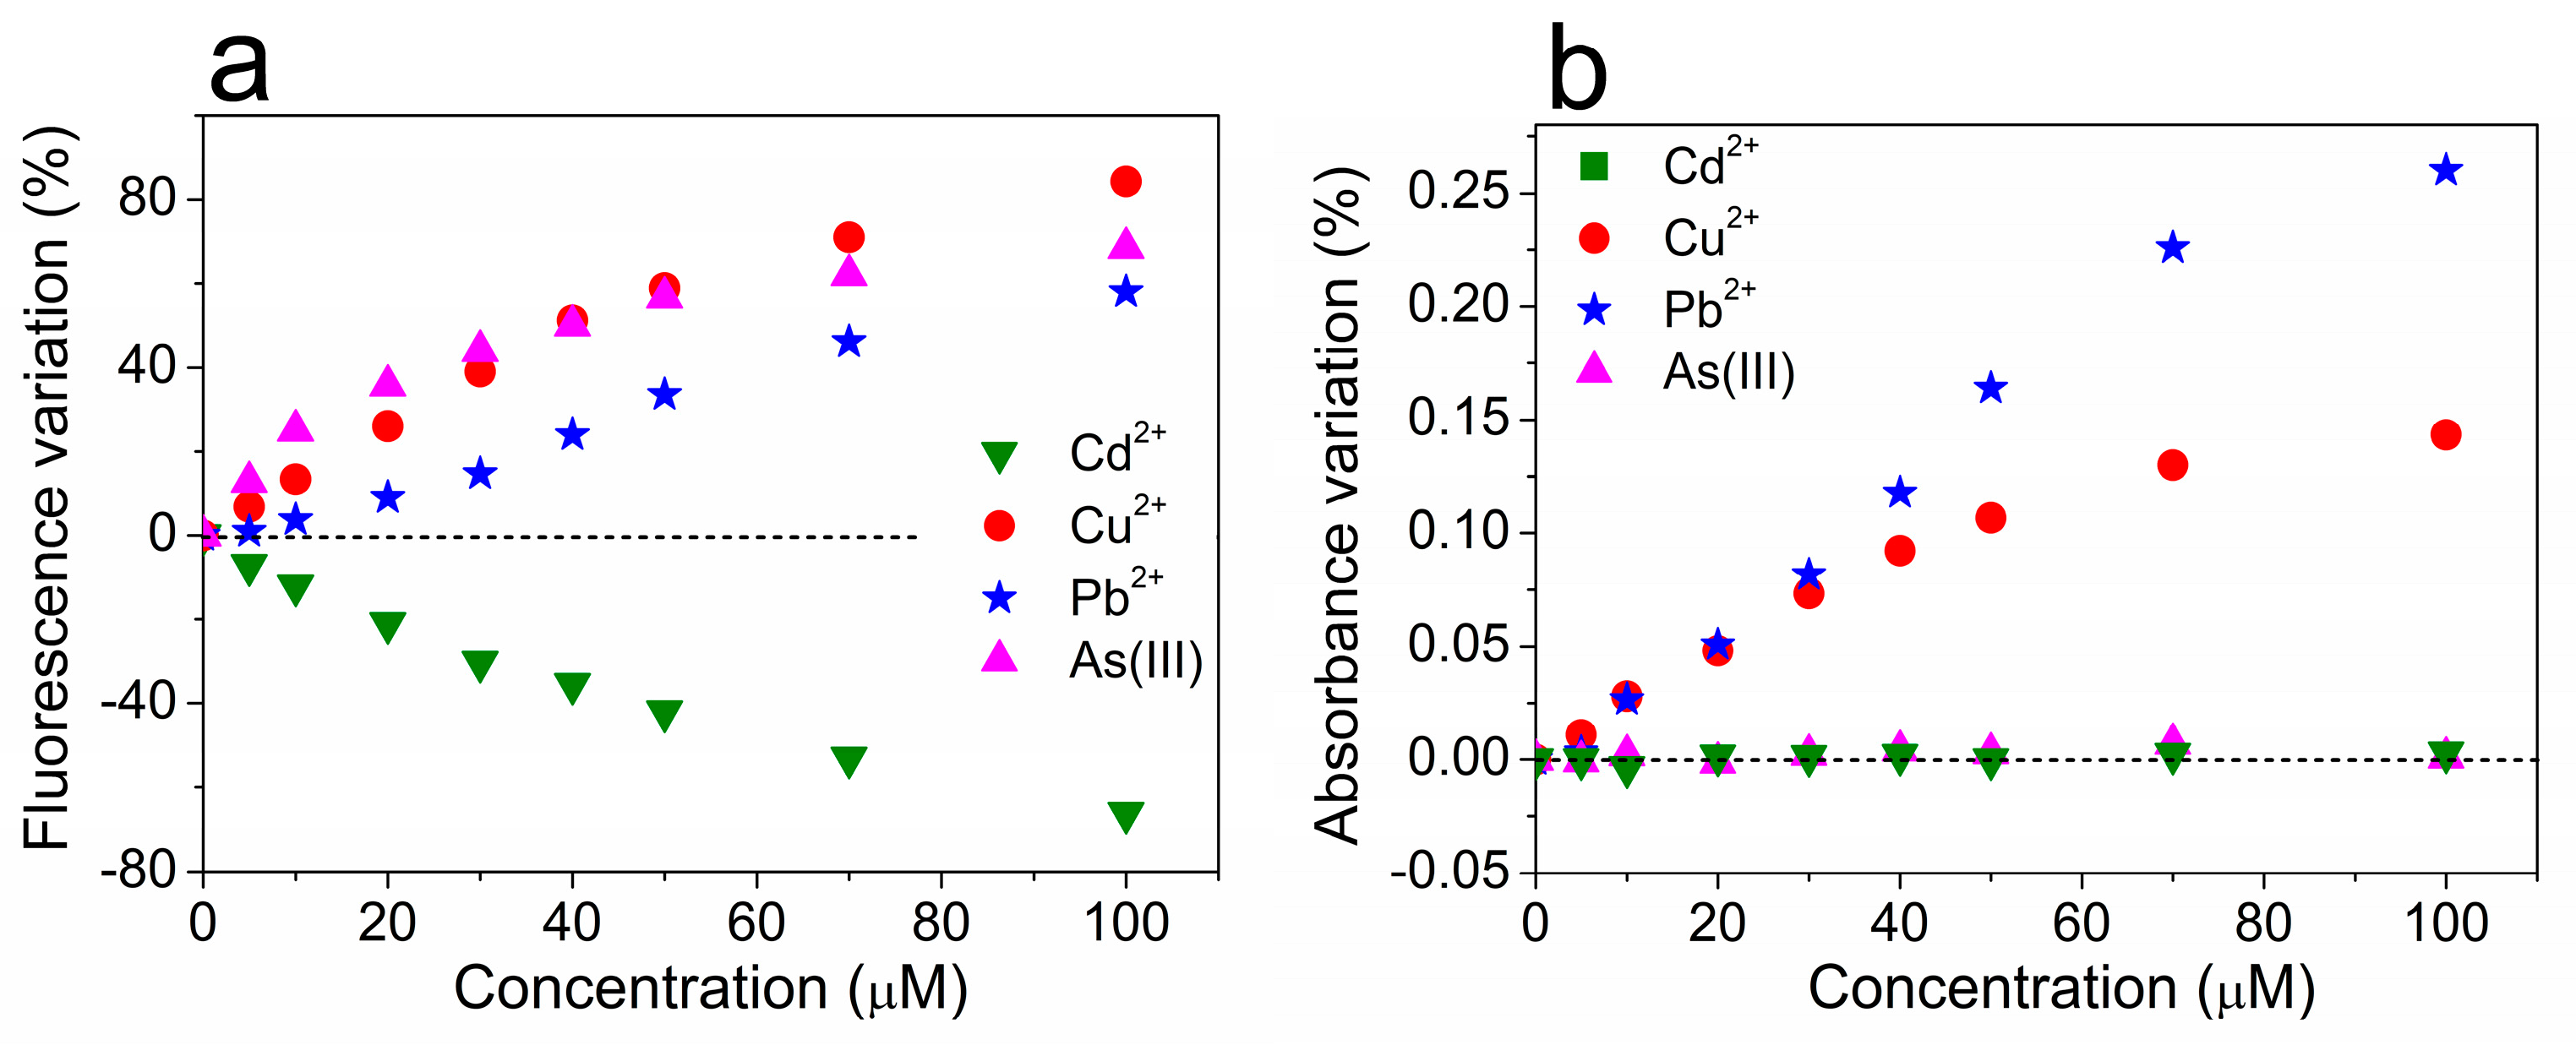
3.2. Diversified Optical Response of UFQDs to Heavy Metal Ions
3.3. Possible Mechanisms for the Optical Response
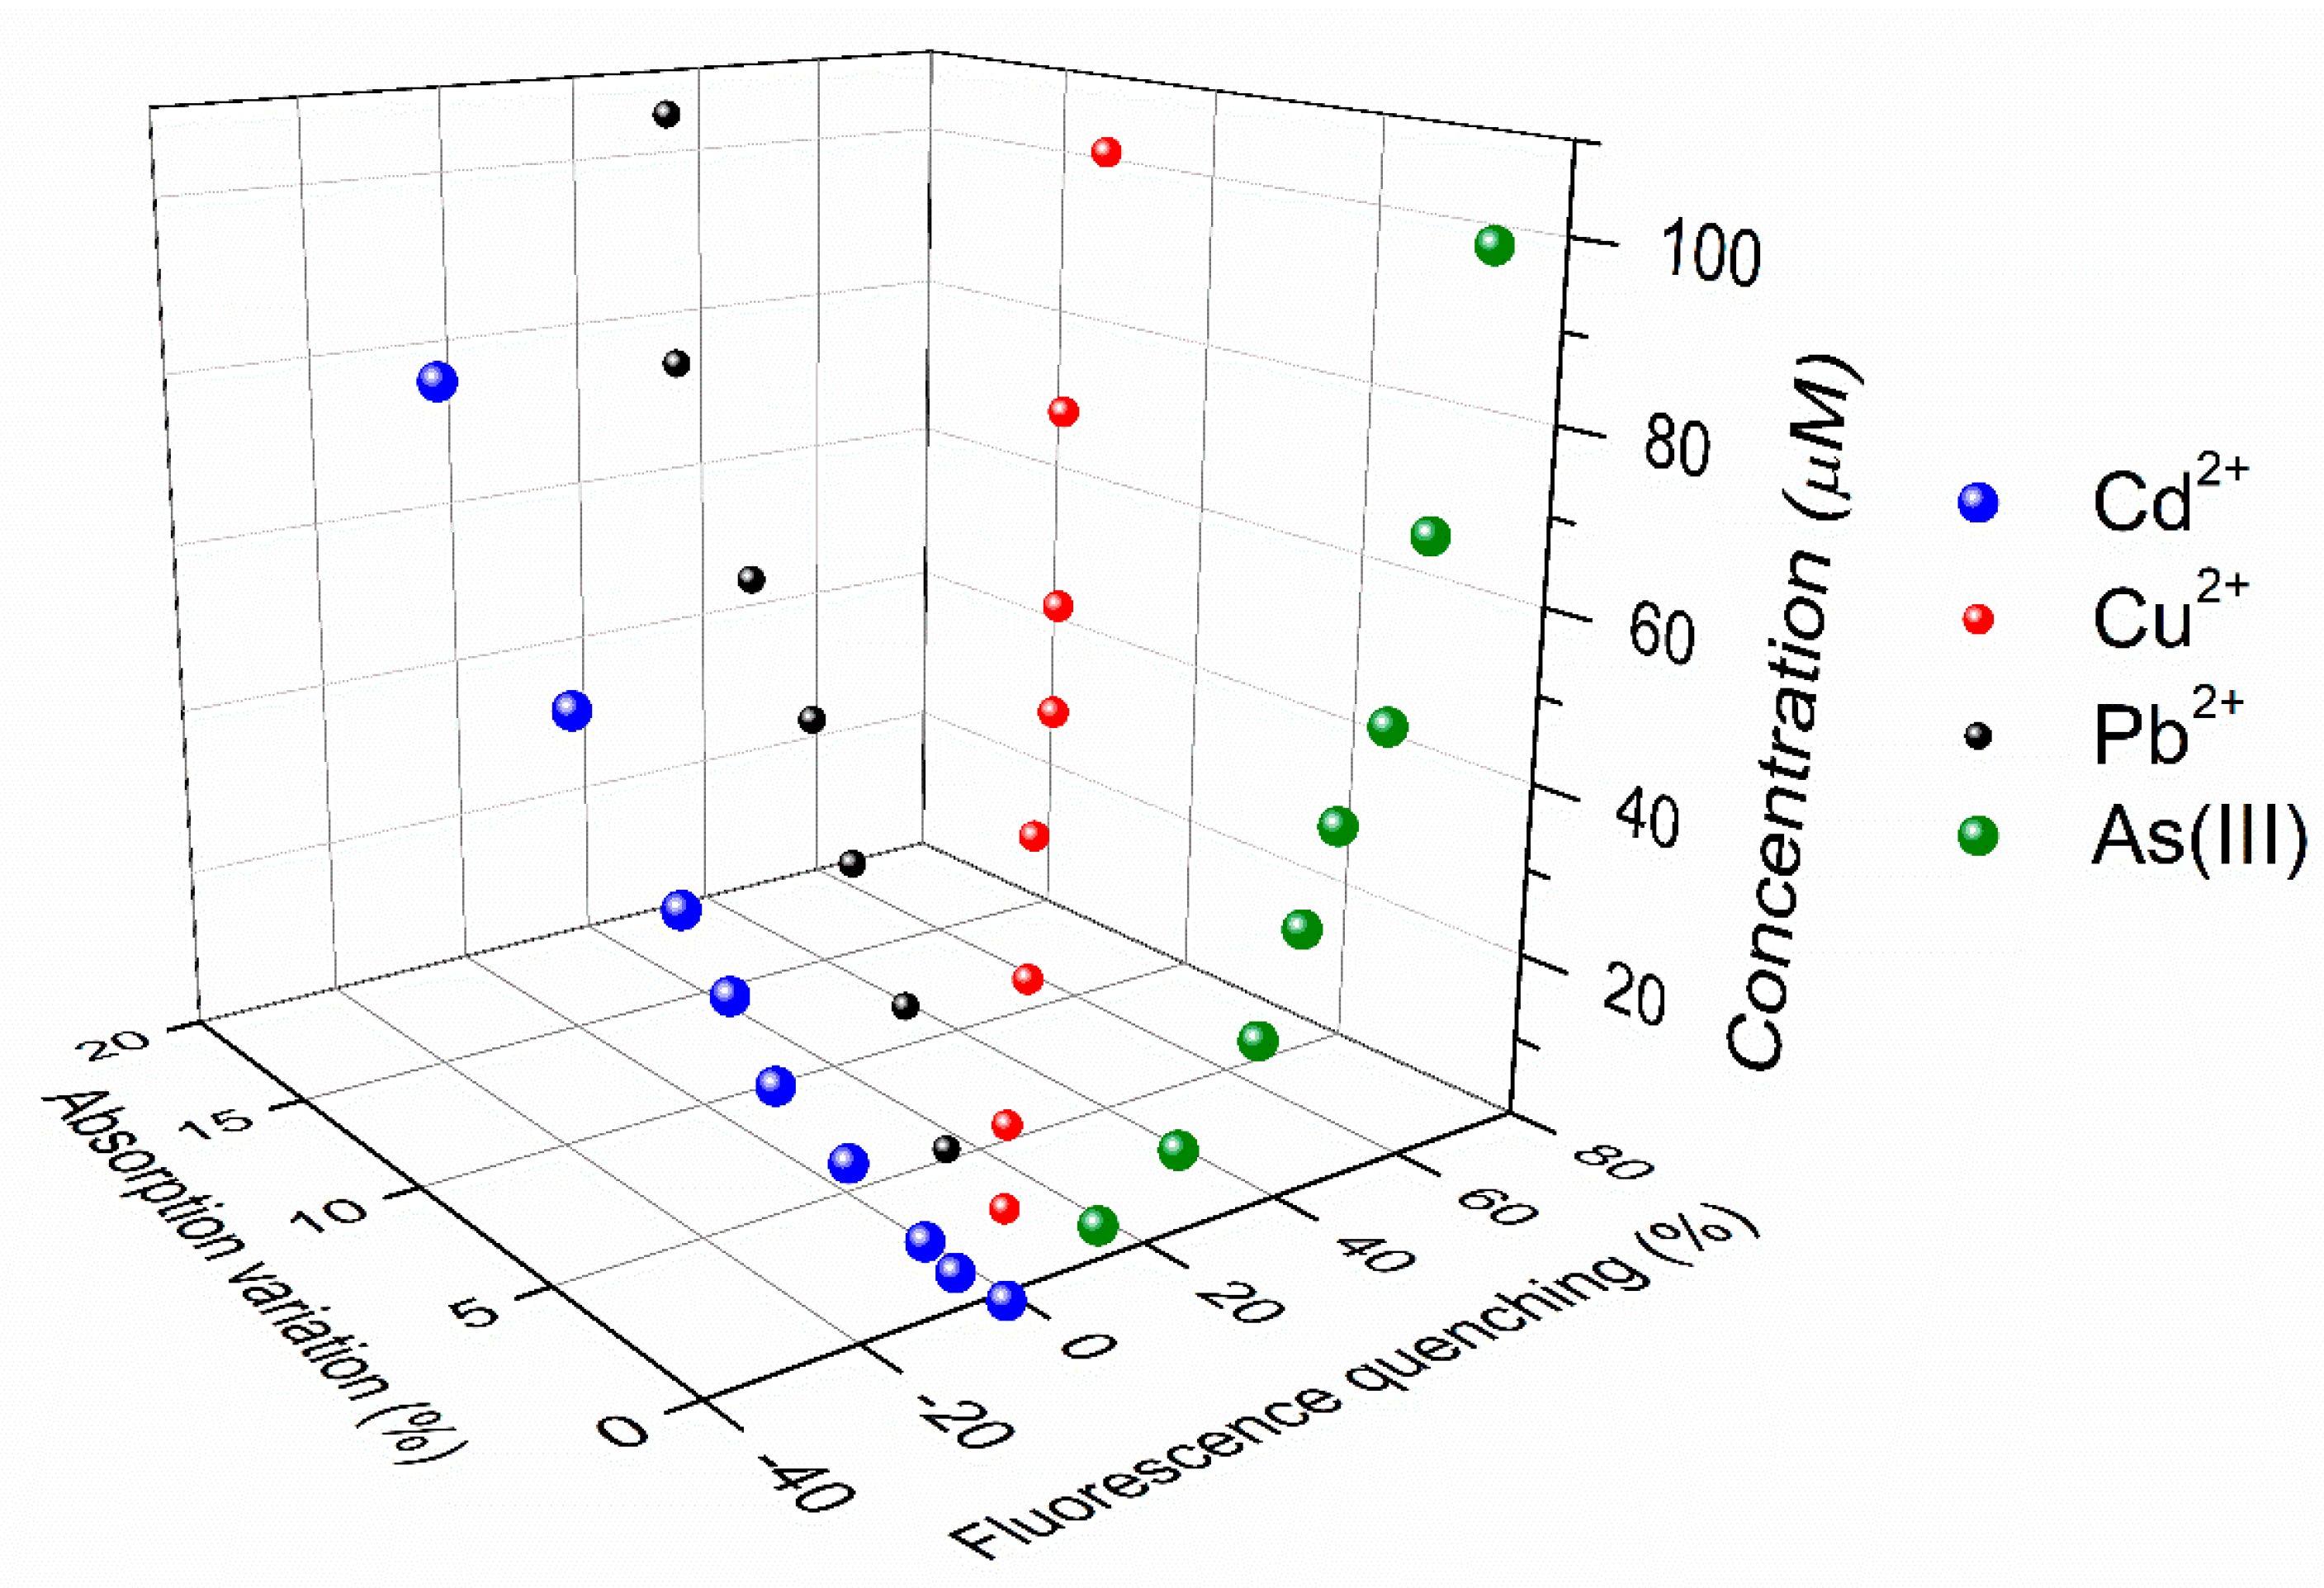
3.4. Comparison with Regular GOQDs, LODs, and Three-Dimensional Calibration Diagram
4. Conclusions
Supplementary Materials
Author Contributions
Conflicts of Interest
References
- Barreto, J.A.; O’Malley, W.; Kubeil, M.; Graham, B.; Stephan, H.; Spiccia, L. Nanomaterials: Applications in cancer imaging and therapy. Adv. Mater. 2011, 23, H18–H40. [Google Scholar] [CrossRef] [PubMed]
- Lin, N.; Huang, J.; Dufresne, A. Preparation, properties and applications of polysaccharide nanocrystals in advanced functional nanomaterials: A review. Nanoscale 2012, 4, 3274. [Google Scholar] [CrossRef] [PubMed]
- Prosposito, P.; Mochi, F.; Ciotta, E.; Casalboni, M.; de Matteis, F.; Venditti, I.; Fontana, L.; Testa, G.; Fratoddi, I. Hydrophilic silver nanoparticles with tunable optical properties: Application for the detection of heavy metals in water. Beilstein J. Nanotechnol. 2016, 7, 1654–1661. [Google Scholar] [CrossRef] [PubMed]
- Guo, S.; Wang, E. Noble metal nanomaterials: Controllable synthesis and application in fuel cells and analytical sensors. Nano Today 2011, 6, 240–264. [Google Scholar] [CrossRef]
- Yadav, A.; de Angelis, R.; Casalboni, M.; de Matteis, F.; Prosposito, P.; Nanni, F.; Cacciotti, I. Spectral properties of self-assembled polystyrene nanospheres photonic crystals doped with luminescent dyes. Opt. Mater. 2013, 35, 1538–1543. [Google Scholar] [CrossRef]
- Orsini, A.; Medaglia, P.G.; Scarpellini, D.; Pizzoferrato, R.; Falconi, C. Towards high-performance, low-cost quartz sensors with high-density, well-separated, vertically aligned ZnO nanowires by low-temperature, seed-less, single-step double-sided growth. Nanotechnology 2013, 24, 355503. [Google Scholar] [CrossRef] [PubMed]
- Shen, J.; Zhu, Y.; Yang, X.; Li, C. Graphene quantum dots: Emergent nanolights for bioimaging, sensors, catalysis and photovoltaic devices. Chem. Commun. 2012, 48, 3686–3699. [Google Scholar] [CrossRef] [PubMed]
- Yang, X.; Liu, M.; Yin, Y.; Tang, F.; Xu, H.; Liao, X. Green, Hydrothermal Synthesis of Fluorescent Carbon Nanodots from Gardenia, Enabling the Detection of Metronidazole in Pharmaceuticals and Rabbit Plasma. Sensors 2018, 18, 964. [Google Scholar] [CrossRef] [PubMed]
- Zhang, J.; Yu, S. Carbon dots: Large-scale synthesis, sensing and bioimaging. Biochem. Pharmacol. 2016, 19, 382–393. [Google Scholar] [CrossRef]
- Sun, H.; Wu, L.; Wei, W.; Qu, X. Recent advances in graphene quantum dots for sensing. Mater. Today 2013, 16, 433–442. [Google Scholar] [CrossRef]
- Zor, E.; Morales-Narváez, E.; Zamora-Gálvez, A.; Bingol, H.; Ersoz, M.; Merkoçi, A. Graphene quantum dots-based photoluminescent sensor: A multifunctional composite for pesticide detection. ACS Appl. Mater. Interfaces 2015, 7, 20272–20279. [Google Scholar] [CrossRef] [PubMed]
- Naumov, A.V. Optical Properties of Graphene Oxide, in Graphene Oxide: Fundamentals and Applications; John Wiley & Sons, Ltd.: Chichester, UK, 2016. [Google Scholar]
- Sk, M.A.; Ananthanarayanan, A.; Huang, L.; Lim, H. Revealing the tunable photoluminescence properties of graphene quantum dots. J. Mater. Chem. C Mater. Opt. Electron. Devices 2014, 2, 6954–6960. [Google Scholar] [CrossRef]
- Cao, L.I.; Meziani, M.J.; Sahu, S. Photoluminescence Properties of Graphene versus Other Carbon Nanomaterials. Acc. Chem. Res. 2012, 46, 171–180. [Google Scholar] [CrossRef] [PubMed]
- Li, M.; Cushing, S.K.; Zhou, X.; Wu, N. Fingerprinting photoluminescence of functional groups in graphene oxide. J. Mater. Chem. 2012, 22, 23374–23379. [Google Scholar] [CrossRef]
- Galande, C.; Mohite, A.D.; Naumov, A.V.; Gao, W.; Ci, L.; Ajayan, A.; Gao, H.; Srivastava, A.; Weisman, R.B.; Ajayan, P.M. Quasi-Molecular Fluorescence from Graphene Oxide. Sci. Rep. 2011, 85, 1–5. [Google Scholar] [CrossRef] [PubMed]
- Ju, J.; Chen, W. Graphene Quantum Dots as a Fluorescence Probes for Sensing Metal Ions: Synthesis and Applications. Curr. Org. Chem. 2015, 19, 1150–1162. [Google Scholar] [CrossRef]
- Wang, D.; Wang, L.; Dong, X.; Shi, Z.; Jin, J. Chemically tailoring graphene oxides into fluorescent nanosheets for Fe3+ ion detection. Carbon 2012, 50, 2147–2154. [Google Scholar] [CrossRef]
- Wang, F.; Gu, Z.; Lei, W.; Wang, W.; Xia, X.; Hao, Q. Graphene quantum dots as a fluorescent sensing platform for highly efficient detection of copper(II) ions. Sens. Actuators B Chem. 2014, 190, 516–522. [Google Scholar] [CrossRef]
- Chakraborti, H.; Sinha, S.; Ghosh, S.; Kalyan, S. Interfacing water soluble nanomaterials with fluorescence chemosensing: Graphene quantum dot to detect Hg2+ in 100% aqueous solution. Mater. Lett. 2013, 97, 78–80. [Google Scholar] [CrossRef]
- Li, Z.; Wang, Y.; Ni, Y.; Kokot, S. A rapid and label-free dual detection of Hg(II) and cysteine with the use of fluorescence switching of graphene quantum dots. Sens. Actuators B Chem. 2015, 207, 490–497. [Google Scholar] [CrossRef]
- Huang, H.; Liao, L.; Xu, X.; Zou, M.; Liu, F.; Li, N. The electron-transfer based interaction between transition metal ions and photoluminescent graphene quantum dots (GQDs): A platform for metal ion sensing. Talanta 2013, 117, 152–157. [Google Scholar] [CrossRef] [PubMed]
- Huang, S.; Qiu, H.; Zhu, F.; Lu, S.; Xiao, Q. Graphene quantum dots as on-off-on fluorescent probes for chromium(VI) and ascorbic acid. Microchim. Acta 2015, 182, 1723–1731. [Google Scholar] [CrossRef]
- Liu, X.; Gao, W.; Zhou, X. Pristine graphene quantum dots for detection of copper ions. J. Mater. Res. 2014, 29, 1401–1407. [Google Scholar] [CrossRef]
- Length, F. Heavy metal pollution and human biotoxic effects. Int. J. Phys. Sci. 2007, 2, 112–118. [Google Scholar]
- Jaishankar, M.; Tseten, T.; Anbalagan, N.; Mathew, B.B.; Beeregowda, K.N. Toxicity, mechanism and health effects of some heavy metals. Interdiscip. Toxicol. 2014, 7, 60–72. [Google Scholar] [CrossRef] [PubMed]
- Gordon, B.; Callan, P.; Vickers, C. WHO Guidelines for Drinking-Water Quality, 2008th ed.; World Health Organization: Geneva, Switzerland, 2008. [Google Scholar]
- Ackerman, A.H.; Creed, P.A.; Parks, A.N.; Fricke, M.W.; Schwegel, C.A.; Creed, J.T.; Heitkemper, D.T.; Vela, N.P. Comparison of a chemical and enzymatic extraction of arsenic from rice and an assessment of the arsenic absorption from contaminated water by cooked rice. Environ. Sci. Technol. 2005, 39, 5241–5246. [Google Scholar] [CrossRef] [PubMed]
- Kumawat, M.K.; Thakur, M.; Gurung, R.B.; Srivastava, R. Graphene Quantum Dots for Cell Proliferation, Nucleus Imaging, and Photoluminescent Sensing Applications. Sci. Rep. 2017, 7, 15858. [Google Scholar] [CrossRef] [PubMed]
- Jin, K.; Gao, H.; Lai, L.; Pang, Y.; Zheng, S.; Niu, Y.; Li, X. Preparation of highly fluorescent sulfur doped graphene quantum dots for live cell imaging. J. Lumin. 2018, 197, 147–152. [Google Scholar] [CrossRef]
- Kim, H.N.; Ren, W.X.; Kim, J.S.; Yoon, J. Fluorescent and colorimetric sensors for detection of lead, cadmium, and mercury ions. Chem. Soc. Rev. 2012, 41, 3210–3244. [Google Scholar] [CrossRef] [PubMed]
- Bradley, S.J.; Kroon, R.; Laufersky, G.; Röding, M.; Goreham, R.V.; Gschneidtner, T.; Schroeder, K.; Moth-Poulsen, K.; Andersson, M.; Nann, T. Heterogeneity in the fluorescence of graphene and graphene oxide quantum dots. Microchim. Acta 2017, 184, 871–878. [Google Scholar] [CrossRef]
- Ciotta, E.; Paoloni, S.; Richetta, M.; Prosposito, P.; Tagliatesta, P.; Lorecchio, C.; Venditti, I.; Fratoddi, I.; Casciardi, S.; Pizzoferrato, R. Sensitivity to Heavy-Metal Ions of Unfolded Fullerene Quantum Dots. Sensors 2017, 17, 2614. [Google Scholar] [CrossRef] [PubMed]
- Chua, C.K.; Sofer, Z.; Šimek, P.; Jankovský, O.; Klímová, K.; Bakardjieva, S.; Kučková, Š.H.; Pumera, M. Synthesis of strongly fluorescent graphene quantum dots by cage-opening buckminsterfullerene. ACS Nano 2015, 9, 2548–2555. [Google Scholar] [CrossRef] [PubMed]
- Hall, G.E.M.; Pelchat, J.C.; Gauthier, G. Stability of inorganic arsenic(III) and arsenic(V) in water samples. J. Anal. At. Spectrom. 1999, 14, 205–213. [Google Scholar] [CrossRef]
- Hummers, W.S.; Offeman, R.E. Preparation of Graphitic Oxide. J. Am. Chem. Soc. 1958, 80, 1339. [Google Scholar] [CrossRef]
- Kaciulis, S.; Mezzi, A.; Calvani, P.; Trucchi, D.M. Electron spectroscopy of the main allotropes of carbon. Surf. Interface Anal. 2014, 46, 966–969. [Google Scholar] [CrossRef]
- Pizzoferrato, R.; Ziller, T.; Micozzi, A.; Ricci, A.; Sterzo, C.L.; Ustione, A.; Oliva, C.; Cricenti, A. Suppression of the excimer photoluminescence in a poly(arylene-ethynylene) co-polymer. Chem. Phys. Lett. 2005, 414, 234–238. [Google Scholar] [CrossRef]
- Kosynkin, D.V.; Higginbotham, A.L.; Sinitskii, A.; Lomeda, J.R.; Dimiev, A.; Price, B.K.; Tour, J.M. Longitudinal unzipping of carbon nanotubes to form graphene nanoribbons. Nature 2009, 458, 872–876. [Google Scholar] [CrossRef] [PubMed]
- Schniepp, H.C.; Li, J.L.; McAllister, M.J.; Sai, H.; Herrera-Alonson, M.; Adamson, D.H.; Prud’homme, R.K.; Car, R.; Seville, D.A.; Aksay, I.A. Functionalized single graphene sheets derived from splitting graphite oxide. J. Phys. Chem. B 2006, 110, 8535–8539. [Google Scholar] [CrossRef] [PubMed]
- Pedrazzetti, L.; Nobili, L.; Magagnin, L.; Bernasconi, R.; Lucotti, A.; Soltani, P.; Mezzi, A.; Kaciulis, S. Growth and characterization of ultrathin carbon films on electrodeposited Cu and Ni. Surf. Interface Anal. 2017, 49, 1088–1094. [Google Scholar] [CrossRef]
- Huang, J.J.; Rong, M.Z.; Zhang, M.Q. Preparation of graphene oxide and polymer-like quantum dots and their one- and two-photon induced fluorescence properties. Phys. Chem. Chem. Phys. 2016, 18, 4800–4806. [Google Scholar] [CrossRef] [PubMed]
- Yun, L.; Kyusik, Z. Graphene oxide-modified ZnO particles: Synthesis, characterization, and antibacterial properties. Int. J. Nanomed. 2015, 10, 79–92. [Google Scholar]
- Kochmann, S.; Hirsch, T.; Wolfbeis, O.S. The pH dependence of the total fluorescence of graphite oxide. J. Fluoresc. 2012, 22, 849–855. [Google Scholar] [CrossRef] [PubMed]
- Chien, C.T.; Li, S.S.; Lai, W.J.; Yeh, Y.C.; Chen, H.A.; Chen, I.S.; Chen, L.C.; Chen, K.H.; Nemoto, T.; Isoda, S.; et al. Tunable photoluminescence from graphene oxide. Angew. Chem. Int. Ed. 2012, 51, 6662–6666. [Google Scholar] [CrossRef] [PubMed]
- Gong, Y.; Li, D.; Fu, Q.; Pan, C. Influence of graphene microstructures on electrochemical performance for supercapacitors. Prog. Nat. Sci. Mater. Int. 2015, 25, 379–385. [Google Scholar] [CrossRef]
- Kellici, S.; Acord, J.; Ball, J.; Reehal, H.S.; Morgan, D.; Saha, B. A single rapid route for the synthesis of reduced graphene oxide with antibacterial activities. RSC Adv. 2014, 4, 14858. [Google Scholar] [CrossRef]
- Chithiraikumar, S.; Balakrishnan, C.; Neelakantan, M.A. Tuning ligand vicinity towards development of “turn-on” fluorescence for cadmium(II) ions under physiological pH and bio-imaging. Sens. Actuators B Chem. 2017, 249, 235–245. [Google Scholar] [CrossRef]
- Afaneh, A.T.; Schreckenbach, G. Fluorescence Enhancement/Quenching Based on Metal Orbital Control: Computational Studies of a 6-Thienyllumazine-Based Mercury Sensor. J. Phys. Chem. A 2015, 119, 8106–8116. [Google Scholar] [CrossRef] [PubMed]
- Xu, H.; Miao, R.; Fang, Z.; Zhong, X. Quantum dot-based turn-on fluorescent probe for detection of zinc and cadmium ions in aqueous media. Anal. Chim. Acta 2011, 687, 82–88. [Google Scholar] [CrossRef] [PubMed]
- Kim, S.; Shin, D.H.; Kim, C.O.; Kang, S.S.; Kim, J.M.; Choi, S.H.; Jin, L.H.; Cho, Y.H.; Hwang, S.W.; Sone, C. Size-dependent radiative decay processes in graphene quantum dots. Appl. Phys. Lett. 2012, 101, 10–14. [Google Scholar] [CrossRef]
- Li, Q.; Chen, B.; Xing, B. Aggregation Kinetics and Self-Assembly Mechanisms of Graphene Quantum Dots in Aqueous Solutions: Cooperative Effects of pH and Electrolytes. Environ. Sci. Technol. 2017. [Google Scholar] [CrossRef] [PubMed]
- Wu, L.; Liu, L.; Gao, B.; Munoz-Carpena, R.; Zhang, M.; Chen, H.; Zhou, Z.; Wang, H. Aggregation kinetics of graphene oxides in aqueous solutions: Experiments, mechanisms, and modeling. Langmuir 2013, 29, 15174–15181. [Google Scholar] [CrossRef] [PubMed]
- Yang, S.T.; Chang, Y.; Wang, H.; Liu, G.; Chen, S.; Wang, Y.; Liu, Y.; Cao, A. Folding/aggregation of graphene oxide and its application in Cu2+ removal. J. Colloid Interface Sci. 2010, 351, 122–127. [Google Scholar] [CrossRef] [PubMed]
- Park, S.; Lee, K.; Bozoklu, G.; Cai, W.; Nguyen, Ќ.S.T.; Ruoff, R.S. Graphene Oxide Papers Modified by DivalentIons—Enhancing Mechanical Properties via Chemical Cross-Linking. ACS Nano 2008, 2, 572–578. [Google Scholar] [CrossRef] [PubMed]
- Barone, P.W.; Baik, S.; Heller, D.A.; Strano, M.S. Near-infrared optical sensors based on single-walled carbon nanotubes. Nat. Mater. 2005, 4, 86–92. [Google Scholar] [CrossRef] [PubMed]
- Yang, K.; Chen, B.; Zhu, X.; Xing, B. Aggregation, Adsorption, and Morphological Transformation of Graphene Oxide in Aqueous Solutions Containing Different Metal Cations. Environ. Sci. Technol. 2016, 50, 11066–11075. [Google Scholar] [CrossRef] [PubMed]
- Wang, J.; Chen, B. Adsorption and coadsorption of organic pollutants and a heavy metal by graphene oxide and reduced graphene materials. Chem. Eng. J. 2015, 281, 379–388. [Google Scholar] [CrossRef]
- Sitko, R.; Turek, E.; Zawisza, B.; Malicka, E.; Talik, E.; Heimann, J.; Gagor, A.; Feist, B.; Wrzalik, R. Adsorption of divalent metal ions from aqueous solutions using graphene oxide. Dalton Trans. 2013, 42, 5682. [Google Scholar] [CrossRef] [PubMed]
- Gopalakrishnan, A.; Krishnan, R.; Thangavel, S.; Venugopal, G.; Kim, S.J. Removal of heavy metal ions from pharma-effluents using graphene-oxide nanosorbents and study of their adsorption kinetics. J. Ind. Eng. Chem. 2015, 30, 14–19. [Google Scholar] [CrossRef]
- Szabò, T.; Tombacz, E.; Illès, E.; Dèkàny, I. Enhanced acidity and pH-dependent surface charge characterization of successively oxidized graphite oxides. Carbon 2006, 44, 537–545. [Google Scholar] [CrossRef]
- Gu, D.; Fein, J.B. Adsorption of metals onto graphene oxide: Surface complexation modeling and linear free energy relationships. Colloids Surf. A Physicochem. Eng. Asp. 2015, 481, 319–327. [Google Scholar] [CrossRef]
- Yang, X.; Xia, L.; Song, S. Arsenic Adsorption from Water Using Graphene-Based Materials as Adsorbents: A Critical Review. Surf. Rev. Lett. 2017, 24, 1730001. [Google Scholar] [CrossRef]
- Shtepliuk, I.; Khranovskyy, V.; Yakimova, R. Insights into the origin of the excited transitions in graphene quantum dots interacting with heavy metals in different media. Phys. Chem. Chem. Phys. 2017, 19, 30445–30463. [Google Scholar] [CrossRef] [PubMed]
- McNaught, A.W.; Alan, D. Compendium of Chemical Terminology, 2nd ed.; Wiley-Blackwell: Oxford, UK, 2014. [Google Scholar]
- Xue, L.; Liu, C.; Jiang, H. Highly Sensitive and Selective Fluorescent Sensor for Distinguishing Cadmium from Zinc Ions in Aqueous Media. Org. Lett. 2009, 11, 1655–1658. [Google Scholar] [CrossRef] [PubMed]
- Goswami, P.; Das, D.K. A new highly sensitive and selective fluorescent cadmium sensor. J. Fluoresc. 2012, 22, 391–395. [Google Scholar] [CrossRef] [PubMed]


| Sensitizing Ion | Fluorescence Variation | Absorbance Variation |
|---|---|---|
| Cu2+, Pb2+ | decrease | increase |
| As(III) | decrease | steady |
| Cd2+ | increase | steady |
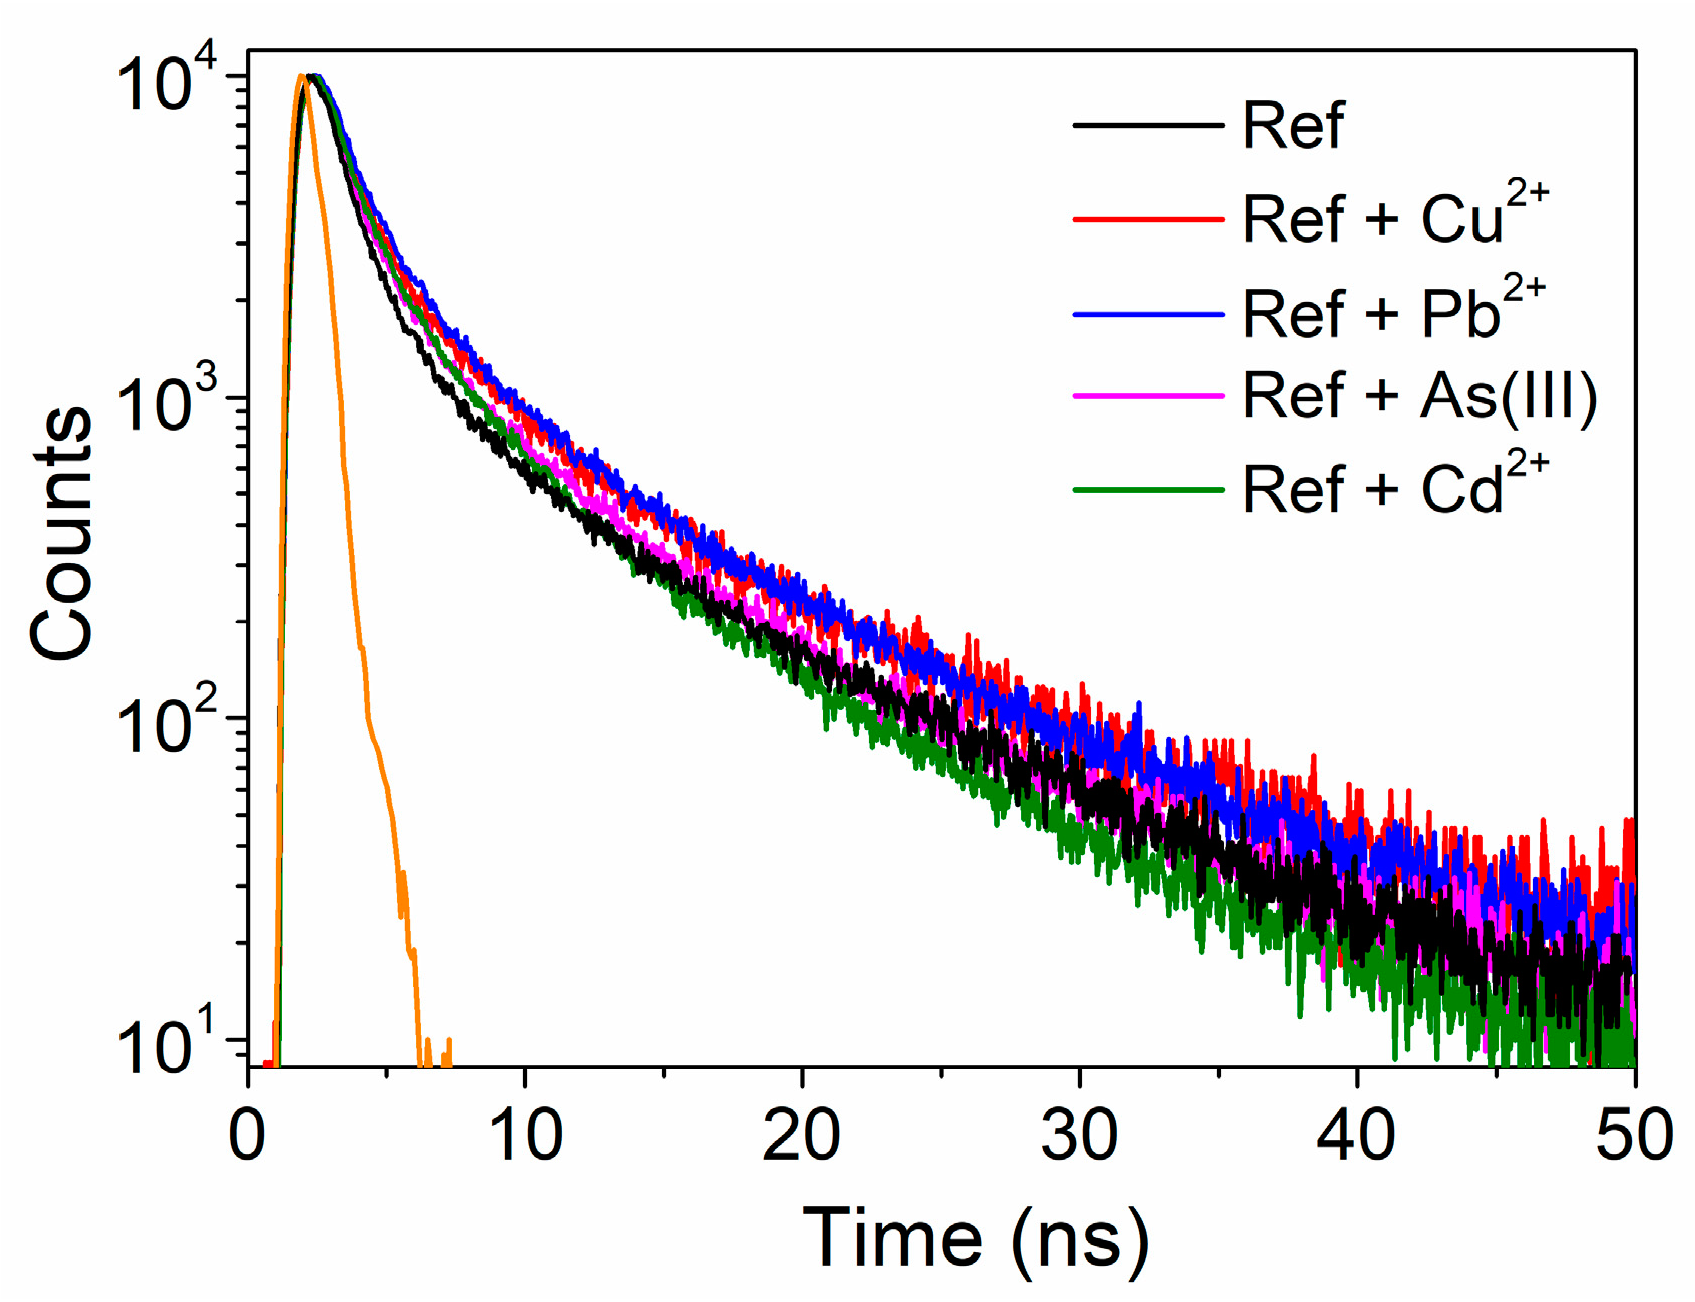
| τ1 (ns) | A1 | τ2 | A2 | τ3 | A3 | |
|---|---|---|---|---|---|---|
| REF | 0.557 | 1 | 2.404 | 1 | 10.30 | 1 |
| Cu2+ | 0.648 | 0.30 | 3.06 | 0.35 | 11.35 | 0.5 |
| Pb2+ | 0.685 | 0.68 | 2.94 | 1.05 | 10.69 | 1 |
| As(III) | 0.602 | 0.45 | 2.99 | 0.55 | 10.30 | 0.6 |
| Cd2+ | 0.629 | 1.37 | 2.74 | 1.90 | 9.55 | 1.5 |
© 2018 by the authors. Licensee MDPI, Basel, Switzerland. This article is an open access article distributed under the terms and conditions of the Creative Commons Attribution (CC BY) license (http://creativecommons.org/licenses/by/4.0/).
Share and Cite
Ciotta, E.; Prosposito, P.; Tagliatesta, P.; Lorecchio, C.; Stella, L.; Kaciulis, S.; Soltani, P.; Placidi, E.; Pizzoferrato, R. Discriminating between Different Heavy Metal Ions with Fullerene-Derived Nanoparticles. Sensors 2018, 18, 1496. https://doi.org/10.3390/s18051496
Ciotta E, Prosposito P, Tagliatesta P, Lorecchio C, Stella L, Kaciulis S, Soltani P, Placidi E, Pizzoferrato R. Discriminating between Different Heavy Metal Ions with Fullerene-Derived Nanoparticles. Sensors. 2018; 18(5):1496. https://doi.org/10.3390/s18051496
Chicago/Turabian StyleCiotta, Erica, Paolo Prosposito, Pietro Tagliatesta, Chiara Lorecchio, Lorenzo Stella, Saulius Kaciulis, Peiman Soltani, Ernesto Placidi, and Roberto Pizzoferrato. 2018. "Discriminating between Different Heavy Metal Ions with Fullerene-Derived Nanoparticles" Sensors 18, no. 5: 1496. https://doi.org/10.3390/s18051496