
Refractive Index Sensor Based on Fano Resonances in Metal-Insulator-Metal Waveguides Coupled with Resonators
by
 , and
, and
Yue Tang
1,†, 
Zhidong Zhang
1,†,
Ruibing Wang
1,
Zhenyin Hai
2,
Chenyang Xue
1,
Wendong Zhang
1 and
Shubin Yan
1,* 1
Science and Technology on Electronic Test and Measurement Laboratory, North University of China, No. 3 Xueyuan Road, Taiyuan 030051, China
2
Ghent University Global Campus, Department of Applied Analytical and Physical Chemistry, Faculty of Bioscience Engineering, 119 Songdo Munhwa-ro, Yeonsu-Gu, Incheon 406-840, Korea
*
Author to whom correspondence should be addressed.
†
These authors contributed equally to this work.
Sensors 2017, 17(4), 784; https://doi.org/10.3390/s17040784
Submission received: 21 February 2017
/
Revised: 25 March 2017
/
Accepted: 4 April 2017
/
Published: 6 April 2017
(This article belongs to the Special Issue Acoustic Wave Resonator-Based Sensors)
Abstract
:A surface plasmon polariton refractive index sensor based on Fano resonances in metal–insulator–metal (MIM) waveguides coupled with rectangular and ring resonators is proposed and numerically investigated using a finite element method. Fano resonances are observed in the transmission spectra, which result from the coupling between the narrow-band spectral response in the ring resonator and the broadband spectral response in the rectangular resonator. Results are analyzed using coupled-mode theory based on transmission line theory. The coupled mode theory is employed to explain the Fano resonance effect, and the analytical result is in good agreement with the simulation result. The results show that with an increase in the refractive index of the fill dielectric material in the slot of the system, the Fano resonance peak exhibits a remarkable red shift, and the highest value of sensitivity (S) is 1125 nm/RIU, RIU means refractive index unit. Furthermore, the coupled MIM waveguide structure can be integrated with other photonic devices at the chip scale. The results can provide a guide for future applications of this structure.
1. Introduction
Surface plasmon polaritons (SPPs) are the charge-density waves caused by coupling between photons and electrons on the metal surface [1,2]. Their fields decay exponentially in the direction perpendicular to the metal–dielectric interface [3,4,5,6,7,8]. As a result, SPPs overcome the diffraction limit of light waves [9,10], rendering them suitable for nanoscale photonic devices [11,12,13,14,15]. Therefore, SPPs constitute a new subject that has attracted considerable attention in related fields [16,17], such as biosensing [18,19], SPP lithography [20], and optical and ultrahigh resolution imaging [21].
Among the SPP waveguides, metal–insulator–metal (MIM) waveguides coupled with resonators have flourished and captured the interest of researchers because they can be easily integrated at the chip scale [22,23]. Recently, with the discovery of Fano resonances in plasmonic waveguide structures, the use of plasmonic structures in Fano resonance-based sensors has become increasingly important in many fields, such as physics [24], chemistry [25], biology [26], and energy and information technology [27]. Therefore, many photonic devices based on Fano resonances have been designed by using the coupling effect between narrow dark modes and broad bright modes and have been used in plasmonic sensors [28,29]. However, plasmonic sensors currently present low sensitivity, which remains a huge challenge for researchers.
In this study, a structure composed of MIM waveguides coupled with ring and rectangular resonators is proposed for plasmonic refractive index sensors [30]. A finite-element method (FEM) with perfectly matched layer (PML) absorbing boundary condition is adopted to investigate the properties of the transmission spectra and the refractive index sensing. The magnetic field (Hz) distributions in this structure are analyzed. In addition, the effects of the structural parameters of the plasmonic coupling system on the Fano resonance are investigated. The function of the shift of the Fano resonance peaks with the refractive index of the fill dielectric is examined.
2. Structural Model and Analytical Method
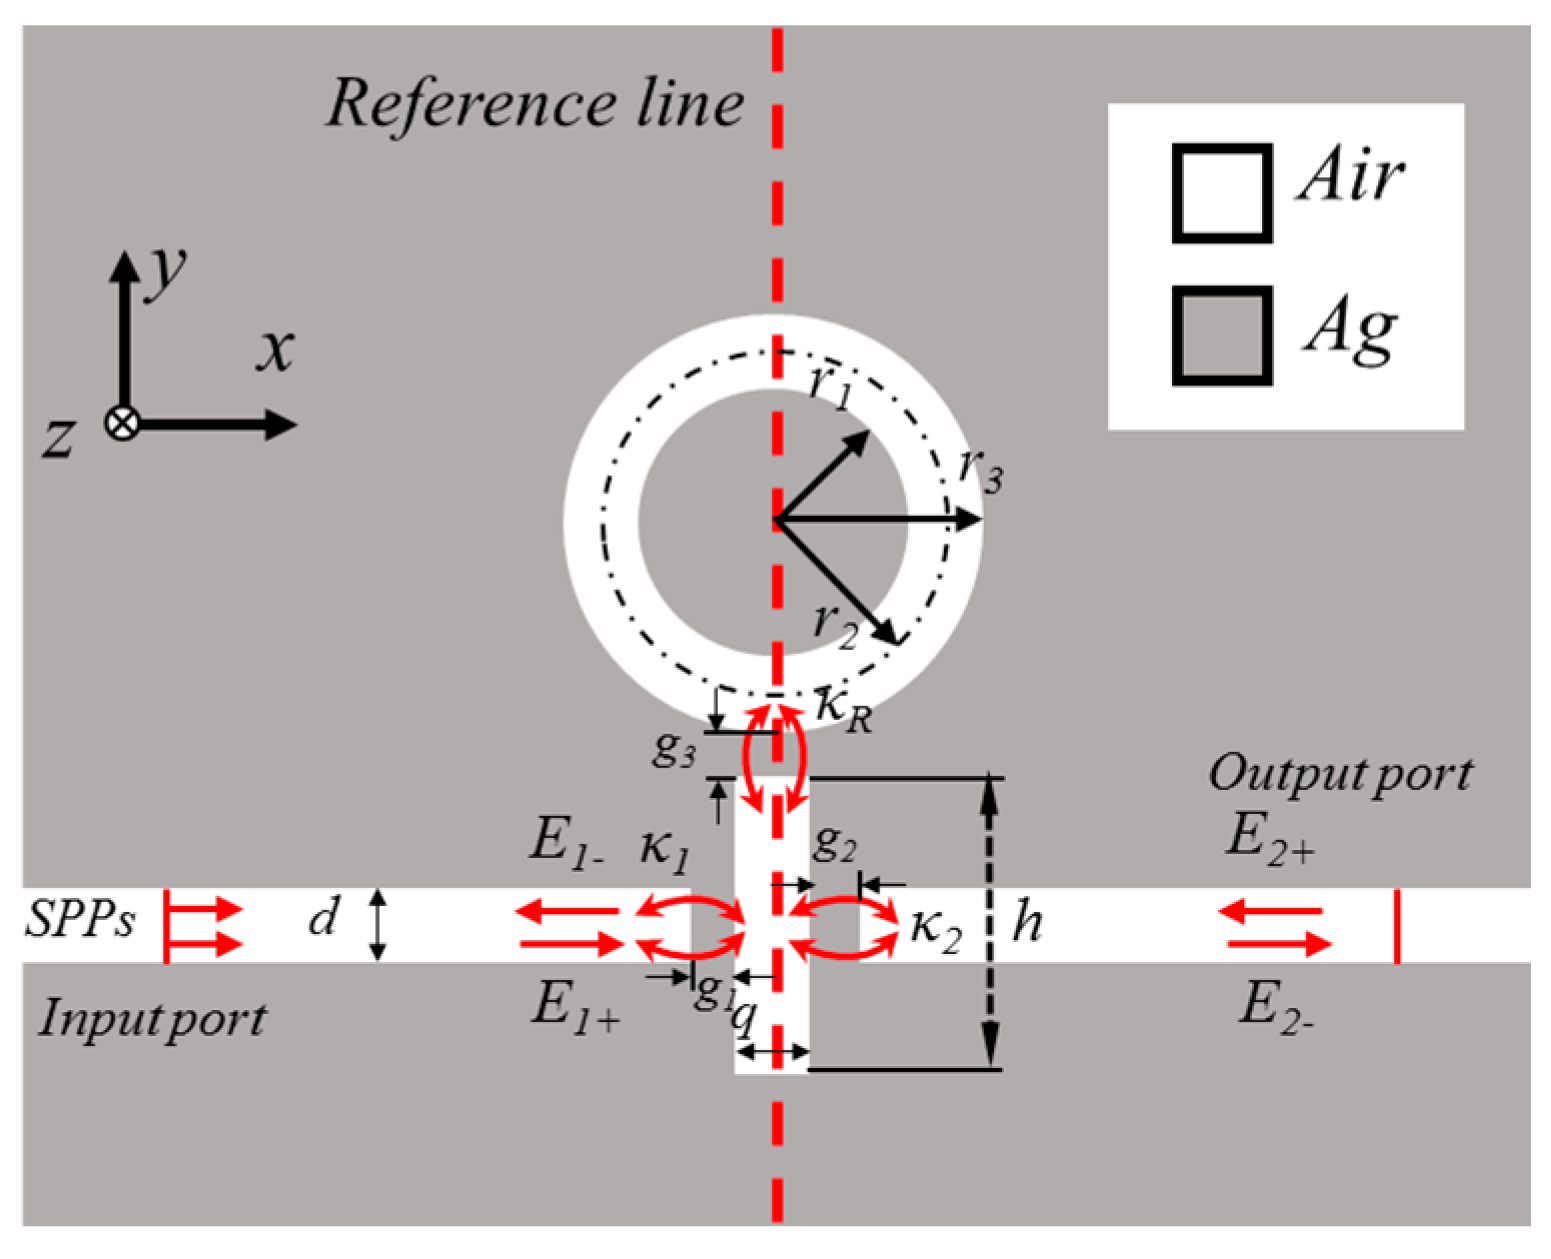
A schematic of the proposed refractive index sensor is shown in Figure 1. The sensor is composed of two MIM waveguides, a rectangular resonator, and a ring resonator. The gray and white areas represent the silver (εm) layer and dielectric (εs), respectively. The widths of the MIM waveguides, ring cavity, and rectangular cavity are fixed at 50 nm to ensure that only the fundamental transverse magnetic (TM0) mode is supported in the MIM waveguides [31]. In Figure 1, g1, g2, and g3 are the coupling distances between the input MIM waveguide and rectangular cavity, between the rectangular cavity and output MIM waveguide, and between the rectangular cavity and ring cavity, respectively. The input and output ports are in the right and left MIM waveguides. The central radius of the ring cavity is r2 = (r1 + r3)/2; h and q are the height and width of the rectangular cavity, respectively; and n is the refractive index of the fill dielectric.
The transmission characteristics of the MIM waveguides coupled with rectangular and ring cavities are simulated by FEM. PMLs were utilized to simulate the top and bottom boundaries of the structure.
The permittivity of Ag can be described by Debye–Drude dispersion mode [31,32]:
where ε∞ = 3.8344 and εs = −9530.5 are the infinite frequency permittivity and the static permittivity, respectively; τ = 7.35 × 10⁻¹⁵ s is the relaxation time; and σ = 1.1486 × 10⁷ S/m is the conductivity of Ag.
The TM0 model of the MIM waveguide can be expressed as follows [33]:
where k = 2π/λ is the wave vector in the waveguide, d is the width of each MIM waveguide, p = εin/εm (εin and εm are the dielectric of the insulator and metal, respectively), and ac = [k02(εin − εm) + k2]1/2, k0 is the wave vector in free space. The transmission wavelengths can be derived on the basis of standing wave theory as follows [34,35]:
where Re(neff)—which is the real part of the effective refractive index of a wavelength in the MIM waveguide—can be derived by Equation (4). In Equations (3) and (4), L is the perimeter of the rectangular cavity or ring cavity, Ψr is the phase shift of the beam reflected at one end of the cavity.
In this section, the MIM waveguides coupled with the rectangular and ring cavities are analyzed on the basis of temporal coupled-mode theory [36]. To explain the Fano resonance phenomenon, we introduce certain parameters; namely, the SPP wave of the cavity (Ej ± (j = 1, 2)) and the coupling coefficients between the input MIM waveguide and rectangular cavity (κ1), between the rectangular cavity and ring cavity (κ2), and between the output MIM waveguide and the rectangular cavity (κ3). When a certain optical wave with ω frequency is inputted on the input port of the waveguide (E2+ = 0), the time evolution amplitudes AS and AR of the waveguides of the rectangular and ring cavities, respectively, can be derived as follows [32,37,38]:
where j is the imaginary unit (j2 = −1) and ωs and ωR are the resonance frequencies of the rectangular and ring cavities, respectively. In accordance with the energy conservation law, the amplitude of the input and output optical waves in the coupled waveguides are derived by
Transmittance T can be expressed as follows:
where ω is frequency of incident wave and ω = c/λ. When κ1 = 0.6, κ2 = 0.24, and κ3 = 0.14, we get the appropriate fitting curve by the mathematical software.
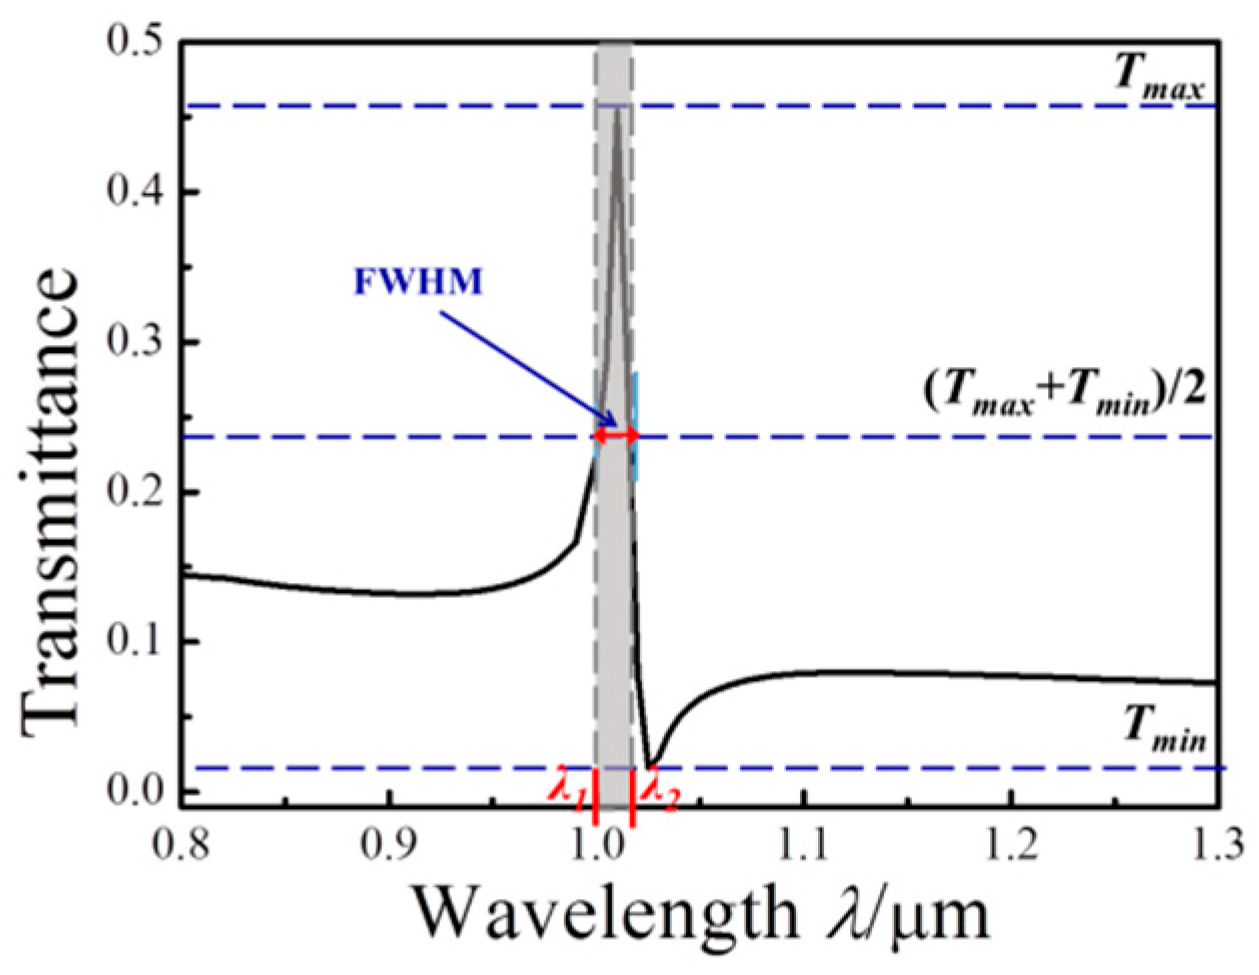
Additionally, FWHM is full width at half maximum, as shown in Figure 2, which can be expressed as follows:
where λ1 and λ2 are the values on the transmission spectrum at which the transmissivity value is (Tmax + Tmin)/2. Tmax and Tmin are the peak and valley values of the transmissivity, respectively.
3. Results and Discussion
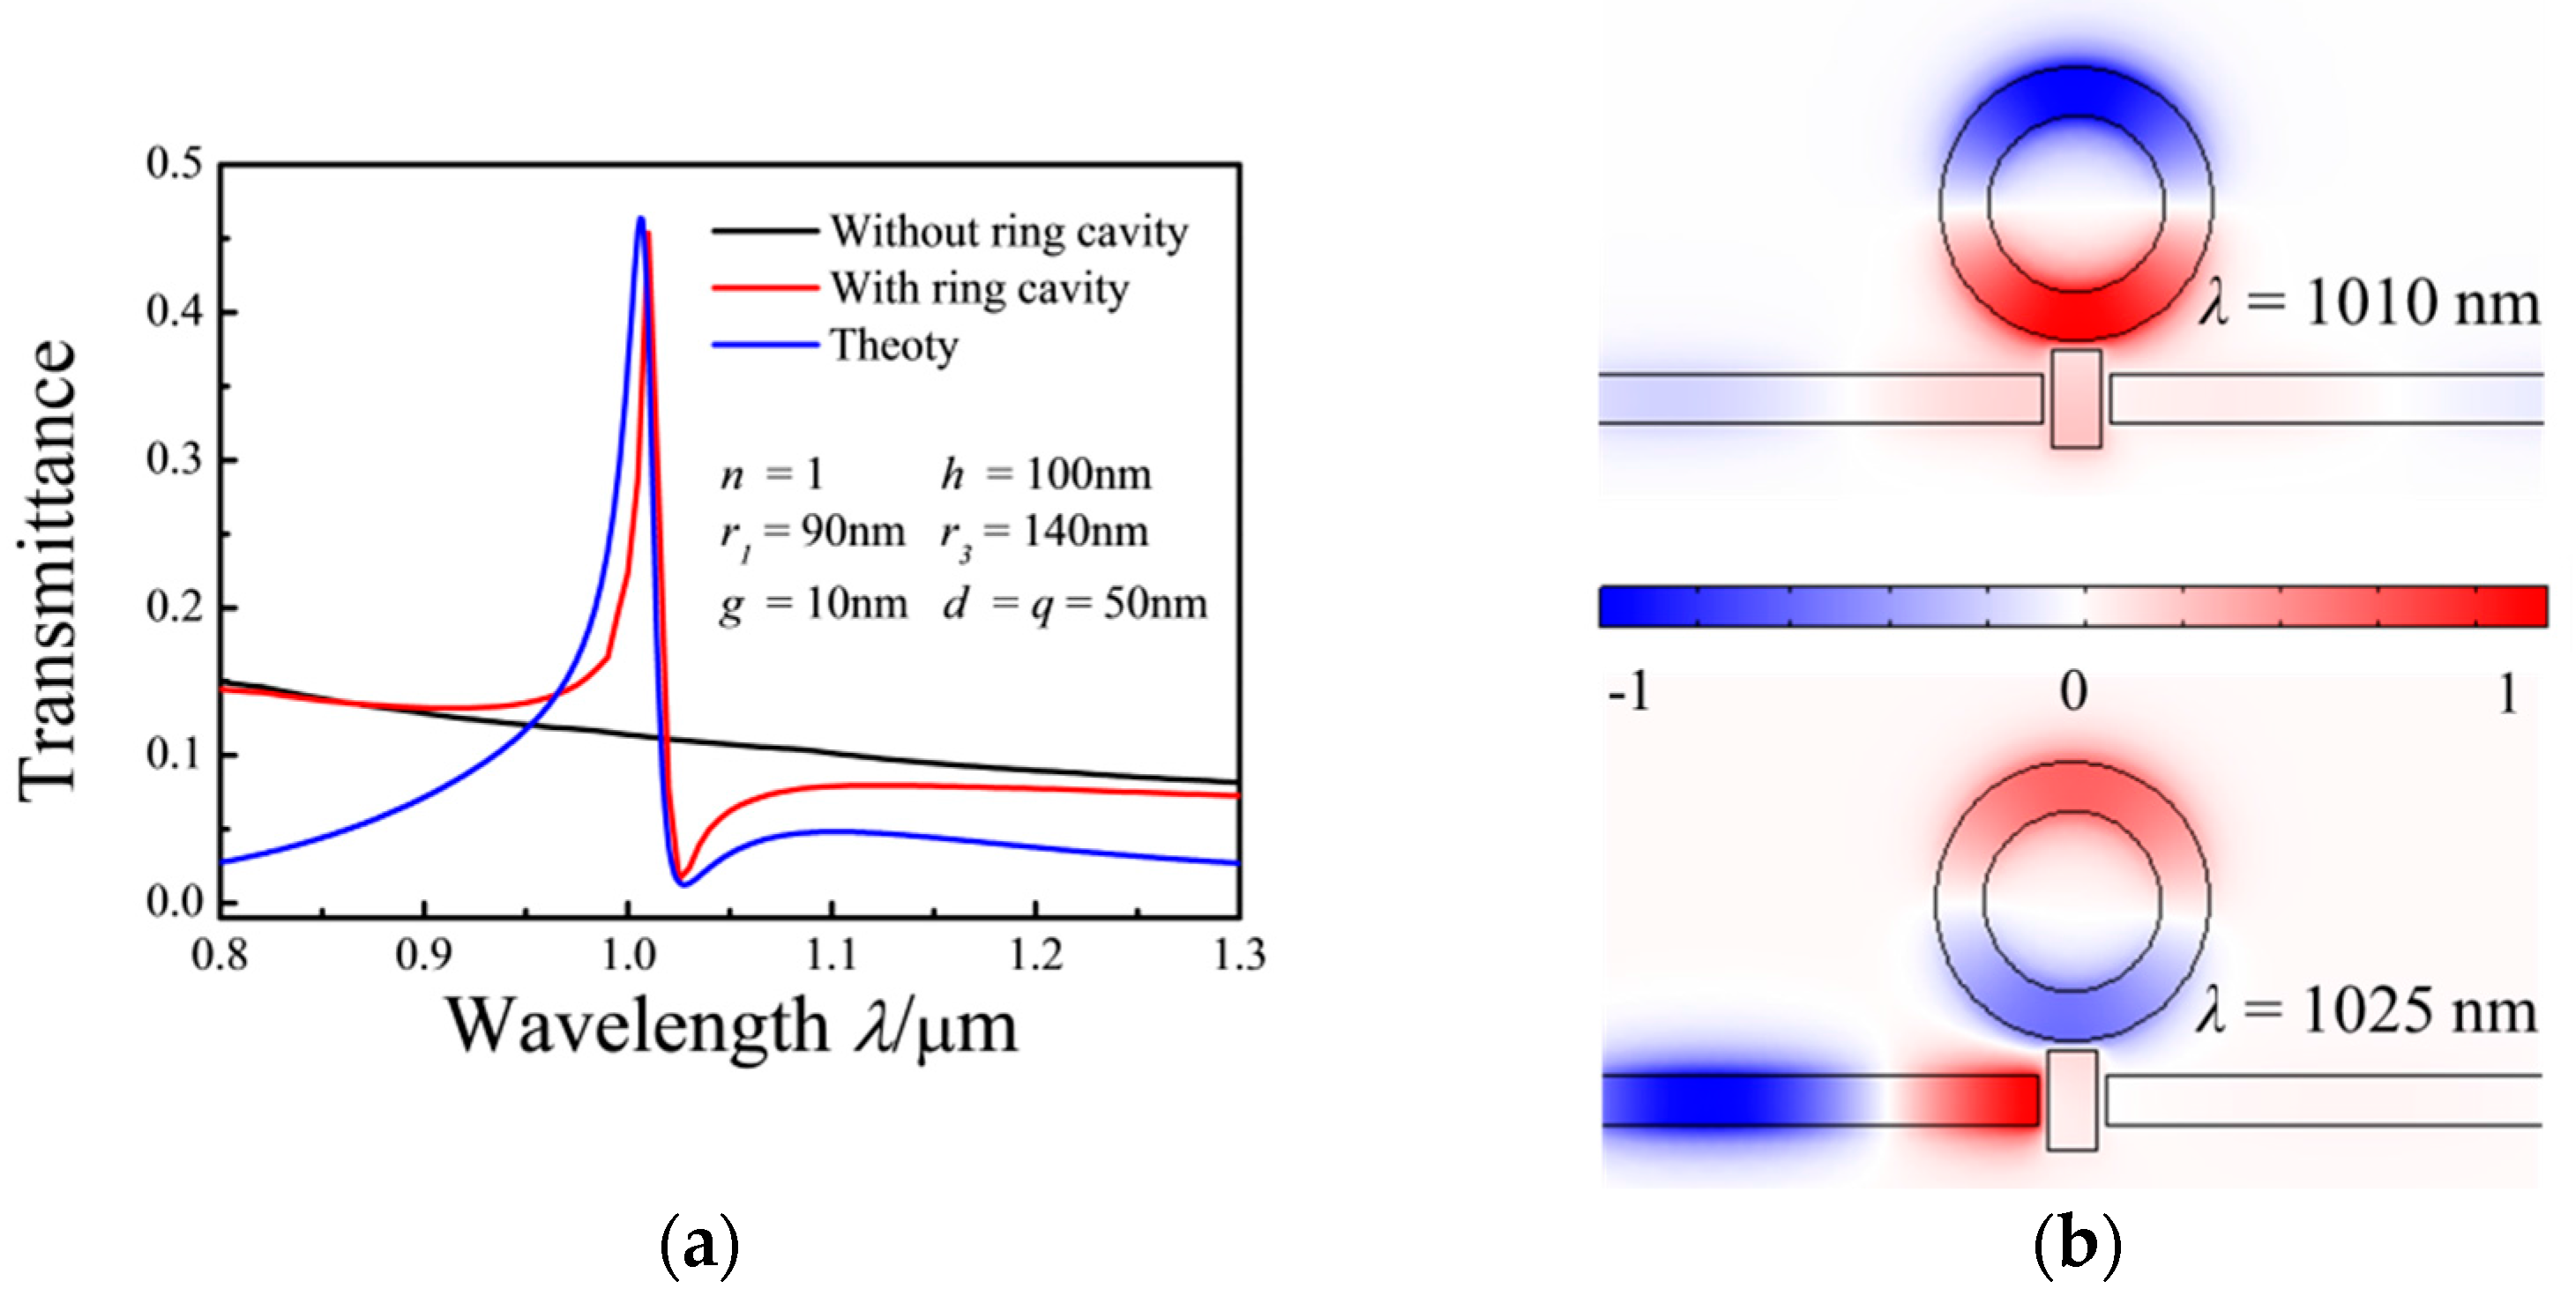
In this section, the transmission spectra of the MIM waveguides are simulated under varying parameters of the structure. The properties of the transmission spectra can be tuned by these parameters. Figure 3a shows the transmission spectra of the structures with and without a ring cavity. The structure without a ring cavity exhibits low transmittance along a linear curve (black solid curve) with a negative slope. When the MIM waveguides are coupled with both a ring resonator and a rectangular resonator, a peak and a dip exist in the asymmetrical transmission spectrum (red solid curve). The red curve shows a Fano resonance in the MIM waveguide. The blue solid curve is obtained by solving Equation (8), which is in good agreement with the simulation results.
Figure 3b shows the steady-state magnetic field Hz distributions at the points of the peak (λ = 1010 nm) and dip (λ = 1025 nm) of the MIM waveguides coupled with ring and rectangular cavities. At the peak position (λ = 1010 nm), an in-phase relationship exists between the lower parts of the ring resonator and rectangular resonator, whereas an anti-phase relationship is evident between the lower and upper parts of the ring resonator. However, at the dip position (λ = 1025 nm), anti-phase relationships exist between the lower parts of the ring resonator and rectangular resonator and between the lower and upper parts of the ring resonator. According to Equations (1)–(4), the effective SPP wavelength, λspp = λ/Re(neff), for λ = 1010 nm is 720 nm. At λ = 1010 nm, 2πr2/λspp ≈ 1 for the ring resonator, and 2(h + p)/λspp ≈ 0.42 for the rectangular resonator. These results show that λspp = 720 nm meets the wave resonance condition of the ring resonator, but does not meet that of the rectangular resonator, which agrees with the numerical results shown in the top image in Figure 3b. Thus, linear and narrow asymmetrical spectra and hybrid and destructive patterns are simultaneously observed between the nonradiative and superradiative modes because of the nonradiative mode and superradiative mode overlap in the spectra.
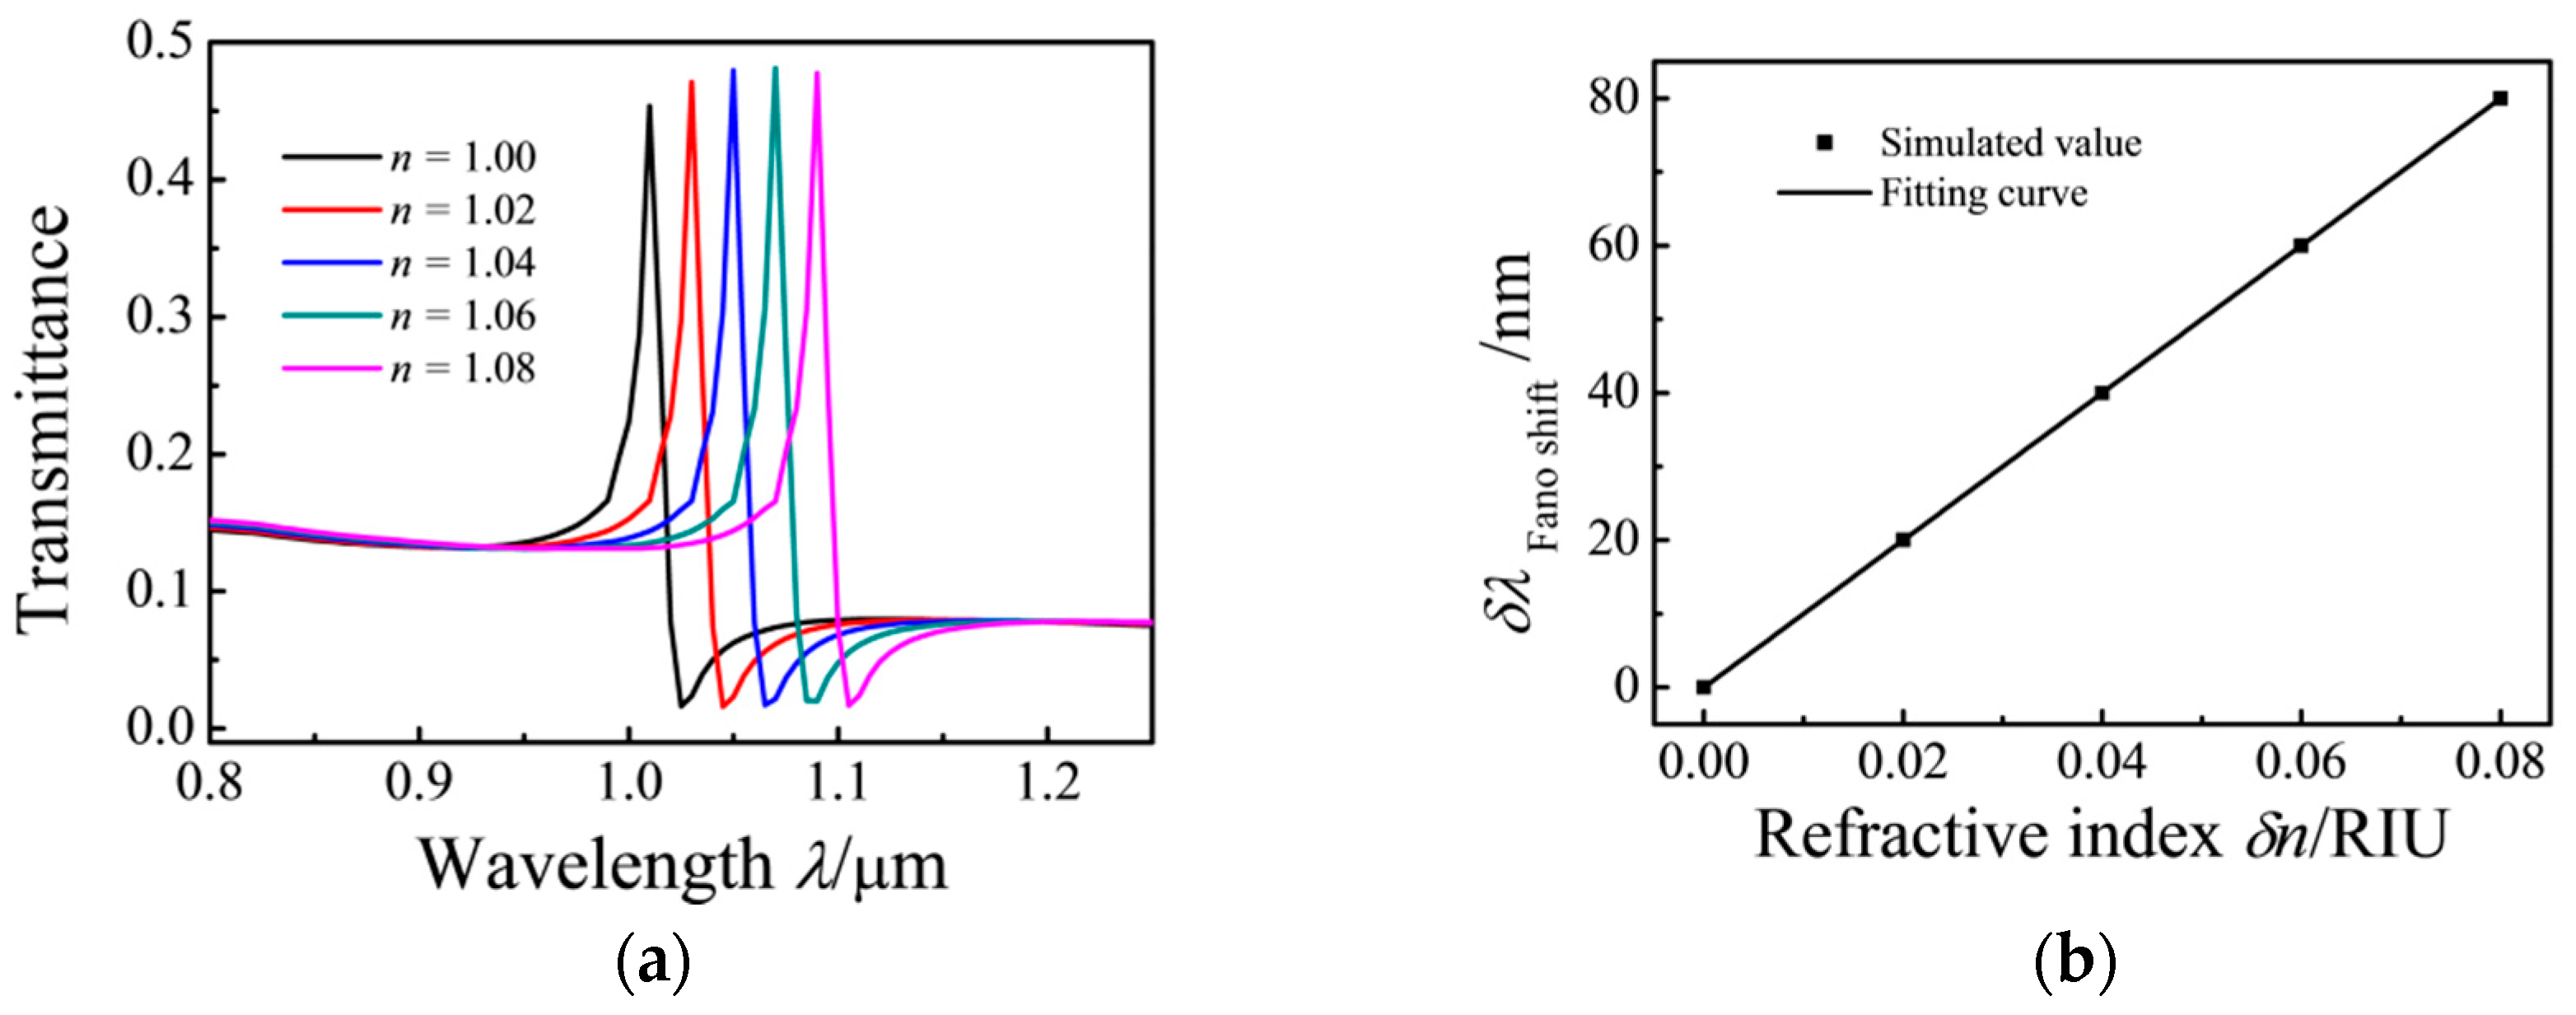
The transmission spectra are simulated using different filling media to investigate the effect of the refractive index (n) on the MIM waveguide. The refractive index, n, is increased from 1 to 1.08 at intervals of 0.02 RIU. The simulation results show that the transmission spectrum exhibits a red shift with an increase in n. When the effective refractive index Re(neff) is increased, the Fano resonance peaks demonstrate a red shift with an increase in n. Figure 4a shows the shift of the Fano resonance peaks with increasing n. The relationship of the peak shift with δn is shown in Figure 4b. The sensitivity (S) of the refractive index sensor is δλ/δn = 1000 nm/RIU, and the figure of merit (FOM) of the proposed sensor is FOM = S/FWHM = 63 [39].
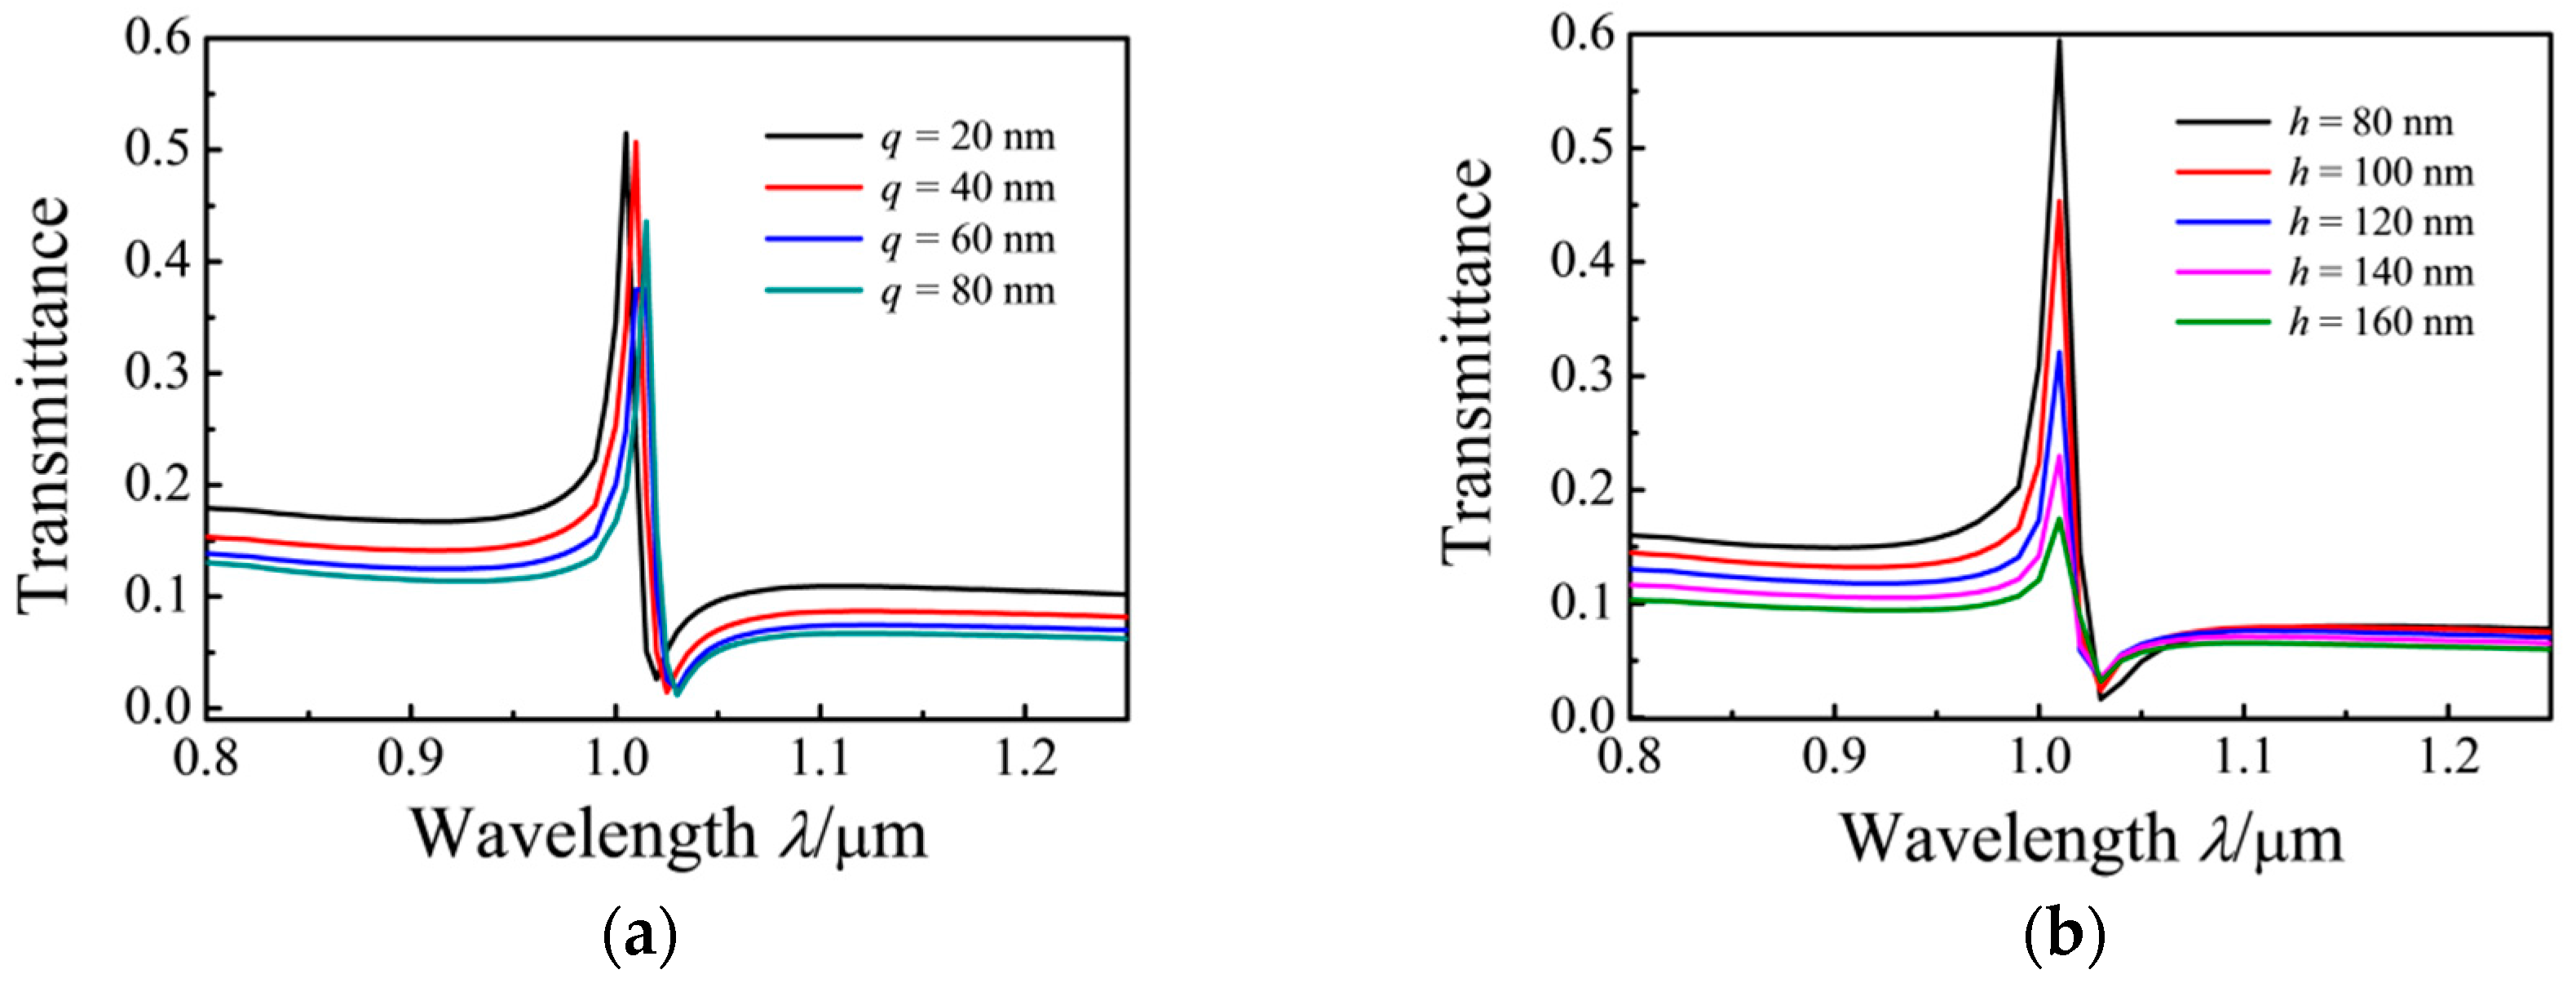
For the investigation of the effect of the different widths of the rectangular cavity on the Fano resonance of the MIM waveguide, q is varied from 20 nm to 80 nm at intervals of 20 m with n = 1, r1 = 90 nm, r2 = 115 nm, r3 = 140 nm, h = 100 nm, and g1 = g2 = g3 = 10 nm. The structure of the MIM waveguide is symmetrical about the reference line. With the increasing width of the rectangular cavity, red shifts in the transmission spectrum are observed, as shown in Figure 5a. As the width increases, the value of L is increased. This outcome can be explained by Equations (3) and (4). The effect of the height of the rectangular cavity on the transmission characteristics is investigated by varying this parameter from 80 nm to 160 nm at intervals of 20 nm, with n = 1, r1 =90 nm, r2 = 115 nm, r3 = 140 nm, d = 50 nm, and g1 = g2 = g3 = 10 nm. The spectra show that the transmission rate remarkably decreased with increasing h, as shown in Figure 5b. With the increased volume of the rectangular cavity, the light energy confined in the ring cavity and the rectangular cavity is increased.
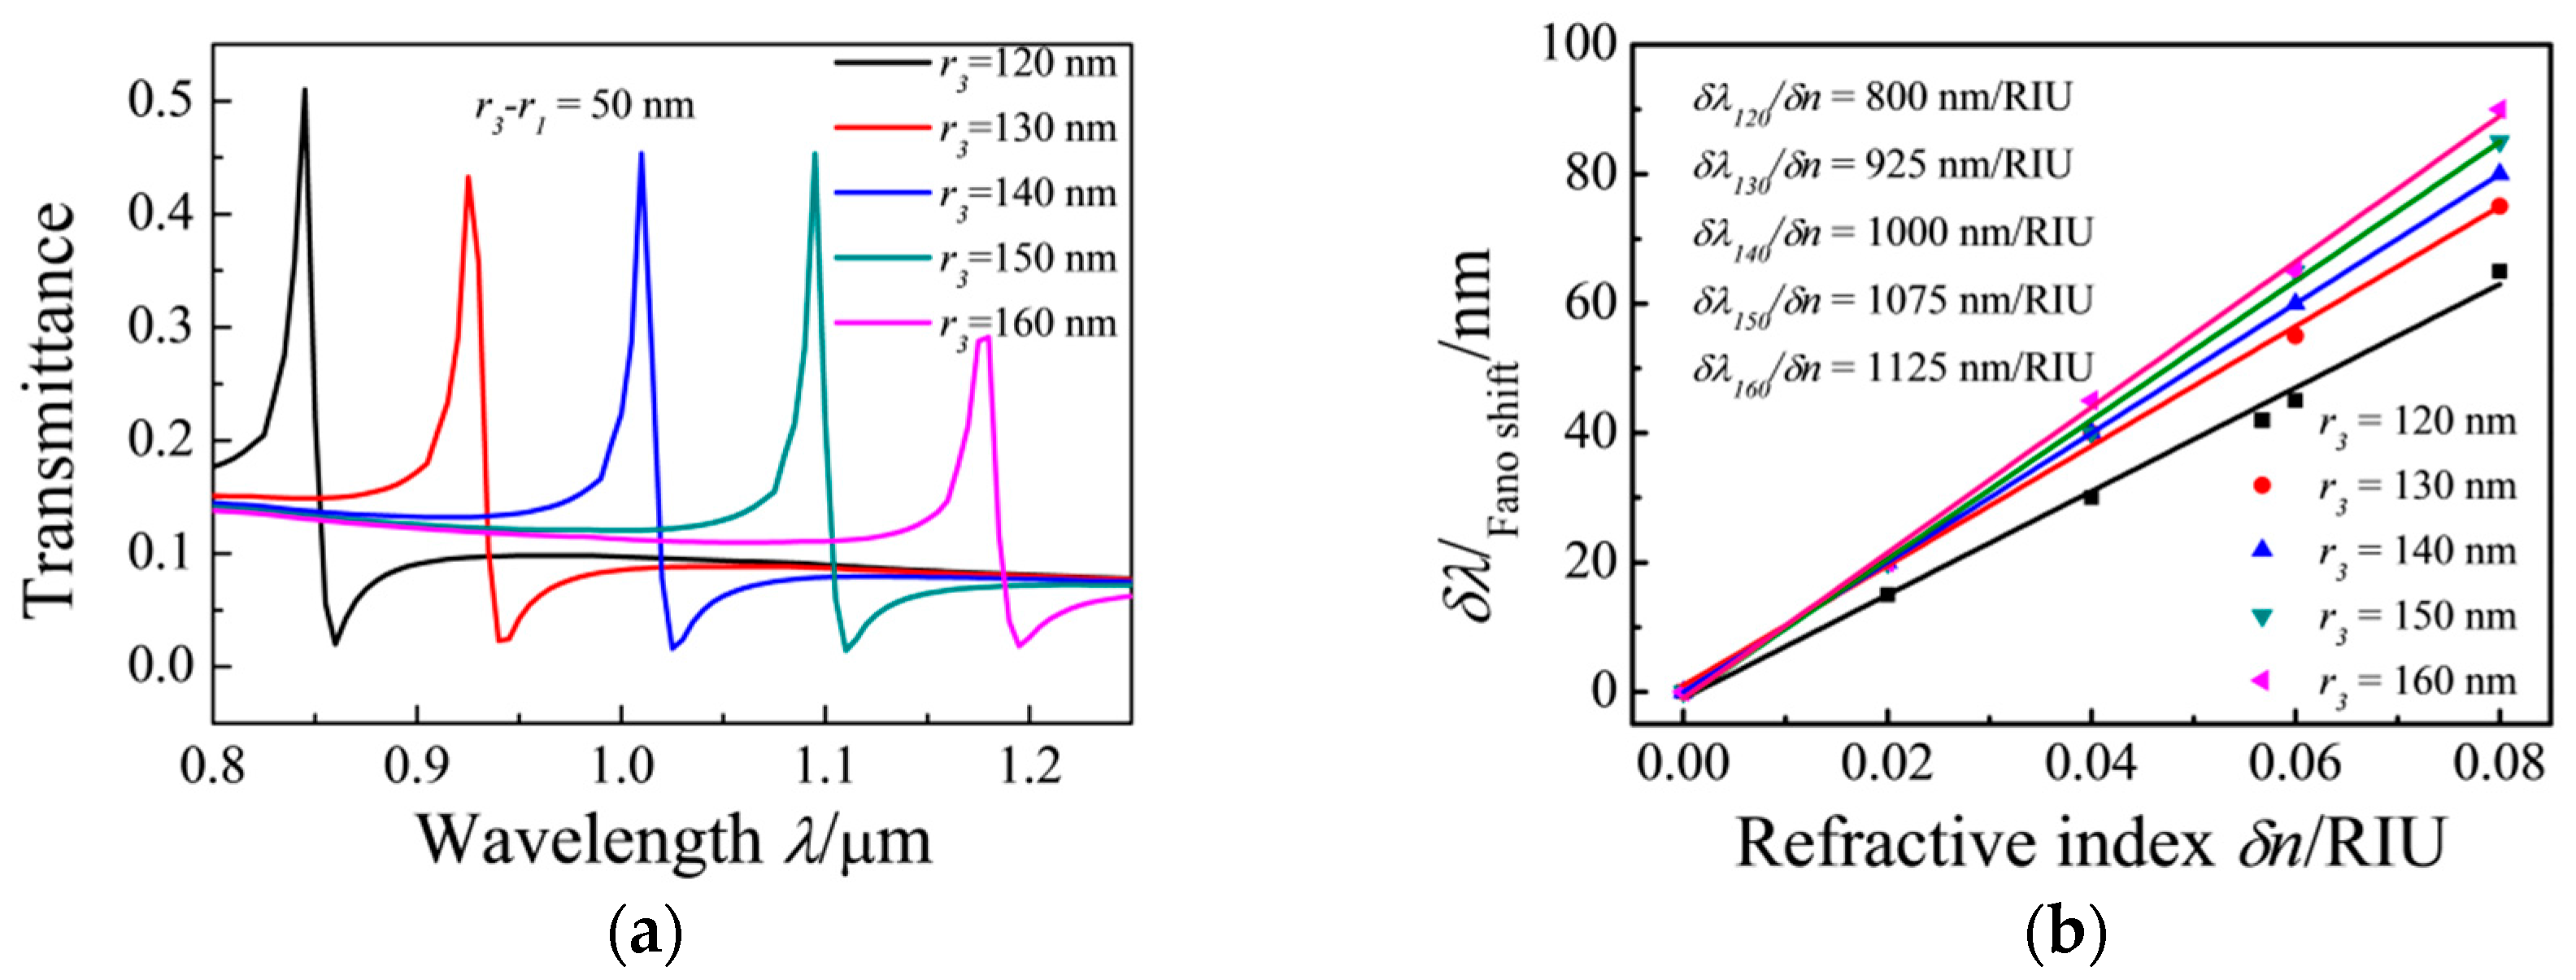
The radius of the ring cavity was changed to study its effect on the transmission rate. The simulation results show that the transmission spectrum exhibits a remarkable red shift with the increasing radius of the ring cavity. The effective refractive index Re(neff) increases with an increase in the radius of the ring resonator, and the Fano resonance peak exhibits a red shift. Re(neff) decreases with a decrease in the radius of the ring resonator. Figure 6a shows the shifts in the Fano resonance peaks as r1 and r3 increase simultaneously. Figure 6b shows the shift in the Fano resonance peak as a function of the refractive index change (δn). The results show that with an increase in the radius of the ring cavity, the sensitivity of the MIM waveguide increases from δλ/δn = 800 nm/RIU (r3 = 120 nm) to δλ/δn = 1125 (r3 = 160 nm) and its FOM = 75. Therefore, the sensitivity of the MIM waveguides increases with an increase in the radius of the ring resonator, which causes peak position change [40,41].
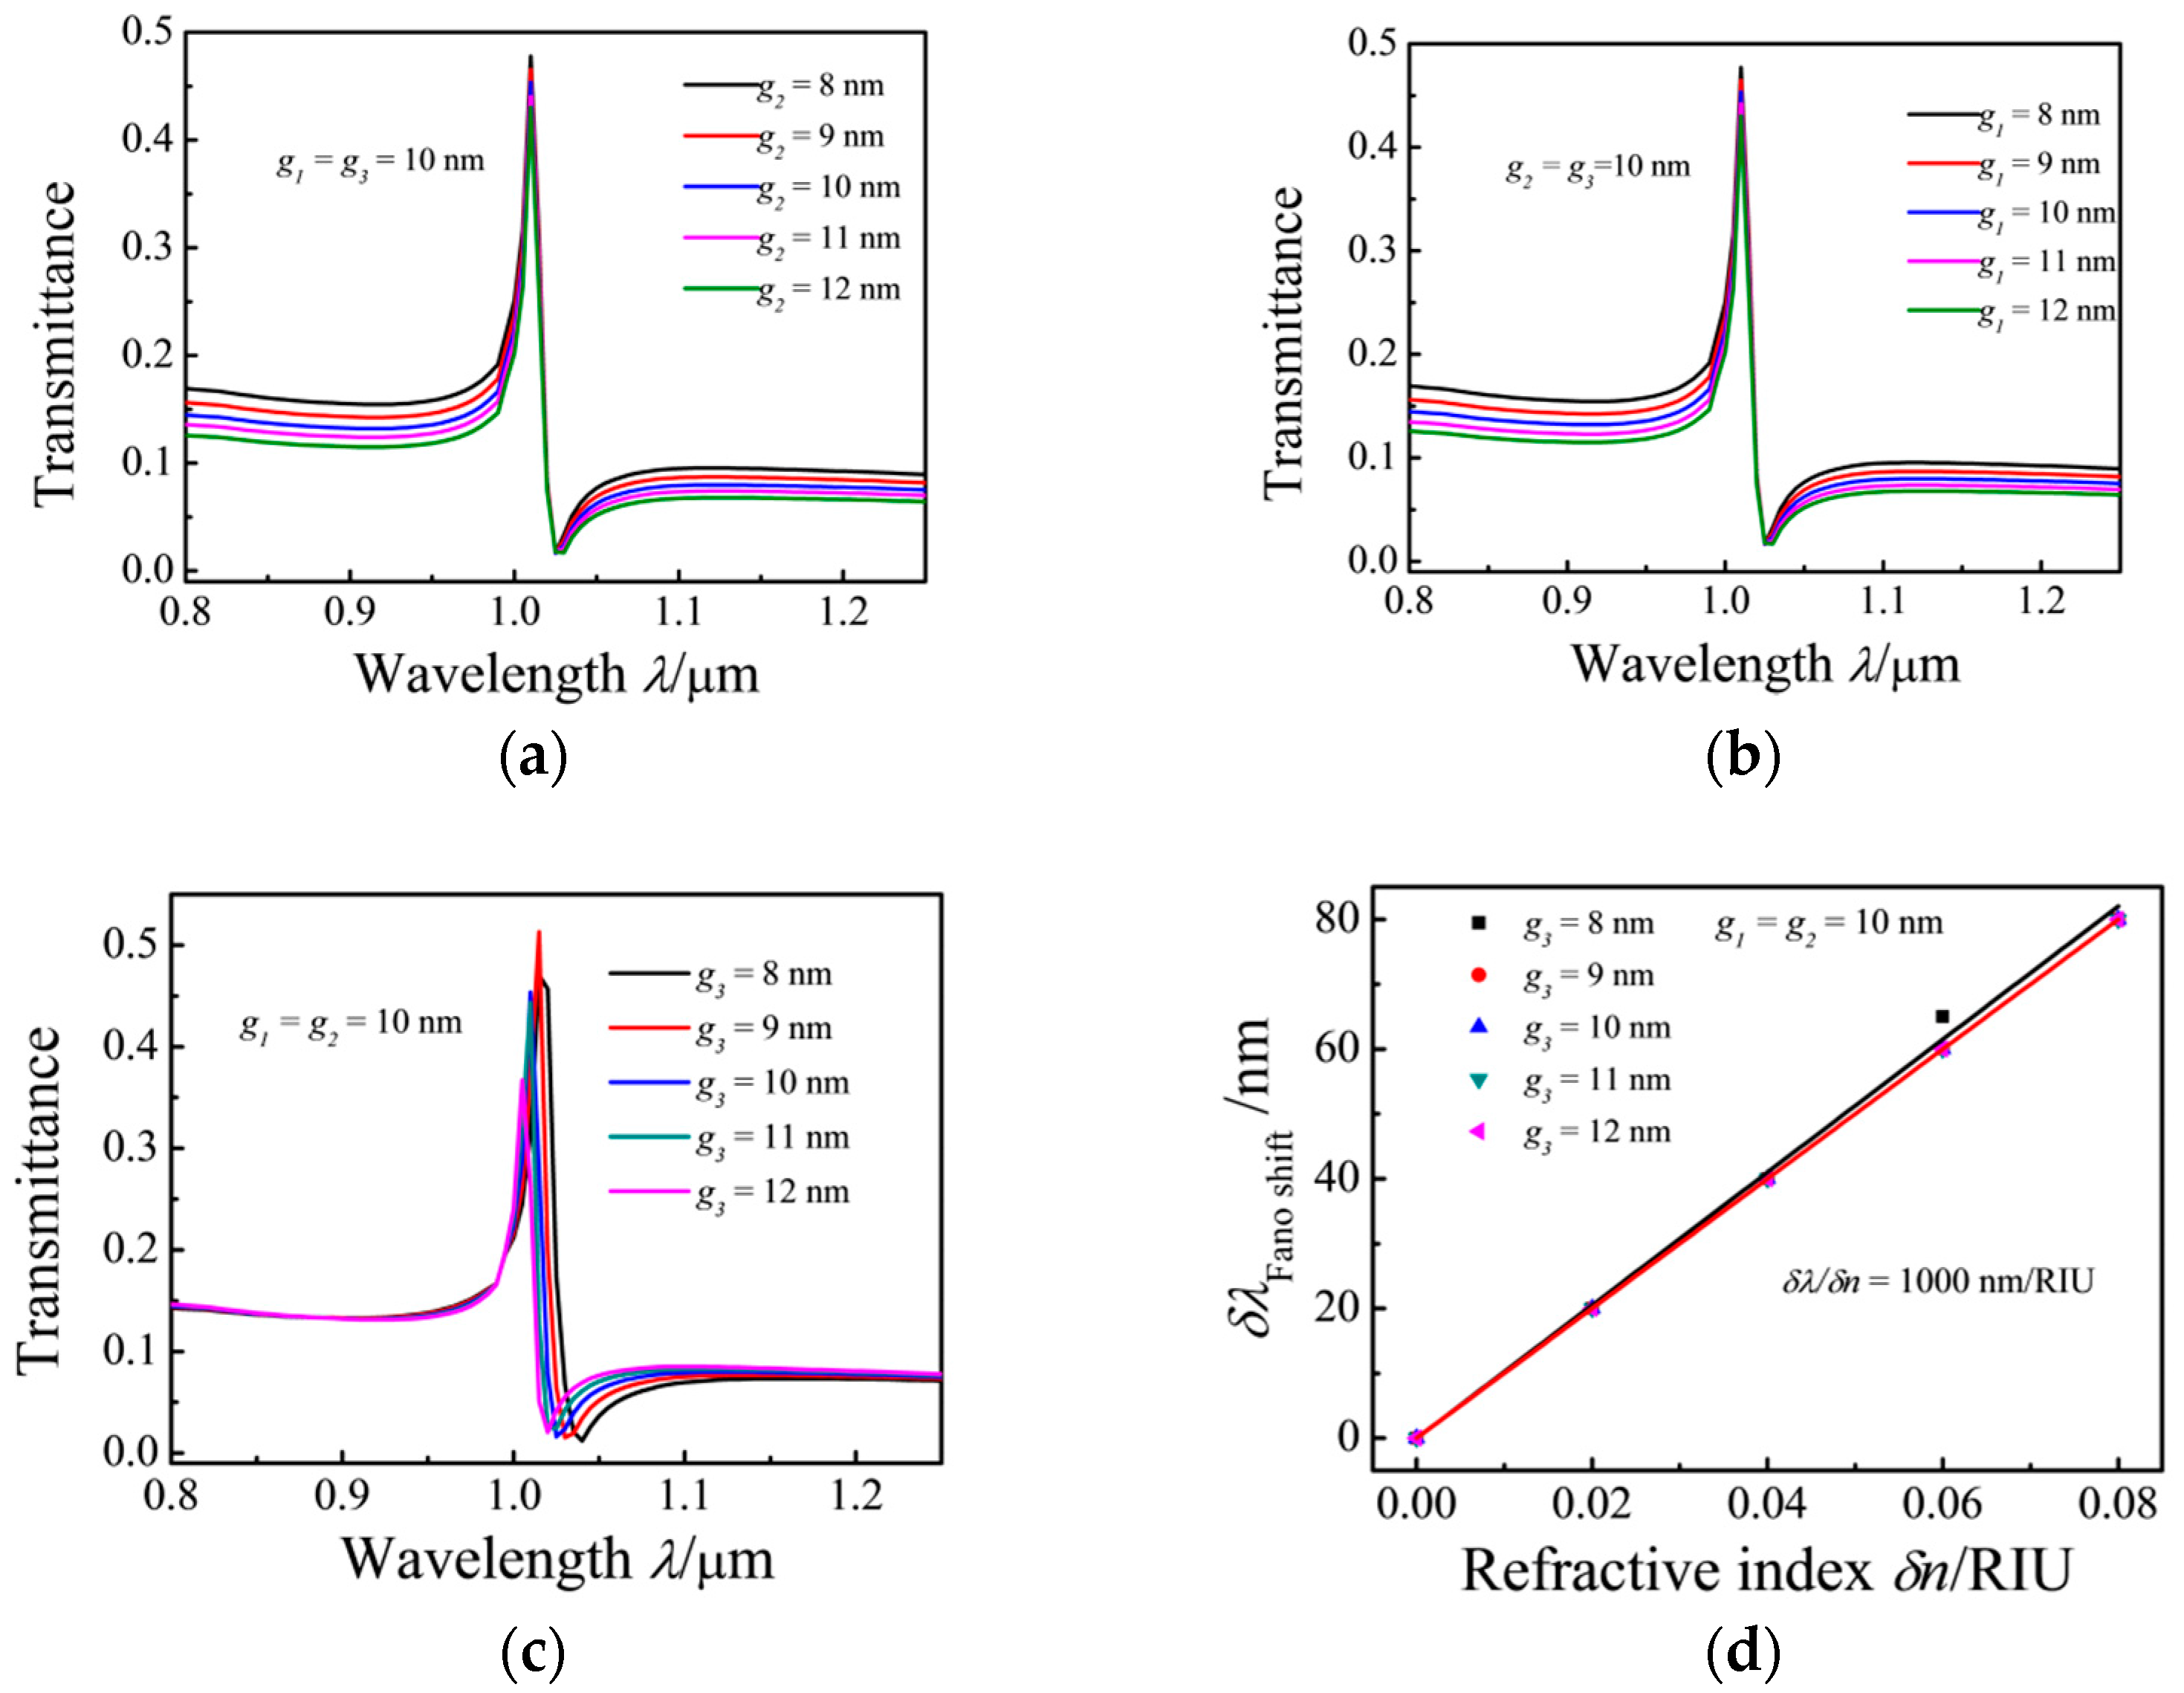
Furthermore, the effects of the coupling distances are studied. In the simulation of the effects of coupling distances g1, g2, or g3, the studied parameter is changed while the other two parameters are kept constant. Figure 7a,b show that with the increasing coupling gap between the rectangular resonator and the input MIM waveguide, the energy confined in the structure increases. Figure 7c shows that the transmission spectra exhibit a blue shift as the coupling gap g3 between the ring cavity and rectangular cavity is increased while the other parameters are fixed at g1 = g2 =10 nm, h = 50 nm, d = 50 nm, r1 = 90 nm, and r3 = 140 nm. Figure 7d shows the function of the Fano peak shift with the refractive index change (δn); the results show that δλ/δn remains constant at 1000 nm/RIU.
4. Conclusions
A plasmonic refractive index sensor based on MIM waveguides coupled with rectangular and ring resonators is studied by FEM. The transmission spectra show that the Fano resonance peak that relies on the refractive index of the materials and the perimeter of the ring resonator. With an increase in the ring cavity perimeter and the refractive index, the Fano resonance peak exhibits a red shift. The refractive index sensitivity of the sensor can reach 1125 nm/RIU. In addition, the unit-cell plasmonic structures can be easily integrated with other photonic devices at the chip scale.
Acknowledgments
This work was supported by the National Natural Science Foundation of China (Grant Nos. 61605177, and 61675185), the National Science Fund for Distinguished Young Scholars (Grant No. 61525107), the Natural Science Foundation of Shanxi Province (Grant No. 201601D011008), the Natural Science Research Foundation of the North University of China (Grant No. 110246). Partly, this work was supported by Open Research Fund Program of Hebei Collaborative Innovation Center for Aerospace Remote Sensing Information Processing and Application. Shu-Bin Yan thanks the Fund Program for the Scientifc Activities of Selected Returned Overseas Professionals in Shanxi Province, the Program for the Top Young and Middle-Aged Innovative Talents of Higher Learning Institutions of Shanxi, and the North University of China Science Fund for Distinguished Young Scholars.
Author Contributions
Yue Tang and Zhidong Zhang designed the simulations and wrote the paper; Ruibing Wang and Zhenyin Hai analyzed the data; Shubin Yan revised the paper; Chenyang Xue and Wendong Zhang contributed the analysis tools.
Conflicts of Interest
The authors declare no conflict of interest.
References
- Barnes, W.L.; Dereux, A.; Ebbesen, T.W. Surface plasmon subwavelength optics. Nature 2003, 424, 824–830. [Google Scholar] [CrossRef] [PubMed]
- Haddouche, I.; Lynda, C. Comparison of finite element and transfer matrix methods for numerical investigation of surface plasmon waveguides. Opt. Commun. 2017, 382, 132–137. [Google Scholar] [CrossRef]
- Zayats, A.V.; Smolyaninov, I.I.; Maradudin, A.A. Nano-optics of surface plasmon polaritons. Phys. Rep. 2005, 408, 131–314. [Google Scholar] [CrossRef]
- Prasad, P.N. Nanophotonics; John Wiley & Sons: Hoboken, NJ, USA, 2004. [Google Scholar]
- Brongersma, M.L.; Pieter, K.G. Surface Plasmon Nanophotonics; Springer: Dordrecht, The Netherlands, 2007. [Google Scholar]
- Lu, H.; Liu, X.; Mao, D. Plasmonic nanosensor based on Fano resonance in waveguide-coupled resonators. Opt. Lett. 2012, 37, 3780–3782. [Google Scholar] [CrossRef] [PubMed]
- Chen, Z.; Yu, L. Multiple fano resonances based on different waveguide modes in a symmetry breaking plasmonic system. IEEE Photonics J. 2014, 6, 1–8. [Google Scholar] [CrossRef]
- Piao, X.; Yu, S.; Park, N. Control of Fano asymmetry in plasmon induced transparency and its application to plasmonic waveguide modulator. Opt. Express 2012, 20, 18994–18999. [Google Scholar] [CrossRef] [PubMed]
- Falk, A.L.; Koppens, F.H.L.; Yu, C.L.; Kang, K.; de Leon Snapp, N.; Akimov, A.V.; Jo, M.-H.; Lukin, M.D.; Park, H. Near-field electrical detection of optical plasmons and single-plasmon sources. Nat. Phys. 2009, 5, 475–479. [Google Scholar] [CrossRef]
- Gramotnev, D.K.; Bozhevolnyi, S.I. Plasmonics beyond the diffraction limit. Nat. Photonics 2010, 4, 83–91. [Google Scholar] [CrossRef]
- Nehl, C.L.; Liao, H.; Hafner, J.H. Optical properties of star-shaped gold nanoparticles. Nano Lett. 2006, 6, 683–688. [Google Scholar] [CrossRef] [PubMed]
- Shao, L.; Ruan, Q.; Jiang, R.; Wang, J. Macroscale Colloidal Noble Metal Nanocrystal Arrays and Their Refractive Index-Based Sensing Characteristics. Small 2014, 10, 802–811. [Google Scholar] [CrossRef] [PubMed]
- Zhou, N.; Ye, C.; Polavarapu, L.; Xu, Q.-H. Controlled preparation of Au/Ag/SnO2 core–shell nanoparticles using a photochemical method and applications in LSPR based sensing. Nanoscale 2015, 7, 9025–9032. [Google Scholar] [CrossRef] [PubMed]
- Dahlin, A.B. Plasmonic Biosensors: An Integrated View of Refractometric Detection; IOS Press: Amsterdam, The Netherlands, 2012. [Google Scholar]
- Ma, Y.; Farrell, G.; Semenova, Y.; Wu, Q. Hybrid nanowedge plasmonic waveguide for low loss propagation with ultra-deep-subwavelength mode confinement. Opt. Lett. 2014, 39, 973–976. [Google Scholar] [CrossRef] [PubMed]
- Chen, Z.; Wang, W.; Cui, L.; Yu, L.; Duan, G.; Zhao, Y.; Xiao, J. Spectral splitting based on electromagnetically induced transparency in plasmonic waveguide resonator system. Plasmonics 2014, 10, 721–727. [Google Scholar] [CrossRef]
- Wen, K.; Hu, Y.; Chen, L.; Zhou, J.; Lei, L.; Meng, Z. Single/dualFano resonance based on plasmonic metal-dielectric-metal waveguide. Plasmonics 2016, 11, 315–321. [Google Scholar] [CrossRef]
- Homola, J. Present and future of surface plasmon resonance biosensors. Anal. Bioanal. Chem. 2003, 337, 528–539. [Google Scholar] [CrossRef] [PubMed]
- Daghestani, H.N.; Day, B.W. Theory and Applications of Surface Plasmon Resonance Resonant Mirror Resonant Waveguide Grating and Dual Polarization Interferometry Biosensors. Sensors 2010, 10, 9630–9646. [Google Scholar] [CrossRef] [PubMed]
- Yue, W.; Wang, Z.; Yang, Y.; Chen, L.; Syed, A.; Wong, K.; Wang, X. Electron-beam lithography of gold nanostructures for surface-enhanced Raman scattering. J. Micromech. Microeng. 2012, 22, 125007. [Google Scholar] [CrossRef]
- Ni, B.; Chen, X.Y.; Xiong, D.Y.; Liu, H.; Hua, G.H.; Chang, J.H.; Zhou, H. Infrared plasmonic refractive index-sensitive nanosensor based on electromagnetically induced transparency of waveguide resonator systems. Opt. Quantum Electron. 2015, 47, 1339–1346. [Google Scholar] [CrossRef]
- Kirchain, R.; Kimerling, L. A roadmap for nanophotonics. Nat. Photonics 2007, 1, 303–305. [Google Scholar] [CrossRef]
- Zia, R.; Schuller, J.A.; Chandran, A.; Brongersma, M.L. Plasmonics: The next chip-scale technology. Mater. Today 2006, 9, 20–27. [Google Scholar] [CrossRef]
- Abbas, M.N.; Cheng, C.W.; Chang, Y.C.; Shih, M.H. An omni-directional mid-infrared tunable plasmonic polarization filter. Nanotechnology 2012, 23, 444007. [Google Scholar] [CrossRef] [PubMed]
- Kato, N.; Lee, L.; Chandrawati, R.; Johnston, A.P.; Caruso, F. Optically Characterized DNA Multilayered Assemblies and Phenomenological Modeling of Layer-by-Layer Hybridization. J. Phys. Chem. C 2009, 113, 21185–21195. [Google Scholar] [CrossRef]
- Yang, X.D.; Liu, Y.; Oulton, R.F.; Yin, X.; Zhang, X. Optical forces in hybrid plasmonic waveguides. Nano Lett. 2011, 11, 321–328. [Google Scholar] [CrossRef] [PubMed]
- Maier, S.A. Plasmonics: Fundamentals and Applications; Springer: Berlin, Germany, 2007. [Google Scholar]
- Fan, P.; Yu, Z.; Fan, S.; Brongersma, M.L. Optical Fano resonance of an individual semiconductor nanostructure. Nat. Mater. 2014, 13, 471–475. [Google Scholar] [CrossRef] [PubMed]
- Francescato, F.; Giannini, V.; Maier, S.A. Plasmonic systems unveiled by Fano resonances. ACS Nano 2012, 6, 1830–1838. [Google Scholar] [CrossRef] [PubMed]
- Bhatia, P.; Gupta, B.D. Surface-plasmon-resonance-based fiber-optic refractive index sensor: Sensitivity enhancement. Appl. Opt. 2011, 50, 2032–2036. [Google Scholar] [CrossRef] [PubMed]
- Gai, H.; Wang, J.; Tian, Q. Modified Debye model parameters of metals applicable for broadband calculations. Appl. Opt. 2007, 46, 2229–2233. [Google Scholar] [CrossRef] [PubMed]
- Zhang, Z.D.; Luo, L.; Xue, C.Y.; Zhang, W.D.; Yan, S.B. Fano Resonance Based on Metal-Insulator-Metal Waveguide-Coupled Double Rectangular Cavities for Plasmonic Nanosensors. Sensors 2016, 16, 642. [Google Scholar] [CrossRef] [PubMed]
- Kekatpure, R.D.; Hryciw, A.C.; Barnard, E.S.; Brongersma, M.L. Solving dielectric and plasmonic waveguide dispersion relations on a pocket calculator. Opt. Express 2009, 17, 24112–24129. [Google Scholar] [CrossRef] [PubMed]
- Zhu, J.H.; Wang, Q.J.; Shum, P.; Huang, X.G. A simple nanometeric plasmonic narrow-band filter structure based on metal-insulator-metal waveguide. IEEE Trans. Nanotechnol. 2011, 10, 1371–1376. [Google Scholar] [CrossRef]
- Hu, F.; Yi, H.; Zhou, Z. Wavelength demultiplexing structure based on arrayed plasmonic slot cavities. Opt. Lett. 2011, 36, 1500–1502. [Google Scholar] [CrossRef] [PubMed]
- Haus, H.A.; Huang, W.P. Coupled-mode theory. IEEE Proc. 1991, 79, 1505–1518. [Google Scholar] [CrossRef]
- Haus, H.A. Waves and Fields in Optoelectronics; Prentice-Hall: Upper Saddle River, NJ, USA, 1984. [Google Scholar]
- Piao, X.; Yu, S.; Koo, S.; Lee, K.; Park, N. Fano-type spectral asymmetry and its control for plasmonic metal-insulator-metal stub structures. Opt. Express 2011, 19, 10907–10912. [Google Scholar] [CrossRef] [PubMed]
- Ameling, R.; Langguth, L.; Hentschel, M.; Mesch, M.; Braun, P.V.; Giessen, H. Cavity-enhanced localized plasmon resonance sensing. Appl. Phys. Lett. 2010, 97, 253116. [Google Scholar] [CrossRef]
- Miller, M.M.; Lazarides, A.A. Sensitivity of metal nanoparticle surface plasmon resonance to the dielectric environment. J. Phys. Chem. B 2005, 109, 21556–21565. [Google Scholar] [CrossRef] [PubMed]
- Dmitriev, A.; Hägglund, C.; Chen, S.; Fredriksson, H.; Pakizeh, T.; Käll, M.; Sutherland, D.S. Enhanced nanoplasmonic optical sensors with reduced substrate effect. Nano Lett. 2008, 8, 3893–3898. [Google Scholar] [CrossRef] [PubMed]
Figure 1.
2D schematic of the metal–insulator–metal (MIM) waveguides coupled with rectangular and ring resonators. SPPs: surface plasmon polaritons.
Figure 1.
2D schematic of the metal–insulator–metal (MIM) waveguides coupled with rectangular and ring resonators. SPPs: surface plasmon polaritons.

Figure 2.
The diagram of full width at half maximum (FWHM).

Figure 3.
(a) Transmission spectra of the MIM waveguides coupled with ring and rectangular cavities (red curve) by a rectangular cavity only (black curve); (b) contour profiles of the normalized Hz field distributions in the MIM waveguides coupled with ring and rectangular resonators with λ = 1010 nm (top) and λ = 1025 nm (bottom).

Figure 4.
(a) Transmission spectra for the MIM waveguide coupled with ring and rectangular cavities with changing n (h = 100 nm); (b) Shift in the Fano resonance peak as a function of refractive index (δn).
Figure 4.
(a) Transmission spectra for the MIM waveguide coupled with ring and rectangular cavities with changing n (h = 100 nm); (b) Shift in the Fano resonance peak as a function of refractive index (δn).

Figure 5.
Transmission spectra of the MIM waveguides coupled with ring and rectangular cavities with (a) changing q (h = 100 nm) and (b) changing h of the rectangular resonator.
Figure 5.
Transmission spectra of the MIM waveguides coupled with ring and rectangular cavities with (a) changing q (h = 100 nm) and (b) changing h of the rectangular resonator.

Figure 6.
Transmission spectra of the MIM waveguides coupled with ring and rectangular cavities with (a) changing r1 and r3; (b) shift in the Fano resonance peak as a function of the refractive index change (δn).
Figure 6.
Transmission spectra of the MIM waveguides coupled with ring and rectangular cavities with (a) changing r1 and r3; (b) shift in the Fano resonance peak as a function of the refractive index change (δn).

Figure 7.
Transmission spectra of the MIM waveguide coupled with ring and rectangular cavities with varying coupling distances (a) g2; (b) g1; (c) g3 and (d) the shift in the Fano resonance peak as a function of the refractive index change (δn).
Figure 7.
Transmission spectra of the MIM waveguide coupled with ring and rectangular cavities with varying coupling distances (a) g2; (b) g1; (c) g3 and (d) the shift in the Fano resonance peak as a function of the refractive index change (δn).

© 2017 by the authors. Licensee MDPI, Basel, Switzerland. This article is an open access article distributed under the terms and conditions of the Creative Commons Attribution (CC BY) license (http://creativecommons.org/licenses/by/4.0/).
Share and Cite
MDPI and ACS Style
Tang, Y.; Zhang, Z.; Wang, R.; Hai, Z.; Xue, C.; Zhang, W.; Yan, S. Refractive Index Sensor Based on Fano Resonances in Metal-Insulator-Metal Waveguides Coupled with Resonators. Sensors 2017, 17, 784. https://doi.org/10.3390/s17040784
AMA Style
Tang Y, Zhang Z, Wang R, Hai Z, Xue C, Zhang W, Yan S. Refractive Index Sensor Based on Fano Resonances in Metal-Insulator-Metal Waveguides Coupled with Resonators. Sensors. 2017; 17(4):784. https://doi.org/10.3390/s17040784
Chicago/Turabian StyleTang, Yue, Zhidong Zhang, Ruibing Wang, Zhenyin Hai, Chenyang Xue, Wendong Zhang, and Shubin Yan. 2017. "Refractive Index Sensor Based on Fano Resonances in Metal-Insulator-Metal Waveguides Coupled with Resonators" Sensors 17, no. 4: 784. https://doi.org/10.3390/s17040784
Note that from the first issue of 2016, this journal uses article numbers instead of page numbers. See further details here.