
Continuous Indoor Positioning Fusing WiFi, Smartphone Sensors and Landmarks


Abstract
:1. Introduction
2. Related Works
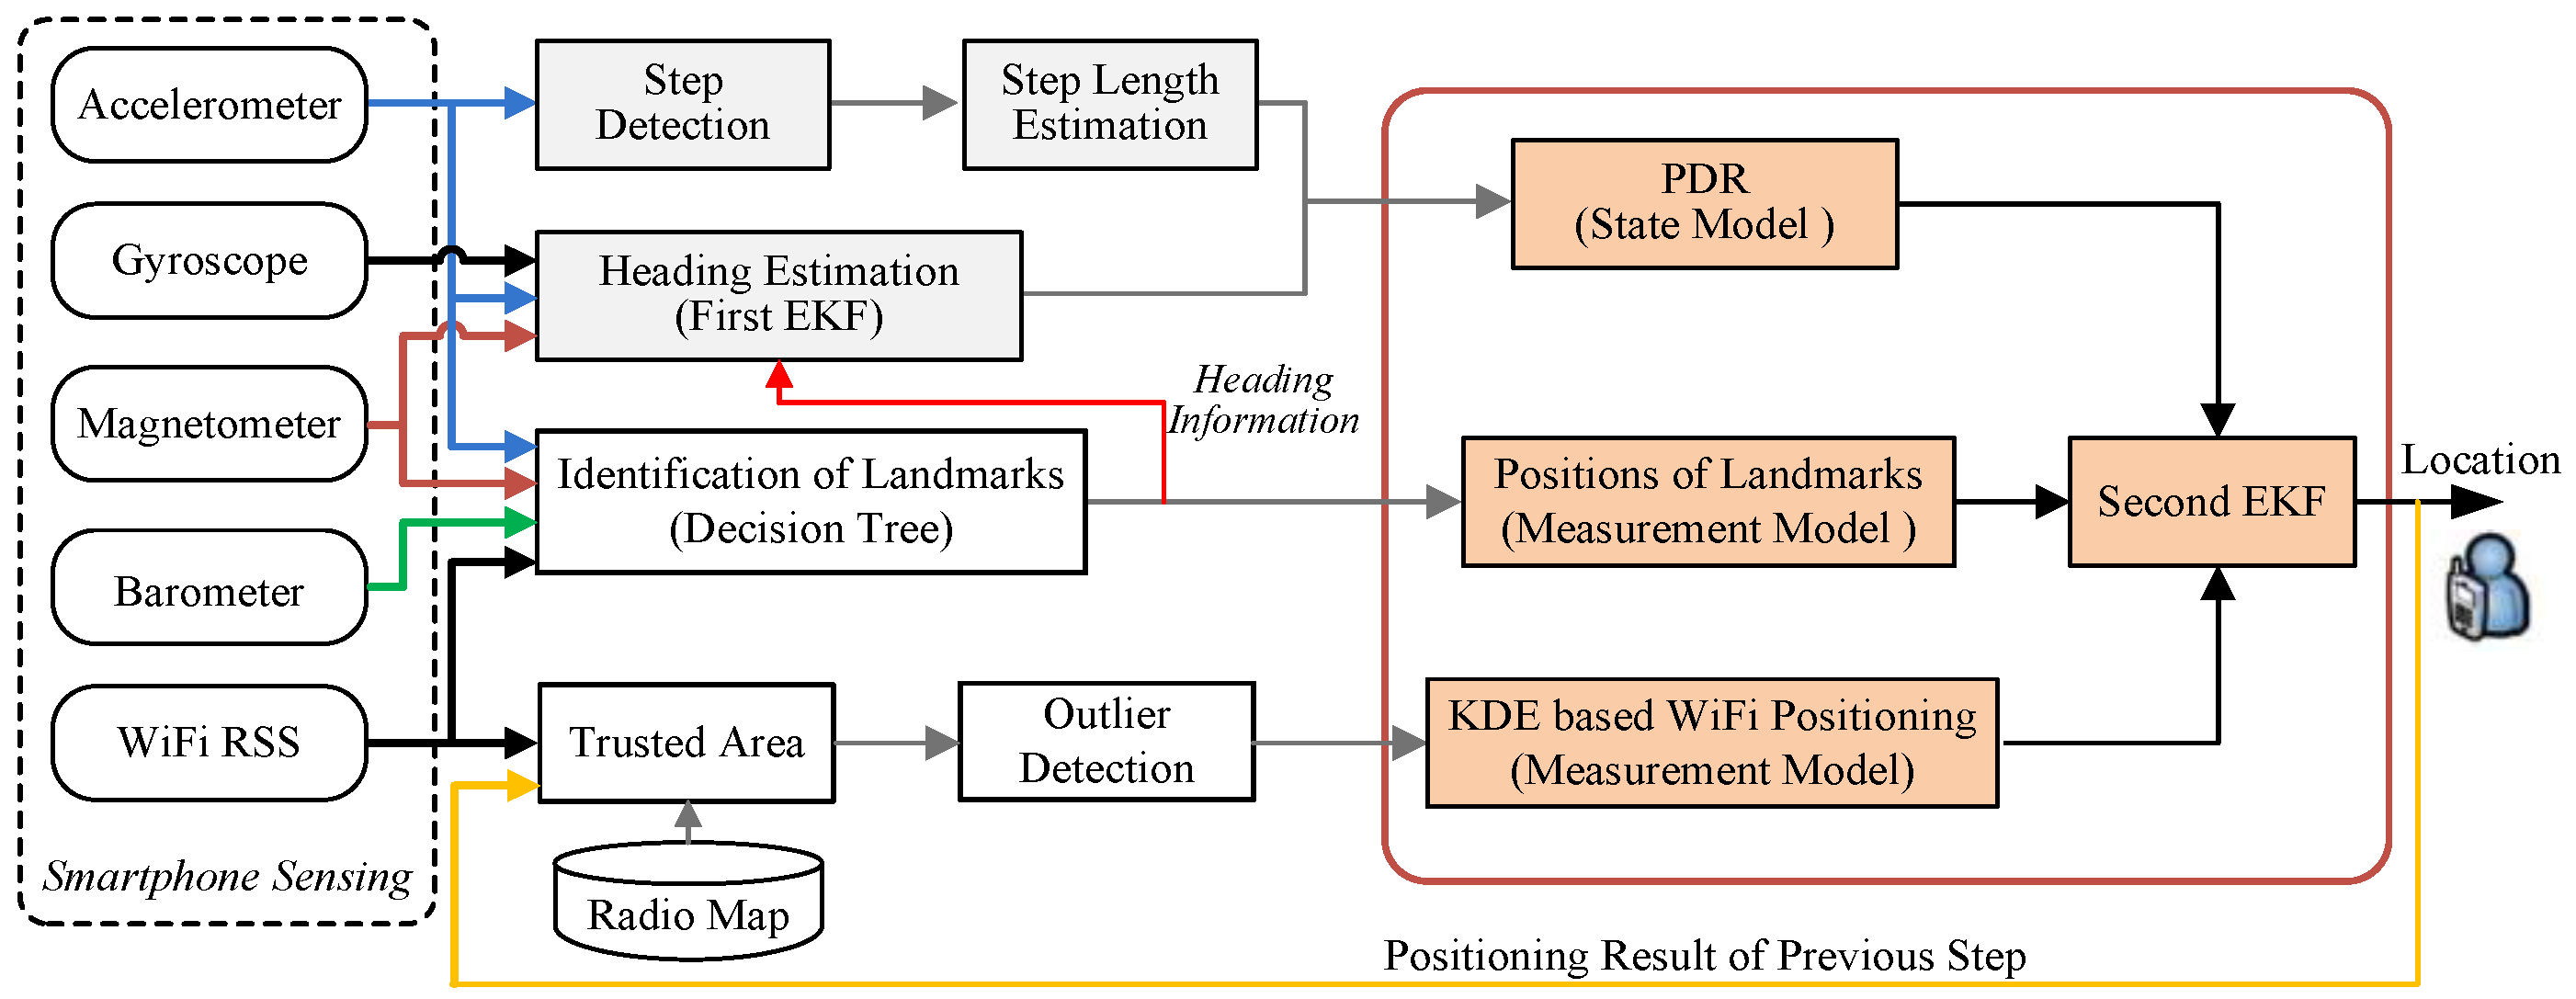
3. Methodology
3.1. WiFi Positioning
3.1.1. Kernel Density Estimation Based Measurement Update
3.1.2. Trusted Area for Calibration Points Selection
3.1.3. Outlier Detection of RSS Measurements
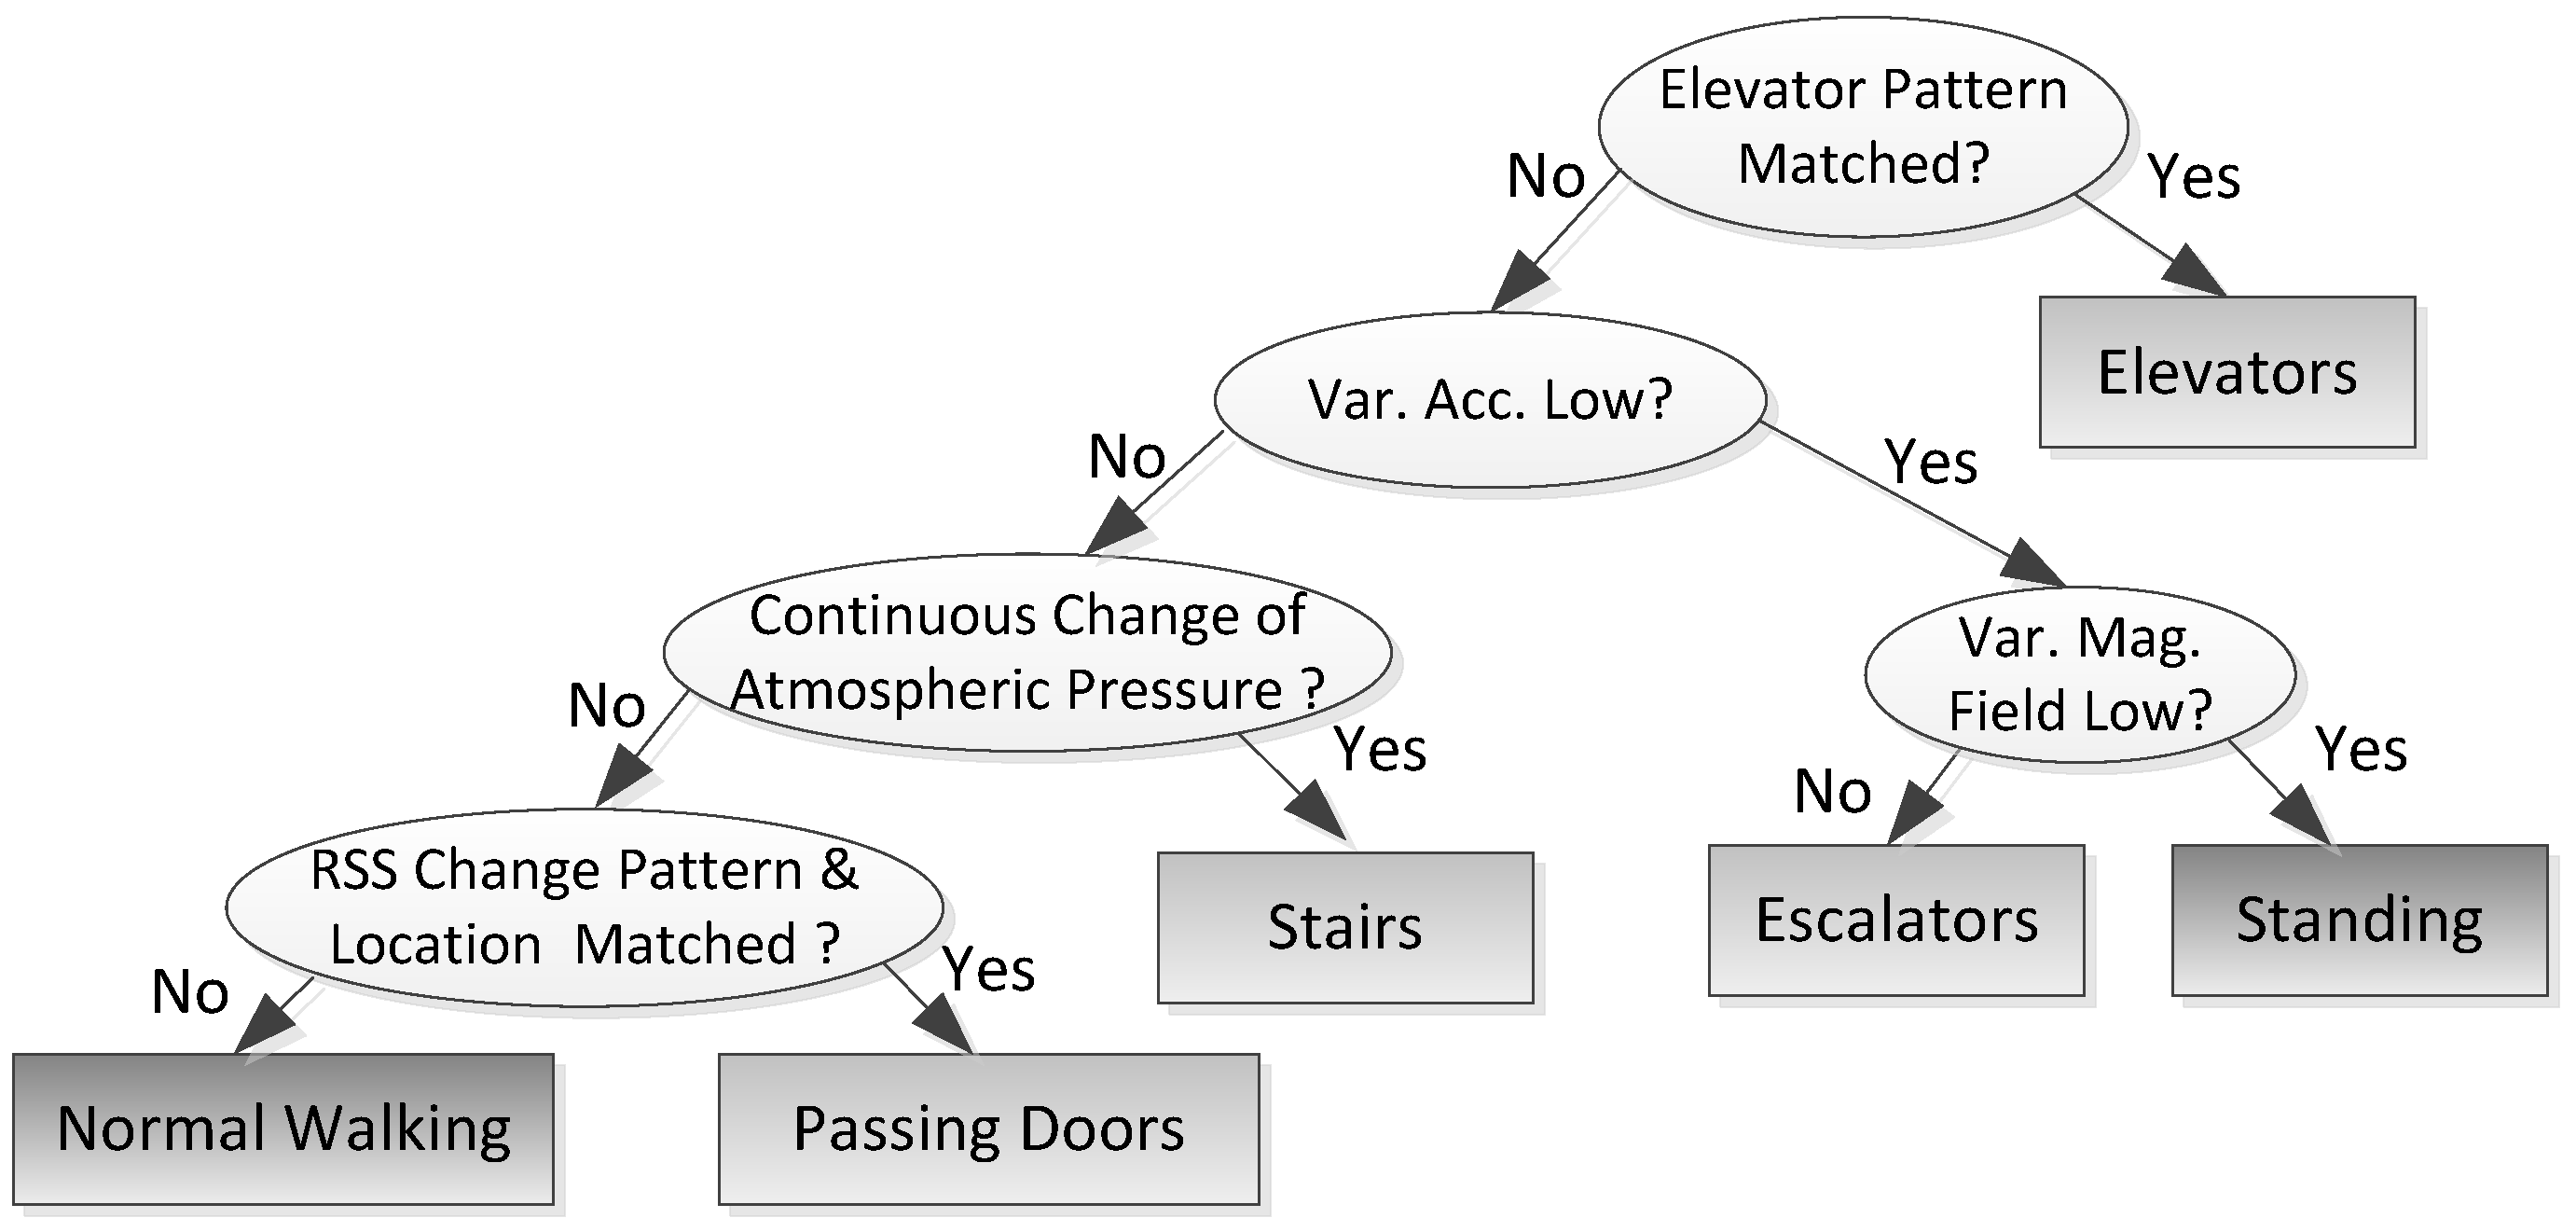
3.2. Identification of Landmarks
3.3. Pedestrian Dead Reckoning (PDR)
3.3.1. Step Detection and Step Length Estimation
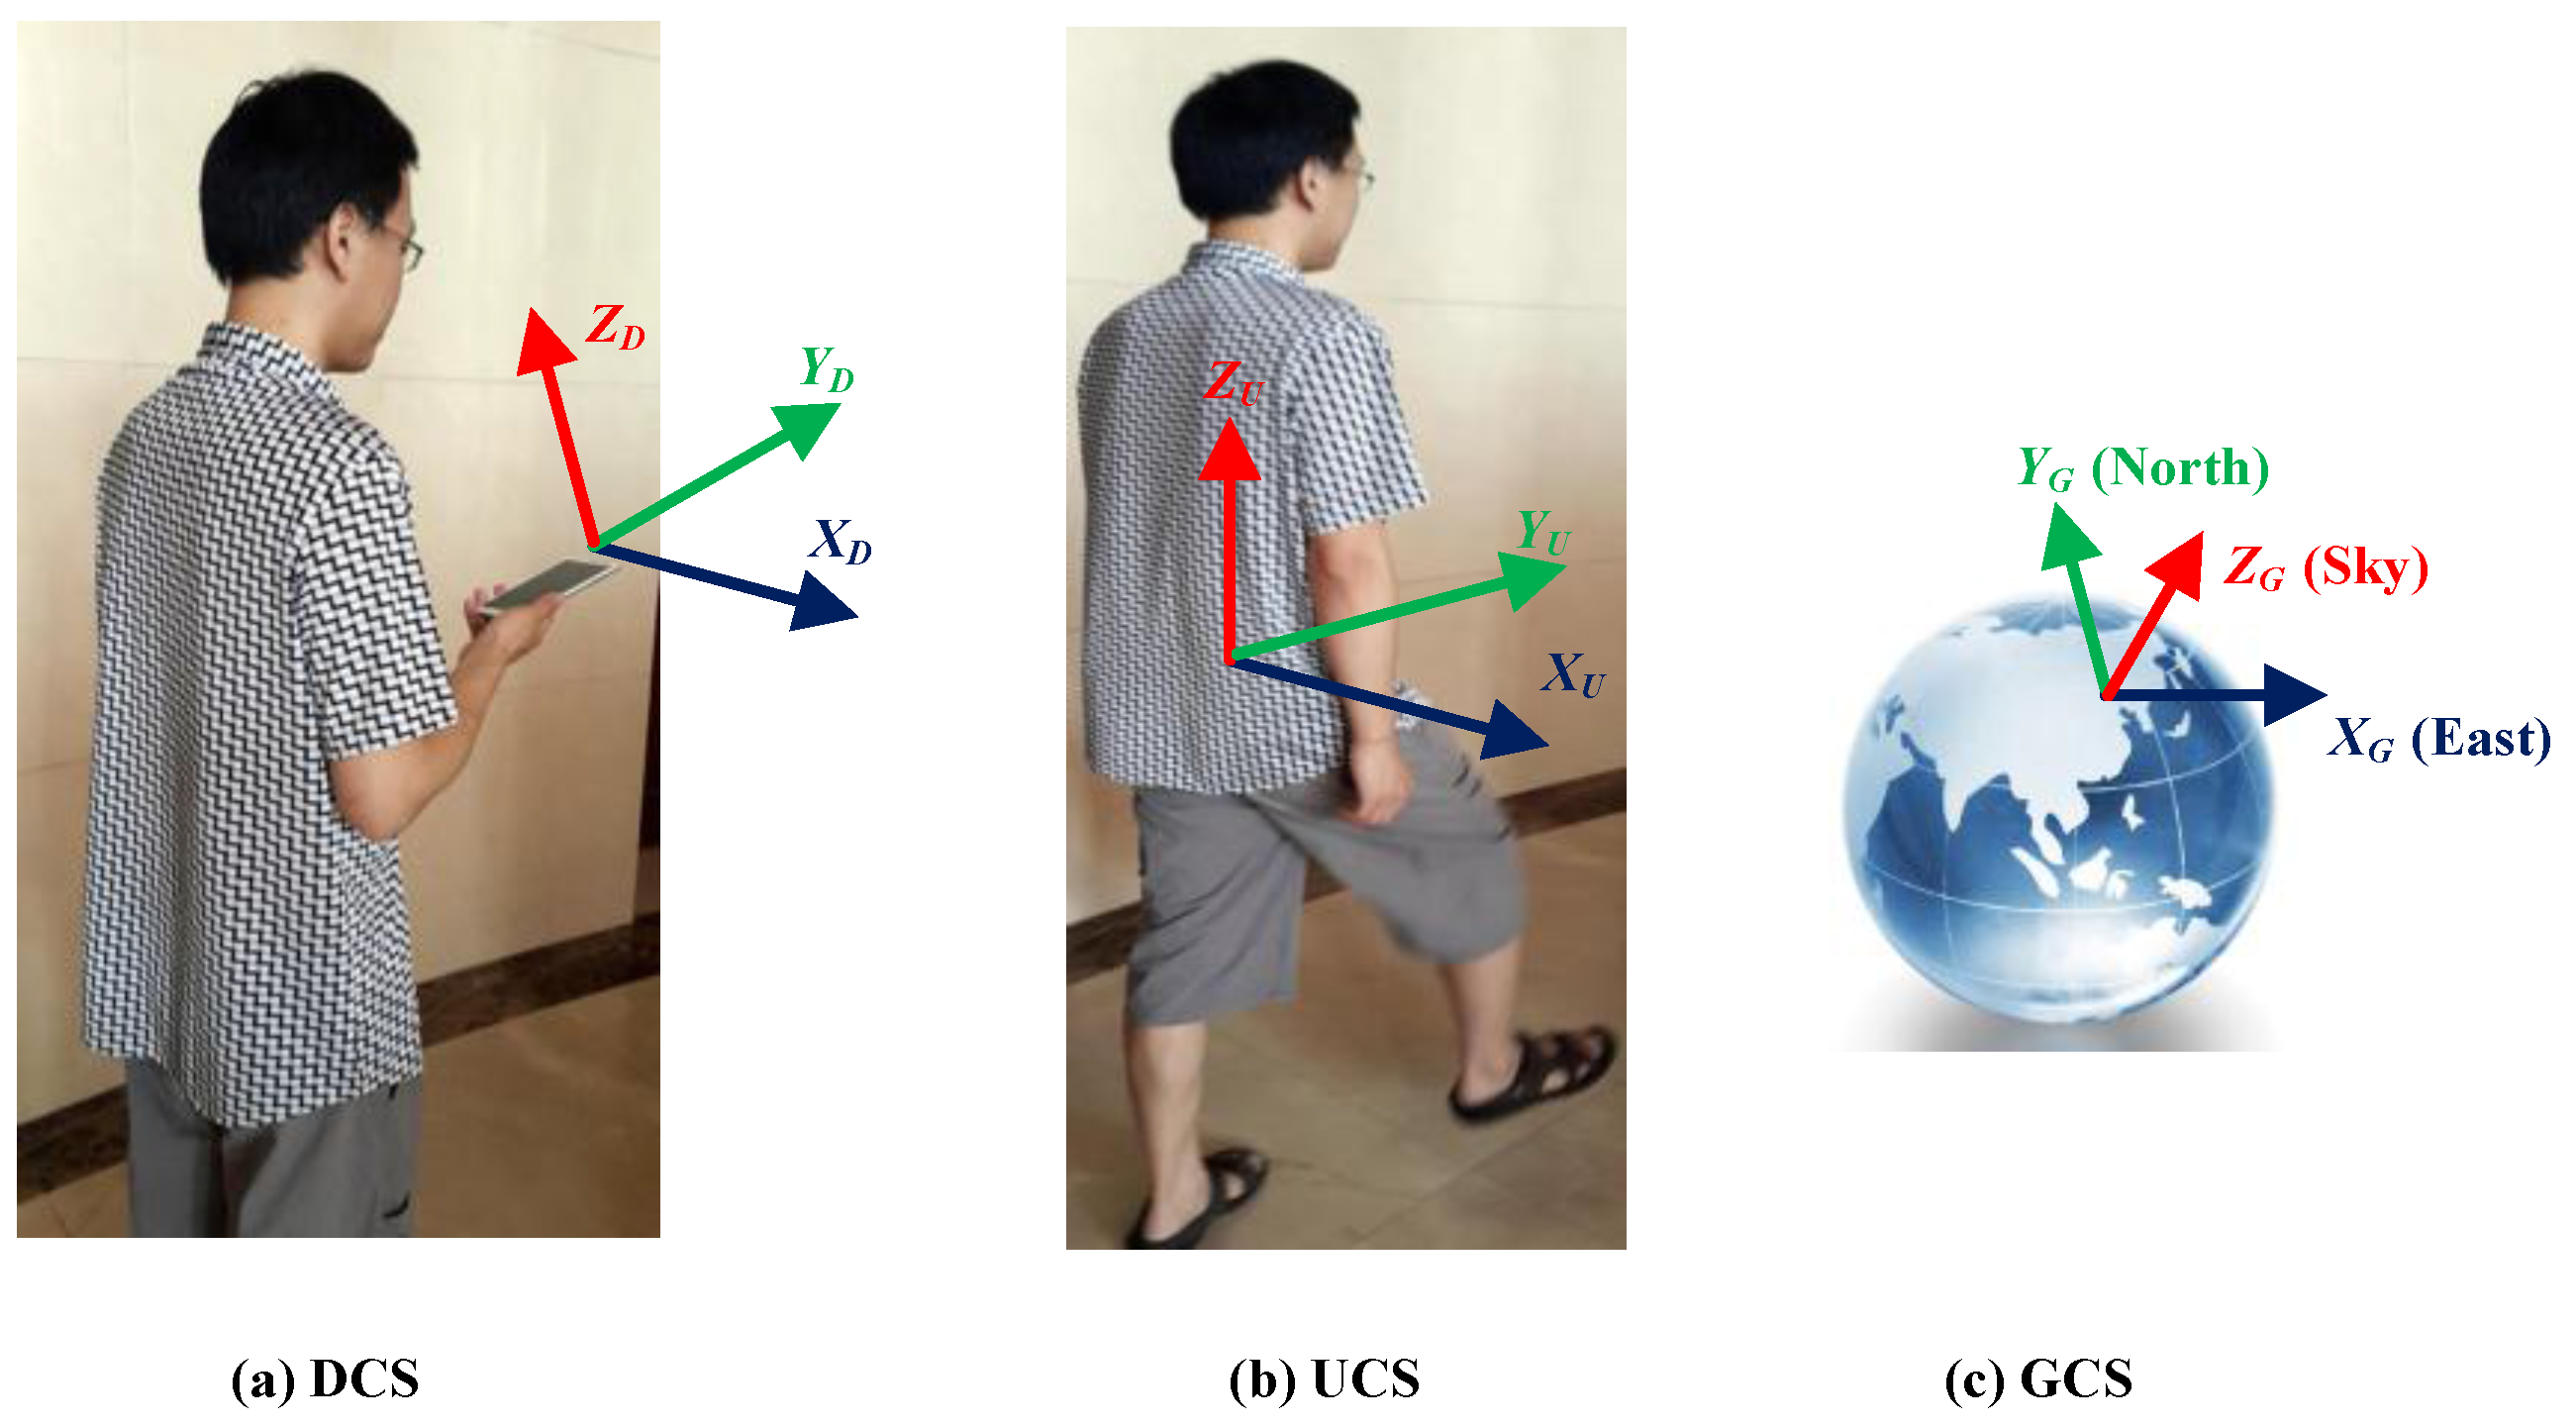
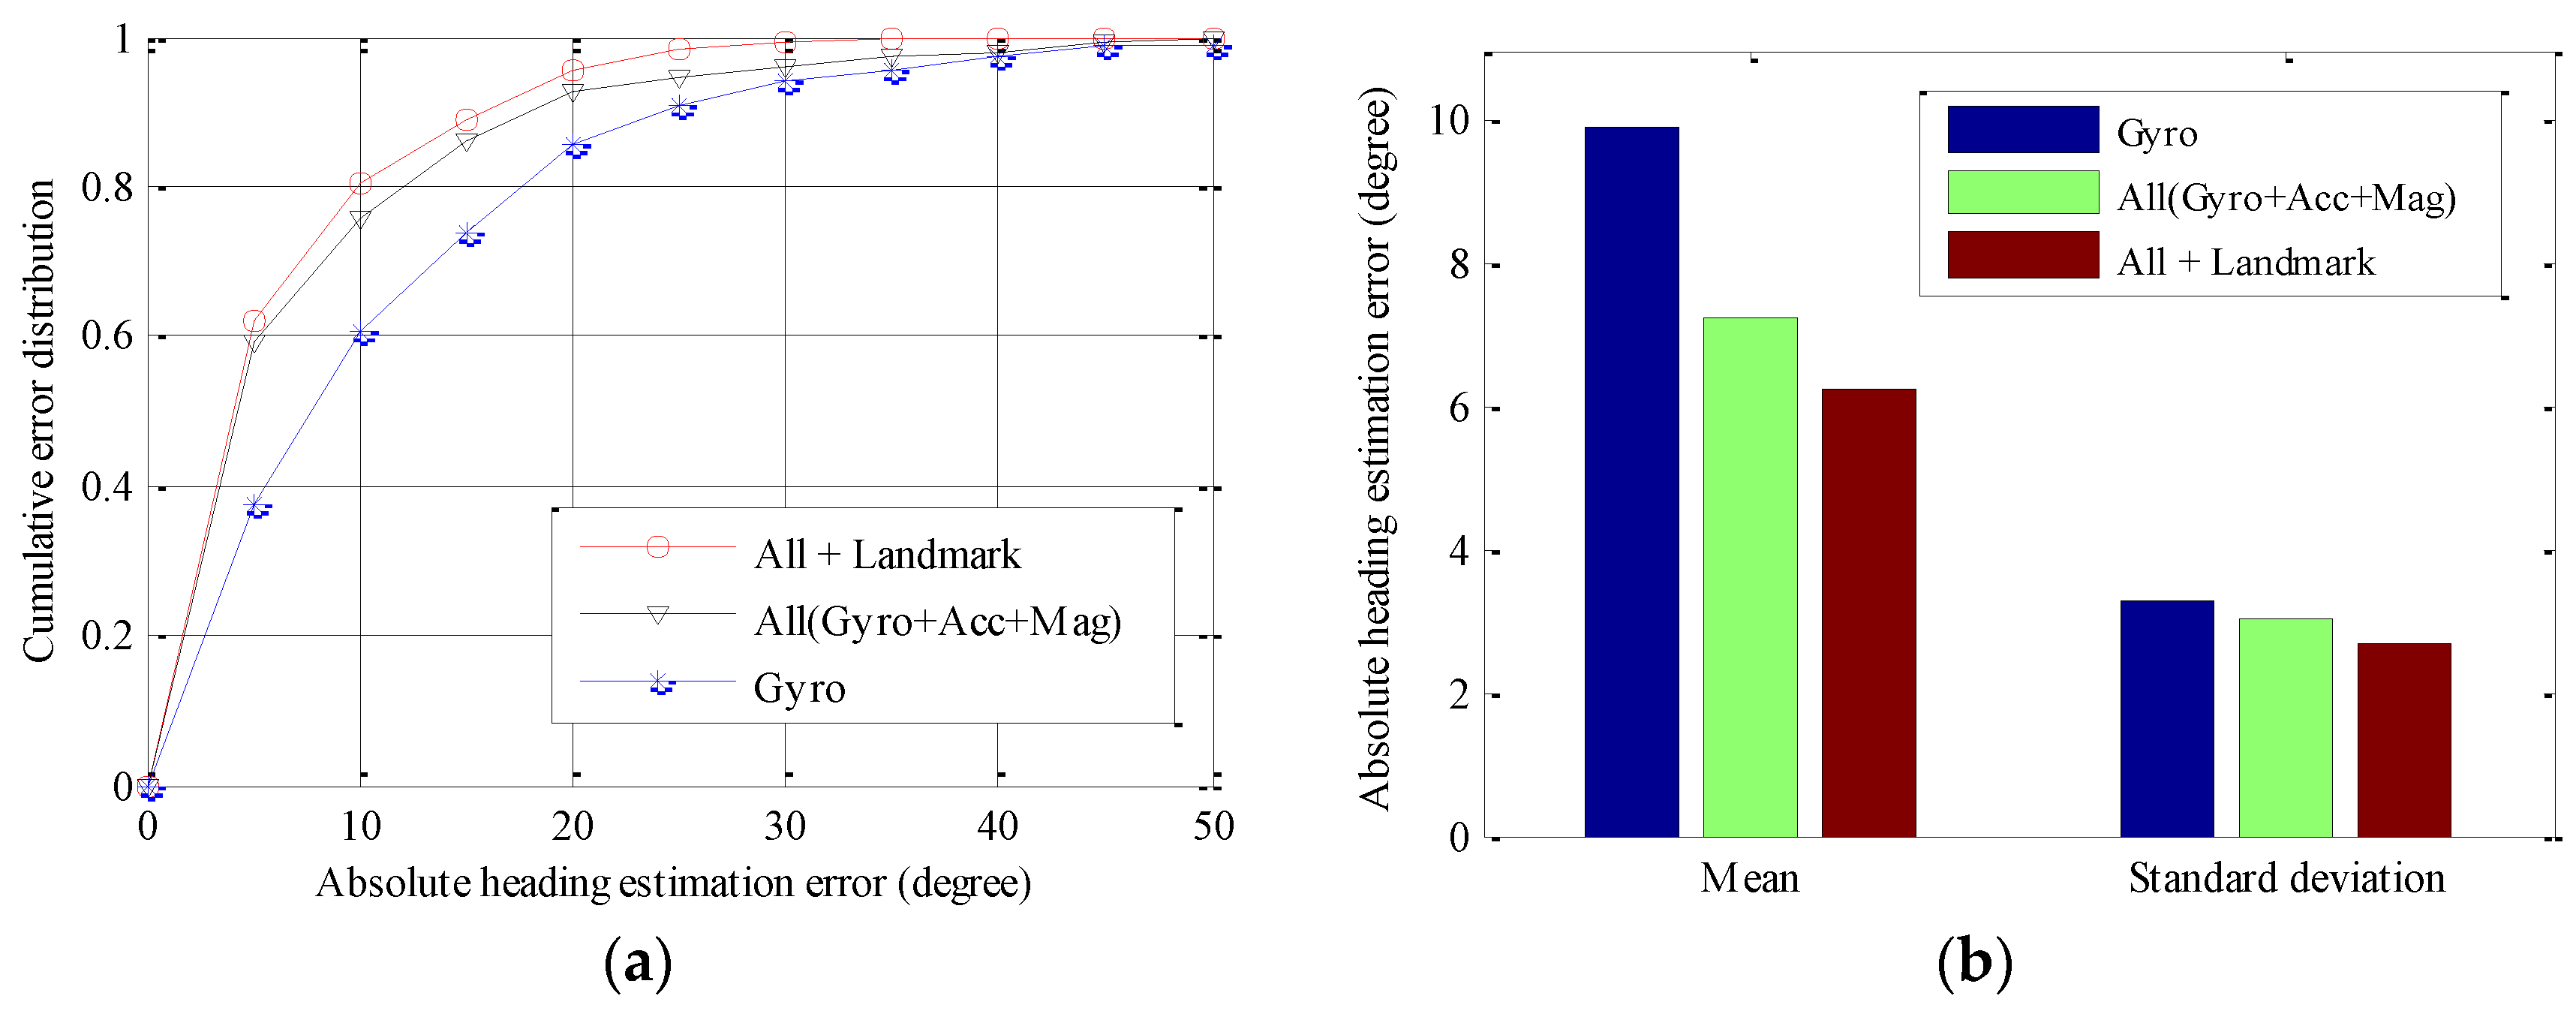
3.3.2. First EKF: User Heading Estimation Fusing Inertial Sensors, Magnetometers, and Landmarks
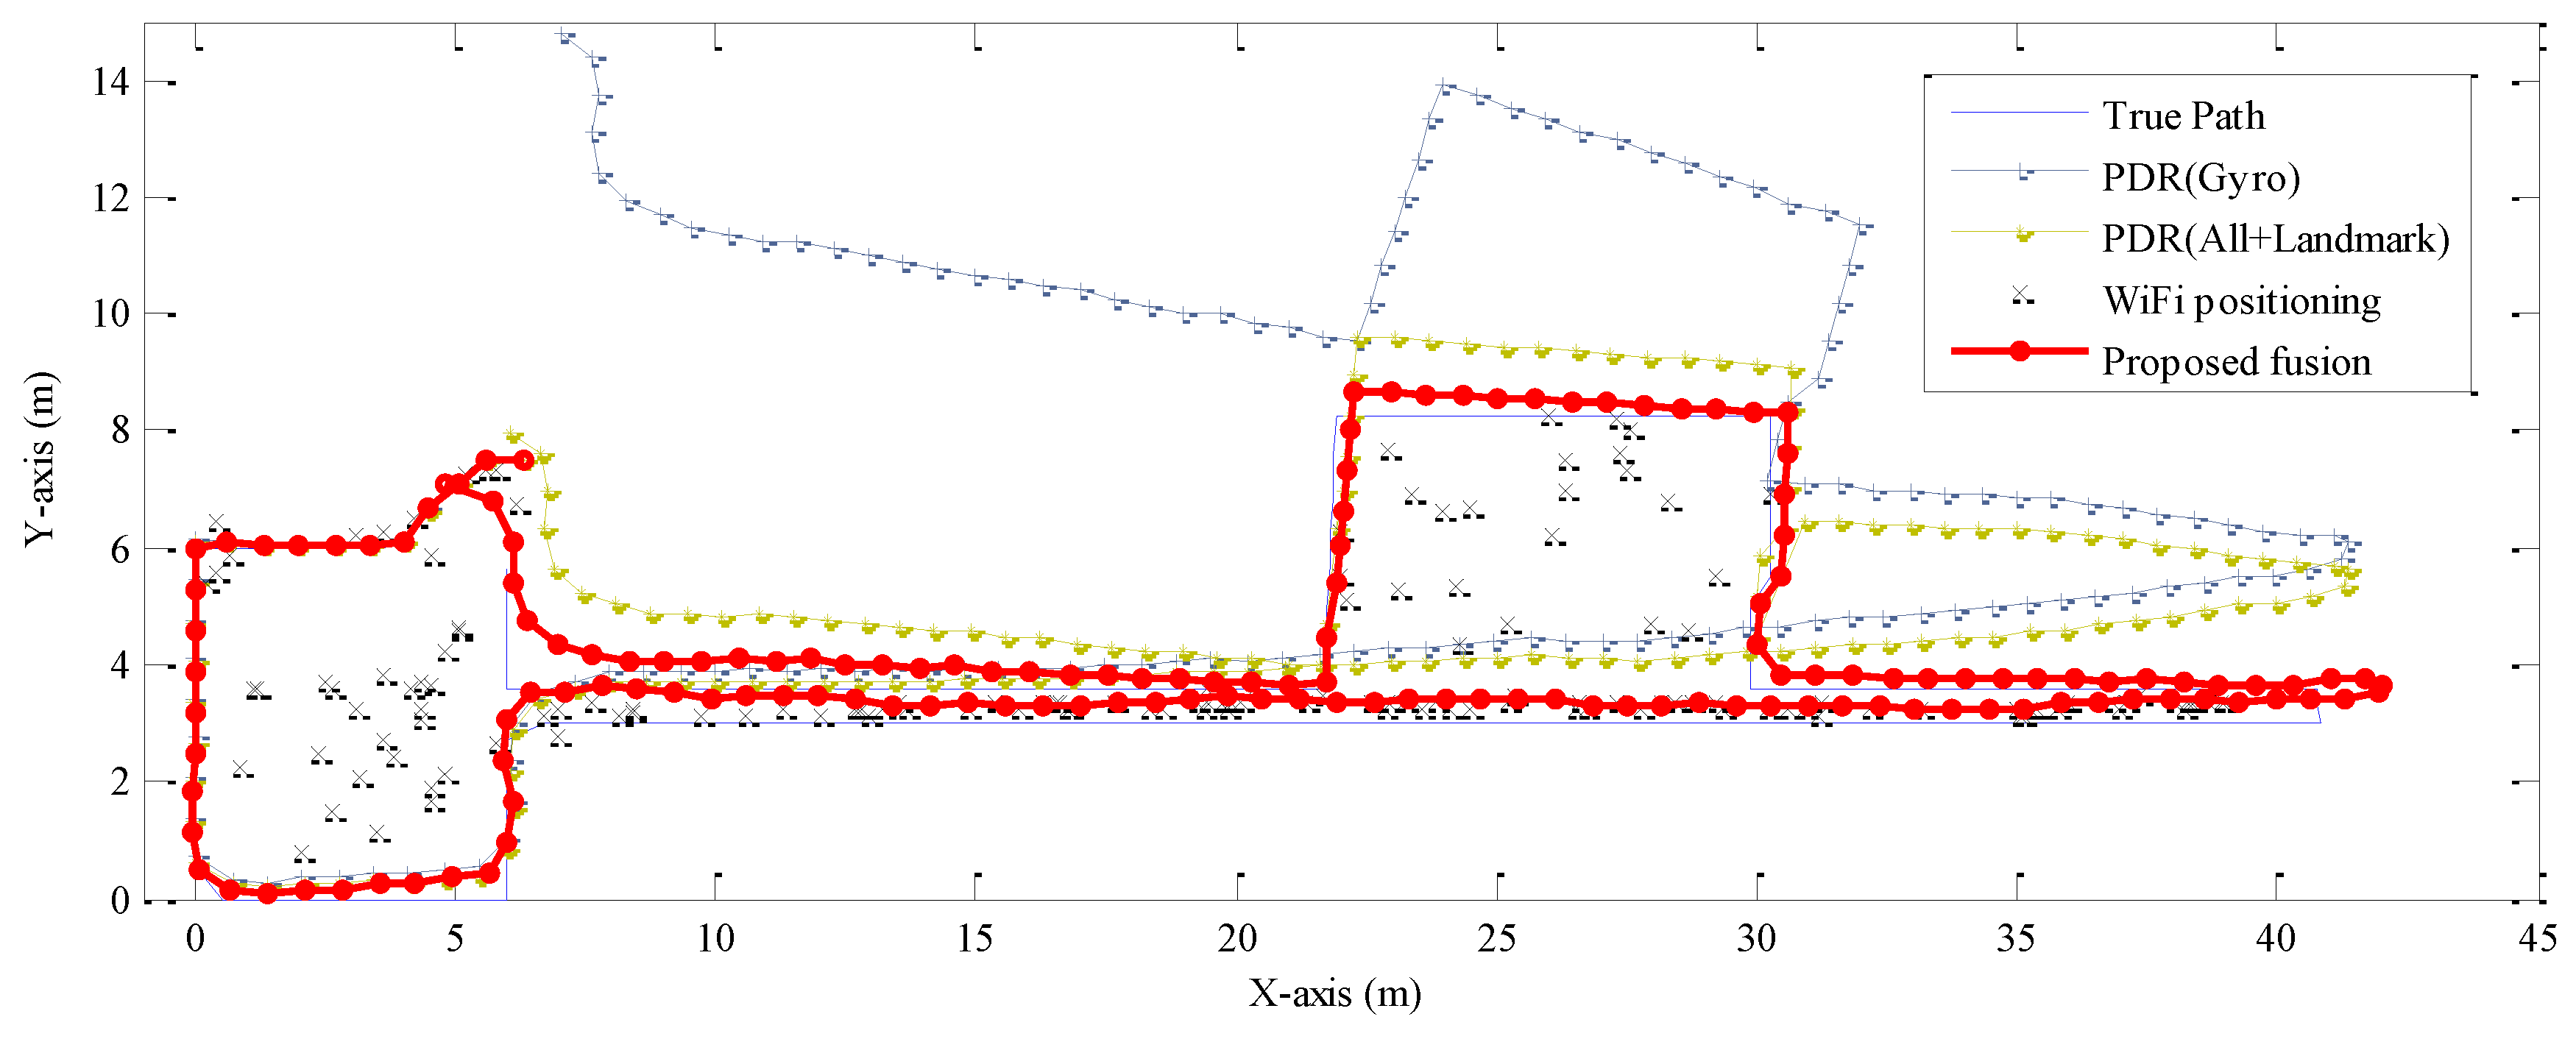
3.4. Second EKF: Fusing WiFi Positioning, PDR, and Landmarks
4. Evaluation
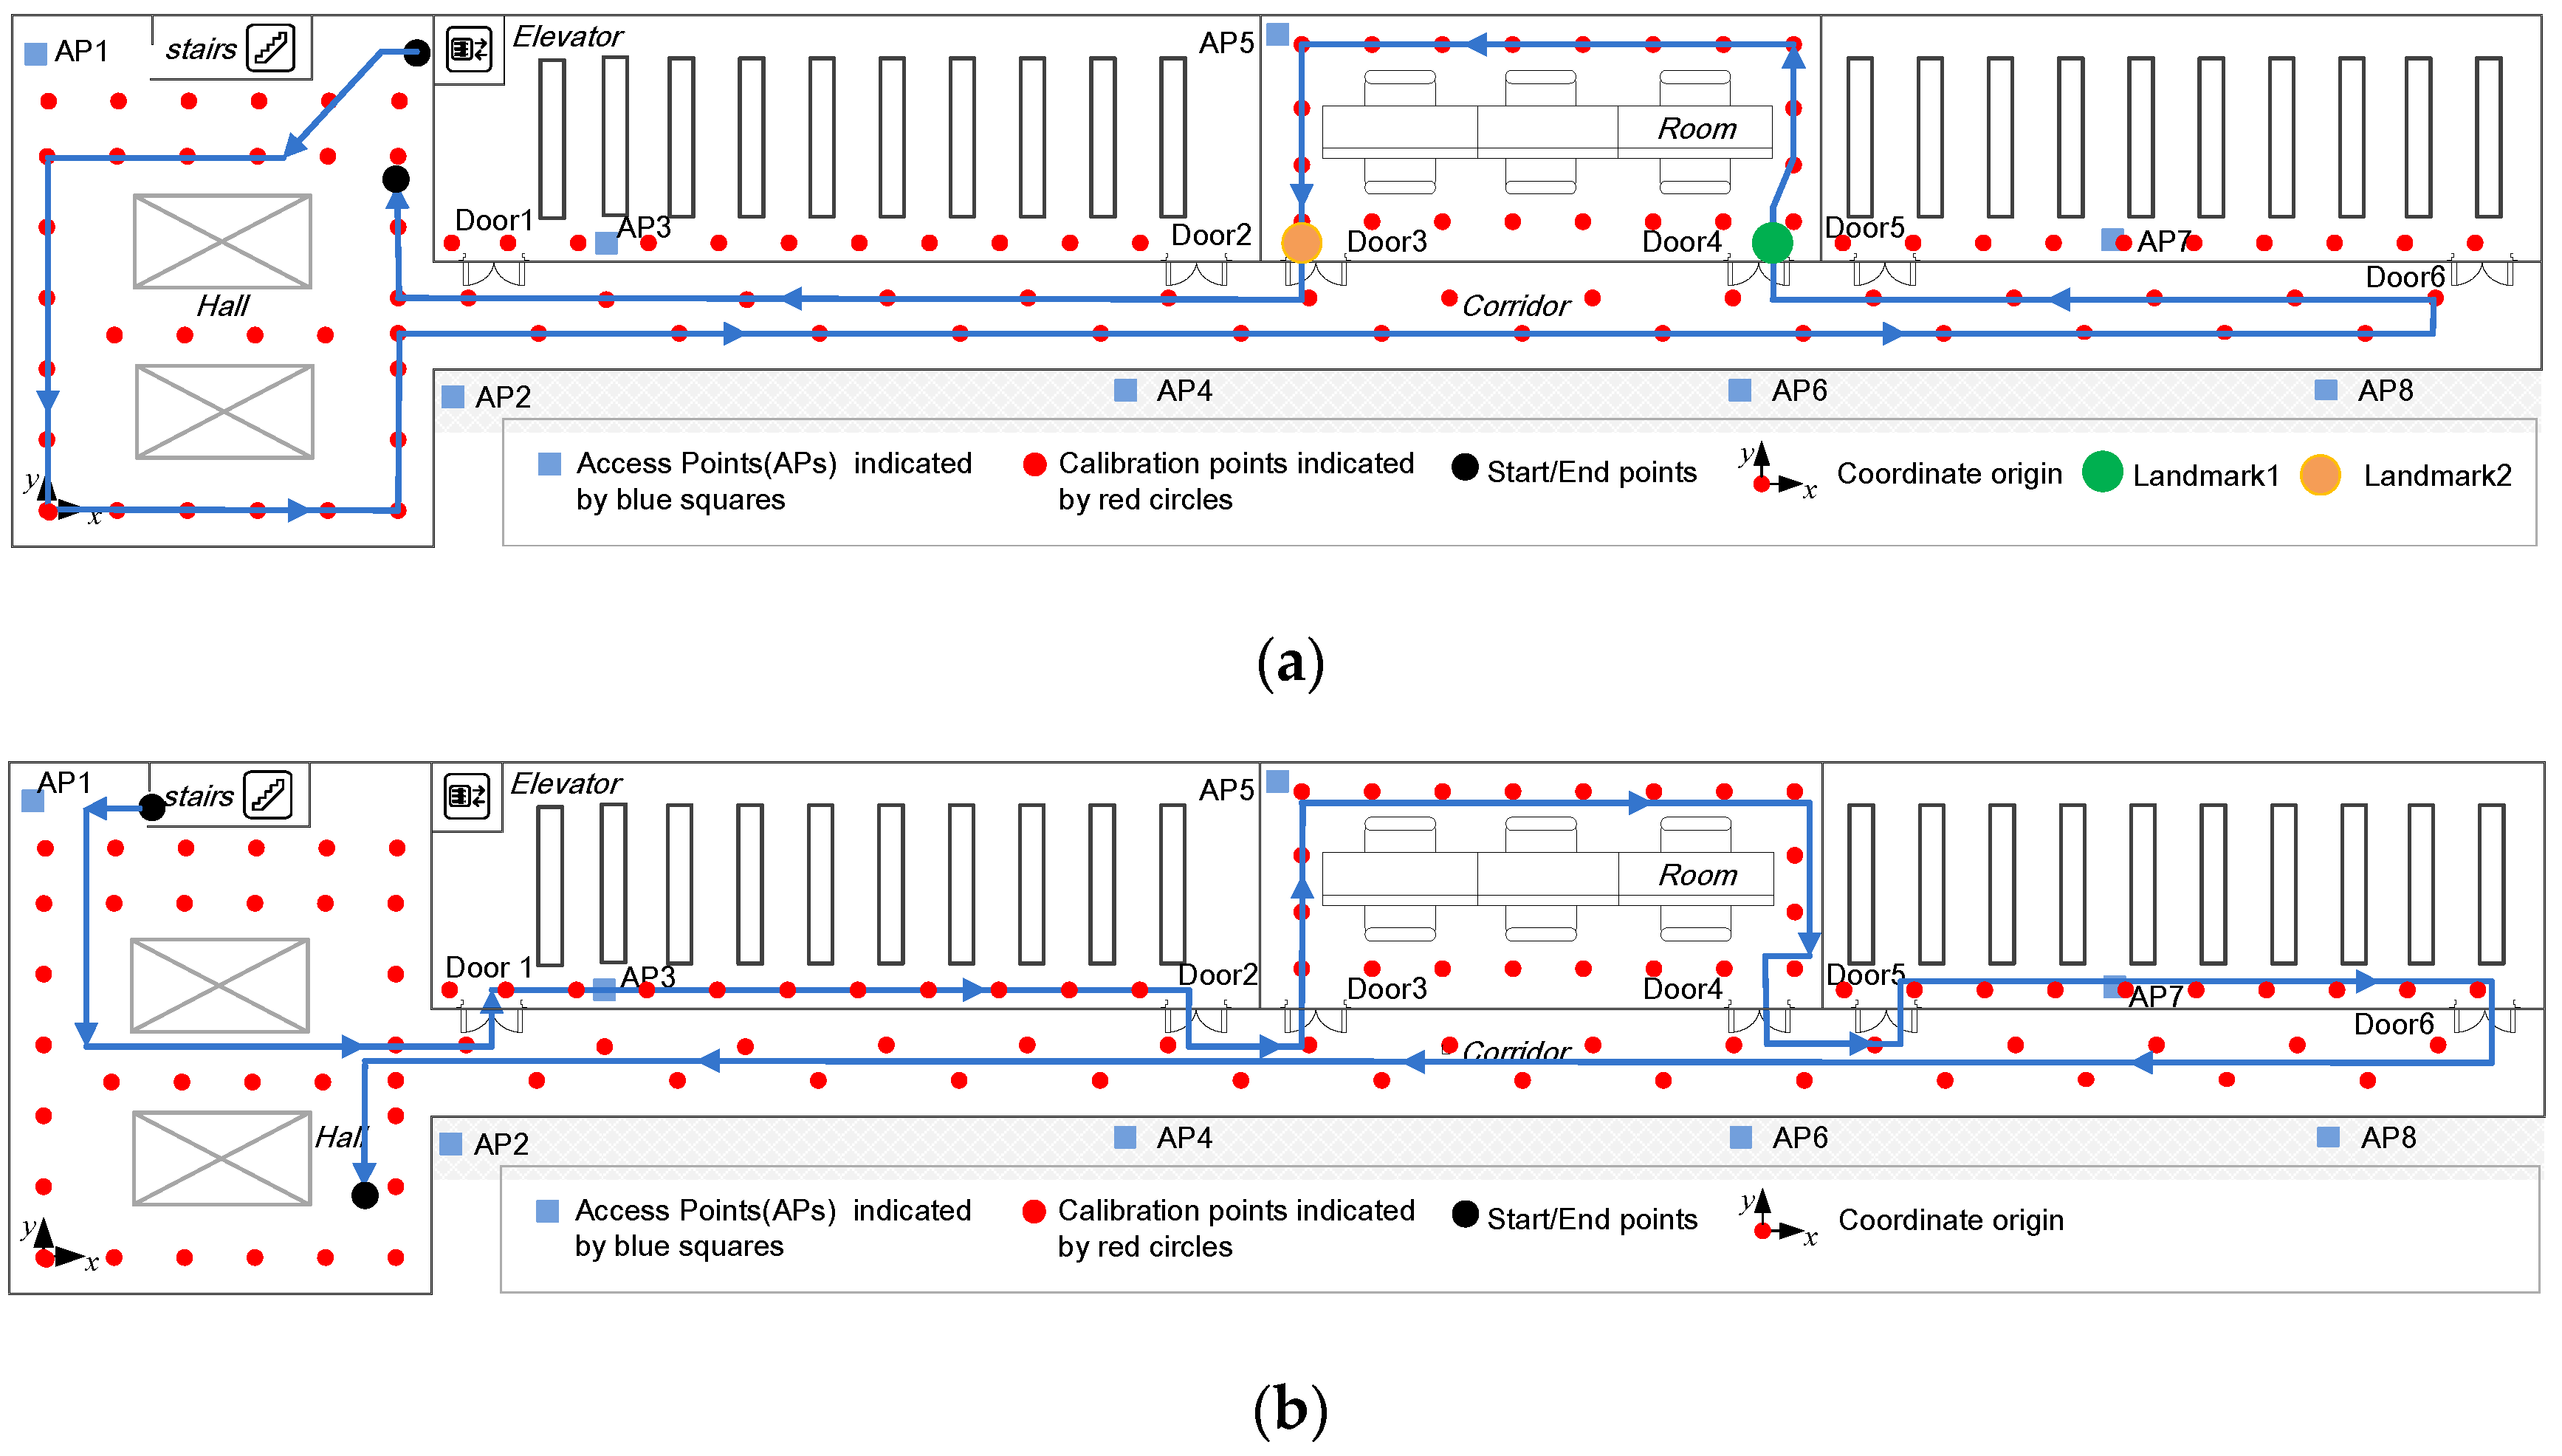
4.1. Experimental Setup
4.2. Performance Analysis
5. Conclusions
Acknowledgments
Author Contributions
Conflicts of Interest
References
- Greßmann, B.; Klimek, H.; Turau, V. Towards Ubiquitous Indoor Location Based Services and Indoor Navigation. In Proceedings of the 7th Workshop on Positioning Navigation and Communication (WPNC), Dresden, Germany, 11–12 March 2010; pp. 107–112.
- Zhou, M.; Zhang, Q.; Xu, K.; Tian, Z.; Wang, Y.; He, W. PRIMAL: Page Rank-Based Indoor Mapping and Localization Using Gene-Sequenced Unlabeled WLAN Received Signal Strength. Sensors 2015, 15, 24791–24817. [Google Scholar] [CrossRef] [PubMed]
- Gezici, S.; Tian, Z.; Giannakis, G.B.; Kobayashi, H.; Molisch, A.F.; Poor, H.V.; Sahinoglu, Z. Localization via Ultra-Wideband Radios: A Look at Positioning Aspects for Future Sensor Networks. IEEE Signal Proc. Mag. 2005, 22, 70–84. [Google Scholar] [CrossRef]
- Zhuang, Y.; Yang, J.; Li, Y.; Qi, L.; El-Sheimy, N. Smartphone-Based Indoor Localization with Bluetooth Low Energy Beacons. Sensors 2016, 16, 596. [Google Scholar] [CrossRef] [PubMed]
- Ni, L.M.; Liu, Y.; Lau, Y.C.; Patil, A.P. LANDMARC: Indoor Location Sensing Using Active RFID. Wirel. Netw. 2004, 10, 701–710. [Google Scholar] [CrossRef]
- Zhao, Y.; Dong, L.; Wang, J.; Hu, B.; Fu, Y. Implementing Indoor Positioning System via ZigBee Devices. In Proceedings of the 42nd Asilomar Conference on Signals, Systems and Computers, Pacific Grove, CA, USA, 26–29 October 2008; pp. 1867–1871.
- Deng, Z.-A.; Hu, Y.; Yu, J.; Na, Z. Extended Kalman Filter for Real Time Indoor Localization by Fusing WiFi and Smartphone Inertial Sensors. Micromachines 2015, 6, 523–543. [Google Scholar] [CrossRef]
- Ma, L.; Xu, Y.B. Received Signal Strength Recovery in Green WLAN Indoor Positioning System Using Singular Value Thresholding. Sensors 2015, 15, 1292–1311. [Google Scholar] [CrossRef] [PubMed]
- Deng, Z.A.; Xu, Y.B.; Ma, L. Indoor Positioning via Nonlinear Discriminative Feature Extraction in Wireless Local Area Network. Comput. Commun. 2012, 35, 738–747. [Google Scholar] [CrossRef]
- Xiao, Z.; Wen, H.; Markham, A.; Trigons, N. Robust Indoor Positioning With Lifelong Learning. IEEE J. Sel. Areas Commun. 2015, 33, 2287–2301. [Google Scholar] [CrossRef]
- Renaudin, V.; Combettes, C. Magnetic, Acceleration Fields and Gyroscope Quaternion (MAGYQ)-Based Attitude Estimation with Smartphone Sensors for Indoor Pedestrian Navigation. Sensors 2014, 14, 22864–22890. [Google Scholar] [CrossRef] [PubMed]
- Chen, Z.; Zou, H.; Jiang, H.; Zhu, Q.; Soh, Y.C.; Xie, L. Fusion of WiFi, Smartphone Sensors and Landmarks Using the Kalman Filter for Indoor Localization. Sensors 2015, 15, 715–732. [Google Scholar] [CrossRef] [PubMed]
- Abdelnasser, H.; Mohamed, R.; Elgohary, A.; Farid, M.; Wang, H.; Sen, S.; Choudhury, R.; Youssef, M. SemanticSLAM: Using Environment Landmarks for Unsupervised Indoor Localization. IEEE Trans. Mob. Comput. 2015, 1, 1–14. [Google Scholar] [CrossRef]
- Wang, H.; Lenz, H.; Szabo, A.; Bamberger, J.; Hanebeck, U.D. WLAN-Based Pedestrian Tracking Using Particle Filters and Low-Cost MEMS Sensors. In Proceedings of the 2007 4th Workshop on Positioning, Navigation and Communication (WPNC’07), Hannover, Germany, 22 March 2007; pp. 1–7.
- Rai, A.; Chintalapudi, K.K.; Padmanabhan, V.N.; Sen, R. Zee: Zero-Effort Crowdsourcing for Indoor Localization. In Proceedings of the 18th Annual International Conference on Mobile Computing and Networking, Istanbul, Turkey, 22–26 August 2012; pp. 293–304.
- Jan, S.-S.; Hsu, L.-T.; Tsai, W.-M. Development of an Indoor Location Based Service Test Bed and Geographic Information System with a Wireless Sensor Network. Sensors 2010, 10, 2957–2974. [Google Scholar] [CrossRef] [PubMed]
- Li, X.; Wang, J.; Liu, C.; Zhang, L.; Li, Z. Integrated WiFi/PDR/Smartphone Using an Adaptive System Noise Extended Kalman Filter Algorithm for Indoor Localization. ISPRS Int. J. Geo-Inf. 2016, 5, 8. [Google Scholar] [CrossRef]
- Zhou, M.; Qiu, F.; Tian, Z.; Wu, H.; Zhang, Q.; He, W. An Information-Based Approach to Precision Analysis of Indoor WLAN Localization Using Location Fingerprint. Entropy 2015, 17, 8031–8055. [Google Scholar] [CrossRef]
- Evennou, F.; Marx, F. Advanced Integration of WiFi and Inertial Navigation Systems for Indoor Mobile Positioning. EURASIP J. Appl. Signal Proc. 2006. [Google Scholar] [CrossRef]
- Deng, Z.A.; Xu, Y.B.; Ma, L. Energy Efficient Access Point Selection and Signal Projection for Accurate Indoor Positioning. China Commun. 2012, 9, 52–65. [Google Scholar]
- Scott, D.W. Multivariate Density Estimation; Wiley: Hoboken, NJ, USA, 1992. [Google Scholar]
- Silverman, B.W. Density Estimation for Statistics and Data Analysis; Chapman and Hall: London, UK, 1986. [Google Scholar]
- Colombo, A.; Fontanelli, D.; Macii, D.; Palopoli, L. Flexible Indoor Localization and Tracking Based on a Wearable Platform and Sensor Data Fusion. IEEE Trans. Instrum. Meas. 2014, 63, 864–876. [Google Scholar] [CrossRef]
- Edwan, E.; Zhou, J.C.; Zhang, J.Y.; Loffeld, O. A New Loosely Coupled DCM Based GPS/INS Integration Method. Navig.-J. Inst. Navig. 2012, 59, 93–106. [Google Scholar] [CrossRef]
- Sabatini, A.M. Quaternion-Based Extended Kalman Filter for Determining Orientation by Inertial and Magnetic Sensing. IEEE Trans. Biomed. Eng. 2006, 53, 1346–1356. [Google Scholar] [CrossRef] [PubMed]
- Kushki, A.; Plataniotis, K.; Venetsanopoulos, A. Kernel-Based Positioning in Wireless Local Area Networks. IEEE Trans. Mob. Comput. 2007, 6, 689–705. [Google Scholar] [CrossRef]
- Bar-Shalom, Y.; Li, X.-R.; Kirubarajan, T. Estimation with Applications to Tracking and Navigation; Wiley: New York, NY, USA, 2001. [Google Scholar]
- Gu, Y.; Song, Q.; Li, Y.; Ma, M.; Zhou, Z. An Anchor-Based Pedestrian Navigation Approach Using Only Inertial Sensors. Sensors 2016, 16, 334. [Google Scholar] [CrossRef] [PubMed]
- Deng, Z.A.; Xu, Y.B.; Ma, L. Joint Access Point Selection and Local Discriminant Embedding for Energy Efficient and Accurate Wi-Fi Positioning. KSII Trans. Internet Inf. Syst. 2012, 6, 794–814. [Google Scholar]
- Mo, Y.; Zhang, Z.Z.; Lu, Y.; Meng, W.X.; Agha, G. Random Forest Based Coarse Locating and KPCA Feature Extraction for Indoor Positioning System. Math. Probl. Eng. 2014, 850926. [Google Scholar] [CrossRef]
- Zou, D.Y.; Meng, W.X.; Han, S. Euclidean Distance Based Handoff Algorithm for Fingerprint Positioning of WLAN System. In Proceedings of the IEEE Wireless Communications and Networking Conference (WCNC) 2013, Shanghai, China, 7–10 April 2013; pp. 1564–1568.
- Li, F.; Zhao, C.; Ding, G.; Gong, J.; Liu, C.; Zhao, F. A Reliable and Accurate Indoor Localization Method Using Phone Inertial Sensors. In Proceedings of the 14th ACM International Conference on Ubiquitous Computing, Pittsburgh, PA, USA, 5–8 September 2012; pp. 1–10.
- Jahn, J.; Batzer, U.; Seitz, J.; Patino-Studencka, L.; Boronat, J.G. Comparison and Evaluation of Acceleration Based Step Length Estimators for Handheld Devices. In Proceedings of the 2010 International Conference on Indoor Positioning and Indoor Navigation (IPIN), Zurich, Switzerland, 15–17 September 2010; pp. 1–6.
- Deng, Z.-A.; Wang, G.; Hu, Y.; Wu, D. Heading Estimation for Indoor Pedestrian Navigation Using a Smartphone in the Pocket. Sensors 2015, 15, 21518–21536. [Google Scholar] [CrossRef] [PubMed]
- Sabatini, A.M.; Martelloni, C.; Scapellato, S.; Cavallo, F. Assessment of Walking Features from Foot Inertial Sensing. IEEE Trans. Biomed. Eng. 2005, 52, 486–494. [Google Scholar] [CrossRef] [PubMed]
- Zhou, M.; Xu, Y.B.; Ma, L.; Tian, S. On the Statistical Errors of RADAR Location Sensor Networks with Built-In Wi-Fi Gaussian Linear Fingerprints. Sensors 2012, 12, 3605–3626. [Google Scholar] [CrossRef] [PubMed]


| Notations | Definitions |
|---|---|
| Coordinate vector of the i-th calibration point | |
| Coordinate vector of the i-th walking step | |
| Ultimate location estimation result at the i-th step | |
| WiFi positioning result using RSS vector collected at the i-th step | |
| Mean RSS vector at the i-th calibration point | |
| Gaussian kernel function with mean vector and covariance matrix | |
| Number of APs used in positioning | |
| DCS/UCS/GCS | Device/User/Global Coordinate System |
| Step length of the i-th walking step | |
| Yaw angle (user heading) estimated at the i-th step at GCS | |
| Direction cosine matrix between DCS and GCS | |
| Rotation quaternion vector at time instants |
| Motion States | Stairs | Elevators | Escalators | Walking | Standing | Doors |
|---|---|---|---|---|---|---|
| Stairs | 0.995 | 0 | 0 | 0.005 | 0 | 0 |
| Elevators | 0 | 1.0 | 0 | 0 | 0 | 0 |
| Escalators | 0 | 0 | 1.0 | 0 | 0 | 0 |
| Walking | 0 | 0 | 0 | 1.0 | 0 | 0 |
| Standing | 0 | 0 | 0 | 0 | 1.0 | 0 |
| Doors | 0 | 0 | 0 | 0.02 | 0 | 0.98 |
| Compared Approach | Proposed Fusion | Fusion Approach (Empirical) | PDR (All + Landmark) | PDR (Gyro) | WiFi Positioning | Improved WiFi Positioning |
|---|---|---|---|---|---|---|
| Mean error | 0.72 | 0.96 | 1.22 | 3.12 | 3.01 | 2.43 |
| Standard deviation | 0.44 | 0.58 | 0.74 | 2.63 | 2.69 | 1.95 |
| Medium error | 0.68 | 0.89 | 1.08 | 2.30 | 2.12 | 2.03 |
| 75 percentile | 0.92 | 1.32 | 1.55 | 4.66 | 3.44 | 3.21 |
| 90 percentile | 1.35 | 1.73 | 2.10 | 7.05 | 5.26 | 4.42 |
© 2016 by the authors; licensee MDPI, Basel, Switzerland. This article is an open access article distributed under the terms and conditions of the Creative Commons Attribution (CC-BY) license (http://creativecommons.org/licenses/by/4.0/).
Share and Cite
Deng, Z.-A.; Wang, G.; Qin, D.; Na, Z.; Cui, Y.; Chen, J. Continuous Indoor Positioning Fusing WiFi, Smartphone Sensors and Landmarks. Sensors 2016, 16, 1427. https://doi.org/10.3390/s16091427
Deng Z-A, Wang G, Qin D, Na Z, Cui Y, Chen J. Continuous Indoor Positioning Fusing WiFi, Smartphone Sensors and Landmarks. Sensors. 2016; 16(9):1427. https://doi.org/10.3390/s16091427
Chicago/Turabian StyleDeng, Zhi-An, Guofeng Wang, Danyang Qin, Zhenyu Na, Yang Cui, and Juan Chen. 2016. "Continuous Indoor Positioning Fusing WiFi, Smartphone Sensors and Landmarks" Sensors 16, no. 9: 1427. https://doi.org/10.3390/s16091427