Efficiency Enhancement of a Cantilever-Based Vibration Energy Harvester

Abstract
: Extracting energy from ambient vibration to power wireless sensor nodes has been an attractive area of research, particularly in the automotive monitoring field. This article reports the design, analysis and testing of a vibration energy harvesting device based on a miniature asymmetric air-spaced cantilever. The developed design offers high power density, and delivers electric power that is sufficient to support most wireless sensor nodes for structural health monitoring (SHM) applications. The optimized design underwent three evolutionary steps, starting from a simple cantilever design, going through an air-spaced cantilever, and ending up with an optimized air-spaced geometry with boosted power density level. Finite Element Analysis (FEA) was used as an initial tool to compare the three geometries' stiffness (K), output open-circuit voltage (Vave), and average normal strain in the piezoelectric transducer (εave) that directly affect its output voltage. Experimental tests were also carried out in order to examine the energy harvesting level in each of the three designs. The experimental results show how to boost the power output level in a thin air-spaced cantilever beam for energy within the same space envelope. The developed thin air-spaced cantilever (8.37 cm3), has a maximum power output of 2.05 mW (H = 29.29 μJ/cycle).1. Introduction
Most of the energy harvesting units found in the literature are based on vibration using piezoelectric transducers. This is attributed to the simplicity of these systems and the level of energy offered by vibration sources [1,2] and also because of the piezoelectric compatibility with electronic devices, particularly commercial portable devices and wireless sensor nodes [3]. In this research, for the purpose of energy harvesting from a rolling tyre, vibration-based energy harvesting is an option [4–12].
Tyre vibration is an attractive energy source in which energy harvesting might be applied. Several studies have been completed to measure tyre vibration under different loading and road surface conditions using different techniques. For instance, the Pirelli Tire System project in co-operation with the Mechanical Engineering Department of the Politecnico di Milano have published a paper regarding measurements of pneumatic tyre acceleration under rolling conditions using a three-axial MEMS accelerometer [13]. From this paper, it can be seen that harvestable vibration energy is around the 100 Hz range. Kindt et al. [14] carried out experiments on tyre vibration, and collected experimental data using a Laser Doppler vibrometer and the high power vibration energy density was also around 100 Hz. A similar frequency spectrum pattern was obtained by Roundy [15,16] and Löhndorf et al. [6]. Vibration based piezoelectric, electrostatic and electromagnetic micro generators for tyre pressure monitoring have been developed by several researchers and companies [9–11,17–24], but in most cases, micro generator performance highly depends on the applied frequency in such a way that it has a quite narrow band width of the efficient power generation level around its resonance frequency which makes it not suitable for the variable excitation frequency environment, such as in land vehicle tyres. However, vibration energy harvesters can be a good option when applied on constant speed machinery by toning their resonance frequencies with the machines' operation speeds. Khameneifar and Arzanpour [5] made a theoretical model for a bending-based energy harvester attached on a pneumatic inner tyre surface in which the generated electric charge was proportional to tyre speed and radial deflection. Calculation findings can be summarised to a prediction of a power generation of approximately 2.95 mW at 50 km/h when a 30 kΩ load resistor is used. Its also worth mentioning that tyre induced vibration is highly affected by road surface roughness which can change vibration velocity and acceleration amplitudes [13,25]. This can directly affect the amount of the harvested energy when a vibration energy harvester is employed.
Active TPMSs power consumes less than passive TPMSs, with a power consumption around 200–250 μWs for a State-of-the-Art TPMS module [26]. The maximum power output level of vibration energy harvester in the literature found to be between 2.5 μW and 349 μW and as shown in Table 1.
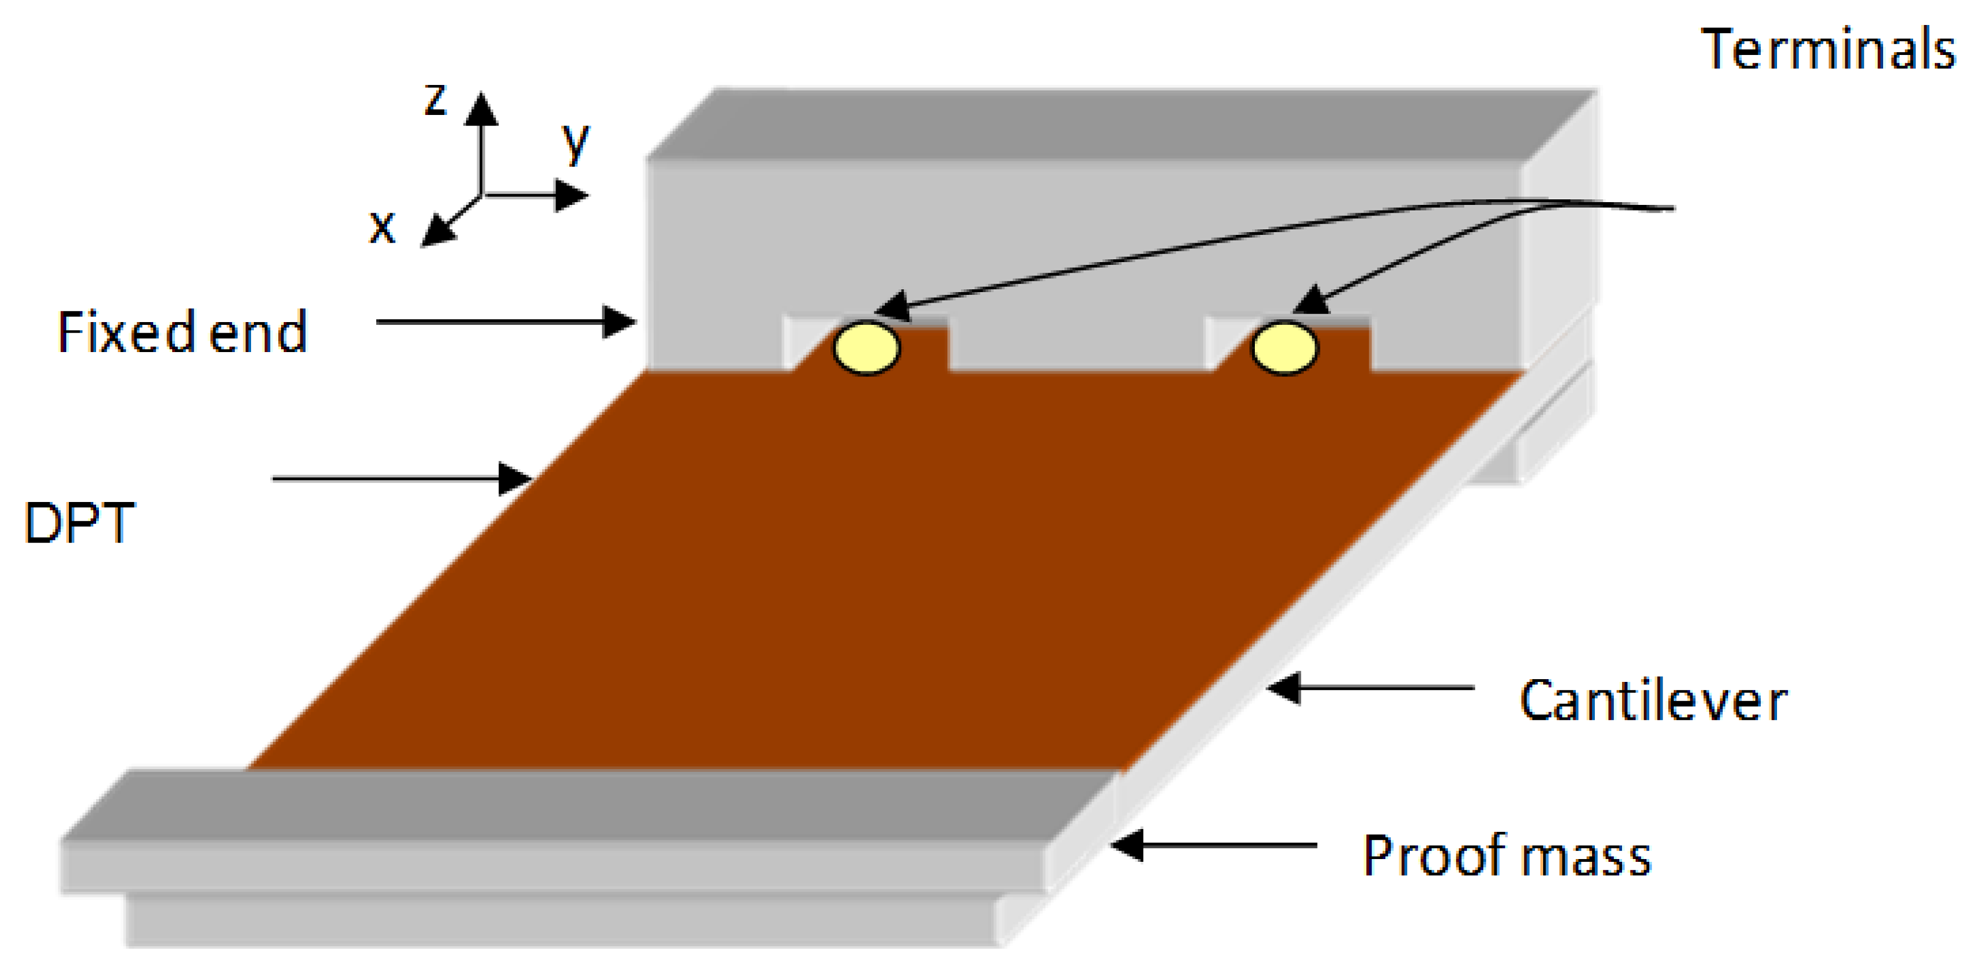
This article presents the design, theoretical analysis, FEA simulations and experimental investigation of a thin piezoelectric based vibration energy harvester. The DuraAct patch transducer element (DPT) used in this study is a compact and flexible unit which utilizes a thin piezoceramic foil sandwiched between two conductive films all embedded in a ductile composite-polymer structure, labelled (DuraAct P-876.A11) and developed by PI (Physik Instrumente) Ltd. The performance of the developed design differs from conventional cantilever based energy harvesters in terms of the output power level and density. Following the energy harvester analysis, a power management circuit designed by the author is also presented. Finally the developed power management circuit is employed to link between the promoted energy harvester and a capacitive sensor readout circuit designed by the author.
2. Characterizing the DPT Element
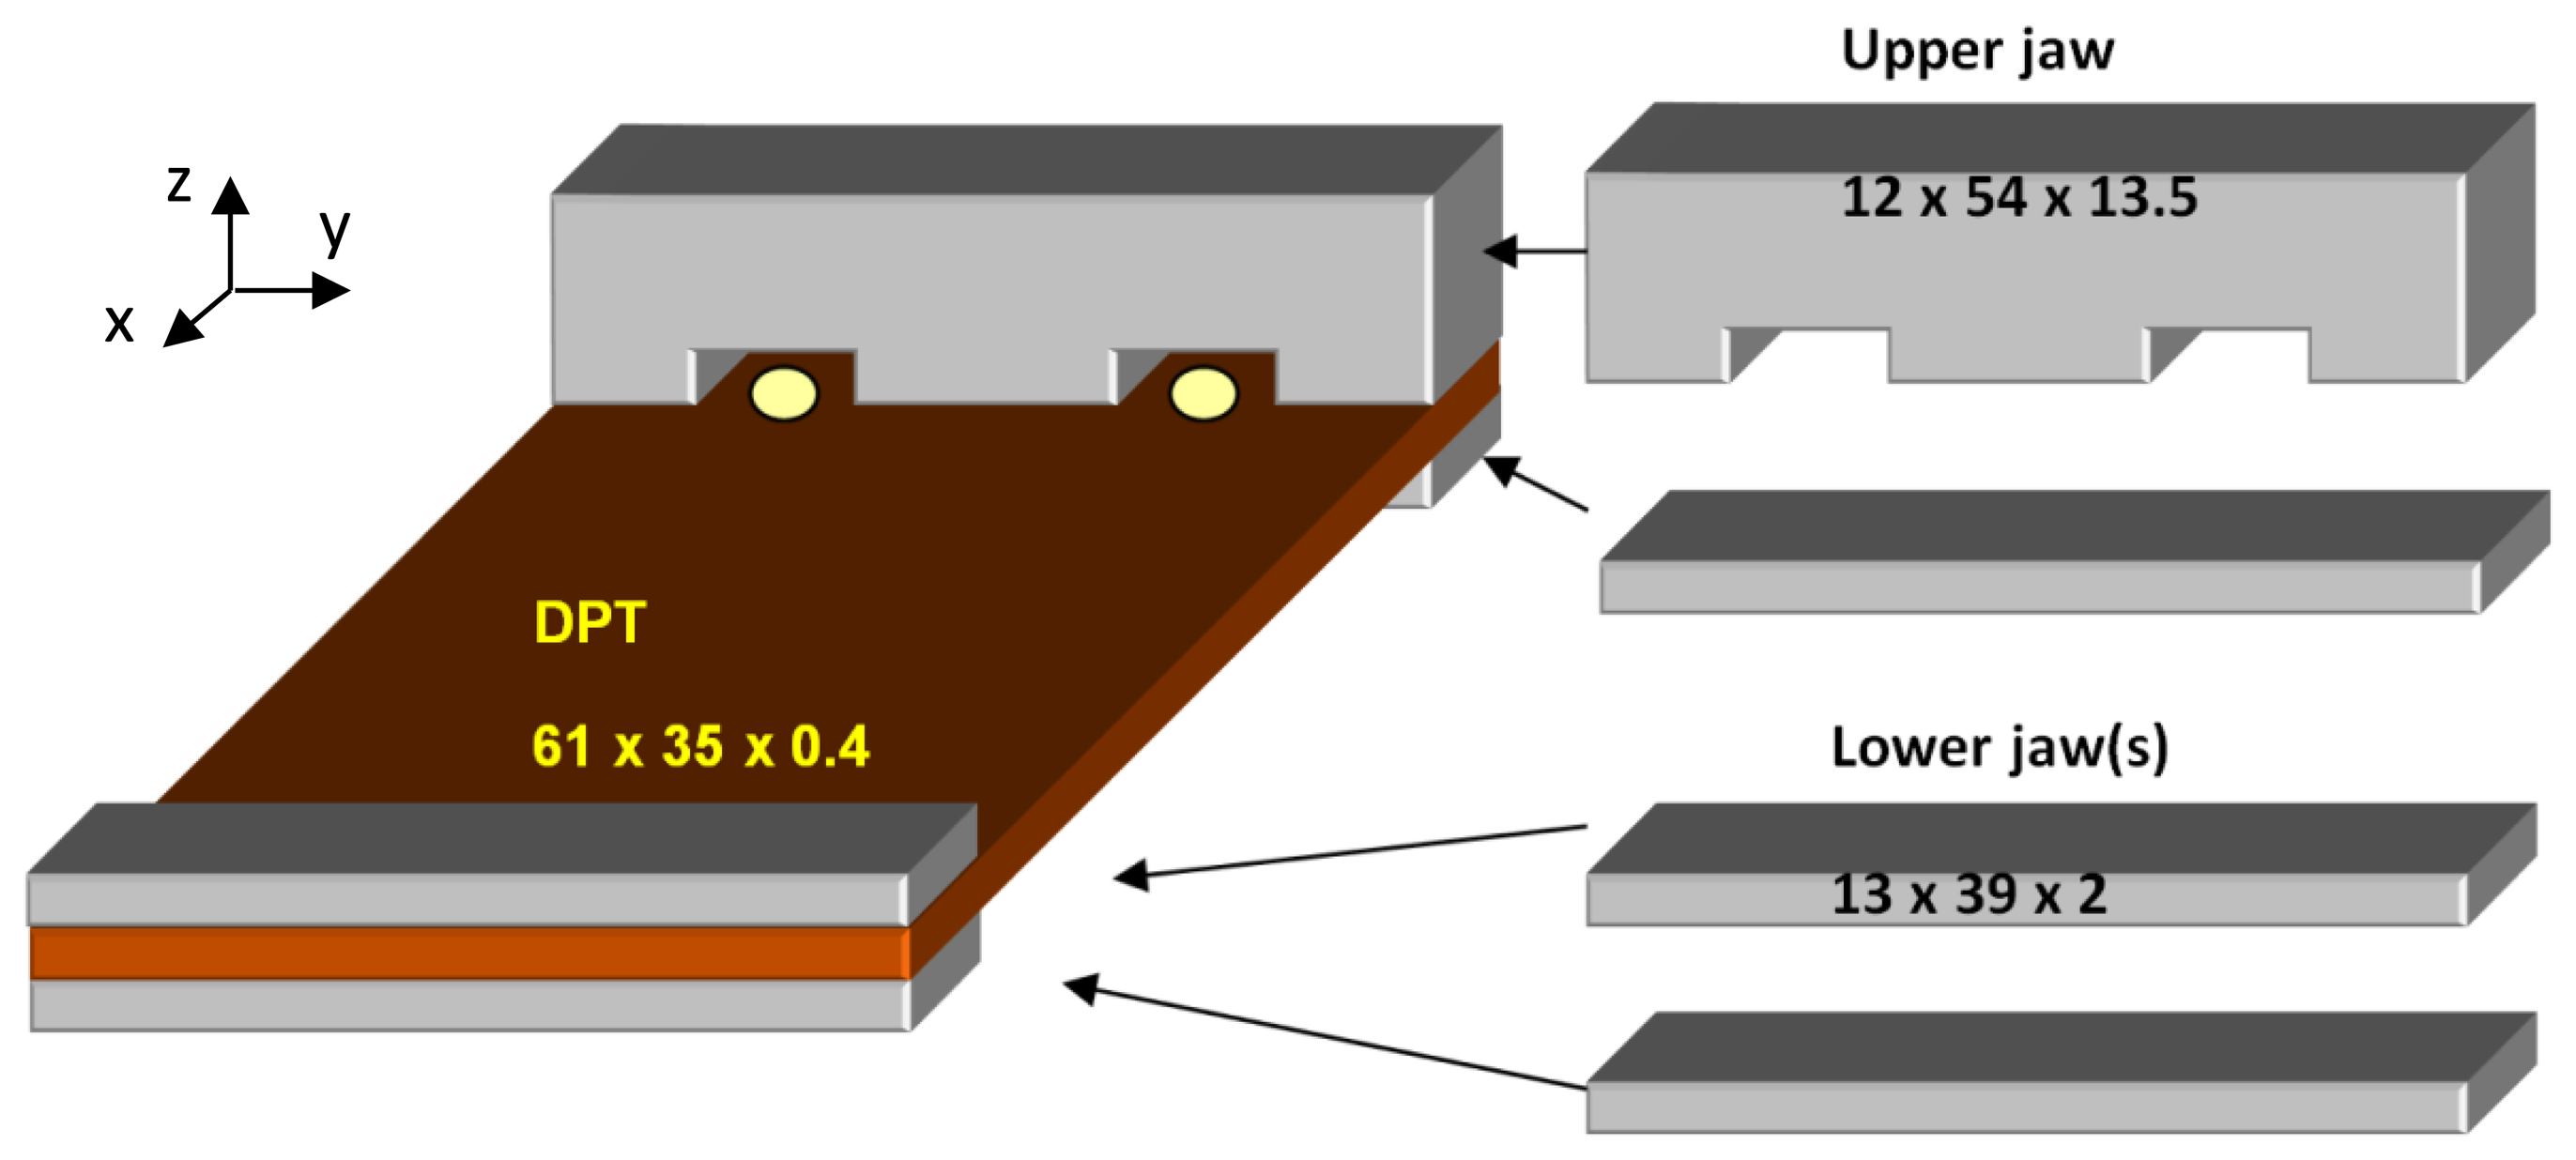
This section presents the main features of the DPT transducer used in this study (see Figure 1). The reason behind choosing this transducer is its high charge coefficient d33 (394 pC/N), high mechanical strength and flexibility, and wide operation temperature range (−20 to 150 °C), making it well suited for energy harvesting within a tyre environment. The main dimensions of the transducer are shown in Figure 2.
In addition to the electrical and mechanical characteristics of the transducer given by the manufacturer, experimental tests were carried out in the school of mechanical engineering laboratories to find out more about the mechanical and electrical properties this transducer.
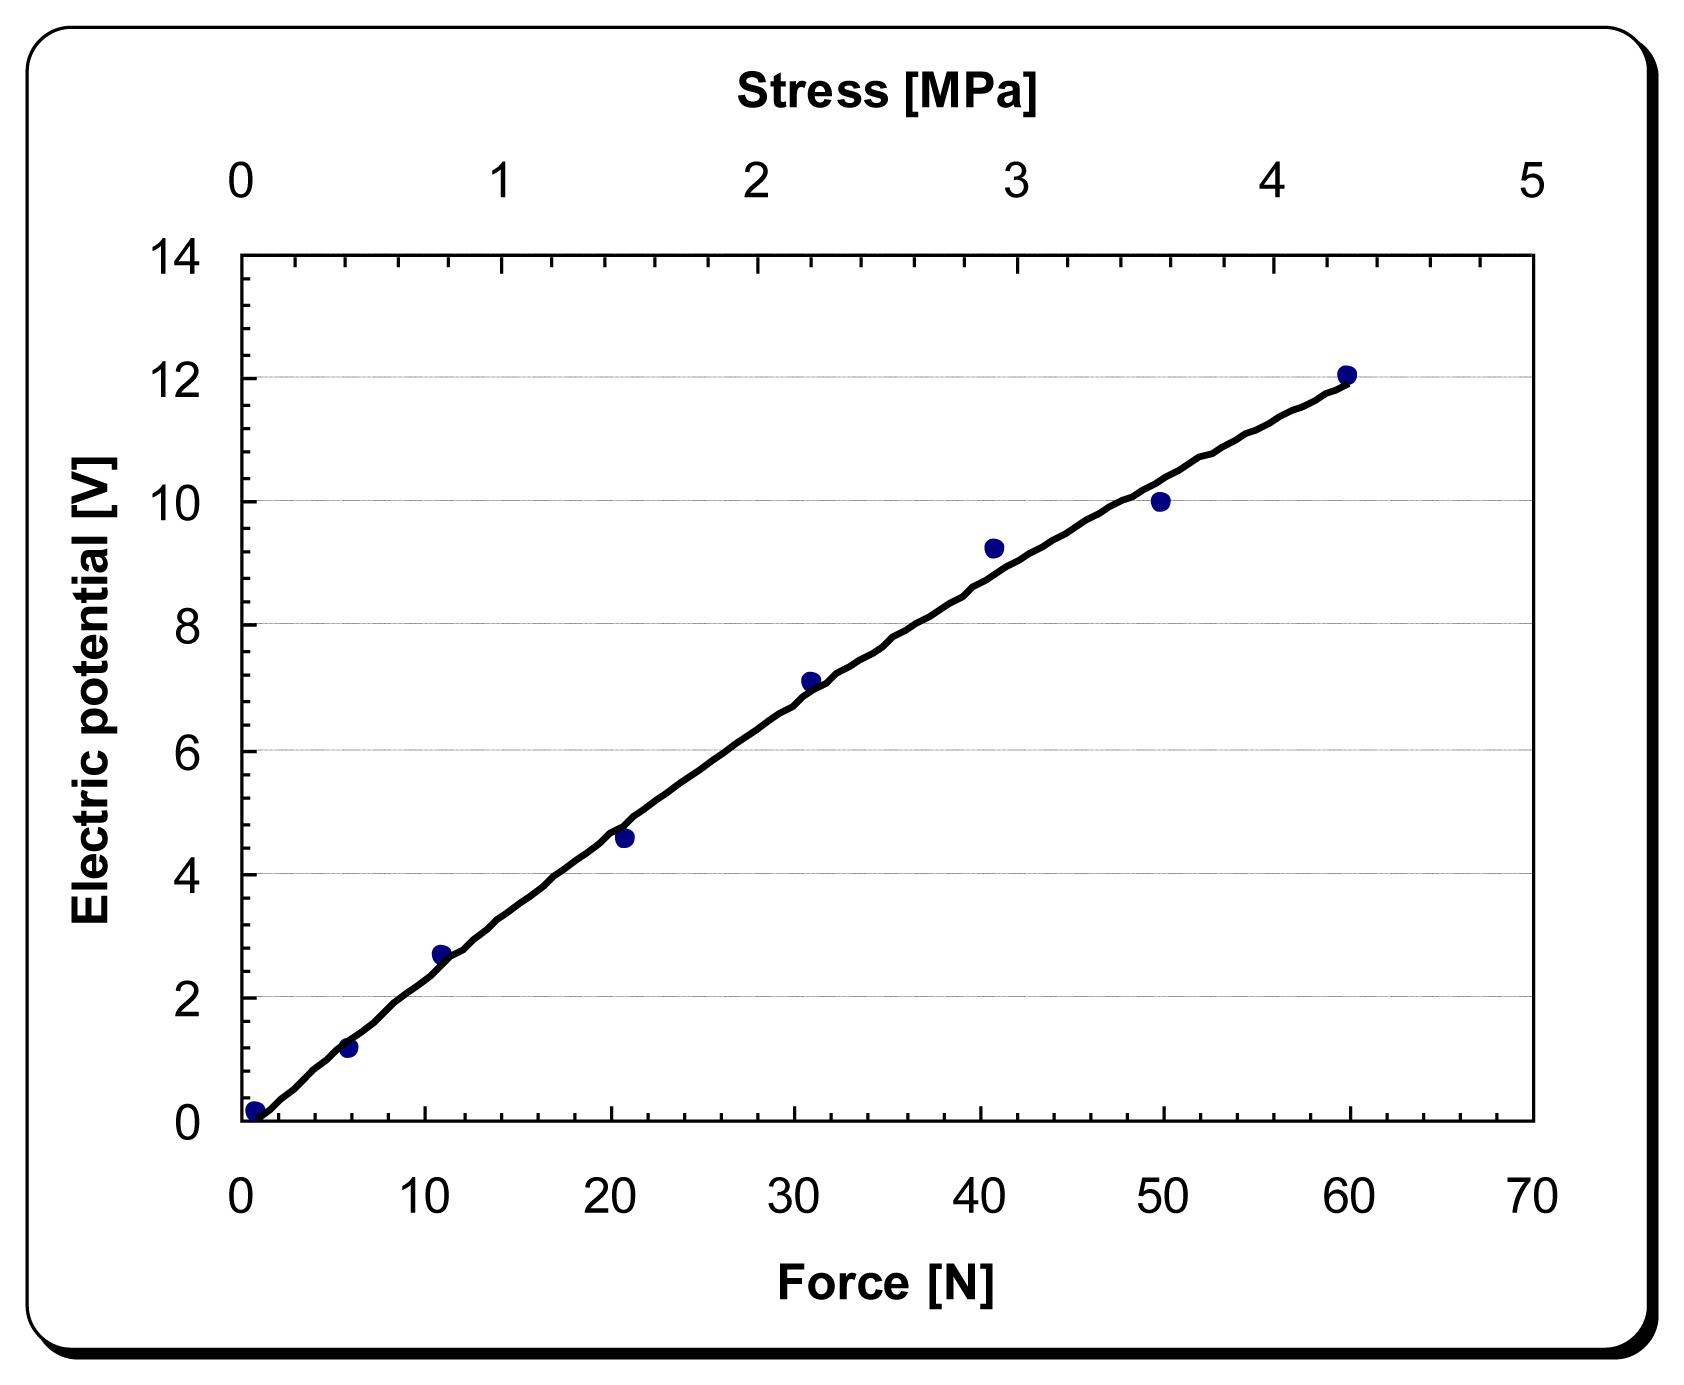
In order not to damage the electrical contacts of the DPT transducer, a couple of custom made jaws were used as shown in Figure 3. The experimental tests which were carried out examined the piezoelectric effect and Young's modulus of elasticity of the transducer at different force-rates along the x-axis, as shown in Figures 4 and 5, respectively.
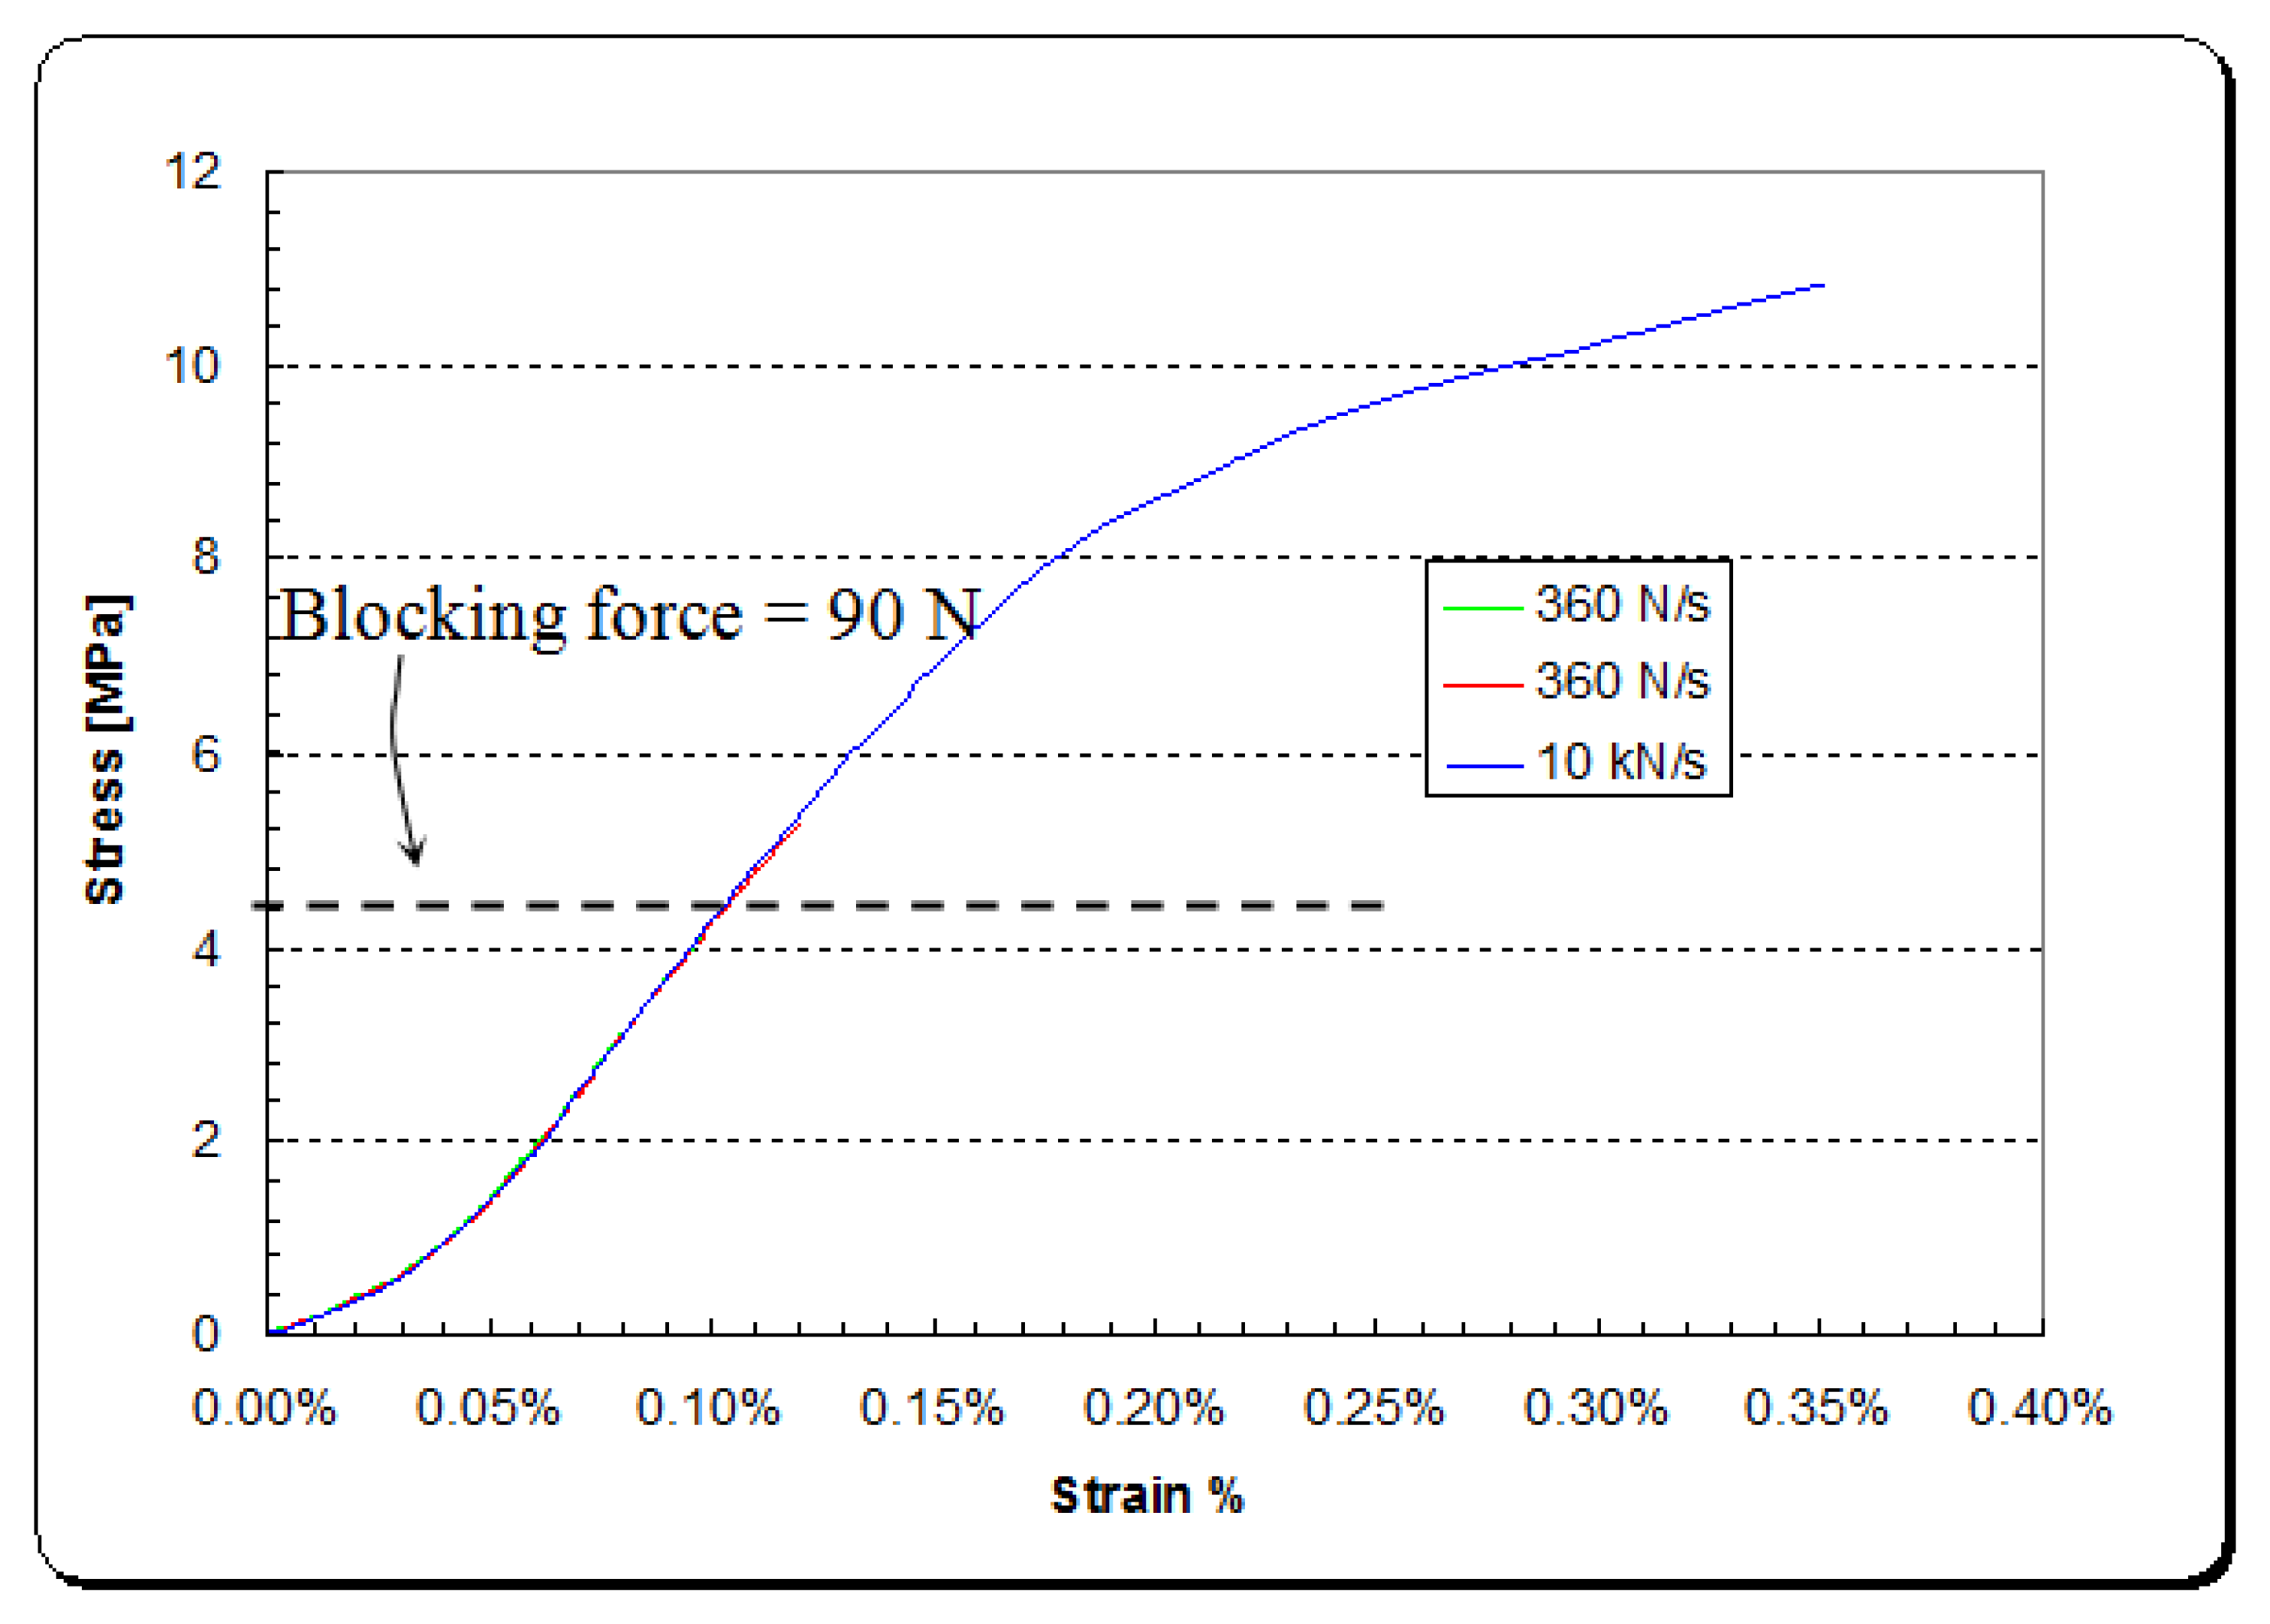
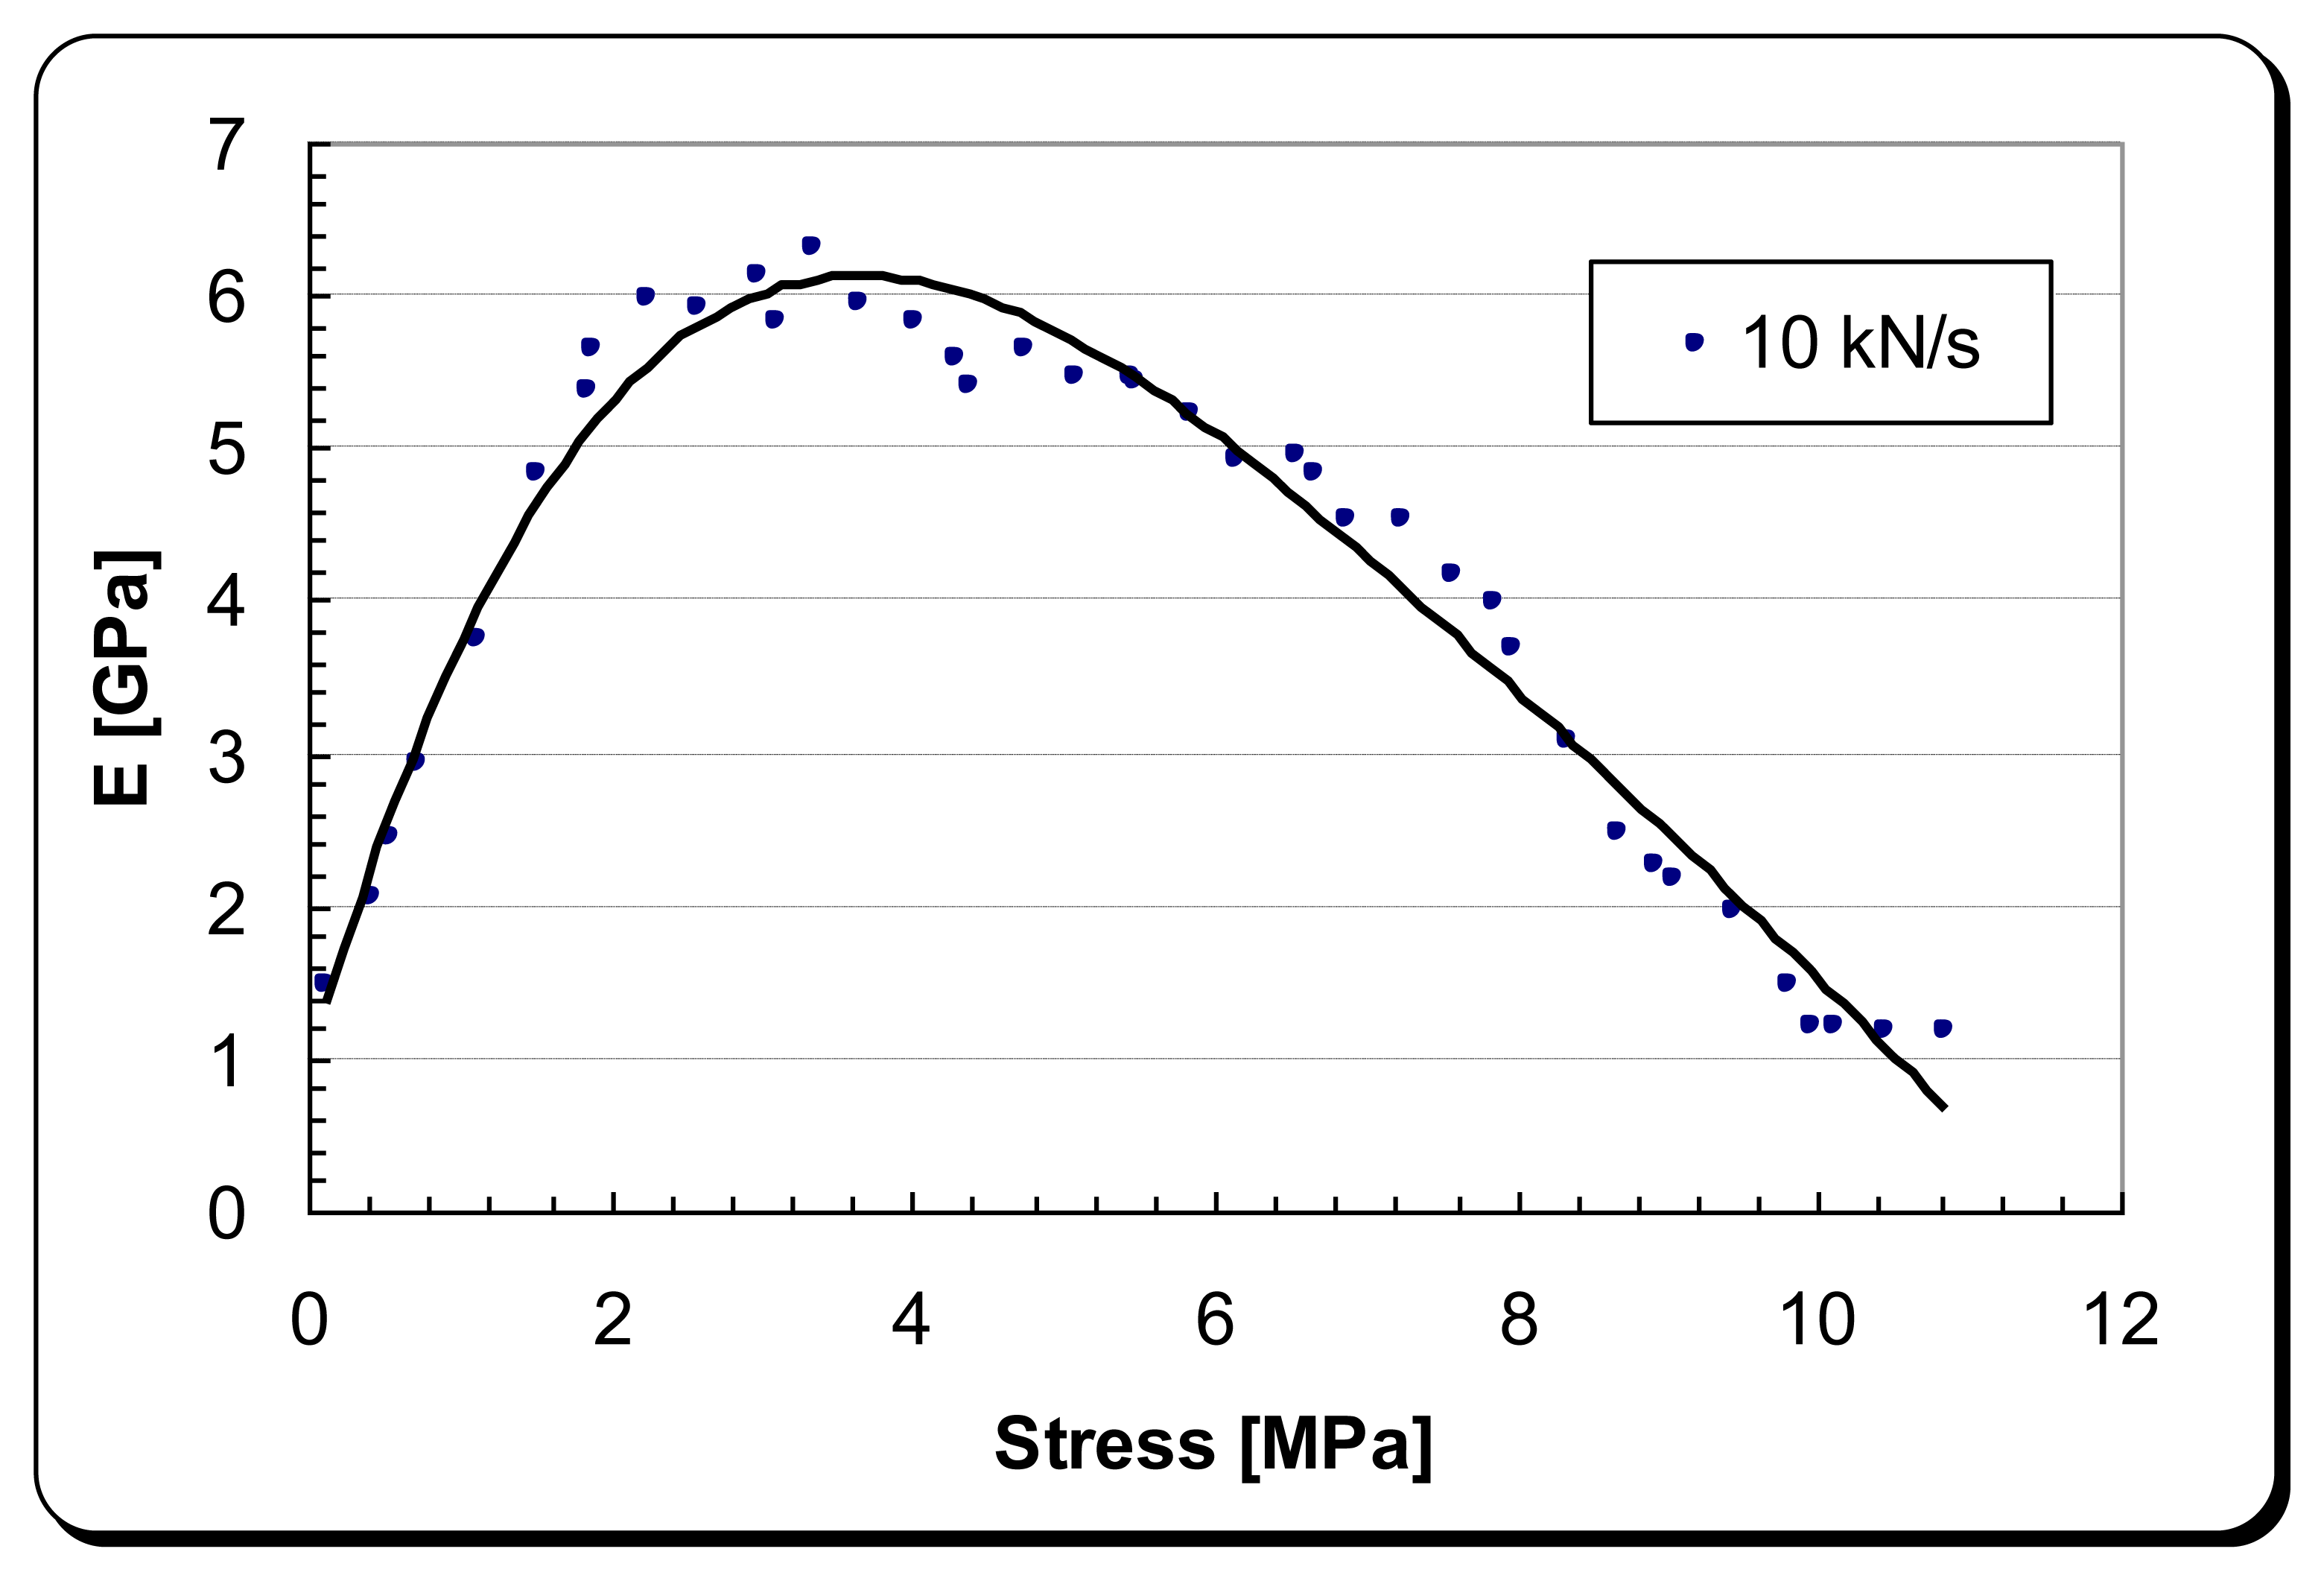
Figure 5 shows that the DPT transducer has a hyperelastic stress-strain relationship in the x-direction. This results in a variable modulus of elasticity for the DPT transducer, depending on how much tensile stress is being applied as shown in Figure 6. Modulus of elasticity experimental data were fed into the FEA modelling.
Non-linearity is a fundamental behavior in piezoelectric materials [30]. Figure 5 shows non-linearity in the stress-strain curve. This could be also due to the laminated structure of the patch transducer which consists of a piezoceramic plate, electrodes and preloaded polymer materials acting as mechanical preload and also as electrical insulation, making the DuraAct bendable [31]. The blocking force can be defined as the force required for pushing back a fully energized actuator to zero displacement.
The next section presents the development of a high power density energy harvester through modifying the design of the cantilever that holds the DPT transducer as shown in Figure 7.
3. Cantilever Design Optimization
Cantilever geometry in a vibration based energy harvester is a crucial factor to the efficiency and effectiveness of the device. Having electric charge generated by a piezoelectric element is mainly influenced by the strain distribution within the transducer. Optimized cantilever designs usually tend to increase the average strain value across the transducer surface area and prevent overstraining the transducer [32–34]. Zheng [35,36] presents an alternative cantilever design; that is an air spaced cantilever, in which a fairly even strain distribution across the piezoelectric transducer layer is obtained by increasing the distance between the piezoelectric transducer layer and the neutral plane of bending [35].
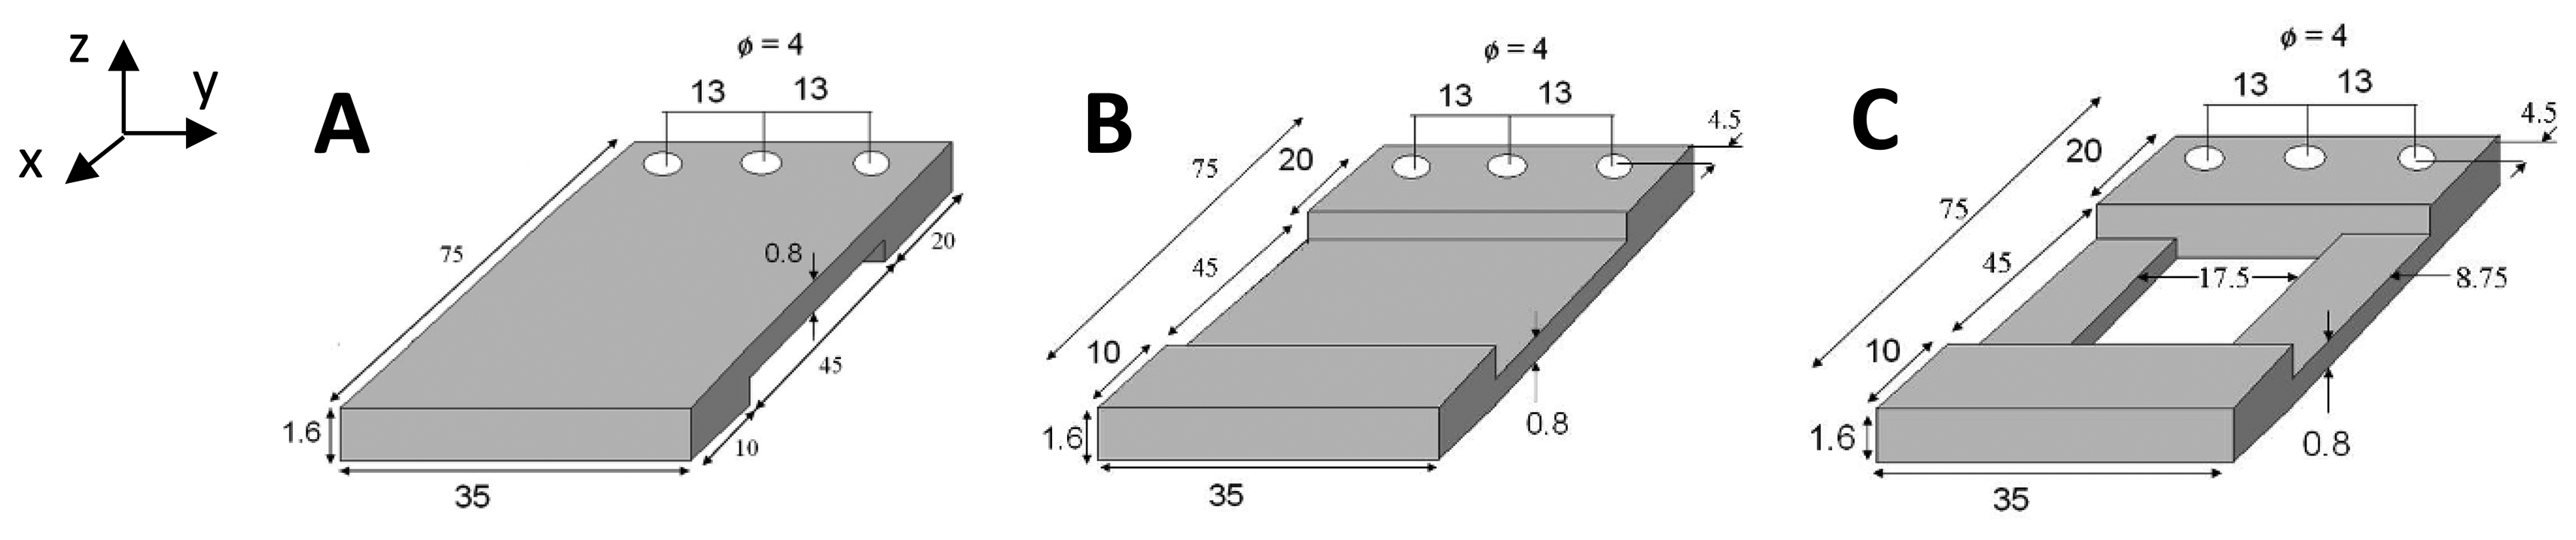
Figure 8 shows the three evolutionary steps, (designs A, B and C), which the optimized design underwent; starting from a simple cantilever design, going through an air-spaced cantilever, and ending up with an optimized air-spaced geometry with a boosted power density level. The same proof mass (47 g) is used in all designs, and all geometries are contained in the same space envelope (see Figure 7). Dimensions were chosen to achieve high deflection in the DFT but also within the fatigue limits of the cantilever assembly.
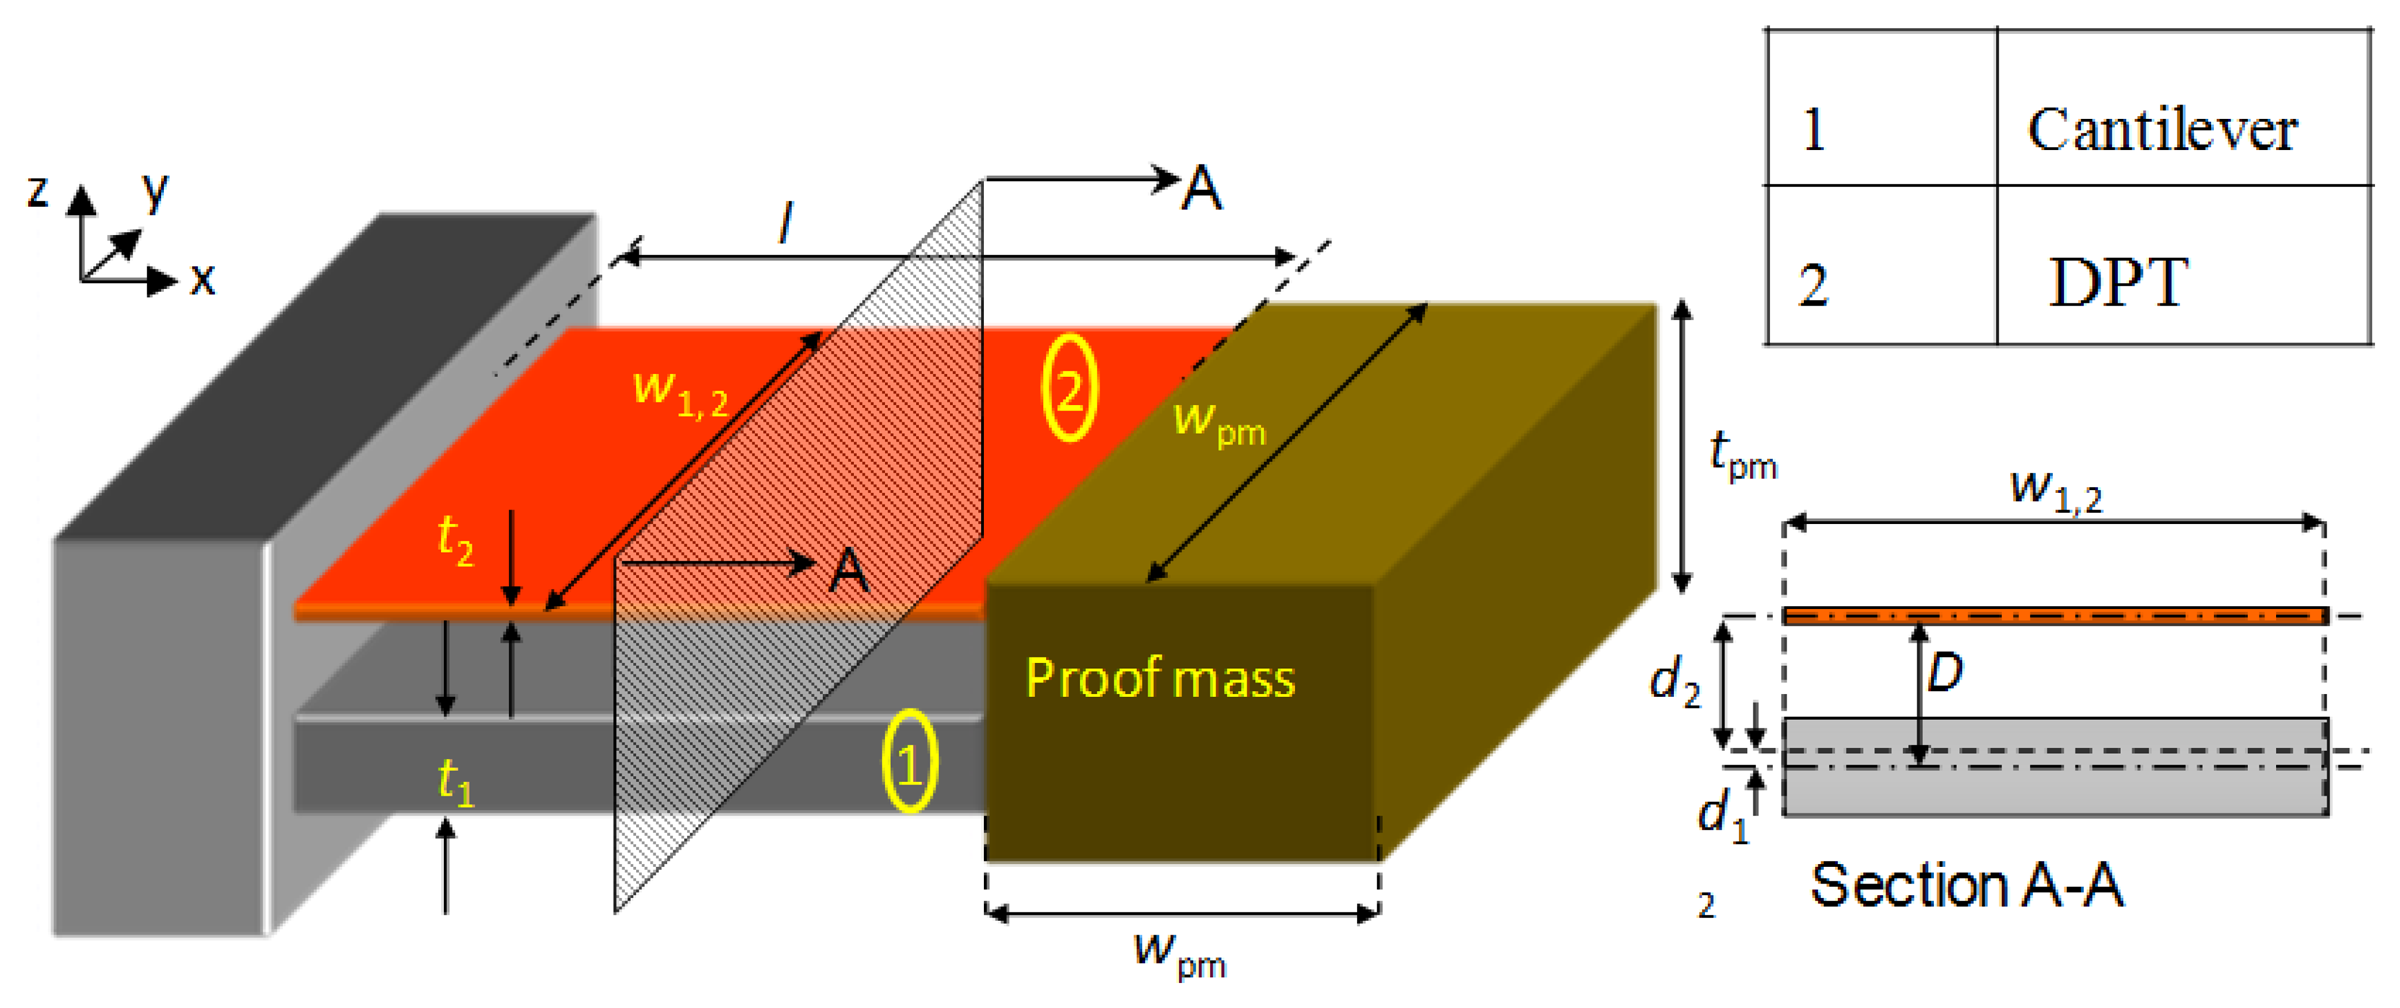
In order to compare between the three designs' performances, properties like the flexural rigidity and the average normal strain distribution in the x-direction (εx)avg need to be examined. In the following paragraphs, analytical calculations, using the formulae derived by Zheng [35], and FEA simulations using COMSOL software for all designs, are presented. A general schematic diagram for the vibration-based energy harvester is shown in Figure 9 below. Cross-sections of the energy harvester for the three cantilever designs are shown in Figure 10.
3.1. Theoretical Analysis
This section presents the theoretical formulae and the corresponding calculated values of the fundamental parameters of the energy harvester assembly for the three cantilever designs. The formula used in this analysis presented in Table 2 are quoted from Zheng and Xu [35]. Table 3 shows the given data and calculated mechanical and electrical parameters needed to compare between the influences of each of the three cantilever designs in the performance of the vibration-based energy harvester.
In order to determine the location of the neutral axis for the cantilever-DPT assemblies shown in Figure 10, the following formula is applied [37]:
Having the energy harvester harmonically excited by the motion of the supported points as shown in Figure 11, the energy balance of the energy harvesting system from time ti to tf can be obtained [38,39]:
The term on the left-hand side represents the input mechanical energy (Einp). The first term on the right-hand side represents the energy dissipated due to mechanical damping within the cantilever-DPT assembly (Edsp). According to Shu and Lien [38], and assuming a 90° phase difference (θ = 90°), these two terms can be re-written as:
Although both force and displacement experienced by the oscillating mass are harmonic, the relationship between them is still linear as shown in Figure 12.
Thereby, the input mechanical energy for a quarter oscillation cycle can be obtained as:
Consequently, the total input mechanical energy for a complete oscillation cycle would be:
Similarly, the energy dissipated due to mechanical damping can be written as:
The second term on the right-hand side in Equation (2) represents the electrical energy generated by the energy harvester (Egen). In this study, the electrical energy generated by the harvester is stored in a 2,200 μF storage capacitor (C) after passing through a full bridge rectifier as shown in Figure 13. By neglecting any rectification losses and any other electrical losses, the energy stored in the storage capacitor (Eout) can be assumed to be equal to the energy generated by the energy harvester (Eout = Egen) and can be obtained as follows [40]:
The overall system efficiency can be obtained as:
In this analysis, the cantilever has a relatively considerable mass mc compared to the proof mass mpm. For this reason it is assumed that the calculations for the kinetic energy, harmonic excitation force, and the amplitude of oscillation of the vibrating energy harvester consider the overall oscillating mass (mc + mpm + mdpt) and at the centroid of the total oscillating mass, which is calculated using the first moment of mass as presented in Table 3 [37]. Locations of the centre of mass for the three designs are listed in Table 3. The periodic motion of the cantilever-DPT assembly is assumed to follow the harmonic motion formulae as follows [41]:
Velocity and acceleration of oscillation are the first and second time derivatives of Equation (9) respectively [41]:
The damping coefficient c is measured experimentally, firstly by observing the rate of decay ξ under free vibration (see Figure 14) and by using the logarithmic decrement formula [41]:
Then the damping coefficient c can be obtained using the following formula [41]:
The amplitude at resonance can be found to be [41]:
Using Newton's second law, the induced force at the position of centroid can be obtained:
Using Equation (5), Equation (15) can be rewritten as:
Similarly, the energy dissipated due to mechanical damping can be written as:
By substituting Equations (16) and (17) into Equation (2), the energy balance equation can be rewritten as:
Having only the mechanical damping influence considered in the energy balance equation as the main source of energy dissipation, a fourth term (Elos) is added to contain any other losses within the system, e.g., electrically induced damping. Therefore, Equation (18) can be rewritten as:
The following section presents preliminary numerical results of the characteristics of energy harvesters obtained using COMSOL software.
3.2. Numerical Analysis
This section presents the FEA simulations for the three cantilever-DPT assembly designs in terms of mechanical properties; e.g., deflection, resonance frequency and normal strain across the DPT element, and electrical response; that is the voltage generated by the DPT element. The FEA software used to carryout the numerical analysis for the vibration-based energy is COMSOL.
Settings and limitations of the FEA can be summarized by:
Isotropic mechanical properties for both the cantilever and the DPT element.
Uniform gap between the cantilever and the DPT element in the harvester assembly for each case study.
Stress-free condition when no load is applied to the harvester assembly.
Simulation was carried out in two categories: static and modal analysis. The former includes the cantilever-DPT assembly stiffness and the voltage output of the harvester (Figure 16). The latter determines the cantilever-DPT natural frequency. The three cantilever designs were considered in both analyses. A summary of the main results found in these simulations are shown in Table 4.
From Table 4 it can be seen that design C is the best among the three designs for energy harvesting purposes as it offers the highest normal strain (εavg) within the DPT layer, and therefore generates the highest electrical charge under the same loading conditions.
Figure 17 below shows the voltage output of the piezoelectric layer when the cantilever-DPT assembly is subjected to a vertical static load of 1.4 N at the free end as shown in Figure 16. Higher voltage values can be observed in design C.
4. Experimental
This section presents the experimental procedures and the obtained results of testing the vibration energy harvester for the three different cantilever designs. Obtained results include rate of decay of oscillation, cantilever-DPT assembly stiffness, resonance frequency, acceleration of oscillation, harvested energy and the output power of the energy harvester as a function of the storage capacitor voltage and excitation frequency. The apparatus used are shown in Figure 18. The accelerometer used to measure the acceleration of excitation is a product of Brüel & Kjær (Sound and Vibration Measurement A/S), type 4344 307768.
Figure 19 shows the collected experimental data of the rate of decay of oscillation for the three cantilever-DPT assemblies.
The experimental data of the force versus free-end displacement of the three cantilever-DPT assemblies are shown in Figure 20.
Following this, forced vibration tests for the three designs were carried out in two ways:
Identical excitation acceleration of 0.5 g;
Identical amplitude of excitation of 40 μm.
Experimental tests, using the apparatus shown in Figure 18, were carried out in order to examine the energy harvesting level obtained in each of the three designs. A full wave rectifier was used in order to convert the generated energy from the DPT from an AC to DC signal. This energy was subsequently stored in a 2,200 μF capacitor (see Figure 13). Each design was excited from the cantilever base by its fundamental structural resonance frequency first with a peak acceleration of ±0.5 g, and then with a ±40 μm amplitude of excitation. The voltage built-up in the storage capacitor and the corresponding generated power by the energy harvester are shown in Figures 21 and 22, respectively. For the energy harvester containing the design C cantilever and undergoing ±0.5 g acceleration of excitation, the output power as a function of excitation frequency is shown in Figure 23.
Table 5 shows a summary of the experimental results for the tests presented above. It also shows the values of the energy main parameters of the harvesting system calculated using the mathematical formulae presented in Section 3.1. The volume power density (Pdns) was calculated using the space envelope containing the energy harvester (6.5 × 5.2 × 0.5) = 16.9 cm3.
When comparing the energy generated per one cycle (Hout) and (Pavg) in each cantilever under ±40 μm amplitude of excitation, although design B has the maximum power output among the three designs, it can be seen that there is a dramatic increase in the device efficiency in design C. That is due to the different frequency of oscillation and therefore the time spent to generate that amount of energy. This makes design C the most suitable design among the three studied designs for energy harvesting purposes. The following section presents the integration of the optimized vibration based energy harvester into a developed capacitive sensor read-out circuit designed by the author.
5. Power Management Circuitry
This section illustrates a power management unit, designed by the author, to regulate the energy generated by the developed vibration-based energy harvester. It also demonstrates the integration of the energy harvester with the power management unit into the read-out circuit presented in this article. A block diagram showing all the three integrated units to make a complete self-powered wireless sensor node powered by vibration energy harvesting is shown in Figure 24.
The power management design requirement is monitor the voltage across the storage capacitor and switching on and off the application load, which is in this case the capacitive sensor read-out and transmission circuit. MAX981 comparator, which is the main component in the power management circuit, was chosen for its low power consumption and therefore minimizing the overall power loss for running the transmission circuit. MAX971/981 comparator acts as the main switch to turn on and off the application circuit (λ oscillator), and therefore it controls the discharge of the storage capacitor whenever the voltage of the capacitor reaches a certain level [42]. The comparator allows switching with hysteresis; that is the turn-on and turn-off voltages are slightly different. This way the system will have an operation voltage range for the application circuit and the switching voltages can be controlled by changing the hysteresis resistors. This comparator was chosen after comparing and testing it with two other comparators as shown in Table 6.
The PCB layout of the integrated power management unit with the λ oscillator/transmitter is shown in Figure 25. Given the tangential acceleration component inside a rolling pneumatic tyre shown in Figure 26 [16], the developed energy harvester was tested at a low level of acceleration excitation at resonance. The available shaker was capable of delivering as low as ±0.05 g of excitation acceleration, which is within the excitation range occurring in a rolling wheel as presented in Figure 26, and thereby the system was tested at that acceleration level to approach vibration conditions within a rolling pneumatic tyre as much as possible. Acceleration data were gathered by affixing an accelerometer on an R13 rim inside tyre cavity. The transmitted signal is a frequency signal, meaning that the RF frequency of the received signal is driven by the vale of the capacitance in the capacitive sensor. The conducted results at steady state charging-discharging cycle (Figures 27 and 28) showed an average sampling rate of approximately 0.166% (9.95 sample/min). The switching voltage range, bordered using two blue dashed lines in Figures 27 and 28, was chosen to ensure a reasonable balance between the transmitter/oscillator power consumption and the amount of the generated power by the energy harvester.
6. Conclusions
A study of a vibration-based cantilever energy harvester is presented in this article. Three vibration-based energy harvester designs are compared theoretically, numerically and experimentally to determine the influence of the harvester geometry on the overall device power output and efficiency. The device, of which the highest power output was achieved, was employed as the power supply of the λ-diode oscillator/transmitter designed by the author under vibration conditions close to those existing in a rolling tyre, to determine its feasibility of powering a TPMS.
The experimental results show a successful attempt to boost the power output level, in a thin air-spaced cantilever beam for energy within the same space envelope, and virtually quadruple the energy harvester efficiency when the same excitation amplitude is applied.
However, in this type of energy harvesting, assuming no contribution from resonance or harmonics, the output power of such a system is inversely proportional with the square of the excitation frequency [16], and usually these systems require adding a proof mass to enhance their efficiency. For these two reasons, and for powering a TPMS, an alternative energy harvesting system is required, e.g., a multi-resonance vibration energy harvester or a direct strain energy harvester that can extract energy from cyclic tyre deformation. Having the energy harvester installed inside tyre cavity, a robust packaging is essential. Ideally, the energy harvester needs to be as close and compact as possible with the TPMS electronics and therefore containing the energy harvester inside the TPMS casing is desirable.
Acknowledgments
This work was supported by the Engineering and Physical Sciences Research Council, the Technology Strategy Board (grant number 11200-73308), and the University of Birmigham. The author would like to show his appreciation for all research and staff members at the School of Mechanical Engineering at the University of Birminghamm and College of Enginerring at Al-Nahrain University for their valuable assistance and guidance towards accomplishing this project.
Conflicts of Interest
The authors declare no conflicts of interest.
References
- Roundy, S.; Wright, P.K.; Rabaey, J. A study of low level vibrations as a power source for wireless sensor nodes. Comput. Commun. 2003, 26, 1131–1144. [Google Scholar]
- Beeby, S.; Tudor, M.; White, N. Energy harvesting vibration sources for microsystems applications. Meas. Sci. Technol. 2006, 17, R175–R195. [Google Scholar]
- Cook-Chennault, K.A.; Sastry, A.M.; Thambi, N. Topical review: Powering MEMS portable devices—A review of non-regenerative and regenerative power supply systems with special emphasis on piezoelectric energy harvesting systems. Smart Mater. Struct. 2008, 17, 043001. [Google Scholar]
- Roundy, S. Energy Harvesting for Tire Pressure Monitoring Systems. Proceedings of the First Annual Workshop on Micro Power Techologies, San Jose, CA, USA, 22 October 2009.
- Farbod, K.; Siamak, A. Energy harvesting from pneumatic tires using piezoelectric transducers. ASME Conf. Proceed. 2008, 2008, 331–337. [Google Scholar]
- Löhndorf, M.; KvisterØy, T.; Westby, E.; Halvorsen, E. Evaluation of Energy Harvesting Concepts for Tire Pressure Monitoring Systems. Proceedings of Power MEMS 2007, Freiburg, Germany, 28–29 November 2007; pp. 331–334.
- Sham, I. Cost-Effective Piezoelectric-Based Energy Harvesting Solution for Tire Pressure Monitoring System. Presented at Energy Harvesting and Storage, Denver, CO, USA, 4 November 2009.
- Frey, A.; Seidel, J.; Schreiter, M.; Kuehne, I. System Modeling of a Piezoelectric Energy Harvesting Module for Environments with High Dynamic Forces. Presented at Smart Sensors, Actuators, and MEMS V, Prague, Czech Republic, 18–April 2011.
- Keck, M. A. New Approach of a Piezoelectric Vibration-Based Power Generator to Supply Next Generation Tire Sensor Systems. Proceedings of 2007 IEEE Sensors, Atlanta, GA, USA, 28–31 October 2007; pp. 1299–1302.
- Wu, L.; Wang, Y.; Jia, C.; Zhang, C. Battery-Less Piezoceramics Mode Energy Harvesting for Automobile TPMS. Proceedings of IEEE 8th International Conference on ASIC (ASICON'09), Changsha, China, 20–23 October 2009; pp. 1205–1208.
- Zheng, Q.; Tu, H.; Agee, A.; Xu, Y. Vibration Energy Harvesting Device Based on Asymmetric Air-Spaced Cantilevers for Tire Pressure Monitoring System. Proceedings of Power MEMS 2009, Washington, DC, USA, 14 December 2009; pp. 403–406.
- Wang, Y.J.; Chen, C.D.; Sung, C.K. Design of a frequency-adjusting device for harvesting energy from a rotating wheel. Sens. Actuators A: Phys. 2010, 159, 196–203. [Google Scholar]
- Braghin, F.; Brusarosco, M.; Cheli, F.; Cigada, A.; Manzoni, S.; Mancosu, F. Measurement of contact forces and patch features by means of accelerometers fixed inside the tire to improve future car active control. Veh. Syst. Dyn. 2006, 44, 3–13. [Google Scholar]
- Kindt, P.; Sas, P.; Desmet, W. Measurement and analysis of rolling tire vibrations. Opt. Lasers Eng. 2009, 47, 443–453. [Google Scholar]
- Roundy, S.J. Energy Scavenging for Wireless Sensor Nodes with a Focus on Vibration to Electricity Conversion. Ph.D. Thesis, University of California, Berkeley, Berkeley, CA, USA; p. 287.
- Roundy, S. Energy Harvesting for Tire Pressure Monitoring Systems: Design Considerations. Proceedings of Power MEMS + microMEMS, Sendai, Japan, 9–12, November 2008; pp. 1–6.
- Gu, L.; Livermore, C. Compact passively self-tuning energy harvesting for rotating applications. Smart Mater. Struct. 2011, 21. [Google Scholar] [CrossRef]
- Tang, Q.C.; Xia, X.Y.; Li, X.X. Non-Contact Frequency-up-Conversion Energy Harvester for Durable & Broad-Band Automotive TPMS Application. Proceedings of 2012 IEEE 25th International Conference on Micro Electro Mechanical Systems (MEMS), Paris, France, 29 January–2 February 2012; pp. 1273–1276.
- Wang, Y.J.; Chen, C.D.; Sung, C.K. System design of a weighted-pendulum-type electromagnetic generator for harvesting energy from a rotating wheel. IEEE/ASME Trans. Mechatron. 2013, 18, 754–763. [Google Scholar]
- Hatipoglu, G.; Ürey, H. FR4-based electromagnetic energy harvester for wireless tyre sensor nodes. Procedia Chem. 2009, 1, 1211–1214. [Google Scholar]
- Suzuki, Y. Recent progress in MEMS electret generator for energy harvesting. IEE J Trans. Electr. Electron. Eng. 2011, 6, 101–111. [Google Scholar]
- Chen, Y.Y.; Pan, H.W. A Piezoelectric Vibration Energy Harvester for Tire Pressure Monitoring Systems. Proceedings of Symposium on Ultrasonic Electronics, Kyoto, Japan, 8–10 November 2011; pp. 321–322.
- Pinna, L.; Valle, M.; Bo, G.M. Experimental Results of Piezoelectric Bender Generators for the Energy Supply of Smart Wireless Sensors. Proceedings of the 13th Italian Conference Sensors and Microsystems, Roma, Italy, 19–21 February 2008; pp. 450–458.
- Tornincasa, S.; Repetto, M.; Bonisoli, E.; di Monaco, F. Energy harvester for vehicle tires: Nonlinear dynamics and experimental outcomes. J. Intell. Mater. Syst. Struct. 2012, 23, 3–13. [Google Scholar]
- Tsujiuchi, N.; Koizumi, T.; Oshibuchi, A.; Shima, I. Rolling Tire Vibration Caused by Road Roughness. Proceedings of SAE 2005 Noise and Vibration Cnference and Exhibition, Traverse City, MI, USA, 16 May 2005. paper 2005–01–2524.
- Lange, T.; Löhndorf, M.; Kvisterøy, T. Intelligent Low-Power Management and Concepts for Battery-Less Direct Tire Pressure Monitoring Systems (TPMS). In Advanced Microsystems for Automotive Applications 2007, VDI-Buch; Springer: Berlin, Germany, 2007; pp. 237–249. [Google Scholar]
- Pinna, L. Vibration-Based Energy Scavenging for Power Autonomous Wireless Sensor Systems. Ph.D. Thesis, University of Genoa, Genoa, Italy, February 2010; p. 141. [Google Scholar]
- Frey, A.; Seidel, J.; Schreiter, M.; Kuehne, I. Piezoelectric MEMS Energy Harvesting Module Based on Non-Resonant Excitation. Proceedings of 2011 16th International Conference on Solid-State Sensors, Actuators and Microsystems (TRANSDUCERS), Beijing, China, 5–9 June 2011; pp. 683–686.
- Gu, L.; Livermore, C. Pendulum-Driven Passive Self-Tuning Energy Harvester for Rotating Applications. Presented at Power MEMS Workshop, Leuven, Belgium, December 2010.
- Mekid, S.; Lim, B. Characteristics comparison of piezoelectric actuators at low electric field: Analysis of strain and blocking force. Smart Mater. Struct. 2004, 13, N93–N98. [Google Scholar]
- DuraAct Patch Transducer, Bendable and Robust. P876 Datasheet, 2012. Available Online: http://www.physikinstrumente.com/en/pdf/P876_Datasheet.pdf (accessed on 23 June 2013).
- Roundy, S.; Leland, E.S.; Baker, J.; Carleton, E.; Reilly, E.; Lai, E.; Otis, B.; Rabaey, J.M.; Wright, P.K.; Sundararajan, V. Improving power output for vibration-based energy scavengers. IEEE Pervasive Comput. 2005, 4, 28–36. [Google Scholar]
- Chen, Z.S.; Yang, Y.M.; Deng, G.Q. Analytical and Experimental Study on Vibration Energy Harvesting Behaviors of Piezoelectric Cantilevers with Different Geometries. Proceedings of International Conference on Sustainable Power Generation and Supply (SUPERGEN'09), Nanjing, China, 6–7 April 2009; pp. 1–7.
- Xu, J.W.; Shao, W.W.; Kong, F.R.; Feng, Z.H. Right-angle piezoelectric cantilever with improved energy harvesting efficiency. Appl. Phys. Lett. 2010, 96, 152904. [Google Scholar]
- Zheng, Q.; Yong, X. Asymmetric air-spaced cantilevers for vibration energy harvesting. Smart Mater. Struct. 2008, 17, 055009. [Google Scholar]
- Zheng, Q.; Wang, Z.; Xu, Y. Symmetric air-spaced cantilevers for strain sensing. Sens. Actuators A: Phys. 2008, 147, 142–149. [Google Scholar]
- Gere, J.M.; Goodno, B.J. Review of Centriods and Moments of Inertia. In Mechanics of Materials, 8th ed.; Cengage Learning: Stamford, CT, USA, 2012; pp. 954–980. [Google Scholar]
- Shu, Y.C.; Lien, I.C. Efficiency of energy conversion for a piezoelectric power harvesting system. J. Micromech. Microeng. 2006, 16, 2429–2438. [Google Scholar]
- Shu, Y.C.; Lien, I.C. Analysis of power output for piezoelectric energy harvesting systems. Smart Mater. Struct. 2006, 15, 1499–1512. [Google Scholar]
- Hammond, P. Electric Charges at Rest (II). In Electromagnetism for Engineers, an Introductory Course, 1st ed.; Pergamon Press: London, UK, 1964; pp. 44–45. [Google Scholar]
- Thomson, W. Free Vibration Harmonically Excited Vibration. In Theory of Vibration with Applications, 3rd ed.; Taylor & Francis: London, UK, 2004; pp. 17–57. [Google Scholar]
- Steve, C.L.Y. Low Power Wireless Sensor Applications. M.Sc. Thesis, The Chinese University of Hong Kong, Hong Kong, China, June 2004. [Google Scholar]


| Energy Harvesting Mechanism | Energy Harvesting Technique | Size | Power Output | Output Voltage | Location within the Tyre | Source |
|---|---|---|---|---|---|---|
| Vibration | Electromagnetic | 5 mm diameter × 5 mm high magnet, no more specifications are given | 0.054 mW at 60 km/h | 1.5 VAC at 60 km/h | Attached onto the inner surface of the tyre belt | Tornincasa et al., 2012 [24] |
| Vibration | Piezoelectric | 31.8 × 3.2 × 0.66 mm3 | 0.78 μW at 50 km/h 2.99 μW at 80 km/h | 2–3 V at 50 km/h 5–10 V at 80 km/h | Attached to the tyre wall from the outside in the tangential direction at 16 cm distance from the wheel centre | Pinna, 2010 [27] |
| Vibration | Piezoelectric | 55.4 × 15.2 × 1.2 mm3 | 100.4 μW at resonance frequency (47.6 Hz) | 6 VAC at resonance frequency (47.6 Hz) | - | Chen and Pan, 2011 [22] |
| Vibration | Piezoelectric | Some 10 mm2 in area × 80 μm in thickness | 5.5 μW at resonance (11 kHz) | 3.7 VAC at resonance (11 kHz) | Either on the rim or in the inner liner of the tyre | Frey, 2011 [28] |
| Vibration | Electromagnetic | 30 × 30 × 11.7 mm3 | 0.144 mW at 50 km/h at an acceleration of 6g, 0.4 mW at 150 km/h at an acceleration of 15g | 120 mV at 50 km/h at an acceleration of 6g, 200 mV at 150 km/h at an acceleration of 15g | - | Hatipoglu and Urey, 2009 [20] |
| Vibration | Piezoelectric | A diameter of 10.4 mm × 1.4 mm thickness | Peak power = 80 μW at 80 km/h, average power of 40 μW over 30–180 km/h speed range | Maximum of 40 V (open circuit) conditions are not specified | The sensor module mounted at the inner tread area | Keck, 2007 [9] |
| Vibration | Piezoelectric | Not specified | Averaged power of 0.38 mW | Maximum 12.3 V at resonance, 125.8 Hz (open circuit) | - | Liji WU et al., 2009 [10] |
| Vibration | Piezoelectric | 15 × 6 × 46 mm3 | 47 μW at approximately 80 km/h at resonance | >5 VAC but not specified | The vibration energy harvesting device was mounted on the wheel up-side-down to make sure the PZT operates in compression mode | Zheng et al., 2009 [11] |
| Vibration | Piezoelectric | (≈10) × 20 × 20 mm3 | 123 μW at 16.2 Hz 60 μW at 6.2 Hz | (21–25) Vp-p over the frequency range (4–16) Hz in which the system almost remains at resonance | The device is mounted at optimal radius of 7.5 mm from the centre of rotation | Lei Gu, and Livermore, 2010 [29] |
| Vibration | Piezoelectric | Not clear | Average power of 10 μW over the frequency range (10–22) Hz under 1 g acceleration of excitation | Average voltage ≈ 14Vp-p across a 6.1 MΩ resistive load | The harvester mounted on the rim inside the tyre cavity | Tang et al., 2012 [18] |
| Vibration | Electromagnetic | ≈ 2.5 cm in diameter, thickness is not specified | Average power of 349 μW at 400 rpm across a 330 Ω resistive load | ≈ 0.33 Vrms at 400 rpm across a 330 Ω resistive load | The weighted pendulum combined with magnets and coils was mounted on a rotation plate driven by an ac servo motor to simulate the device oscillation. | Wang et al., 2012 [19] |
| Parameter Description | Symbol | Units | Formulae | |
|---|---|---|---|---|
| Pure bending | Stiffness | kP | N/m | |
| Rigidity | RP | N m2 | ||
| S-shape bending | Stiffness | kS | N/m | |
| Rigidity | RS | N m2 | ||
| Effective stiffness | kE | N/m | ||
| Resonance frequency | f0 | Hz | ||
| Normal strain acting along the x-axis in the DPT element | (εx)avg | - | ||
| Parameter | Units | Design A | Design B | Design C | |
|---|---|---|---|---|---|
| Cantilever dimensions | |||||
| w1 | width | m | 3.50 × 10⁻² | 3.50 × 10⁻² | 1.75 × 10⁻² |
| t1 | thickness | m | 8.00 × 10⁻⁴ | 8.00 × 10⁻⁴ | 8.00 × 10⁻⁴ |
| l1 | length | m | 4.50 × 10⁻² | 4.50 × 10⁻² | 4.50 × 10⁻² |
| mc | mass | kg | 1.42 × 10⁻² | 1.42 × 10⁻² | 9.33 × 10⁻³ |
| DPT element dimensions | |||||
| w2 | width | m | 3.50 × 10⁻² | 3.50 × 10⁻² | 3.50 × 10⁻² |
| t2 | thickness | m | 4.00 × 10⁻⁴ | 4.00 × 10⁻⁴ | 4.00 × 10⁻⁴ |
| l2 | length | m | 4.50 × 10⁻² | 4.50 × 10⁻² | 4.50 × 10⁻² |
| mdpt | Mass | kg | 2.10 × 10⁻³ | 2.10 × 10⁻³ | 2.10 × 10⁻³ |
| Proof mass | |||||
| mpm* | mass | kg | 5.14 × 10⁻² | 5.14 × 10⁻² | 5.14 × 10⁻² |
| lpm | length | m | 2.00 × 10⁻² | 2.00 × 10⁻² | 2.00 × 10⁻² |
| Cantilever properties | |||||
| E1 | modulus of elasticity | Pa | 2.00 × 10¹¹ | 2.00 × 10¹¹ | 2.00 × 10¹¹ |
| I1 | second moment of area | m | 1.49 × 10⁻¹² | 1.49 × 10⁻¹² | 7.47 × 10⁻¹³ |
| A1 | x-area | m2 | 2.80 × 10⁻⁵ | 2.80 × 10⁻⁵ | 1.40 × 10⁻⁵ |
| d1 | m | 1.04 × 10⁻⁵ | 1.04 × 10⁻⁵ | 2.42 × 10⁻⁵ | |
| DPT element properties | |||||
| E2 | Modulus of elasticity | Pa | 4.40 × 10⁹ | 4.40 × 10⁹ | 4.40 × 10⁹ |
| I2 | Second moment of area | m | 1.87 × 10⁻¹³ | 1.87 × 10⁻¹³ | 1.87 × 10⁻¹³ |
| A2 | x-area | m2 | 1.40 × 10⁻⁵ | 1.40 × 10⁻⁵ | 1.40 × 10⁻⁵ |
| d2 | m | 5.89 × 10⁻⁴ | 5.90 × 10⁻⁴ | 1.38 × 10⁻³ | |
| Centroid from the fixed end | |||||
| x̅ | m | 5.37 × 10⁻² | 5.37 × 10⁻² | 5.48 × 10⁻² | |
| m | kg | 6.77 × 10⁻² | 6.77 × 10⁻² | 6.28 × 10⁻² | |
| Cantilever-DPT assembly rigidity | |||||
| D | m | 6.00 × 10⁻⁴ | 1.40 × 10⁻³ | 1.40 × 10⁻³ | |
| Rp | N.m2 | 3.22 × 10⁻¹ | 4.19 × 10⁻¹ | 2.69 × 10⁻¹ | |
| Rs | N.m2 | 2.99 × 10⁻¹ | 2.99 × 10⁻¹ | 1.50 × 10⁻¹ | |
| Cantilever-DPT assembly stiffness | |||||
| kS | N/m | 3.94 × 10⁴ | 3.94 × 10⁴ | 1.98 × 10⁴ | |
| kp | N/m | 6.76 × 10³ | 8.82 × 10³ | 5.66 × 10³ | |
| kE | N/m | 5.77 × 10³ | 7.21 × 10³ | 4.40 × 10³ | |
| Resonance frequency | |||||
| f0 | Hz | 53.4 | 59.6 | 46.6 | |
| Normal strain in the DPT element under 0.5 g acceleration of excitation (a) | |||||
| a | acceleration | m/s2 | 4.905 | 4.905 | 4.905 |
| (εx)avg | με | 15.0181 | 26.8651 | 41.145 | |
*The mass used in the calculations is the sum of the proof mass and the 1.8 × 35 × 10 mm3 (4.37 × 10⁻³ kg) portion at the end of each of the three cantilevers.
| Parameter | Description | Units | Design A | Design B | Design C |
|---|---|---|---|---|---|
| Vavg | the average voltage generated by the DPT | V | 4.96 | 5 | 7.149 |
| Vmax | maximum voltage within the DPT | V | 6.832 | 7.155 | 10.438 |
| F | applied force on the cantilever-DPT assembly | N | 1.4 | 1.4 | 1.4 |
| uend | deflection of the free end | mm | 0.134 | 0.0515 | 0.0891 |
| ucg/uend | deflection at the centre of gravity of the cantilever-DPT assembly relative to the deflection of the free end | mm | 0.708 | 0.708 | 0.783 |
| k | stiffness | kN/m | 10.447 | 27.184 | 15.713 |
| εavg | normal strain in the DPT element in the x direction | με | 33.662 | 34.024 | 48.59 |
| f0 | resonance frequency | Hz | 48.13 | 64.58 | 50.255 |
| Common Variables | Design | |||||||
|---|---|---|---|---|---|---|---|---|
| Parameter | Description | Units | A | B | C | |||
| f0 | Natural frequency | Hz | 5.98 × 101 | 5.85 × 101 | 4.76 × 101 | |||
| τd | Oscillation period | s | 1.67 × 10⁻² | 1.71 × 10⁻² | 2.10 × 10⁻² | |||
| c | Damping coefficient | N s/m | 4.45 × 10⁻¹ | 4.75 × 10⁻¹ | 4.07 × 10⁻¹ | |||
| Excitation Variables | ±0.5g Acceleration of Excitation | ±40 μm Amplitude of Excitation | ||||||
| A | B | C | A | B | C | |||
| z0 | Excitation amplitude | m | 3.49 × 10⁻⁵ | 3.63 × 10⁻⁵ | 5.48 × 10⁻⁵ | 4.00 × 10⁻⁵ | 4.00 × 10⁻⁵ | 4.00 × 10⁻⁵ |
| Peak excitation acceleration | m/s2 | 4.91 × 100 | 4.91 × 100 | 4.91 × 100 | 5.63 × 100 | 5.40 × 100 | 3.58 × 100 | |
| Hinp | Energy input per cycle | μJ/Cycle | 1.19 × 10⁵ | 8.92 × 10⁴ | 7.91 × 10⁴ | 1.56 × 10⁵ | 1.08 × 10⁵ | 4.22 × 10⁴ |
| (Hout)avg | Average energy output per cycle | μJ/Cycle | 1.48 × 101 | 1.90 × 101 | 2.79 × 101 | 2.04 × 101 | 2.16 × 101 | 1.81 × 101 |
| (Hout)max | Maximum energy output per cycle | μJ/Cycle | 2.24 × 101 | 2.87 × 101 | 3.99 × 101 | 3.08 × 101 | 3.30 × 101 | 2.56 × 101 |
| Pavg | Average power generation | mW | 8.84 × 10⁻¹ | 1.11 × 100 | 1.33 × 100 | 1.22 × 100 | 1.26 × 100 | 8.60 × 10⁻¹ |
| Pmax | Maximum power generation | mW | 1.34 × 100 | 1.68 × 100 | 1.90 × 100 | 1.84 × 100 | 1.93 × 100 | 1.22 × 100 |
| Pdns | Volume power density | mW/cm3 | 7.93 × 10⁻² | 9.94 × 10⁻² | 1.12 × 10⁻¹ | 1.09 × 10⁻¹ | 1.14 × 10⁻¹ | 7.22 × 10⁻² |
| η | Total efficiency | % | 1.89 × 10⁻² | 3.22 × 10⁻² | 5.05 × 10⁻² | 1.44 × 10⁻² | 2.90 × 10⁻² | 6.07 × 10⁻² |
| Part | ICL7665S | MAX6763/MAX6764 | MAX971/MAX981 |
|---|---|---|---|
| Properties | |||
| Supply Current/μA | 2.55 | 23 | 4 |
| Operating Temperature Range/°C | 0 to 70 | −40 to 125 | 0 to 120 |
| No. of required resistors | 7 | 3 (a relay and NPN transistor is required) | 5 |
| Chip dimensions/mm | 5 × 6 × 1.75 (10.16 × 7.11 × 5.33) | 3 × 3 × 1.45 + relay & transistor | 5.03 × 4.78 × 1.10 |
© 2014 by the authors; licensee MDPI, Basel, Switzerland. This article is an open access article distributed under the terms and conditions of the Creative Commons Attribution license (http://creativecommons.org/licenses/by/3.0/).
Share and Cite
Kubba, A.E.; Jiang, K. Efficiency Enhancement of a Cantilever-Based Vibration Energy Harvester. Sensors 2014, 14, 188-211. https://doi.org/10.3390/s140100188
Kubba AE, Jiang K. Efficiency Enhancement of a Cantilever-Based Vibration Energy Harvester. Sensors. 2014; 14(1):188-211. https://doi.org/10.3390/s140100188
Chicago/Turabian StyleKubba, Ali E., and Kyle Jiang. 2014. "Efficiency Enhancement of a Cantilever-Based Vibration Energy Harvester" Sensors 14, no. 1: 188-211. https://doi.org/10.3390/s140100188