Article

Temporal and Spatial Dynamics of Phytoplankton Primary Production in Lake Taihu Derived from MODIS Data

1
Taihu Lake Laboratory Ecosystem Research Station, State Key Laboratory of Lake Science and Environment, Nanjing Institute of Geography and Limnology, Chinese Academy of Sciences, Nanjing 210008, China
2
College of Resources & Environment, GIS Research Center, Hunan Normal University, Changsha 410081, China
*
Author to whom correspondence should be addressed.
Remote Sens. 2017, 9(3), 195; https://doi.org/10.3390/rs9030195
Submission received: 24 November 2016 / Revised: 26 January 2017 / Accepted: 20 February 2017 / Published: 24 February 2017
(This article belongs to the Special Issue Water Optics and Water Colour Remote Sensing)

Abstract

:
We investigated the long-term variations in primary production in Lake Taihu using Moderate Resolution Imaging Spectroradiometer (MODIS) data, based on the Vertically Generalized Production Model (VGPM). We firstly test the applicability of VGPM in Lake Taihu by comparing the results between the model-derived and the in situ results, and the results showed that a strong significant correlation (R2 = 0.753, p < 0.001, n = 63). Then, VGPM was used to map temporal-spatial distributions of primary production in Lake Taihu. The annual mean daily primary production of Lake Taihu from 2003 to 2013 was 1094.06 ± 720.74 mg·C·m−2·d−1. Long-term primary production maps estimated from the MODIS data demonstrated marked temporal and spatial variations. Spatially, the primary production in bays, especially in Zhushan Bay and Meiliang Bay, was consistently higher than that in the open area of Lake Taihu, which was caused by chlorophyll-a concentrations resulting from high nutrient concentrations. Temporally, the seasonal variation of primary production from 2003 to 2013 was: summer > autumn > spring > winter, with significantly higher primary production found in summer and autumn than in winter (p < 0.005, t-test), primarily caused by seasonal variations in water temperature. On a monthly scale, the primary production exerts a clear character of bimodality, increasing from January to May, decreasing in June or July, and finally reaching its highest value during August or September. Wind is another important factor that could affect the spatial variations of primary production in the large, eutrophic and shallow Lake Taihu.

Graphical Abstract

1. Introduction

Phytoplankton is at the bottom of the food chain, creating fresh organic matter from inorganic nutrients, carbon dioxide and energy from sunlight, which strongly influence nutrient concentrations and support higher trophic levels such as zooplankton and filter feeder. When either system is employed, phytoplankton creates organic matter from inorganic compounds and carbon dioxide, which is called phytoplankton primary production [1,2]. The rate of phytoplankton primary production is a fundamental property of aquatic system and measurements of primary production are critical to our understanding of the carbon cycle [3]. Estimation of the phytoplankton primary production is also an important topic in fisheries resource management and global change [4].
One of the major goals of modern biological oceanography is to acquire a better understanding of primary production in various oceanic provinces, with a special emphasis on marine carbon cycling and climate change on regional to global scales [5]. As an important part of the global carbon cycle, estimating the primary production in lakes is also the major goals of modern limnology, and important for us to understand the regional ecological environment [4]. Actually, lake primary production, which is commonly regarded as the photosynthetic capacity of phytoplankton for the unit volume, is an important parameter to describe ecosystem and environmental characteristics of lake [6].
Traditionally, the primary production of an aquatic environment was obtained from cruise samples. While in situ experiments provided accurate estimates of primary production in small volumes of water, they may not be easily extrapolated to lake-wide estimates [7,8,9]. Moreover, these experiments provide an integrated measure of production that is dependent on many variables (e.g., phytoplankton biomass, light, temperature, etc.), thus limiting their predictive value. Early ways to estimate primary production for the great lakes may be biased because of deficiencies in traditional collection and incubation techniques [10,11,12,13,14,15].
Satellite data have been widely used to derive several lake biogeochemical parameters, such as, total suspended matter, chlorophyll a (Chla), and diffuse attenuation coefficient of photosynthetically active radiation (Kd(PAR)). Satellite remote sensing has many advantages in estimation of lake biogeochemical parameters. The repeated coverage by remote sensing enables the detection of the temporal and spatial variation, which has proven beneficial for rapidly estimating lake biogeochemical parameters [16]. Additionally, satellite remote sensing is more practical and economical than the other monitoring methods and also can be easily integrated into geographic information [17,18,19]. However, remote sensing data cannot directly provide information on primary production without support of models [20]. Vertically Generalized Productivity Model (VGPM) is the most widely used to estimate primary production due to its minimal input parameters, which has been validated by thousands of in situ measured data over several orders of magnitude. Among these input parameters, Chla and euphotic depth are could be derived from remote sensing data, providing a possibility for estimating primary production using remote sensing data. Many studies have successfully estimated phytoplankton primary production by combining remote sensing data to VGPM for open ocean [21,22,23]. However, due to difficulty in retrieval of Chla and euphotic depth in complexly optical waters, there have been few applications of the VGPM to lakes [24,25,26].
As the third-largest freshwater lake in China, Lake Taihu has a water surface area of 2338 km2, and a mean depth of 1.9 m [24]. This large, shallow lake is located in one of the world’s most heavily populated regions, which has experienced rapid economic development in recent years. Lake Taihu serves as a key drinking water resource for the approximately 10 million local residents residing in several large nearby cities, such as Shanghai, Suzhou, Wuxi and Huzhou [27,28]; it also has additional economic functions including tourism, fisheries and shipping [29]. Besides, Lake Taihu Basin also contributes 11.6% of China’s gross domestic product, despite accounting for only 0.38% of China’s total area. With economic development, a lot of wastewater, sewage and polluted water surrounding urban and rural areas were discharged to Lake Taihu, resulting in phytoplankton blooms and then triggering a drinking water crisis in 2007 [30]. Phytoplankton are commonly the most important primary producer in lake ecosystems, strongly influencing nutrient concentrations and supporting higher trophic levels such as zooplankton and filter feeders. Phytoplankton primary production is an important indicator of water quality and algal biomass. Therefore, describing the temporal and spatial variations in phytoplankton assemblages and primary production is crucial for understanding the development of eutrophication and ecosystem dynamics in Lake Taihu [31].
Biogeochemical parameters in Lake Taihu are always characterized by highly temporal-spatial dynamics, indicating that estimates of primary production using traditional sampling methods may lead to large uncertainty when we investigate primary production dynamics in the whole lake for a long time period.
In recent years, we have calibrated and validated Chla and euphotic depth estimation model in Lake Taihu, making it possible for us to estimate the phytoplankton primary production based on the VGPM model. Therefore, the aims of ours study were to (1) assess the accuracy and feasibility of VGPM in Lake Taihu using in situ measurement data; (2) estimate the phytoplankton primary production of Lake Taihu from 2003 to 2013 using MODIS-derived data; (3) analyze the temporal and spatial variations in primary production in Lake Taihu and discuss the potential affecting factors.

2. Materials and Methods
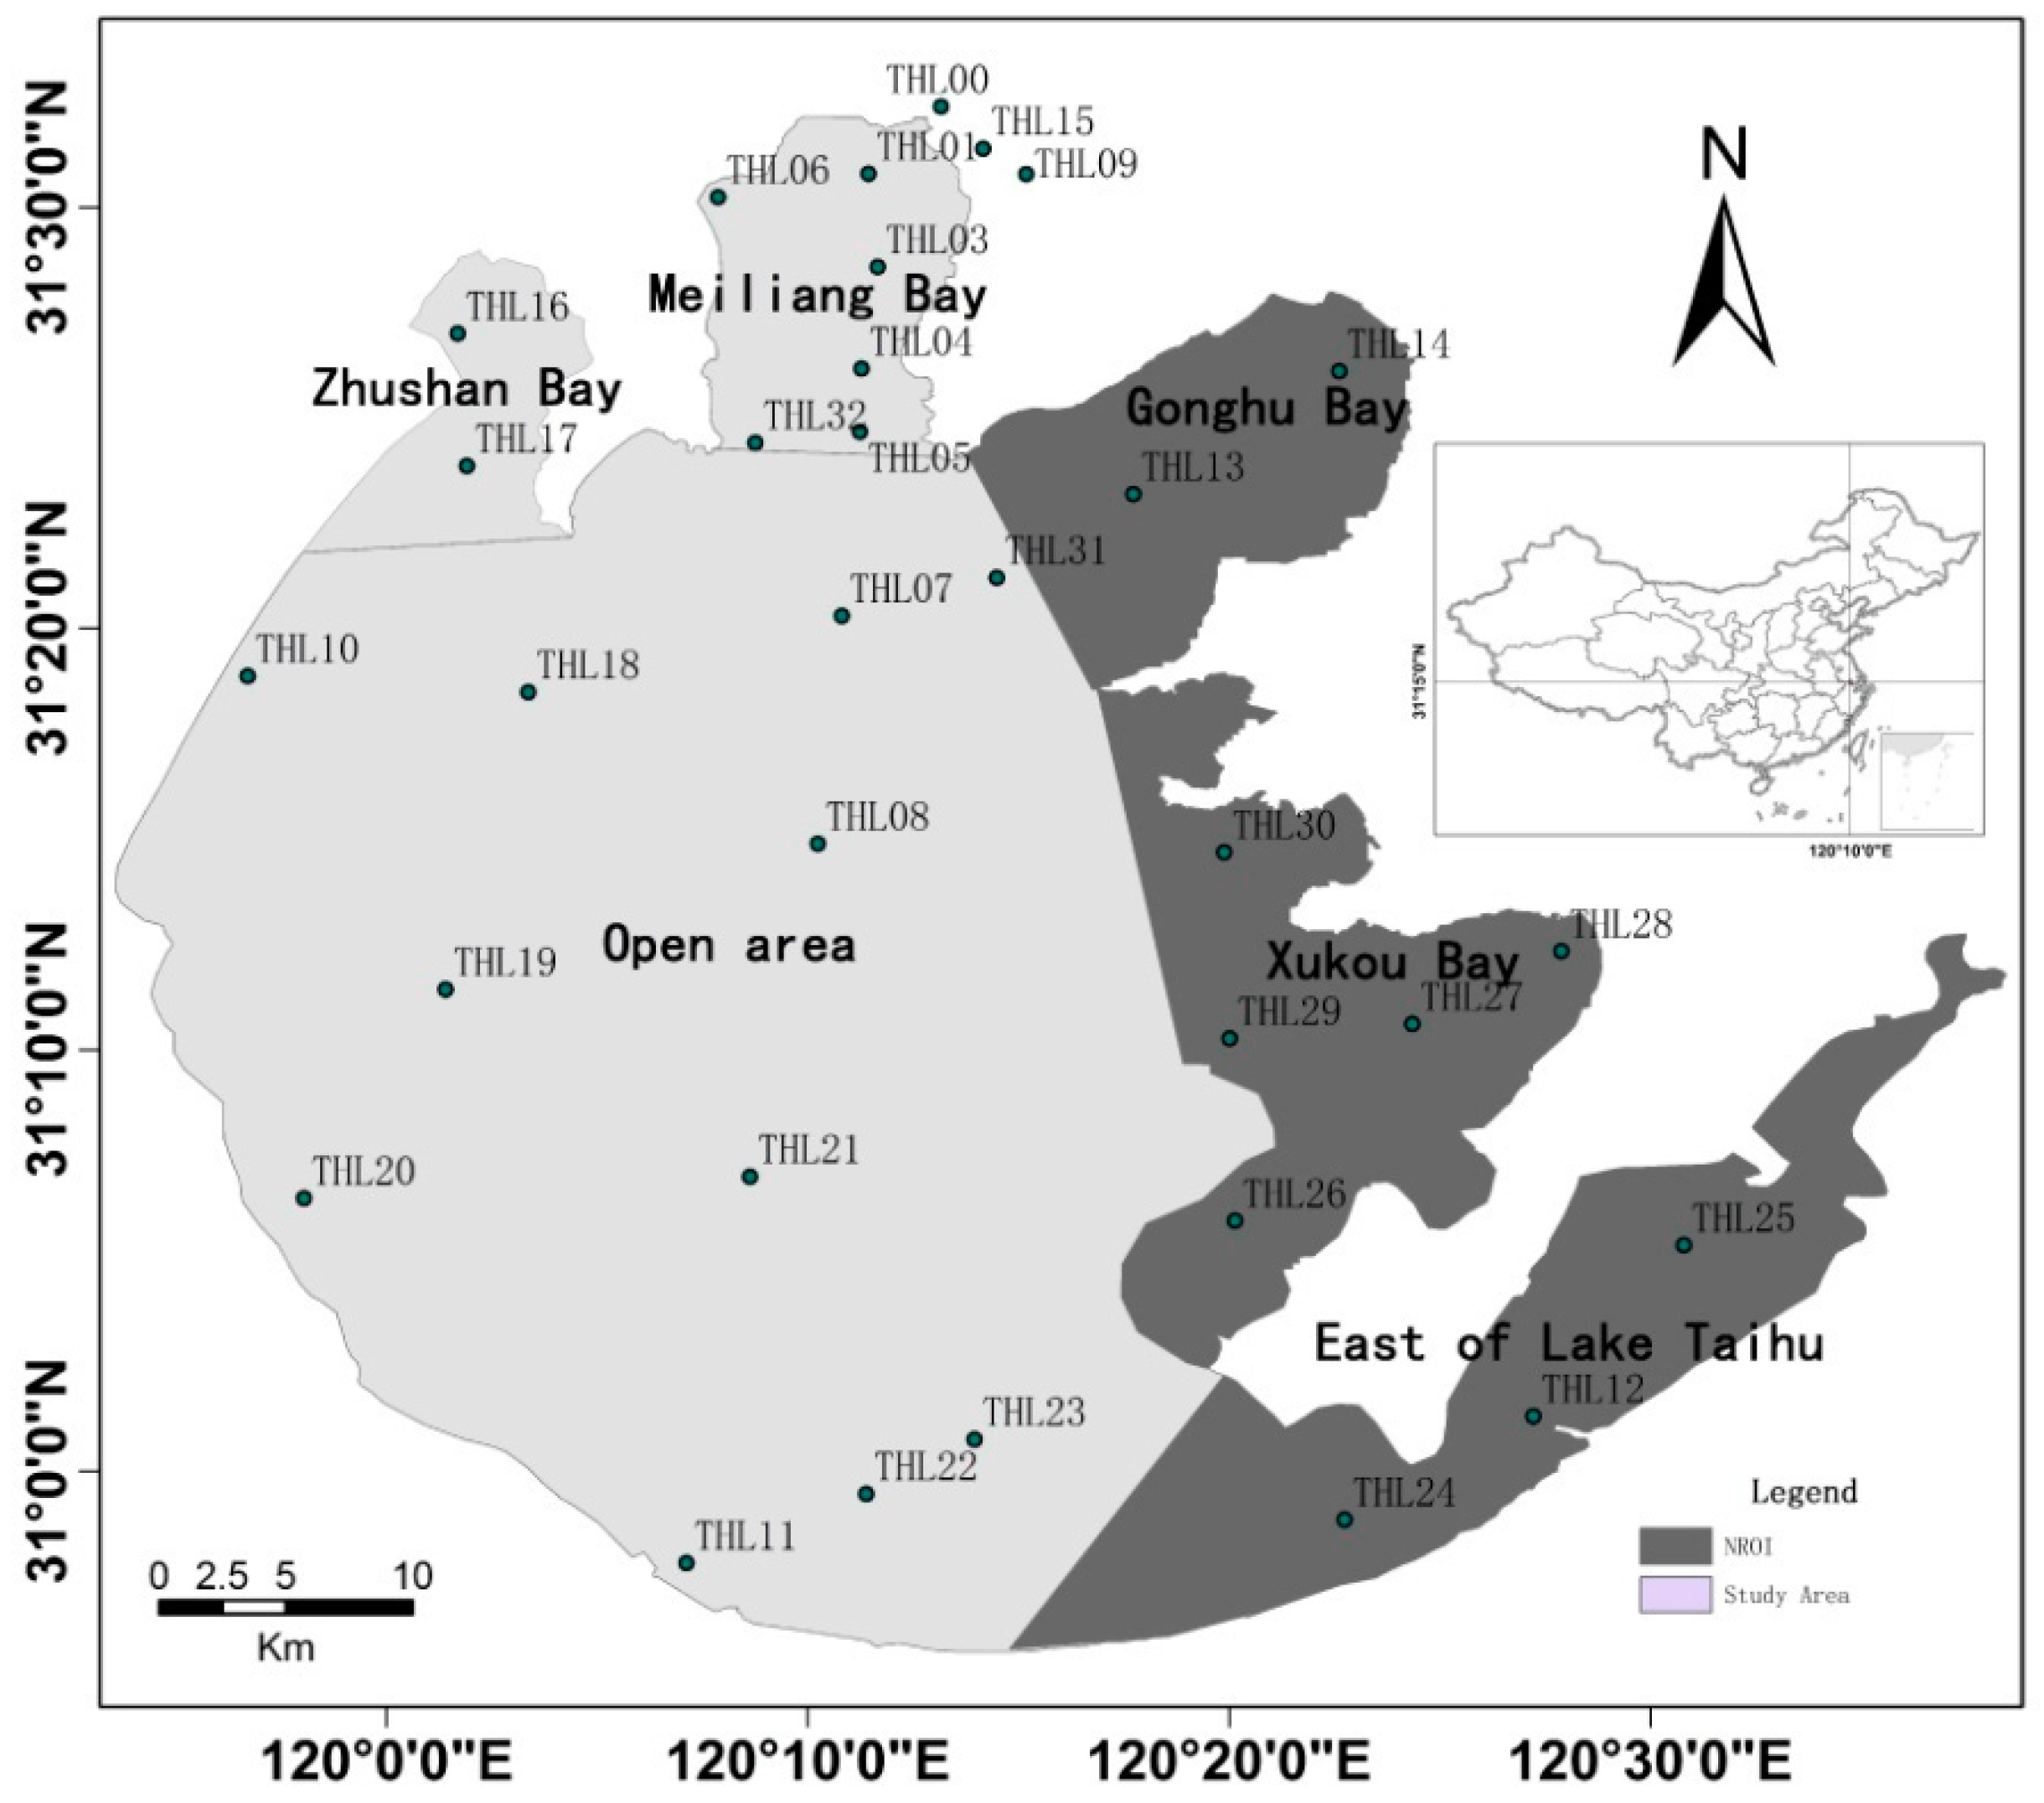
2.1. Study Area

Lake Taihu is a crucial water source for the Yangtze River Delta, located between 30°56′N–31°33′N and 119°54′E–120°36′E (Figure 1) [30]. In this article, Lake Taihu can be divided into six areas based on shoreline geometry, environmental factors, and human activities: Meiliang Bay, Zhushan Bay, Gonghu Bay, Xukou Bay, East Lake Taihu and the open area (Figure 1) [32,33]. It should be noted that the East Lake Taihu, Gonghu Bay and Xukou Bay were outside of the scope of the study area, defined as the non-region-of-interest (NROI) for this research, because the retrieved Chla were unusually high in these regions. In fact, these regions were marcophytic-dominated rather than phytoplankton-dominated [34], and the abundant submerged plants resulted in the deviation of retrieved Chla by MODIS data because of similar spectral characteristics with algae.

2.2. Field Data

A total of 63 samples were used to validate the VGPM model and a total of 20 samples were used to analyze the correlation between phytoplankton primary production and nutrients. 63 phytoplankton primary production samples were collected between 2005 and 2013 from the two sites (THL04 and THL08). Rates of phytoplankton primary production and respiration were measured using the light–dark bottle incubation method. Within the dark bottle, only respiration can occur; and within the light bottle, both respiration and photosynthesis can occur. From the difference in O2 within the light and dark bottles relative to the initial O2, the rate of primary production can be calculated [35,36,37]. The nutrient concentration data in 2013 were collected from 32 sites THL00-THL32 (except THL02) (Figure 1).

2.3. Image Data Description and Processing

The MODIS-Aqua data have been freely available since 2002 and has a maximum spatial resolution of 250 m (band 1 and band 2) and a very short revisit interval (1 image/day). MODIS-Aqua L-0 data from January 2003 to December 2013 (more than 4000 images) were downloaded from NASA’s Goddard Space Flight Center (GSFC, http://oceancolor.gsfc.nasa.gov/). Due to the clouds, cloud shadows, or thick aerosols, not all downloaded images were used in this study. We selected 1086 cloud-free images of Lake Taihu from January 2003 to December 2013. These images were processed to Level-1 (calibrated spectral radiance) using the software package SeaDAS (version 6.0).

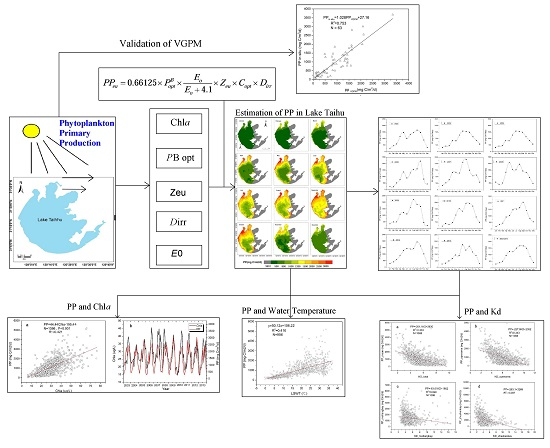
2.4. Method Description

After investigating the variability observed in primary production by assembling a dataset of 11,283 14C-based measurements of daily carbon fixation collected at 1698 oceanographic stations in both open ocean and coastal waters, Behrenfeld and Falkowski discovered a consistent trend in the vertical distribution of primary production and observed that the VGPM well accounted for the trend in normalized primary production estimated from depth integrated primary production [14]. VGPM model has been validated by thousands of in situ measured data points on a large scale and in different water areas. Therefore, it has been used widely to accurately estimate primary production.
The equation of VGPM is given below:
P P eu = P opt B × D irr × z = o Z eu ( 1 e E z E max ) e ( β d * E d ) ( 1 e E opt E max ) e ( β d * E opt ) × C z × d z
where PPeu represents primary production from sea surface to the euphotic depth (mg·C·m−2·d−1.), P opt B is the maximum optimal rate of carbon fixation of water mass, Dirr is the illumination period, Zeu is the euphotic depth, Ez represents Photosynthetically Active Radiation(PAR) that is photosynthetic effective radiation at depth Z (mol quanta/m2), Emax represents the maximum photosynthetic effective radiation, Eopt is the PAR where P opt B is located and βd is the initial slope of curve P-I chlorophyll concentration at depth Z.
After contrasting the results calculated by the VGPM model and ship-measured data, Behrenfeld and Falkowski considered that the model describes 79% of temporal-spatial variety of primary production (n = 10857). After simplification, the model can be presented as:
P P eu = 0.66125 × P opt B × E o E o + 4.1 × Z eu × C opt × D irr
where P opt B is the maximum rate of carbon fixation within a water column (mg C/(mg Chl·h)), E0 is PAR of the surface photosynthetic effective radiation of the lake, Zeu is the euphotic depth, Copt is Chla concentration where P opt B is located, which can be replaced by remote sensed surface Chla concentration, and Dirr is day length in decimal hours.
The model parameters can be acquired through the following methods:
(1) Calculation of P opt B is based on the experienced relationship between P opt B and the lake surface temperature (LST, °C) obtained with field investigation data provided by Behrenfeld and Falkowski. Therefore, P opt B can be commonly considered as a function of the lake surface temperature, which was described by Behrenfeld and Falkowski [12,14] as:
P opt B = { 1.13 ( T 1.0   ° C ) 4.00 ( T 28.5   ° C ) P opt B ( 1.0 < T < 28.5   ° C )
where
P opt B = 1.2956 + 2.749 × 10 1 T + 6.17 × 10 2 T 2 2.05 × 10 2 T 3 + 2.462 × 10 3 T 4 1.348 × 10 4 T 5 + 3.4132 × 10 6 T 6 3.27 × 10 8 T 7
The LST data from Lake Taihu can be calculated from MODIS data. Previous studies have showed that MODIS-derived LST and in situ water temperatures in Lake Taihu were significantly correlated, with a coefficient of determination higher than 0.96 and a root mean square error between 1.2 °C and 1.8 °C [38]. Then, the P opt B can be derived from MODIS-derived LST using the Equations (3) and (4).
(2) Chla can also be acquired from the MODIS data based on the model which was developed by Shi et al using Rayleigh-corrected reflectance as follows [31]:
Chla = 1454.3 × Index MODIS + 69.35
where IndexMODIS = (EXP(Rrc645) − EXP(Rrc859))/(EXP(Rrc645) + EXP(Rrc859)). A significant linear correlation was found between in situ and estimated Chla with the normalized spectral index (R2 = 0.72, p < 0.005; t-test). The relative error of the model for the validation dataset ranged from 0.4% to 64.5% with a mean absolute percent error of 27.1% (RMSE = 15.01 μg/L). The good agreement showed that the Chla can be used to estimate the primary production of Lake Taihu.
(3) The euphotic depth (Zeu) in this study was calculated using the relationship between the euphotic depth and the PAR diffuse attenuation coefficient (Kd(PAR)) as follows:
Z eu ( PAR ) = 4.605 K d ( PAR )
In this study, the Kd(PAR) can be derived using a estimation model developed for Lake Taihu using MODIS-Aqua remote sensing reflectance at the 645 nm band (Rrs(645)) (Unpublished data) as follows.
K d ( PAR ) = 1.56 × exp [ 44.603 × R rs ( 645 ) ]
This model has been validated with independent random samples, and indicated a good performance for Taihu Kd(PAR) estimation (R2 = 0.71; p < 0.001, t-test; RMSE = 1.06 m−1; MAPE = 25%). It is noted that there will be such a situation arose in which estimation euphotic zone depth exceeded bottom depth and if so, we use the bottom depth to replace the estimation euphotic zone depth [39].
(4) Dirr can be calculated based on the time and position of the water column. In this study, northern, southern and central regions of the Lake Taihu were selected to calculate the day length of each day.
(5) E0 data from Lake Taihu can be calculated according to the following equation from Zhang and Qin [40]:
E 0 = ( 0.2909 + 0.0764 × lg E * ) × Q
where E0 is monthly mean total daily PAR and E* is the vapor pressure corrected by air pressure,
E * = P 0 × E / P  
where P0 and P are the air pressure at sea level and at the monitoring station, respectively, E is the monthly mean vapor pressure and Q is the monthly mean daily global solar radiation. Q can be calculated according to the percentage of sunshine as follows [41]:
Q = Q 0 × ( 0.1351 + 0.5707 × s 1 )
where Q is the monthly mean total daily global solar radiation, Q0 is the monthly mean total daily extra-terrestrial radiation outside the Earth’s atmosphere and s1 is the percentage of actual sunshine expressed relative to the duration of possible sunshine. This model has been validated with independent random samples, and indicated a good performance for Taihu E0 estimation (R2 = 0.83, p < 0.001; t-test)
With the VGPM model and the Chla data, lake surface photosynthetic available radiation, day length, optimal rate of daily carbon fixation and the euphotic depth, daily primary production in Lake Taihu from 2003 to 2013 has been calculated using the Equation (2).

2.5. Statistical Analysis and Accuracy Assessment

Statistical analysis, including calculation of the maximum, minimum, mean, median values and linear and non-linear regressions were performed using the Statistical Program for Social Sciences (SPSS) 17.0 software. The significance level was reported to be significant (p ≤ 0.05) or not significant (p > 0.05). The fitting determination coefficient (R2) was calculated through linear regression using theOriginPro8.5 software.
The accuracy of the phytoplankton primary production estimation was assessed for the two validation datasets by comparing the estimation with the measured primary production values. This comparison was quantified by means of the percent difference (MNB) between the estimated primary production (PPesti) and analytically measured phytoplankton primary production (PPmeas):
MNB   = | PP esti , i PP meas , i PP esti , i | × 100 %
Systematic and randomized errors were characterized by the root mean square error (RMSE), and Mean absolute percentage error (MAPE).These metrics were defined as follows:
RMSE   =   1 N i = 1 N ( PP esti , i PP meas , i ) 2
M A P E = 1 N × i = 1 N | Y measured , i Y estimated , i Y measured , i × 100 %

3. Results

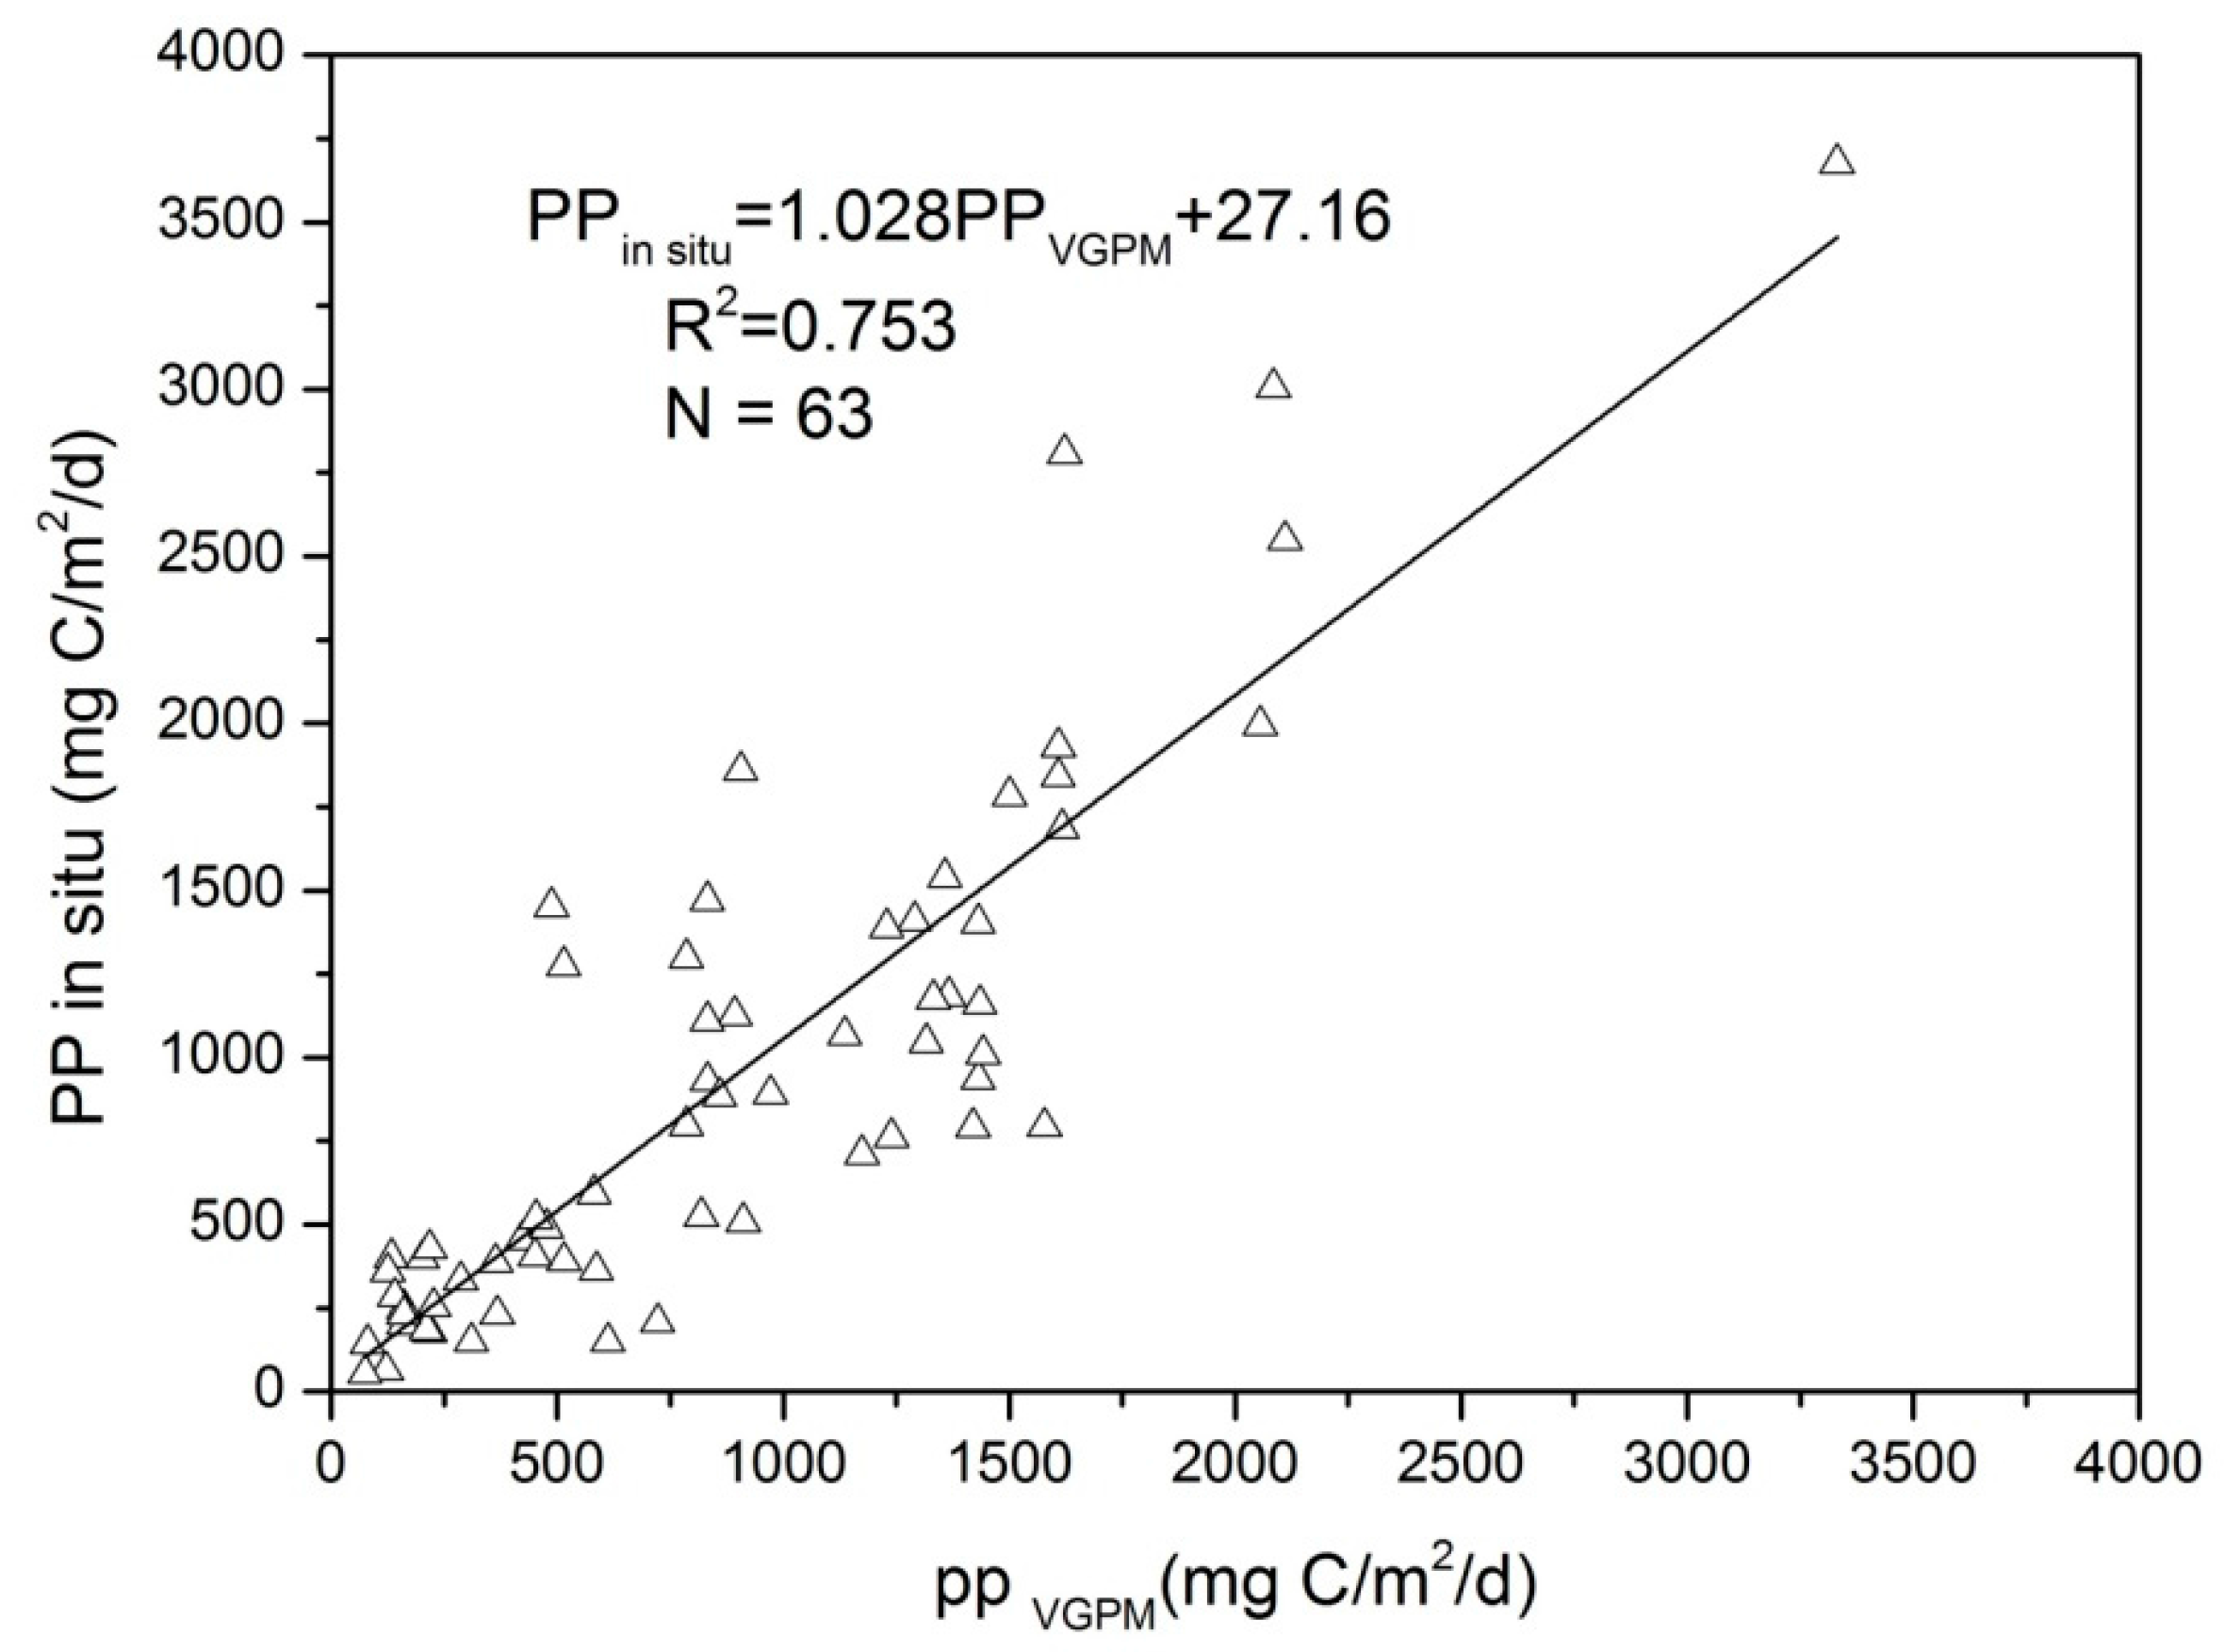
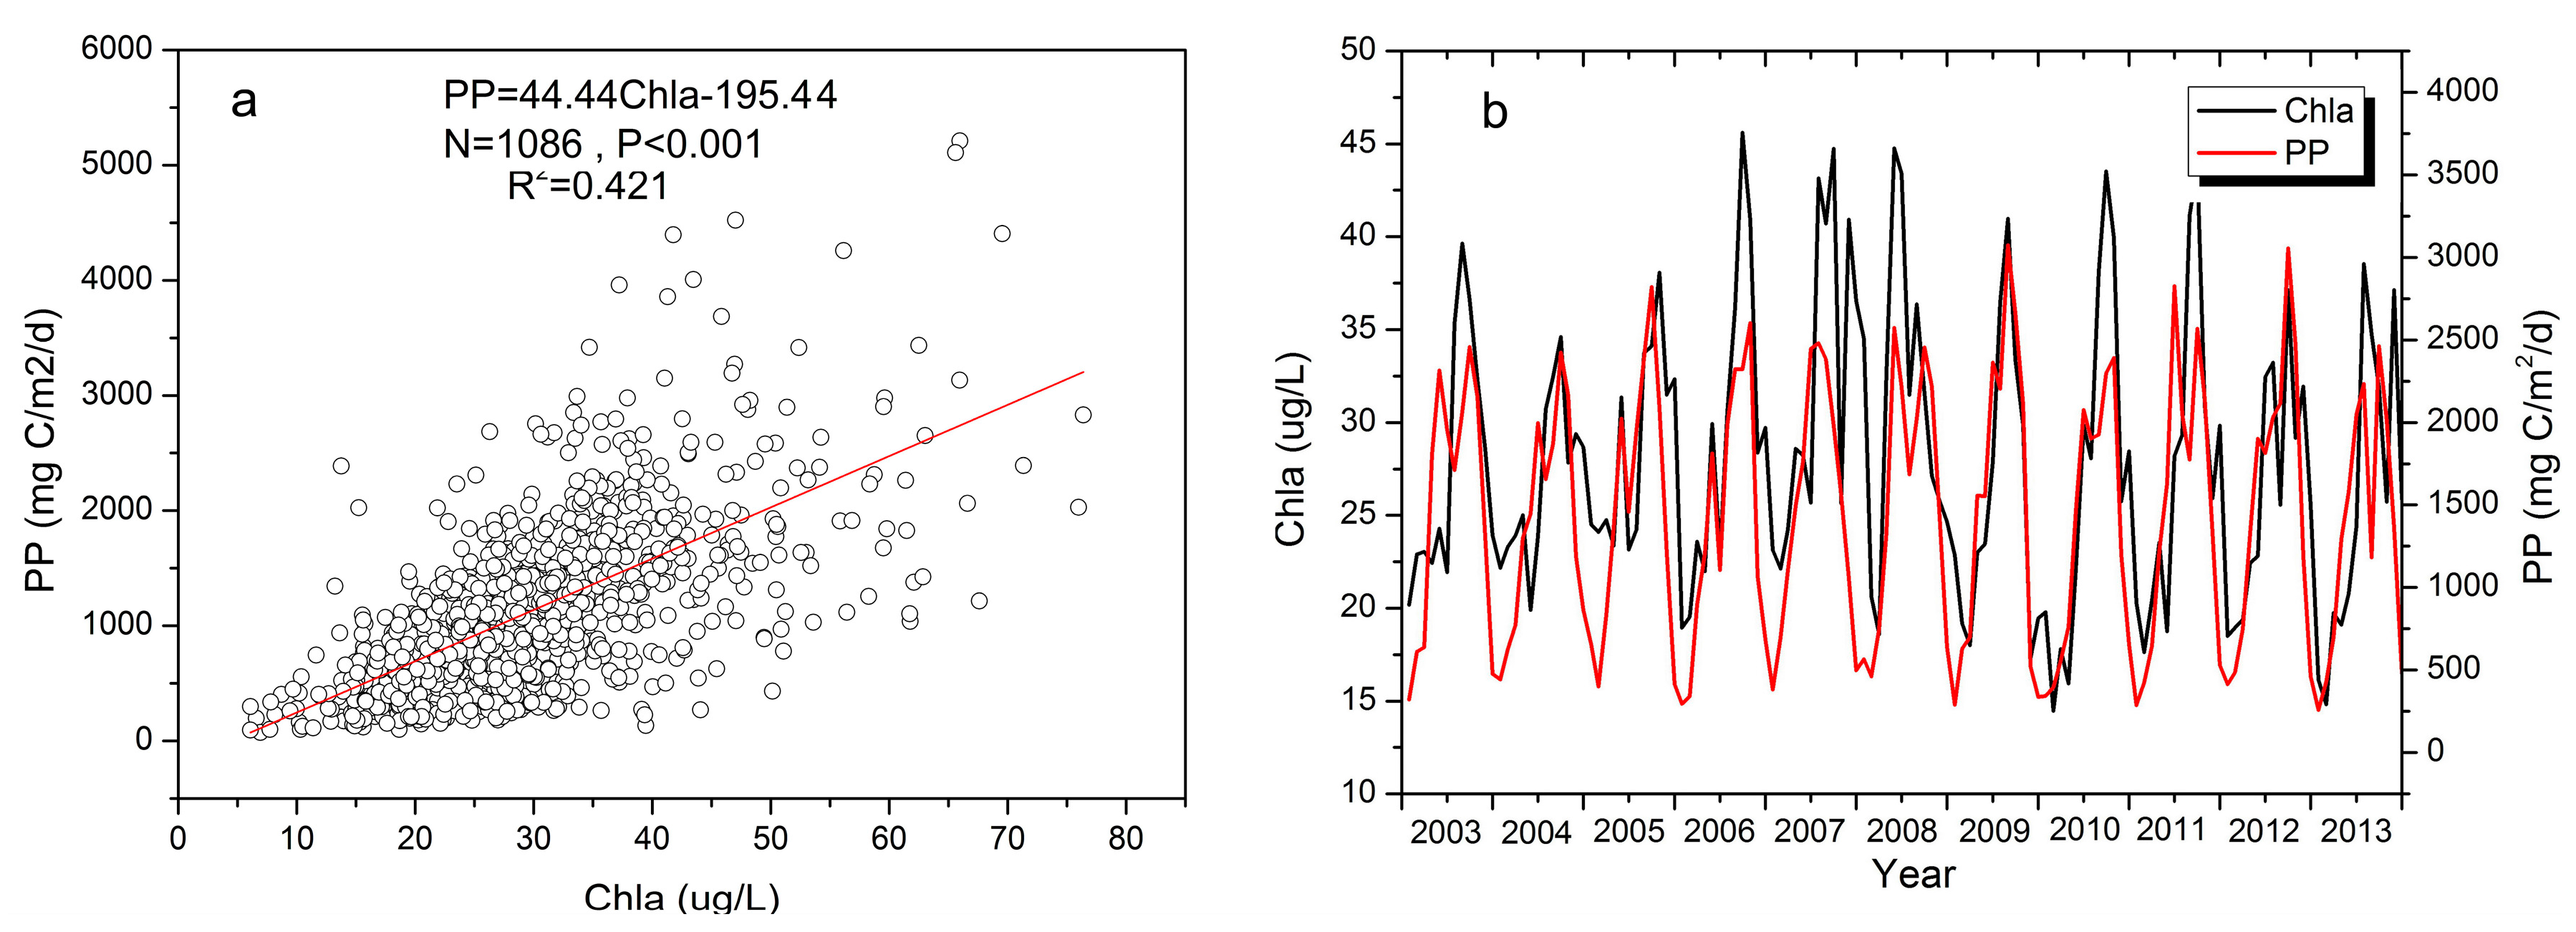
3.1. Validation of VGPM

In theory, the estimated phytoplankton primary production through satellite data and in situ measured phytoplankton primary production should be consistent within a limited period. We set the criterion for matching the satellite data and the in situ observations to ≤12 h (the time interval between the in situ measurements and the corresponding estimated data), according to the hourly variations of the process being measured, to minimize the effects of the temporal difference between the in situ and estimated phytoplankton primary production. Among all collected samples, there were 63 pairs of in situ data and estimated phytoplankton primary production that met the matching criterion. The accuracy of the VGPM was then evaluated through the comparison of the estimated phytoplankton primary production, and in situ phytoplankton primary production is shown in Figure 2. The results show that these values were in good agreement, with a highly significant linear relationship (R2 = 0.753, RMSE = 384.68 mg·C·m−2·d−1, MAPE = 40.5%). For all data sets, the minimum and mean of MNB were 1.3% and 41.7%, respectively, between estimated phytoplankton primary production and in situ measurements. The good performance of the VGPM is encouraging and clearly demonstrates that the VGPM could be used for remotely sensed estimations of phytoplankton primary production in the turbid waters of Lake Taihu.

3.2. Temporal-Spatial Distribution of Phytoplankton Primary Production

The daily average data were considered on a monthly, seasonal and annual basis, with the seasons defined as follows: winter, December–February; spring, March–May; summer, June–August; and autumn, September–November [23].

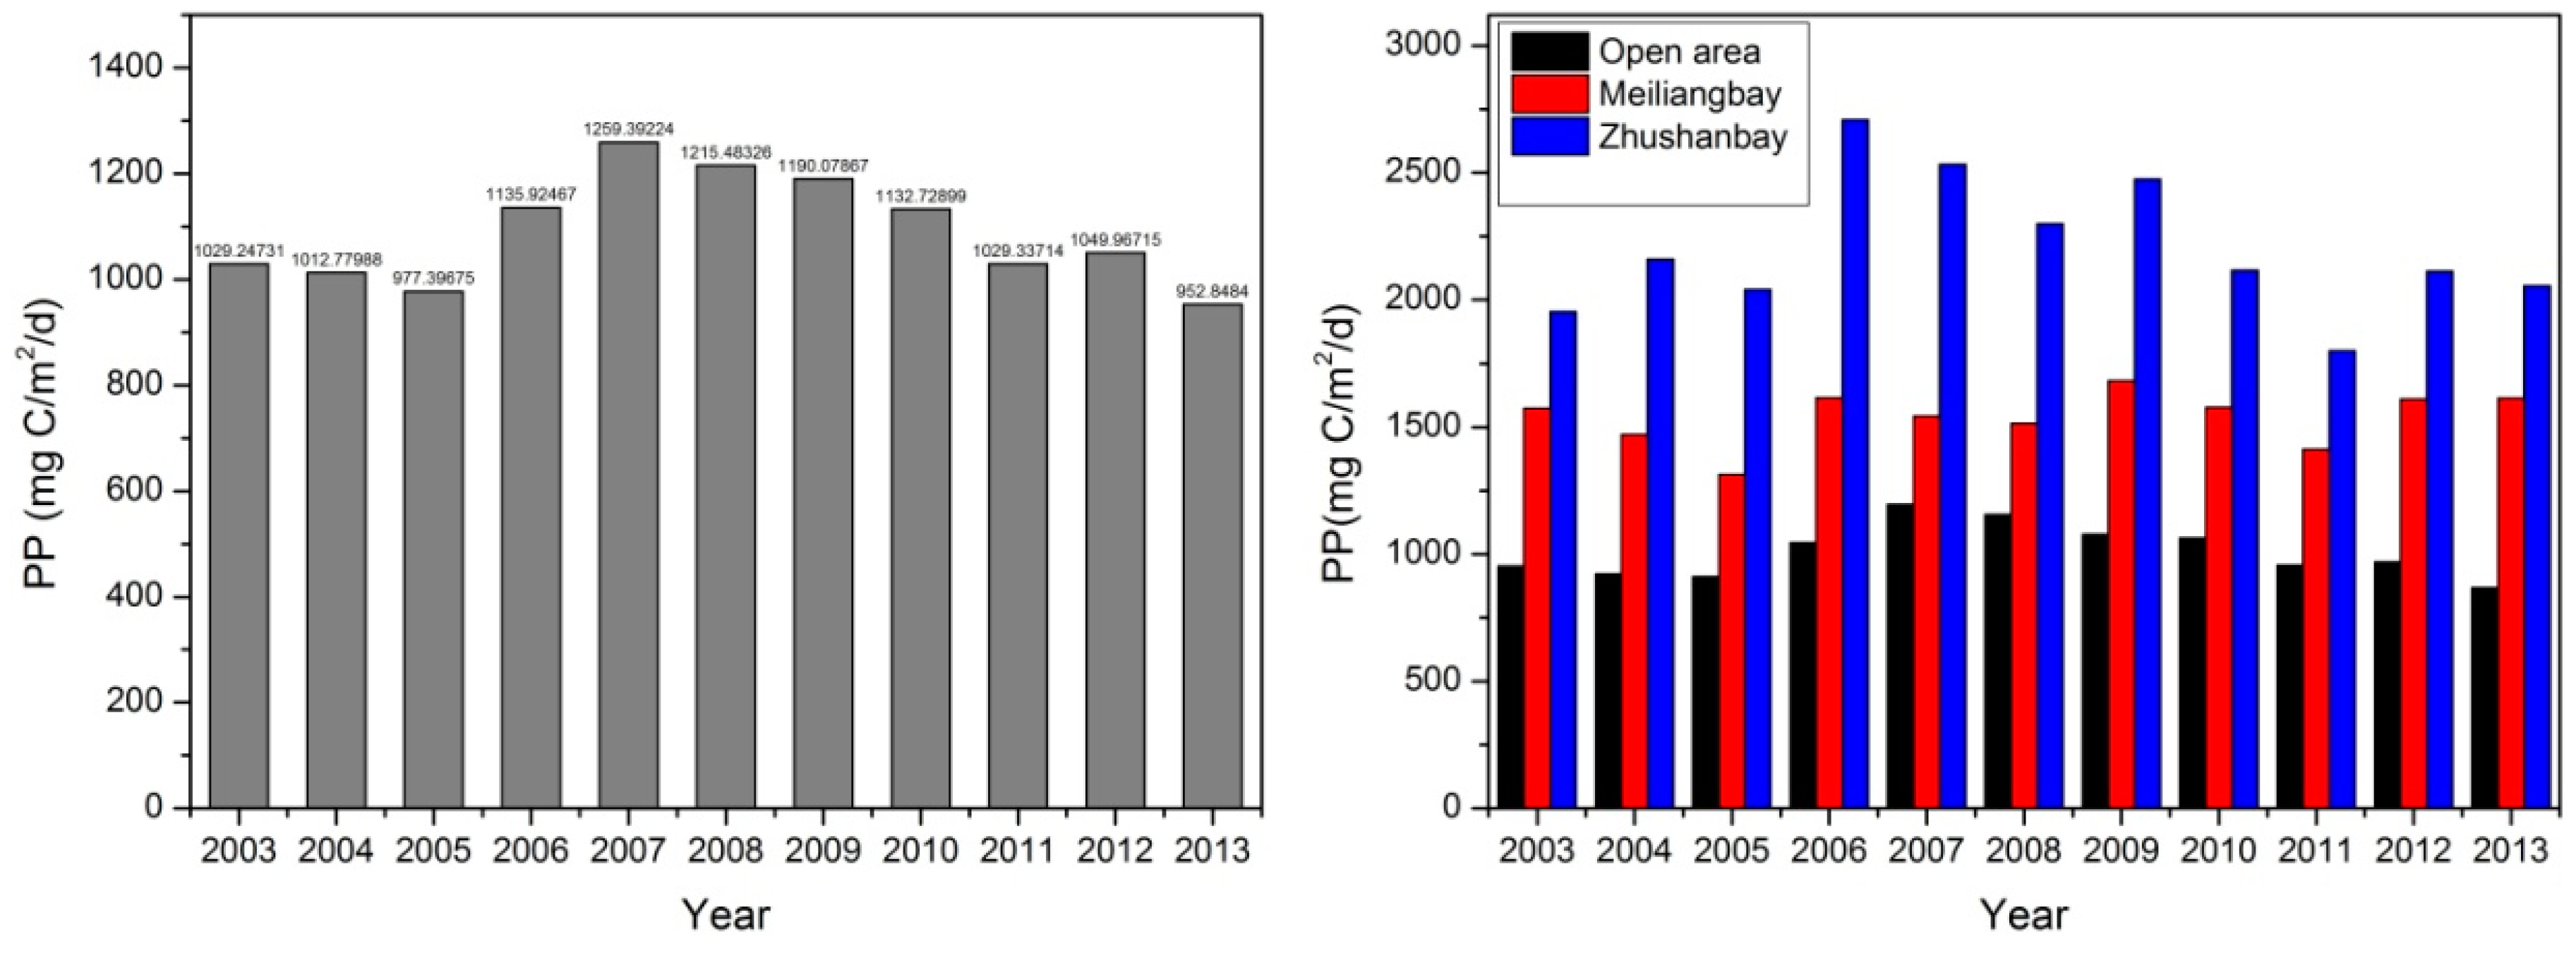
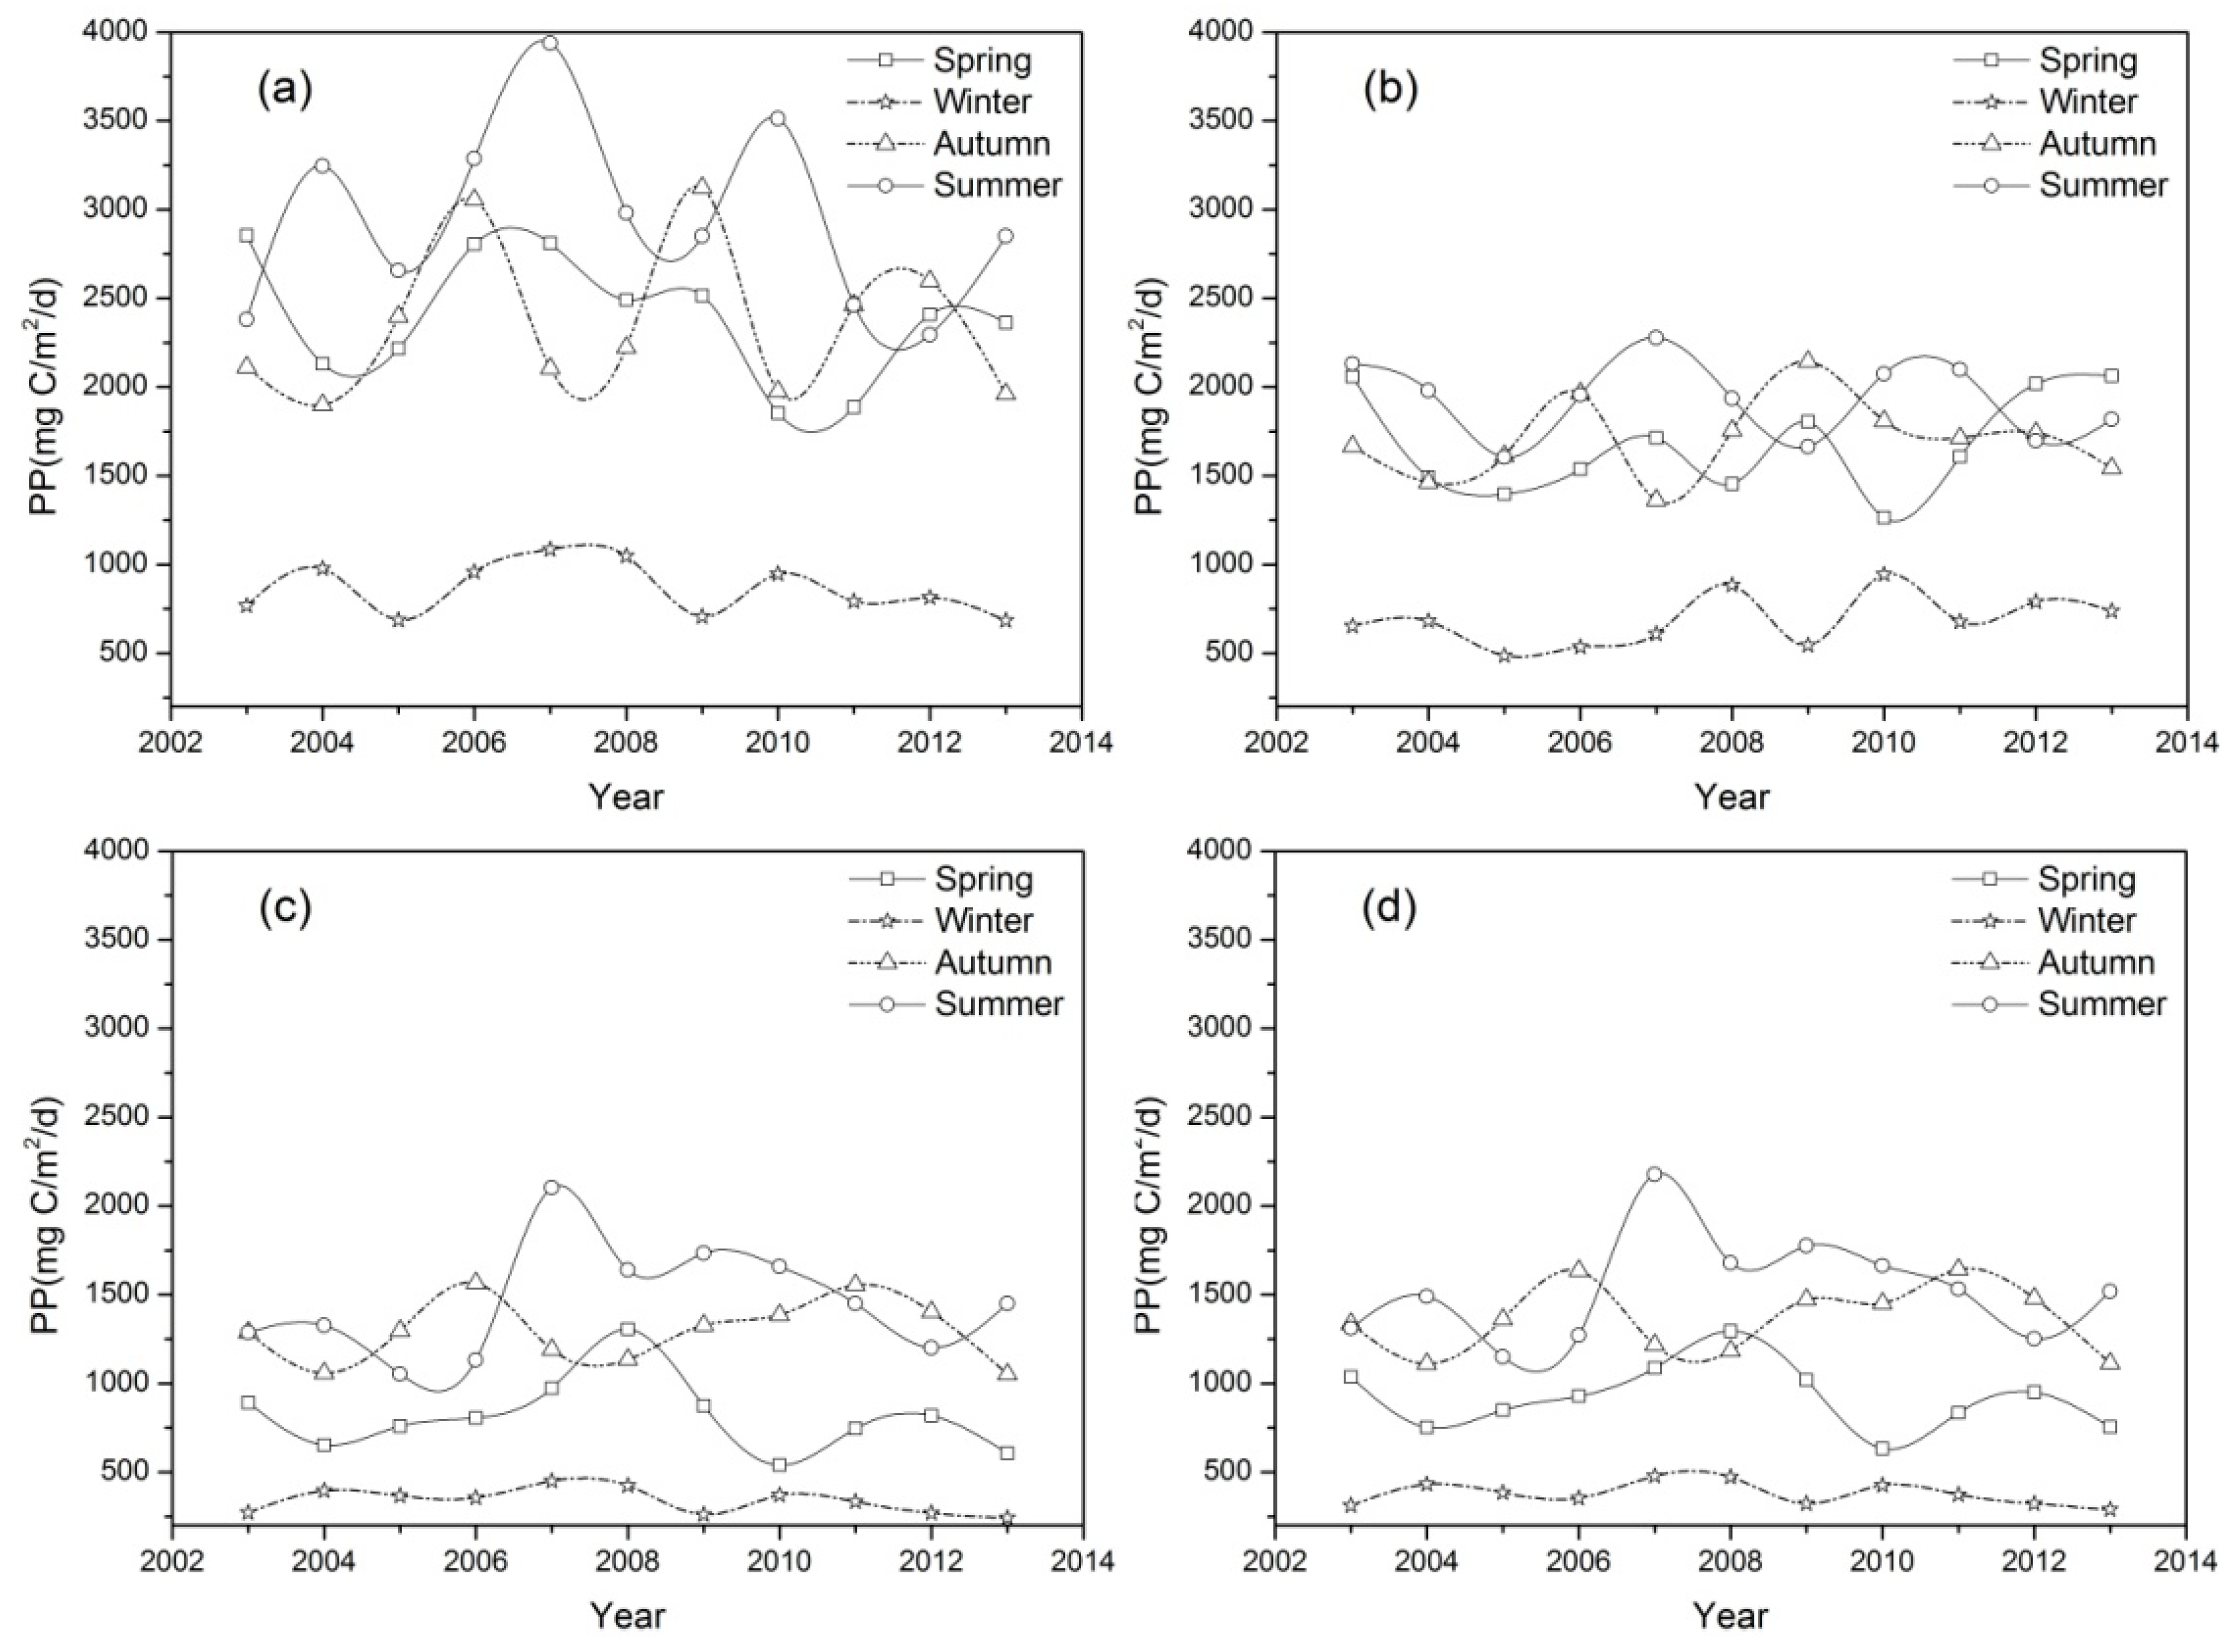
3.2.1. Annual Variation of Phytoplankton Primary Production

The annual means of the MODIS-derived phytoplankton primary production for Lake Taihu are presented in Figure 3, demonstrating inter-annual changes in the phytoplankton primary production from 2003 to 2013. The mean phytoplankton primary production of entire Lake Taihu ranged from 952.84 ± 759.36 to 1259.39 ± 859.71 mg·C·m−2·d−1. The mean daily phytoplankton primary production in Lake Taihu (Open area, Meiliang Bay, Zhushan Bay) from 2003 to 2013 is 1094.06 ± 720.74 C/m2/d, which is far higher than the average of case I water and some case II water, such as Lake Michigan and Lake Huron [42,43]. In detail, the phytoplankton primary production of entire Lake Taihu in 2007 (1259.39 ± 859.71 mg·C·m−2·d−1) and 2008 (1215.48 ± 866.74 mg·C·m−2·d−1) was higher than that of 2005 (977.39 ± 634.76 mg·C·m−2·d−1) and 2013 (952.85 ± 759.36 mg·C·m−2·d−1), revealing that Lake Taihu experienced moderate spatial and inter-annual variations in phytoplankton primary production. It is worth noting that the highest phytoplankton primary production value was recorded in 2007. This was probably due to abnormal weak cold air in farther northern part of the region, which caused high temperature during the winter and spring of 2007, and the abnormal lack of precipitation may have jointly contributed to the monthly variations in 2007 [44]. The phytoplankton primary production in Lake Taihu experienced three markedly different variations from 2003 to 2013: (1) decreased from 2003 to 2005; (2) increased sharply from 2005 to 2007; and (3) decreased from 2007 to 2013.

3.2.2. Seasonal Variation of Phytoplankton Primary Production

The time series of seasonal averages of MODIS-derived phytoplankton primary production values from 2003 to 2013 were constructed for the three regions (open area, Meiliang Bay, Zhushan Bay) by spatially and temporally averaging all valid pixels over the lake in each region. Overall, phytoplankton primary production exhibited typical seasonal variability over Lake Taihu, with significantly higher values in summer (1529.65 ± 782.77 mg·C·m−2·d−1) and autumn (1364.75 ± 697.83 mg·C·m−2·d−1) than in spring (921.47 ± 536.79 mg·C·m−2·d−1 or winter (378.66 ± 206.81 mg·C·m−2·d−1) (t-test, p < 0.001) (Figure 4 and Figure 5).

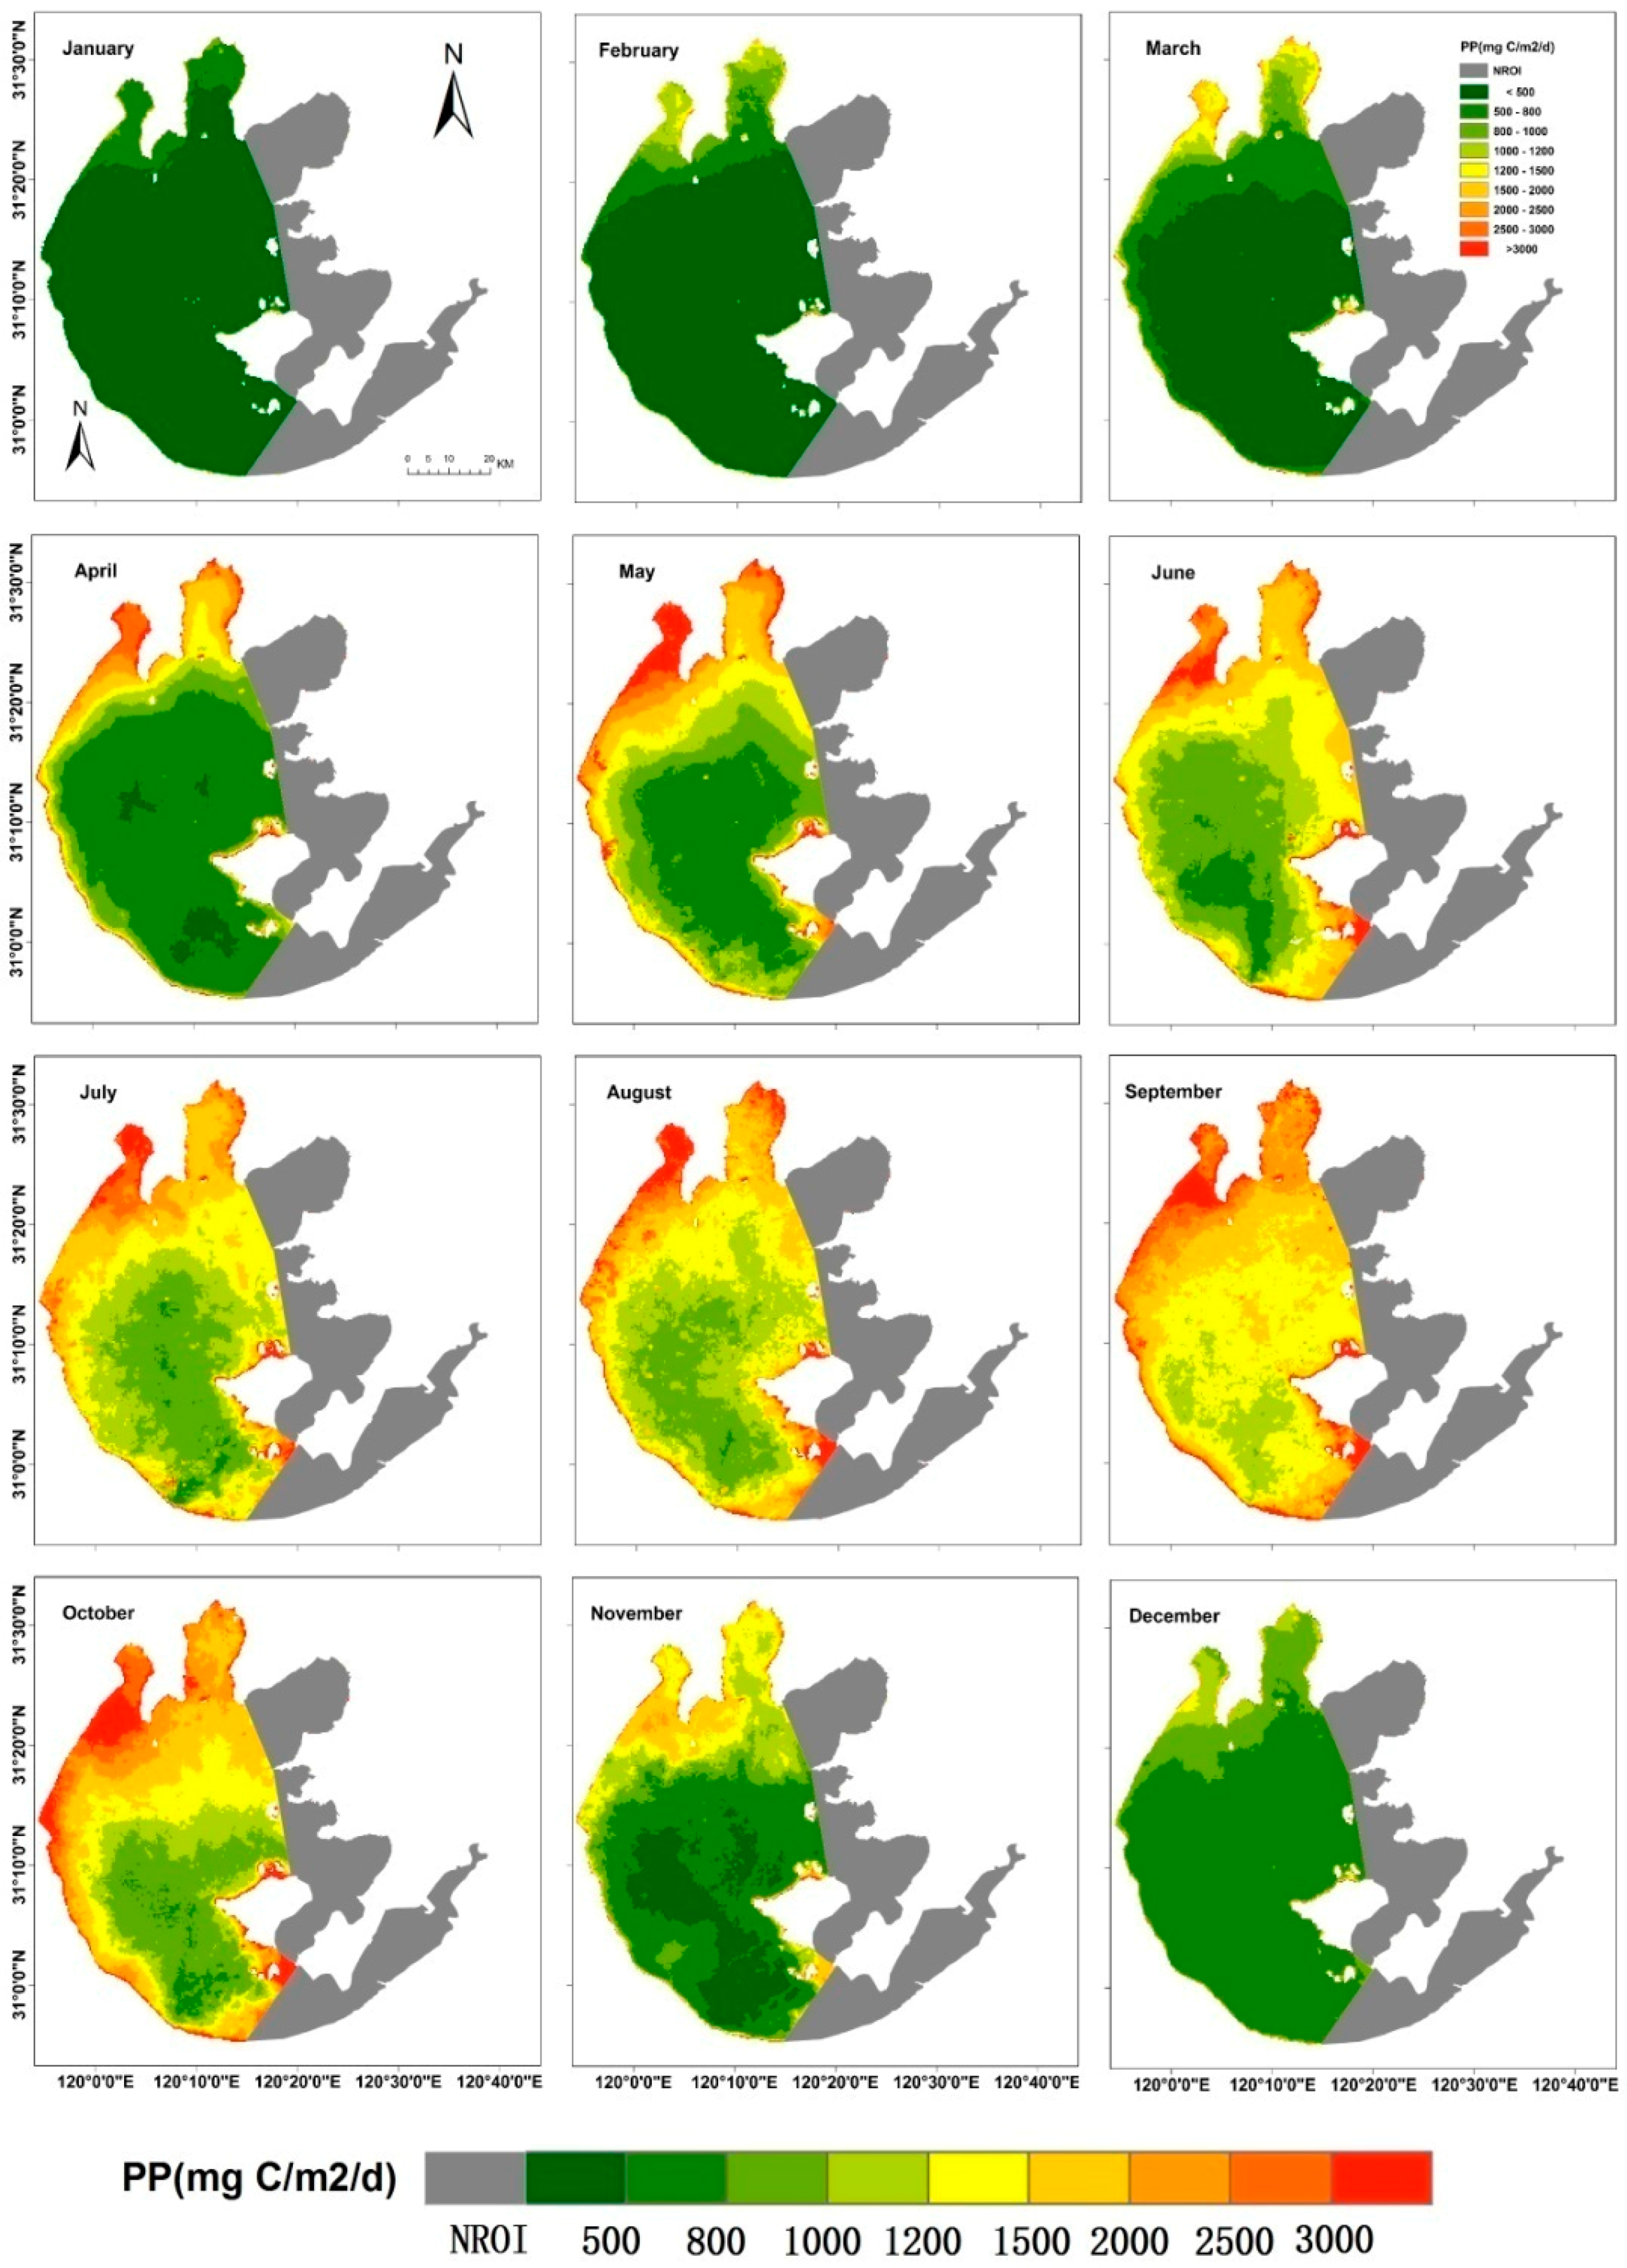
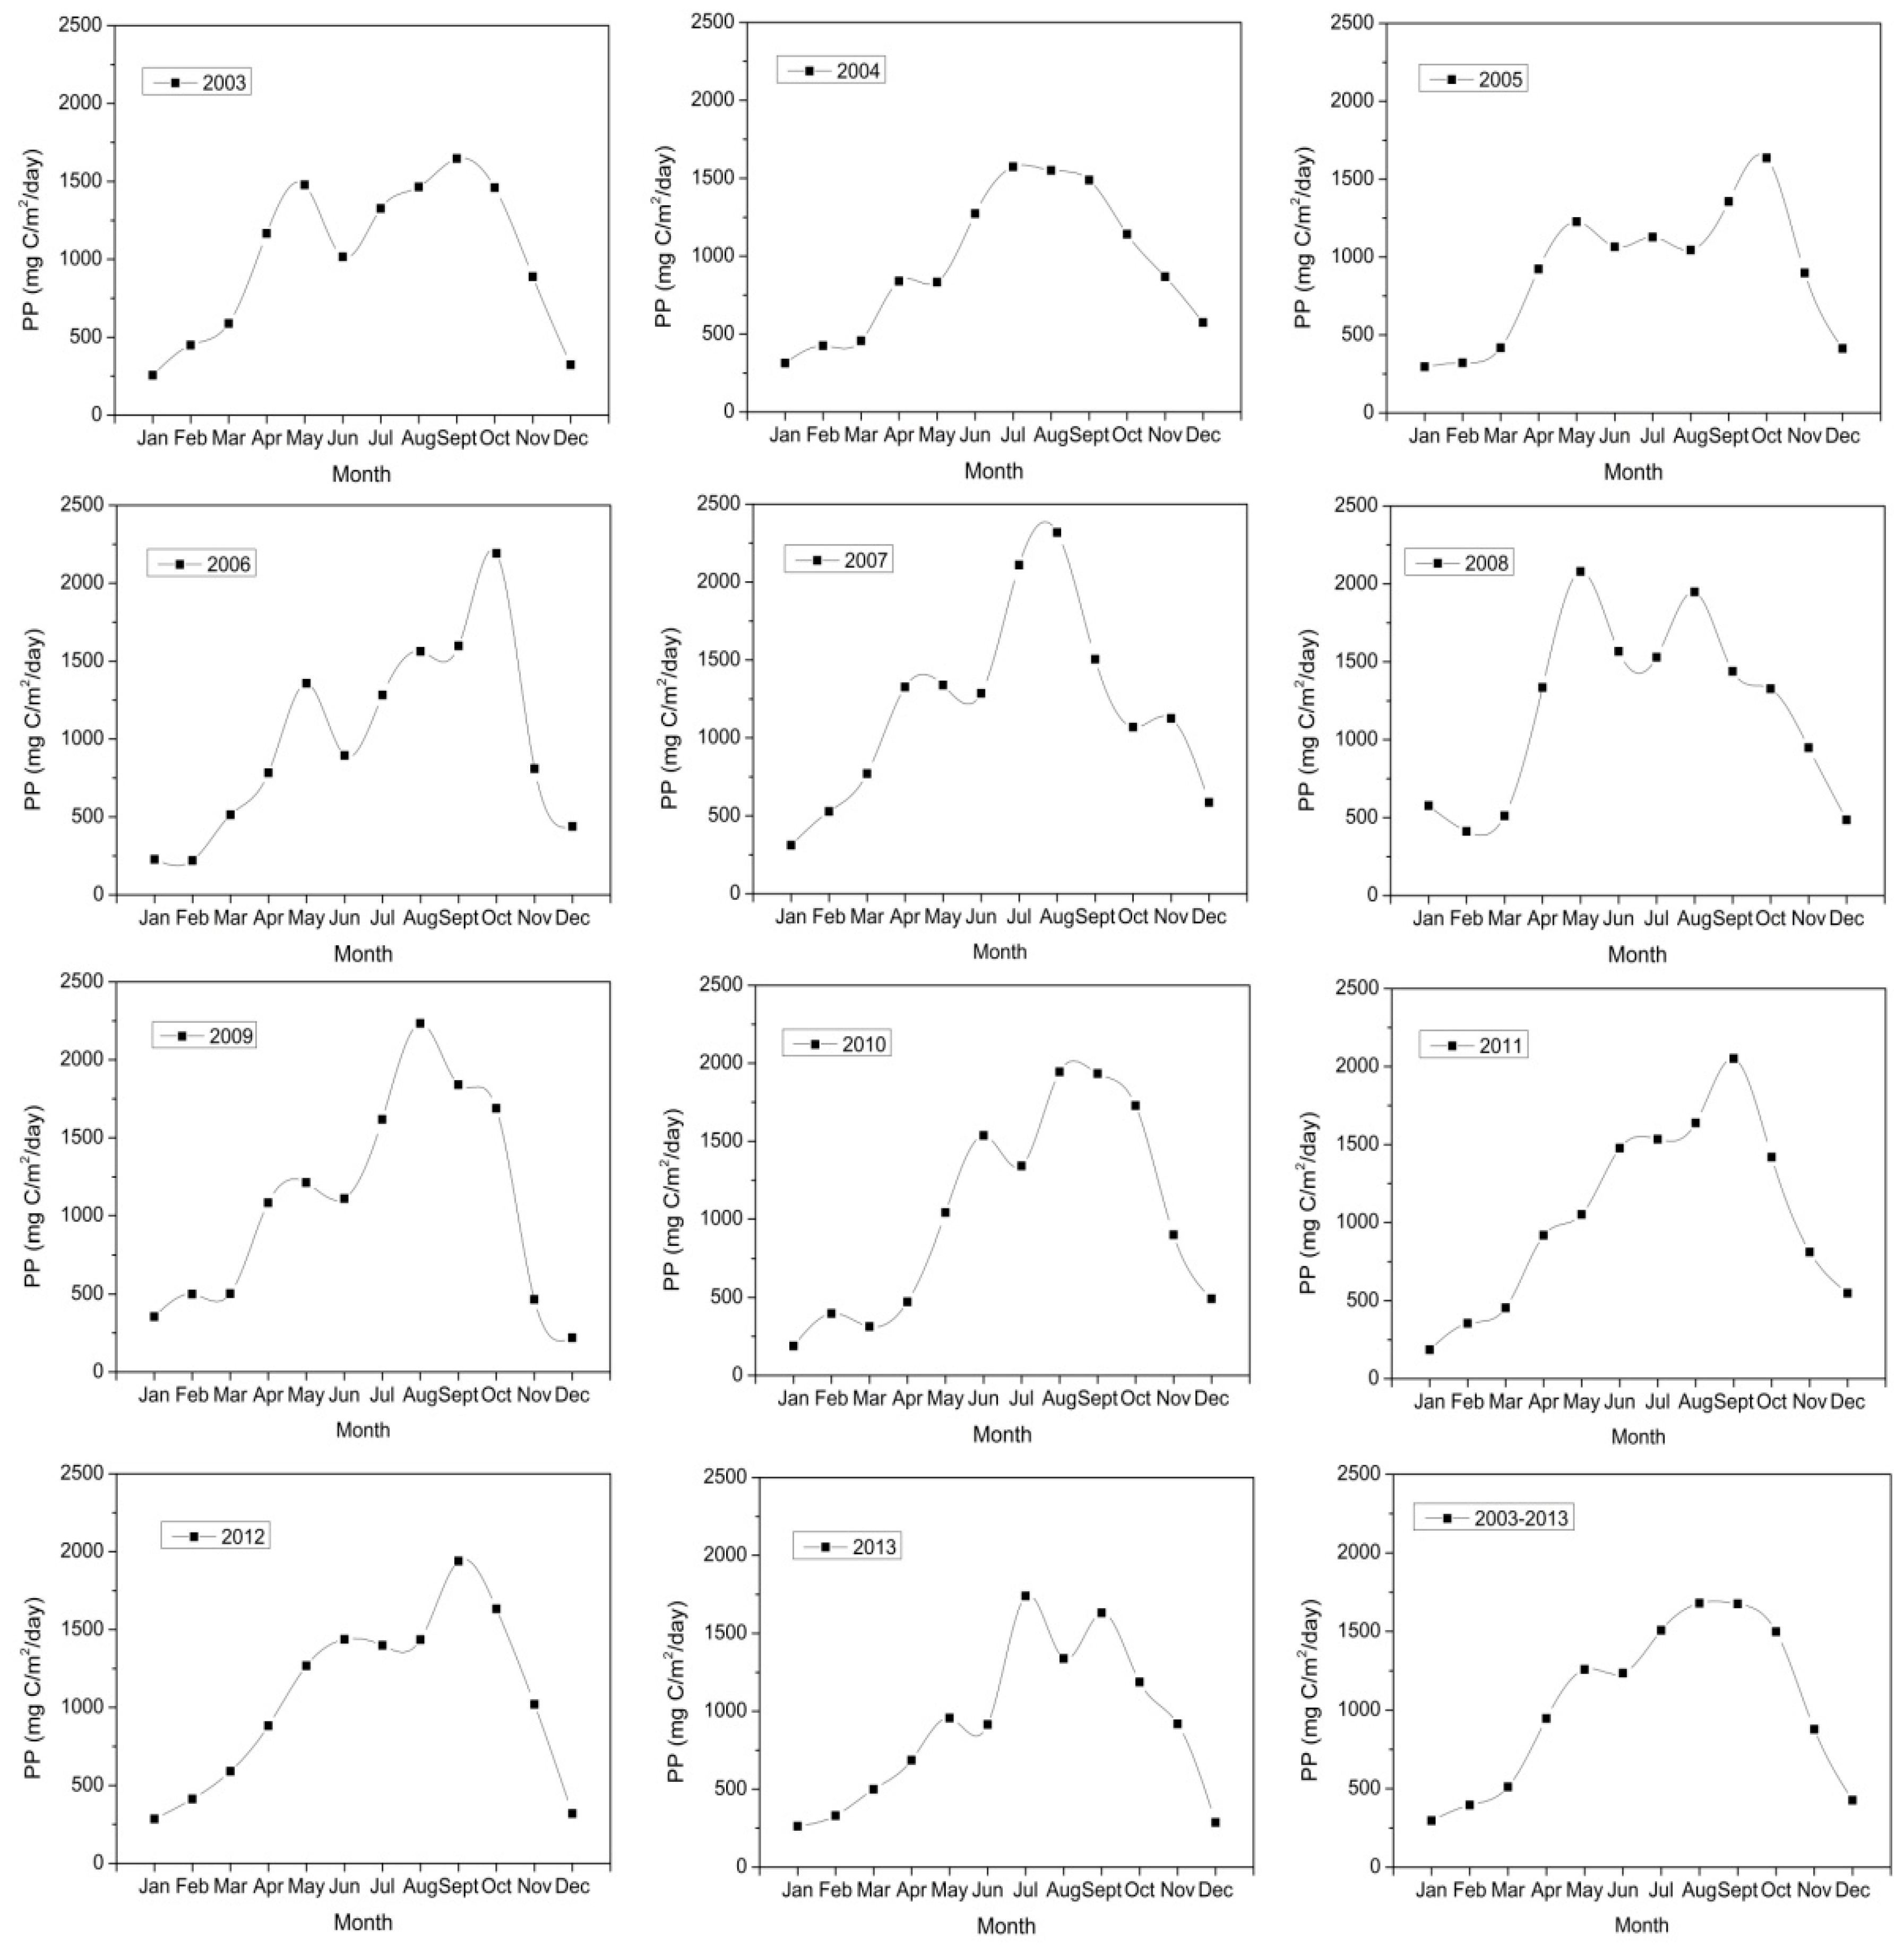
3.2.3. Monthly Variation of Phytoplankton Primary Production

Maps of monthly phytoplankton primary production derived from the VGPM are shown in Figure 6 and Figure 7, demonstrating the inter-monthly changes in the phytoplankton primary production from 2003 to 2013. The highest monthly mean daily phytoplankton primary production in Lake Taihu during the study interval from 2003 to 2013 was measured in August, with an average value of 1675.49 ± 710.36 mg·C·m−2·d−1, nearly 7 times higher than the lowest value of 296.01 ± 130.83 mg·C·m−2·d−1 in January. Some interesting characteristics demonstrated that there is a clear bimodality in character in the monthly variability in Lake Taihu. Specifically, the monthly distribution of phytoplankton primary production increased from January to May, then decreased in June or July, and finally reached highest value in August or September (Figure 7).

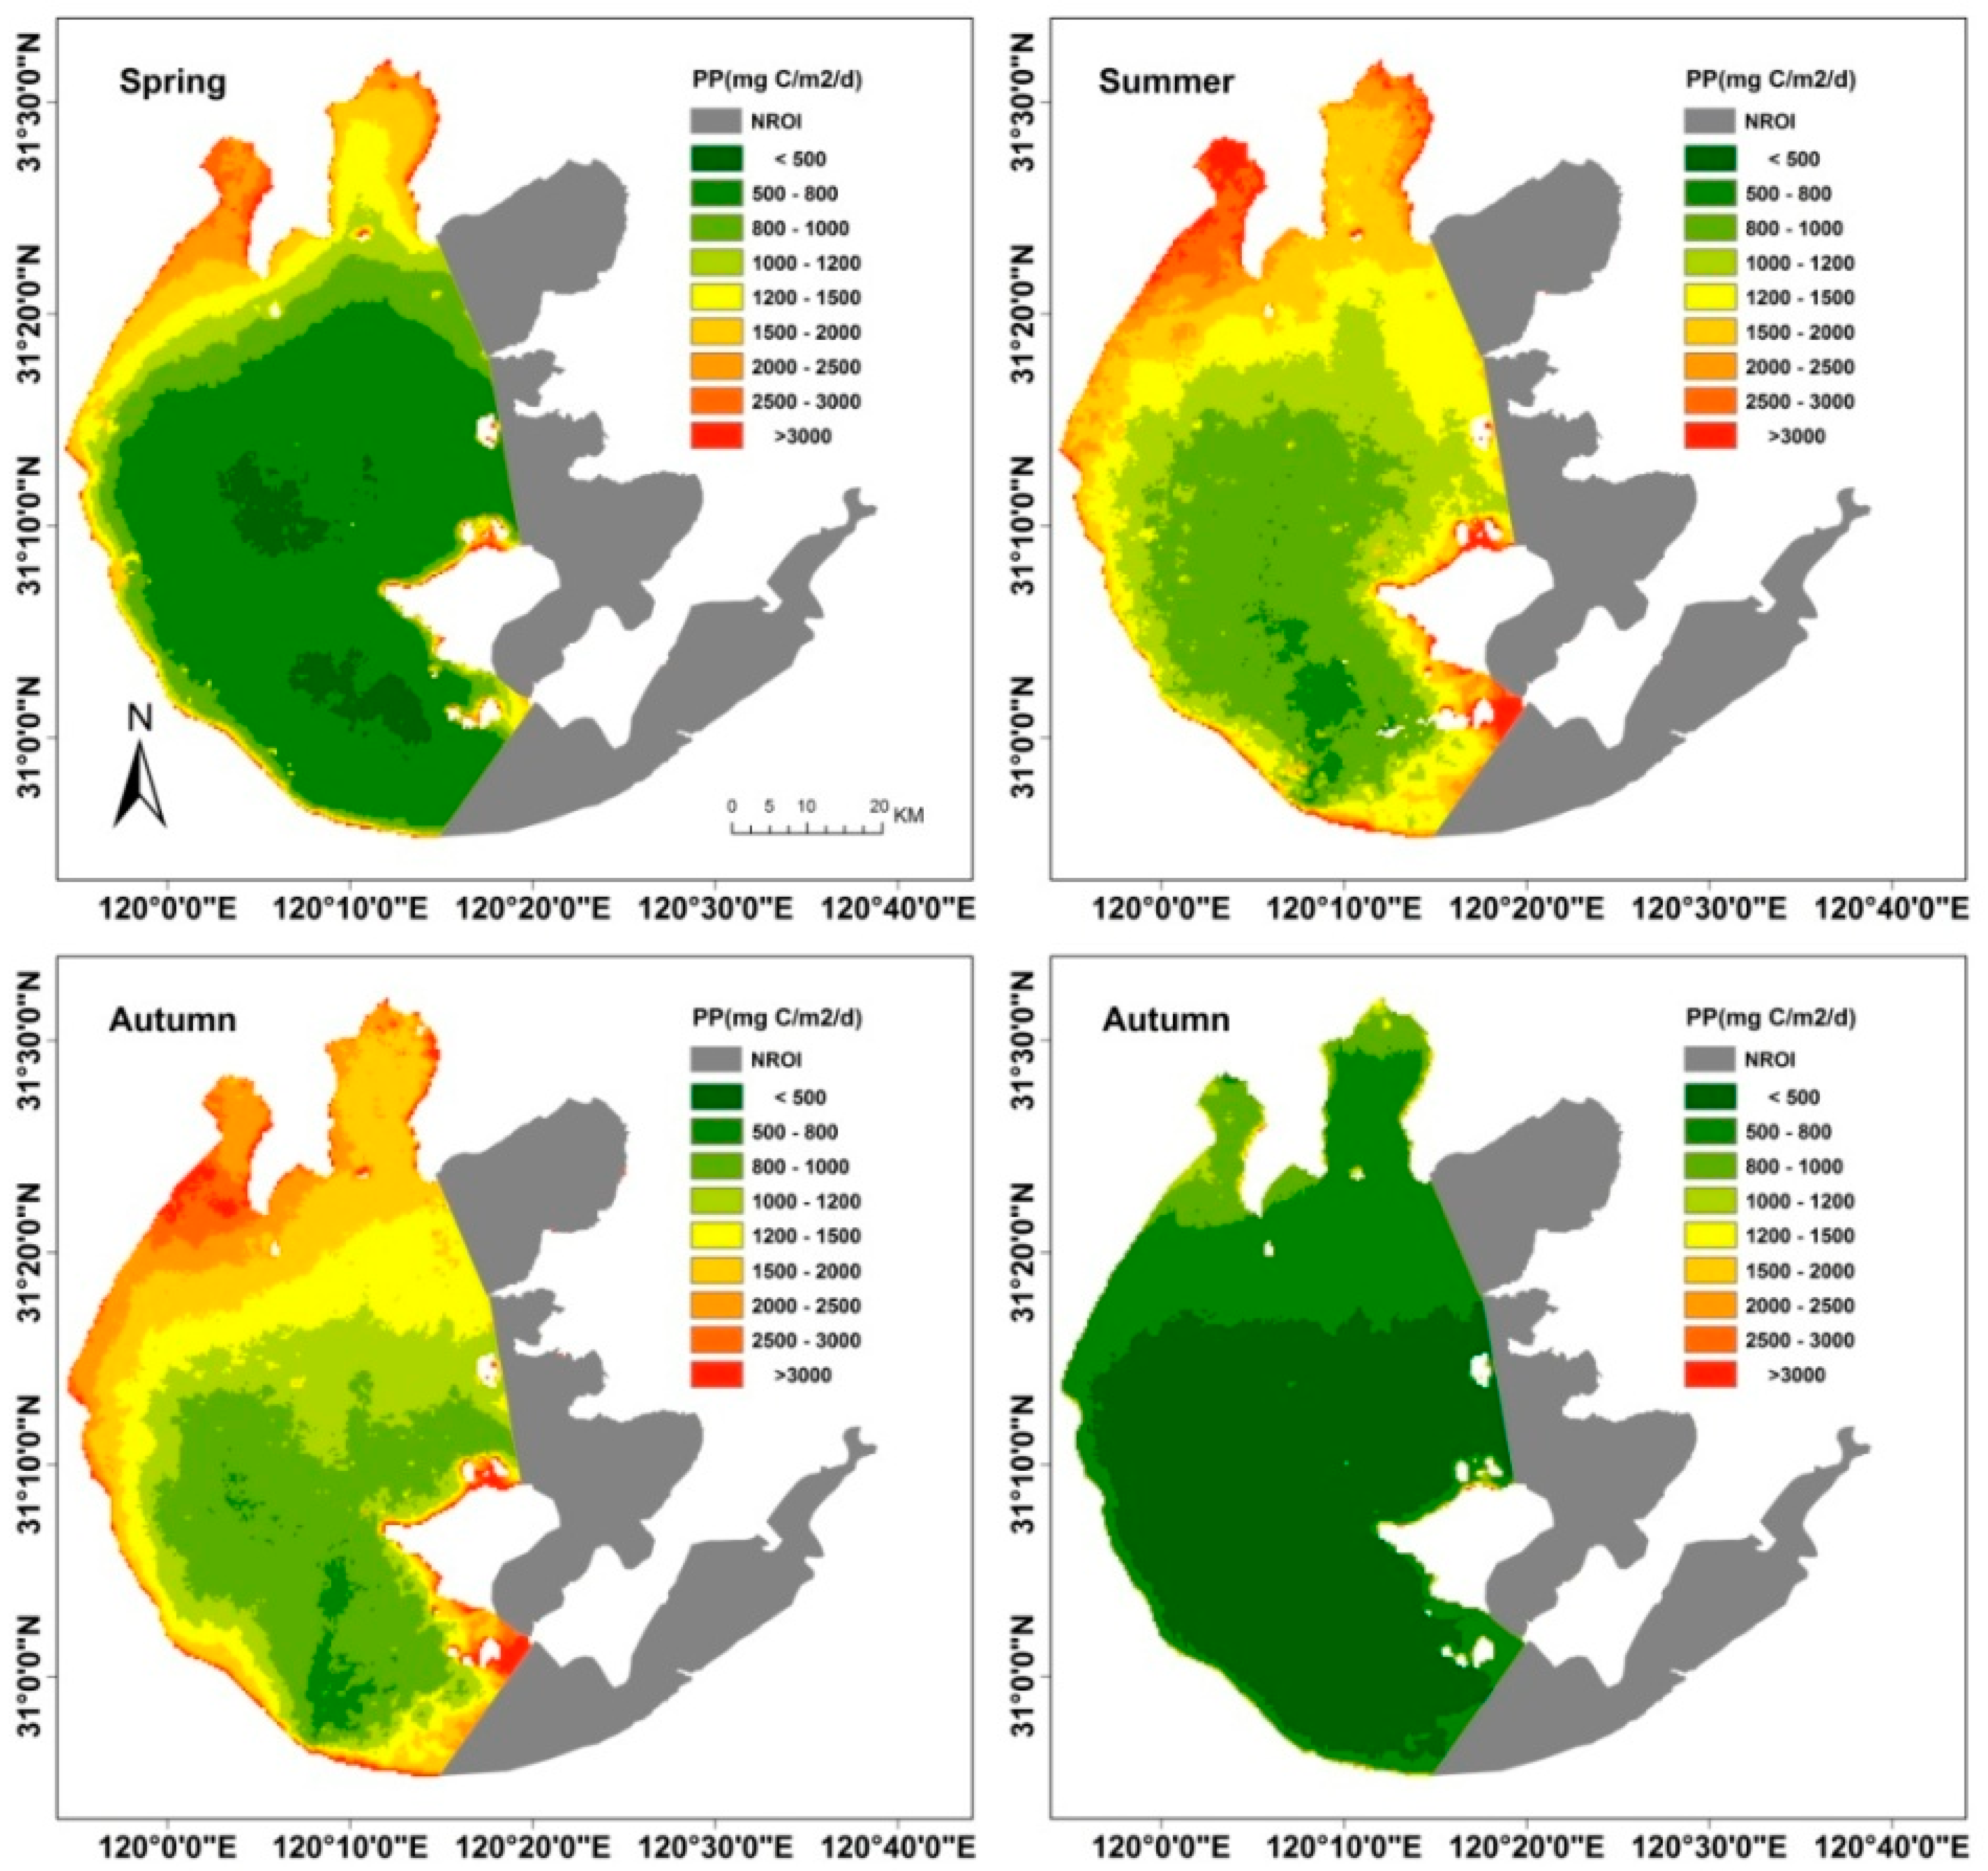
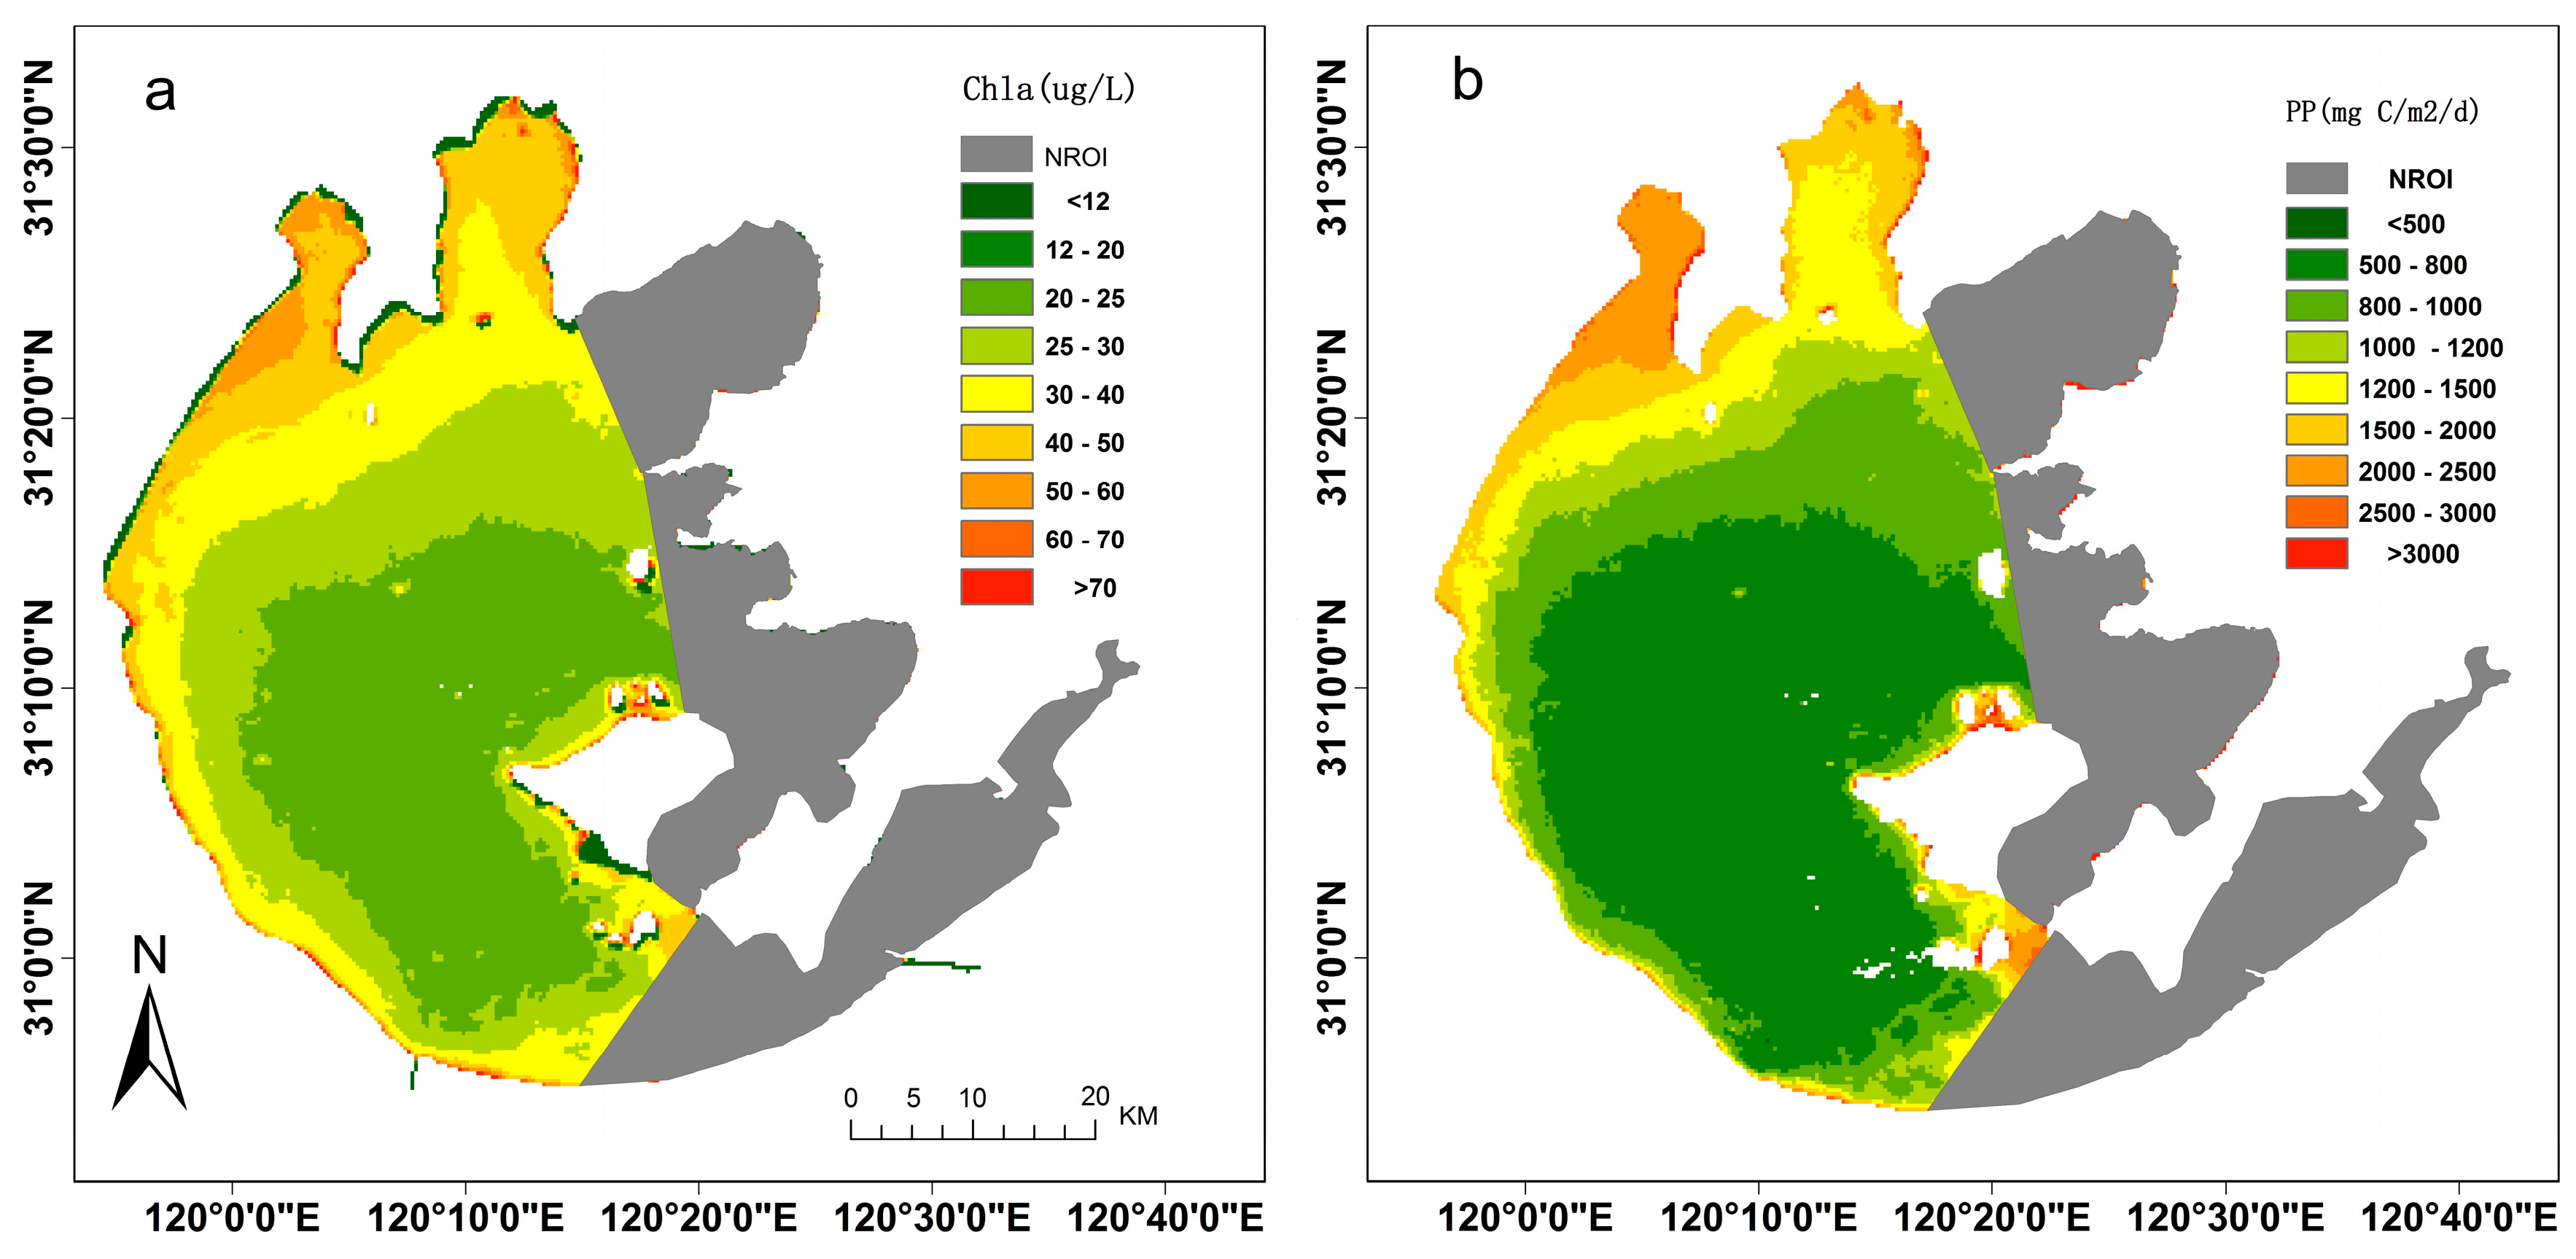
3.2.4. Spatial Variation of Phytoplankton Primary Production

The MODIS-derived phytoplankton primary production data from 2003 to 2013 were averaged to calculate the regional phytoplankton primary production distribution for Lake Taihu. It can be concluded that the decrease of phytoplankton primary production in Lake Taihu from the bay of the lake to the open area is in accordance with the basic distribution principle of the spatial variability (Figure 4 and Figure 6). The area around the estuary such as Meiliang Bay and Zhushan Bay are the regions where the maximum value of phytoplankton primary production was recorded. In the district of the Meiliang Bay and Zhushan Bay, the annual mean daily phytoplankton primary production was 2205.47 ± 1397.98 mg·C·m−2·d−1, 1551.39 ± 851.36 mg·C·m−2·d−1, respectively, which was nearly 2 times and 1.5 times higher than the lowest value of 1019.25 ± 721.23 mg·C·m−2·d−1 that was recorded in open area (Table 1).This is in agreement with previous observations of productivity in Lake Taihu [24,26]. However, there was no significant spatial variation in the monthly mean daily phytoplankton primary production in winter, especially in January and February, possibly due to the degradation of algae in the whole lake (Figure 6).

4. Discussion

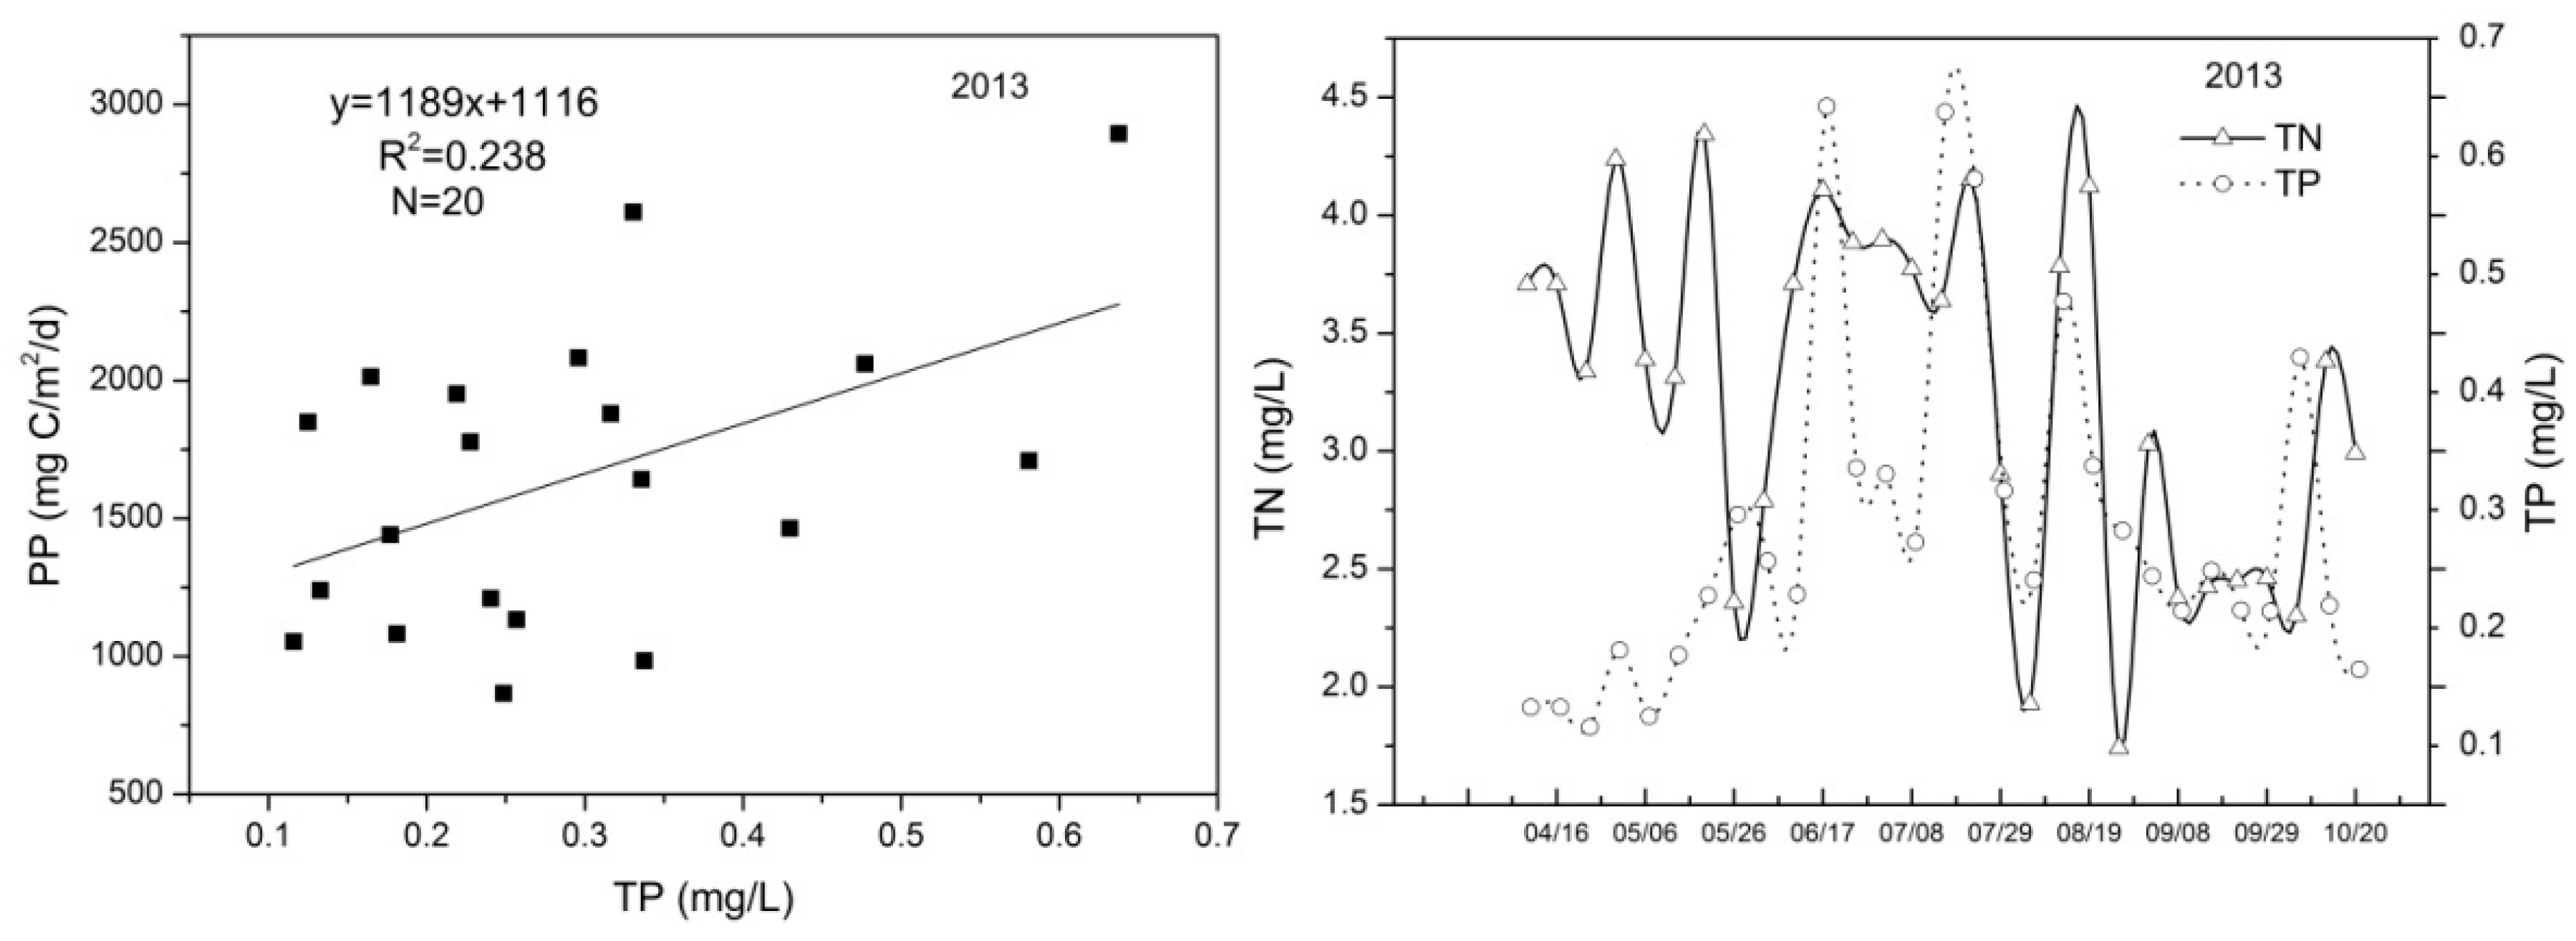
4.1. Correlation between the Primary Production with Chla and Nutrient Concentrations

Previous studies have suggested that phytoplankton biomass is the most important factor affecting the temporal variations of phytoplankton primary production [45,46,47,48,49,50,51,52]. The linear relationship between Chla and phytoplankton primary production demonstrates that the Chla is strongly positively correlated with phytoplankton primary production in Lake Taihu (Figure 8). Deng reported that Chla was low in winter and early spring, and increased in late spring to a maximum in late summer and early autumn; the algae bloom began in May or June, and lasted until October. This finding is consistent with the recorded temporal variations in phytoplankton primary production in Lake Taihu [53]. The spatial variation in phytoplankton primary production was also consistent with the variations in Chla; the highest productivity was observed near Zhushan Bay, where Chla was also the highest among all the study areas (Figure 9).
The phenomenon in which both higher phytoplankton primary production and higher Chla appeared in the bay is related to nutrient distribution. The nutrients mainly affect phytoplankton biomass to control the level of the phytoplankton primary production of phytoplankton. In fact, previous studies have showed that total nutrients, especially the total phosphorus, play a key role in determining phytoplankton in Lake Taihu [25,54,55]. Higher total nitrogen and total phosphorus concentrations at ZhuShan Bay and MeilLiang Bay resulted in a marked increase in Chla. As a highly eutrophic lake, high concentrations of nutrients in Lake Taihu provide good conditions for phytoplankton to grow. The high phytoplankton biomass keeps phytoplankton primary production at a very high level, and the spatial distribution of nutrients can affect the spatial variation in phytoplankton primary production of phytoplankton through affecting the Chla. Some studies have shown that the spatial distribution of nutrient concentrations in Lake Taihu was consistent with the variations in Chla [56,57]. Based on the above analysis, it can be found that the influence of phytoplankton primary production of phytoplankton in Lake Taihu by nutrients is highly significant, and the concentration and spatial distribution of nutrients are major factors responsible for the level and spatial variations in phytoplankton primary production in Lake Taihu. Additionally, the temporal variations of phytoplankton primary production in Lake Taihu appear to show a correlation with the concentrations of nutrients, especially the total phosphorus concentration (Figure 10). Therefore, one of the reasons for the temporal-spatial variations of phytoplankton primary production in Lake Taihu is the temporal-spatial variation in Chla, originated by different nutrient concentrations.

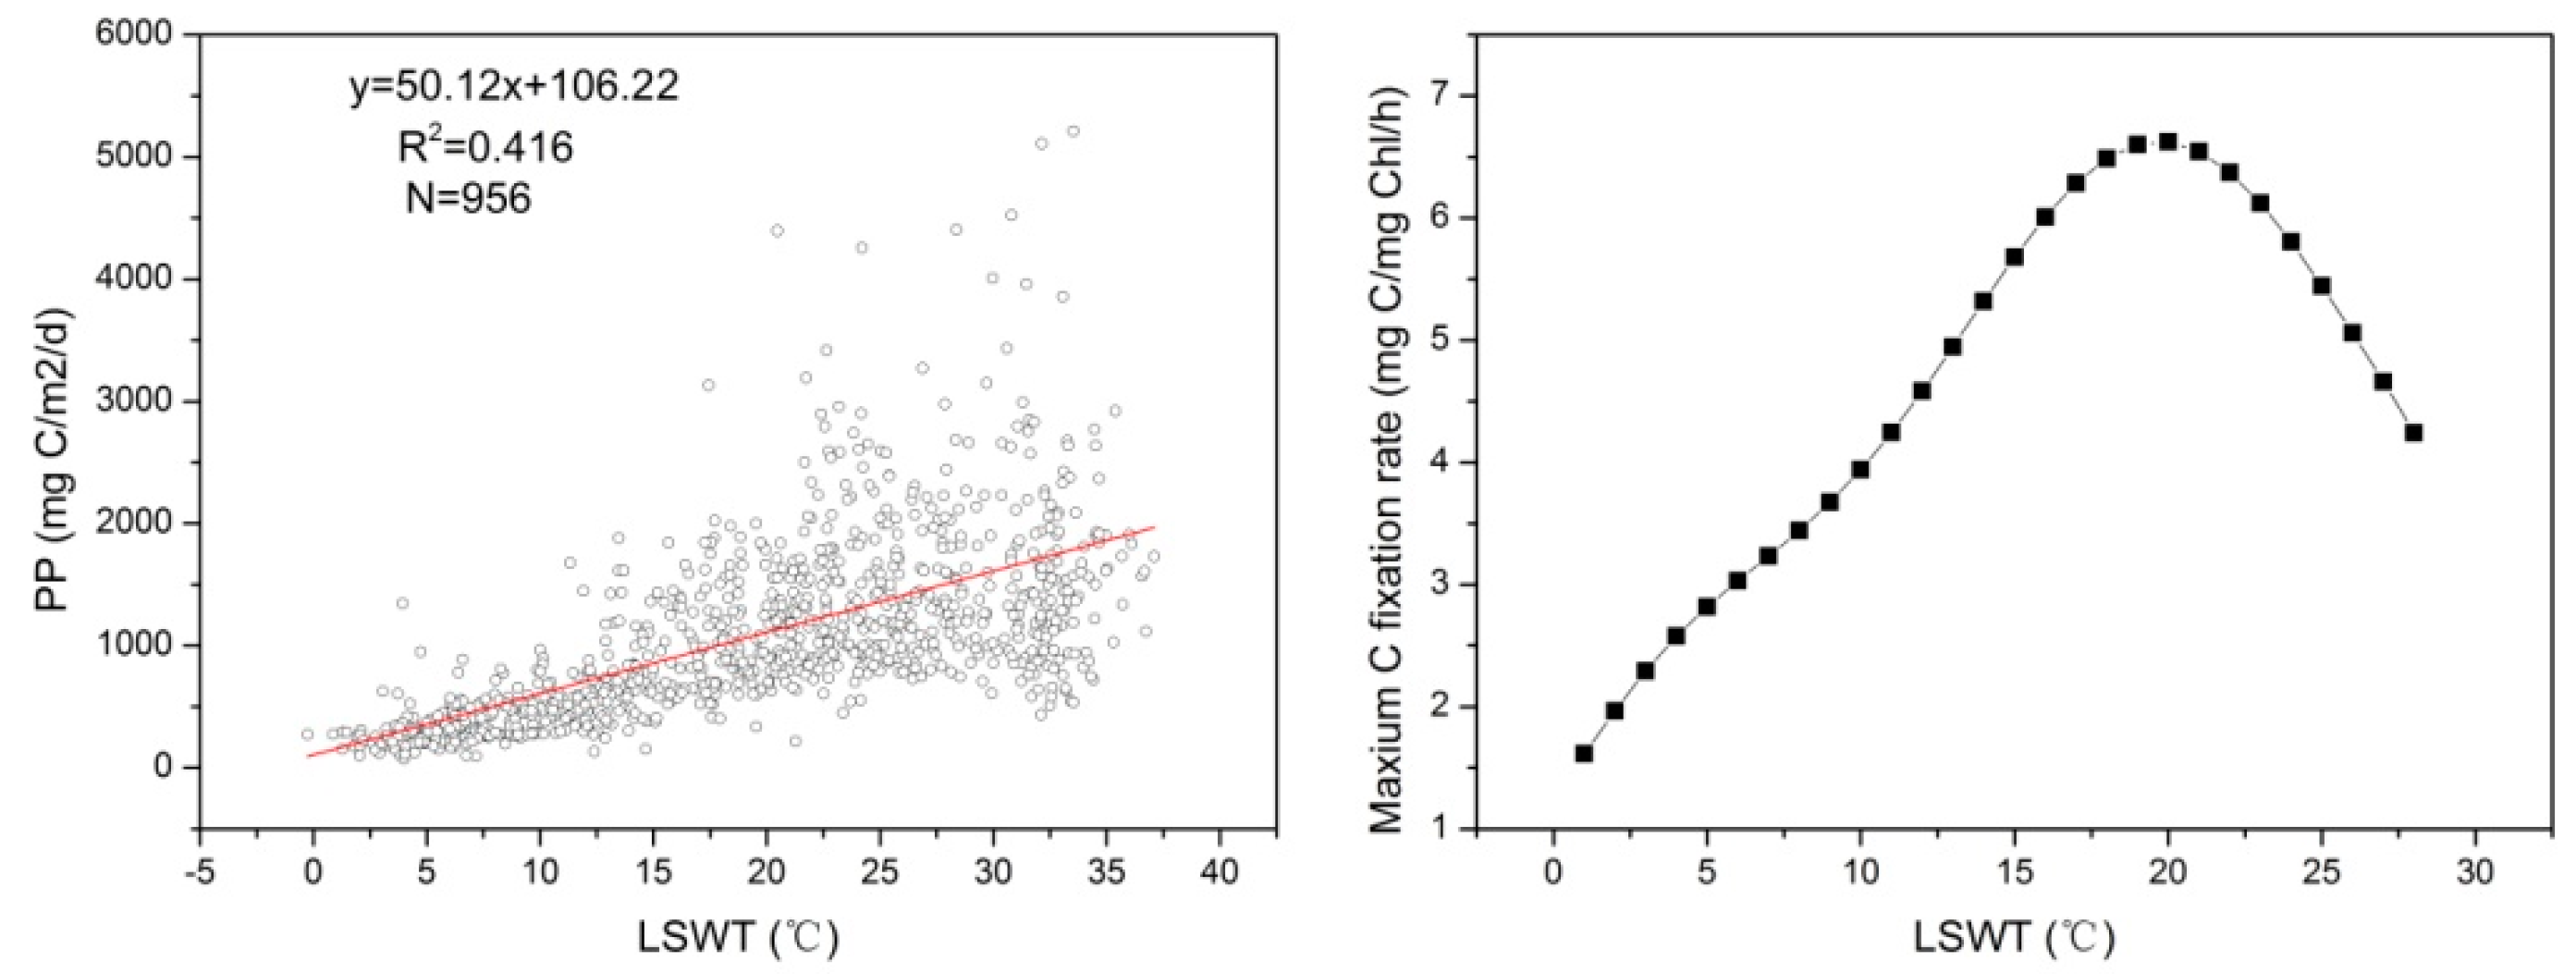
4.2. Correlation between the Primary Production and Lake Water Temperature

Although influenced by nutrient concentrations, the temporal variations of phytoplankton primary production were also likely affected by water temperature. Chla and phytoplankton primary production peaks appeared during different months (Figure 8b), suggesting that the water temperature was likely to be responsible for this difference. The P opt B is potentially the most important variable in the estimation of phytoplankton primary production, and one of the principal approaches for estimating P opt B is to define predictive relationships between P opt B and lake surface temperature by a high-order polynomial. The suitable water temperature for phytoplankton growth was approximately 20 °C [34]; a temperature that is too high or too low will suppress the phytoplankton photosynthesis rate, therefore maximal P opt B values occur from18–23 °C (Figure 11). In January, the water temperature was the lowest, which corresponded to a very low value for P opt B , greatly inhibiting phytoplankton primary production. As temperatures increased, the phytoplankton primary production dropped briefly due to the value of inhibition of P opt B result from the high water temperature of 23.6 °C in June and 26.6 °C in July. In August and September, although the temperature remained high, the phytoplankton primary production began to gradually rise to its maximum due to the explosive growth of the phytoplankton biomass. In November and December, as with the decrease of phytoplankton biomass, the photoperiod and P opt B , phytoplankton primary production began to drop quickly. Based on the above analysis, the water temperature in Lake Taihu seem to influence the temporal distribution by affecting the maximum optimal rate of carbon fixation of water mass. Additionally, the mutual movement between phytoplankton biomass and P opt B was the intrinsic c motivation of the temporal variation mechanism of phytoplankton primary production in Lake Taihu.

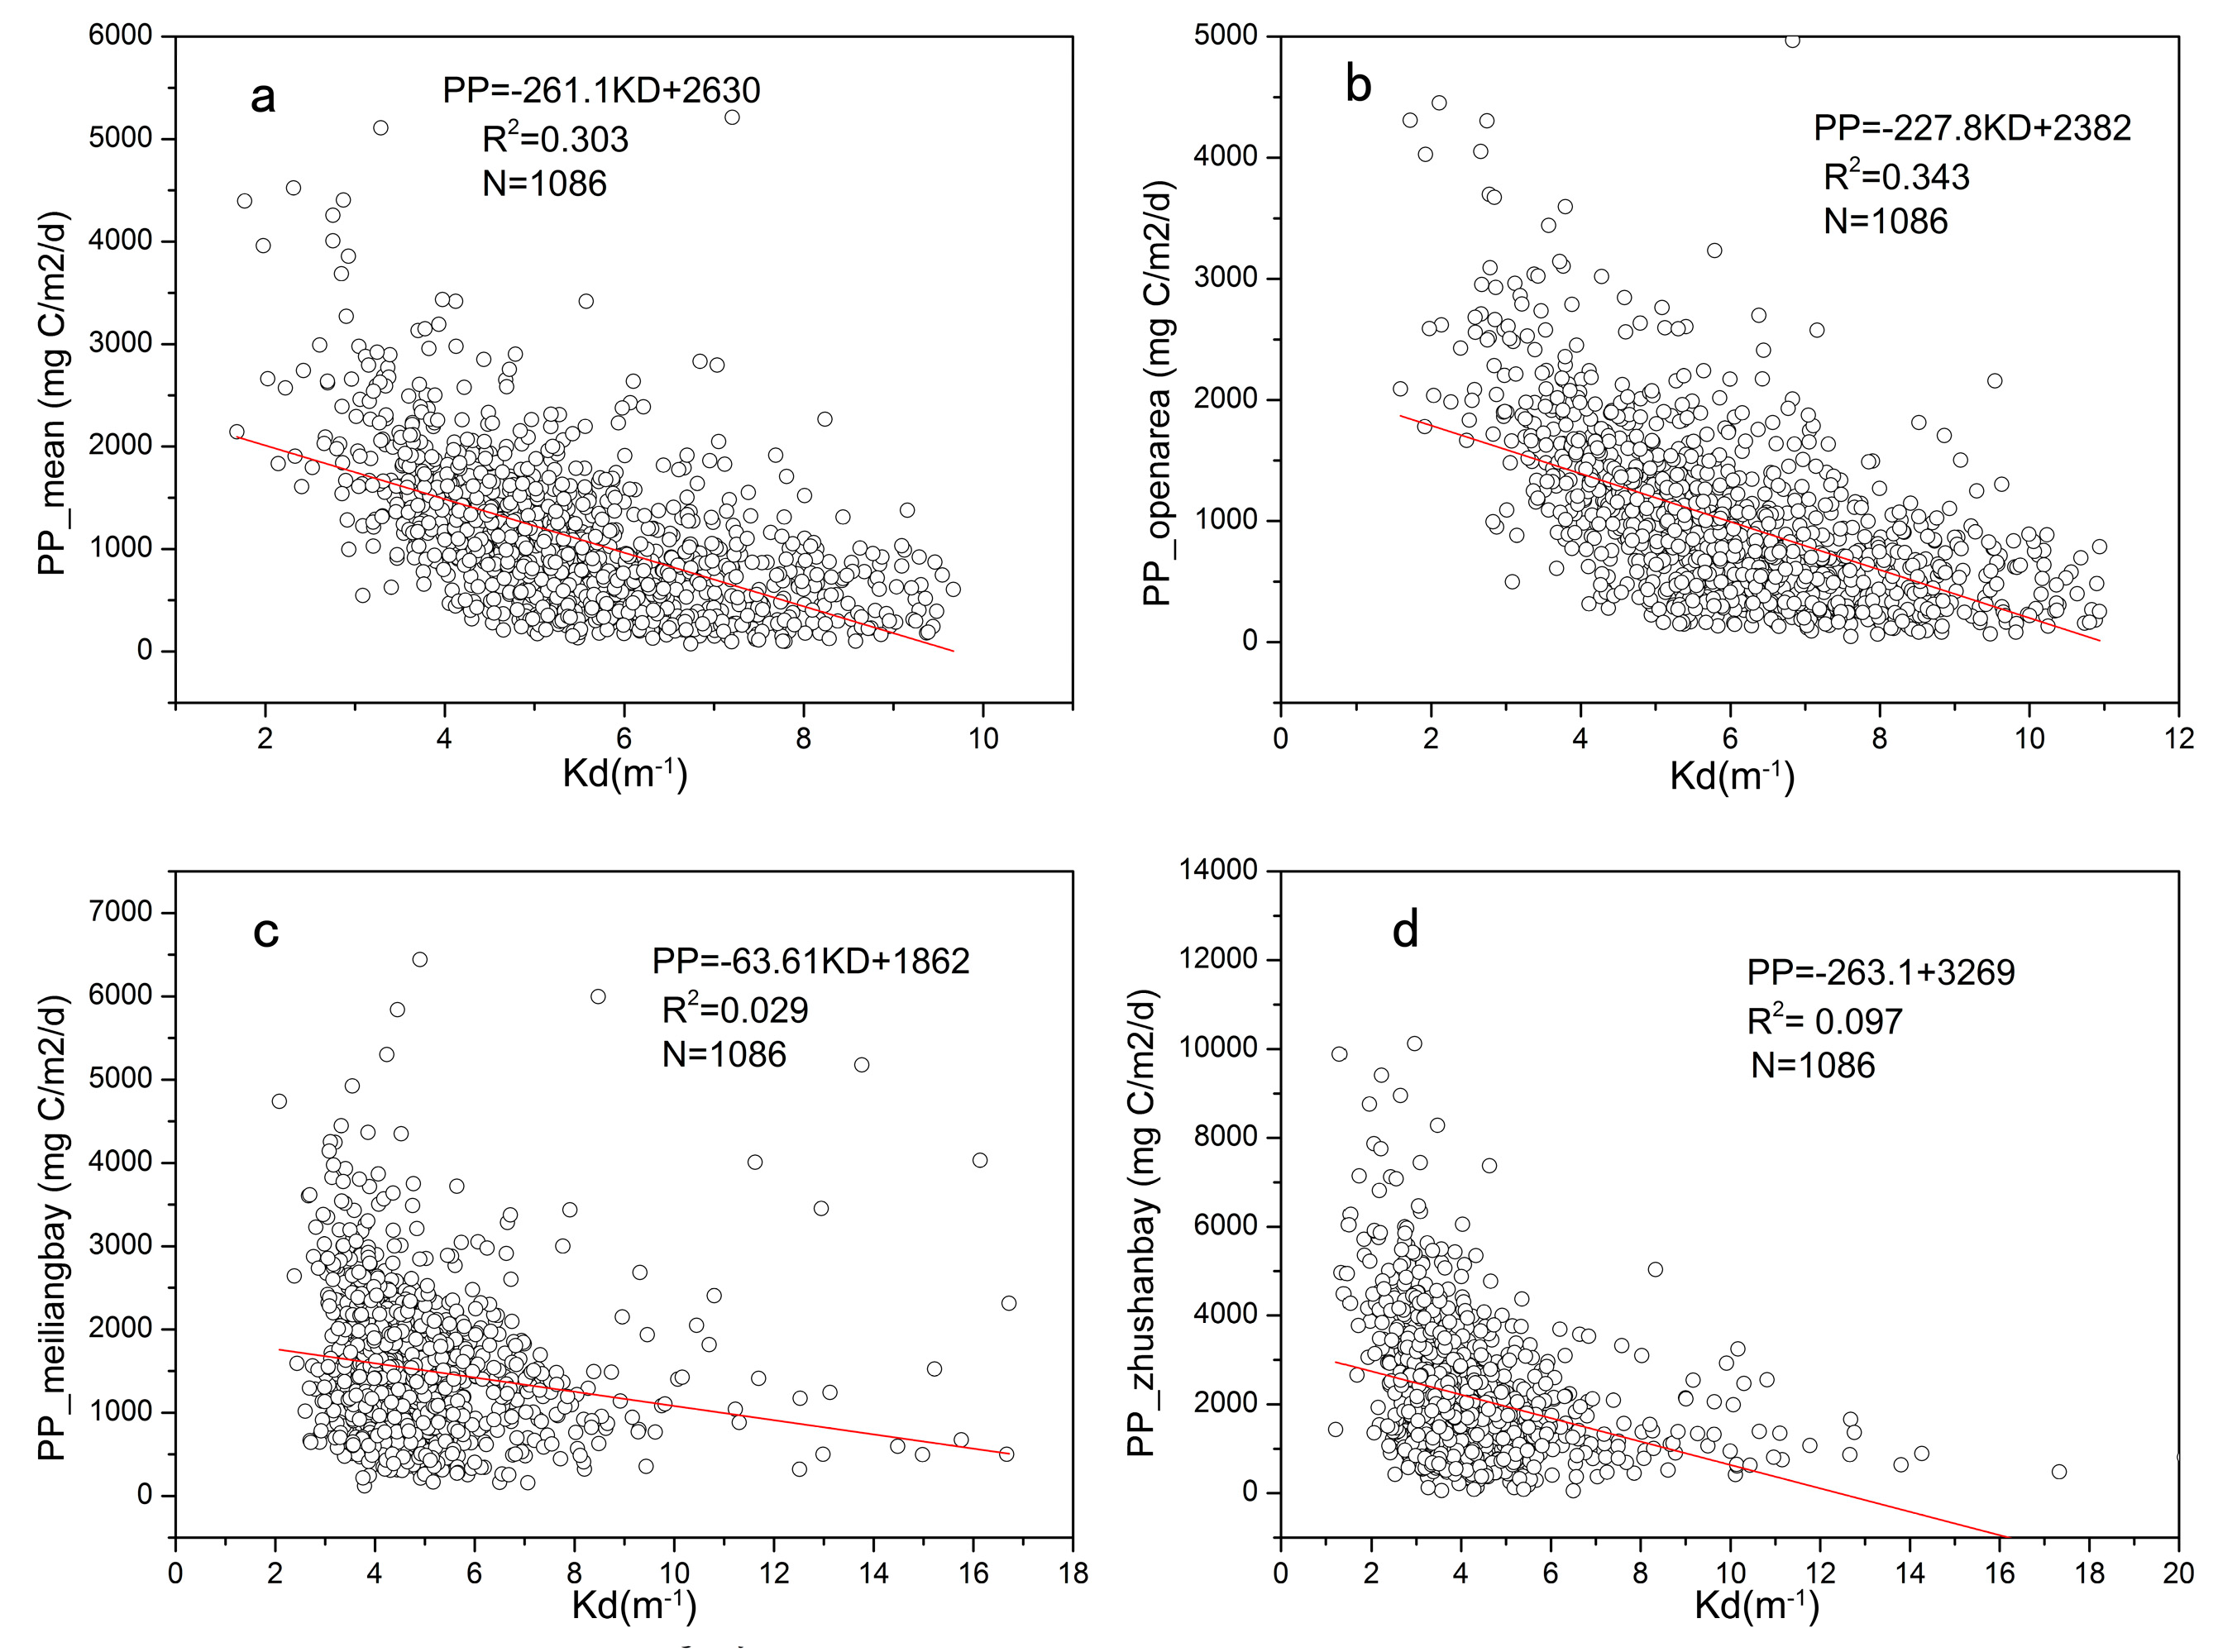
4.3. The Effects of Wind-Driven Sediment Resuspension on the Spatial Distribution of Phytoplankton Primary Production

Wind-induced sediment resuspension can affect phytoplankton primary production by influencing euphotic depth and nutrient availability. To investigate the effect of wind-driven sediment resuspension on the spatial distribution of phytoplankton primary production in Lake Taihu, we performed a correlated analysis between the MODIS-derived phytoplankton primary production and Kd(PAR). The results (Figure 12) showed the existence of a negative linear correlation between the phytoplankton primary production and the Kd(PAR) in the open area, indicating that the process of primary production in the open area was easily disturbed by wind-derived waves. This result is in agreement with our finding that lower phytoplankton primary production was found in the open area compared to the other regions of Lake Taihu. The dominant wind directions in Lake Taihu were found to be NNW and ESE, resulting in longer wind fetches for northern and western parts of Lake Taihu. Longer wind fetches yield stronger wind forces and thus more sediment resuspension in the northern and western regions of Lake Taihu. In the littoral zones and bays, such as Zhushan Bay and Meiliang Bay, the wind fetches are shorter than in the open area. Therefore, wind-driven sediment resuspension, expressed using disturbance index, could explain the spatial variations in the phytoplankton primary production in Lake Taihu.

5. Conclusions

The efficient and accurate estimation of the distribution and variation of phytoplankton primary production is important for ecosystem and water resource management of lake. In this study, we addressed one technical challenge and understanding of the long-term primary production distribution variations in Lake Taihu, from 2003 to 2013. The technical challenge is that the VGPM model is a good model for phytoplankton primary production estimation in Lake Taihu (R2 = 0.753, RMSE = 384.68 mg·C·m−2·d−1). It holds considerable promise and could be useful for primary production estimation in large lakes.
The annual mean daily phytoplankton primary production was 1094.06±720.74 mg·C·m−2·d−1 in Lake Taihu from 2003 to 2013. The spatial pattern in daily mean phytoplankton primary production was similar to that of Chla, decreasing from bay to open area. The phytoplankton primary production exhibited typical seasonal variability over the entire Lake Taihu, and there is a clear bimodality characteristic of phytoplankton primary production in the monthly variability of Lake Taihu.
Temporal-spatial variations in phytoplankton primary production appeared to be mainly driven by Chla variations, and the spatial distribution of nutrients affected the spatial variation of phytoplankton primary production of through affecting Chla. High nutrient concentrations determined the high Chla and then resulted in the high phytoplankton primary production of Lake Taihu. Other contributing factors include water temperature, surface PAR, photoperiod and euphotic depth responsible for the spatial variation of the phytoplankton primary production. In addition, as a large, shallow lake, the wind-driven sediment resuspension plays an important role in spatial distribution of phytoplankton primary production, especially in the open area.

Acknowledgments

This study was jointly supported by the National Natural Science Foundation of China (Grants 41271355 and 41230744), the CAS/SAFEA International Partnership Program for Creative Research Teams (KZZD-EW-TZ-08), International Science & Technolog Cooperation Program of China (2014DFG91780), and the Taihu Lake Laboratory Ecosystem Research Station (TLLER). The authors would like to thank the anonymous reviewers for their useful and constructive comments.

Author Contributions

Y.D. wrote the main manuscript text. Y.Z., K.S., Y.Z. and D.L. designed and conducted the experiments, collected and analyzed the data. Y.Z., K.S., Y.Z contributed to analyzing the data, writing and editing the manuscript. All authors reviewed the manuscript.

Conflicts of Interest

The authors declare no conflict of interest.

References

  1. Lakshmi, E.; Pratap, D.; Nagamani, P.V.; Rao, K.H.; Latha, T.P.; Choudhury, S.B. Time Series Analysis of Primary production along the East Coast of India Using Oceansat-2 Ocean Colour Monitor (O cm). Int. Arch. Photogramm. Remote Sens. Spat. Inf. Sci. 2014, 40, 1049–1053. [Google Scholar] [CrossRef]
  2. Deines, A.M.; Bunnell, D.B.; Rogers, M.W. A review of the global relationship among freshwater fish, autotrophic activity, and regional climate. Rev. Fish Biol. Fish. 2015, 25, 323–336. [Google Scholar] [CrossRef]
  3. Behrenfeld, M.J.; Boss, E.; Siegel, D.A.; Shea, D.M. Carbon-based ocean productivity and phytoplankton physiology from space. Glob. Biogeochem. Cycles 2005, 19, 177–202. [Google Scholar] [CrossRef]
  4. Wetzel, R.G. Limnology: Lake and River Ecosystem. EOS Trans. Am. Geophys. Union 2001, 21, 1–9. [Google Scholar]
  5. Sterner, R.W. In situ-measured primary production in Lake Superior. J. Great Lakes Res. 2010, 36, 139–149. [Google Scholar] [CrossRef]
  6. Smith, R.C.; Prezelin, B.B.; Bidigare, R.R.; Baker, K.S. Bio-optical modeling of photosynthetic production. Limnol. Oceanogr. 1989, 34, 1524–1544. [Google Scholar] [CrossRef]
  7. Li, G.; Ping, G.; Fang, W.; Qiang, L. Estimation of ocean primary production and its spatio-temporal variation mechanism for East China Sea based on VGPM model. J. Geogr. Sci. 2004, 14, 32–40. [Google Scholar] [CrossRef]
  8. Fahnenstiel, G.L.; Sayers, M.J.; Shuchman, R.A.; Yousef, F.; Pothoven, S.A. Lake-wide phytoplankton production and abundance in the Upper Great Lakes: 2010–2013. J. Great Lakes Res. 2016, 42, 619–629. [Google Scholar] [CrossRef]
  9. Morel, A.; Berthon, J.F. Surface pigments, algal biomass profiles, and potential production of the euphotic layer: Relationships reinvestigated in view of remote sensing applications. Limnol. Oceanogr. 1989, 34, 1545–1562. [Google Scholar] [CrossRef]
  10. Fahnenstiel, G.; Pothoven, S.; Vanderploeg, H.; Klarer, D.; Nalepa, T.; Scavia, D. Recent Changes in Primary Production and Phytoplankton in the Offshore Region of Southeastern Lake Michigan. J. Great Lakes Res. 2010, 36, 20–29. [Google Scholar] [CrossRef]
  11. Eppley, R.W.; Stewart, E.; Abbott, M.R.; Heyman, U. Estimating ocean primary production from satellite chlorophyll—Introduction to regional differences and statistics for the southern California bight. J. Plankton Res. 1985, 7, 227–234. [Google Scholar] [CrossRef]
  12. Behrenfeld, M.J.; Falkowski, P.G. A consumer’s guide to phytoplankton primary production models. Limnol. Oceanogr. 1997, 42, 1479–1491. [Google Scholar] [CrossRef]
  13. Carr, M.E.; Friedrichs, M.A.M.; Schmeltz, M.; Aita, M.N.; Antoine, D.; Arrigo, K.R.; Asanuma, I.; Aumont, O.; Barber, R.; Behrenfeld, M. A comparison of global estimates of marine primary production from ocean color. Deep Sea Res. Part II Top. Stud. Oceanogr. 2006, 53, 741–770. [Google Scholar] [CrossRef] [Green Version]
  14. Behrenfeld, M.J.; Falkowski, P.G. Photosynthetic rates derived from satellite-based chlorophyll concentration. Limnol. Oceanogr. 1997, 42, 1–20. [Google Scholar] [CrossRef]
  15. Tripathy, S.C.; Ishizaka, J.; Siswanto, E.; Shibata, T.; Mino, Y. Modification of the vertically generalized production model for the turbid waters of Ariake bay, southwestern Japan. Estuar. Coast Shelf 2012, 97, 66–77. [Google Scholar] [CrossRef]
  16. Kameda, T.; Ishizaka, J.; Murakami, H. Two-phytoplankton community model of primary production for ocean color satellite data. Hyperspectr. Remote Sens. Ocean. 2000, 4154, 159–165. [Google Scholar]
  17. Ye, H.B.; Chen, C.Q.; Sun, Z.H.; Tang, S.L.; Song, X.Y.; Yang, C.Y.; Tian, L.Q.; Liu, F.F. Estimation of the primary production in pearl river estuary using MODIS data. Estuar. Coast Shelf 2015, 38, 506–518. [Google Scholar] [CrossRef]
  18. Vollenweider, R.A.; Munawar, M.; Stadelmann, P. A comparative Review of Phytoplankton and Primary Production in the Laurentian Great Lakes. J. Fish. Res. Board Can. 2011, 31, 739–762. [Google Scholar] [CrossRef]
  19. Kemili, P.; Putri, M.R. Estimation of primary production in Banda Sea using the vertical distribution model. AIP Conf. Proc. 2014, 1589, 389–393. [Google Scholar]
  20. Field, C.B.; Behrenfeld, M.J.; Randerson, J.T.; Falkowski, P. Primary production of the biosphere: Integrating terrestrial and oceanic components. Science 1998, 281, 237–240. [Google Scholar] [CrossRef] [PubMed]
  21. Kahru, M.; Mitchell, B.G. Influence of the El Niño—La Niña cycle, on satellite-derived primary production, in the California Current. Investig. Mar. 2002, 29, 27-1–27-4. [Google Scholar] [CrossRef]
  22. Mcclain, C.R.; Christian, J.R.; Signorini, S.R.; Lewis, M.R.; Asanuma, I.; Turk, D.; Dupouy-Douchement, C. Satellite ocean-color observations of the tropical pacific ocean. Deep Sea Res. Part II Top. Stud. Oceanogr. 2002, 49, 2533–2560. [Google Scholar] [CrossRef]
  23. Gregg, W.W.; Conkright, M.E.; Ginoux, P.; O’Reilly, J.E.; Casey, N.W. Ocean primary production and climate: Global decadal changes. Geophys. Res. Lett. 2003, 30, 157–168. [Google Scholar] [CrossRef]
  24. Zhang, Y.L.; Qin, B.Q.; Liu, M.L. Temporal—Spatial variations of chlorophyll a and primary production in meiliang bay, Lake Taihu, China from 1995 to 2003. J. Phytoplankton Res. 2007, 29, 707–719. [Google Scholar] [CrossRef]
  25. Zhang, Y.; Feng, S.; Ronghua, M.A.; Liu, M.A.; Qin, B. Spatial pattern of euphotic depth and estimation of phytoplankton primary production in Lake Taihu in autumn 2004. J. Lake Sci. 2008, 20, 380–388. [Google Scholar]
  26. Yin, Y.; Zhang, Y.; Shi, Z.; Liu, X. Estimation of spatial and seasonal changes in phytoplankton primary production in meiliang bay, Lake Taihu, based on the vertically generalized production model and MODIS data. Acta Ecol. Sin. 2012, 32, 3528–3537. [Google Scholar] [CrossRef]
  27. Cheng-Feng, L.E.; Yun-Mei, L.I.; Zha, Y.; Sun, D.Y.; Heng, L.U. Simulation of backscattering properties of Taihu Lake. Adv. Water Sci. 2009, 20, 707–713. [Google Scholar]
  28. Le, C.F.; Li, Y.M.; Zha, Y.; Sun, D.; Huang, C.; Lu, H. A four-band semi-analytical model for estimating chlorophyll a in highly turbid lakes: The case of Taihu Lake, China. Remote Sens. Environ. 2009, 113, 1175–1182. [Google Scholar] [CrossRef]
  29. Qin, B.; Xu, P.; Wu, Q.; Luo, L.; Zhang, Y. Environmental issues of Lake Taihu, China. Hydrobiologia 2007, 581, 3–14. [Google Scholar] [CrossRef]
  30. Le, C.F.; Li, Y.M.; Zha, Y.; Sun, D.Y. Specific absorption coefficient and the phytoplankton package effect in Lake Taihu, China. Hydrobiologia 2009, 619, 27–37. [Google Scholar] [CrossRef]
  31. Shi, K.; Zhang, Y.; Zhou, Y.; Liu, X.; Zhu, G.; Qin, B.; Gao, G. Long-term MODIS observations of cyanobacterial dynamics in Lake Taihu: Responses to nutrient enrichment and meteorological factors. Sci. Rep. 2017. [CrossRef] [PubMed]
  32. Qin, B.; Zhu, G.; Gao, G.; Zhang, Y.; Wei, L.; Paerl, H.W.; Carmichael, W.W. A drinking water crisis in Lake Taihu, China: Linkage to climatic variability and lake management. Environ. Manag. 2010, 45, 105–112. [Google Scholar] [CrossRef] [PubMed]
  33. Zhang, Y.; Shi, K.; Liu, X.; Zhou, Y.; Qin, B. Lake topography and wind waves determining seasonal-spatial dynamics of total suspended matter in turbid Lake Taihu, China: Assessment using long-term high-resolution MERIS data. PLoS ONE 2014, 9, e98055. [Google Scholar] [CrossRef] [PubMed]
  34. Bai, X.; Xiaohong amp, G.U.; Yang, L. Analyses on water quality and its protection in east Lake Taihu. J. Lake Sci. 2006, 18, 91–96. [Google Scholar]
  35. Kauer, T.; Kutser, T.; Arst, H.; Danckaert, T.; Nõges, T. Modelling primary production in shallow well mixed lakes based on MERIS satellite data. Remote Sens. Environ. 2015, 163, 53–261. [Google Scholar] [CrossRef]
  36. Fahnenstiel, G.L.; Carrick, H.J. Primary production in lakes Huron and Michigan: In vitro and in situ comparisons. J. Plankton Res. 1988, 10, 1273–1283. [Google Scholar] [CrossRef]
  37. Gaarder, T.; Gran, H.H. Investigations of the production of plankton in the Oslo Fjord. J. Conseil—Conseil Permanent Int. l’Explor. Mer. 1927, 42, 1–48. [Google Scholar]
  38. Liu, G.; Ou, W.; Zhang, Y.; Wu, T.; Zhu, G.; Shi, K.; Qin, B. Validating and mapping surface water temperatures in Lake Taihu: Results from MODIS land surface temperature products. IEEE J. Sel. Top. Appl. Earth Obs. Remote Sens. 2015, 8, 1–15. [Google Scholar] [CrossRef]
  39. Shi, K.; Zhang, Y.; Liu, X.; Wang, M.; Qin, B. Remote sensing of diffuse attenuation coefficient of photosynthetically active radiation in Lake Taihu using MERIS data. Remote Sens. Environ. 2014, 140, 365–377. [Google Scholar] [CrossRef]
  40. Zhang, Y.; Qin, B. The basic characteristic and climatological calculation of the photosythetically available radiation in Taihu region. Acta Energiae Solaris Sinica 2002, 21, 118–123. [Google Scholar]
  41. Zhang, Y.; Sciences, C.A.O. Nanjing. Climatological calculation and characteristic analysis of global radiation over Wuxi region. Q. J. Appl. Meteorol. 2003, 14, 339–347. [Google Scholar]
  42. Shuchman, R.A.; Sayers, M.; Fahnenstiel, G.L.; Leshkevich, G. A model for determining satellite-derived primary production estimates for Lake Michigan. J. Great Lakes Res. 2013, 39, 46–54. [Google Scholar] [CrossRef]
  43. Warner, D.M.; Lesht, B.M. Relative importance of phosphorus, invasive mussels and climate for patterns in chlorophyll a and primary production in Lakes Michigan and Huron. Freshw. Biol. 2015, 60, 1029–1043. [Google Scholar] [CrossRef]
  44. Asano, T.; Li, G.M.; Hirai, Y.; Kim, D.C.; Ito, T. Eutrophication of lake taihu in China and post-response to the plague of algal bloom in 2007. E-Journal GEO 2011, 5, 138–153. [Google Scholar] [CrossRef]
  45. Hu, C.; Zhongping, L.; Ma, R.; Yu, K.; Li, D.; Shang, S. Moderate resolution imaging spectroradiometer (MODIS) observations of cyanobacteria blooms in Taihu Lake, China. Prehosp. Disaster Med. 2010, 29, 303–306. [Google Scholar] [CrossRef]
  46. Wang, M.; Shi, W.; Tang, J. Water property monitoring and assessment for China’s inland Lake Taihu from MODIS-Aqua measurements. Remote Sens. Environ. 2011, 115, 841–854. [Google Scholar] [CrossRef]
  47. Ma, W.; Chai, F.; Xiu, P.; Xue, H.; Tian, J. Modeling the long-term variability of phytoplankton functional groups and primary production in the South China Sea. J. Oceanogr. 2013, 69, 527–544. [Google Scholar] [CrossRef]
  48. Pei, G.; Hong, X. Primary production of benthic algae community in the Donghu Lake. J. South-Central Univ. Natly (Nat. Sci. Ed.) 2010, 29, 28–31. [Google Scholar]
  49. Bergamino, N.; Horion, S.; Stenuite, S.; Cornet, Y.; Loiselle, S.; Plisnier, P.D.; Descy, J.P. Spatio-temporal dynamics of phytoplankton and primary production in lake Tanganyika using a MODIS based bio-optical time series. Remote Sens. Environ. 2010, 114, 772–780. [Google Scholar] [CrossRef]
  50. Ardyna, M.; Babin, M.; Gosselin, M.; Devred, E. Parameterization of vertical chlorophyll a in the Arctic ocean: Impact of the subsurface chlorophyll maximum on regional, seasonal and annual primary production estimates. Biogeosciences 2013, 10, 4383–4404. [Google Scholar] [CrossRef]
  51. Tan, S.; Shi, G.; Tan, S.; Shi, G. Satellite-derived primary production and its spatial and temporal variability in the China seas. J. Geogr. Sci. 2006, 16, 447–457. [Google Scholar] [CrossRef]
  52. Kameda, T.; Ishizaka, J. Size-fractionated primary production estimated by a Two-phytoplankton community model applicable to ocean color remote sensing. J. Oceanogr. 2005, 61, 663–672. [Google Scholar] [CrossRef]
  53. Deng, J.; Qin, B.; Paerl, H.W.; Zhang, Y.; Ma, J.; Chen, Y. Earlier and warmer springs increase cyanobacterial (microcystis spp.) blooms in subtropical Lake Taihu, China. Freshw. Biol. 2014, 59, 1076–1085. [Google Scholar] [CrossRef]
  54. Deng, J.; Qin, B.; Paerl, H.W.; Zhang, Y.; Wu, P.; Ma, J.; Chen, Y. Effects of nutrients, temperature and their interactions on spring phytoplankton community succession in Lake Taihu, China. PLoS ONE 2014, 9, e113960. [Google Scholar] [CrossRef] [PubMed]
  55. Xu, S.; Wang, Y.; Huang, B.; Wei, Z.B.; Miao, A.J.; Yang, L.Y. Nitrogen and phosphorus limitation of phytoplankton growth in different areas of Lake Taihu, China. J. Freshw. Ecol. 2014, 30, 113–127. [Google Scholar] [CrossRef]
  56. Yuan, H.Z.; Shen, J.; Liu, E.F.; Wang, J.J.; Meng, X.H. Space distribution characteristics and diversity analysis of phosphorus from overlying water and surface sediments in Taihu Lake. J. Environ. Sci. 2010, 31, 954–960. [Google Scholar]
  57. Zhao, X. Temporal and spatial distribution of physicochemical characteristics and nutrients in sediments of Lake Taihu. J. Lake Sci. 2007, 19, 698–704. [Google Scholar]
Figure 1. Maps showing location of Lake Taihu and the sampling sites. The in situ primary production were measured at two sites, THL04 (31.44583°N, 120.18883°E) and THL08 (31.24816°N, 120.10062°E), from 2005 to 2013. The in situ nutrient concentration in 2013 including total nitrogen and total phosphorus were collected from 32 sites THL00-THL32 (except THL02).
Remotesensing 09 00195 g001
Figure 2. Relationship between measured and estimated primary production by VGPM.
Remotesensing 09 00195 g002
Figure 3. Annual variations of phytoplankton primary production in Lake Taihu from 2003 to 2013.
Remotesensing 09 00195 g003
Figure 4. Maps of the MODIS-derived mean daily phytoplankton primary production for the four seasons in Lake Taihu generated using the VGPM.
Remotesensing 09 00195 g004
Figure 5. Seasonal variation of phytoplankton primary production in each region based on VGPM estimation from 2003 to 2013 in (a) Zhanshan Bay; (b) Meiliang Bay; (c) the open area and (d) the entire lake.
Remotesensing 09 00195 g005
Figure 6. Monthly mean daily phytoplankton primary production of Lake Taihu from January to December.
Remotesensing 09 00195 g006
Figure 7. Time series of monthly phytoplankton primary production in Lake Taihu from 2003 to 2013.
Remotesensing 09 00195 g007
Figure 8. (a) Relationship between Chla and MODIS derived primary productivity of Lake Taihu from 2003–2013 (b) Monthly mean MODIS derived primary productivity and Chla of Lake Taihu from 2003–2013.
Remotesensing 09 00195 g008
Figure 9. (a) Chla distribution in Lake Taihu averaged from all Chla estimates from the MODIS data gathered from 2003–2013 and (b) spatial PP distribution in Lake Taihu based on all PP estimates from the MODIS data gathered from 2003–2013.
Remotesensing 09 00195 g009
Figure 10. Time series of total nitrogen and total phosphorusin 2013, and the correlation between phytoplankton primary production and total phosphorus.
Remotesensing 09 00195 g010
Figure 11. Correlations between water temperature and maximum carbon fixation rate and phytoplankton primary production.
Remotesensing 09 00195 g011
Figure 12. Correlations between PAR diffuse attenuation coefficient and phytoplankton primary production for the regions of (a) the entire Lake Taihu; (b) the open area; (c) Meiliang Bay and (d) Zhushan Bay.
Remotesensing 09 00195 g012
Table 1. Phytoplankton primary production variations of different seasons in different regions (mg·C·m−2·d−1).
Lake TaihuSpringSummerAutumnWinterMean
Open area815.521458.071296.31339.721019.25
Meiliang Bay1673.321931.071707.68685.551551.39
Zhushan Bay2394.082951.642356.00860.392205.47
Whole lake921.471529.651364.75378.661094.61

