A series of key VIIRS performance tests were performed at ambient, TV, or both [
12]. Because of limited space, this paper will focus on key radiometric performance metrics including the J1 radiometric calibration for the RSB and TEB, dynamic range, signal to noise ratio (SNR), noise equivalent differential temperature (NEdT), polarization sensitivity, relative spectral response (RSR), response
versus scan-angle (RVS), near field response (NFR) and stray light response (SLR). All of the calibration parameters and SNR were derived in the TV environment at three instrument temperature plateaus: cold, nominal and hot plateau. In this paper, only the performance for electronics side A at the nominal plateau (
i.e., closest to on-orbit configuration) will be reported.
3.1. RSB Radiometric Calibration
J1 VIIRS RSB were carefully calibrated in a TV environment using a National Institute of Standards and Technology (NIST) traceable light source, the 100 cm diameter spherical integrating source (SIS100). Another source, the three mirror collimator (TMC) SIS, capable of reaching high radiance values was also used to calibrate M1-M3 low gain. While the SIS100 has a radiance monitor to track the source fluctuations and drifts, the TMC does not, and therefore it is considered less accurate than the SIS100. In addition, the space view source (SVS) was used to collect the dark offset needed to generate the background corrected detector response or digital number (dn).
The detector response is related to the light source radiance L (Wm
−2·sr
−1·μm
−1) through a second degree polynomial:
where c
0, c
1, and c
2 are the calibration coefficients and U(
dn3) denotes the truncation error.
The calibration coefficients can be determined from Equation (1) through curve fitting to unsaturated measurements at different radiance levels over the band’s dynamic range [Lmin, Lmax]; however, the instability of the source over time can lead to high uncertainties for the radiometric calibration algorithm. To mitigate the impact of the source instability, the radiance measurements were performed with and without an attenuator screen inserted into the optical path between the SIS100 and VIIRS RTA entrance aperture. The attenuator screen is an opaque plate with small holes to allow a determined fraction of light through (transmittance of ~56%). The time between attenuator in and out is very short to minimize the effect of source instability on the measurements (~2 min).
Consequently, the ratio of the detected spectral radiances with and without the attenuator is equal to the attenuator transmittance (τ), as:
where dn
in and dn
out denote the
dn with and without the attenuator, respectively. A 3-sigma outlier rejection criteria is used during the calculation.
To facilitate the data regression, Equation (2) is rewritten as:
where
, and
.
The model parameters τ,
, and
are determined through a non-linear least-square process. It is worth noting that the RSB on-orbit calibration is performed through the linear coefficient (c
1) updates, and this coefficient or gain is determined pre-launch by inverting Equation (1) and averaging over the selected source levels:
The RSB radiometric calibration coefficients are derived in TV at the cold, nominal, and hot temperature plateaus for each detector, HAM side, gain stage, and electronic side, and are then implemented into the SDR LUTs to support on-orbit calibration [
13].
In general, the band averaged c0/c1 coefficient is very small and is on the order of 10−1 (c0 varies within ±0.4). Exceptions include M1–M3 low gain and SWIR bands M8–M11, where c0/c1 has values up to 3. The high values could be explained by the TMC inaccuracies noted previously, and the SWIR non-linearity issue described in a sub-section below. The c0/c1’s variation over the three TV temperature plateaus and across detectors as well as its uncertainty is small, and is in general on the order of 10−1, except M1–M3 low gain which has uncertainty values up to 7, probably due to the TMC fluctuations. The quadratic term c2/c1 has mean values on the order of 10−6 for all RSB bands, and its uncertainty is also on the order of 10−6. The average gain, c1, shows some sensitivity to instrument temperature, varying by up to 5% between TV plateaus, while its uncertainty is very small, on the order of 10−4.
3.1.1. SNR Calculation and Performance
SNR was computed for each detector using the SIS100 radiance at various levels to cover the dynamic range of each RSB. This SNR is derived for each sample position (
i.e., angular position in scan) by dividing the cross-scan average by their standard deviation as:
where M, N are the total number of samples and scans respectively, and
i,
j are the scan and sample number respectively. The SNR processing approach is based on the cross-scan standard deviation (σ
j), which avoids the spatial non-uniformity when viewing the SIS aperture across samples.
The SNR estimates derived at each SIS level were fit using a mathematical formula described by Equation (6) in order to compute the SNR at any radiance level, and to smooth out the variability in the SNR over radiance levels:
The band averaged SNR values are shown in
Table 3. All J1 RSB meet the SNR specification at L
typ with good margins, and overall, these margins are better than those measured for SNPP. It is also worth noting that having a contamination-free RTA mirror coating, J1 SNR performance is expected to be even better than SNPP at the end of mission life. The smallest and largest SNR margins for J1 are 51% and 3172% for M2 high gain and I3, respectively. It is also worth mentioning that the I3 detector 4 is a very noisy detector (SNR = 6.7), and its responsivity is about 50% lower than the other detectors in this band. This detector is being studied to mitigate striping features in I3 images and associated products.
Table 3.
J1 VIIRS SNR (at Ltyp) and Lsat values for RSB, and comparison to sensor specification and SNPP. The ratio between measured performance and specification (Spec) is also shown. For dual gain bands, the Lsat of high gain stage represents the radiance transition (Ltrans) to low gain.
Table 3.
J1 VIIRS SNR (at Ltyp) and Lsat values for RSB, and comparison to sensor specification and SNPP. The ratio between measured performance and specification (Spec) is also shown. For dual gain bands, the Lsat of high gain stage represents the radiance transition (Ltrans) to low gain.
| Band | Gain Stage | SNR (Spec) | Lmax (Spec) | SNPP SNR | J1 SNR | SNPP SNR/Spec | J1 SNR/Spec | SNPP Lsat | J1 Lsat | SNPP Lsat/Spec | J1 Lsat/Spec |
|---|
| M1 | High | 352 | 135 | 613 | 636 | 1.74 | 1.81 | 172 | 154 | 1.27 | 1.14 |
| M1 | Low | 316 | 615 | 1042 | 1066 | 3.30 | 3.37 | 696 | 705 | 1.13 | 1.15 |
| M2 | High | 380 | 127 | 554 | 573 | 1.46 | 1.51 | 138 | 137 | 1.09 | 1.08 |
| M2 | Low | 409 | 687 | 963 | 986 | 2.35 | 2.41 | 827 | 880 | 1.20 | 1.28 |
| M3 | High | 416 | 107 | 683 | 706 | 1.64 | 1.70 | 125 | 113 | 1.17 | 1.06 |
| M3 | Low | 414 | 702 | 1008 | 1063 | 2.44 | 2.57 | 843 | 838 | 1.20 | 1.19 |
| M4 | High | 362 | 78 | 526 | 559 | 1.45 | 1.54 | 88 | 87 | 1.13 | 1.12 |
| M4 | Low | 315 | 667 | 864 | 844 | 2.74 | 2.68 | 872 | 851 | 1.31 | 1.28 |
| M5 | High | 242 | 59 | 373 | 380 | 1.54 | 1.57 | 66 | 61 | 1.12 | 1.04 |
| M5 | Low | 360 | 651 | 776 | 751 | 2.16 | 2.09 | 726 | 725 | 1.12 | 1.11 |
| M6 | High | 199 | 41 | 409 | 428 | 2.06 | 2.15 | 48 | 48 | 1.16 | 1.16 |
| M7 | High | 215 | 29 | 524 | 549 | 2.44 | 2.55 | 31 | 31 | 1.07 | 1.06 |
| M7 | Low | 340 | 349 | 721 | 760 | 2.12 | 2.23 | 414 | 409 | 1.19 | 1.17 |
| M8 | High | 74 | 164.9 | 358 | 335 | 4.84 | 4.53 | 126 | 118 | 0.77 | 0.72 |
| M9 | High | 83 | 77.1 | 290 | 325 | 3.49 | 3.91 | 84 | 80 | 1.09 | 1.04 |
| M10 | High | 342 | 71.2 | 691 | 765 | 2.02 | 2.24 | 81 | 77 | 1.14 | 1.09 |
| M11 | High | 10 | 31.8 | 105 | 216 | 10.49 | 21.57 | 35 | 35 | 1.09 | 1.10 |
| I1 | High | 119 | 718 | 261 | 227 | 2.19 | 1.91 | 771 | 777 | 1.07 | 1.08 |
| I2 | High | 150 | 349 | 273 | 287 | 1.82 | 1.91 | 413 | 410 | 1.18 | 1.17 |
| I3 | High | 6 | 72.5 | 176 | 190 | 29.36 | 31.72 | 70 | 66 | 0.97 | 0.91 |
3.1.2. Dynamic Range
J1 RSB dynamic range was also verified, and RSB saturation was found to be comparable to SNPP pre-launch performance, meeting the specification with acceptable margins, except for bands M8 (72%) and I3 (91%). These two L
max non-compliances were expected (similar to SNPP) and have a limited effect on environmental and science products based on SNPP experience. As a note, SNPP M8 and I3 saturation became compliant post-launch because of the RTA mirror degradation on-orbit (decreasing radiometric sensitivity), but J1 will not have that benefit since the mirror coating issue causing this radiometric degradation was corrected in the J1 flight hardware. For dual gain bands, the high gain L
sat shown in
Table 3 represents the radiance transition (L
trans) from high gain to low gain. The requirement for L
trans is to be within +50% above L
max. As shown in
Table 3, all dual gain bands are compliant with this requirement, with M1 having the highest transition, 14% higher than specified high gain L
max.
3.1.3. RSB Calibration Uncertainties
VIIRS RSB requirements on the absolute radiometric calibration are against the spectral reflectance accuracy of 2% when viewing a uniform scene of typical radiance. This uncertainty verification was performed using contributors which have been constrained by sensor-level requirements while others are based on the sensor contractor allocations [
14]. A key contributor to the radiometric uncertainty includes the detector response characterization uncertainty, which states that the response of a detector to a range of radiance levels from L
min to L
max must be fit with a second degree polynomial to within 0.3%. This characterization uncertainty requirement was very challenging for many VIIRS RSB to meet, but the spectral reflectance accuracy (2%) was met for all RSB except M11 (2.25%) [
14], primarily due to the uncertainty of the SD bi-directional reflectance factor (BRF) at SWIR wavelengths.
3.1.4. SWIR Linearity Issue
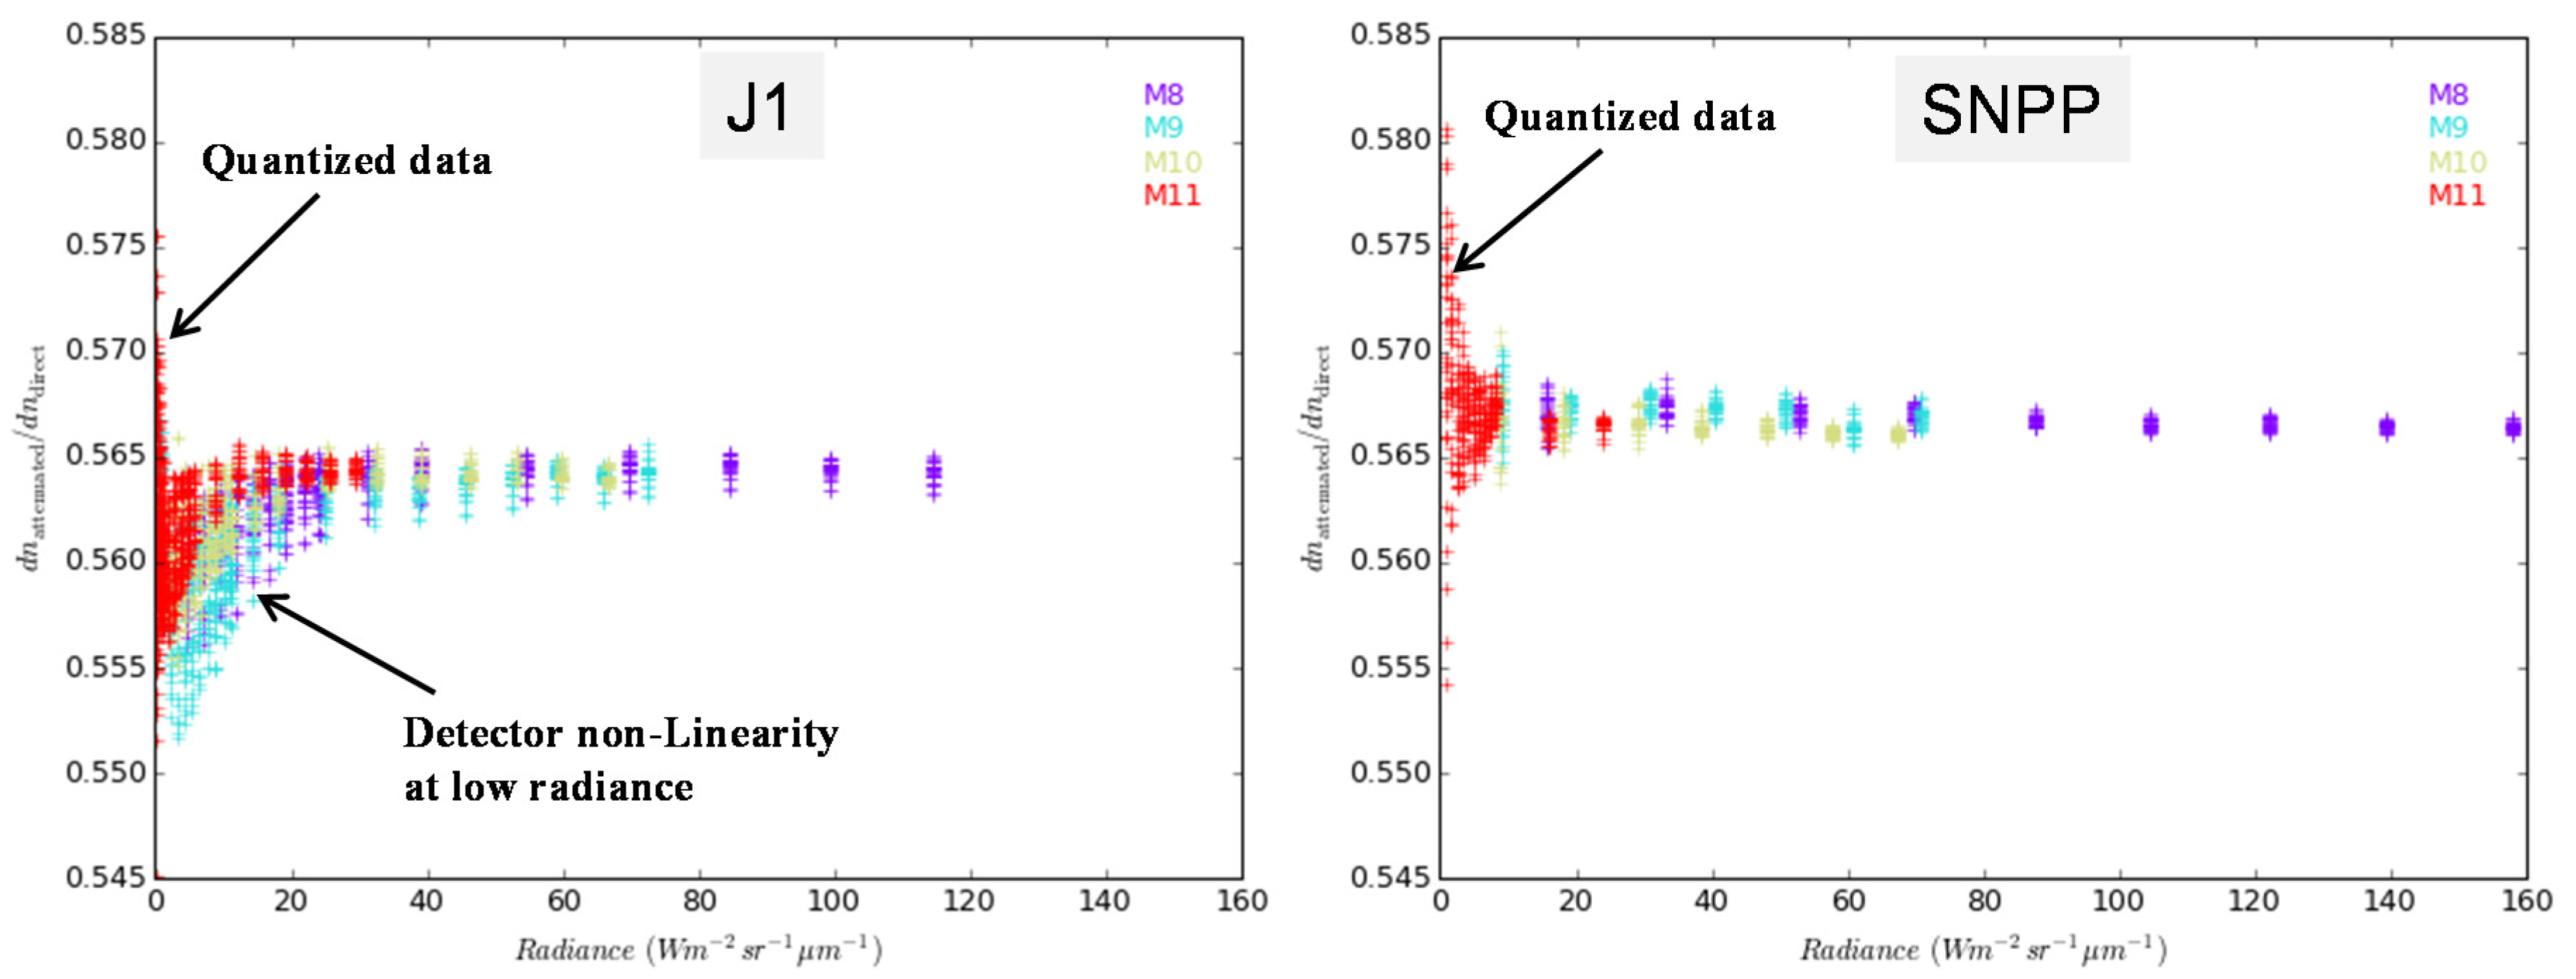
J1 SWIR M-bands exhibited more non-linear behavior at low radiance than what was observed on SNPP.
Figure 2 shows the ratios of attenuator out signal to attenuator in signal for SWIR bands M8–M11. The non-constant dn ratio reflects the large non-linear response at low radiance levels, while SNPP dn ratios were much flatter. An investigation of this issue discovered that an analog signal processor bias voltage for the SMWIR focal plane was set to a different voltage value (−0.2 V) compared to its setting on SNPP (−0.4 V). The non-linearity present in the SWIR M-bands produces large errors in the attenuator ratios, and therefore large errors in the radiance characterization uncertainty and uniformity. Quantized data are also observed at low radiance values and are harder to address in the calibration algorithm. A mitigation plan is being prepared to enhance the calibration performance of the SWIR bands, based on either a third degree polynomial equation or the adoption of a two-piece calibration (
i.e., calibration over two radiance ranges).
Figure 2.
Comparison of J1 and SNPP SWIR (M8–M11) non-linearity as shown by the ratio of sensor response value (dn) for attenuator in and out measurements.
Figure 2.
Comparison of J1 and SNPP SWIR (M8–M11) non-linearity as shown by the ratio of sensor response value (dn) for attenuator in and out measurements.
3.1.5. DNB Performance and Linearity Issue
While J1 DNB performance was measured using similar testing as the M-bands and I-bands, additional testing was performed to enhance the DNB characterization (at low light). Data analysis during first baseline testing at cold plateau showed a larger than expected non-linear response for DNB high gain A and B (HGA, HGB). The mid-gain and low gain stages also showed non-linearity features, but to a much lower extent. Upon further analysis, linear fit residuals plotted on a detector basis showed increasing residuals for high gain stages from aggregation modes 21 up to 32. There are 32 aggregation modes that are used by the DNB charge-coupled device (CCD) when scanning from beginning to end of scan. Since the CCD is a matrix of detectors in the scan and track directions, the aggregation consist of averaging a certain number of pixels (averaging is performed in the electronics) in the scan and track directions to keep the spatial resolution almost constant throughout the scan. The root cause of this DNB non-linearity issue was associated to two incorrect biases set in the focal plane interface electronics coupling into the feedthrough effect, and resulting in charge bleeding from one detector to the next (crosstalk) on the signal output line between successive acquisition frames.
Figure 3 shows the DNB response (dn) for HGB (HGA shows similar features) at four aggregation modes (1, 21, 26 and 32), where the non-linearity is clearly increasing from aggregation mode 21 up to aggregation 32. This non-linearity also increases as the radiance decreases. This issue was intensively investigated, and a solution referenced as Option 21 was identified to significantly reduce the non-linearity effect, which consists of fixing the aggregation mode from zone 21 outward, meaning that all aggregation zones from 21 to 32 will be assigned aggregation mode 21. It is also important to note that reducing the non-linearity effect led to better radiometric uncertainty, uniformity (striping) between detectors and between aggregation zones, and SNR performance. The only caveat for this solution is the loss of ability to maintain constant spatial resolution at large scan angles, but this is considered as low risk compared to the non-linearity effect.
Figure 3.
J1 DNB HGB response (dn) as a function of radiance in aggregation zones 1, 21, 26 and 32. Non-linearity feature starts to increase noticeably between aggregation modes 21 and 32 at low radiance. The 16 DNB detectors are represented by different symbols.
Figure 3.
J1 DNB HGB response (dn) as a function of radiance in aggregation zones 1, 21, 26 and 32. Non-linearity feature starts to increase noticeably between aggregation modes 21 and 32 at low radiance. The 16 DNB detectors are represented by different symbols.
Based on Option 21 configuration used to correct for non-linearity, the DNB SNR showed compliance with specification at Lmin for all aggregation zones, and the DNB dynamic range is compliant with Lmax specification, 200 Wm−2·sr−1, except for aggregation zone 1 (~97% of Lmax). This is considered as low risk for the DNB since more than 99.9% of the Earth targets seen by SNPP DNB (based on data from 14 orbits) have radiance values less than 150 Wm−2·sr−1.
Further concerns associated with on-orbit calibration, and how the non-linearity could impact the radiance quality are being investigated. Additional DNB testing is planned at spacecraft TV level (April 2016) to derive at-launch offset tables based on the new optimized sample-to-zone mapping, and to enhance DNB on-orbit calibration performance.
3.2. Thermal Emissive Bands (TEB) Calibration
J1 VIIRS thermal band calibration is referenced to a NIST traceable external blackbody calibration source (BCS). The radiance reaching the detector is the sum of the source radiance as well as contributors along the optical path (
i.e., the RTA, HAM, and aft optics). The reflectance factors represent the total reflectance of the RTA mirrors, HAM and aft-optics. The RVS is the scan angle dependent relative reflectance of the HAM. The temperature of each source is determined from one or more thermistors, and the radiances of the sources are determined via Planck’s law convolved over the RSR of each spectral band over the extended band-pass [
15].
The path difference radiance between the two sources (BCS and SV) is then:
The path difference radiance is modeled as a quadratic polynomial in the offset corrected digital response, or
The retrieved EV radiance for the BCS is determined by inverting Equation (7), or
The low gain state of band M13 is calibrated using a second high temperature external blackbody, the TMC blackbody. The calibration of the TMC blackbody was tied to the BCS by cross calibration at scene temperatures where both sources overlap.
NEdT Calculation
The NEdT is the fluctuation in the scene temperature equivalent to the system noise and is computed via the equation
The derivative is of Planck’s law with respect to the source temperature. The NEdT was determined at all source levels and compared to the specified value at T
typ; this was determined by fitting the SNR as a function of path difference radiance. As shown in
Table 4, all TEB band average and per detectors NEdT meet the specification with good margins, and the performance is comparable to SNPP. A mild dependence of NEdT to sensor temperature (TV plateaus) was observed. The smallest and greatest NEdT margins were observed for M14 (39%) and I4 (595%) respectively. Detector noise variability is small in general, with the exception of detector 4 in M15 and detector 5 in M16B which are out-of-family detectors, and could lead to striping in some data products.
Table 4 also shows the J1 maximum temperature and comparison to the specification and SNPP. All bands have saturation values above the specified T
max, and comparable to SNPP. For J1, digital saturation occurred first for all bands, while for SNPP two bands, M12 and M14, exhibit analog saturation before digital saturation. The TEB saturation values are consistent among electronics sides and temperature plateaus to within 3 K. M13 low gain saturation was not observed in TV testing, but saturation is expected to be around 670 K based on ambient testing, while SNPP VIIRS has shown saturation around 654 K.
Table 4.
J1 VIIRS Tmax and NEdT performance for TEB derived in TV at nominal plateau, and comparison to Spec and SNPP.
Table 4.
J1 VIIRS Tmax and NEdT performance for TEB derived in TV at nominal plateau, and comparison to Spec and SNPP.
| Band | Tmax | NEdT at Ttyp |
|---|
| Spec | SNPP | J1 | Spec | SNPP | J1 |
|---|
| I4 | 353 | 357 | 357 | 2.5 | 0.41 | 0.42 |
| I5 | 340 | 373 | 370 | 1.5 | 0.42 | 0.41 |
| M12 | 353 | 357 | 358 | 0.396 | 0.13 | 0.12 |
| M13 HG | 343 | 364 | 363 | 0.107 | 0.044 | 0.043 |
| M13 LG | 634 | - | - | 0.423 | 0.340 | 0.304 |
| M14 | 336 | 347 | 348 | 0.091 | 0.061 | 0.050 |
| M15 | 343 | 365 | 359 | 0.070 | 0.030 | 0.026 |
| M16 | 340 | 368 | 369 | 0.072 | 0.038 | 0.043 |
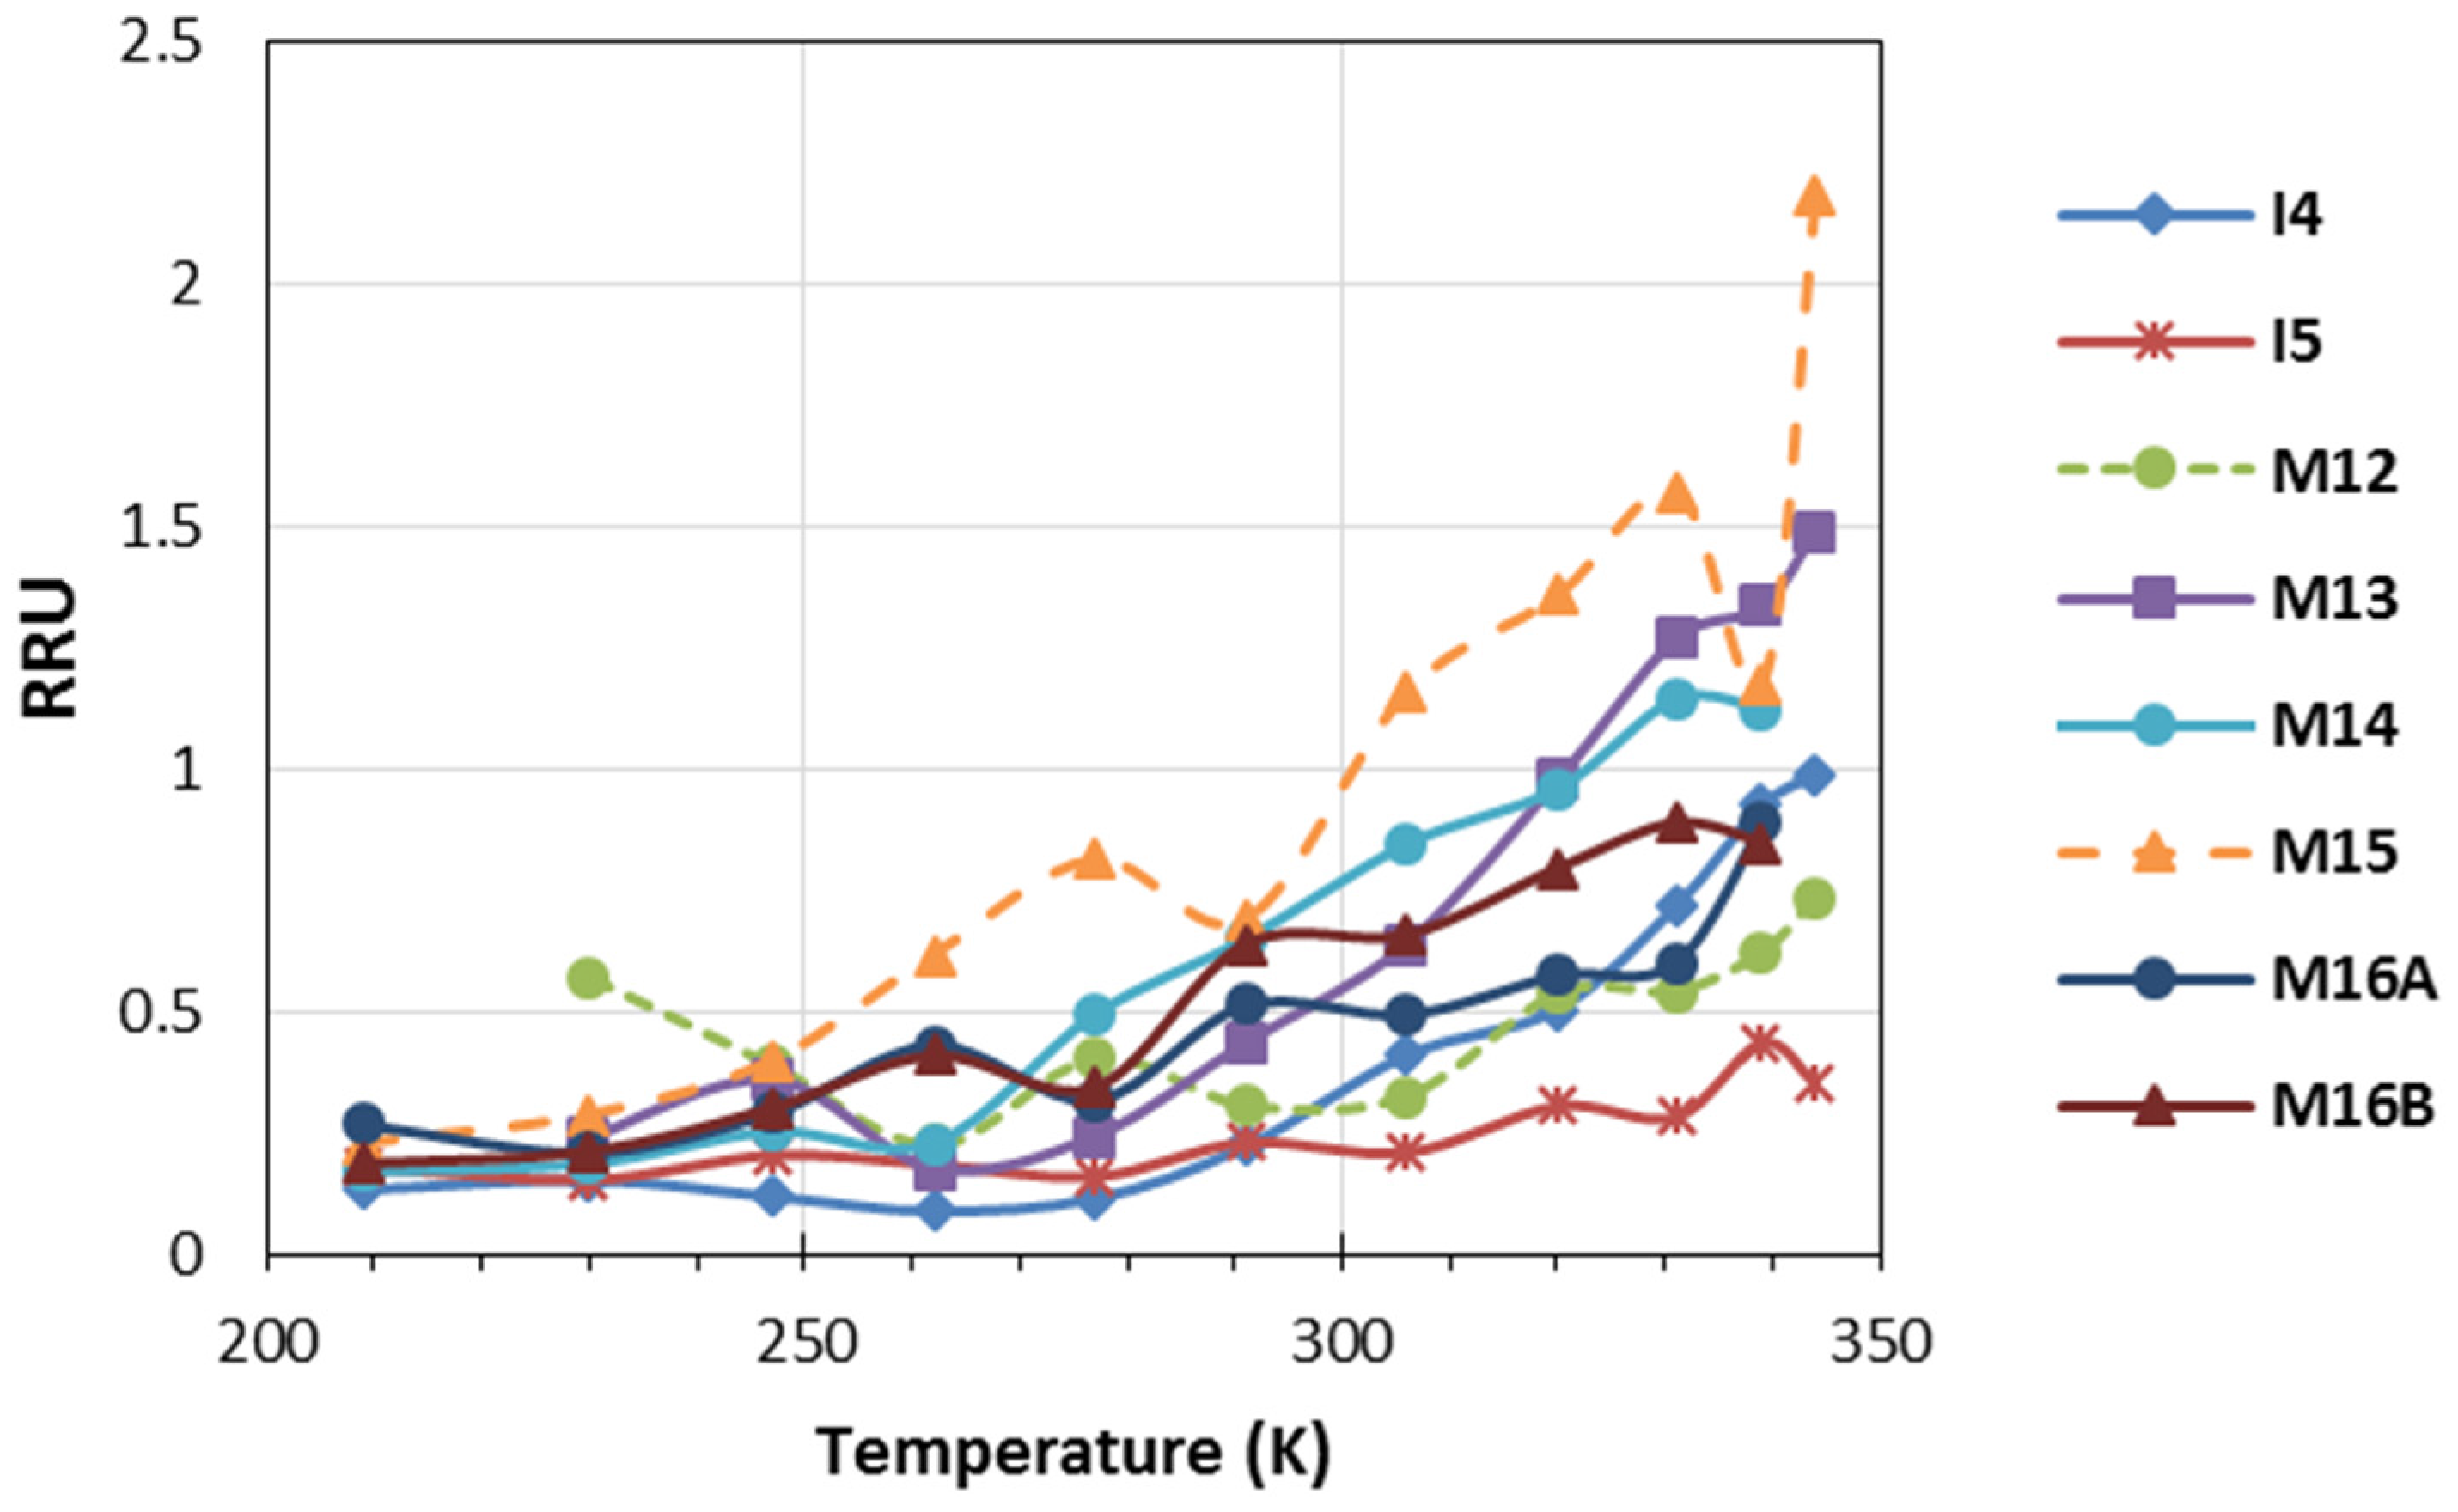
The radiometric response uniformity (RRU) represents the detector-to-detector uniformity (or striping) and is quantified by the following equation:
where the average EV retrieved radiance is over all detectors in a band and NEdL is derived from Equation (10). The sensor specification is met if the RRU is less than unity within the radiance range from L
min to 0.9 L
max.
Figure 4.
J1 maximum RRU as a function of source (BCS) temperature is shown for all TEB, HAM 0, and nominal plateau (RRU is compliant if less than unity).
Figure 4.
J1 maximum RRU as a function of source (BCS) temperature is shown for all TEB, HAM 0, and nominal plateau (RRU is compliant if less than unity).
Figure 4 shows the detector-to-detector striping performance represented by the RRU metric as a function of scene temperature for all emissive bands. We can easily see that the risk of striping increases with temperature for all TEB bands, because the deviation of the detector retrieved radiance from the band average increases with temperature while the NEdL levels off. Results derived per HAM side, electronics side and temperature plateau have shown some performance variations, with RRU for some bands reaching up to 2 at highest temperatures (larger than 310 K). We should also emphasize the difficulty to meet this requirement for both SNPP and J1 since VIIRS TEB has a very good noise performance (very low NEdL).
The absolute radiance difference (ARD) is the percent difference between the retrieved and calculated BCS radiances, and it is essentially a measure of the fit uncertainty’s effect on the accuracy of the retrieved radiance, or
The band averaged ARD for J1 TEB derived at nominal plateau are shown in
Table 5 alongside the specified values in parenthesis. As expected, the ARD results show excellent thermal calibration for all bands at the specified temperatures, and the only exception is M12 at very low temperature (230 K) where the ARD value of 7.6 is slightly higher than the specified value of 7.0. The temperature errors converted from the ARD values are also shown in
Table 5 at each specified temperature. The corresponding temperature uncertainty was computed by taking the difference in temperature derived from the radiance with and without the radiance uncertainty. Overall, the ARD performance (and temperature errors) is comparable between J1 and SNPP.
Table 5.
J1 Band averaged ARD (%) at specified temperature shown for all TEB, HAM 0, and nominal plateau. ARD specification values are in parenthesis. In addition, shown in the lower part of this table are the corresponding temperature errors (K).
Table 5.
J1 Band averaged ARD (%) at specified temperature shown for all TEB, HAM 0, and nominal plateau. ARD specification values are in parenthesis. In addition, shown in the lower part of this table are the corresponding temperature errors (K).
| ARD Performance (%) |
|---|
| Temp (K) | I4 | I5 | M12 | M13 | M14 | M15 | M16A | M16B |
|---|
| 190 | ~ | ~ | ~ | ~ | 0.68 (12.30) | 0.29 (2.10) | 0.17 (1.60) | 0.25 (1.60) |
| 230 | ~ | ~ | 7.60 (7.00) | 2.95 (5.7) | 0.11 (2.40) | 0.07 (0.60) | 0.08 (0.60) | 0.04 (0.60) |
| 267 | 0.48 (5.00) | 0.10 (2.50) | ~ | ~ | ~ | ~ | ~ | ~ |
| 270 | ~ | ~ | 0.24 (0.70) | 0.15 (0.70) | 0.08 (0.60) | 0.05 (0.40) | 0.04 (0.40) | 0.04 (0.40) |
| 310 | ~ | ~ | 0.25 (0.70) | 0.17 (0.70) | 0.11 (0.40) | 0.06 (0.40) | 0.03 (0.40) | 0.04 (0.40) |
| 340 | ~ | ~ | 0.27 (0.70) | 0.18 (0.70) | 0.09 (0.50) | 0.05 (0.40) | 0.03 (0.40) | 0.03 (0.40) |
| Temperature Error (K) |
| Temp (K) | I4 | I5 | M12 | M13 | M14 | M15 | M16A | M16B |
| 190 | ~ | ~ | ~ | ~ | 0.2 | 0.08 | 0.07 | 0.1 |
| 230 | ~ | ~ | 1.01 | 0.71 | 0.04 | 0.02 | 0.03 | 0.02 |
| 267 | 0.13 | 0.05 | ~ | ~ | ~ | ~ | ~ | ~ |
| 270 | ~ | ~ | 0.05 | 0.04 | 0.04 | 0.03 | 0.04 | 0.03 |
| 310 | ~ | ~ | 0.06 | 0.05 | 0.07 | 0.04 | 0.03 | 0.04 |
| 340 | ~ | ~ | 0.08 | 0.08 | 0.08 | 0.04 | 0.04 | 0.04 |
3.3. Polarization Sensitivity
During ambient phase testing, J1 polarization sensitivity was characterized using an integrating sphere combined with a sheet polarizer at seven different scan angles in the 400 to 900 nm range covering all VisNIR bands [
16,
17]. The sheet polarizer was mounted on a rotary stage and was rotated in 15 degree increments from 0 to 360 degrees. Additionally, a long wavelength spectral blocking filter was placed in the optical path when measuring the short wavelength bands, M1 to M3, to eliminate near infrared OOB contributions. The polarization sensitivity was derived for all VisNIR bands, detectors, HAM sides, and seven scan angles (−55, −45, −20, −8, 22, 45, 55), using Fourier series. The quality of J1 measurements based on the Fourier transform is good, since only the zeroth and second order terms have shown non-negligible results. The polarization sensitivity factors derived based on ambient testing have revealed unexpectedly large non-compliance for four bands, M1–M4. This polarization issue was linked to the redesigned VisNIR spectral filters, and confirmed by the sensor polarization model [
16,
17]. Based on these findings further performance testing was conducted in the post-TV phase adding four more scan-angles (−37, −30, −15, 4) and limited testing with monochromatic laser source for two bands, M1 and M4, to verify the quality of the sensor polarization modeling [
16,
17]. The monochromatic polarization testing confirmed the large diattenuation on both edges of the filters bandpass causing the large polarization sensitivity seen in the broadband testing.
The final J1 mean degree of linear polarization (DoLP) values are shown for all VisNIR bands in
Table 6 for HAM side 1. The polarization maximum and specification values per band are also shown. The linear polarization sensitivity for bands M1 to M4 was higher than the specified limit, with maximums (both HAM sides) as high as ~6.42% for M1, ~4.36% for M2, ~3.08% for M3, and ~4.35% for M4. Differences in linear polarization sensitivity with HAM side are as high as ~1%, where HAM 1 is generally larger.
Table 6.
DoLP (HAM 1) for both SNPP and J1 sensors. The maximum polarization is for both HAM sides. Numbers in bold represent performance non-compliance.
Table 6.
DoLP (HAM 1) for both SNPP and J1 sensors. The maximum polarization is for both HAM sides. Numbers in bold represent performance non-compliance.
| Band | Sensor | Scan Angle | Max Pol. | Spec |
|---|
| −55 | −45 | −37 | −30 | −20 | −15 | −8 | 4 | 22 | 45 | 55 |
|---|
| I1 | SNPP | 0.86 | 0.76 | ~ | ~ | 0.62 | ~ | 0.59 | ~ | 0.54 | 0.58 | 0.61 | 1.24 | 2.5 |
| J1 | 0.86 | 0.9 | 0.95 | 0.95 | 0.94 | 0.98 | 0.95 | 0.98 | 1 | 1.03 | 1.04 | 1.03 | 2.5 |
| I2 | SNPP | 0.49 | 0.45 | ~ | ~ | 0.47 | ~ | 0.51 | ~ | 0.56 | 0.56 | 0.55 | 0.56 | 3 |
| J1 | 1.19 | 0.92 | 0.75 | 0.62 | 0.5 | 0.51 | 0.48 | 0.5 | 0.53 | 0.58 | 0.61 | 0.92 | 3 |
| M1 | SNPP | 3.14 | 2.73 | ~ | ~ | 2.01 | ~ | 1.83 | ~ | 1.45 | 1.23 | 1.39 | 2.73 | 3 |
| J1 | 5.57 | 5.73 | 5.86 | 6.06 | 6.17 | 6.19 | 6.34 | 6.41 | 6.42 | 6.17 | 5.96 | 6.42 | 3 |
| M2 | SNPP | 2.25 | 2.05 | ~ | ~ | 1.65 | ~ | 1.54 | ~ | 1.28 | 1.17 | 1.3 | 2.05 | 2.5 |
| J1 | 4.08 | 4.08 | 4.13 | 4.23 | 4.18 | 4.18 | 4.23 | 4.25 | 4.19 | 4.36 | 4.46 | 4.36 | 2.5 |
| M3 | SNPP | 1.45 | 1.31 | ~ | ~ | 0.96 | ~ | 0.85 | ~ | 0.62 | 0.71 | 0.81 | 1.31 | 2.5 |
| J1 | 2.92 | 2.86 | 2.83 | 2.85 | 2.76 | 2.74 | 2.75 | 2.74 | 2.85 | 3.08 | 3.11 | 3.08 | 2.5 |
| M4 | SNPP | 1.59 | 1.52 | ~ | ~ | 1.37 | ~ | 1.3 | ~ | 1.02 | 0.86 | 0.82 | 1.52 | 2.5 |
| J1 | 4.03 | 4.2 | 4.33 | 4.35 | 4.32 | 4.35 | 4.3 | 4.29 | 4.15 | 3.99 | 3.91 | 4.35 | 2.5 |
| M5 | SNPP | 0.81 | 0.74 | ~ | ~ | 0.7 | ~ | 0.69 | ~ | 0.61 | 0.59 | 0.57 | 1.02 | 2.5 |
| J1 | 2.1 | 2.17 | 2.23 | 2.19 | 2.13 | 2.14 | 2.07 | 2.03 | 2.02 | 1.99 | 1.97 | 2.23 | 2.5 |
| M6 | SNPP | 1.29 | 1.14 | ~ | ~ | 0.96 | ~ | 0.92 | ~ | 0.81 | 0.75 | 0.7 | 1.14 | 2.5 |
| J1 | 1.03 | 0.92 | 0.89 | 0.87 | 0.86 | 0.91 | 0.91 | 0.95 | 0.96 | 0.95 | 0.94 | 1.32 | 2.5 |
| M7 | SNPP | 0.52 | 0.47 | ~ | ~ | 0.43 | ~ | 0.44 | ~ | 0.48 | 0.47 | 0.45 | 0.48 | 3 |
| J1 | 1.18 | 0.92 | 0.74 | 0.61 | 0.48 | 0.47 | 0.43 | 0.46 | 0.47 | 0.52 | 0.56 | 0.92 | 3 |
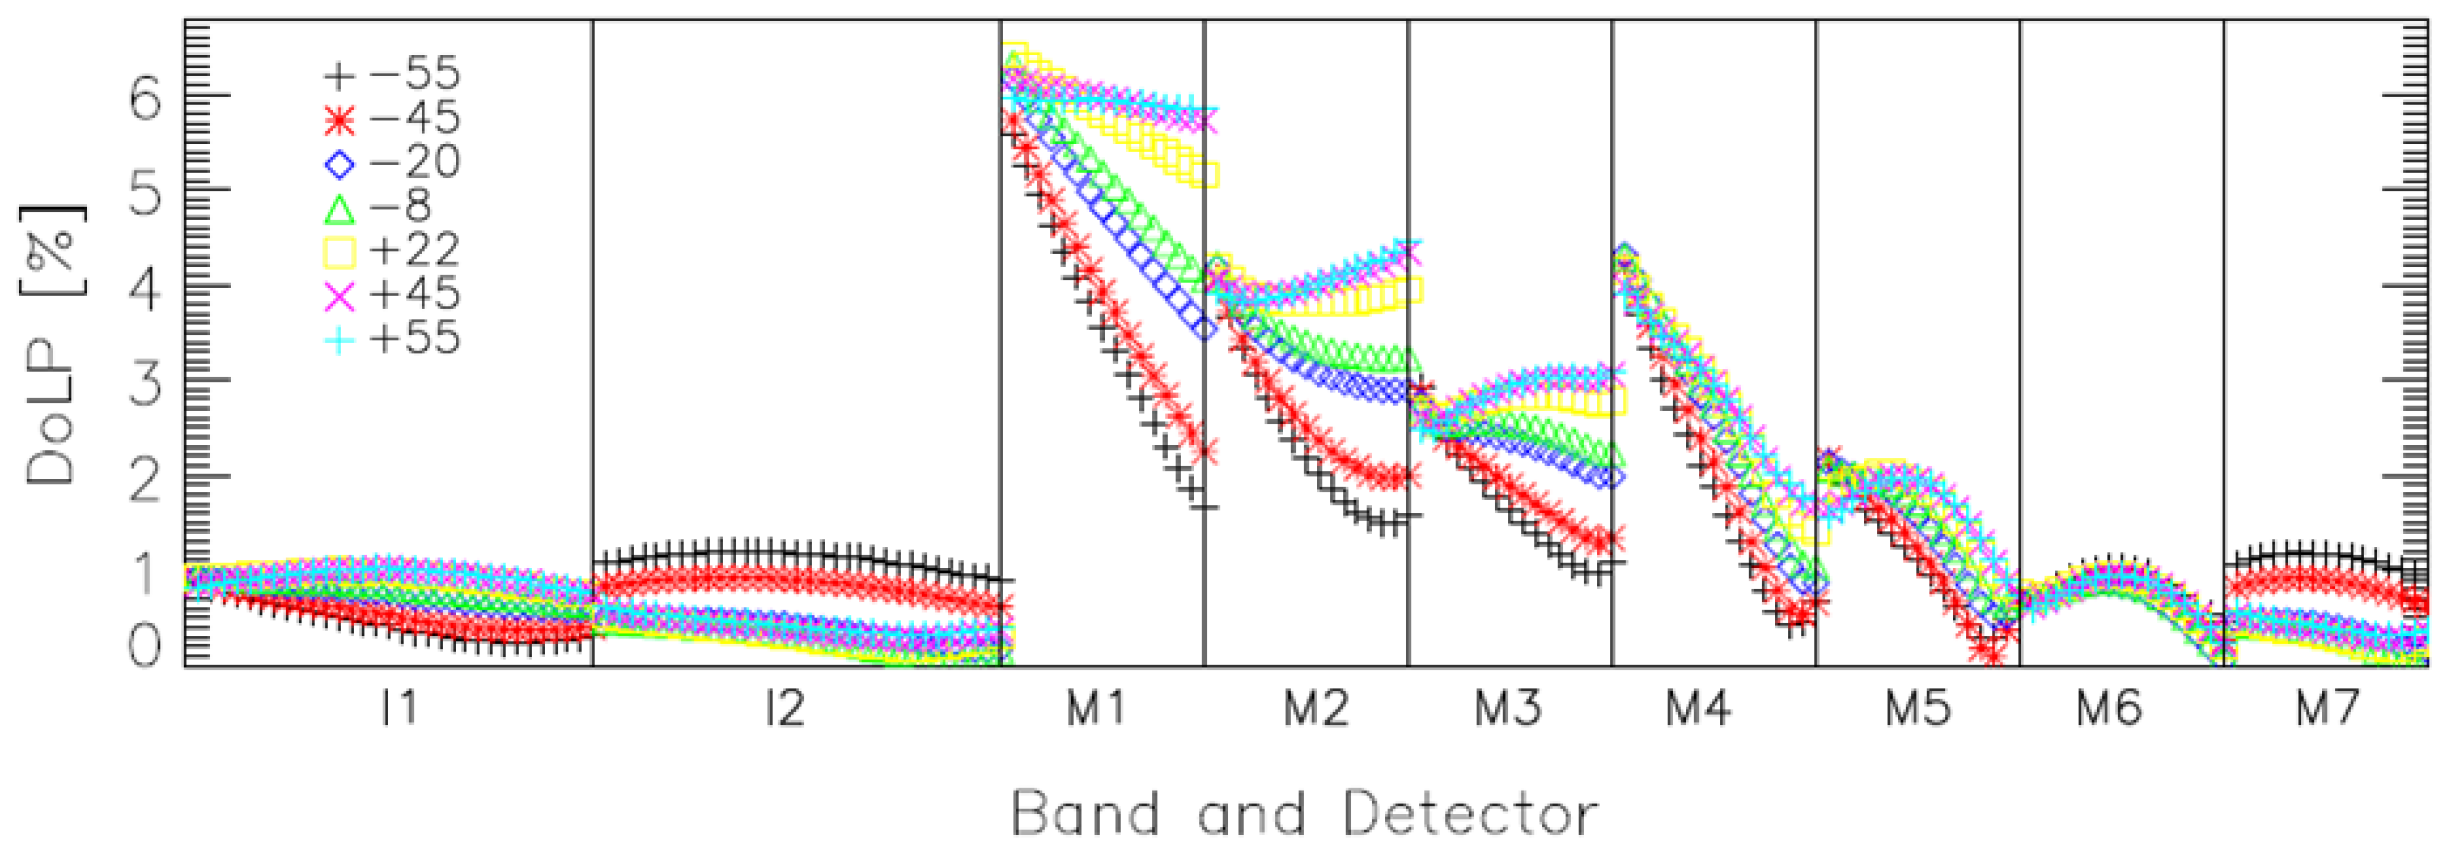
Large detector-to-detector and scan angle variations were observed within various bands (
Figure 5), and these variations could reach up to ~4% (M1). This is likely the result of angle of incidence changes on the VisNIR spectral filter assembly. The final uncertainty analysis has demonstrated compliance with uncertainty specification (0.5%), with an overall polarization factor uncertainty less than 0.22% for all bands except M1 which showed an uncertainty of about 0.37%. While the DNB has no requirement for polarization sensitivity, data analysis has shown this polarization performance to vary between 1.36% and 1.6% over the scan-angle range, detectors and HAM sides.
Figure 5.
The DoLP (HAM 1) per detector and across scan angles.
Figure 5.
The DoLP (HAM 1) per detector and across scan angles.
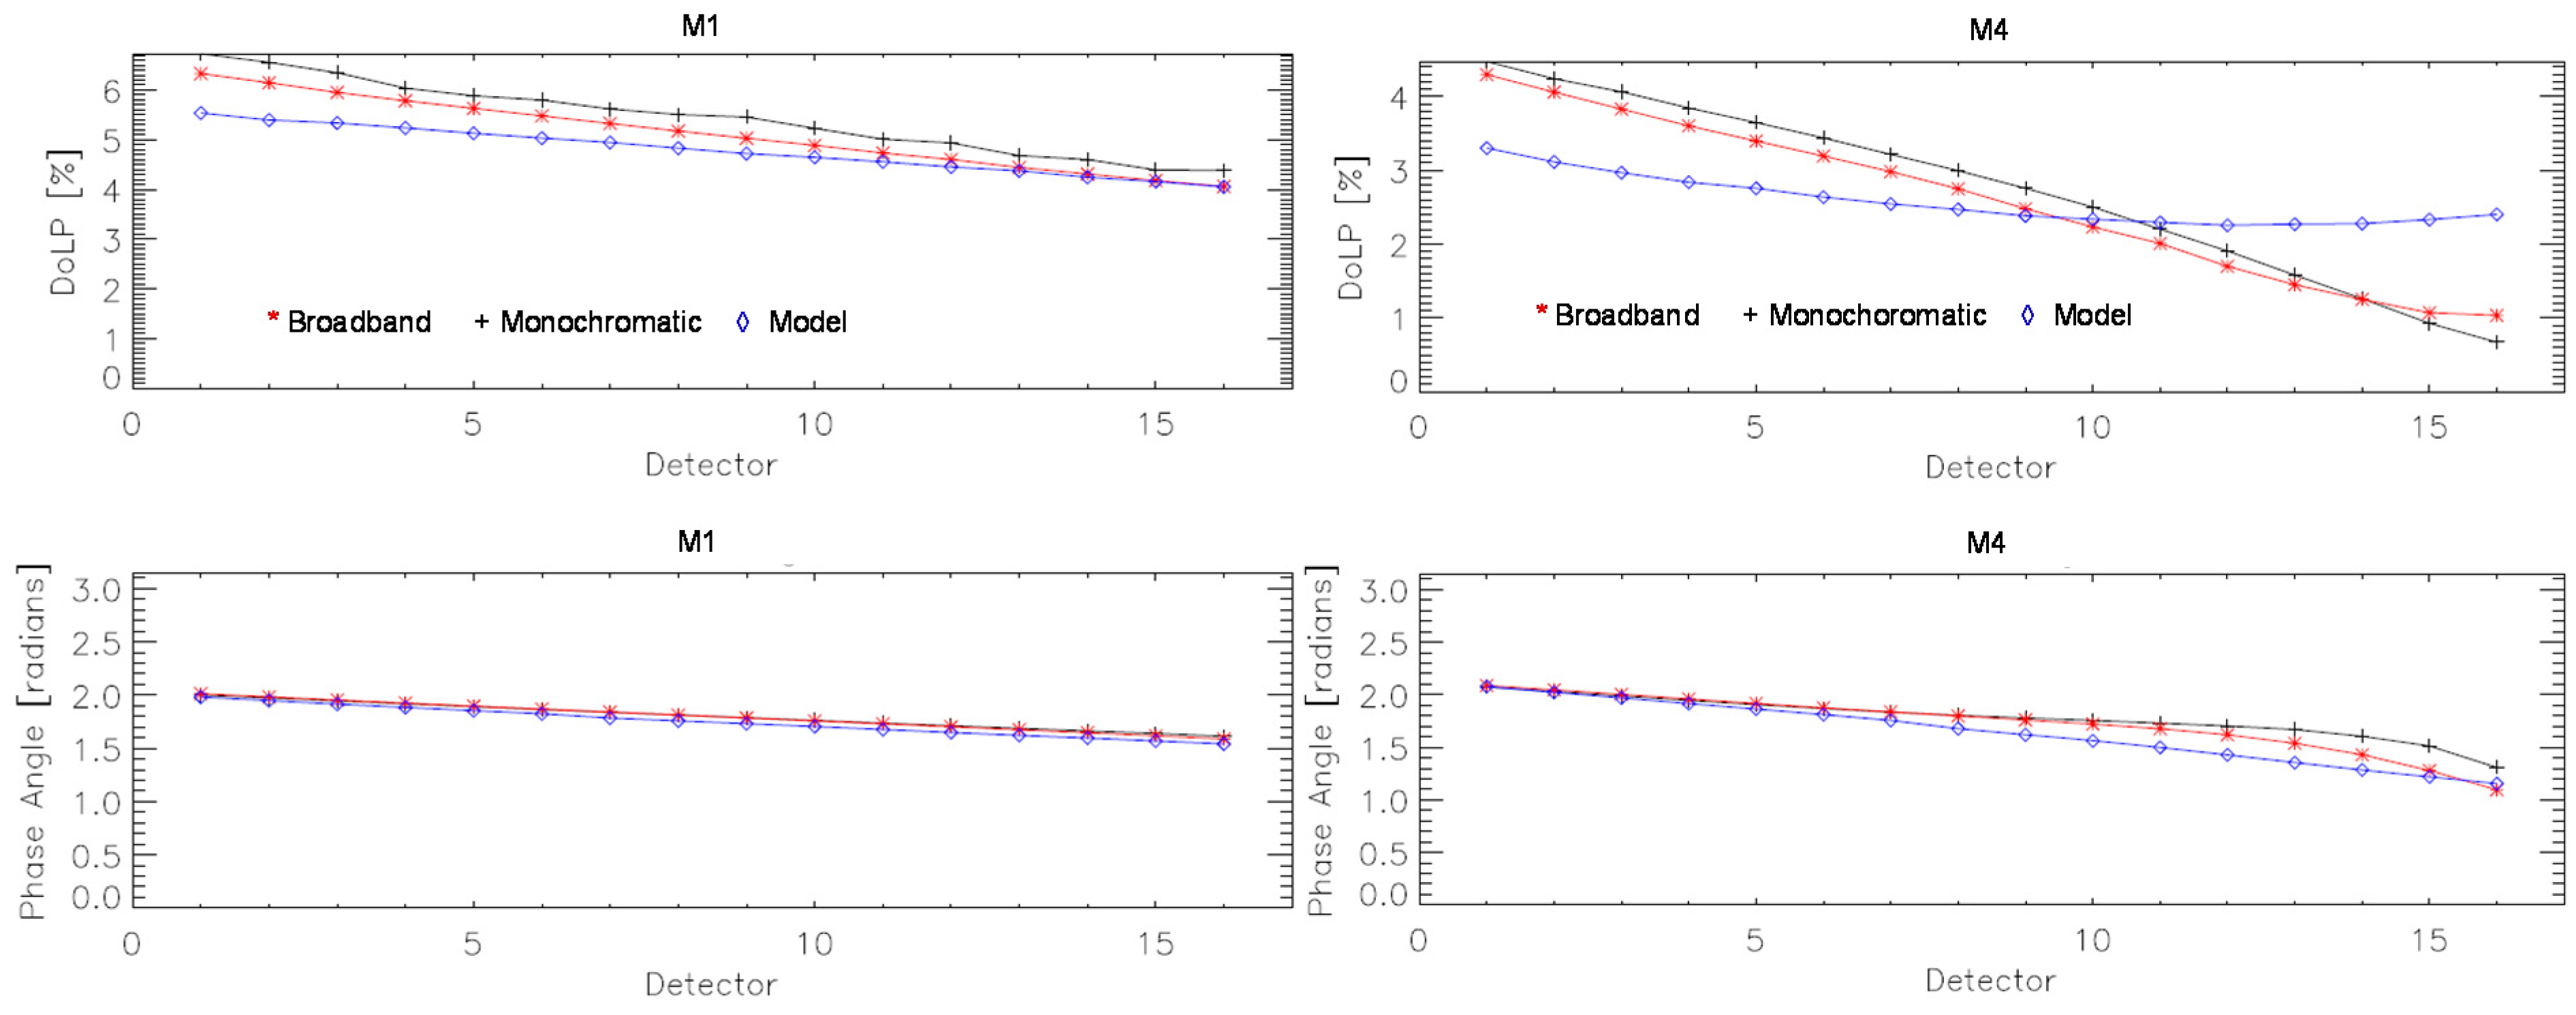
Figure 6 shows a comparison of the DoLP results derived for M1 and M4 bands, based on the broadband source and the monochromatic source measurements [
16,
17]. In general, the results agree well, and the difference is less than 0.5% for the DoLP and less than 14 degrees for the phase. These measurement results were also compared to the outputs of the J1 polarization model. Our preliminary assessment is that the model was not able to represent the detector dependence with the accuracy needed, especially for M4 (maximum difference ~1.5%), and therefore, our recommendation was to revise the model and its component inputs for J1 and future instruments (J2+).
Figure 6.
J1 DoLP and phase angle for M1 and M4, using broadband (*), monochromatic (+), and sensor model (◊).
Figure 6.
J1 DoLP and phase angle for M1 and M4, using broadband (*), monochromatic (+), and sensor model (◊).
3.4. Relative Spectral Response (RSR)
VIIRS sensor level spectral testing was performed using a double monochromator source, the Spectral Measurement Assembly (SpMA) in ambient for the VisNIR bands, and in the TV environment at nominal plateau for the SMWIR and LWIR bands [
18]. The monochromator exit slit image was aligned to illuminate one spectral band at a time, and the spectral response was measured over a spectral region covering roughly the acceptance of the dichroic spectral bandpass. The VIIRS spectral data were corrected for the spectral shape of the source using a reference detector data set and normalized to the peak response to determine the VIIRS RSR. The data were analyzed to determine each band’s center wavelength, Full Width Half Maximum (FWHM) bandwidth, 1% response points, and the Integrated OOB (IOOB). J1 spectral characterization was completed successfully, and analysis completed by the government team based on the SNR and visual inspection led to the release of high quality J1 VIIRS RSR data set (Version 1, stitched in-band and OOB) in June 2015 [
18].
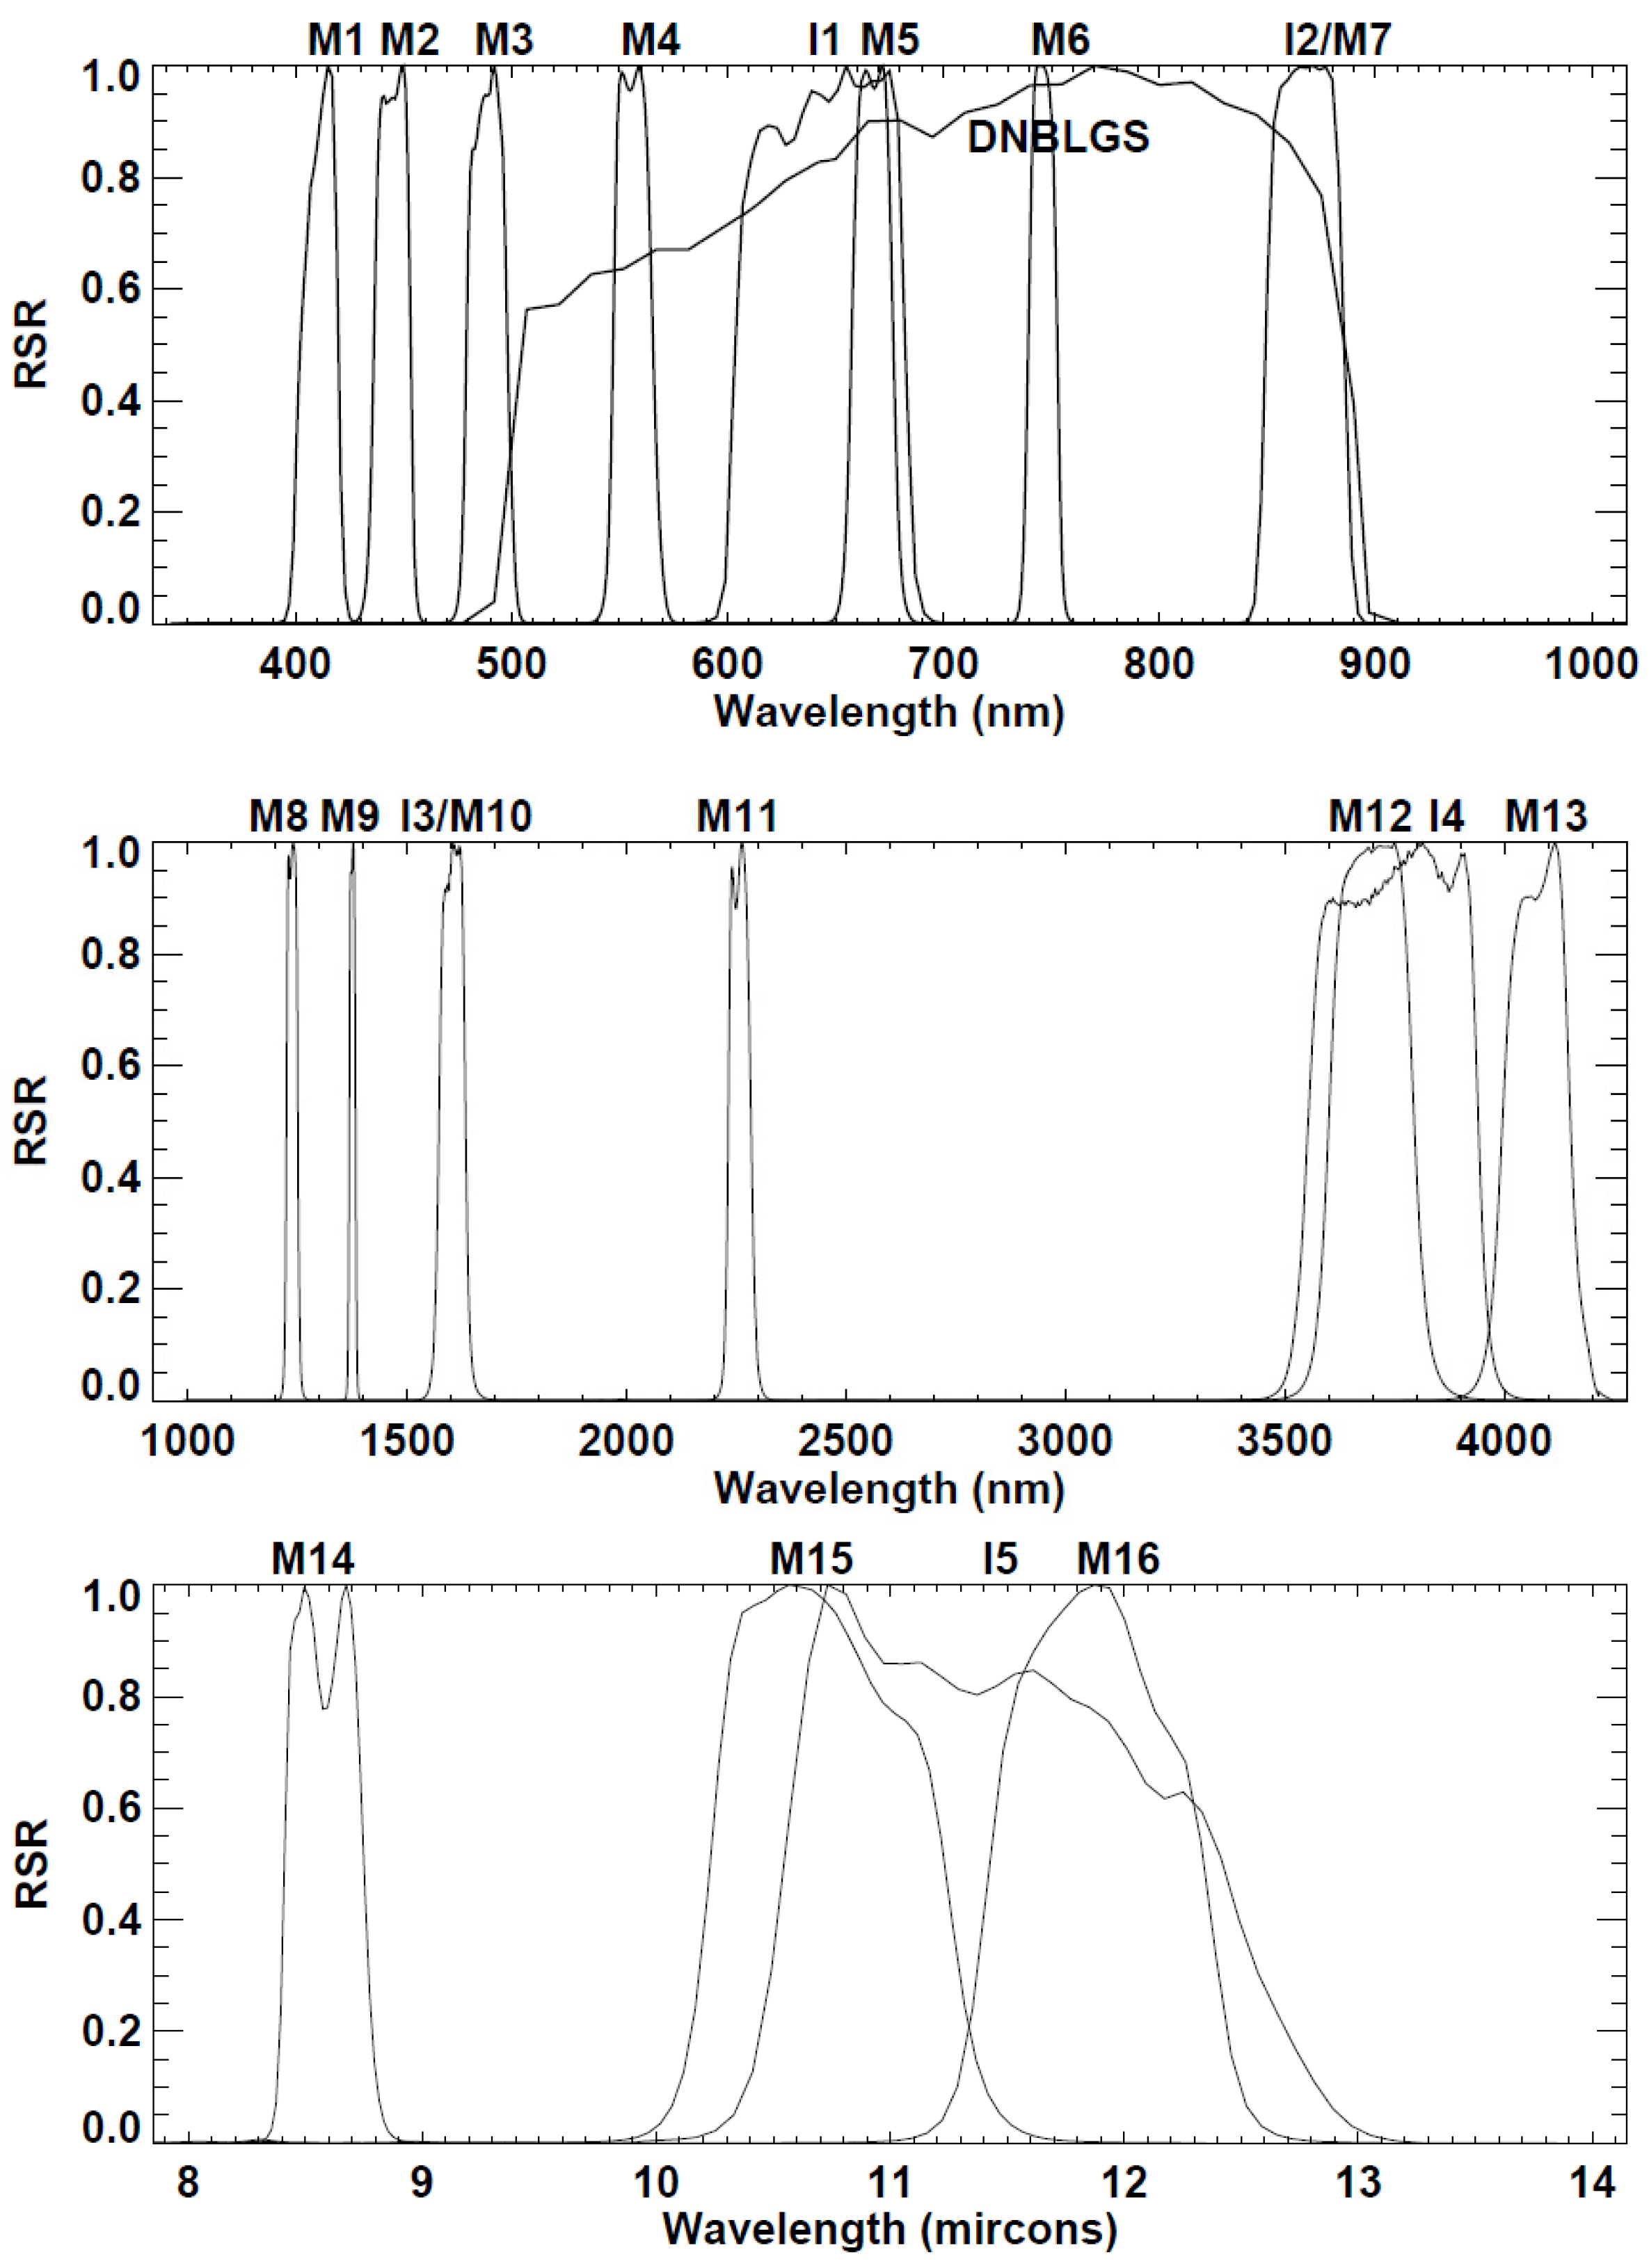
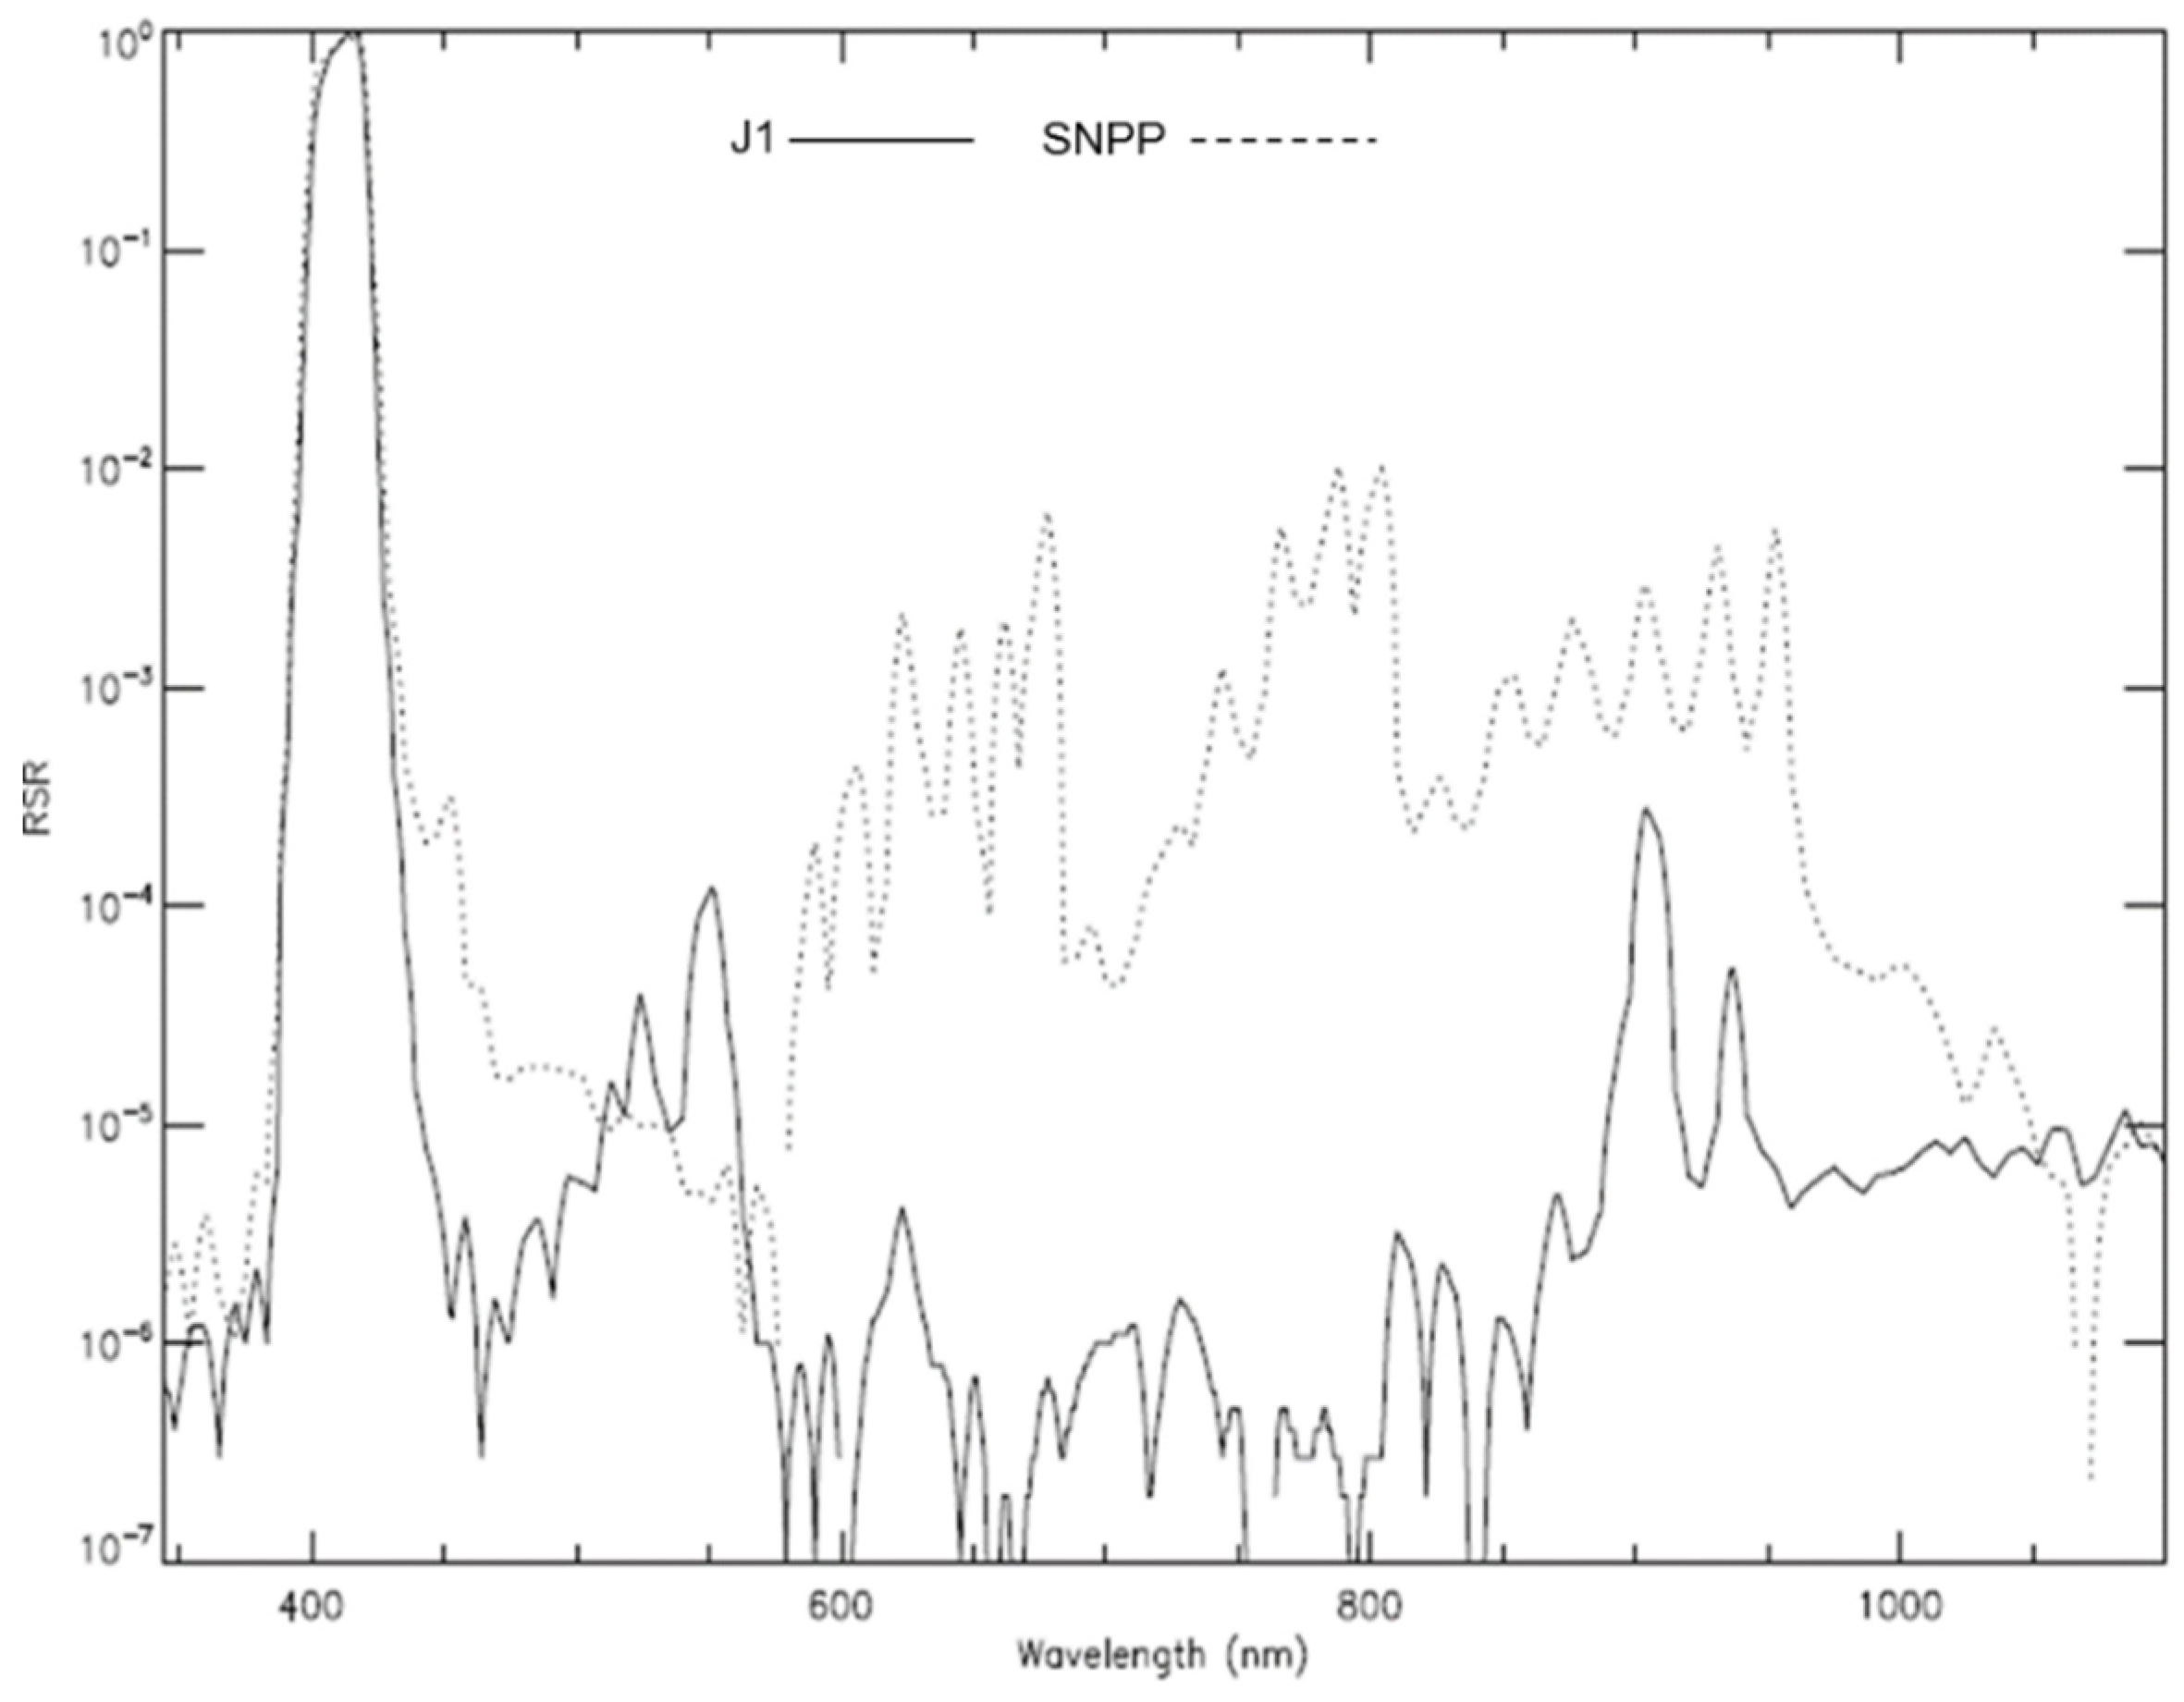
Figure 7 shows the in-band RSR for VisNIR and DNB (top), SMWIR (middle) and LWIR (bottom). As noted previously, the redesign of the VisNIR filters led to major enhancements in terms of IOOB reduction as shown in
Figure 8 where we compare the full M1 RSR (in-band and OOB) between J1 and SNPP sensors. Compliance with the band center, bandwidth, extended band-pass, and IOOB requirements were calculated for all bands on a per detector basis.
Table 7 provides a band average summary of J1 spectral performance for all bands, showing non-compliances in shaded cells. As a comparison to SNPP VIIRS, performances that were not compliant for SNPP were underlined. We can easily observe the enhancements of J1 IOOB for the VisNIR bands compared to SNPP. Most other non-compliances are either similar to SNPP or not considered a risk to the SDR or EDR performance. Additional RSR testing was performed for VisNIR bands in the post-TV phase using the NIST laser source. Further enhancements to the VisNIR RSRs are expected before J1 instrument launch, which will be based on the combination of best quality measurements from SpMA and laser sources, and this new version is expected to be released in early 2016.
Table 7.
J1 Spectral performance (measurement vs. specification) summary based on RSR Version 1 data set. Shaded cells represent J1 non-compliances. Underlined cells represent SNPP non-compliances.
Table 7.
J1 Spectral performance (measurement vs. specification) summary based on RSR Version 1 data set. Shaded cells represent J1 non-compliances. Underlined cells represent SNPP non-compliances.
| Band | Center Wavelength (nm) | Bandwidth (nm) | 1% Limits (nm) | IOOB (%) |
|---|
| Meas. | Spec. | Meas. | Spec. | Meas. | Spec. | Meas. | Spec. |
|---|
| Center/Tolerance | Bandwidth/Tolerance | Lower Limit | Upper Limit | Lower Limit | Upper Limit |
|---|
| I1 | 643.0 | 640/6 | 78.6 | 80/6 | 594.0 | 693.5 | 565 | 715 | 0.11 | 0.5 |
| I2 | 867.3 | 865/8 | 36.4 | 39/5 | 841.6 | 893.5 | 802 | 928 | 0.12 | 0.7 |
| I3 | 1603.2 | 1610/8 | 60.4 | 60/5 | 1544.5 | 1667.4 | 1509 | 1709 | 0.44 | 0.7 |
| I4 | 3747.7 | 3740/8 | 386.7 | 380/5 | 3474.4 | 4014.9 | 3340 | 4140 | 0.17 | 0.5 |
| I5 | 11483.5 | 11450/8 | 1876.5 | 1900/5 | 10161.8 | 13078.7 | 9900 | 12900 | 0.23 | 0.4 |
| M1 | 411.2 | 412/2 | 17.5 | 20/2 | 395.3 | 425.4 | 376 | 444 | 0.24 | 1.0 |
| M2 | 444.8 | 445/3 | 17.0 | 18/2 | 429.3 | 457.9 | 417 | 473 | 0.34 | 1.0 |
| M3 | 488.6 | 488/4 | 19.0 | 20/3 | 473.0 | 504.4 | 455 | 521 | 0.30 | 0.7 |
| M4 | 556.3 | 555/4 | 18.5 | 20/3 | 540.0 | 573.6 | 523 | 589 | 0.25 | 0.7 |
| M5 | 667.1 | 672/5 | 19.4 | 20/3 | 649.6 | 684.9 | 638 | 706 | 0.27 | 0.7 |
| M6 | 746.0 | 746/2 | 13.5 | 15/2 | 733.9 | 758.0 | 721 | 771 | 0.26 | 0.8 |
| M7 | 867.5 | 865/8 | 36.3 | 39/5 | 842.8 | 892.5 | 801 | 929 | 0.12 | 0.7 |
| M8 | 1238.4 | 1240/5 | 26.1 | 20/4 | 1214.1 | 1264.9 | 1205 | 1275 | 0.49 | 0.8 |
| M9 | 1375.7 | 1378/4 | 14.4 | 15/3 | 1362.1 | 1390.0 | 1351 | 1405 | 0.42 | 1.0 |
| M10 | 1603.7 | 1610/14 | 60.1 | 60/9 | 1545.8 | 1667.5 | 1509 | 1709 | 0.44 | 0.7 |
| M11 | 2258.2 | 2250/13 | 52.0 | 50/6 | 2209.4 | 2314.3 | 2167 | 2333 | 0.37 | 1.0 |
| M12 | 3697.9 | 3700/32 | 194.7 | 180/20 | 3519.1 | 3893.7 | 3410 | 3990 | 0.36 | 1.1 |
| M13 | 4073.9 | 4050/34 | 154.9 | 155/20 | 3911.7 | 4214.0 | 3790 | 4310 | 0.43 | 1.3 |
| M14 | 8580.3 | 8550/70 | 339.7 | 300/40 | 8336.4 | 8879.1 | 8050 | 9050 | 0.23 | 0.9 |
| M15 | 10730.8 | 10763/113 | 1000.7 | 1000/100 | 9915.8 | 11638.0 | 9700 | 11740 | 0.41 | 0.4 |
| M16A | 11882.6 | 12013/88 | 914.2 | 950/50 | 11104.5 | 12692.3 | 11060 | 13050 | 0.46 | 0.4 |
| M16B | 11883.0 | 12013/88 | 933.8 | 950/50 | 11101.8 | 12698.1 | 11060 | 13050 | 0.47 | 0.4 |
| DNBMGS | 693.1 | 700/14 | 380.5 | 400/20 | 488.2 | 906.6 | 470 | 960 | 0.03 | 0.1 |
| DNBLGS | 695.6 | 700/14 | 380.3 | 400/20 | 480.8 | 904.5 | 470 | 960 | 0.02 | 0.1 |
Figure 7.
J1 VIIRS in-band RSRs, for VisNIR and DNB (top); SMWIR (middle); and LWIR (bottom).
Figure 7.
J1 VIIRS in-band RSRs, for VisNIR and DNB (top); SMWIR (middle); and LWIR (bottom).
Figure 8.
Full M1 RSR comparison between J1 (line) and SNPP (dashes).
Figure 8.
Full M1 RSR comparison between J1 (line) and SNPP (dashes).
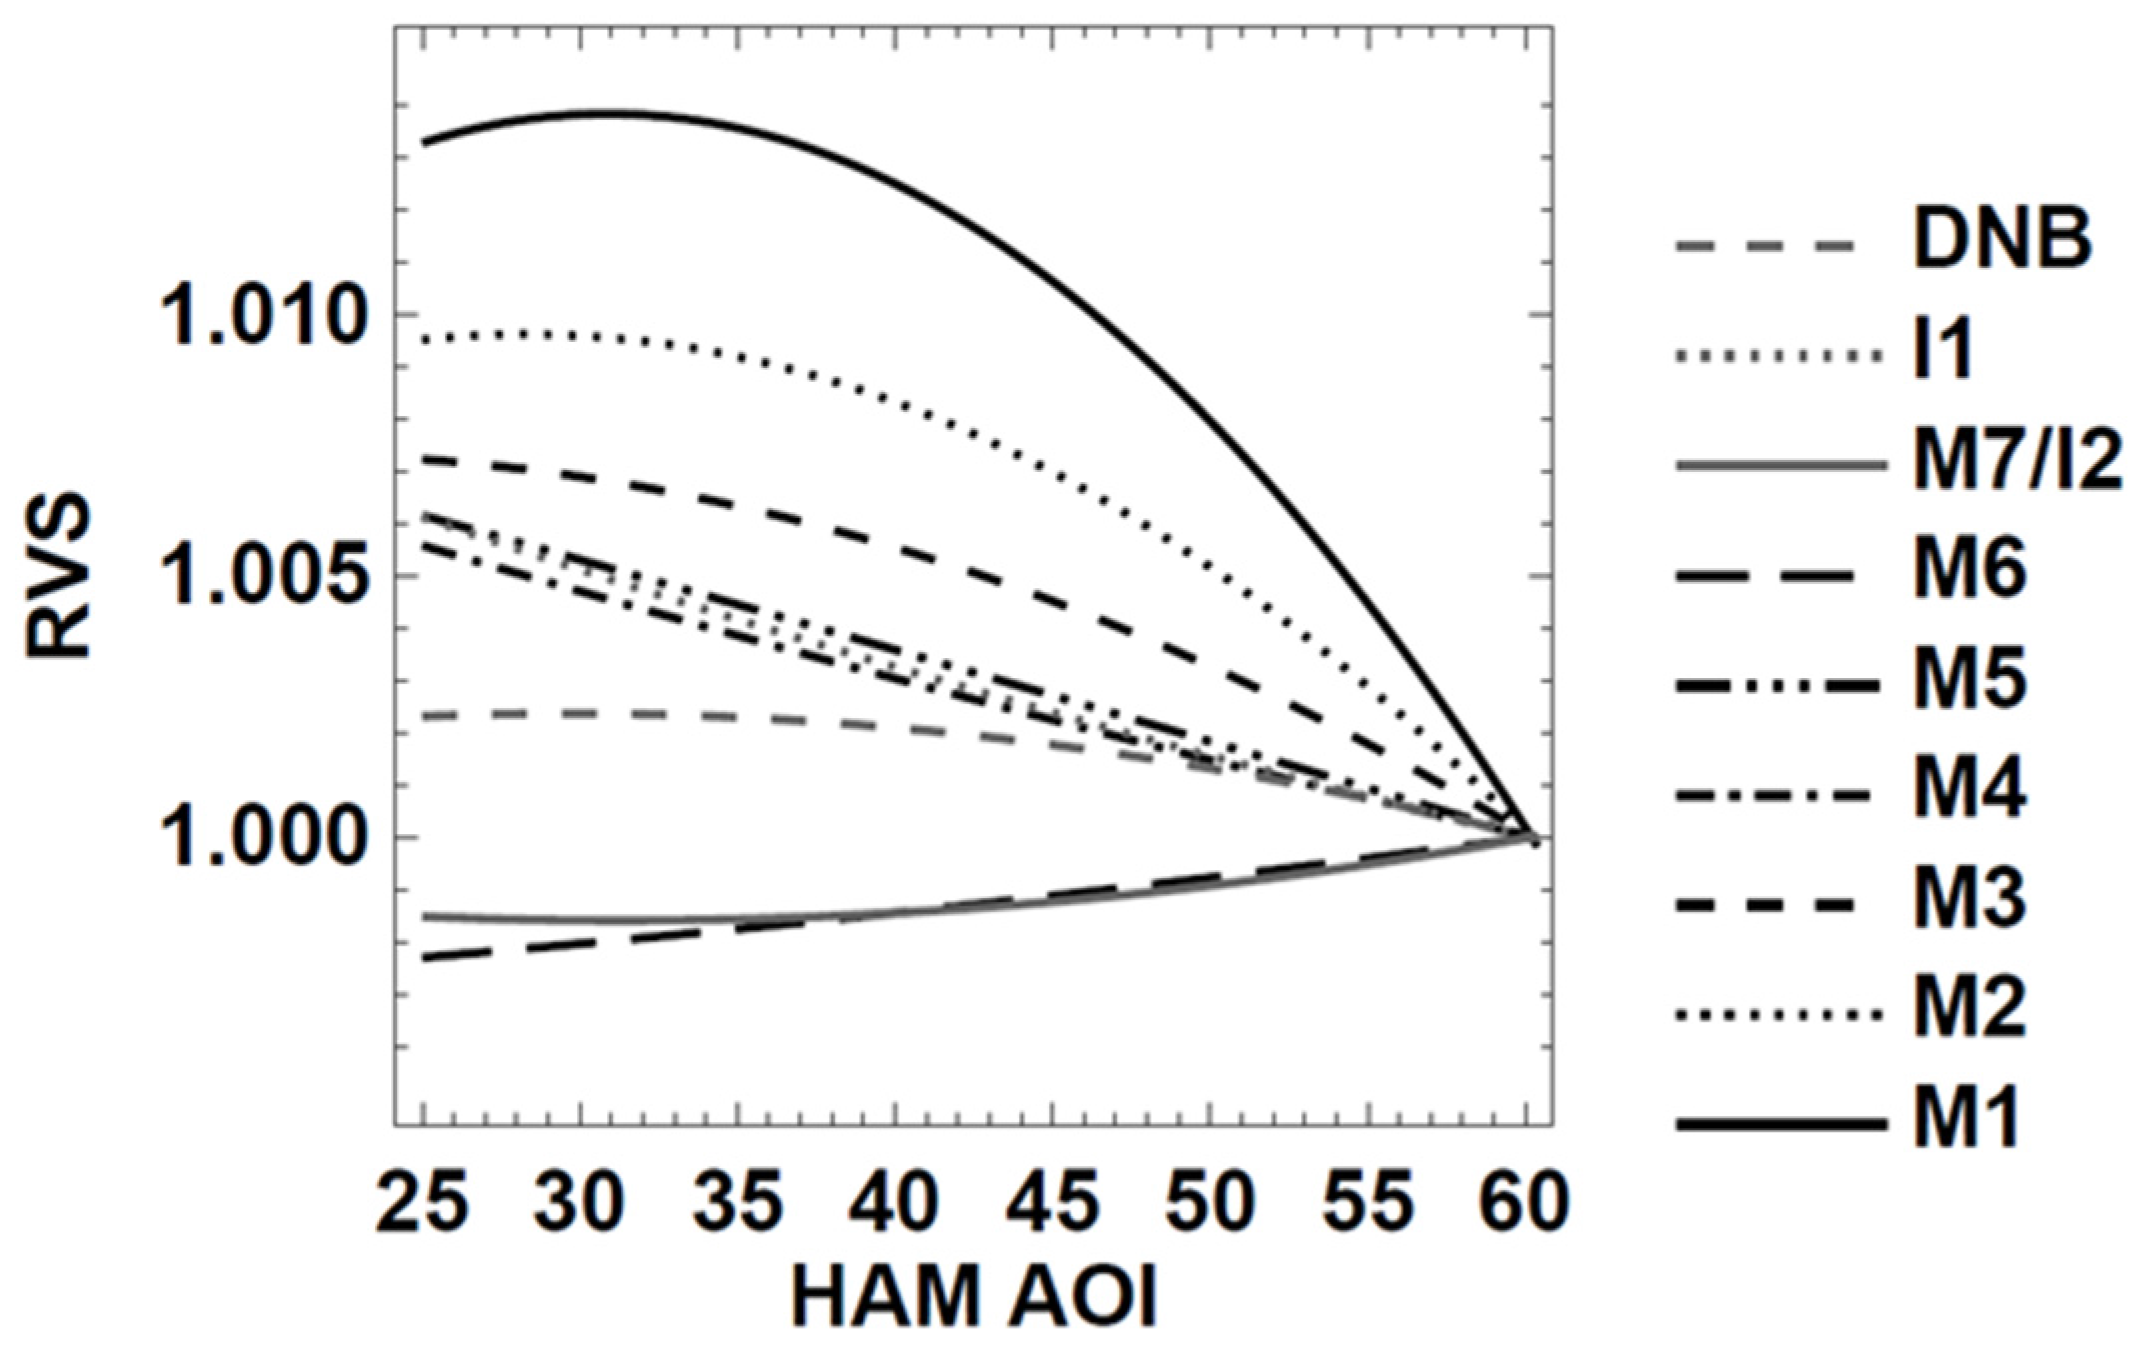
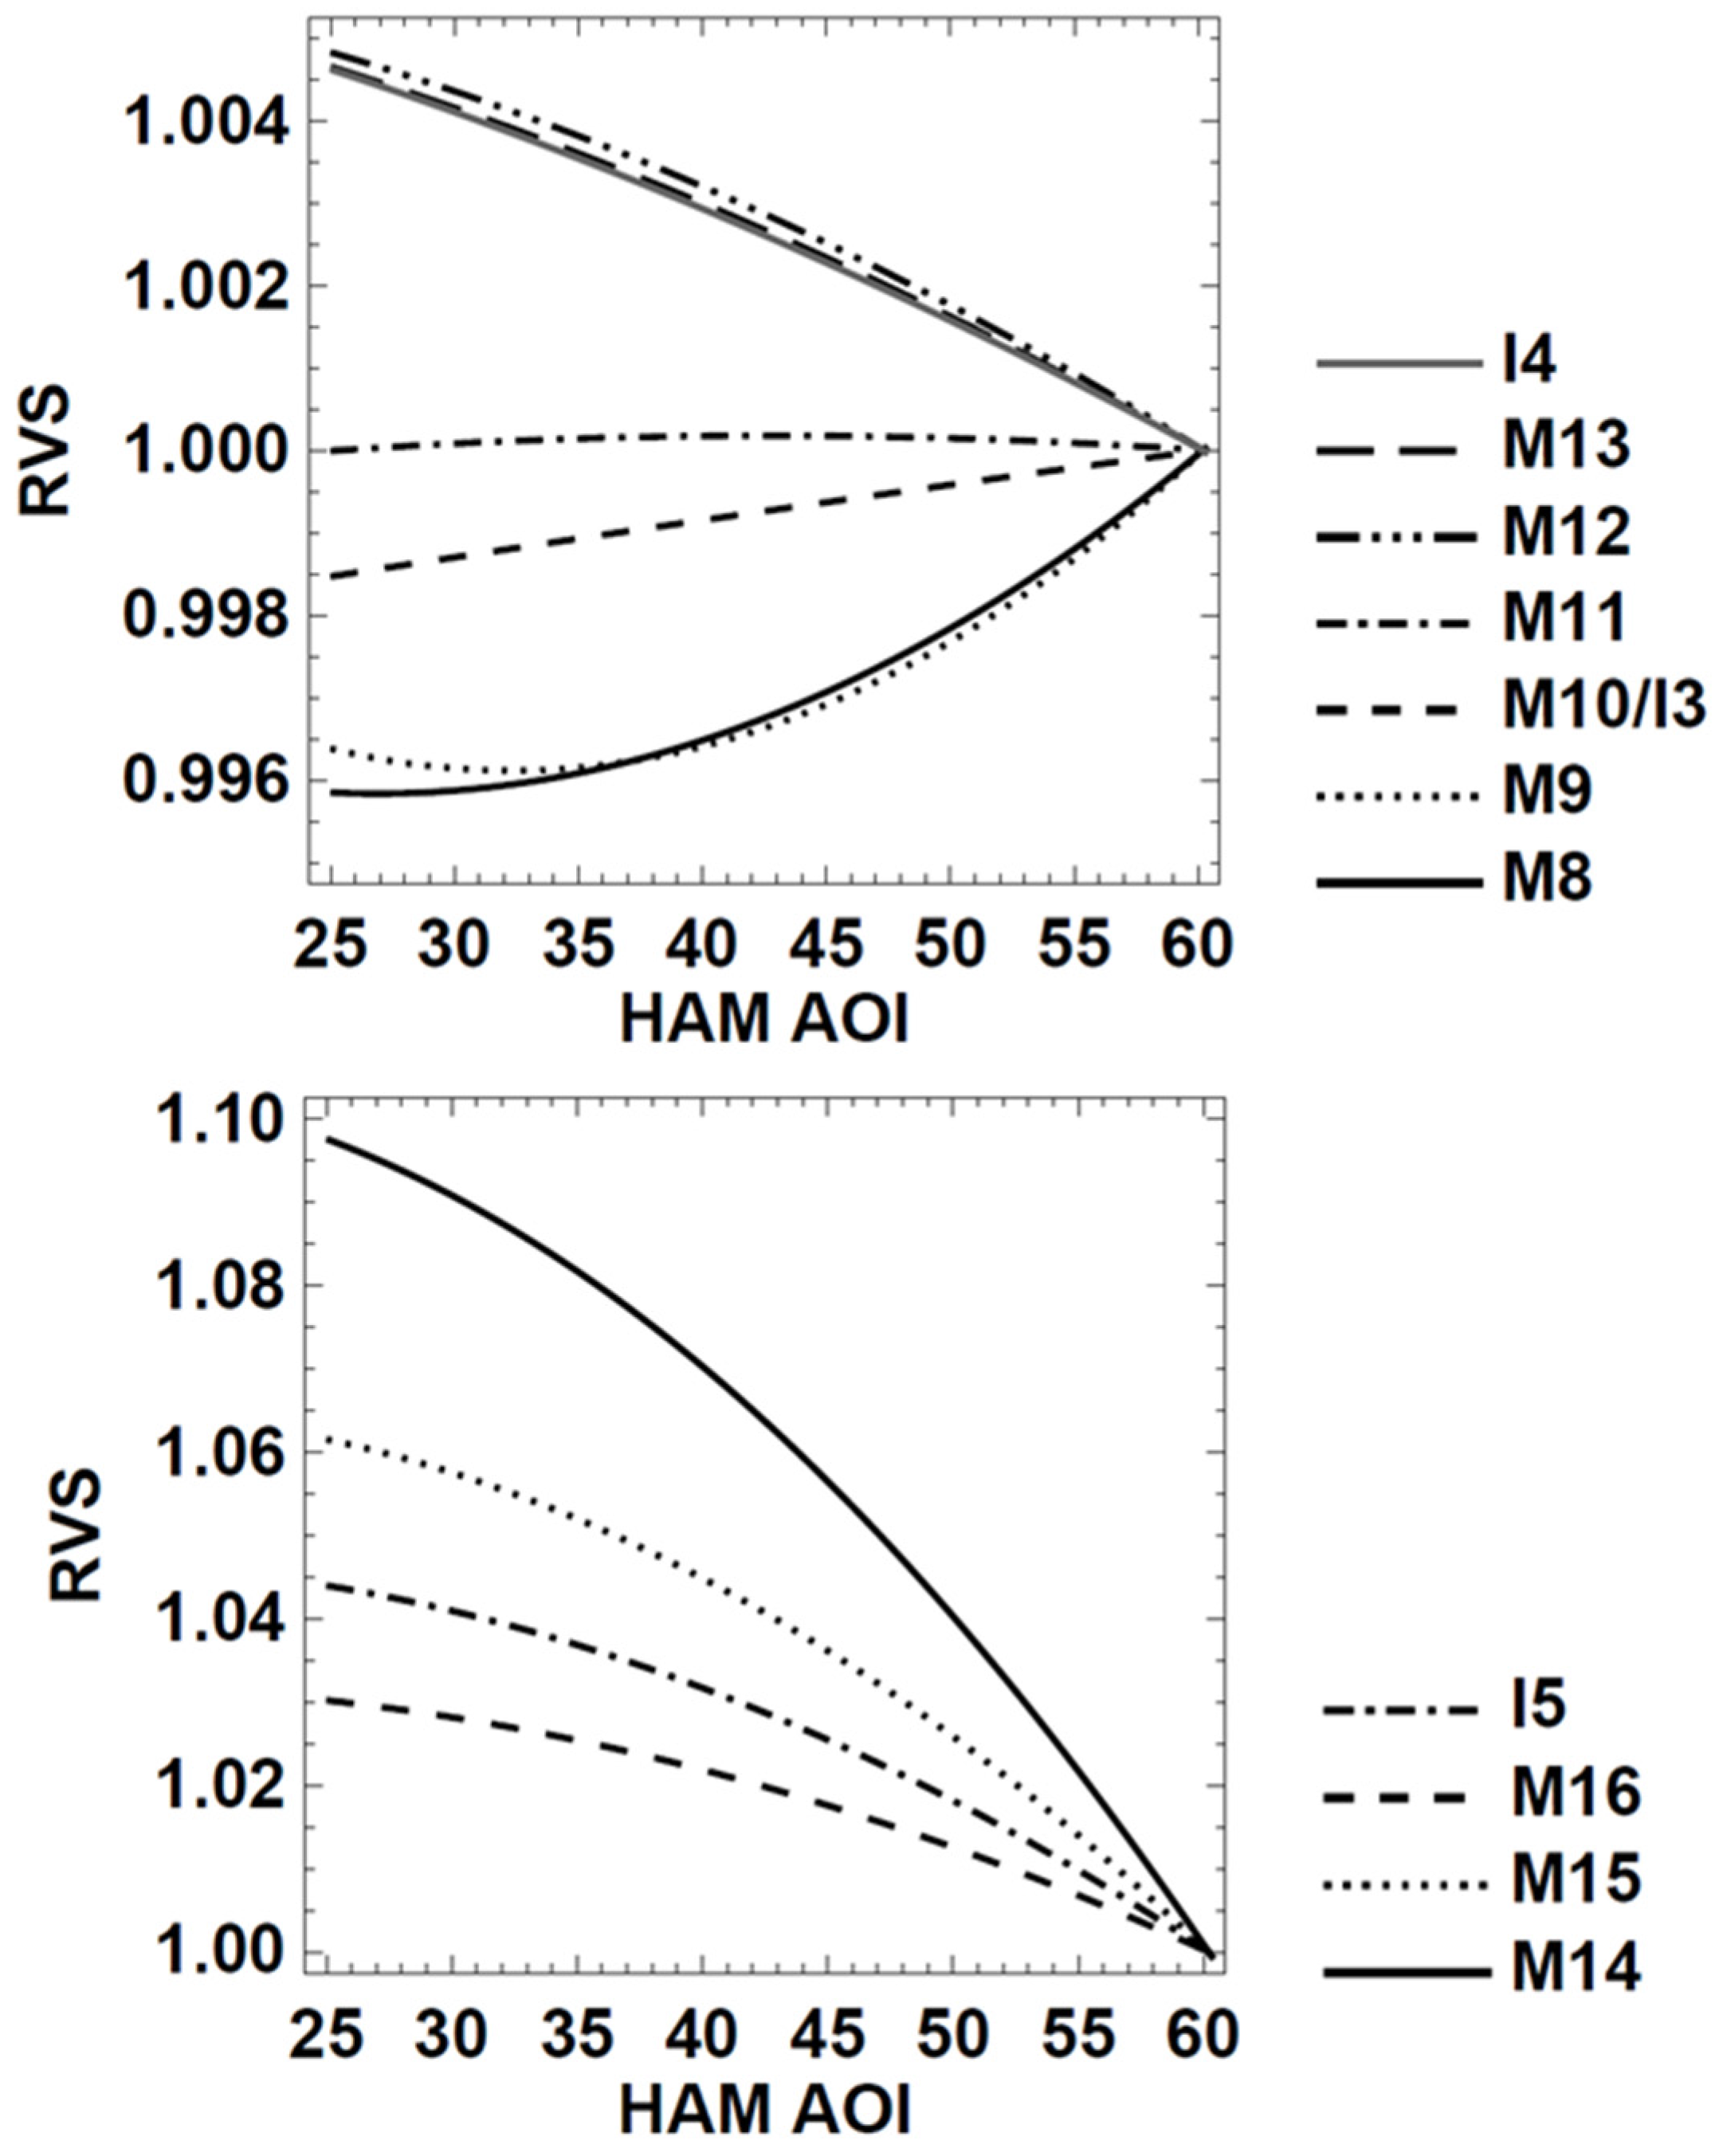
3.5. Response Versus Scan-Angle (RVS)
The RVS testing was performed during ambient phase for the RSB using the SIS100 and for the TEB using the laboratory ambient blackbody (LABB) source and the on-board BB. Data taken at eleven angles-of-incidence (AOI) for the RSB and twelve for the TEB were used to fit the RVS function, which is a quadratic polynomial in AOI, after correcting for source drift and background radiances [
19].
Figure 9 shows J1 band-average RVS functions for HAM side 0. For all bands, the RVS differences between HAM sides are small with the exception of bands M1, M2, M7 and I2. The variation in the RSB RVS for M1–M11 and I1–I3 is generally small (top and middle plots) and similar to SNPP, varying by less than 1.5% (M1 has largest variation) over the full operational AOI range of 28.6° to 60.2°. The RSB RVS uncertainty target is 0.3% which was determined here as the average fitting residuals. All RSB bands had uncertainties lower than 0.06% with the highest uncertainty observed for DNB, and M9 due to error residuals from water vapor correction [
20]. The only exception is I3 detector 4 (very noisy detector) which has shown an uncertainty of about 0.4%.
The J1 band averaged RVS for the MWIR bands, M12–M13 and I4, and the LWIR bands, M14–M16 and I5, are plotted in the middle and bottom plots respectively of
Figure 8. The MWIR RVS is generally small varying by less than 1% over the full AOI range. In contrast, the LWIR RVS changes by up to 10% for M14 over the range of AOI. The TEB RVS uncertainty target is 0.2%, which was determined here as the average fitting residuals; all TEB RVS uncertainties are lower than 0.1%, meeting the RVS characterization uncertainty target with good margin. Overall, J1 RVS performance is comparable to SNPP performance.
Figure 9.
J1 VIIRS band averaged RVS as a function of HAM AOI for HAM 0.
Figure 9.
J1 VIIRS band averaged RVS as a function of HAM AOI for HAM 0.
3.6. Near-Field Response (NFR)
NFR is defined as scattered light originating from within 4 degrees of the RTA line of sight. The Scatter Measurement Assembly (ScMA) light source was used with a slit and a band-pass filter to measure the sensor NFR. The VIIRS NFR is limited by the absolute radiometric calibration uncertainty requirement for structured scenes which sets the maximum allowable response at a specified angle limit coming off a 12 by 12 milliradian bright target for each band. To estimate the structured scene response, a Harvey-Shack BRDF scattering model [
21,
22] was used to fit the measured NFR profile and remove test artifacts and noisy samples.
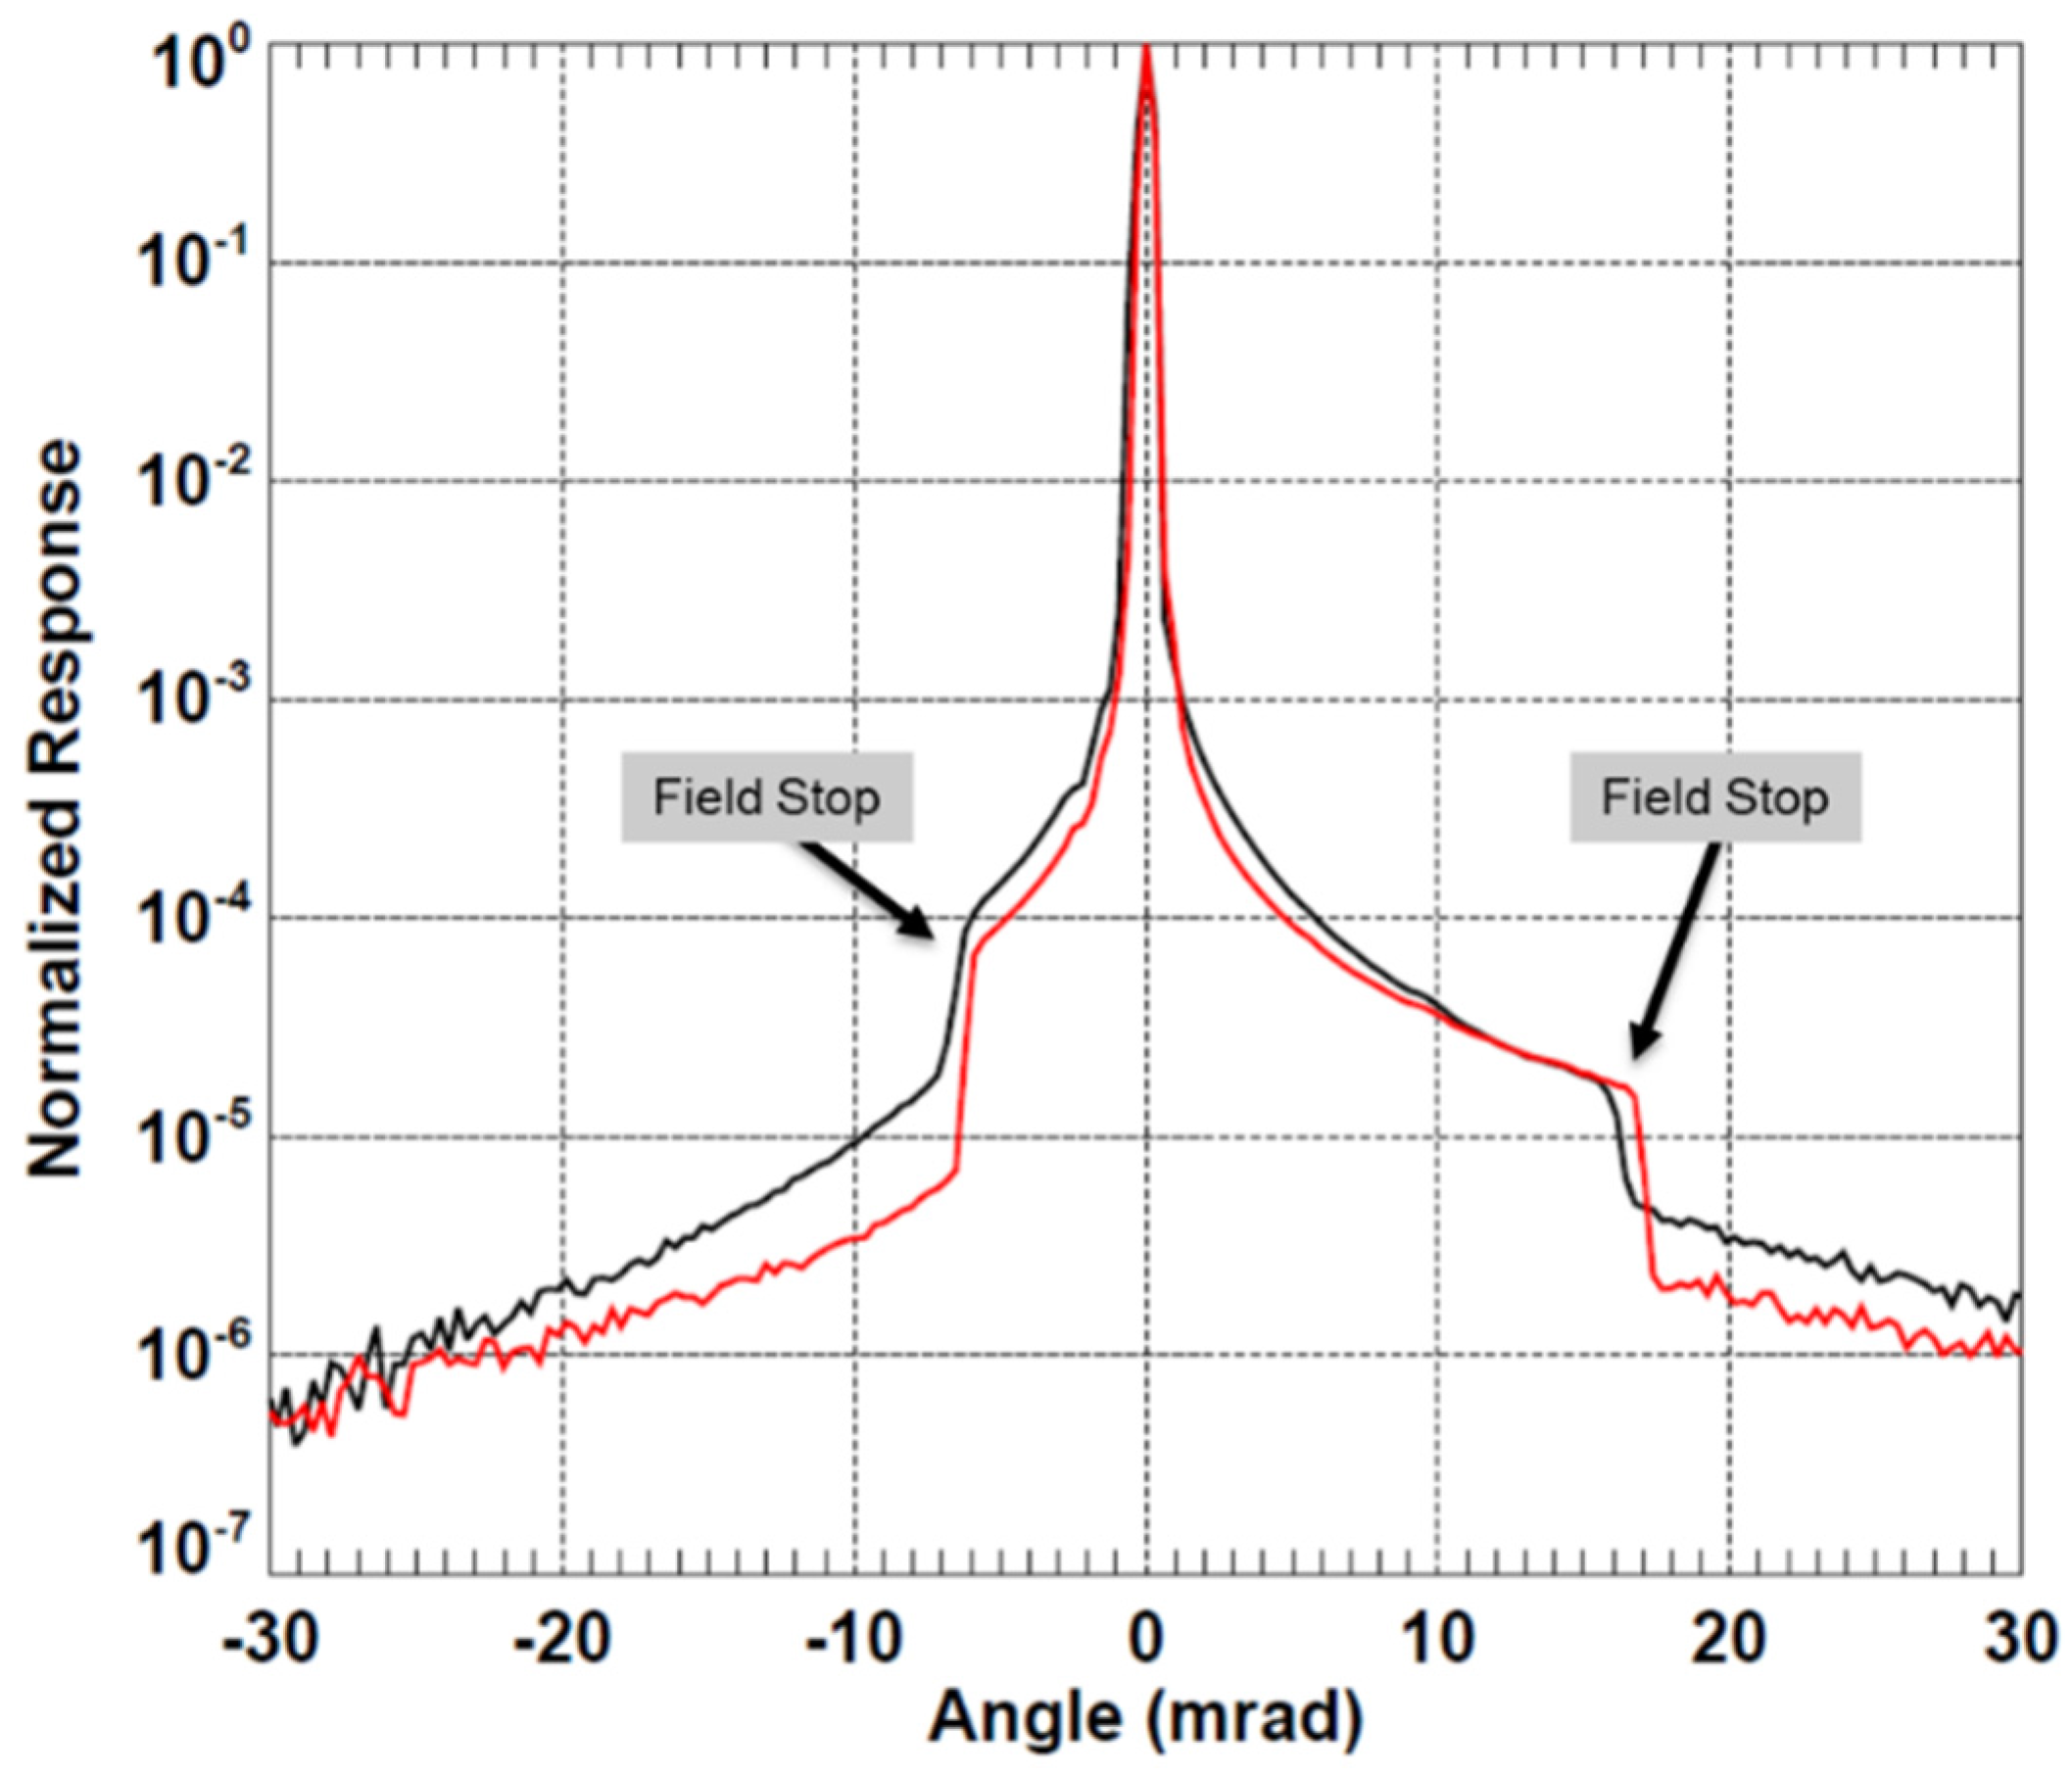
Figure 10 compares the normalized response for band M5 detector 8 between J1 and SNPP, which represents a typical profile observed in the VIIRS NFR measurements when the sensor is scanning the source through a vertical slit reticle. For both SNPP and J1, the figure shows the NFR falling off rapidly from the peak with additional sharp drops seen around the field baffle locations. In this example, the M5 NFR drops to about 0.1% within 5 samples of the peak (
i.e., corresponding to approximately 1.25 km at the Earth surface), and the field baffle reduces the NFR by about one order of magnitude. The NFR is estimated for each detector, and the results show good detector uniformity within the same band. The NFR requirement states that the maximum allowable scattered radiance, as a fraction of typical scene radiance, at the specified angular distance from a bright target shall be less than the specified value. The band averaged VIIRS NFR performance is summarized in
Table 8, including the bright target radiance (L
bright), the specification (L
spec), and the ratio L
scat//L
spec for J1 and SNPP VIIRS. The results show all J1 VIIRS bands meet the specification (L
scat/L
spec<1) with margin at the beginning of life, and multiple bands are showing performance enhancements when compared to SNPP, especially M15 and M16.
Figure 10.
Measured NFR for band M5 (672 nm) detector 8 as a function of scan angle, using J1 data (red line) and SNPP data (black line).
Figure 10.
Measured NFR for band M5 (672 nm) detector 8 as a function of scan angle, using J1 data (red line) and SNPP data (black line).
Table 8.
The summary of J1 band average NFR performance and comparison to SNPP. The ratio Lscat/Lspec less than unity means compliance with scatter requirements.
Table 8.
The summary of J1 band average NFR performance and comparison to SNPP. The ratio Lscat/Lspec less than unity means compliance with scatter requirements.
| Band | Center Wavelength (nm) | Angular Separation (mrad) | Lbright | SNPP | J1 |
|---|
| Lspec | Lscat/Lspec | Lspec | Lscat/Lspec |
|---|
| M1 | 412 | 6 | 162 | 2.77 × 10⁻³ | 0.39 | 4.68 × 10⁻³ | 0.37 |
| M2 | 445 | 6 | 180 | 2.22 × 10⁻³ | 0.45 | 3.95 × 10⁻³ | 0.42 |
| M3 | 488 | 6 | 160 | 2.00 × 10⁻³ | 0.5 | 3.33 × 10⁻³ | 0.36 |
| M4 | 555 | 6 | 160 | 1.31 × 10⁻³ | 0.47 | 2.25 × 10⁻³ | 0.48 |
| M5 | 672 | 6 | 115 | 8.70 × 10⁻⁴ | 0.63 | 9.55 × 10⁻⁴ | 0.67 |
| M6 | 746 | 12 | 147 | 1.31 × 10⁻³ | 0.12 | 1.08 × 10⁻³ | 0.13 |
| M7 | 865 | 6 | 124 | 5.16 × 10⁻⁴ | 0.9 | 6.63 × 10⁻⁴ | 0.83 |
| M8 | 1240 | 6 | 57 | 9.47 × 10⁻⁴ | 0.62 | 4.92 × 10⁻⁴ | 0.65 |
| M9 | 1378 | NA | NA | NA | NA | NA | NA |
| M10 | 1610 | 6 | 86.1 | 8.48 × 10⁻⁴ | 0.76 | 1.03 × 10⁻³ | 0.38 |
| M11 | 2250 | 6 | 1.2 | 1.00 × 10⁻³ | 0.42 | 6.03 × 10⁻⁶ | 0.63 |
| M12 | 3700 | 3 | 0.3 | 1.67 × 10⁻³ | 0.64 | 4.78 × 10⁻⁴ | 0.87 |
| M13 | 4050 | 3 | 1.7 | 1.86 × 10⁻³ | 0.63 | 3.15 × 10⁻³ | 0.47 |
| M14 | 8550 | NA | NA | NA | NA | NA | NA |
| M15 | 10763 | 3 | 12.5 | 7.75 × 10⁻⁴ | 1.25 | 6.69 × 10⁻³ | 0.66 |
| M16 | 12013 | 3 | 11.3 | 7.92 × 10⁻⁴ | 1.26 | 8.95 × 10⁻³ | 0.56 |
| DNB | 12013 | 3 | NA | 2.00 × 10⁻³ | NA | 2.00 × 10⁻³ | 0.65 |
3.7. Stray Light Response (SLR)
The far field stray light is defined as the light originating from the region between 4 and 62.5 degrees from the sensor boresight. The far field stray light testing was performed using a radiometrically calibrated 1000 W studio lamp. The VIIRS telescope was staring at a cavity type blackbody while the lamp was moved through 33 equally distanced hemispherical positions to evaluate the angular stray light distribution. The lamp positions covered roughly equally divided annulus out to 62.5 degrees off nadir to simulate the Earth as subtended by VIIRS at the J1 on-orbit operating altitude. The measured instrument response was scaled by the ratio of the studio lamp irradiance and a model of bright cloud irradiance. The VIIRS far-field stray light testing represent a worse case, hole-in-the-cloud scenario. The measured instrument response at each position was weighted by the corresponding annulus, then aggregated to estimate the total stray light contribution from the specified worse-case scenario. The test was conducted with the RTA locked at SV, nadir, and end-of-scan to obtain stray light estimates at different scan angles.
Table 9 shows the estimated J1 VIIRS far field stray light compliance. The sensor test data analysis showed all RSB meet the stray light requirement with large margins at the beginning of life. Margins are between 45% (M5) and 94% (M10, I3). Furthermore, test results indicate that the stray light rejection is comparable between J1 and SNPP. A noticeable difference is that the stray light in SNPP is much stronger along track than along scan direction; whereas in J1, the stray light is more evenly distributed over all angles. Another difference is that band M11 is now compliant for J1 because of the L
typ requirement change (from 0.1 to 1.0 Wm
−2·sr
−1·μm
−1).
Table 9.
Summary of J1 VIIRS stray light performance, and the ratio of measured stray light to requirement (1% Ltyp). The comparison to SNPP stray light performance is also shown.
Table 9.
Summary of J1 VIIRS stray light performance, and the ratio of measured stray light to requirement (1% Ltyp). The comparison to SNPP stray light performance is also shown.
| Band | Eearth | Ltyp | SNPP | J1 |
|---|
| dnspec | dnstray | dnstray/dnspec | dnspec | dnstray | dnstray/dnspec |
|---|
| M1 | 1444.1 | 44.9 | 17.02 | 2.58 | 0.15 | 7.84 | 2.42 | 0.31 |
| M2 | 1526.1 | 40 | 9.39 | 2.53 | 0.27 | 9.03 | 2.68 | 0.30 |
| M3 | 1563.5 | 32 | 8.81 | 2.56 | 0.29 | 8.12 | 2.89 | 0.36 |
| M4 | 1510.7 | 21 | 7.53 | 2.39 | 0.32 | 7.50 | 2.96 | 0.39 |
| M5 | 1265.7 | 10 | 5.06 | 2.38 | 0.47 | 4.69 | 2.57 | 0.55 |
| M6 | 1088.9 | 9.6 | 8.00 | 3.62 | 0.45 | 7.22 | 2.95 | 0.41 |
| M7 | 833.2 | 6.4 | 6.87 | 4.06 | 0.59 | 6.27 | 3.29 | 0.52 |
| M8 | 353 | 5.4 | 1.45 | 0.77 | 0.53 | 1.82 | 0.44 | 0.24 |
| M9 | 262.9 | 6 | 2.44 | 0.92 | 0.38 | 2.41 | 0.36 | 0.15 |
| M10 | 165.7 | 7.3 | 3.55 | 1.30 | 0.36 | 3.44 | 0.22 | 0.06 |
| M11 | 56.4 | 0.12 | 0.11 | 0.42 | 3.77 | 1.15 | 0.09 | 0.08 |
| I1 | 1341.3 | 22 | 1.02 | 0.26 | 0.26 | 0.94 | 0.31 | 0.33 |
| I2 | 833.2 | 25 | 2.51 | 0.39 | 0.15 | 2.12 | 0.31 | 0.15 |
| I3 | 165.7 | 7.3 | 3.19 | 0.79 | 0.25 | 3.92 | 0.24 | 0.06 |


