Article

Monitoring Spatio-Temporal Distribution of Rice Planting Area in the Yangtze River Delta Region Using MODIS Images

1
Institute of Agricultural Remote Sensing & Information Application, Zhejiang University, Hangzhou 310058, China
2
School of Electronic and Information Engineering, Ningbo University of Technology, Ningbo 315016, China
*
Authors to whom correspondence should be addressed.
Remote Sens. 2015, 7(7), 8883-8905; https://doi.org/10.3390/rs70708883
Submission received: 10 January 2015 / Revised: 27 June 2015 / Accepted: 6 July 2015 / Published: 14 July 2015
(This article belongs to the Special Issue Recent Advances in Remote Sensing for Crop Growth Monitoring)

Abstract

:
A large-area map of the spatial distribution of rice is important for grain yield estimations, water management and an understanding of the biogeochemical cycling of carbon and nitrogen. In this paper, we developed the Normalized Weighted Difference Water Index (NWDWI) for identifying the unique characteristics of rice during the flooding and transplanting period. With the aid of the ASTER Global Digital Elevation Model and the phenological data observed at agrometeorological stations, the spatial distributions of single cropping rice and double cropping early and late rice in the Yangtze River Delta region were generated using the NWDWI and time-series Enhanced Vegetation Index data derived from MODIS/Terra data during the 2000–2010 period. The accuracy of the MODIS-derived rice planting area was validated against agricultural census data at the county level. The spatial accuracy was also tested based on a land use map and Landsat ETM+ data. The decision coefficients for county-level early and late rice were 0.560 and 0.619, respectively. The MODIS-derived area of late rice exhibited higher consistency with the census data during the 2000–2010 period. The algorithm could detect and monitor rice fields with different cropping patterns at the same site and is useful for generating spatial datasets of rice on a regional scale.

1. Introduction

Paddy rice fields provide essential food for more than half of the population of the entire world [1]. Rice is widely cultivated in Asian countries, especially China. Recent FAO (Food and Agricultural Organization) estimates indicate that to satisfy the projected demand of the year 2050, global agricultural production must increase 60 percent above the level of 2005–2007 [2]. Large-area assessments of potential food production regions and their impact on biogeochemical cycling require the acquisition of the best possible information on the distribution of paddy rice fields [3].
The official statistical data on rice sowing areas have been generated based on ground sample surveys and extrapolated to the provincial and national scales. Large-scale census data cannot provide accurate spatial distributions of paddy rice, and a time lag is present in the datasets. Huke developed Asian rice datasets using agricultural statistical datasets collected at the sub-country level [4]. Leff et al. generated a global rice map at a spatial resolution of five arcminutes as part of a global cropland product using satellite-derived land cover data and agricultural census data [5]. Frolking et al. generated 0.5°-resolution maps of the distribution of rice agriculture in mainland China using a combination of county-scale agricultural census data and land cover maps derived from Landsat images collected during the 1995–1996 period [3]. A thematic land use map of China at a scale of 1:100,000 was generated via the visual interpretation of Landsat TM (Thematic Mapper) data [6]. A classification system of 25 land use categories, including paddy rice, was used in this work. The land use map was converted to 1-km gridded data. However, more updated datasets of annual rice distribution with finer resolution are needed at the regional scale.
Approximately half of the cropland in China is multi-cropped each year, and this land has a significant influence on the biogeochemical cycling of carbon and nitrogen. To date, many studies have been conducted to map paddy rice using fine-resolution satellite images, such as Landsat MSS, TM, ETM+ and NOAA/AVHRR images, by applying image classification procedures, but few of these studies have provided detailed information regarding the locations of multi-cropping [7,8,9,10]. Furthermore, because of the fine resolution of these images, it is difficult to obtain more comprehensive images covering an entire region simultaneously over a large area. Rice distribution maps have also been produced via multi-temporal analysis of NOAA/AVHRR and SPOT4/VEGETATION data with a resolution of ~1 km, which is rather coarse for rice mapping [11,12,13].
The Moderate-Resolution Imaging Spectroradiometer (MODIS) aboard the Terra and Aqua satellites, with its advantages of a high revisit period, moderate spatial resolution, wide field of view (FOV) and free access, has been applied for paddy rice mapping. Decision tree algorithms and spectral matching techniques were used to map rice-growing areas using temporal MODIS data [14,15]. A MODIS time-series analysis of spectral indices was found to be more useful for monitoring the phenological variations of paddy rice over a long period [16,17]. A paddy rice field is typically prepared by flooding a few days before the rice seedlings are transplanted. The wet growing season is regarded as a unique and significant characteristic of rice compared with other crops [18]. Thus, the flooding period is recognized as the best phase for rice identification. Spectral indices and bands that are sensitive to water and green vegetation are needed for monitoring the flooding and transplanting period of rice crops. These spectral indices are always calculated using two or more spectral bands to enhance the contrast between target and background and to reduce the effects of the atmosphere and solar illumination geometry. The Normalized Difference Vegetation Index (NDVI), developed using the red and near-infrared bands, is correlated with the Leaf Area Index and chlorophyll content and has been widely used for crop yield estimations and the detection of changes in land use/cover [19,20]. The Enhanced Vegetation Index (EVI) was proposed because of the saturation of the NDVI in high-biomass regions to adjust for residual atmospheric contamination and background reflectance [21,22]. The infrared range is useful for estimating the water content of vegetation and in discriminating water from land. The Normalized Difference Water Index (NDWI) was developed using the reflectance in the near-infrared and green bands to enhance the detection of water features while eliminating soil and terrestrial vegetation features [23]. The modified NDWI (MNDWI) substitutes the near-infrared band with a middle-infrared band, such as Band 5 of Landsat TM, to efficiently enhance open-water signals and suppress or remove the signals from built-up land, as well as vegetation and soil [24]. However, because the reflectance of rice pixels during the flooding and transplanting stage is a mixture of water and vegetation, the sensitivity of the spectral index to flooding features should be further improved for rice mapping. The Land Surface Water Index (LSWI), which was formulated by combining the red and shortwave infrared channels of MODIS, has been used for the identification of rice pixels [25]. However, the threshold between the LSWI and the EVI was determined by considering local practices and rice cropping systems. Qiu et al. proposed a method for mapping rice planting areas by considering the vegetation phenology and surface water variations. The ratios of the changes in amplitude of the LSWI to the two-band Enhanced Vegetation Index 2 (EVI2) during the period from the tillering to the heading stage were used as one indicator to discriminate rice from non-rice fields [26]. Mosleh and Hassan developed a method for mapping “Boro” rice in Bangladesh using the MODIS-derived 16-day composite NDVI at a spatial resolution of 250 m [27]. The ISODATA clustering and the formulation of the mathematical model were the key procedures of this algorithm.
The objectives of the present study are to: (1) develop a Normalized Weighted Difference Water Index for identifying the flooding period of paddy rice fields; (2) map the early, single cropping and double cropping late rice distributions of the Yangtze River Delta region in the 2000–2010 period; and (3) validate the results using land use maps, Landsat ETM+ data and agricultural statistical data.

2. Study Area and Data
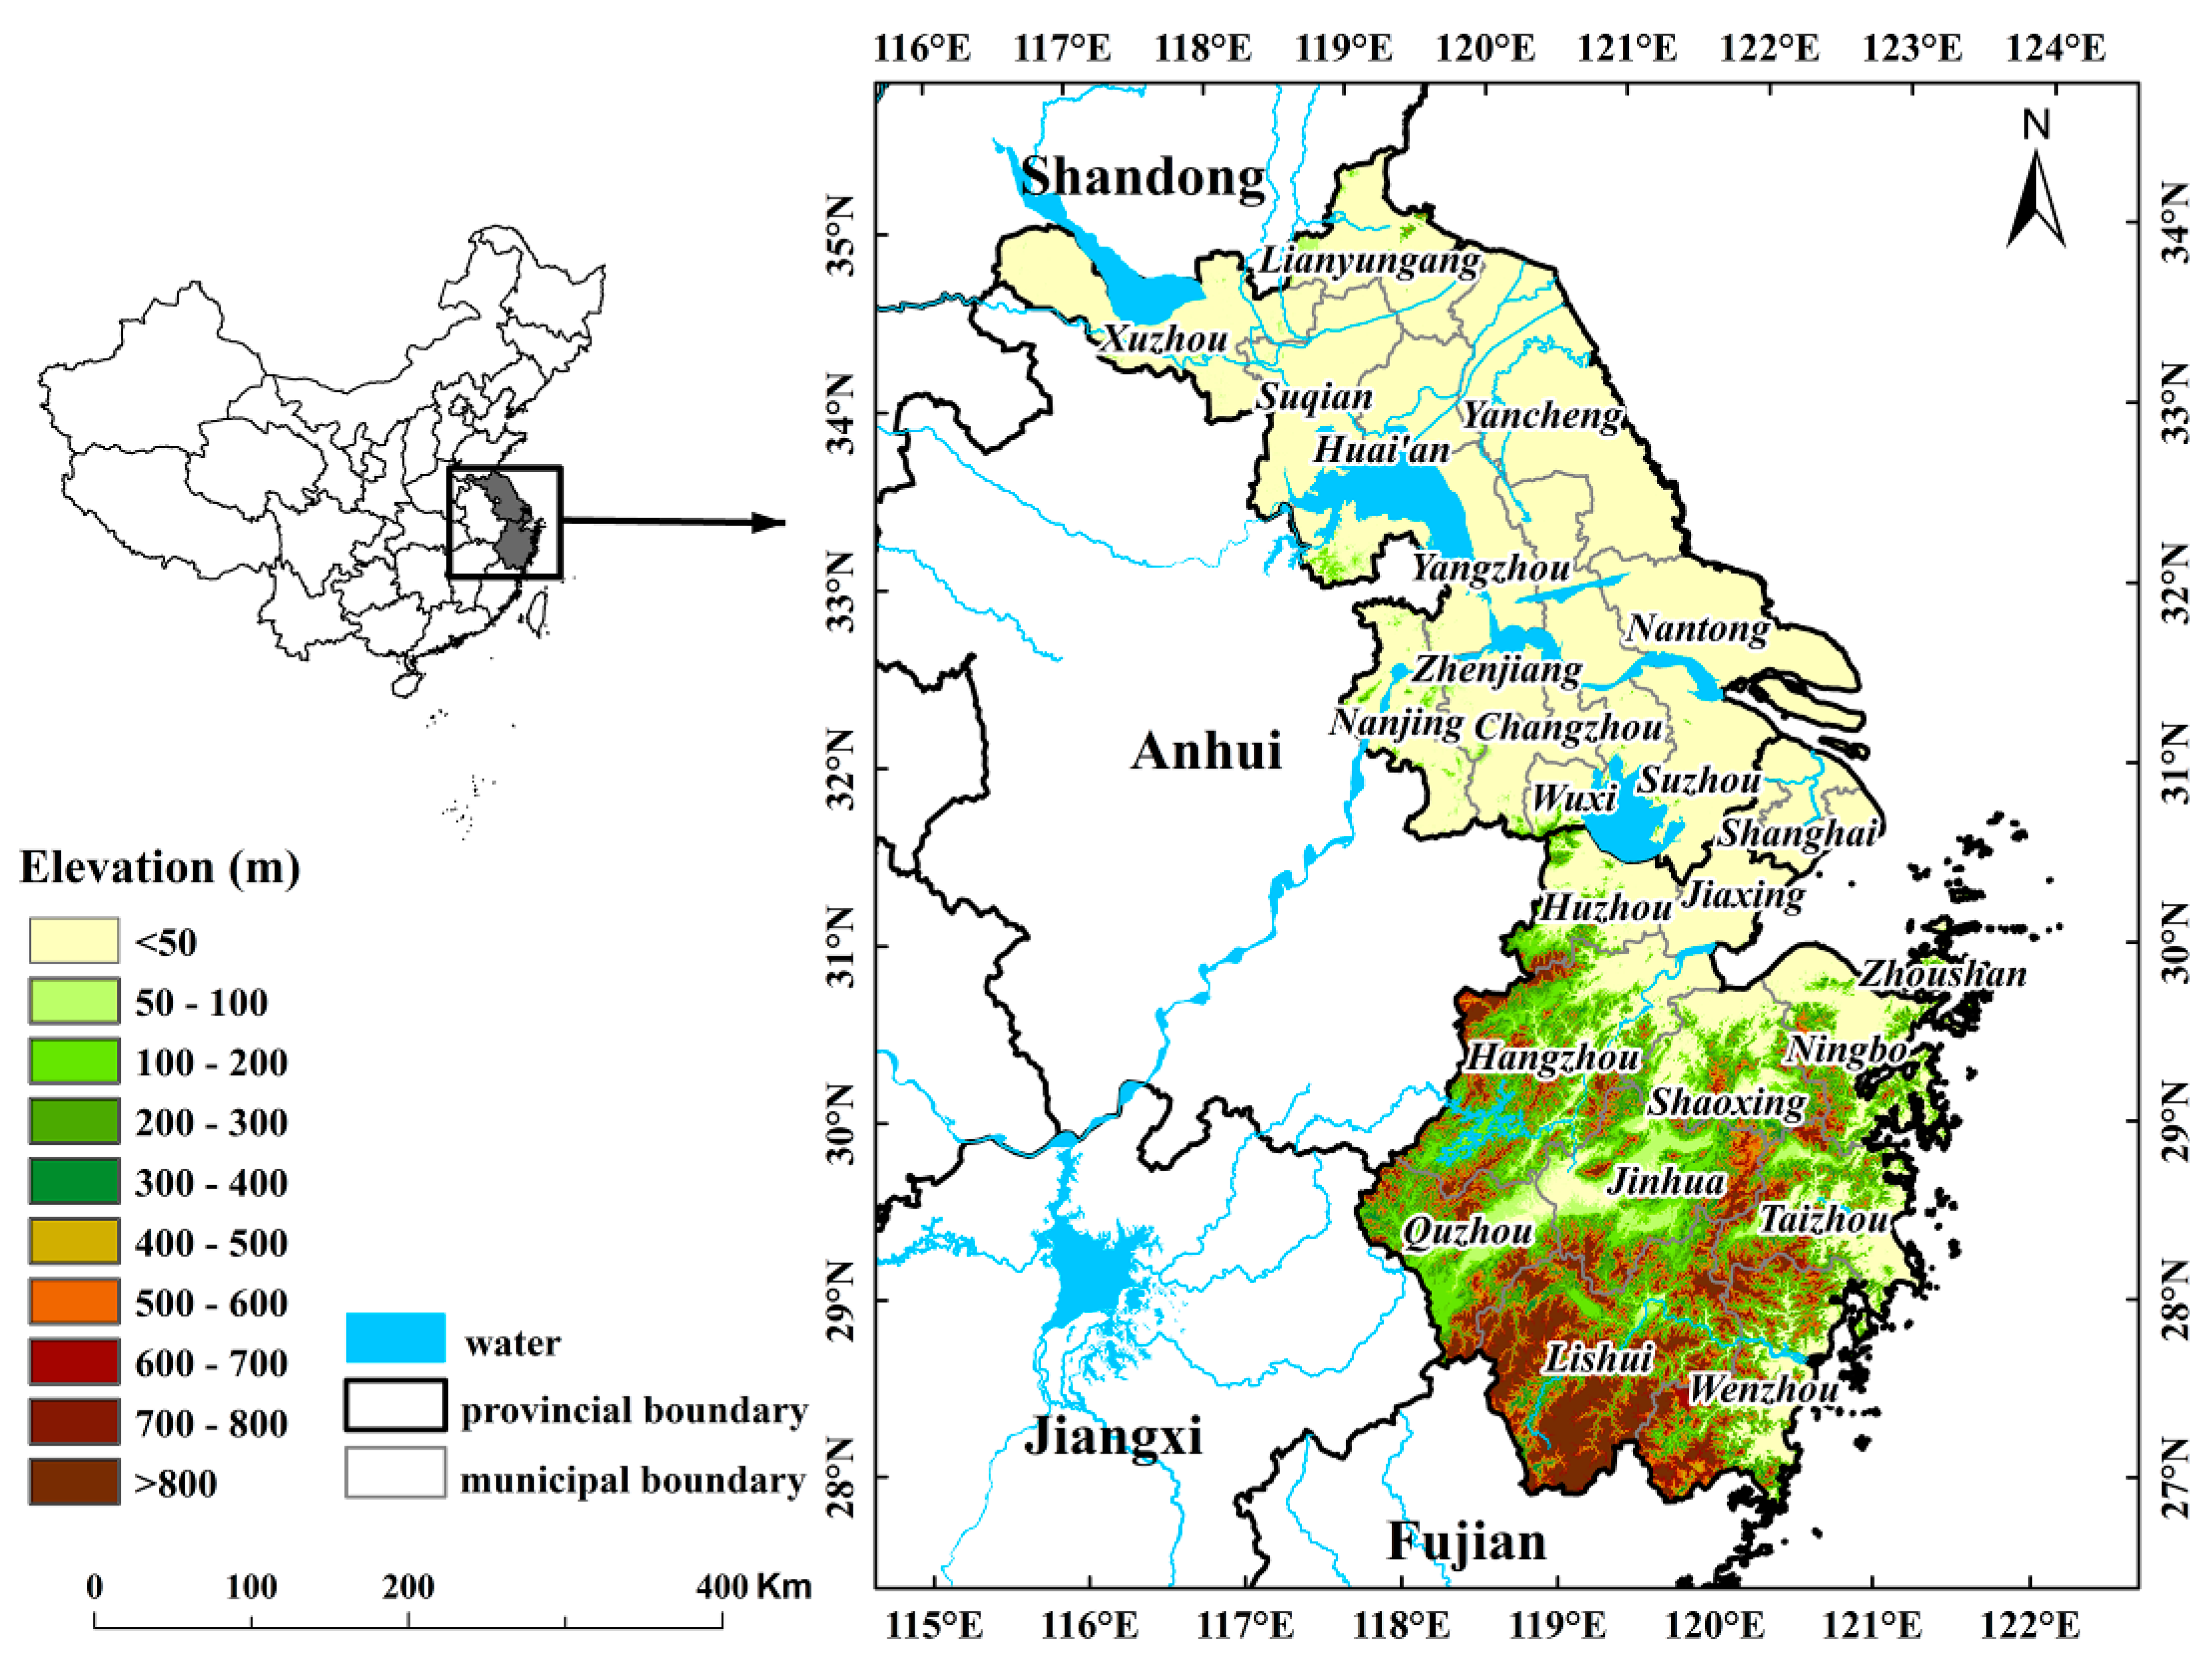
2.1. Study Area

The study area is the Yangtze River Delta region, which is one of the major rice-producing areas in China and spans three provinces (Figure 1). This region extends from 118°50ʹ5″E to 134°46ʹ26″E in longitude and from 38°43ʹ15″N to 53°33ʹ39″N in latitude, with a territory of 2.1 × 10⁵ km2. The climate of the Yangtze River Delta is humid subtropical and is largely controlled by the East Asian monsoon [28]. Rice is the major food crop in the study area, with a high level of production and a wide distribution. The cropping system in Jiangsu Province and Shanghai City consists essentially of one crop of rice and another crop of winter wheat or oil rape, whereas single and double rice cropping systems are the two major planting patterns in Zhejiang Province.
Figure 1. Location and ASTER Global Digital Elevation Model (GDEM) of the study area.
Remotesensing 07 08883 g001

2.2. Data Acquisition

2.2.1. Field Data

Field experiments can yield accurate data under controlled conditions. A field experiment was conducted at the Experimental Farm of Zhejiang University, Hangzhou, Zhejiang Province, from June to October in 2004. Two rice cultivars (i.e., Xieyou 9308 and Xiushui 110) were planted in 18 plots with three different nitrogen fertilization treatments: 0, 140 and 240 kg/ha. Each treatment was repeated three times. Rice seedlings were transplanted into the field on 8 July 2004, and the canopy reached full closure in August. The rice canopy reflectance of each plot was acquired using an Analytical Spectral Devices (ASD) Field Spec Pro Full Range (350–2500 nm) spectroradiometer on 20 July, 8 August, 28 August, 22 September, 5 October and 27 October. At each plot, 10 reflectance measurements were acquired with a nadir view of 25° from a height of 1.0 m above the rice. The spectrum of each plot was recorded as the average of the 10 measurements.

2.2.2. Satellite Data

The MODIS sensor records data in 36 spectral bands and products at spatial resolutions of 250 m, 500 m and 1000 m. In this study, MODIS/Terra eight-day composite surface reflectance products (MOD09A1) were chosen for the mapping of rice planting regions.
The eight-day composite surface reflectance products were routinely processed for atmospheric and radiometric correction for the effects of aerosols and cirrus clouds, as well as to select the best observation and the lowest value in the blue band for each pixel over the eight-day period [29]. Three tiles (h27v05, h27v06 and h28v06) for the 2000–2010 period were acquired from the project website (https://lpdaac.usgs.gov/). The downloaded MODIS data were then mosaicked and reprojected to Albers equal-area conic projection using the MODIS Reprojection Tool (MRT).
A Landsat ETM+ image acquired on 13 May 2000 (path/row: 118/41) was downloaded from the International Scientific Data Service Platform (http://datamirror.csdb.cn/). The region spanned by the image covers the main rice-producing zones in Wenzhou City. According to the phenological data recorded at the local agricultural meteorological station, rice seedlings were generally transplanted into the fields in early May. Radiometric calibration was applied to the Landsat ETM+ image. The fast line-of-sight atmospheric analysis of spectral hypercubes (FLAASH) model was selected for atmospheric correction. The Landsat ETM+ image was resized to a 90 km × 90 km subset and reprojected to the Albers equal-area conic projection.
In addition, ASTER Global Digital Elevation Model (GDEM) data covering the study area were freely obtained from the Earth Remote Sensing Data Analysis Center of Japan (http://gdem.ersdac.jspacesystems.or.jp/).

2.2.3. Ancillary Data

A digital administrative map of China was obtained from the National Fundamental Geographic Information System. A land use map of Wenzhou City in 2005 was obtained from the Land and Resources Bureau of Wenzhou City. The annual sowing areas of paddy rice for each county in the study area during the 2000–2010 period were provided by the bureau of statistics.

3. Methodology

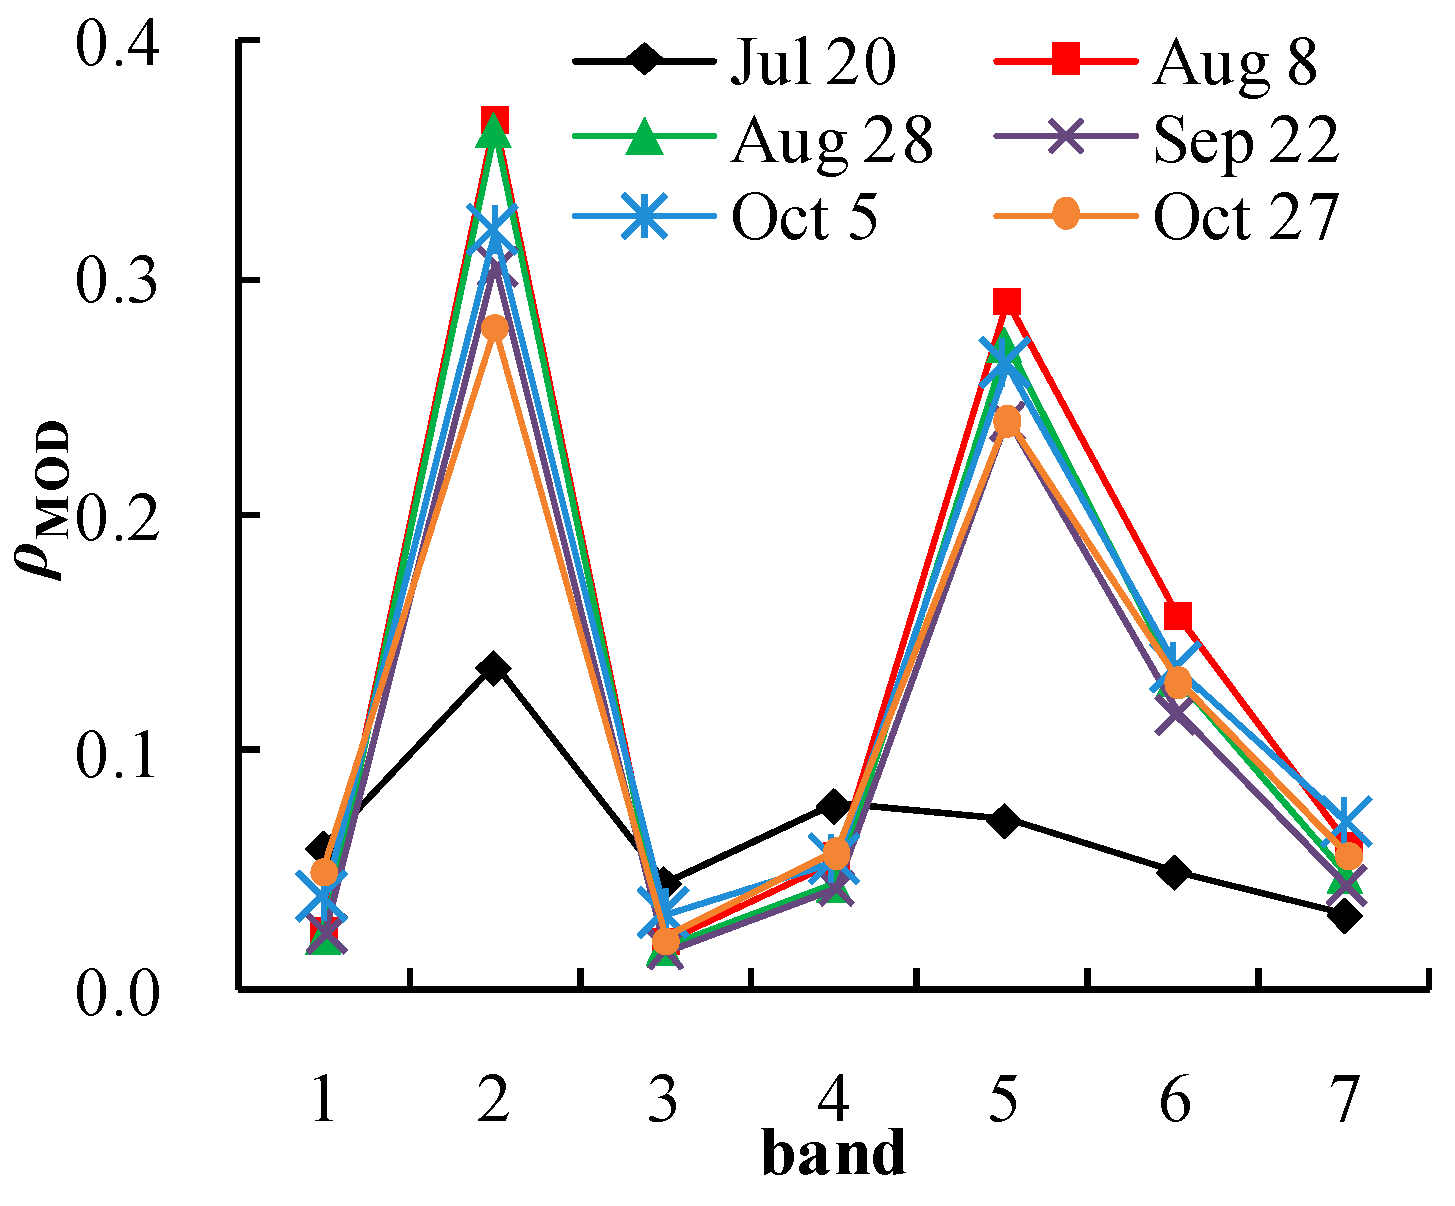
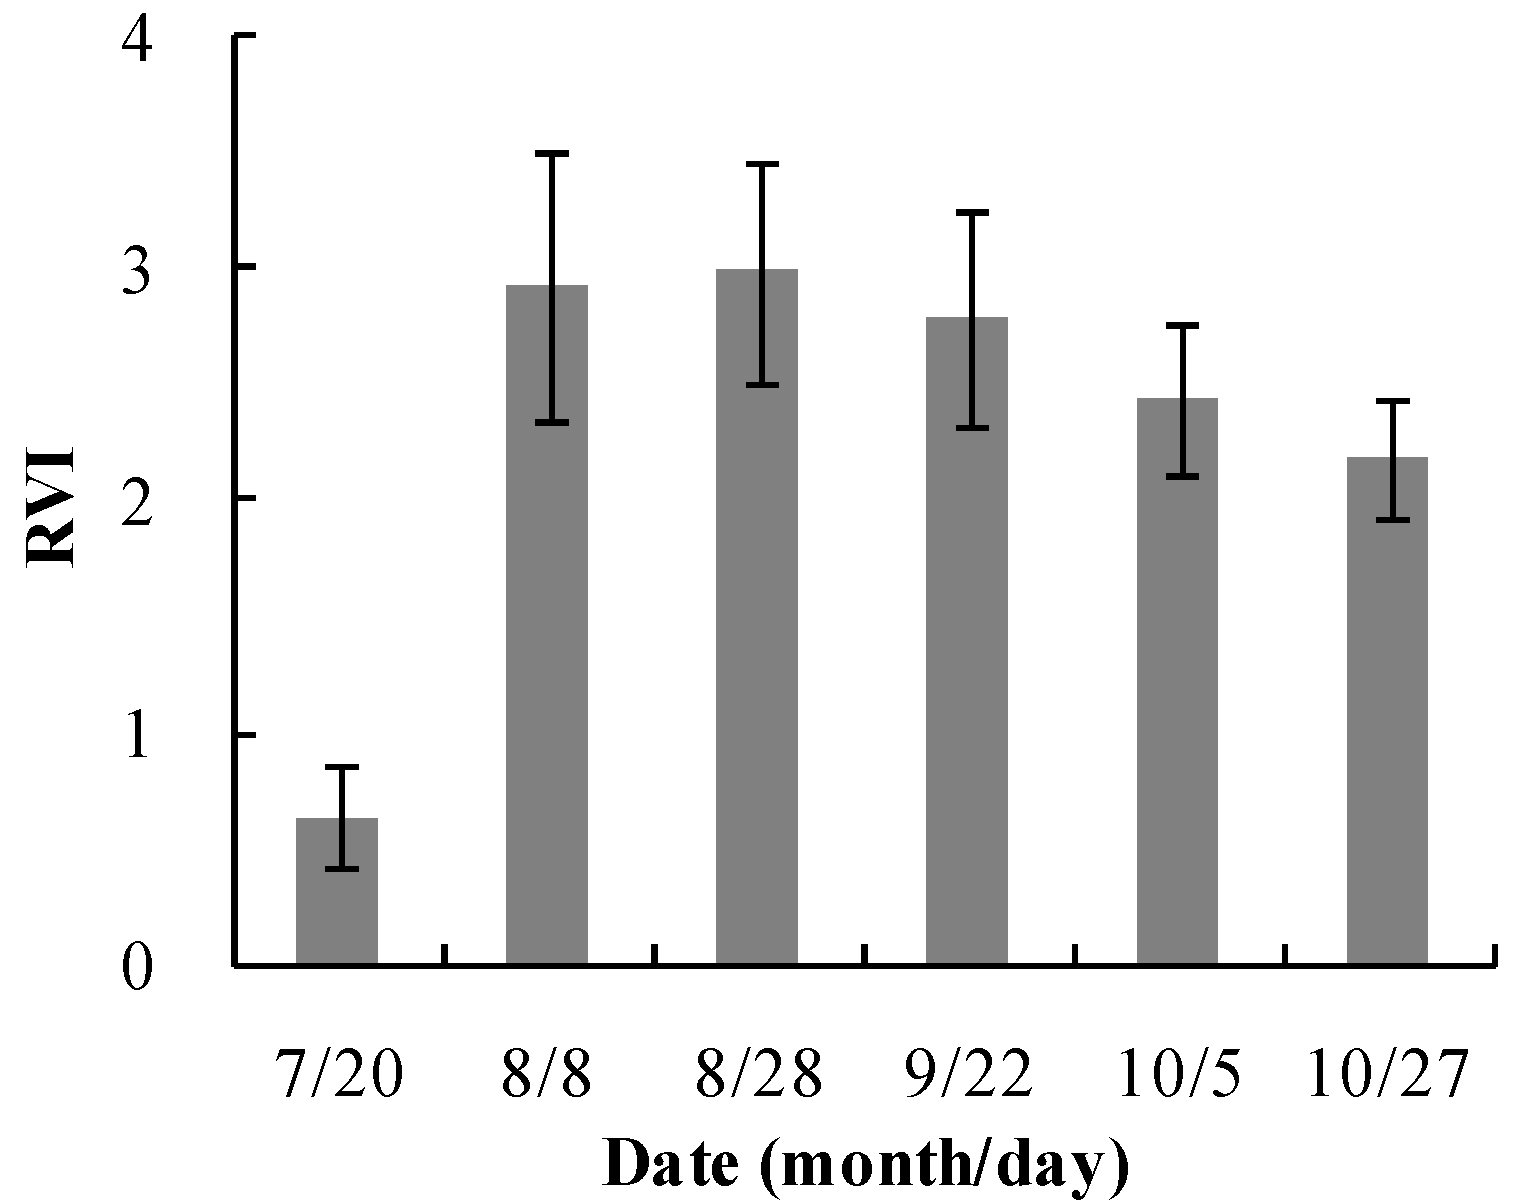
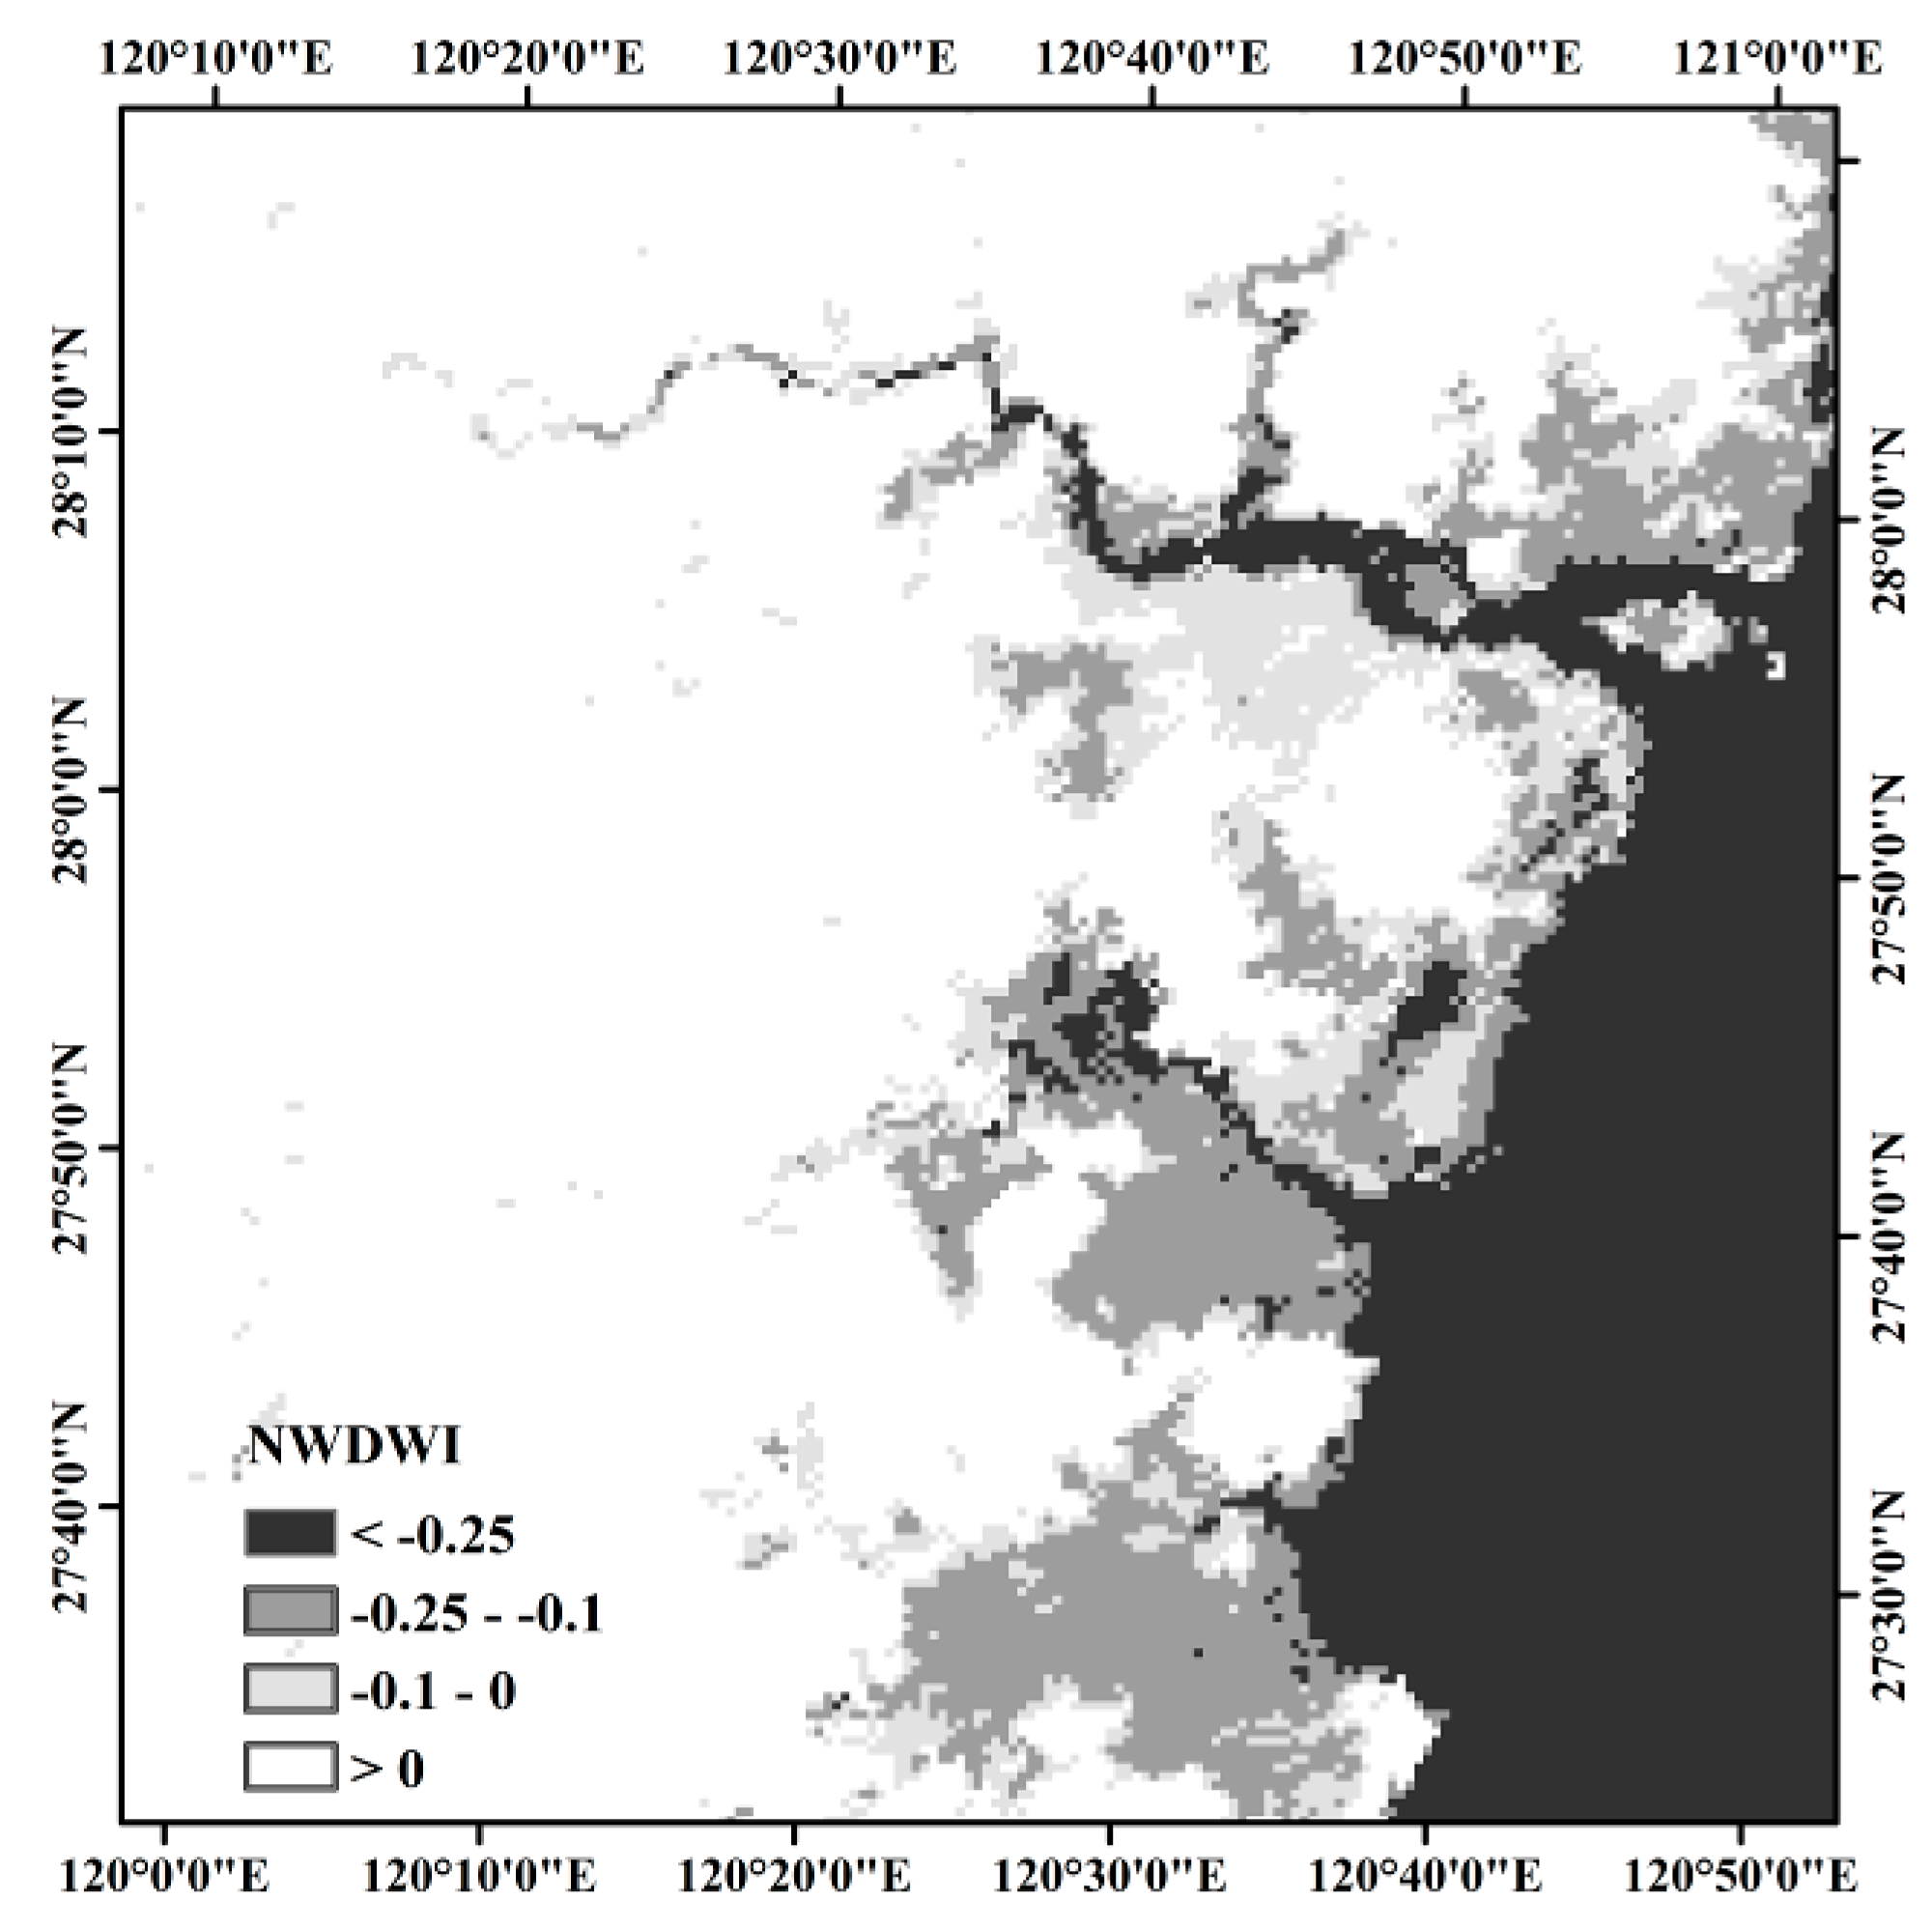
3.1. Spectral Characteristics of Rice during the Flooding and Transplanting Period

Canopy reflectance data collected in the field at a spectral resolution of 1 nm were used to simulate the reflectance in the first seven bands of the MODIS sensor (ρMOD) based on its spectral response function (Figure 2). The reflectance in the near-infrared and shortwave infrared wavelength bands was very low, whereas the reflectance in the visible bands (Bands 1, 3 and 4) was greater than in other growth periods. During the transplanting period, the water in the rice field was found to absorb most of the incident radiant flux, especially in the shortwave infrared region. It was also observed that the reflectance in Band 6 was lower than that in Band 4 (green band). With an increase in the tiller number and leaf area index, the reflectance in the visible bands decreased on 8 August 2004; however, the reflectance in the near-infrared and shortwave infrared bands increased significantly. The reflectance in Band 6 became higher than that in Band 4. In the previous literature, many water indices have been developed using the visible and infrared bands [23,24,25]. The green spectral range is highly sensitive to the Chl-a concentration over a wide range of variation and, thus, is helpful for the remote sensing of vegetation [30]. The near-infrared and shortwave infrared regions are the best wavelength regions for discriminating land from water. Because 1 of the 20 detectors in Terra MODIS Band 5 is noisy, there are stripes in the image. Band 6 was selected as the band sensitive to water, and Band 4 was used as the band sensitive to the presence of green seedlings.
Xu proposed the MNDWI (Equation (1)) to enhance the features of open water in remotely-sensed imagery [24]. Water pixels will have positive values of this index; however, pixels corresponding to flooded rice fields, built-up land and vegetation will have negative values. To enhance the features of rice pixels in the transplanting stage, we introduced a weight in the green band. Thus, we developed a Normalized Weighted Difference Water Index (NWDWI) based on the MNDWI. The ρband4 and ρband6 values described in Equation (2) denote the reflectances in MODIS Bands 4 and 6, respectively. A threshold of zero was applied to the NWDWI to separate flooded rice pixels from vegetation pixels. As shown in Equation (3), the values of the Ratio Vegetation Index (RVI) during different rice growth periods were calculated using the ρMOD values of Bands 6 and 4. Figure 3 shows that the RVI was the lowest during the transplanting stage and reached its peak at the heading stage, after which the RVI slowly deceased.
MNDWI= ρ green ρ MIR ρ green + ρ MIR
NWDWI= ρ band 6 a ρ band4 ρ band 6 + a ρ band4
RVI=  ρ band6   ρ band4
Figure 2. Simulated MODIS reflectances throughout the entire growth cycle of rice.
Remotesensing 07 08883 g002
Figure 3. Statistical analysis of the Ratio Vegetation Index (RVI) throughout the entire growth cycle of a rice paddy in the field.
Remotesensing 07 08883 g003
The acquisition date of the ETM+ image was consistent with the flooding and transplanting date for rice in Wenzhou, Zhejiang Province. Figure 4 is a false-color composite image of the ETM+ data. The paddy rice binary map was obtained from the ETM+ image using the maximum likelihood method and then degraded to the same resolution as the MODIS data using the pixel aggregate method. Because the overpass time of Landsat 7 is close to that of Terra, the aggregated rice map could be used as ground-truth data for validation. The MOD09A1 data (day of year: 2000129) were used to validate the performance of the NWDWI. When a = 1, flooded rice field and vegetation pixels both had positive NWDWI values. When a = 1.5, 54.8% of the rice pixels had negative values, and 21.2% of the negative pixels in the MODIS-derived NWDWI image were labeled as rice pixels in the reference map. When a = 2, approximately 91.4% of the rice pixels had negative NWDWI values, and 24.7% of the negative pixels in the MODIS-derived NWDWI image were labeled as rice pixels in the reference map. The results of a simple density slice classification for the NWDWI (a = 2) demonstrated its ability to discriminate water pixels (Figure 5). In the ocean areas, the pixels had the lowest NWDWI values, whereas in the non-water areas, the pixels had positive values. In a comparison with the rice map derived from the ETM+ image, the omitted rice pixels were mainly distributed at the edges of the rice fields because of the mixed-pixel phenomenon and the uncertainty of edge pixels near large tracts of rice fields. When a = 2.5, approximately 98.5% of the rice pixels had negative NWDWI values. However, there were only 18.1% of pixels with negative values in the NWDWI image labeled as rice pixels in the reference map. Many of the forest, shrub and bare land pixels had negative value, as well as flooded rice pixels. Figure 3 also shows that the RVI was greater than 2 from the tillering stage to the harvest stage. Therefore, when a = 2, NWDWI ≤0 can be used to identify possible flooded rice pixels. Figure 5 also indicates that built-up pixels and pixels corresponding to natural water bodies also had low NWDWI values, which should allow them to be distinguished from rice pixels.
Figure 4. Color composite image of ETM+ data at the test site (R: Band 5; G: Band 4; B: Band 3).
Remotesensing 07 08883 g004
Figure 5. Spatial Normalized Weighted Difference Water Index (NWDWI) distribution of the MODIS image.
Remotesensing 07 08883 g005

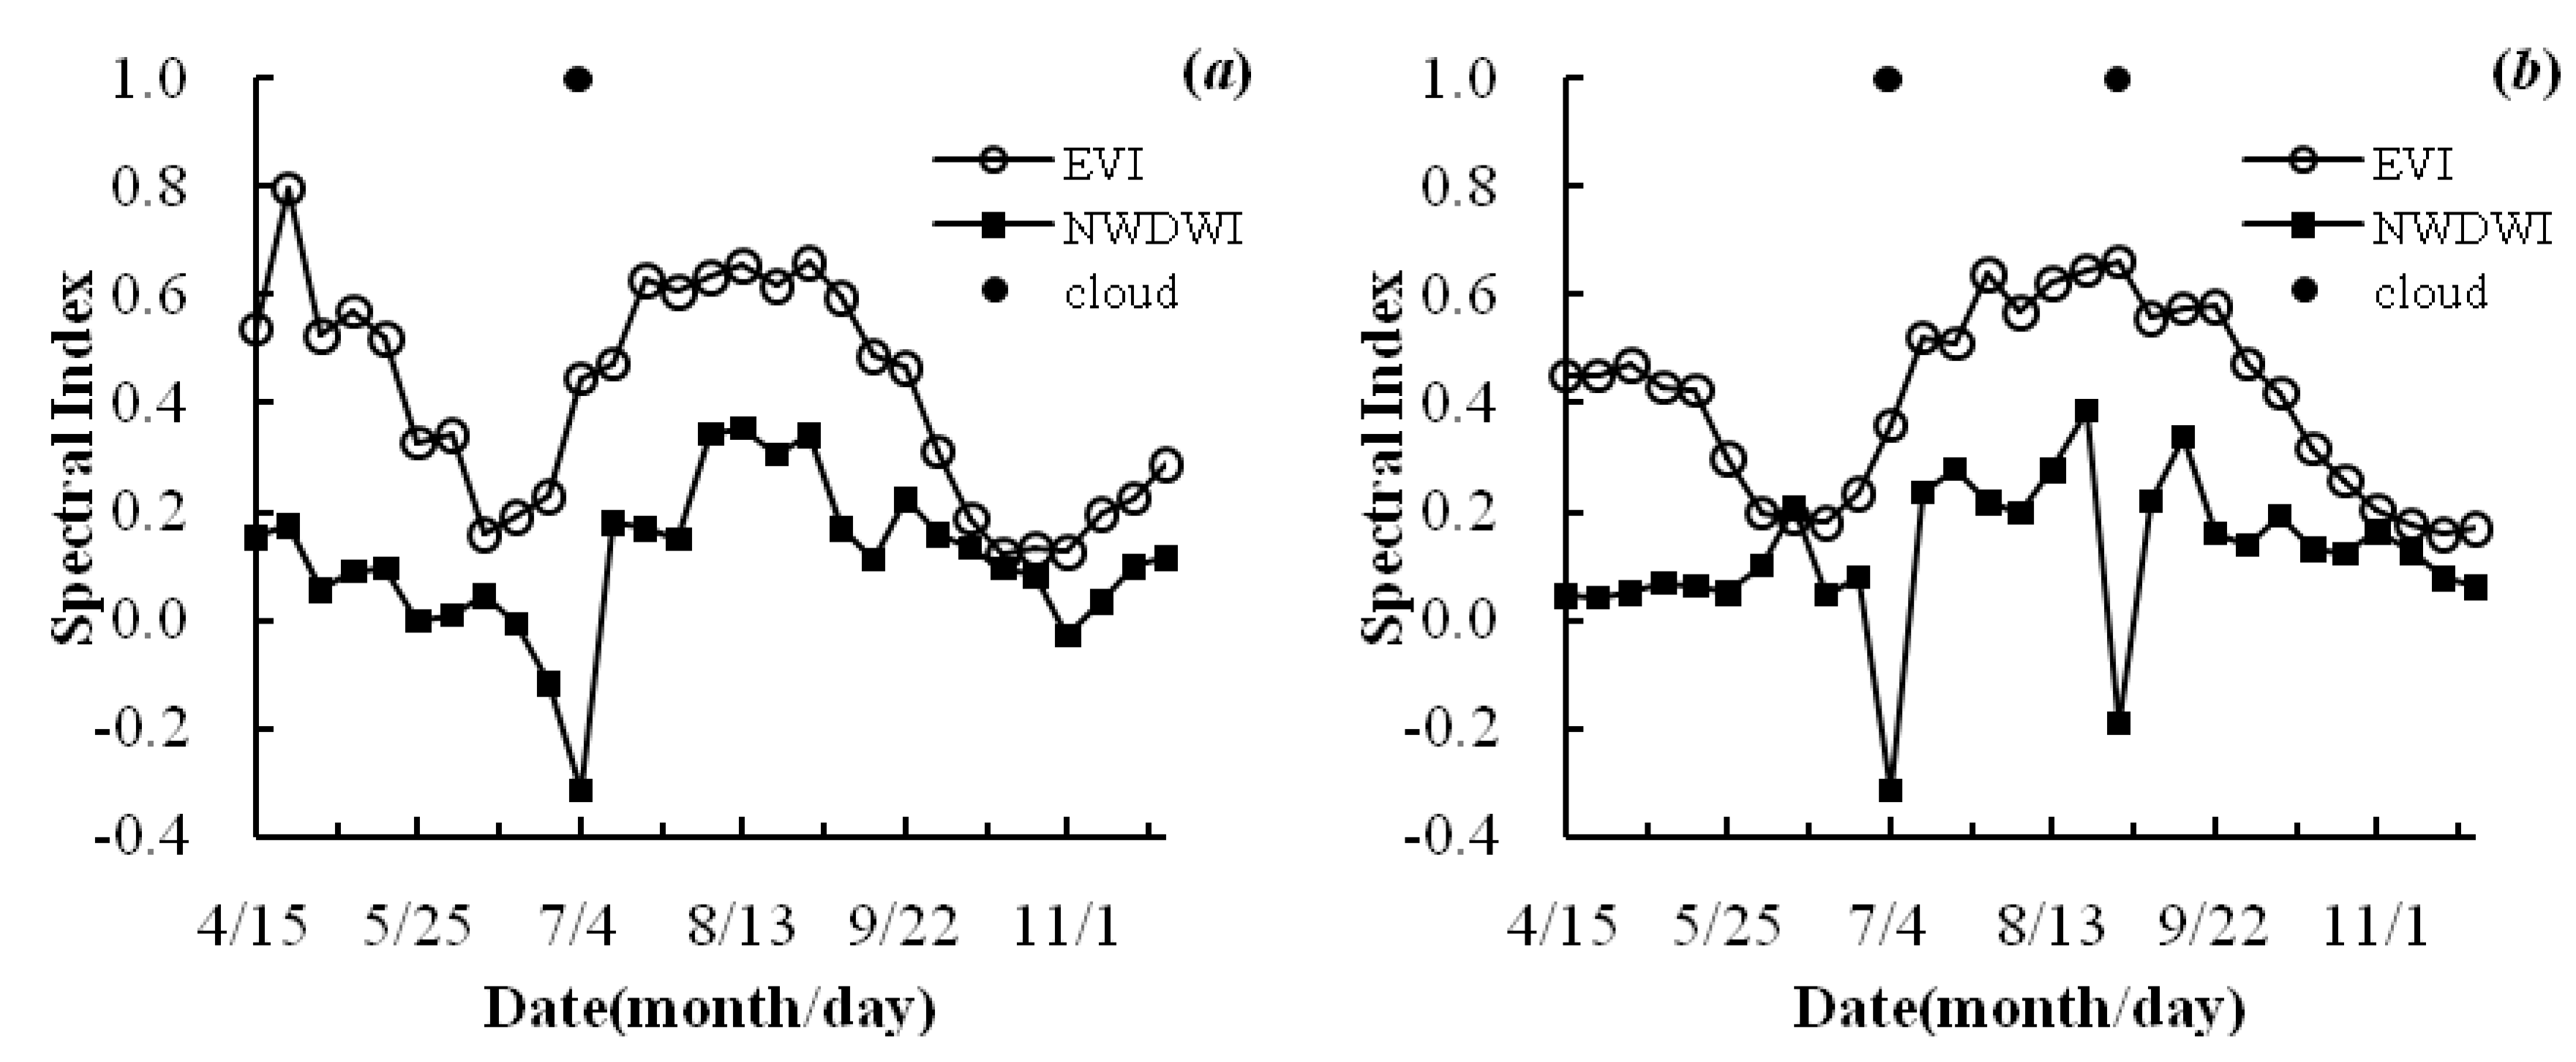
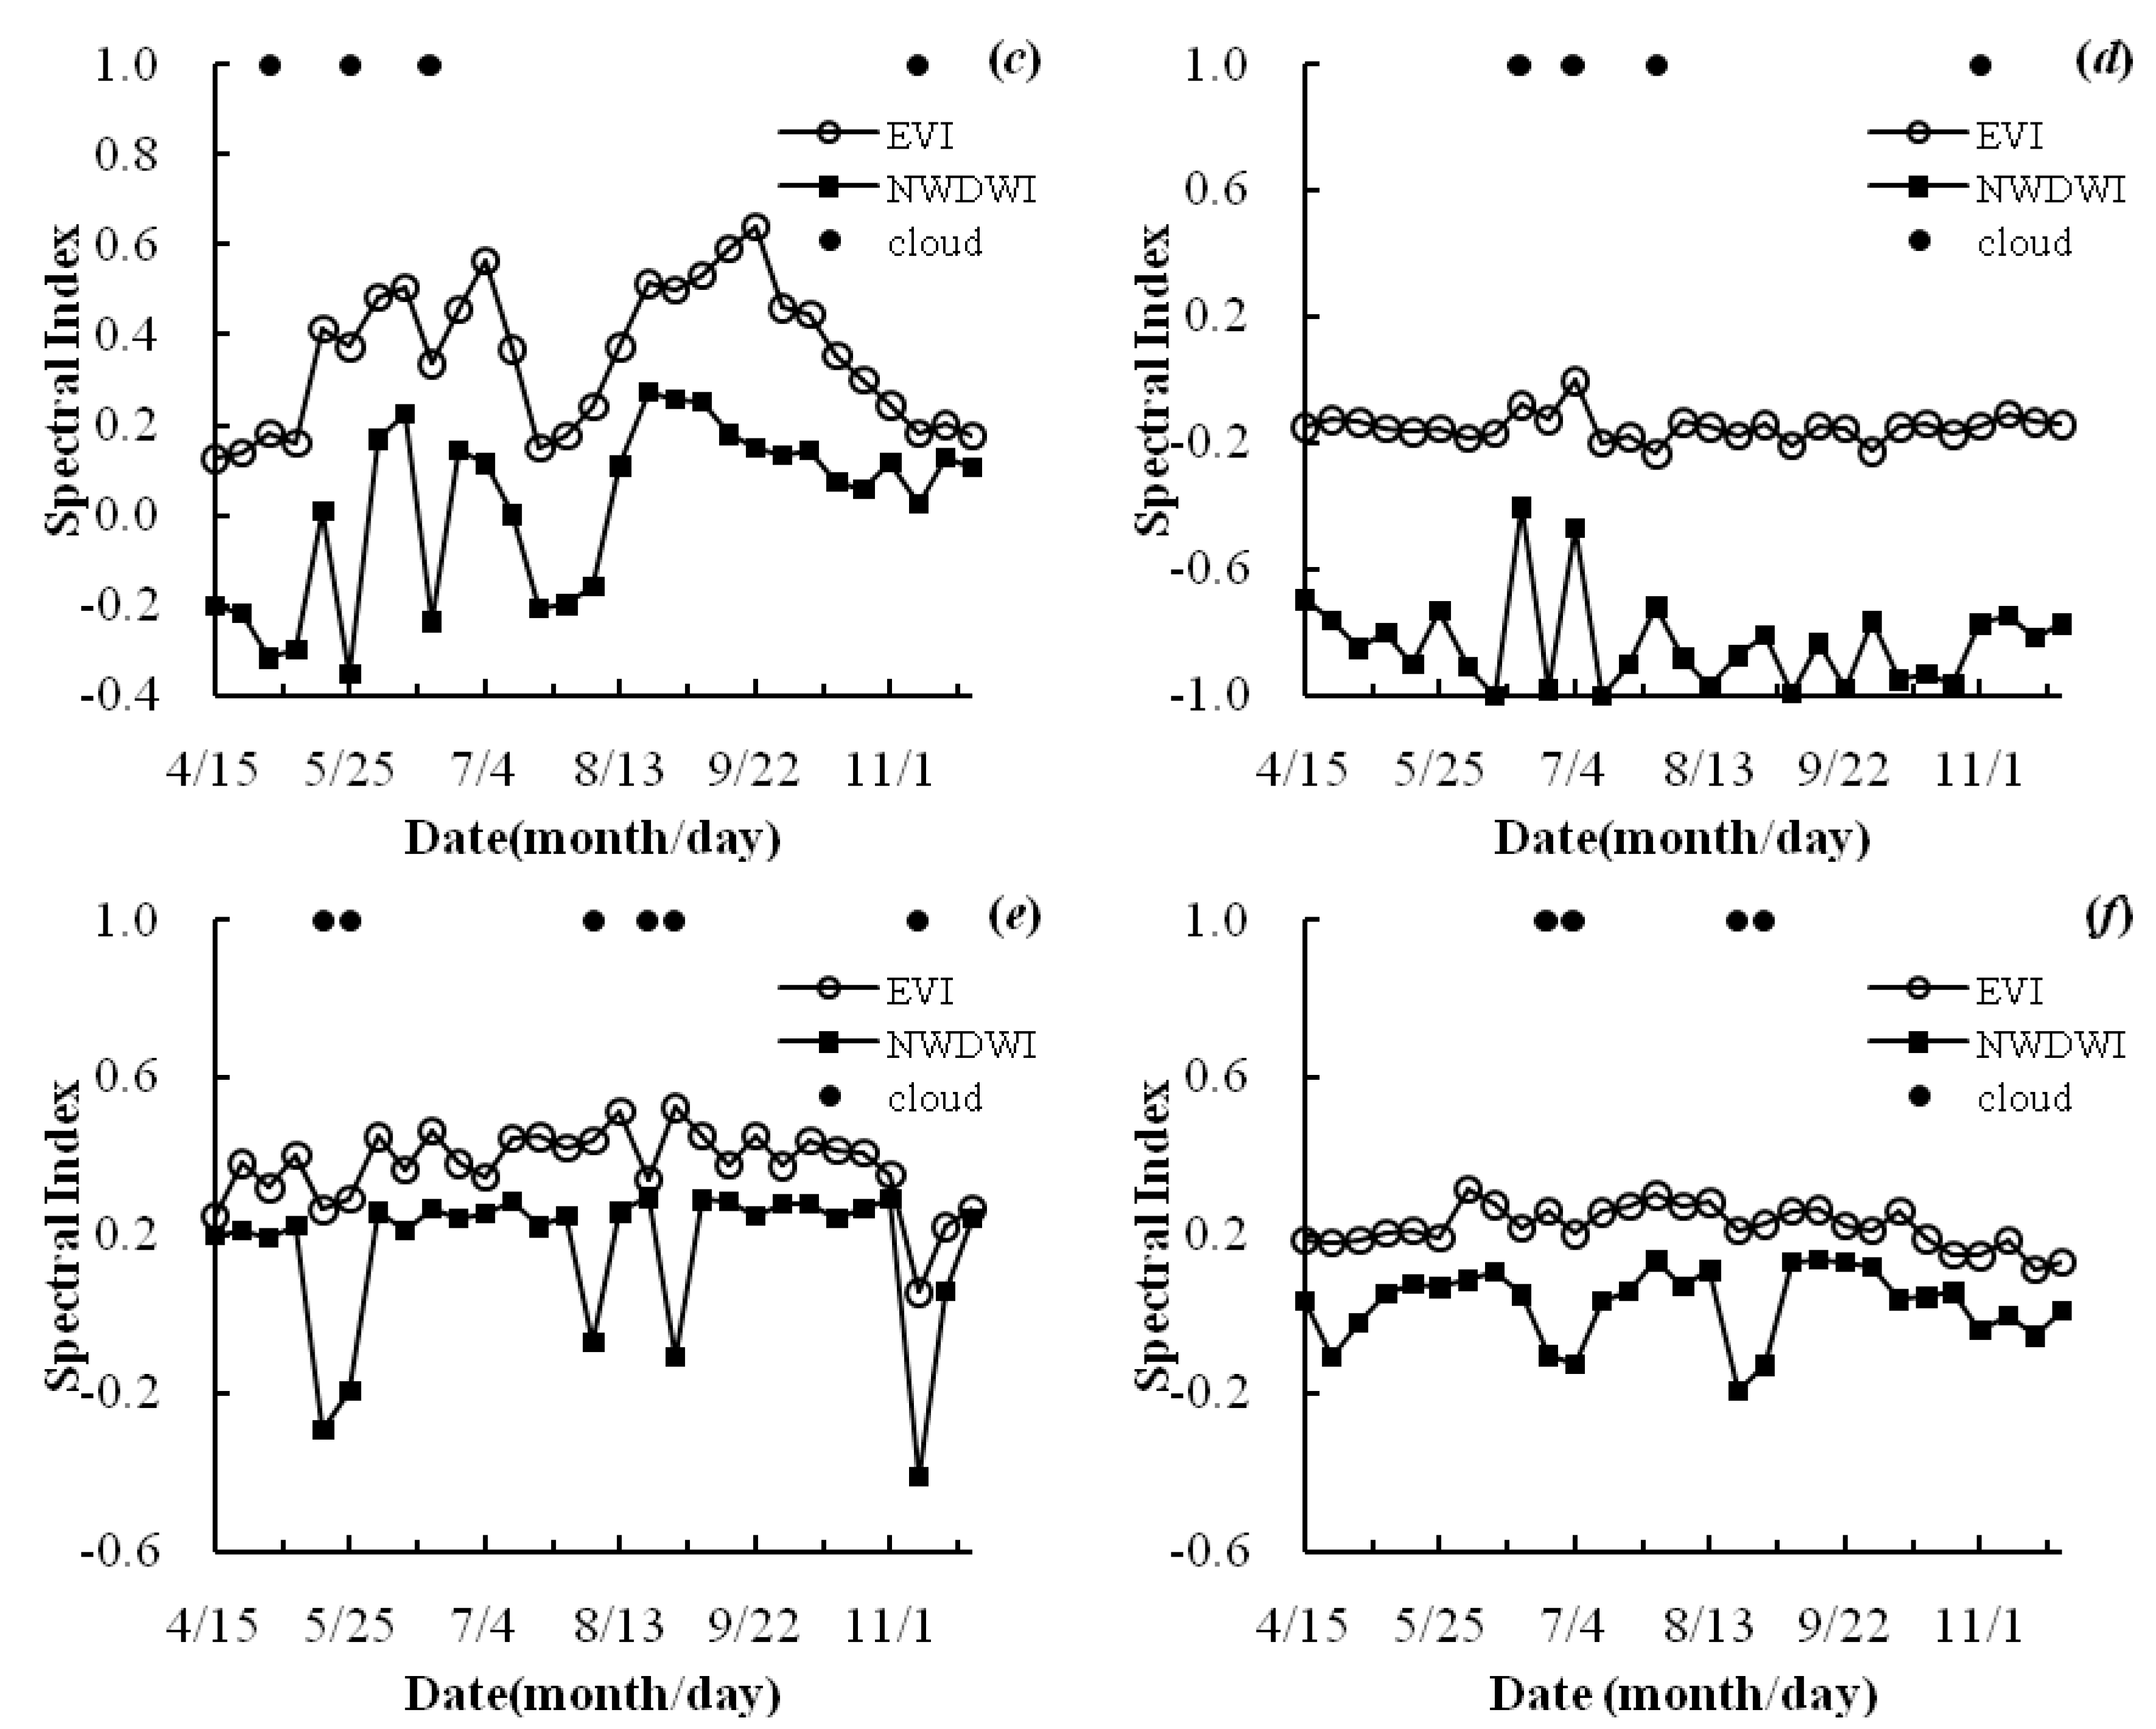
3.2. Reconstruction of the Spectral Index Profile

Although the 8-day composite surface reflectance data were routinely processed, some pixels were still affected by clouds. The pixels with Band 3 reflectances of greater than 10% were labeled as cloud pixels and removed as abnormal data [16]. Cloud masks for each MOD09A1 image were generated individually. Cloud-free data are important requirements for the operational monitoring of rice distributions using optical sensors [31]. To fill in the gaps in the EVI and NWDWI time series caused by clouds, the conditional temporal interpolation method was used in this study [32]. Compared with wavelet analysis and the Savitzky–Golay filter, the advantage of this method is its ability to retain the values of good pixels and repair the bad ones using valid pixels in the previous and subsequent images. If a pixel was contaminated in all three adjacent images, it was removed for further analysis.

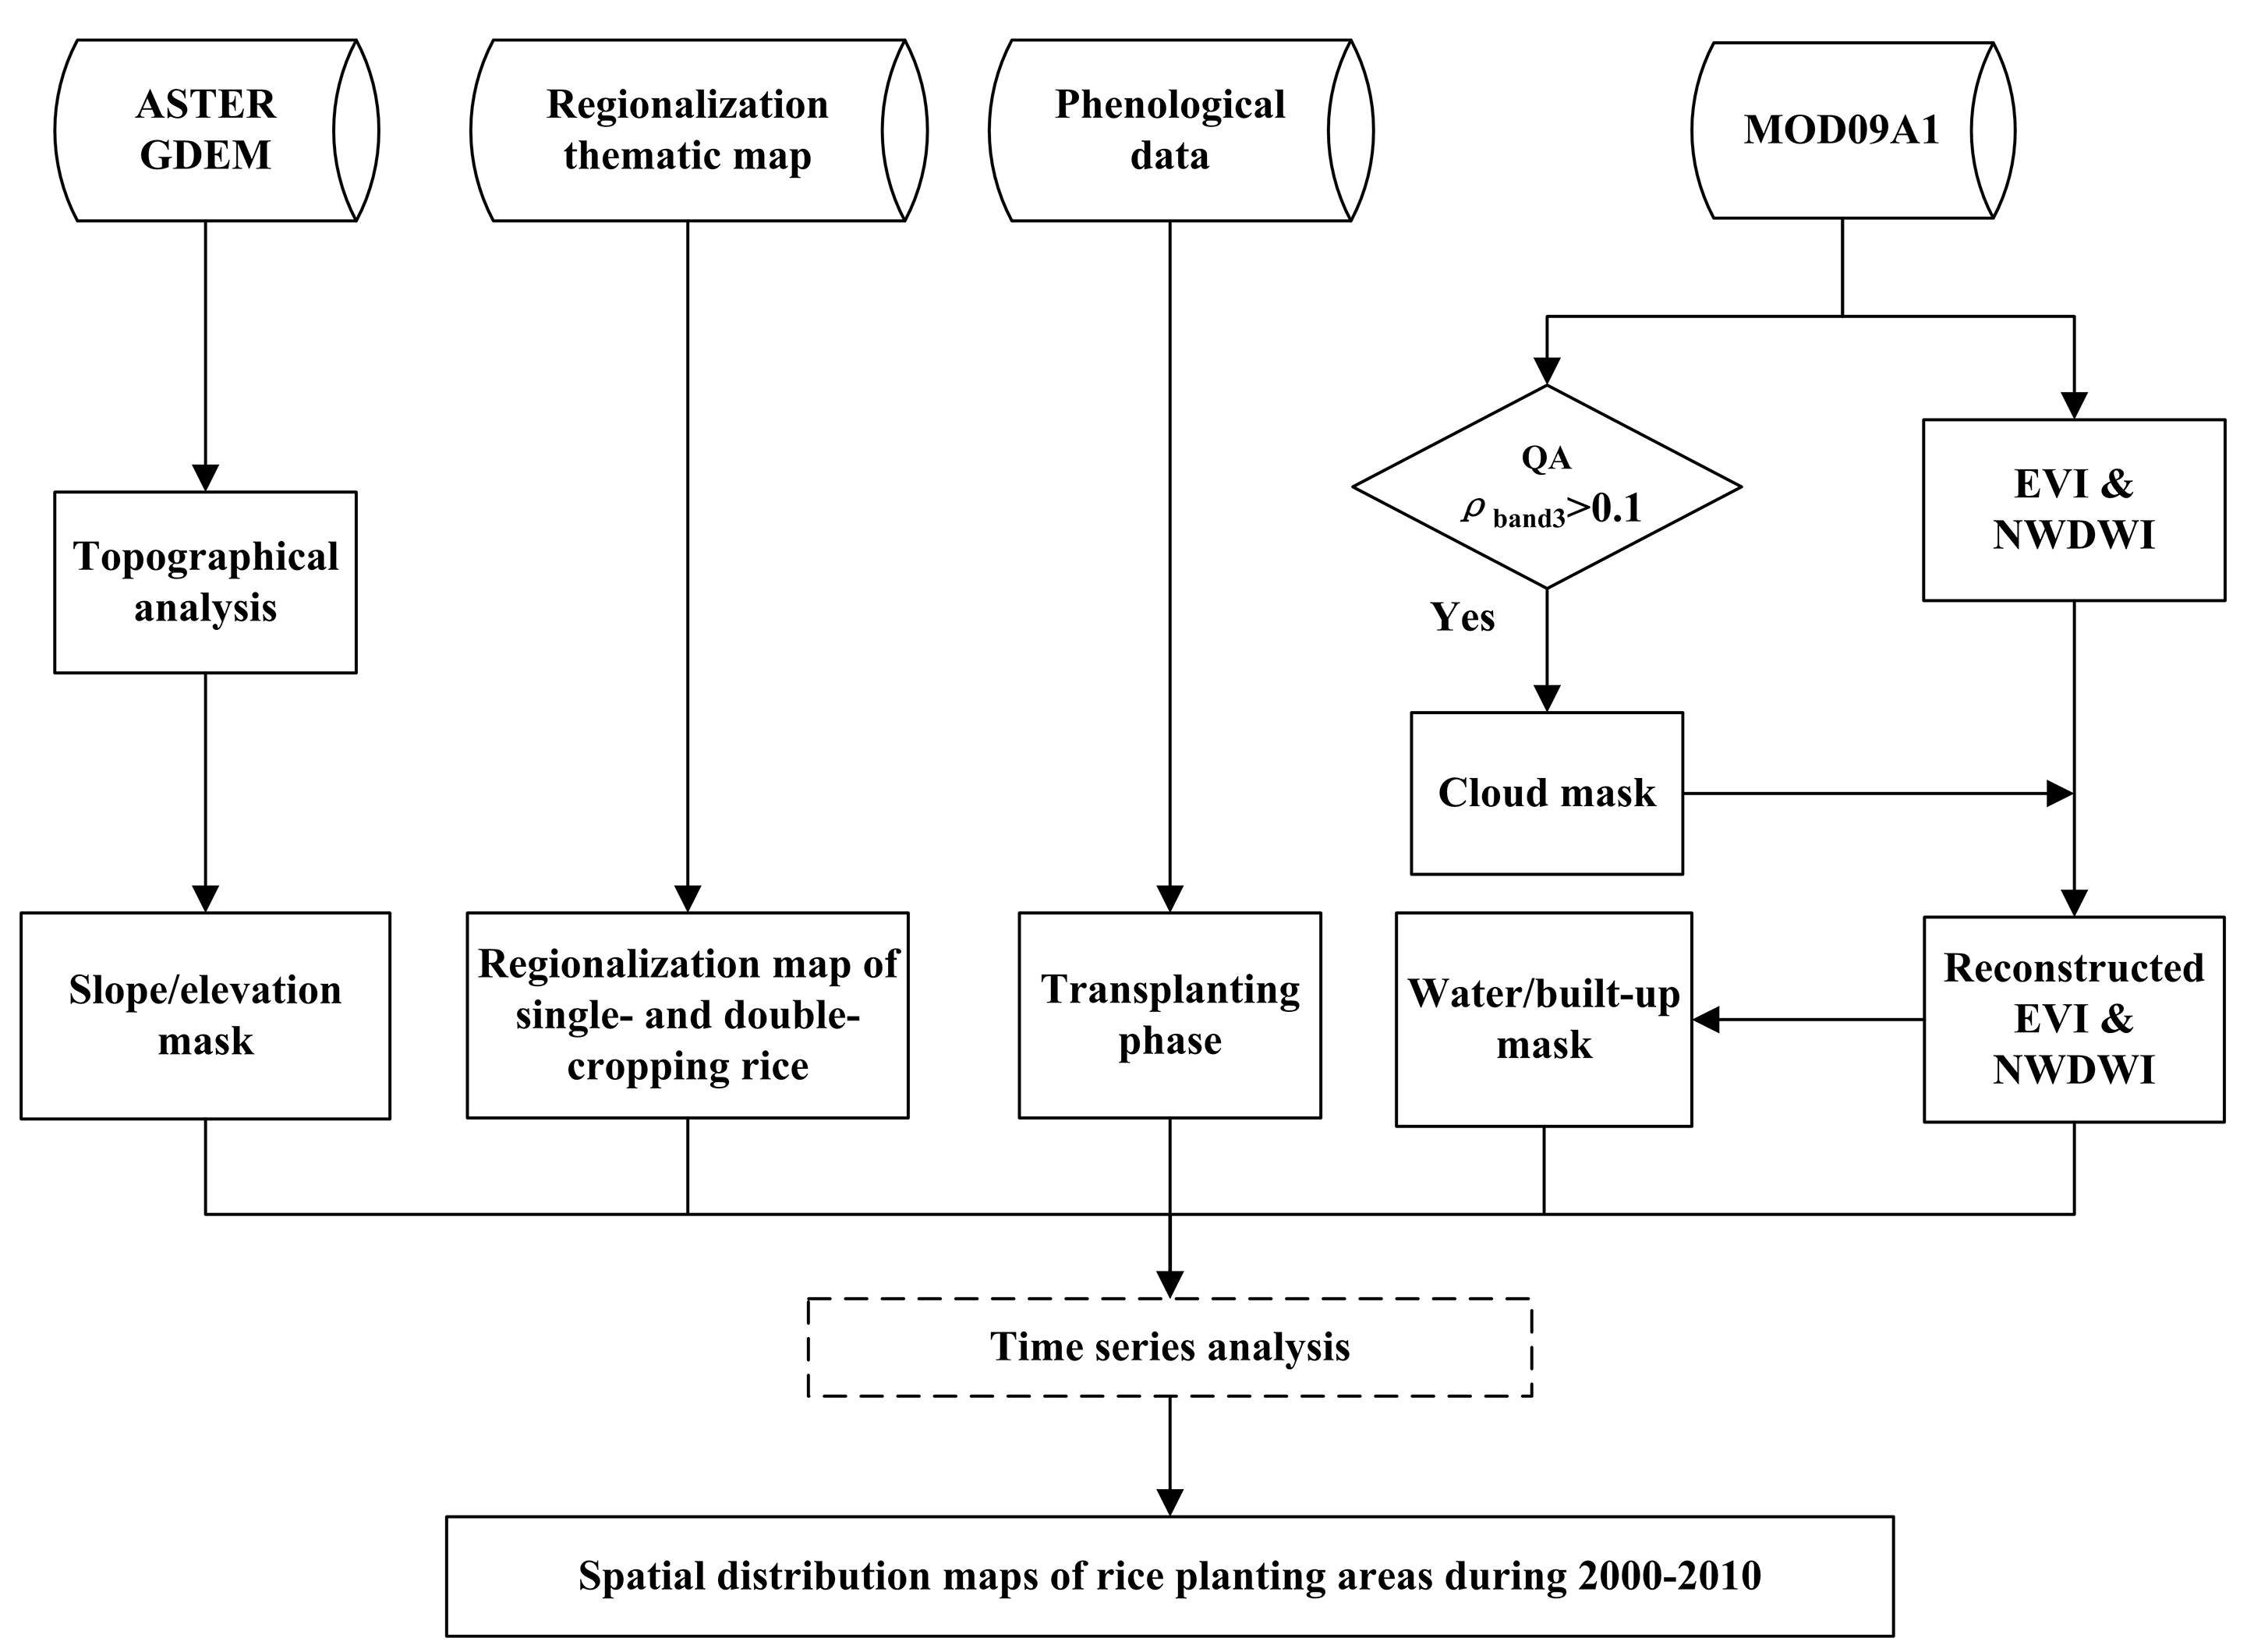
3.3. Algorithm for Mapping Rice Planting Areas Using Time Series MODIS Data

The Yangtze River Delta region can be separated into two zones: one is the single rice planting area, including Jiangsu and Shanghai, and the other is Zhejiang Province [33]. In hilly regions, the elevation and slope are considered to be two important geographical factors for improving the accuracy and stability of classification in rice mapping [34]. In the study area, rice is grown in regions with elevations of less than 800 m and slopes of less than 10°; thus, the elevation and slope were used to exclude non-paddy rice regions.
According to the rice growth calendar for the period of 2000–2010 collected from agrometeorological stations, the transplanting stages for early rice, single cropping rice and double cropping late rice occurred in late April–early May, mid-June–early July and mid-to-late July, respectively. The MODIS data corresponding to the transplanting periods were used to identify flooded rice pixels using the NWDWI to reduce the interference of other wetland plants or crops with short-term precipitation.
The time series of spectral indices are essential for analyzing the annual variability of vegetation activityFigure 6 shows the seasonal EVI and NWDWI profiles of various types of land cover in 2005. Figure 6a–c shows the seasonal spectral index profiles of three major cropping systems in the Yangtze River Delta region. It is obvious that the NWDWI decreased significantly when a pixel was labeled as a cloud pixel. The time series of the EVI and NWDWI revealed the growth stages of the crops. When the rice seedlings were transplanted into the field, the NWDWI was less than zero, because the reflectance of the rice pixels was dominated by water. However, the seasonal NWDWIs of rain-fed crops maintained consistently positive values. Forests in the study area exhibited high EVI and NWDWI values throughout the entire growth period (Figure 6e). Natural water and built-up pixels could be distinguished by their long periods of consistently low NWDWI and EVI values. In the study area, 40 single cropping rice samples and 35 double cropping rice samples were selected to perform a decision tree classification algorithm for mapping the planting areas of early, single cropping and double cropping late rice. For early rice, a pixel with a negative NWDWI and EVI <0.26 was labeled as a potential rice pixel during the transplanting stage. According to the characteristics of the growth period of early rice, the maximum EVI throughout the entire growth period was greater than 0.35, and the EVI decreased below 0.35 in the eleventh 8-day period after that identified as the transplanting stage. Because of the longer growth period of single cropping rice, the EVI decreased to less than 0.35 in the fifteenth 8-day period after the rice seedlings were transplanted. Late rice was transplanted to the same field after the early rice was harvested. If a pixel had NWDWI <0.05 and EVI <0.35, it was recognized as a transplanted rice pixel. The maximum EVI throughout the entire growth period was higher than 0.35, and in the twelfth 8-day period after the transplanting stage, the EVI decreased below 0.35. Natural water bodies and built-up pixels could be excluded by removing pixels with an EVI that was less than 0.3 for fourteen consecutive 8-day periods between April and September. Figure 7 shows the decision tree for the mapping of single cropping, early and double cropping late rice planting areas. Finally, the spatial distribution maps of early, single cropping and double cropping late rice were generated.
Figure 6. Spectral index time series corresponding to various types of land cover at the test sites in 2005: (a) winter wheat and single cropping rice, (b) winter wheat and rain-fed crops, (c) early and late rice, (d) lakes, (e) forests and (f) built-up regions.
Remotesensing 07 08883 g006aRemotesensing 07 08883 g006b
Figure 7. Flow chart for the extraction of rice planting regions.
Remotesensing 07 08883 g007

3.4. Accuracy Assessment

The classification results for the Landsat ETM+ imagery at the studied site were used as the reference rice map for validation. An error confusion matrix was applied to evaluate the agreement of the MODIS-derived rice map with the reference rice map. The commission error, omission error, user’s accuracy and producer’s accuracy were calculated as follows:
Commission error (%) = N commit N MODIS × 100 %
User’s accuracy (%) = 100 − commission error
Omission error (%) = N omit N ETM × 100 %
Producer’s accuracy (%) = 100 − omission error
Here, Ncommit and Nomit represent the numbers of committed and omitted rice pixels, respectively, in the MODIS-derived result, and NMODIS and NETM represent the numbers of rice pixels in the MODIS-derived map and the aggregated reference rice map, respectively.
The error matrix was analyzed at the pixel level. Furthermore, because of the edge effects originating from the spatial aggregation of the ETM+ data and the geometric mismatch between the ETM+ and MODIS data, the error matrix was calculated using a 3 × 3 moving window [35].

4. Results and Discussion

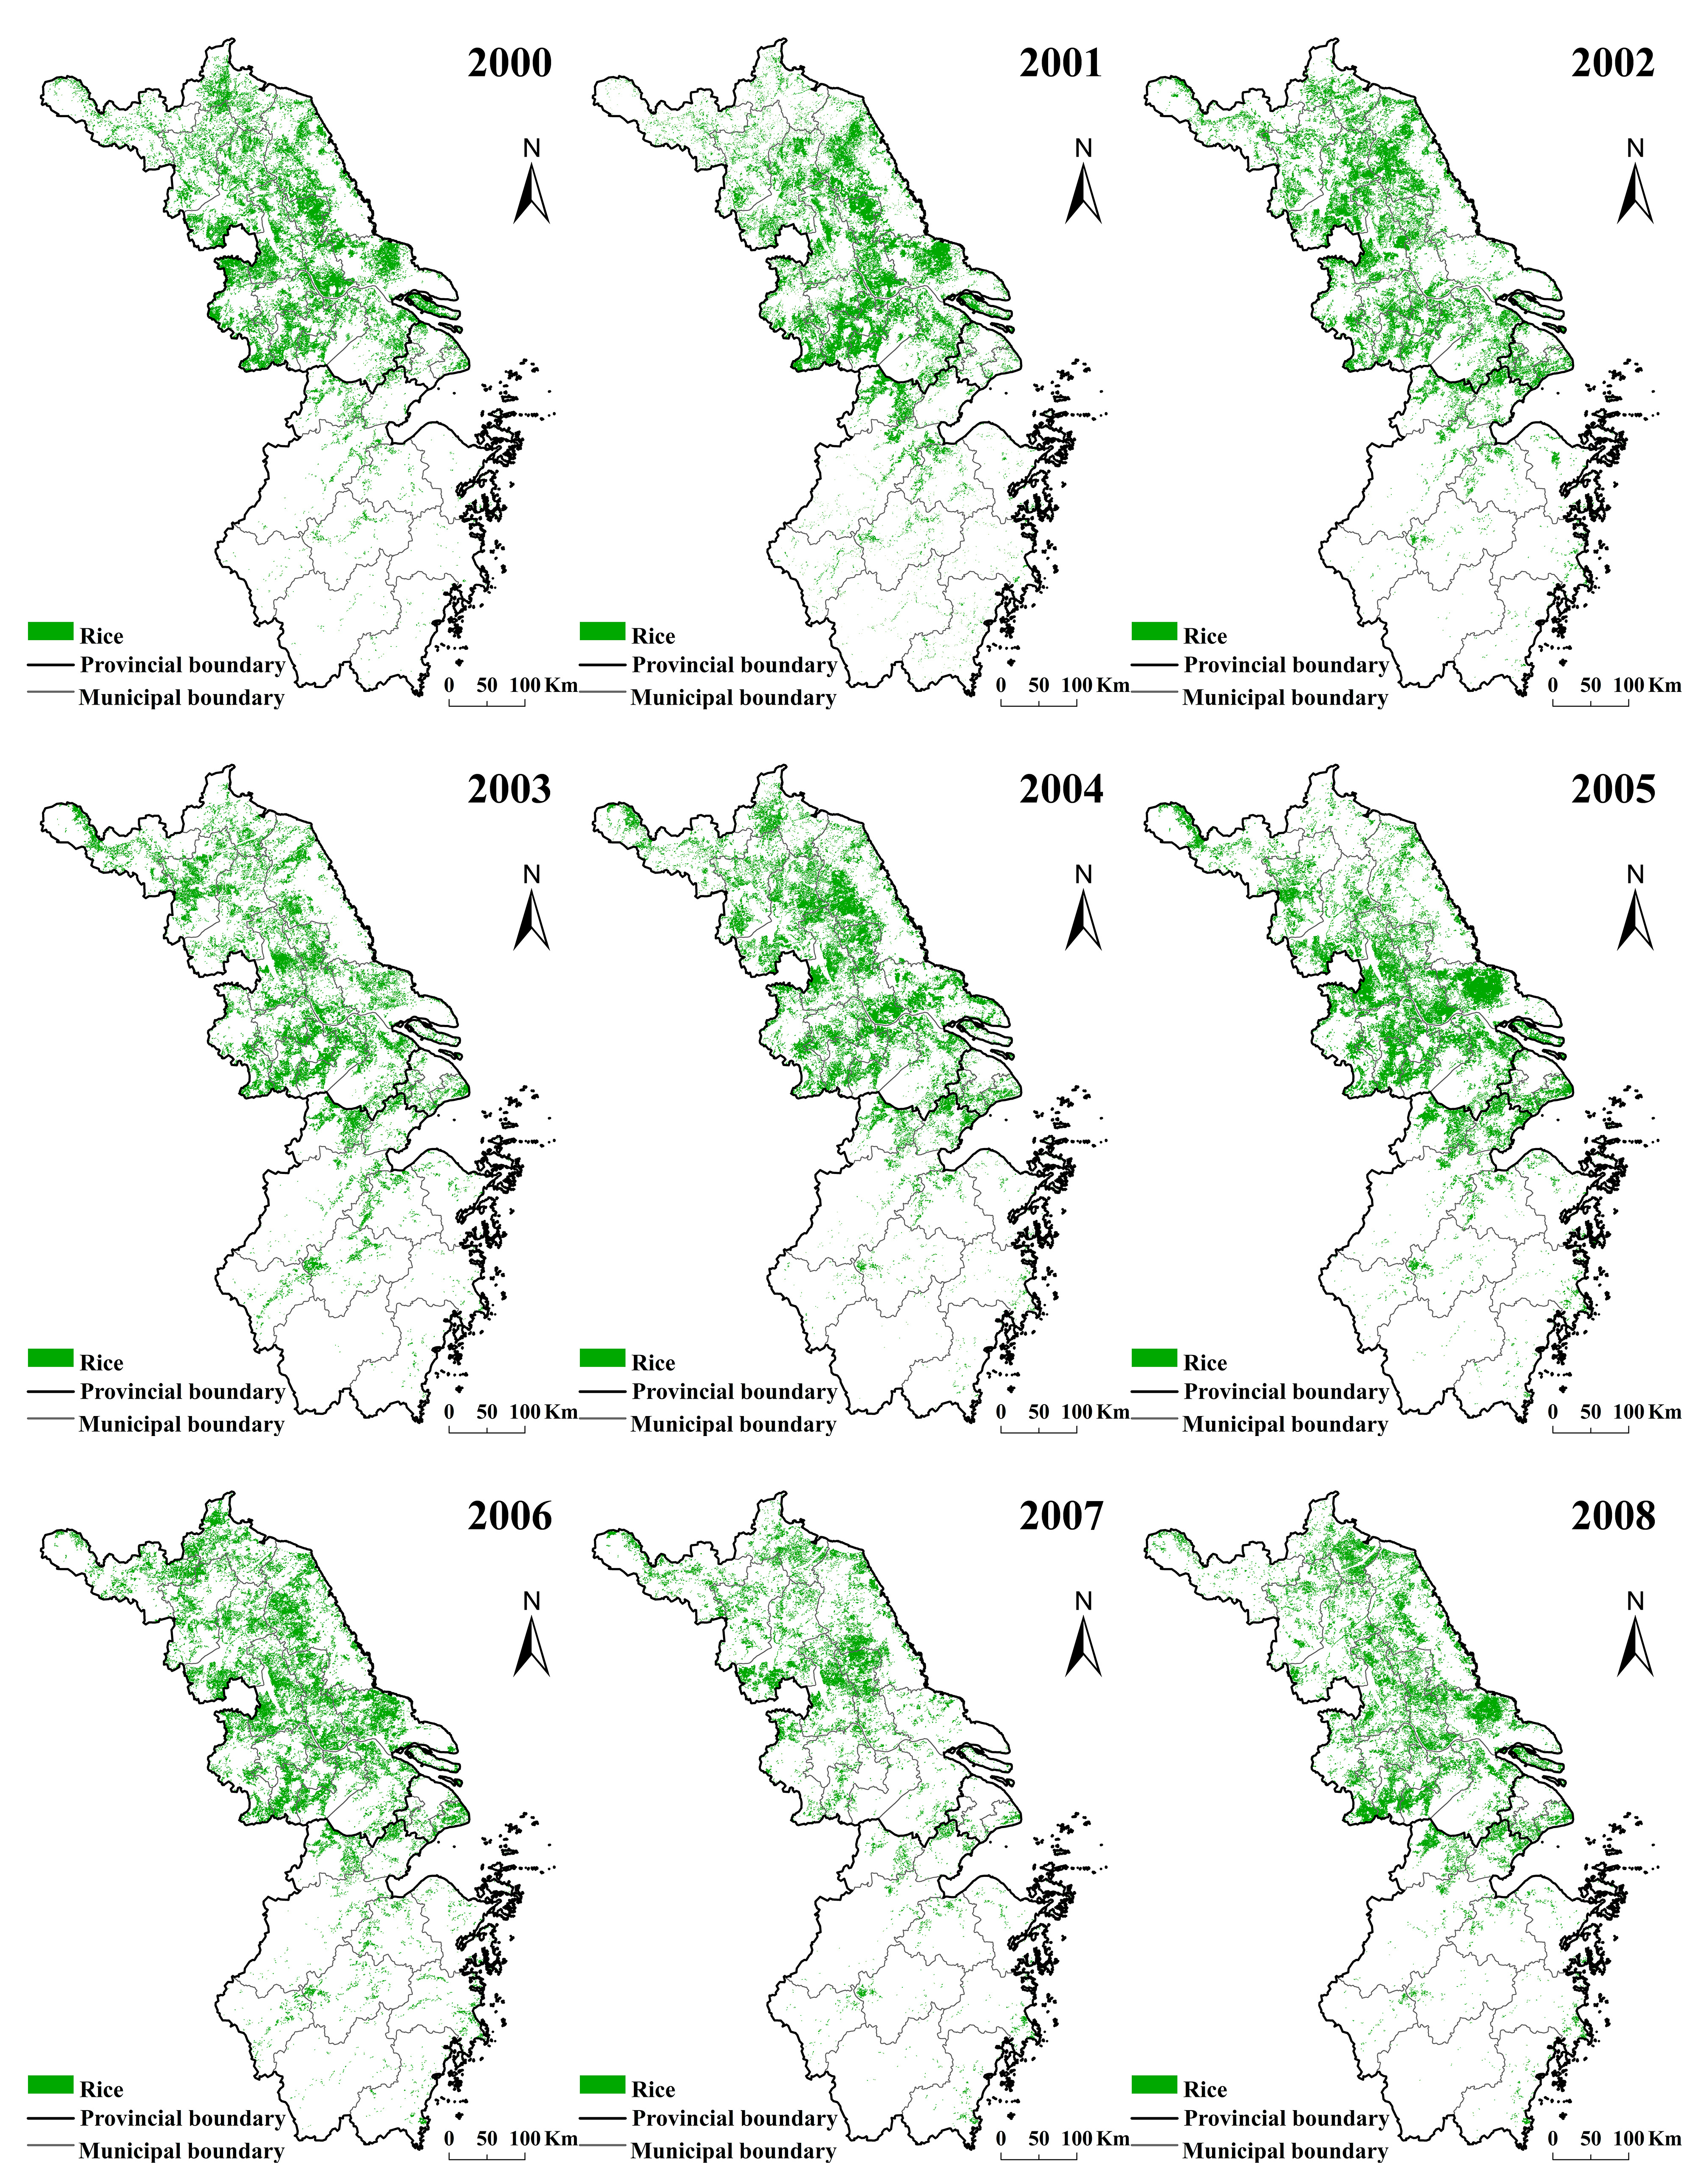
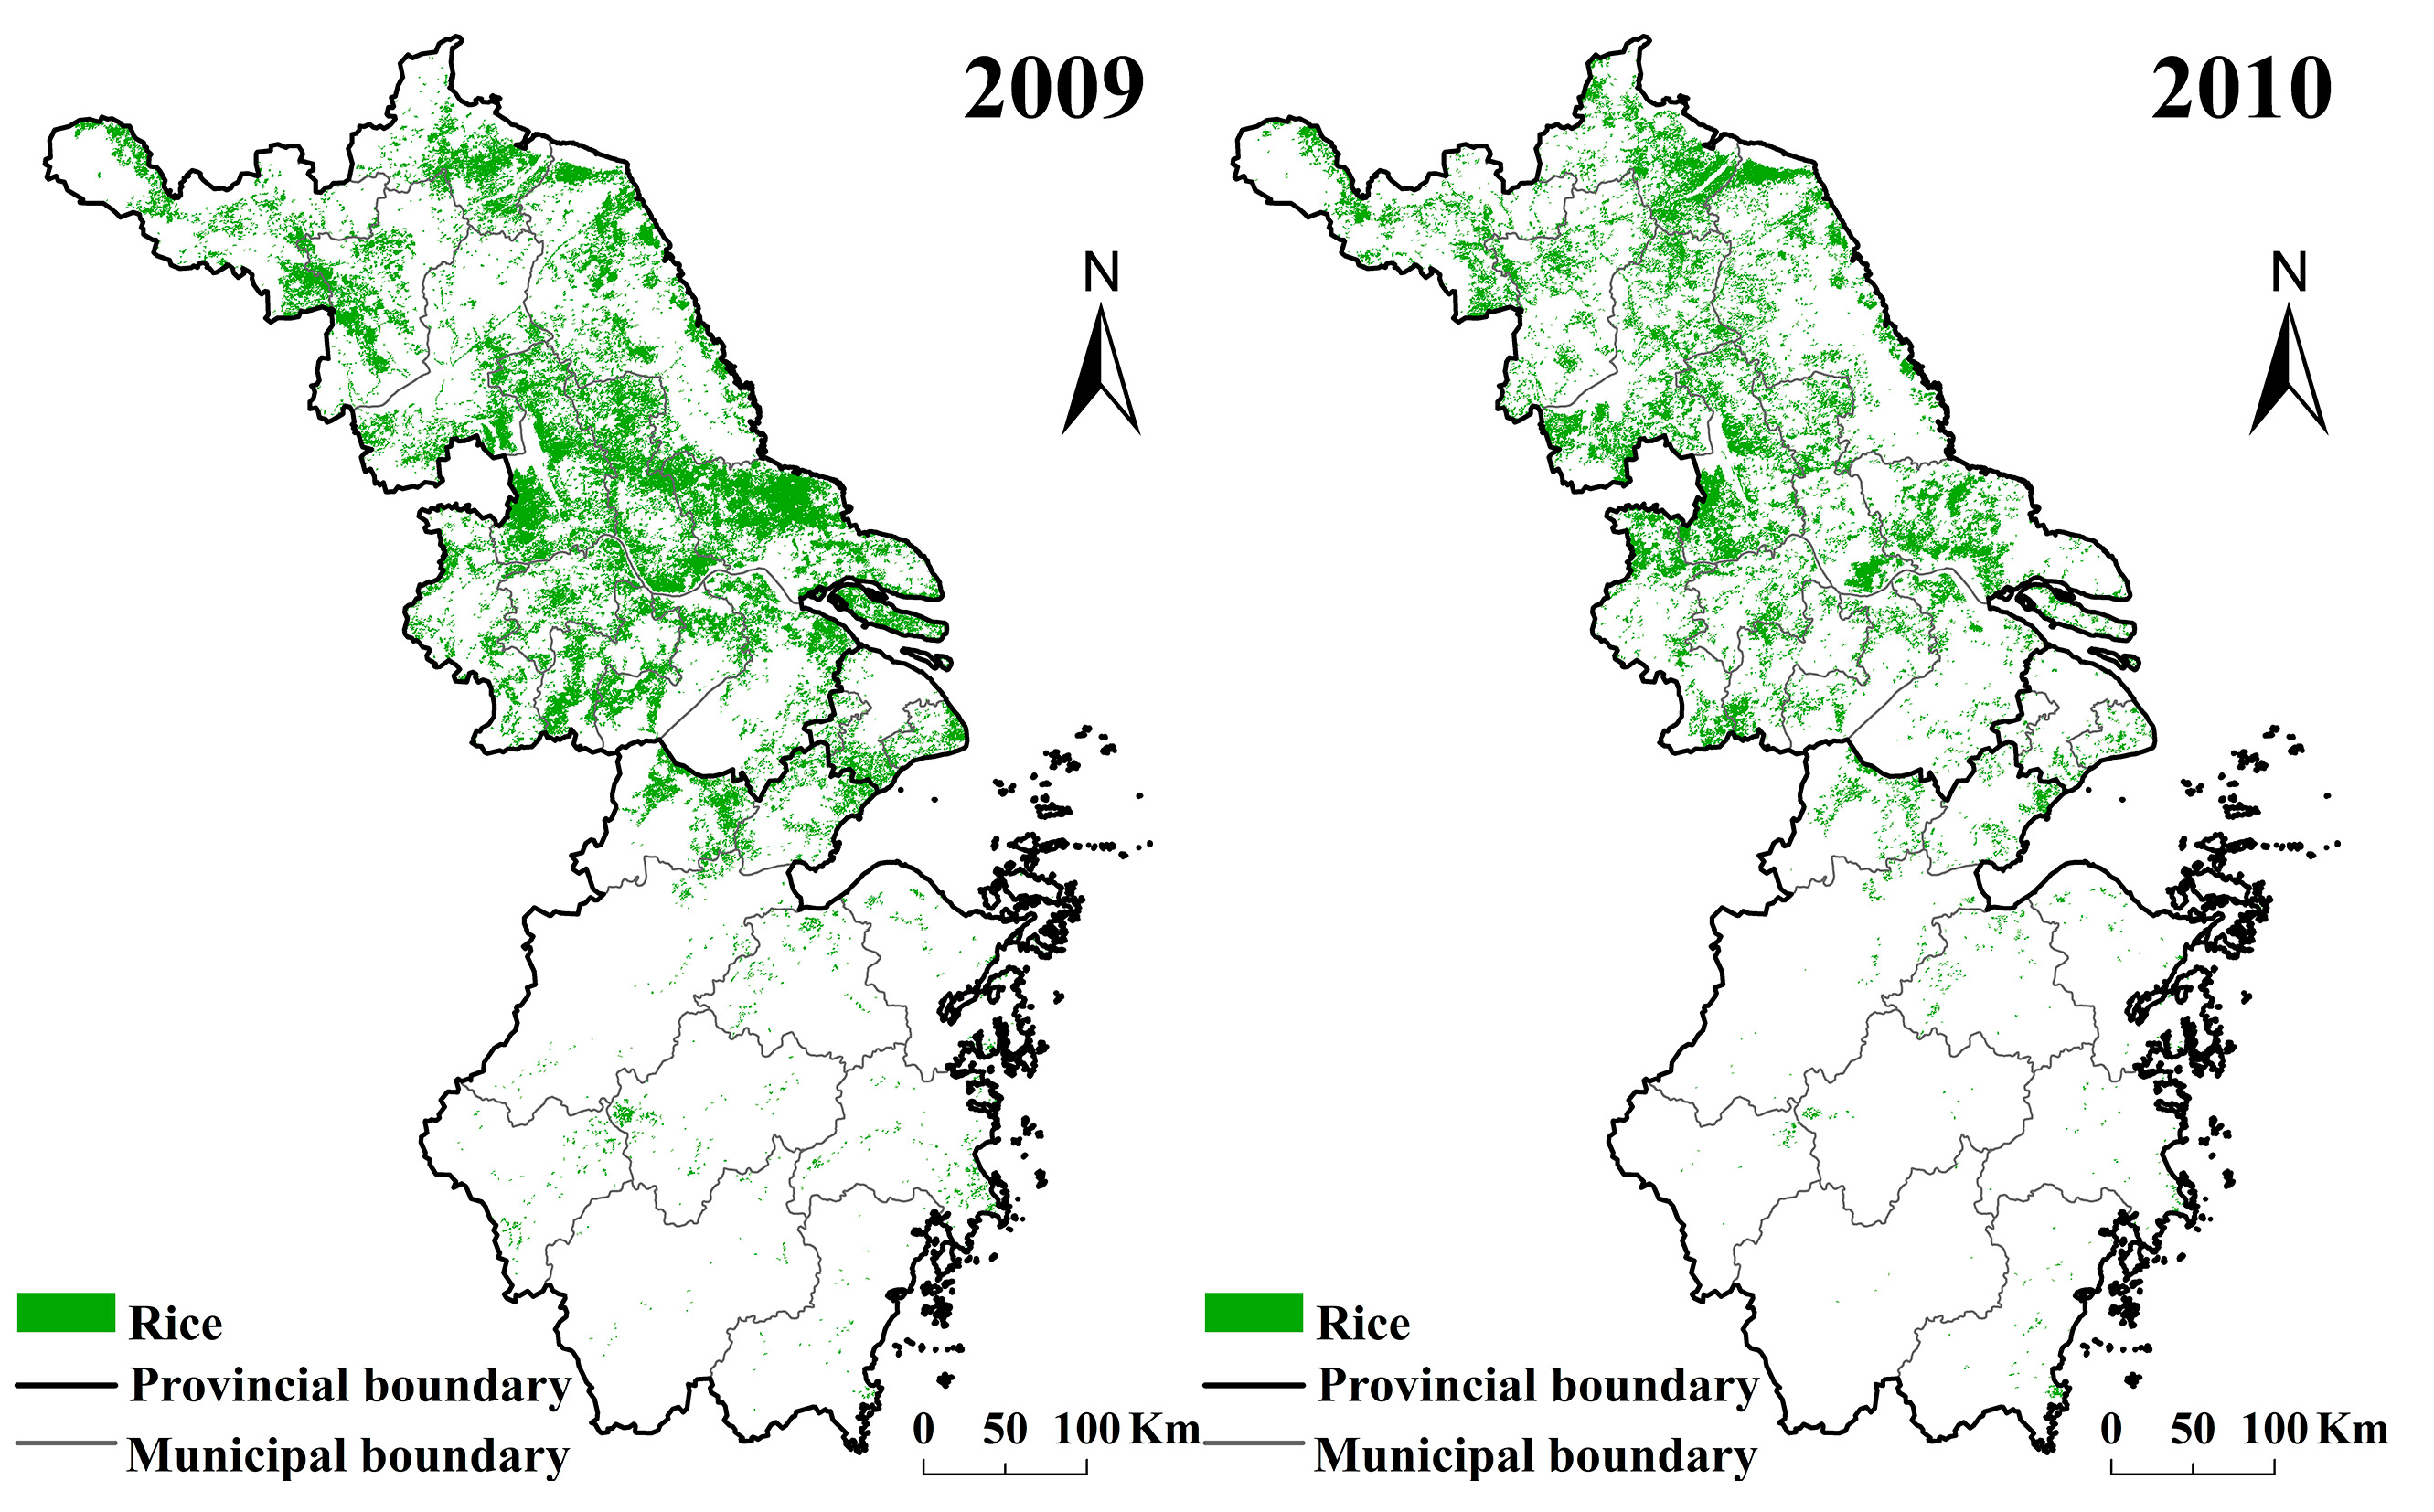
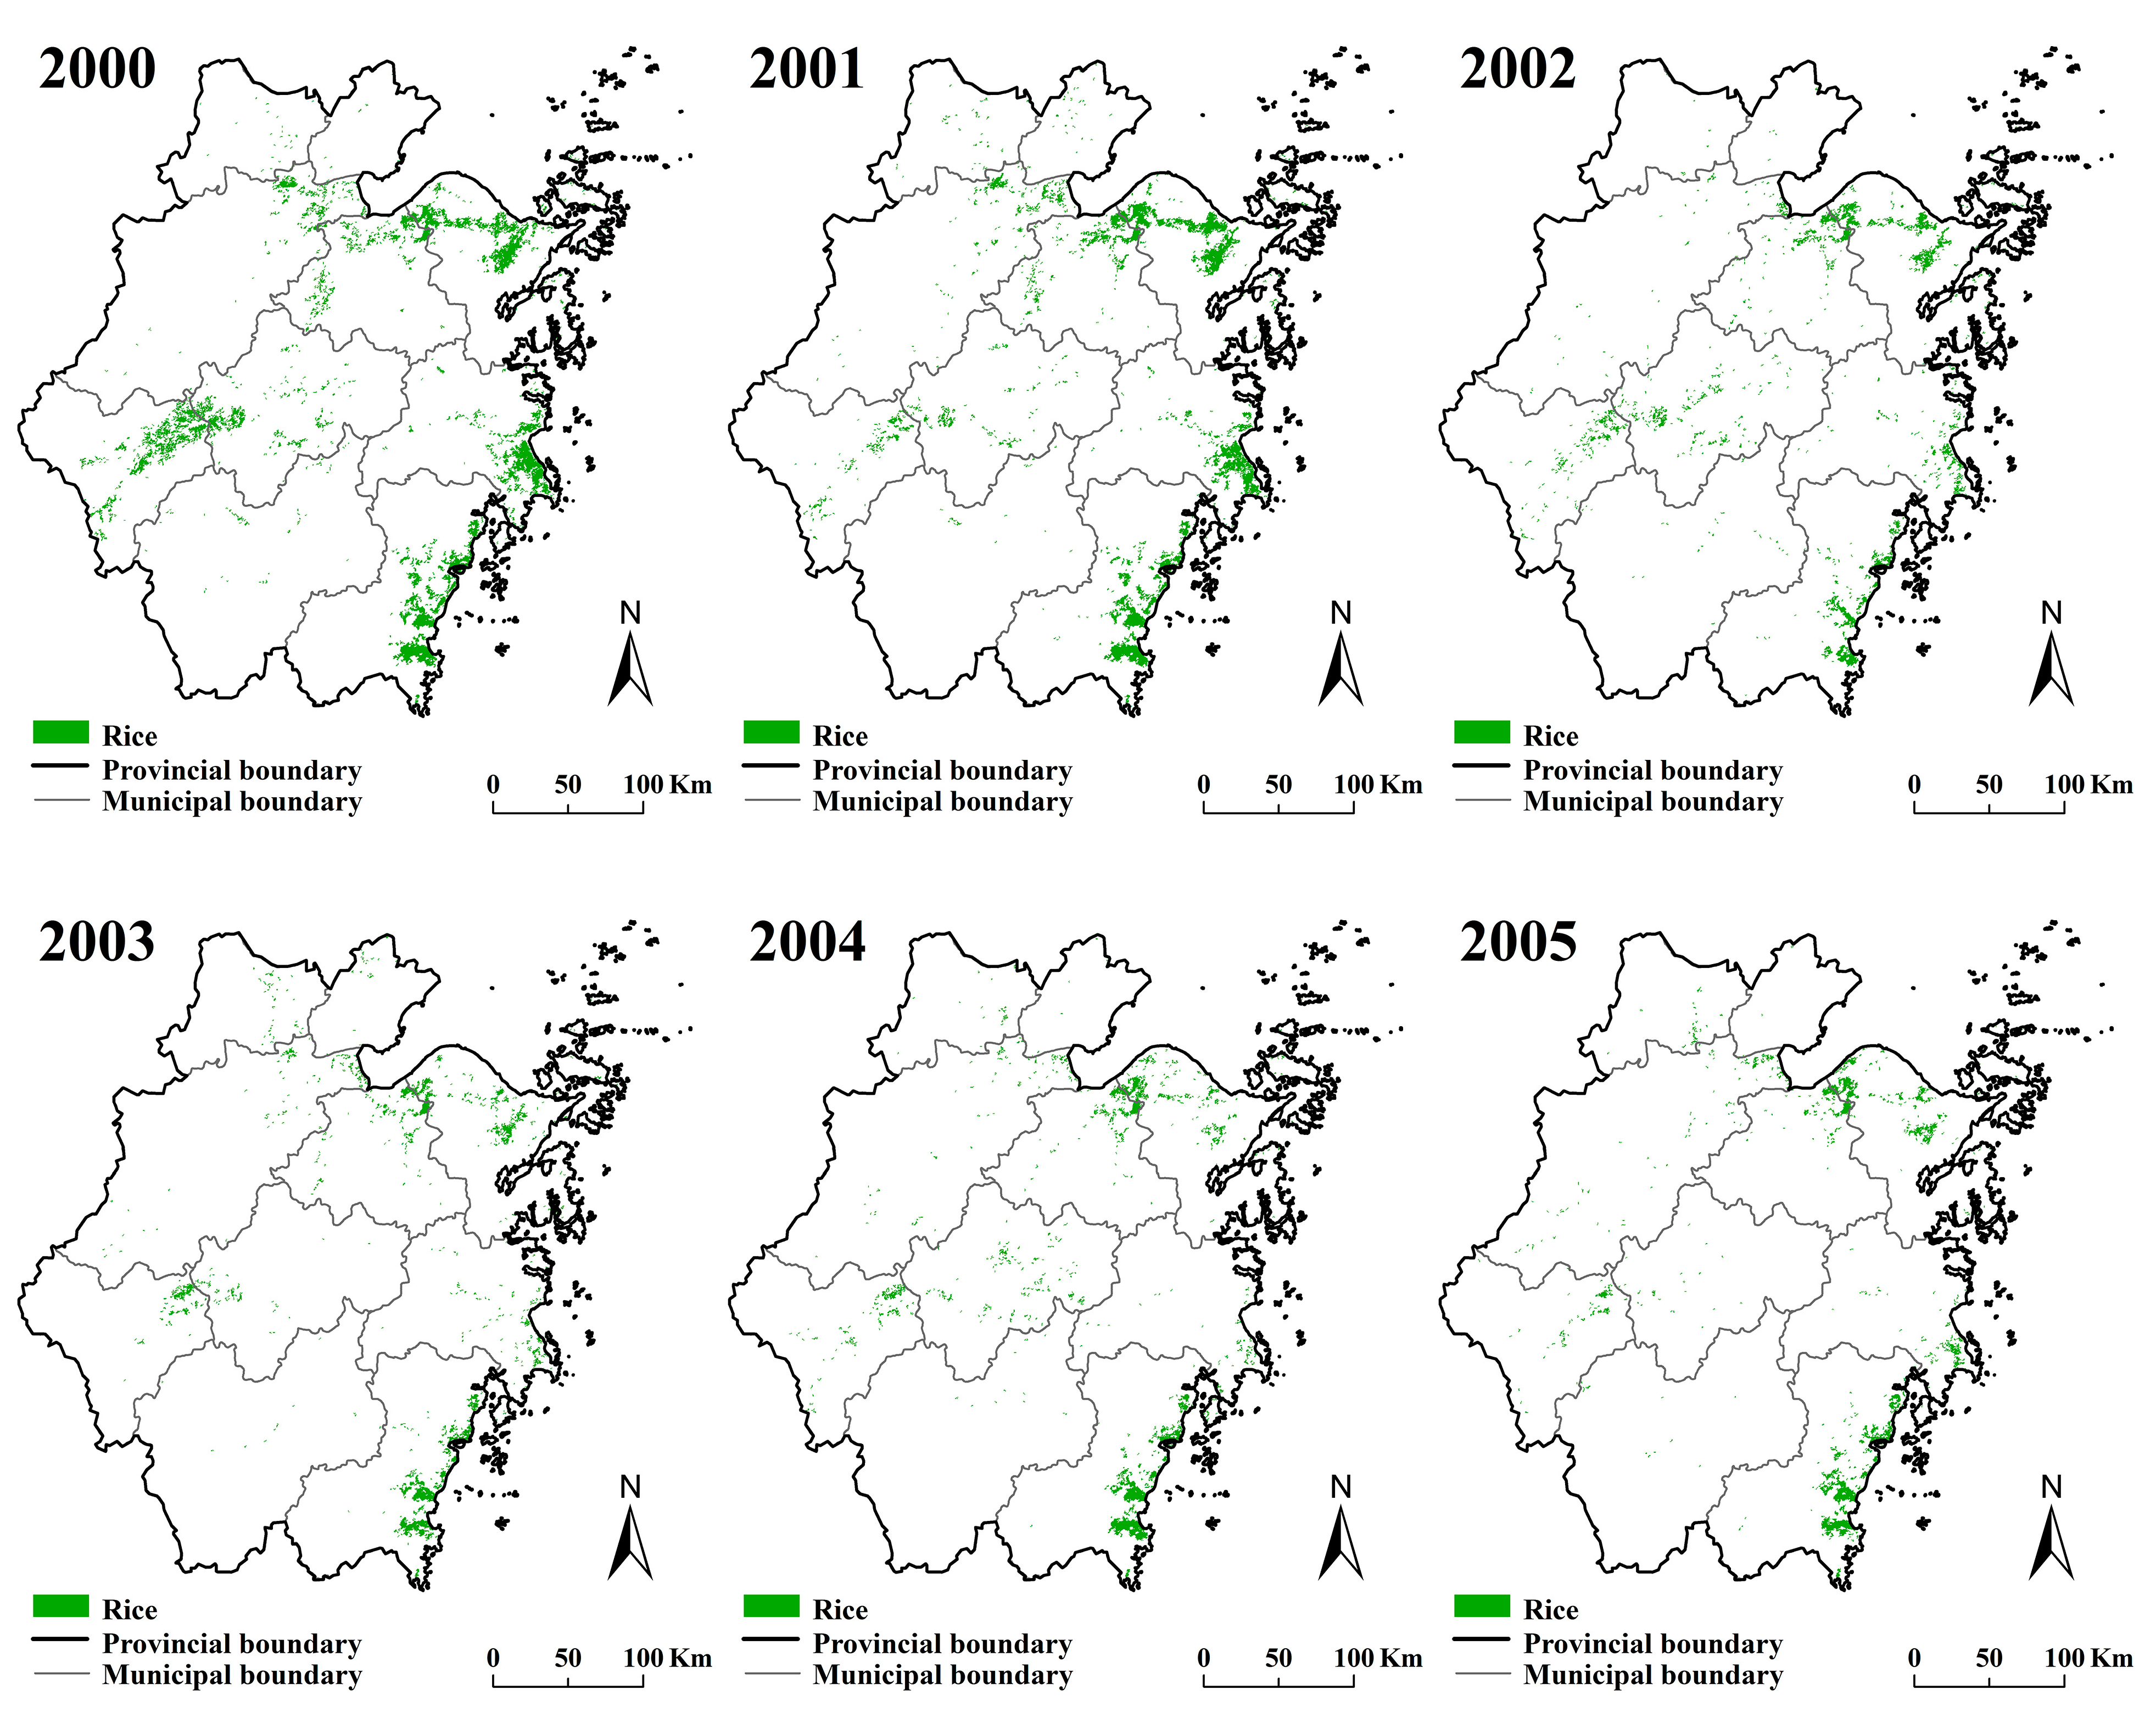
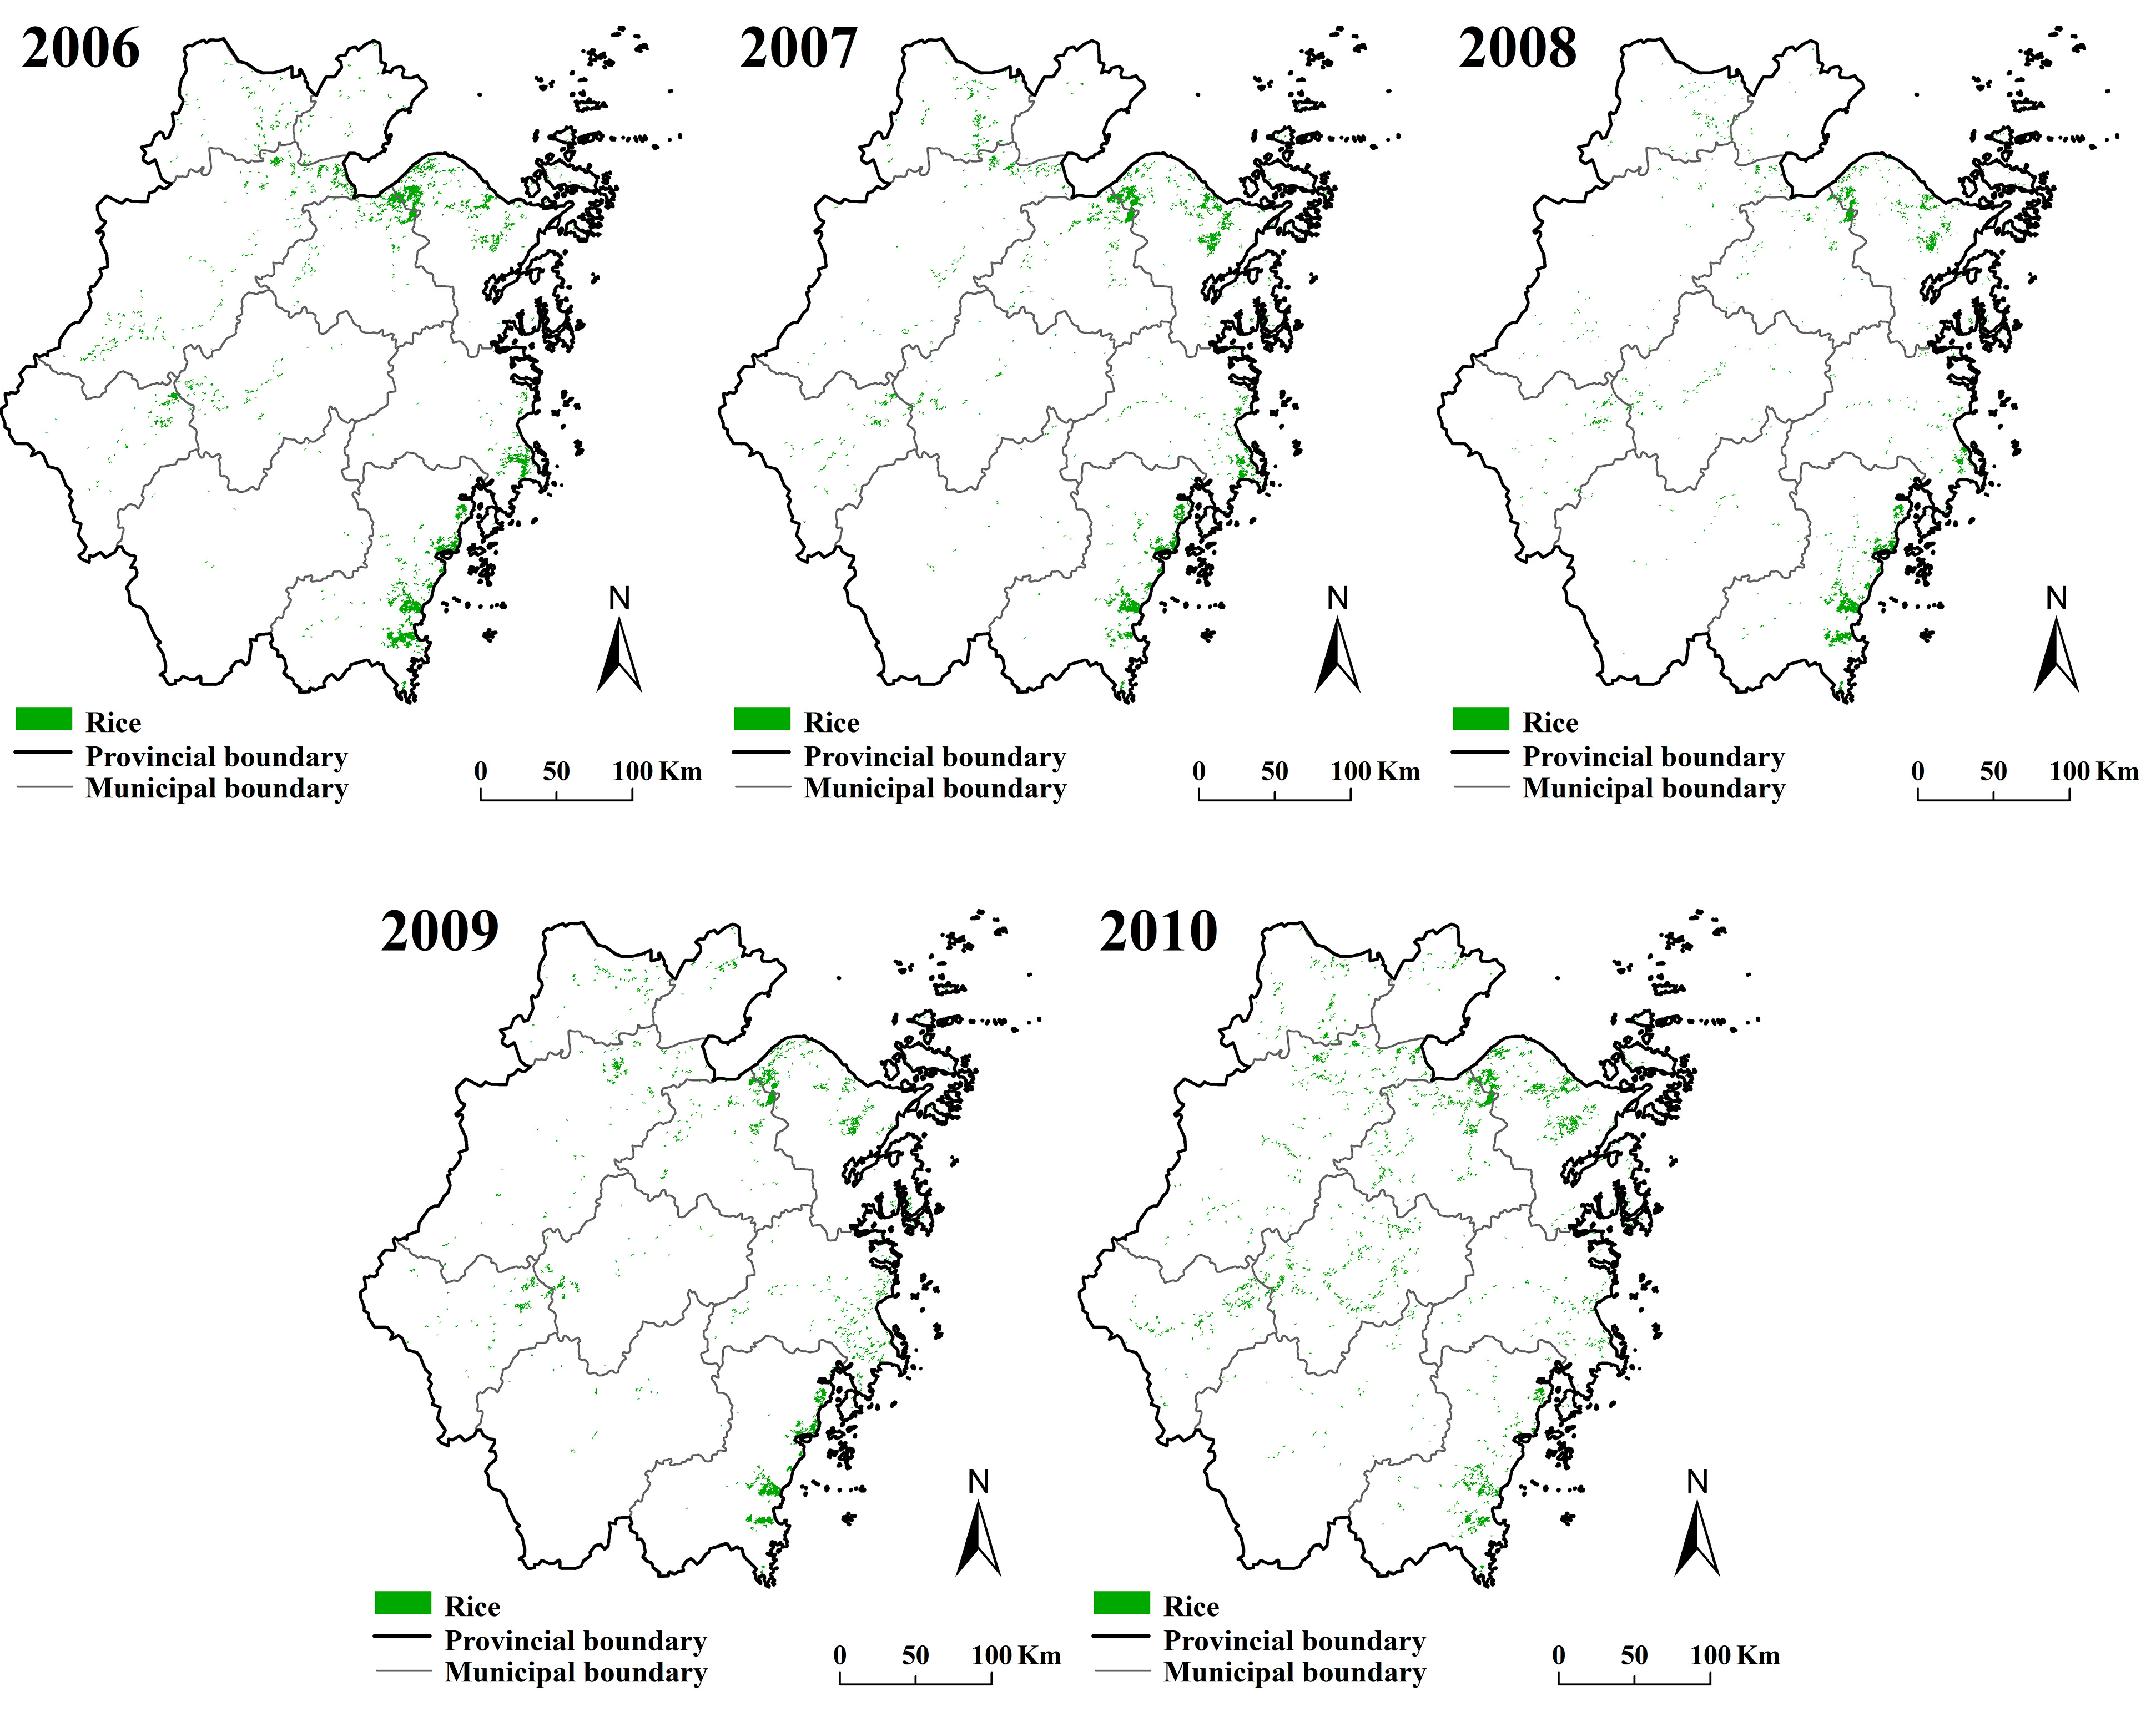
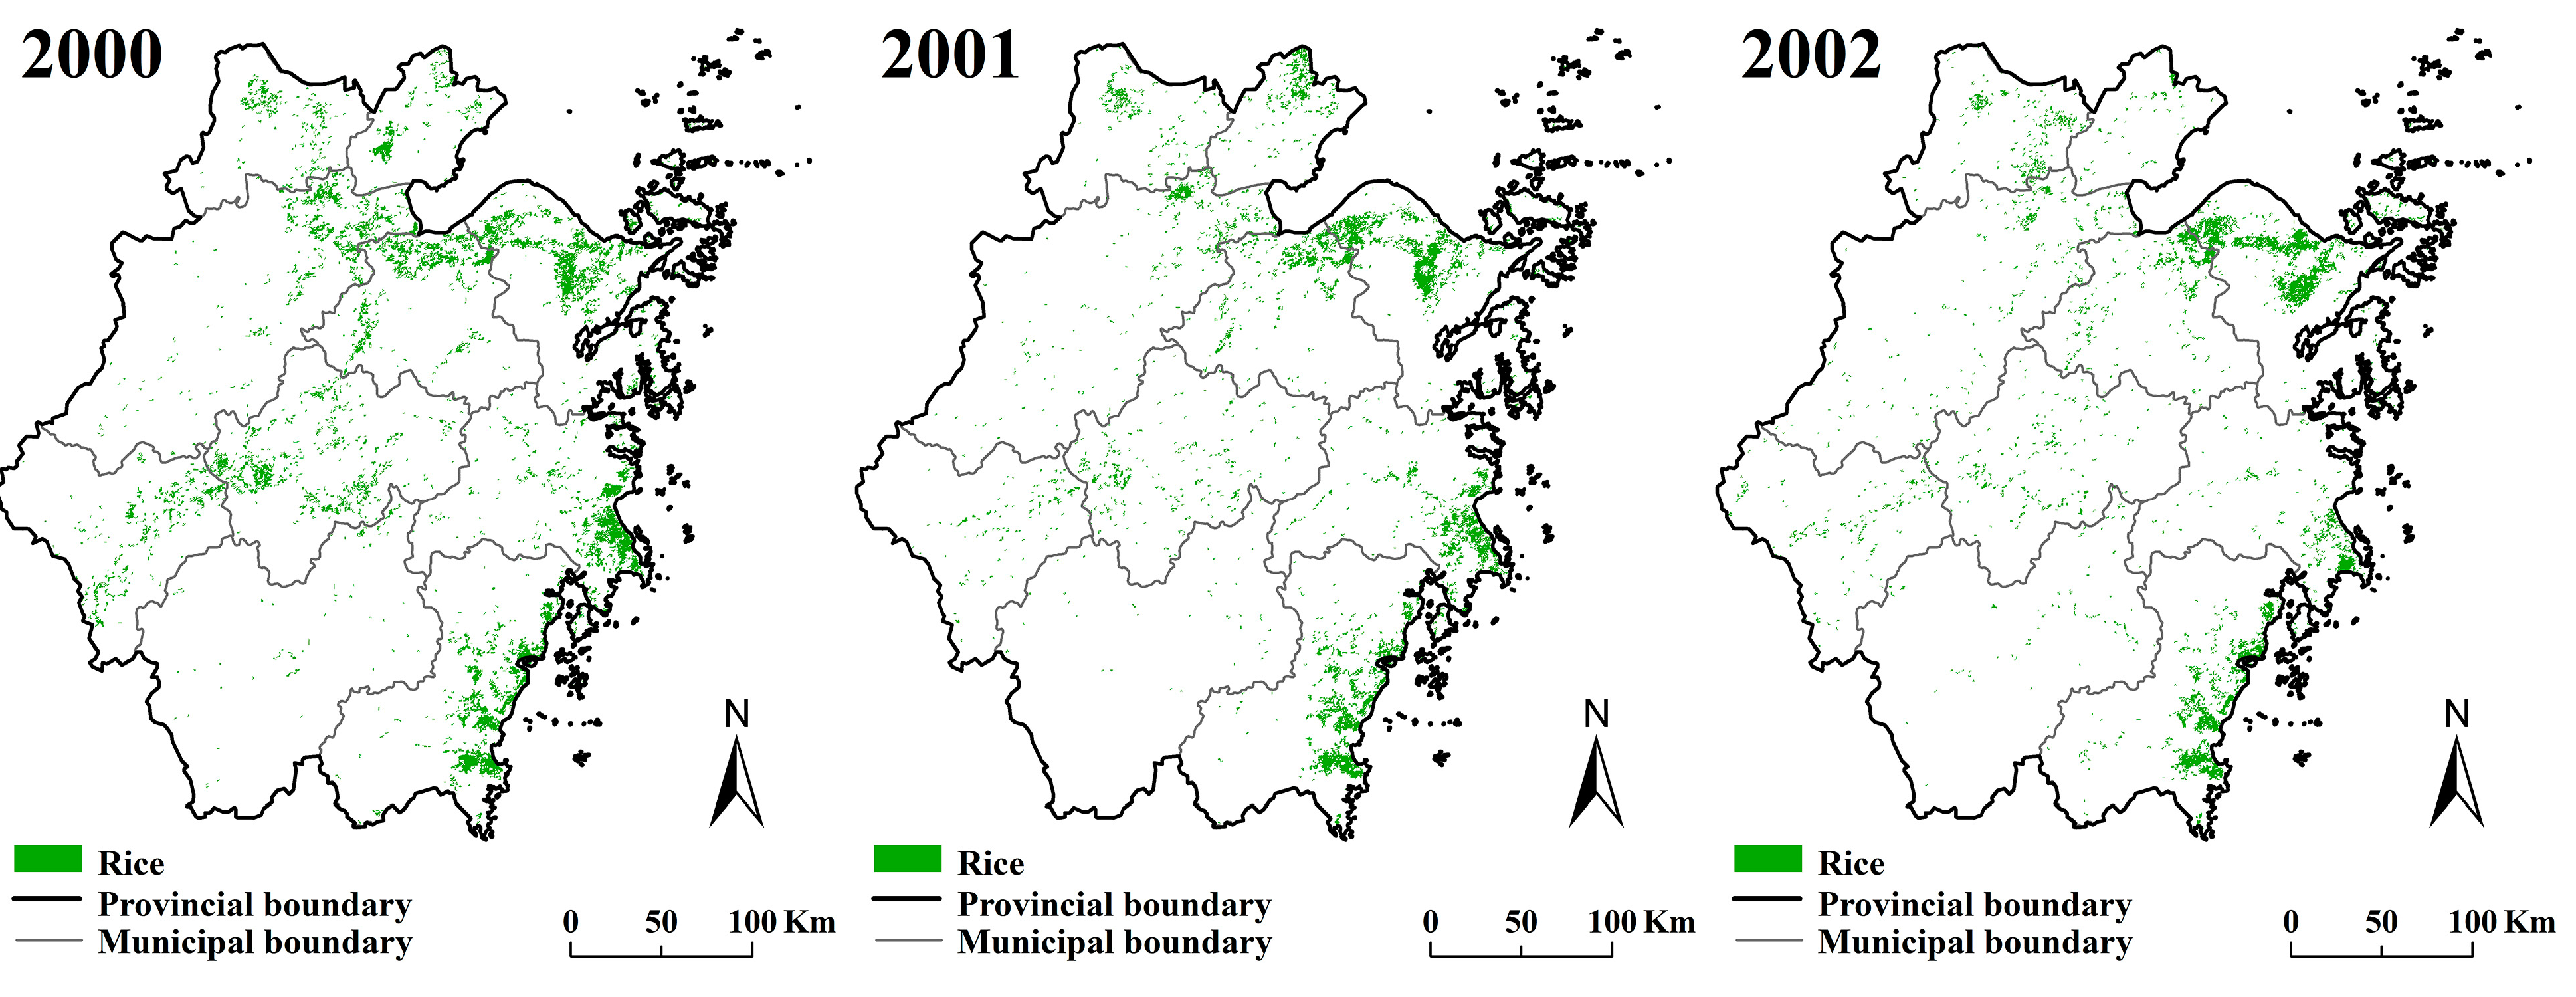
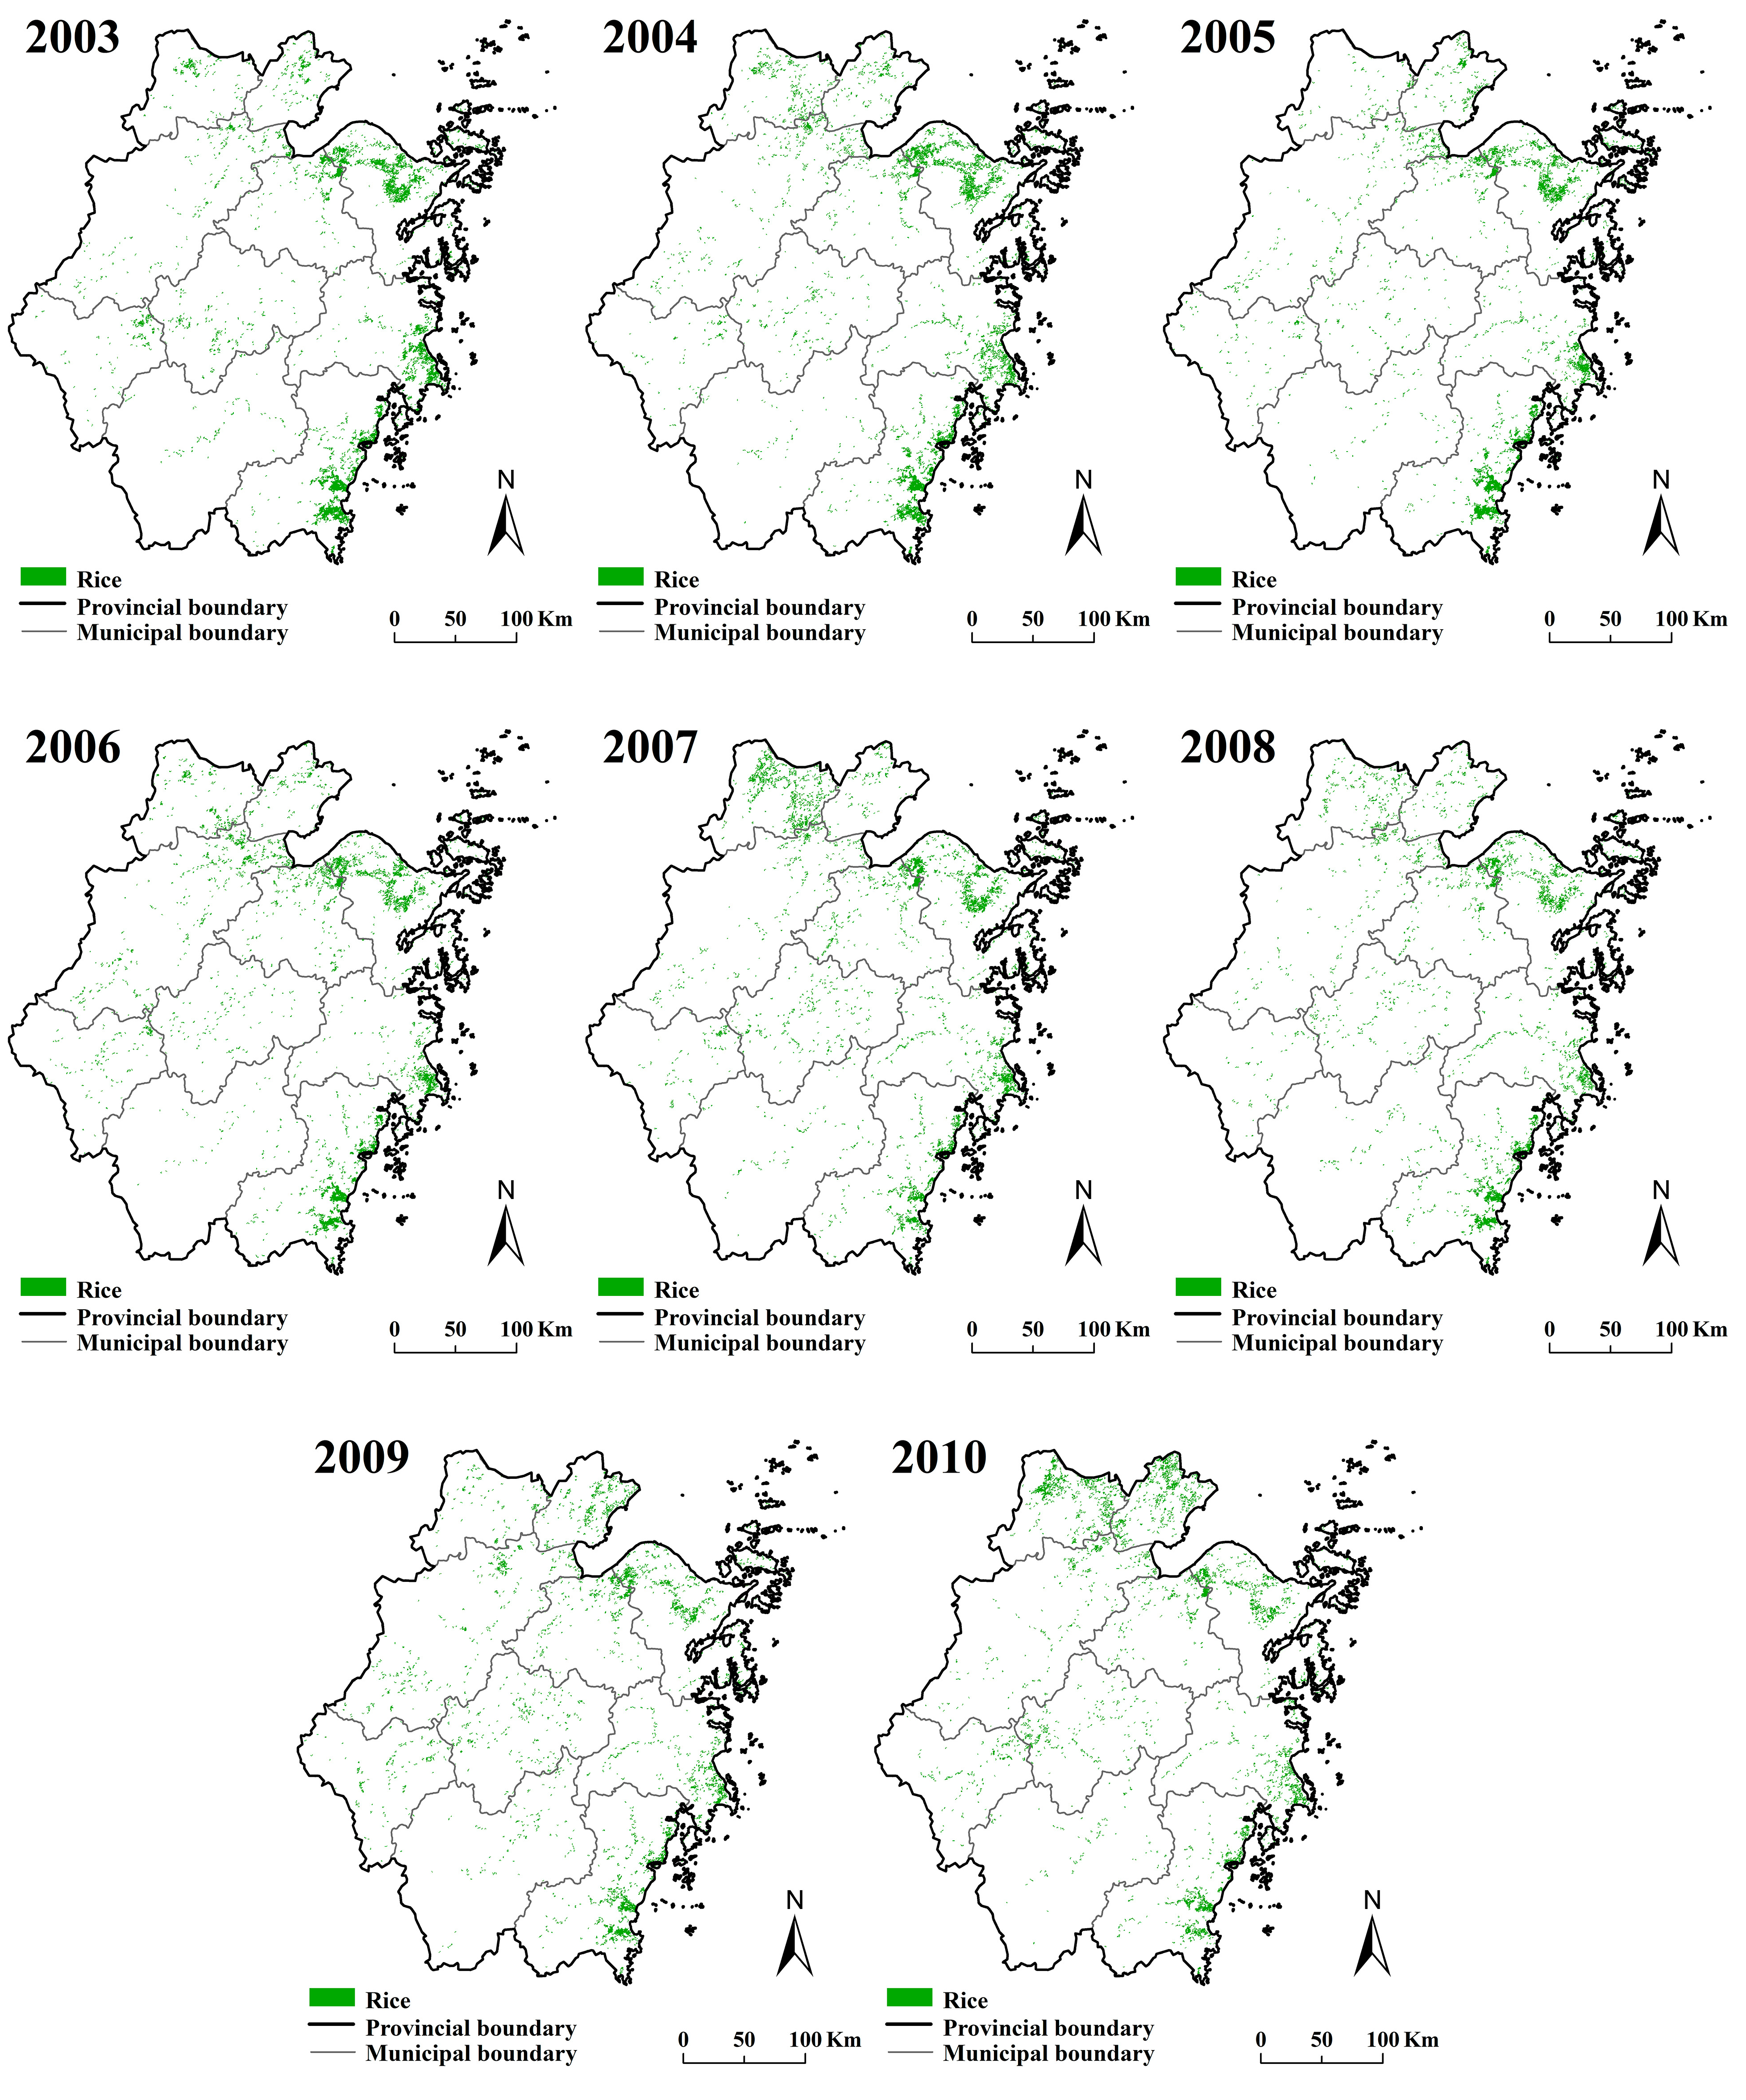
4.1. Spatial and Temporal Distribution of Rice Planting Areas in the Yangtze River Delta Region

The spatial distributions of early, single cropping and double cropping late rice planting areas in the Yangtze River Delta region from 2000 to 2010 were generated using the presented algorithm, and the results are shown in Figure 8, Figure 9 and Figure 10. As shown in Figure 8, single cropping rice was mainly distributed in Jiangsu, Shanghai, Hangzhou-Jiaxing-Huzhou plain, Jinhua-Quzhou basin, Ningbo-Shaoxing plain and the coastal plain of southeastern Zhejiang Province. Double cropping rice was mainly distributed in the Jinhua-Quzhou basin, Ningbo-Shaoxing plain and coastal plain of southeastern Zhejiang Province (Figure 9 and Figure 10). The complexity of the terrain posed a considerable challenge in the extraction of scattered rice fields using MODIS 500-m data because of the mixed-pixel phenomenon. The rice fields were scattered throughout hilly regions, and most of them were distributed along rivers or in terraced planting regions.
The total planting area of early rice decreased from one year to the next from 2000 to 2003 and then remained stable afterward. Single cropping rice began to be planted instead of double cropping rice in some areas of the Yangtze River Delta region. Figure 10 shows that the early rice area decreased significantly in Ningbo-Shaoxing plain and Jinhua-Quzhou basin. The results reveal the change in the cropping systems used in the Yangtze River Delta region over the studied decade.
Figure 8. Spatio-temporal distribution of single cropping rice in the Yangtze River Delta region during the period of 2000–2010.
Remotesensing 07 08883 g008aRemotesensing 07 08883 g008b
Figure 9. Spatio-temporal distribution of early rice in the Yangtze River Delta region during the period of 2000–2010.
Remotesensing 07 08883 g009aRemotesensing 07 08883 g009b
Figure 10. Spatio-temporal distribution of double cropping late rice in the Yangtze River Delta region during the period of 2000–2010.
Remotesensing 07 08883 g010aRemotesensing 07 08883 g010b

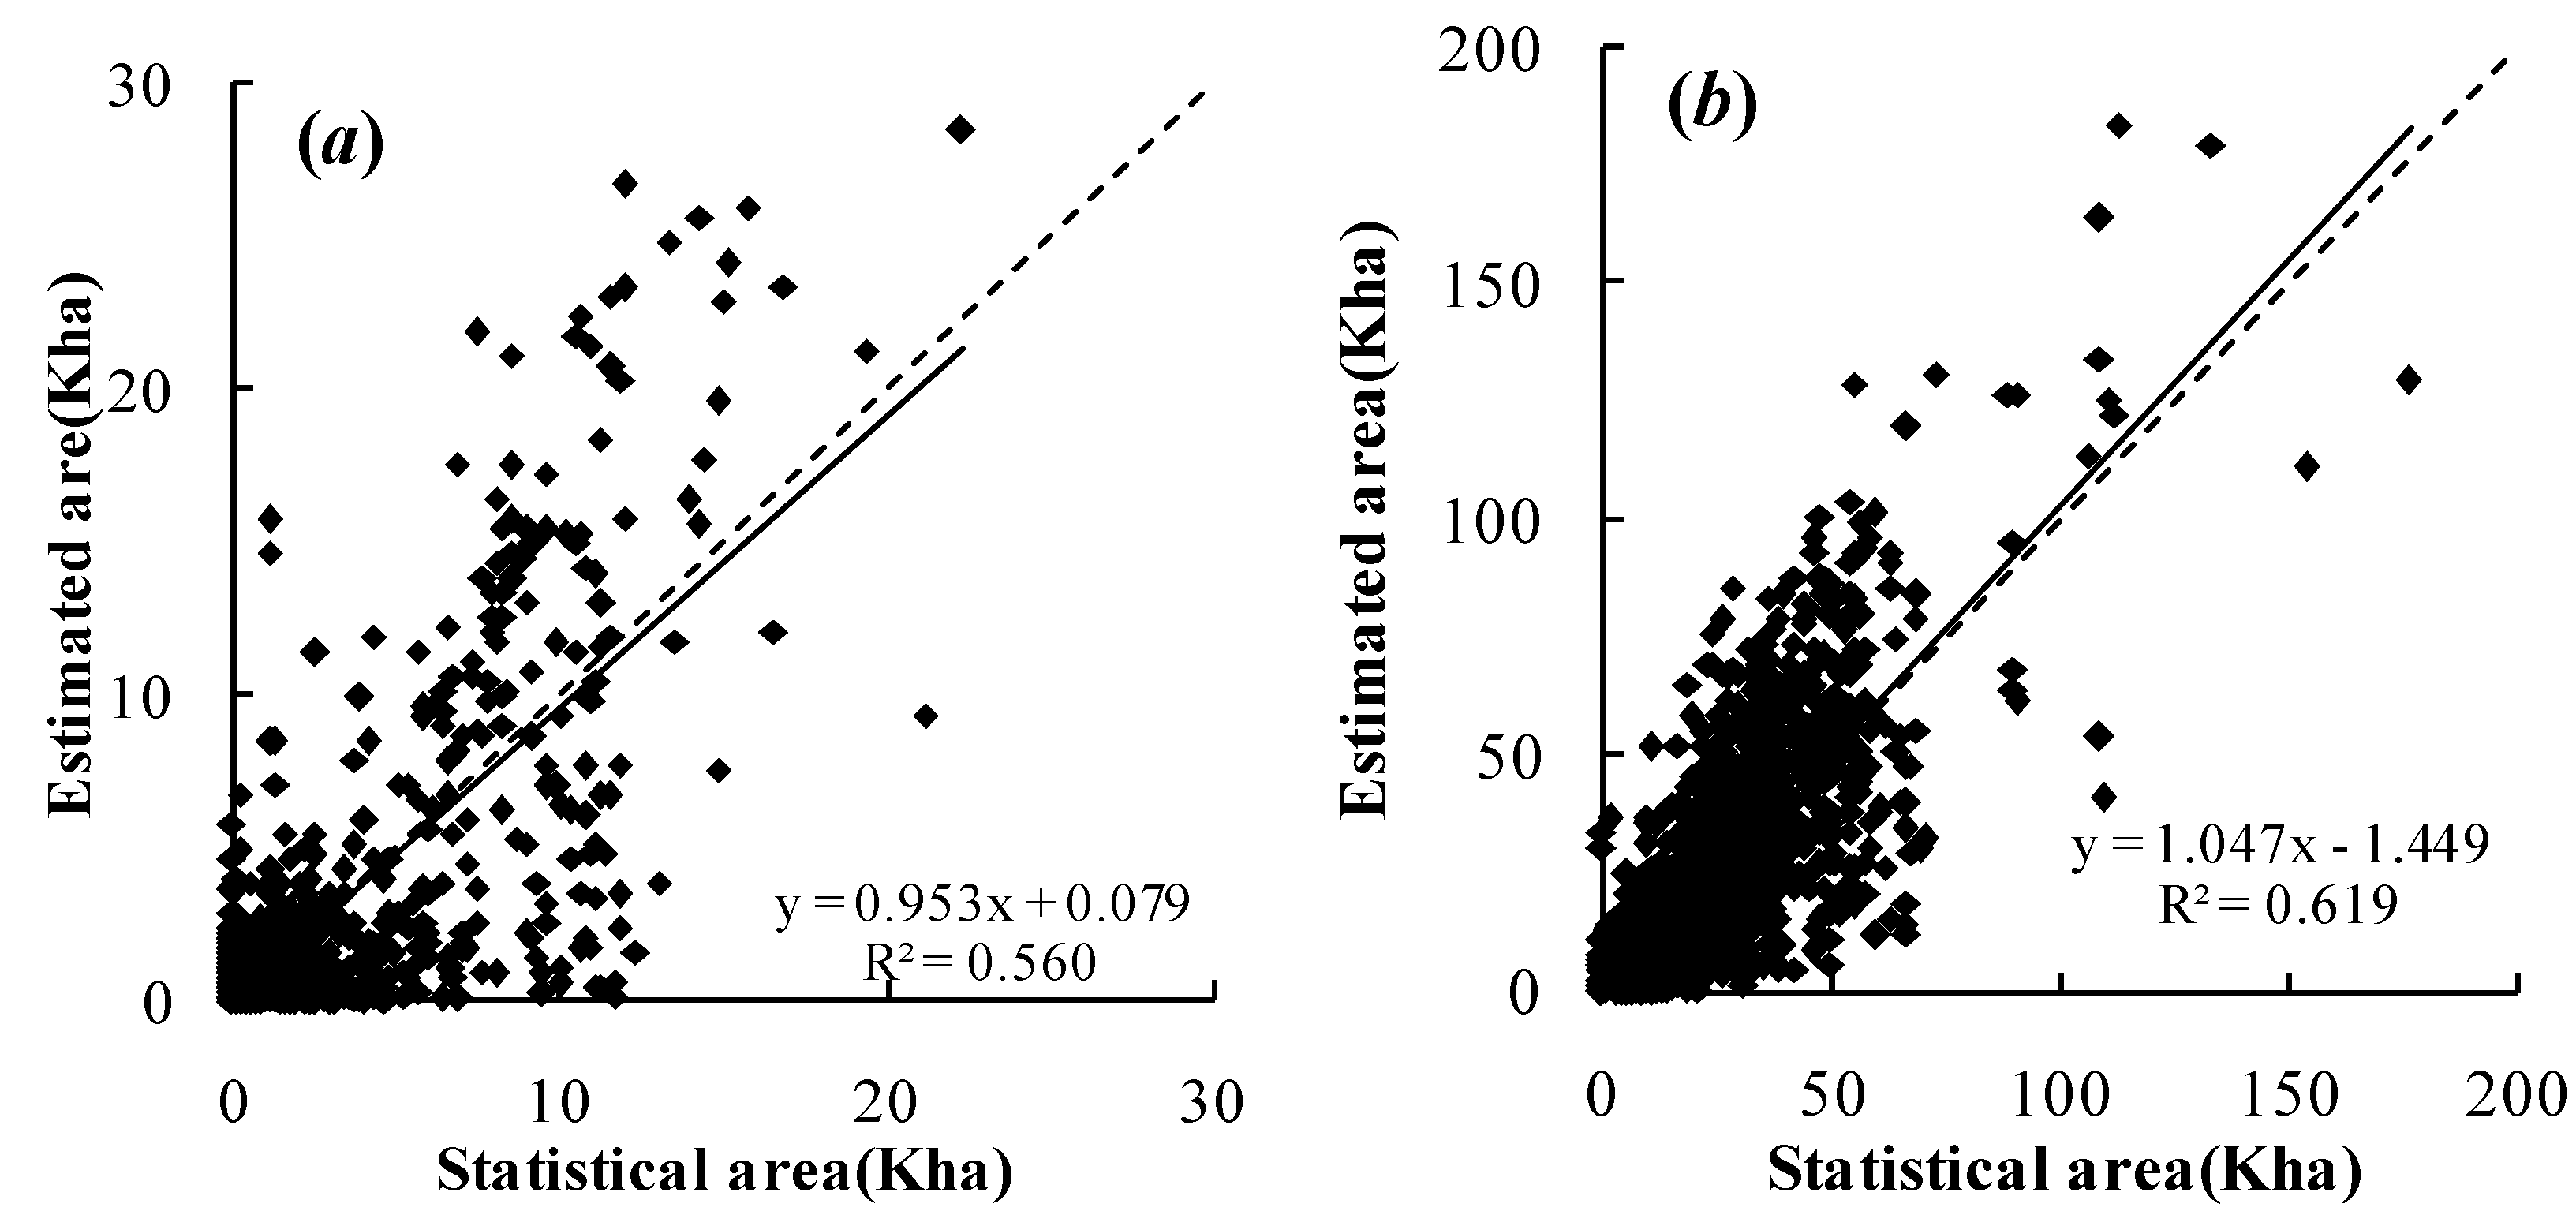
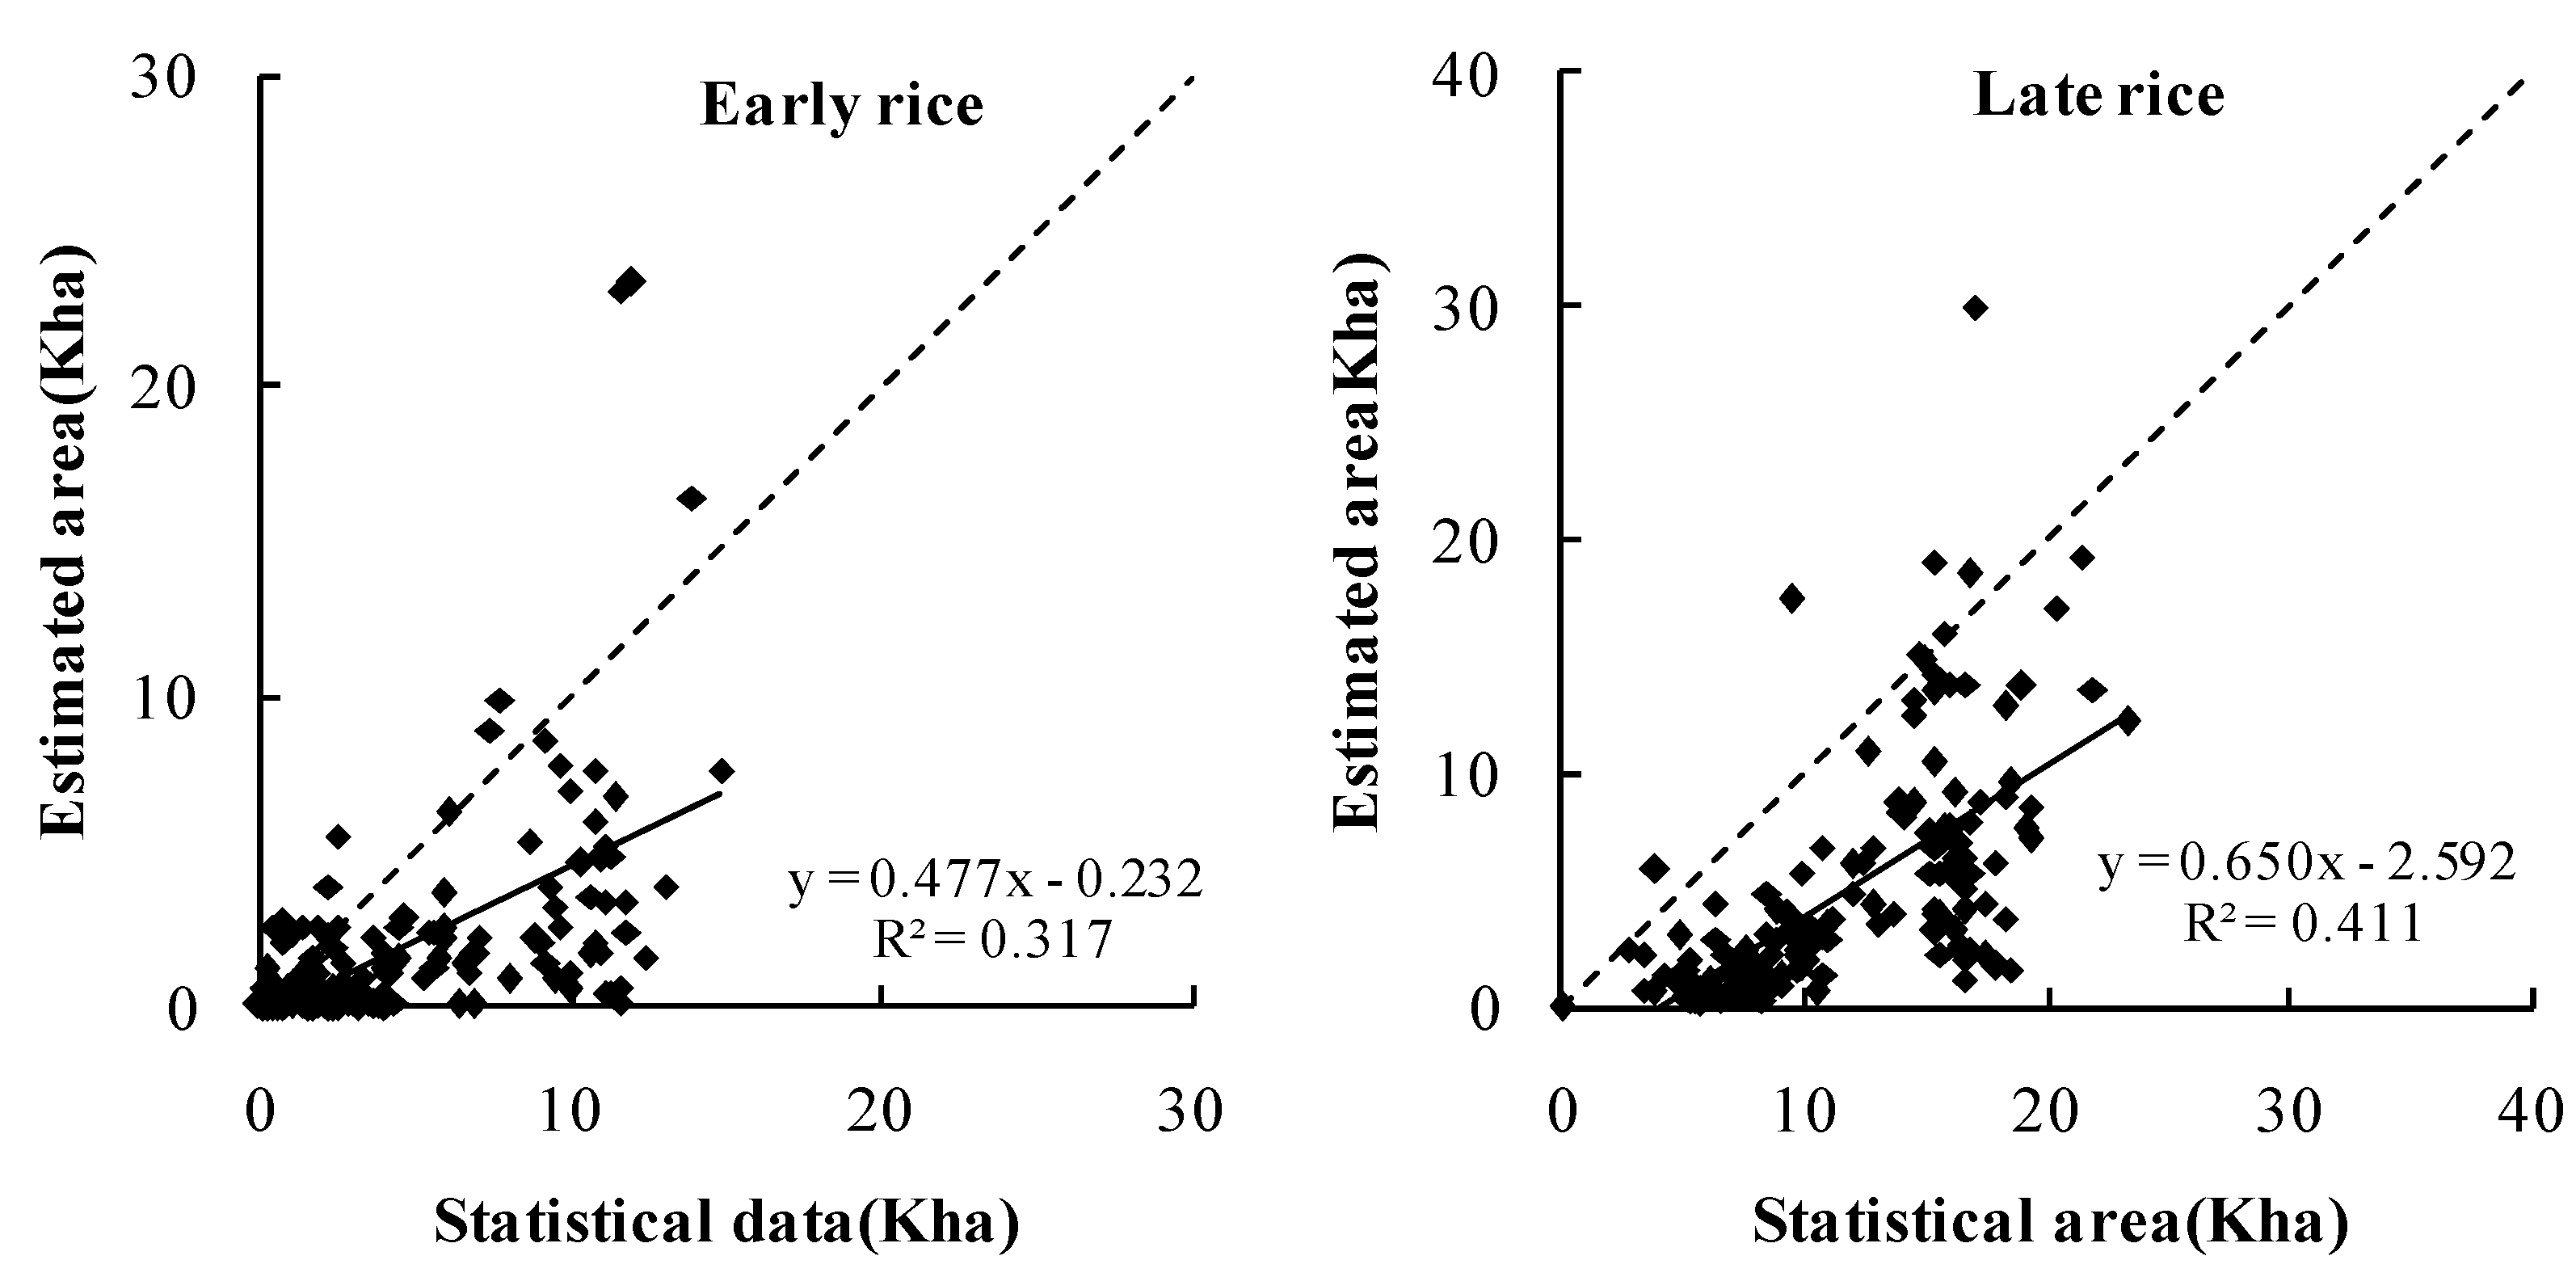
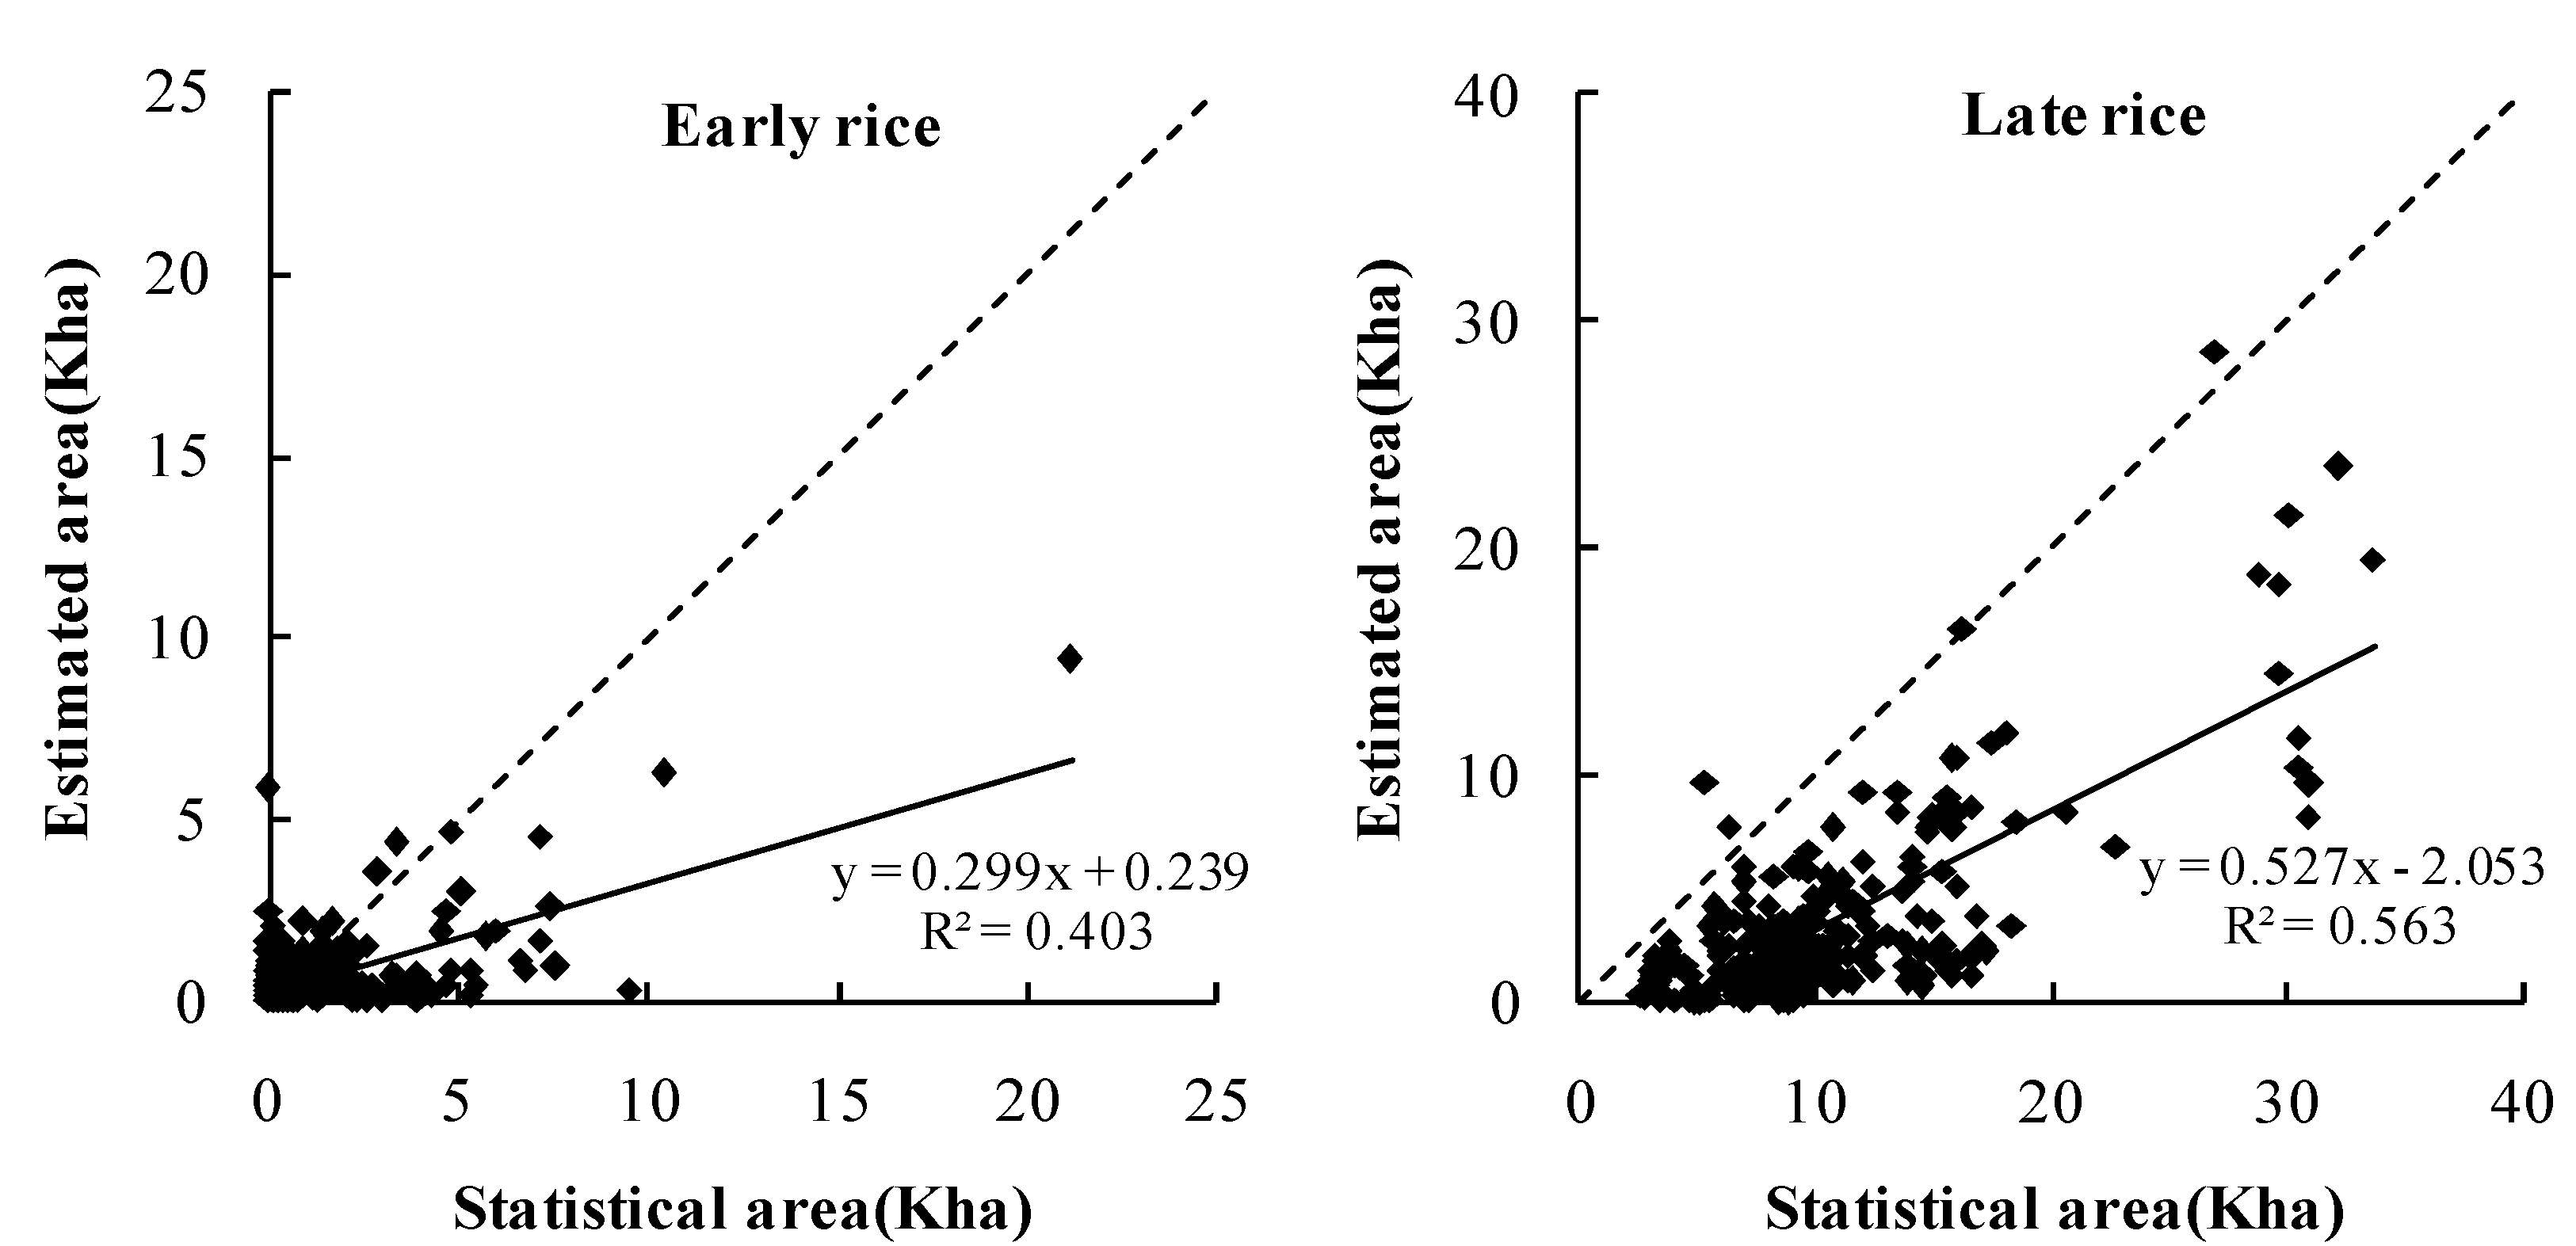
4.2. Comparison of the Estimated Paddy Rice Planting Areas with Agricultural Census Data

It is a time-consuming and labor-intensive task to implement a large-scale regional survey of rice planting region and to obtain an annual spatial map of the study region. Agricultural census data were used as reference data to test the accuracy and stability of our algorithm. Table 1 presents a comparison of the annual total paddy planting areas derived from MODIS and agricultural census data in the Yangtze River Delta region. The absolute errors of the extracted annual total rice areas were less than 15%, except for 2007 and 2010. The MODIS-derived single cropping rice areas were underestimated in 2007 and 2010. The relative error was highest in 2007. The rice planting areas in this year were severely underestimated, especially those in the south of Jiangsu Province, Shanghai City and the north of Zhejiang Province. In 2010, underestimation mainly occurred in northern Nantong City, Taizhou, western Wuxi, northeastern Suzhou and central-southern Zhejiang. In these regions, the cloud occurrence frequency was greater than 60% during the transplanting stage of single cropping rice. Cloud cover during the rainy season may obscure optical observations. The existence of clouds and cloud shadows can result in abnormal changes in the spectral index. Continuous cloud contamination during the transplanting period was the major cause of the underestimation. Although eight-day composite surface reflectance products were generated by selecting the date within the eight-day window with the clearest atmospheric conditions for each pixel, the effects of cloud contamination cannot be neglected. In this study, the conditional temporal interpolation method was applied to reconstruct invalid pixels contaminated by clouds, but if three consecutive eight-day composite data points were all invalid during the flooding and transplanting period of the rice crop, that pixel was eliminated from further analysis. Radar images are a potential alternative means of rice mapping in these regions, especially during the rainy season, because they are independent on the time of day and unimpaired by weather conditions.
Table 1. Comparison of rice planting areas derived using the MODIS algorithm and from the agricultural census data.
YearCensus Data (kha)* RiceMOD (kha)Relative Error (%)
20003928.503882.06−11.8
20013476.303753.937.99
20023239.833472.607.18
20032842.233161.5611.24
20043285.703576.888.86
20053409.263609.665.88
20063439.453638.515.79
20073338.492140.38−35.89
20083359.372893.90−13.86
20093335.403546.106.32
20103309.102636.50−20.33
* RiceMOD denotes the rice planting area derived from MODIS.
Furthermore, county-level validation of the rice planting area extraction results was performed. Because of the different standards for agricultural census data collected at the county level, single cropping rice and double cropping late rice were combined and treated simply as late rice for the comparison. The comparison results for early and late rice are shown in Figure 11. The solid line in the plot is the 1:1 line. The points in the plot are clustered near the 1:1 line, indicating that the MODIS-derived area of early rice is well correlated with the agricultural census data at the county level. The decision coefficients (R2) for early rice and late rice are 0.560 and 0.619, respectively. The MODIS-derived area of late rice demonstrates a higher consistency with the census data during the 2000–2010 period, and the extracted early-rice area exhibits greater bias than that of late rice.
Figure 11. Correlation between areas of (a) early rice and (b) late rice derived using the MODIS algorithm and from the census data at the county level for the 2000–2010 period.
Remotesensing 07 08883 g011
The topography in Zhejiang Province is very complicated, including plains, hills and mountains. Xu and Wang studied regionalization for rice yield estimation in Zhejiang Province by considering the local rice cropping systems, agroclimates, landforms, surface feature structures and rice yield levels. The county borders were treated as the region boundaries in the regionalization [36]. According to the regionalization map, the MODIS-derived early-rice area was close to that indicated by the census data in counties dominated by plains, but a large error was still observed in counties that grew less rice (Figure 12). The MODIS-derived late-rice area in counties dominated by plains was very close to that indicated by the census data. The Jinhua-Quzhou basin, located in central Zhejiang Province, is the major rice-producing region in the study area. The planting areas of early and late rice derived from the MODIS data were underestimated in the counties located in the Jinhua-Quzhou basin region (Figure 13). The results were unsatisfactory because of the influence of the terrain on the land surface reflectance. In counties located in mountainous and hilly regions, the MODIS-derived areas of early and late rice were underestimated to different extents (Figure 14). The rice planting areas derived using the MODIS algorithm were severely underestimated in counties located in mountainous and hilly regions, where the rice fields were typically fragmentary and smaller than a MODIS pixel. Because the spatial resolution of the MODIS data used in the study was 500 m, it was unfeasible to recognize a pixel with a low abundance of rice as a rice pixel. The rice fields were not successfully identified in regions with complicated topographies. However, the MODIS-derived results are still useful for developing large-scale, timely and relatively accurate spatial datasets of paddy rice fields, especially in plain regions, and for providing vital information for yield estimation, growth monitoring, water management and greenhouse gas emission estimation.
Figure 12. Comparison of MODIS-derived areas with census data in counties dominated by plains in the 2000–2010 period.
Remotesensing 07 08883 g012
Figure 13. Comparison of MODIS-derived areas with census data in counties located in the Jinhua-Quzhou basin in the 2000–2010 period.
Remotesensing 07 08883 g013
Figure 14. Comparison of MODIS-derived areas with census data in counties located in mountainous and hilly regions in the 2000–2010 period.
Remotesensing 07 08883 g014

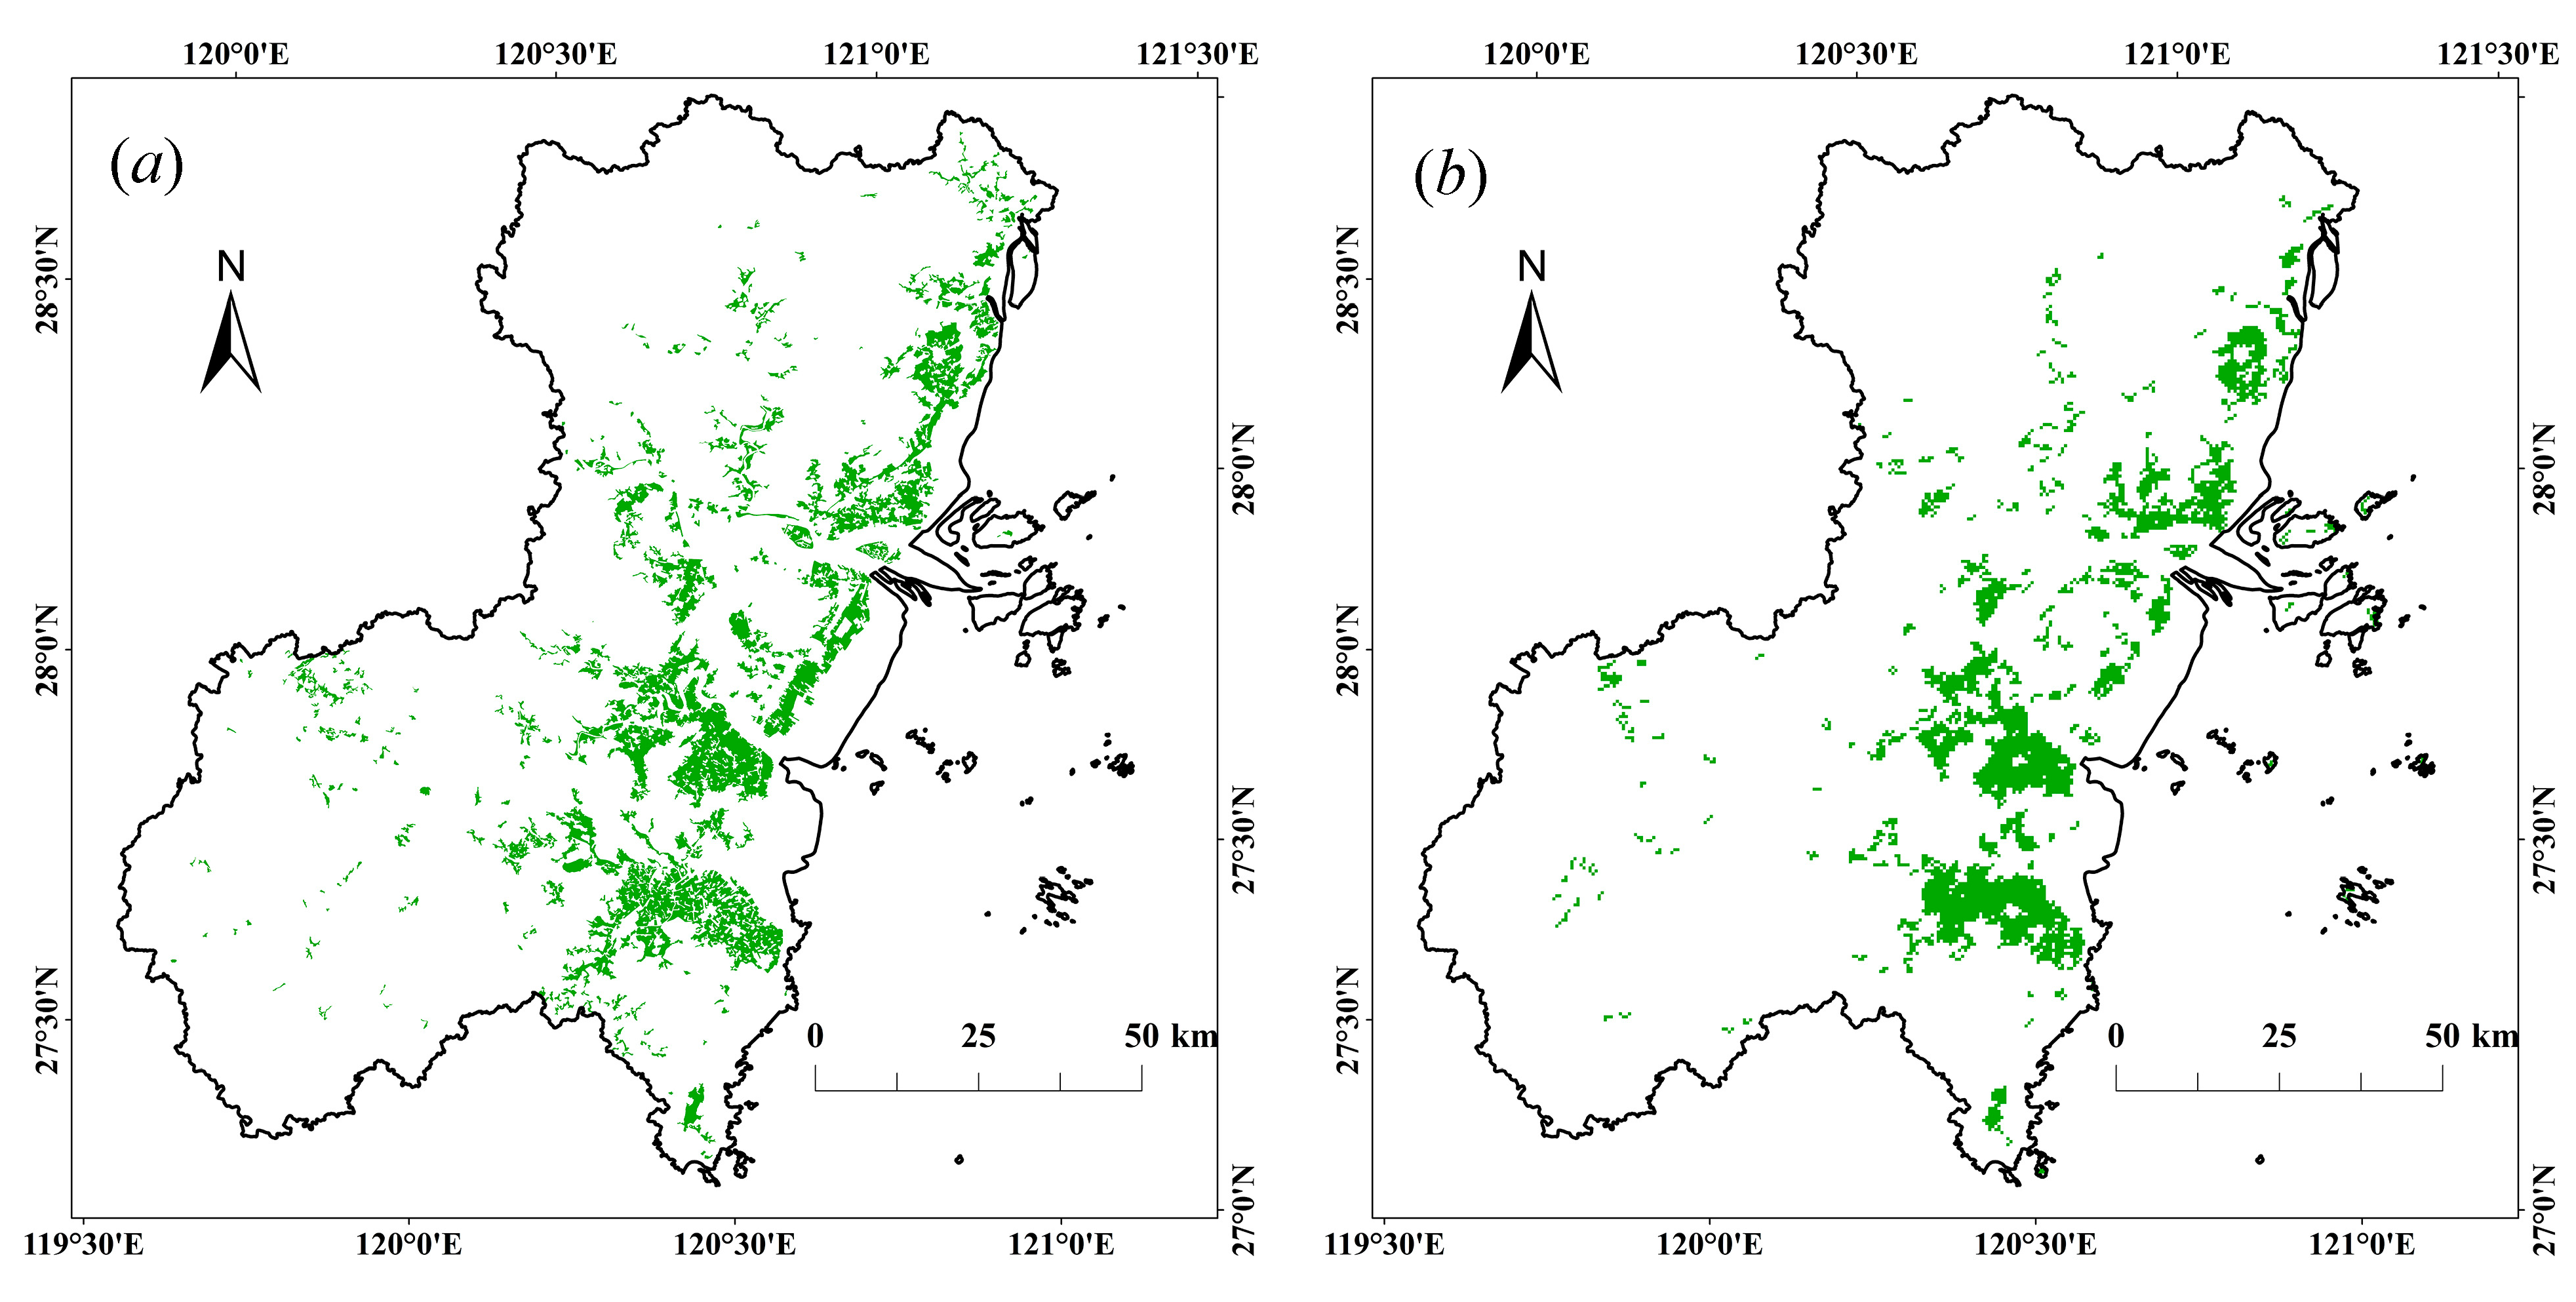
4.3. Spatial Comparison of Extracted Paddy Rice Planting Areas

In addition to the accuracy of the total estimated area, the spatial matching of the MODIS-derived results is also very important for practical applications. Table 2 summarizes the accuracy assessment of the MODIS-derived rice results. At the pixel level, the commission and omission errors were 26.30% and 22.67%, respectively. The user’s and producer’s accuracies were 73.70% and 77.33%, respectively. It is difficult to co-register Landsat ETM+ imagery with MODIS data because of the extremely large difference in spatial resolution between the two datasets. The pixels at the edges of discriminated rice pixels can give rise to considerable error when the accuracy validation is conducted for individual pixels.
Table 2. Accuracy assessment of MODIS-derived results at the studied sites.
LevelCommission Error (%)User’s Accuracy (%)Omission Error (%)Producer’s Accuracy (%)
Pixel level26.3073.7022.6777.33
3 × 3 window3.2396.770.0499.96
Therefore, the commission and omission errors for moving windows of 3 × 3 pixels were also calculated. If a pixel were identified as a rice pixel in the MODIS-derived result, but the eight pixels surrounding it were all labeled as non-rice pixels in the aggregated reference rice map, we considered it to be a committed pixel. If a pixel were labeled as a rice pixel in the aggregated rice map, but no pixels in the moving 3 × 3 pixel window surrounding it were identified as rice in the MODIS-derived result, it was considered to be an omitted pixel. In this analysis, the user’s and producer’s accuracies were found to be 96.77% and 99.96%, respectively.
Figure 15. Irrigated paddies in the land use map (a) and the rice distribution map derived from MODIS (b) for Wenzhou City in 2005.
Remotesensing 07 08883 g015
Although an irrigated paddy indicated in the land use map may be used not only for planting paddy rice, but also for planting aquatic plants, such as reeds and lotus roots, any MODIS-derived rice region should be located in an irrigated paddy. Therefore, a pixel was considered to be misclassified if it was a MODIS-derived rice pixel located in a non-irrigated paddy region. The irrigated paddy regions in the land use map of Wenzhou City for 2005 were extracted for the validation of the spatial matching of the results derived using the MODIS algorithm. In Figure 15a, it is seen that the majority of irrigated paddies were concentrated in the eastern coastal region, especially in Yueqing, Rui’an, Pingyang and Cangnan, and that the total area of irrigated paddies in Wenzhou City in 2005 was 109.7 kha. The two maps shown in Figure 15 were overlaid to examine the agreement between them. The number of pixels extracted using the MODIS algorithm was 4309, 88.95% of which were located in irrigated paddy regions. As indicated by the spatial matching analysis at the county level, the accuracy was lowest in counties with less than 5 kha (Table 3).
Table 3. Consistency analysis of MODIS-derived rice pixels with irrigated paddies in Wenzhou City, 2005.
CityNumber of Rice Pixels Located in Irrigated PaddiesNumber of RiceMOD *Overlap Proportion (%)Area of Irrigated Paddies (kha)Area of RiceMOD (km2)
Yueqing83288893.6921.3819.06
Pingyang58662593.7616.5013.42
Wencheng559359.143.512.00
Yongjia17823874.797.995.11
Taishun5539.430.661.14
Dongtou3525.770.061.12
Wenzhou37144084.3212.449.44
Rui’an81087892.2625.0818.85
Cangnan993104295.3022.1022.37
Total3833430988.95109.7092.50
* RiceMOD denotes the rice pixels derived from MODIS.

5. Conclusions

In this study, the NWDWI was proposed to enhance the signal of flooding regions in remotely-sensed images. The algorithm for the identification of flooded pixels was evaluated based on spectral data measured in the field, as well as ETM+ and MODIS data. Built-up regions and natural watersheds could be readily separated using the NWDWI and EVI. The spatial distribution maps of rice with different cropping patterns (i.e., early rice, single cropping rice and double cropping late rice) in the period of 2000–2010 were generated using a decision tree classification algorithm. The accuracy of the extracted annual total rice area was greater than 85%, except for 2007 and 2010, for which it was poorer, because of the large areas of cloud masking during the transplanting period. The identified rice areas were also validated at the county level. The MODIS-derived area of late rice demonstrated a higher consistency with the census data during the period of 2000–2010. The user’s and producer’s accuracies for moving windows of 3 × 3 pixels were both greater than 95%. The algorithm also revealed the interannual variations in single and double cropping rice in the Yangtze River Delta region.
However, there were several factors that may have affected the accuracy of the results, such as cloud contamination, spatial resolution and topography. The accuracy was not satisfactory in counties with complex terrain. The value of a in the formula for the NWDWI used in this study was determined by field experimental data and the ETM+ image and was appropriate for discriminating rice pixels at a spatial resolution of 500 m during the transplanting stage. The higher value of a in NWDWI could lead to misclassifying numbers of non-rice pixels as rice pixels. Otherwise, rice pixels could be omitted by using a lower value of a in NWDWI. The developed algorithm was found to be unsuitable for use in regions with continuous rainy weather.
Despite the uncertainties in this algorithm, MODIS data are a suitable choice for generating rice distribution maps at large scales, which are useful for long-term grain yield estimations and the detection of changes in land use/cover change. The application of Aqua/MODIS data in combination with Terra/MODIS data could improve the accuracy of our algorithm.

Acknowledgments

This study was supported by the Agricultural Project of Scientific and Technological Research of Shanghai, China (2011-2-11), National High Technology Research and Development Program of China (Grant No. 2012AA12A30703) and Scientific Research Foundation of Ningbo University of Technology. We are grateful for the data support provided by the Land Processes Distributed Active Archive Center (LPDAAC, https://lpdaac.usgs.gov/), the International Scientific Data Service Platform (http://datamirror.csdb.cn/) and the National Meteorological Bureau of China. We would like to thank the anonymous reviewers for their valuable suggestions and comments.

Author Contributions

Jingjing Shi and Jingfeng Huang conceived of and designed the research. Jingjing Shi analyzed the data and wrote the manuscript.

Conflicts of Interest

The authors declare no conflict of interest.

References

  1. Khush, G.S. What it will take to feed 5.0 billion rice consumers in 2030? Plant Mol. Biol. 2005, 59, 1–6. [Google Scholar] [CrossRef] [PubMed]
  2. Food and Agriculture Organziation of the United Nations. Statistical Yearbook 2013: World Food and Agriculture; FAO: Rome, Italy, 2013. [Google Scholar]
  3. Frolking, S.; Qiu, J.J.; Boles, S.; Xiao, X.M.; Liu, J.Y.; Zhuang, Y.H.; Li, C.S.; Qin, X.G. Combining remote sensing and ground census data to develop new maps of the distribution of rice agriculture in China. Glob. Biogeochem. Cycles 2002, 16, 31–38. [Google Scholar] [CrossRef]
  4. Huke, R.E.; Huke, E.H. Rice Area by Type of Culture: South, Southeast, and East Asia. A Review and Updated Data Base; IRRI: Los Baños, Philippines, 1997. [Google Scholar]
  5. Leff, B.; Ramankutty, N.; Foley, J.A. Geographic distribution of major crops across the world. Glob. Biogeochem. Cycles 2004, 18, GB1009. [Google Scholar] [CrossRef]
  6. Liu, J.Y.; Liu, M.L.; Zhuang, D.F.; Zhang, Z.X.; Deng, X.Z. Study on spatial pattern of land-use change in China during 1995–2000. Sci. China Ser. D: Earth Sci. 2003, 46, 373–384. [Google Scholar]
  7. McCloy, K.R.; Smith, F.R.; Robinson, M.R. Monitoring rice areas using Landsat MSS data. Int. J. Remote Sens. 1987, 8, 741–749. [Google Scholar] [CrossRef]
  8. Oguro, Y.; Suga, Y.; Takeuchi, S.; Ogawa, H.; Tsuchiya, K. Monitoring of a rice field using Landsat-5 TM and Landsat-7 ETM+ data. Adv. Space Res. 2003, 32, 2223–2228. [Google Scholar] [CrossRef]
  9. Okamoto, K.; Fukuhara, M. Estimation of paddy field area using the area ratio of categories in each mixel of Landsat TM. Int. J. Remote Sens. 1996, 17, 1735–1749. [Google Scholar] [CrossRef]
  10. Li, Y.Z.; Zeng, Y. Study on methods of rice planting area estimation at regional scale using NOAA/AVHRR data. J. Remote Sens. 1998, 2, 125–130. (In Chinese) [Google Scholar]
  11. Andres, L.; Salas, W.A.; Skole, D. Fourier analysis of multi-temporal AVHRR data applied to a land cover classification. Int. J. Remote Sens. 1994, 15, 1115–1121. [Google Scholar] [CrossRef]
  12. Xiao, X.; Boles, S.; Frolking, S.; Salas, W.; Moore, B.; Li, C.; He, L.; Zhao, R. Observation of flooding and rice transplanting of paddy rice fields at the site to landscape scales in China using VEGETATION sensor data. Int. J. Remote Sens. 2002, 23, 3009–3022. [Google Scholar] [CrossRef]
  13. Quarmby, N.A. Towards continental scale crop area estimation. Int. J. Remote Sens. 1992, 13, 981–989. [Google Scholar] [CrossRef]
  14. Gumma, M.K.; Gauchan, D.; Nelson, A.; Pandey, S.; Rala, A. Temporal changes in rice-growing area and their impact on livelihood over a decade: A case study of Nepal. Agric. Ecosyst. Environ. 2011, 142, 382–392. [Google Scholar] [CrossRef]
  15. Gumma, M.K.; Nelson, A.; Thenkabail, P.S.; Singh, A.N. Mapping rice areas of south Asia using MODIS multitemporal data. J. Appl. Remote Sens. 2011, 5. [Google Scholar] [CrossRef]
  16. Sakamoto, T.; Yokozawa, M.; Toritani, H.; Shibayama, M.; Ishitsuka, N.; Ohno, H. A crop phenology detection method using time-series MODIS data. Remote Sens. Environ. 2005, 96, 366–374. [Google Scholar] [CrossRef]
  17. Zhang, X.Y.; Friedl, M.A.; Schaaf, C.B.; Strahler, A.H.; Hodges, J.C.F.; Gao, F.; Reed, B.C.; Huete, A. Monitoring vegetation phenology using MODIS. Remote Sens. Environ. 2003, 84, 471–475. [Google Scholar] [CrossRef]
  18. Neue, H.U. Methane emission from rice fields. Bioscience 1993, 43, 466–474. [Google Scholar] [CrossRef]
  19. Quarmby, N.A.; Milnes, M.; Hindle, T.L.; Silleos, N. The use of multi-temporal NDVI measurements from AVHRR data for crop yield estimation and prediction. Int. J. Remote Sens. 1993, 14, 199–210. [Google Scholar] [CrossRef]
  20. Lunetta, R.S.; Knight, J.F.; Ediriwickrema, J.; Lyon, J.G.; Worthy, L.D. Land-cover change detection using multi-temporal MODIS NDVI data. Remote Sens. Environ. 2006, 105, 142–154. [Google Scholar] [CrossRef]
  21. Huete, A.R.; Liu, H.Q.; Batchily, K.; van Leeuwen, W. A comparison of vegetation indices over a global set of TM images for EOS-MODIS. Remote Sens. Environ. 1997, 59, 440–451. [Google Scholar] [CrossRef]
  22. Huete, A.; Didan, K.; Miura, T.; Rodriguez, E.P.; Gao, X.; Ferreira, L.G. Overview of the radiometric and biophysical performance of the MODIS vegetation indices. Remote Sens. Environ. 2002, 83, 195–213. [Google Scholar] [CrossRef]
  23. McFeeters, S.K. The use of the Normalized Difference Water Index (NDWI) in the delineation of open water features. Int. J. Remote Sens. 1996, 17, 1425–1432. [Google Scholar] [CrossRef]
  24. Xu, H.Q. Modification of Normalised Difference Water Index (NDWI) to enhance open water features in remotely sensed imagery. Int. J. Remote Sens. 2006, 27, 3025–3033. [Google Scholar] [CrossRef]
  25. Xiao, X.M.; Boles, S.; Liu, J.Y.; Zhuang, D.F.; Frolking, S.; Li, C.S.; Salas, W.; Moore, B. Mapping paddy rice agriculture in southern China using multi-temporal MODIS images. Remote Sens. Environ. 2005, 95, 480–492. [Google Scholar] [CrossRef]
  26. Qiu, B.W.; Li, W.J.; Tang, Z.H.; Chen, C.C.; Qi, W. Mapping paddy rice areas based on vegetation phenology and surface moisture conditions. Ecol. Indic. 2015, 56, 79–86. [Google Scholar] [CrossRef]
  27. Mosleh, M.K.; Hassan, Q.K. Development of a remote sensing-based “Boro” rice mapping system. Remote Sens. 2014, 6, 1938–1953. [Google Scholar] [CrossRef]
  28. Yi, S.; Saito, Y.; Zhao, Q.H.; Wang, P.X. Vegetation and climate changes in the Changjiang (Yangtze river) delta, China, during the past 13,000 years inferred from pollen records. Quat. Sci. Rev. 2003, 22, 1501–1519. [Google Scholar] [CrossRef]
  29. Vermote, E.F.; Vermeulen, A. Atmospheric Correction Algorithm: Spectral Reflectance (MOD09), MODIS Algorithm Technical Background Document, version 4.0; University of Maryland: Maryland, MD, USA, 1999. [Google Scholar]
  30. Gitelson, A.A.; Kaufman, Y.J.; Merzlyak, M.N. Use of a green channel in remote sensing of global vegetation from EOS-MODIS. Remote Sens. Environ. 1996, 58, 289–298. [Google Scholar] [CrossRef]
  31. Spruce, J.P.; Sader, S.; Ryan, R.E.; Smoot, J.; Kuper, P.; Ross, K.; Prados, D.; Russell, J.; Gasser, G.; McKellip, R.; et al. Assessment of MODIS NDVI time series data products for detecting forest defoliation by gypsy moth outbreaks. Remote Sens. Environ. 2011, 115, 427–437. [Google Scholar] [CrossRef]
  32. Groten, S. NDVI—Crop monitoring and early yield assessment of Burkina Faso. Int. J. Remote Sens. 1993, 14, 1495–1515. [Google Scholar] [CrossRef]
  33. Sun, H.S.; Huang, J.F.; Li, B.; Wang, H.S. Study on the regionalization of paddy rice information acquirement through remote sensing technology in China. Sci. Agric. Sin. 2008, 41, 4039–4047. [Google Scholar]
  34. Cheng, Q.; Wang, R.C. Estimation of the rice planting area using digital elevation model and multitemporal moderate resolution imaging spectroradiometer. Trans. Chin. Soc. Agric. Eng. 2005, 21, 89–92. (In Chinese) [Google Scholar]
  35. Zhan, X.; Defries, R.; Townshend, J.R.G.; Dimiceli, C.; Hansen, M.; Huang, C.; Sohlberg, R. The 250 m global land cover change product from the Moderate Resolution Imaging Spectroradiometer of NASA’s Earth Observing System. Int. J. Remote Sens. 2000, 21, 1433–1460. [Google Scholar] [CrossRef]
  36. Xu, H.W.; Wang, K. Regionalization for rice yield estimation by remote sensing in Zhejiang Province. Pedosphere 2001, 11, 175–184. [Google Scholar]

