Article

Evaluating the Vegetation Recovery in the Damage Area of Wenchuan Earthquake Using MODIS Data

1
Academy of Disaster Reduction and Emergency Management, Beijing Normal University, Beijing 100875, China
2
College of Architecture, University of Nebraska-Lincoln, NE 68588, USA
3
Chinese Research Academy of Environmental Sciences, MEP, Beijing 100012, China
*
Authors to whom correspondence should be addressed.
Remote Sens. 2015, 7(7), 8757-8778; https://doi.org/10.3390/rs70708757
Submission received: 24 January 2015 / Revised: 11 May 2015 / Accepted: 18 May 2015 / Published: 13 July 2015

Abstract

:
The catastrophic 8.0 Richter magnitude earthquake that occurred on 12 May 2008 in Wenchuan, China caused extensive damage to vegetation due to widespread landslides and debris flows. In the past five years, the Chinese government has implemented a series of measures to restore the vegetation in the severely afflicted area. How is the vegetation recovering? It is necessary and important to evaluate the vegetation recovery effect in earthquake-stricken areas. Based on MODIS NDVI data from 2005 to 2013, the vegetation damage area was extracted by the quantified threshold detection method. The vegetation recovery rate after five years following the earthquake was evaluated with respect to counties, altitude, fault zones, earthquake intensity, soil texture and vegetation types, and assessed over time. We have proposed a new method to obtain the threshold with vegetation damage quantitatively, and have concluded that: (1) The threshold with vegetation damage was 13.47%, and 62.09% of the field points were located in the extracted damaged area; (2) The total  vegetation damage area was 475,688 ha, which accounts for 14.34% of the study area and was primarily distributed in the central fault zone, the southwest mountainous areas and along rivers in the Midwest region of the study area; (3) Vegetation recovery in the damaged area was better in the northeast regions of the study area, and in the western portion of the Wenchuan-Maoxian fracture; vegetation recovery was better with increasing altitude; there is no obvious relationship between clay content in the topsoil and vegetation recovery; (4) Meadows recovered best and the worst recovery was in mixed coniferous broad-leaved forest; (5) 81,338 ha of vegetation in the damage area is currently undergoing degradation and the main vegetation types in the degradation area are coniferous forest (31.39%) and scrub (34.17%); (6) From 2009 to 2013, 41% has been restored to the level before the earthquake, 9% has not returned but 50% will continue to recover. The Chinese government usually requires five years as a period for post-disaster reconstruction. This paper could be regarded as a guidance for Chinese government departments, whereby additional investment is encouraged for vegetation recovery.

Graphical Abstract

1. Introduction

A disturbance is a relatively discrete event that disrupts the structure of an ecosystem, community or population [1,2]. Currently, human activities and natural hazards are the primary disturbance factors for vegetation and ecosystems. Research on vegetation and ecosystem disturbance primarily centres on human activities [3,4,5], such as resource exploitation, construction [6] and urban expansion [7]. In addition, natural hazards also disturb ecosystem and vegetation groups, such as climate change [8,9], fire [10], flood [11], earthquake and draught [1].
Short-term earthquake damage and subsequent impact on the local ecosystem were analysed with respects to vegetation damage and recovery. Based on various studies, there are two ways to study vegetation damage and recovery. The first method is to calculate vegetation density, species diversity, basal area, etc. from field data and use statistical analysis to study vegetation damage and recovery [12,13]. This method is very precise but requires a large amount of manpower and requires more resources such as money and equipment. Because this method requires a long time for collection of observed data, it is not conducive to large-scale monitoring of vegetation recovery. The second method involves the use of indices, such as vegetation recovery rate [14,15,16], collapse rate [15] and landscape pattern metrics [17]. Statistical methods are used to obtain the regional spatial distribution patterns of vegetation damage and vegetation recovery change over time. This approach is suitable for rapidly and efficiently extracting damaged areas and evaluating vegetation damage and recovery in a disaster area. The data are available through a wide range of disaster surveys and long-term assessments. However, there are some problems: the threshold for extraction of vegetation damage area is experimental and strongly subject to randomness [14,15,16]; previous scholars have studied vegetation recovery over one or two years and did not have enough images to describe the yearly change of vegetation recovery [14,16,18].
Relative variables are often used to detect vegetation change and express vegetation information in remote sensing analysis and are categorized as the Normalized Differential Vegetation Index (NDVI) [15,16,18], Fractional Vegetation Coverage (FVC) [17], vegetation cover index [14,18], Gross Primary Productivity (GPP) [19], etc. There are two types of methods for extracting vegetation damage: one is to use a change detection threshold [15,16], and the other is to employ image classification [18,20]. Of these, the former is more subjective, and the latter requires repeated image classification, the reliability of which seriously affects the precision of the extraction of the damaged area. There are also two ways to validate the extraction accuracy of the damaged area: one is to use images with higher spatial resolution to validate the image with lower resolution [17], and the other is to examine the extraction using field data [21]. The vegetation recovery can be characterised by the vegetation recovery rate [14,15,16,17], landscape pattern metrics [17,21], land cover variation [21], etc. At present, there are two main study events to examine earthquakes as a major disturbance factor; namely, the Jou-Jou earthquake that occurred in Central Taiwan in 1999 [14,15,18,20,21,22] and the Wenchuan earthquake that occurred on the Chinese Mainland in 2008 [7,16,17,23]. This paper utilizes previous variables such as Vegetation Damage Rate (VDR) [17] and Vegetation Recovery Rate (VRR) [14,15,16,17] to extract vegetation damage area and evaluate vegetation recovery. However, this paper emphasizes the vegetation recovery after five years and a synthetic and comprehensive analysis (considering more influence factors on vegetation recovery) is used.
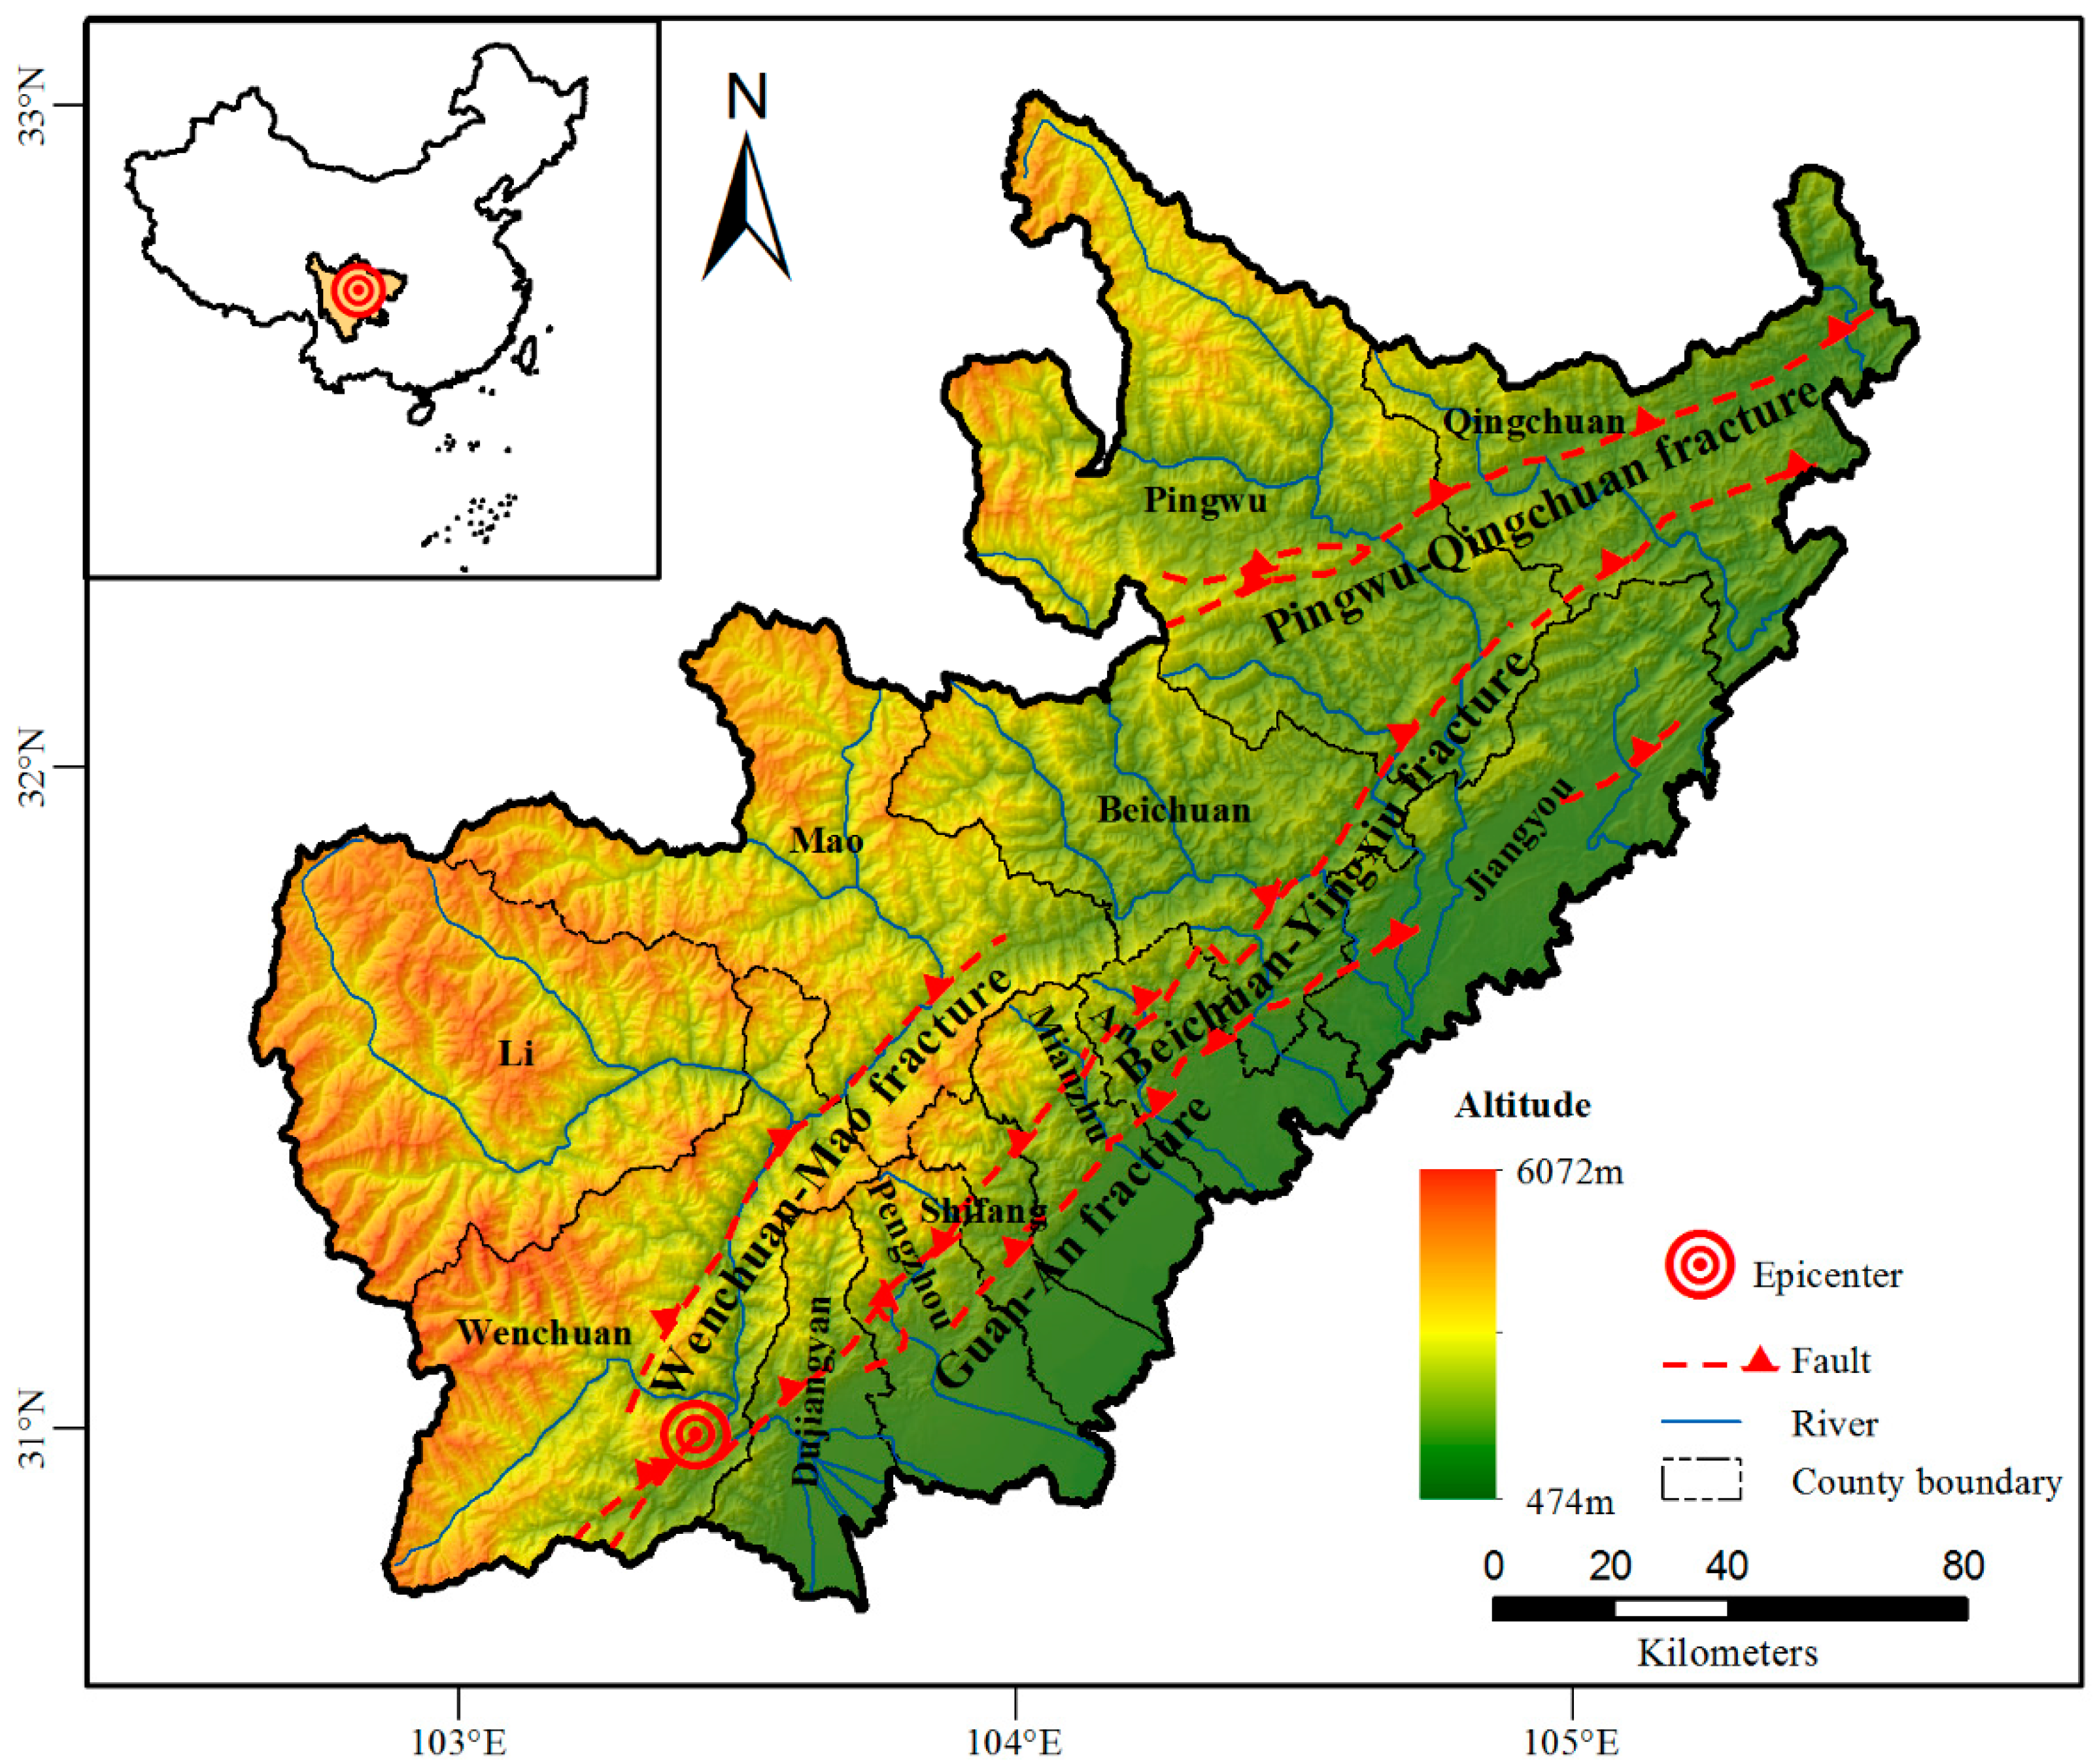
The Wenchuan earthquake, which occurred on 12 May 2008, resulted in substantial damage to the local ecological environment and human infrastructure. The severely afflicted areas include not only key national areas for ecological function [7] but also water resource conservation zones for the Chengdu Plain [7] which is an important habitat for giant pandas and other endangered species [13]. This region is called the “Green Lung” of the middle and lower reaches of the Yangtze River for its wide range of forest cover [16], and it performs extremely important ecological functions, including the conservation of soil and water and biological diversity. Therefore, evaluating the ecological damage and recovery of this severely afflicted area is of great importance. This study is an improvement over previous studies, because (1) this is the first study to evaluate vegetation recovery on space and time in severely afflicted area after five years following the Wenchuan earthquake; (2) a new method to quantitatively determine the threshold is proposed to compensate for subjectivity [14,15,16]; and (3) for a disaster event such as an earthquake, six aspects (i.e., altitude, fault zones, earthquake intensity, soil texture and vegetation types) are normally considered in analyses of vegetation recovery. This approach is synthetic and comprehensive. We tried to include some important aspects for post-disaster assessment in this study, especially for vegetation recovery assessment after the earthquake; (4) we took full advantage of the temporal continuity of the MODIS data to characterise vegetation recovery and changing features between 2009 and 2013 [14,16,18].

2. Materials and Methods

2.1. Study Area

The 8.0 Richter magnitude (China Earthquake Administration) Wenchuan earthquake occurred on 12 May 2008 and caused the most serious damage and had the widest impact of any earthquake in China since the establishment of the People’s Republic of China [24]. The earthquake caused an enormous number of casualties and many geological hazards, such as landslides, rock falls, debris flows, etc., which substantially damaged buildings, infrastructure and the ecological environment [24]. The study area for this paper involves 12 counties or cities seriously damaged by the earthquake, including Wenchuan, Dujiangyan, Pengzhou, Shifang, Mianzhu, Anxian, Jiangyou, Qingchuan, Pingwu, Beichuan, Maoxian and Lixian.
The intensity of the earthquake varied within an elliptical-shaped area centred on Wenchuan and Beichuan. The Wenchuan intensity-XI zone was distributed along Wenchuan-Dujiangyan-Penghzou, and the Beichuan intensity-XI zone was distributed along Anxian-Beichuan-Pingwu. The XI, X and IX intensity zones converged in a long and narrow area, 300 km long and 50 km wide, in the northeast. Because the intensity-VI zone was small, it will not be discussed below.
The study area (Figure 1) is located in northern Sichuan Province in the transitional zone between the Qinghai-Tibet Plateau and the Sichuan Basin and covers an area of 33,147 km2. The terrain tilts from northwest to southeast. The lowest elevation is 474 m, while the highest elevation is 6072 m, a difference of 5598 m. This area has a complex terrain with deep valleys and steep mountains; therefore, landslides, debris flows and other geological hazards are likely. There are 20 rivers in this area, which provide abundant water resources. In addition, this area is the source of the Tuojiang River and the Fujiang River.
Figure 1. The severely damaged counties caused by Wenchuan earthquake, which is located in northern Sichuan province of China.
Remotesensing 07 08757 g001
The Longmenshan fault zone extends across the study area from northeast to southwest, and three near-parallel fault zones extend in a northeast direction: the Wenchuan-Maoxian fracture (mountain fracture), the Yingxiu-Beichuan fracture (central fracture) and the Guan-An fracture (piedmont fracture) [25] (Figure 1). The Yingxiu-Beichuan and Guan-An fractures were triggered by the Wenchuan earthquake at the same time. Beichuan County and Yingxiu Town, which suffered massive devastation during the earthquake, are located in along the Yingxiu-Beichuan fracture.

2.2. Materials

The data used in this paper include NDVI, SRTM, clay content, earthquake intensity and vegetation types.
The NDVI images used in this paper were taken by the MODIS sensor on the Terra satellite, which also provides NDVI images every 16 days at 250-m spatial resolution (MOD13Q1). These data can be used to monitor global vegetation conditions, display land cover and track changes [26].
There are 12 bands for MOD13Q1, and two bands, NDVI and Pixel Reliability, were used in this study. The two NDVI and Pixel Reliability bands were extracted using MRT software, resampled from 231.7 m to 250 m and projected from SIN to an Albers Equivalent Conical Projection. NDVI was used to calculate the fractional vegetation coverage and the band called Pixel Reliability is used to evaluate data availability. The average of the images from 145 to 225 Julian days, collected between 12 May and the end of August each year from 2005 to 2013 was chosen to represent optimal vegetation growth for each year. The reasons for selecting this period of time are: (1) it concludes with the period immediately following the data of the Wenchuan earthquake (12 May) and was therefore suitable for comparing the vegetation for the years before and the years after the earthquake on 12 May 2008; (2) it was the period of the most luxuriant vegetation growth each year, thereby providing the best opportunity to observe the recovery of the vegetation. The Pixel Reliability band shows whether the pixel is useful or not (e.g., potential interference from cloud cover or snow cover). As determined by Pixel Reliability, images from 2009, 2010 and 2012 were influenced by various levels of cloud cover and required preprocessing. The images from 2011 and 2013 had very little cloud cover and did not require preprocessing. The cloud algorithm used in this study was the maximum value composites [27], and the procedure for its use was as follows: images from every two periods were compounded into one representative period, and the resulting image was obtained from the composite of the representative periods. The average cloud cover of the representative image between May and August in 2009 decreased from 19.83% to 6.75%, from 40.13% to 21.54% in 2010 and from 23.01% to 9.57% in 2012. The 2010 image was excluded due to the high level of cloud cover.
The altitude data (Figure 2a) were derived from the Shuttle Radar Topography Mission (SRTM) [28] at 90-meter spatial resolution and used to research the relationship between the vegetation recovery and altitude.
The soil data (Figure 2b) were obtained from the Harmonized World Soil Database (HWSD) of FAO, at 1 km spatial resolution. The clay content of the soil was derived by HWSD and used to evaluate the relationship between the vegetation recovery and soil texture.
The earthquake intensity data (Figure 2b) were downloaded from the website of the China Earthquake Administration [29] and used to research the relationship between the vegetation recovery and earthquake intensity.
The vegetation types (Figure 2c) were obtained from the title Vegetation of China and Its Geographic Pattern [30] and used to research the relationship between the vegetation recovery and vegetation types.
Figure 2. Map shows different data sources used in this paper. (a) Altitude (SRTM) and field points. Field points are marked by researchers just after the earthquake; (b) Clay content (FAO) and earthquake intensity (China Earthquake Administration) (c) Vegetation types.
Remotesensing 07 08757 g002
The field survey points from all counties in the study area (4751 points in total) were used to validate the precision of the extraction. These points, shown in Figure 2a, were geological hazard points marked by researchers immediately following the earthquake and included landslides, debris flows, collapses and unstable slopes.

2.3. Methods

2.3.1. Calculation of Fractional Vegetation Coverage

The Dimidiate Pixel Model based on NDVI was widely applied to calculate FVC (Fractional Vegetation Coverage) because of the need for sample calculation and the independence of the field data collected during the study [31]. The FVC between May and August from 2005 to 2007 was stable; therefore, the average FVC between May and August over three years was computed to represent the pre-quake level of vegetation coverage. The vegetation coverage level immediately following the earthquake was expressed by the average FVC between May and August in 2008, and the vegetation coverage level after the earthquake was the average FVC between May and August for every year (2009‒2013). Due to high levels of cloud cover in 2010, the image for this year was not included in the analysis.

2.3.2. Extraction of Vegetation Damage Areas

Vegetation damage areas caused by the earthquake were the regions where FVC descended rapidly. In this study, vegetation damage areas were characterized by two conditions: slowly and naturally descending FVC and an abrupt decrease in FVC resulting from a burst factor (described as an earthquake in this paper). Some authors [14,15] have used the change detection threshold method to extract landslides, but they did not explain how to determine the threshold. Landslides can be detected by image classification [18], which requires complex computations and is dependent on field samples. This paper proposes a new method to quantitatively determine the threshold more efficiently with simple calculations.
The level of vegetation coverage before the earthquake is represented by FVC0, and the vegetation coverage level after the earthquake is represented by FVC1. Vegetation Damage Rate (VDR) can be expressed by:
V D R = F V C 0 F V C 1 F V C 0 × 100 %
VDR > 0 indicates a decrease in FVC. Districts with decreasing FVC are composed of natural degeneration and an abrupt decrease in FVC caused by the earthquake; the observed limit between those components is the breakpoint. The pixel frequency distribution is described by the image histogram, where the curvature of each point indicates a pixel change. An increased curvature indicates more severe change, therefore, the breakpoint between natural degeneration and earthquake damage is the point where the curvature is maximal in the district of decreasing vegetation. In addition, because of disturbance from the image noise, there may be a pseudo breakpoint that is usually distributed on the two sides of the histogram. It can be excluded by standard deviation as follows: the average ( F V C ¯ ), maximum (FVCmax) and standard deviation (σ) will be computed within the area of VDR > 0 (the area of decreasing vegetation). Most of the data will fall within 3σ (3σ principle in statistics), and the maximum curvature in the histogram can be measured in the open interval of ( F V C ¯ ,   min { F V C ¯ + 3 σ ,   F V C max } ). If the area with vegetation damage is more than 50% of the area being evaluated, the low end of the interval can be expressed as max { F V C min , F V C ¯ 3 σ } . The VDR that corresponds to the maximum curvature is the required threshold T.
{ T = C U R 1 ( max { C U R ( V D R ) } ) , V D R ( F V C ¯ ,   min { F V C ¯ + 3 σ , F V C max } ) C U R ( V D R ) = | f ( V D R + 2 ) + f ( V D R ) 2 f ( V D R + 1 ) { 1 + [ f ( V D R + 1 ) f ( V D R ) ] 2 } 3 2 |
where f(VDR) is the histogram function and CUR(VDR) is the curvature function of the VDR histogram.
If D-set is the vegetation damage area, the damage area can be expressed as:
D = { V D R | V D R T }

2.3.3. Evaluation of Vegetation Recovery in the Damage Area

Before evaluate the vegetation recovery, the data were resampled at 250 m spatial resolution using the nearest neighbour interpolation for the consistency of space resolution and statistical cells, and because the spatial resolution of the most important NDVI data is 250 m.
Vegetation recovery can be expressed as vegetation recovery rate (VRR) as originally applied by Lin et al. [14] in their research on vegetation recovery following the 1999 earthquake in Central Taiwan. The vegetation recovery rate can be expressed by:
V R R = F V C 1 F V C 2 F V C 1 F V C 0 × 100 %
where FVC0 is the vegetation coverage index before the earthquake, FVC1 is the vegetation coverage index immediately following the earthquake, and FVC2 is the vegetation coverage index for a specified period after the earthquake. Greater VRR means better vegetation recovery. According to previous studies in the literatures [15,16,18] and for the convenience of discussion, VRR can be divided into four types, as shown in Table 1.
Table 1. Vegetation Recovery Rate types.
VRR(−∞,0](0,50](50,100](100, +∞)
TypeNot recoveringRecovering slightlyRecovering largelyRecovered fully

3. Results

3.1. FVC Variation in Severely Afflicted Areas

FVC was determined for the periods before and after the Wenchuan earthquake and is presented in Figure 3.
In Figure 3, there is a long (its length is 250 km in length) and narrow (the minimum width is 2~4 km) zone of vegetation decreasing in a northeast direction in the severely afflicted area, especially in the central area where vegetation cover has noticeably decreased. Since 2009, vegetation cover has been gradually increasing, and the zone of decreasing vegetation caused by the earthquake is slowly disappearing (FVC in 2009 is increased by 5.33% from 2008). Evidently, the vegetation in the central portion of the severely afflicted area is also recovering.
Figure 3. Spatial distribution of Fractional Vegetation Coverage (FVC) between May and August. Each image represents the average FVC between May and August in this year. (a) Average FVC before and just after the earthquake; (b) Average FVC after the earthquake. The FVC between May and August from 2005 to 2007 is stable, so the average FVC between May and August over three years is computed to represent the pre-quake level of vegetation coverage. The vegetation coverage level just after the earthquake is expressed by the average FVC between May and August in 2008, and the vegetation coverage level after the earthquake is the average FVC between May and August for every year (2009‒2013). Due to too much cloud cover in 2010, the image for this year was not included in the analysis.
Remotesensing 07 08757 g003

3.2. Extraction and Validation of the Vegetation Damage Area

Curvatures in the green section of Figure 4a are shown in Figure 4b. Most of the curvatures are small, and the maximum curvature is 66 as VDR is equal to 13.47%. Therefore, the threshold T corresponding to the maximum curvature is 13.47%. The area where T ≥ 13.47% indicates that the vegetation damage resulted from the earthquake, and the area where T < 13.47% indicates that the vegetation damage is due to many factors, such as natural degeneration, unapparent impacts of the earthquake, etc.
The area of vegetation damage is 475,688 ha, which accounts for 14.34% of the study area. It is mainly distributed between fault zones, along the rivers (such as Minjiang, Tongkou, Heishuigou and Yuzixi) and in the middle and southwest of the study area. In terms of administrative divisions, the damaged vegetation is concentrated around the boundary of Wenchuan, Dujiangyan, Pengzhou, Shifang, Mianzhu, Anxian, Beichuan, Maoxian and Lixian counties. (Figure 5).
Figure 4. Vegetation Damage Rate (VDR) after the earthquake. (a) VDR histogram in the declining vegetation area where VDR > 0; (b) curvature histogram for the interval of ( F V C ¯ , F V C ¯ + 3 σ ); (c) post-earthquake VDR variability in study area.
Remotesensing 07 08757 g004
Figure 5. Map shows vegetation damage area.
Remotesensing 07 08757 g005
To validate the extraction of the damaged vegetation in the study area, information for 4751 points was collected during a field survey (Figure 2a), including landslides, collapses, debris flows and other geological hazards. A total of 2950 points (62.09%) fell within the damage area extracted by method described above.

3.3. Vegetation Recovery in the Vegetation Damage Area

From 2009 to 2013, the vegetation in the damage area was gradually recovering. The recovery was is manifested by the increase in vegetation that had fully recovered and in vegetation that had largely recovered, while the levels of vegetation with no recovery and vegetation with slight recovery decreased continually. Therefore, the average recovery rate or average recovery type is not a suitable indicator to describe the final status of vegetation recovery after five years. As a result, the final year of the study, 2013, was selected to represent the vegetation recovery status after five years (Figure 6).
Figure 6. Vegetation recovery in 2013.
Remotesensing 07 08757 g006

3.3.1. Differences in Vegetation Recovery by County

The vegetation recovery was highest in Qingchuan, and full vegetation recovery accounted for 72.69% of the damaged area in Qingchuan. The proportions of fully recovered vegetation in Lixian and Pingwu were also greater than 50%. However, the vegetation in Anxian County recovered poorly; only 19.09% of the damaged area had recovered. The proportion of vegetation not recovering was highest in Dujiangyan County where it accounted for 20.84%. The proportion of vegetation not recovering was lowest in Qingchuan and accounts for only 2.17%. In summary, vegetation recovery was highest in the counties of Qingchuan, Lixian, Pingwu and Jiangyou, most of which are located in the northeast of the study area, and vegetation recovery was poorest in the counties of Anxian, Dujiangyan, Shifang and Pengzhou, most of which are located in the east. A large area of vegetation recovery (59.21%) was identified in Lixian County, which is located in the southwest of the study area, but the county also included sites where vegetation had not recovered (11.60%). The areas where vegetation had fully recovered were mostly concentrated in the northeast on the boundary with Qingchuan County, and areas where vegetation had not recovered were primarily type is mainly distributed in the southwest. (Figure 6 and Table 2).
Table 2. Differences in vegetation recovery by county.
CountyTotal Area (ha)Vegetation Recovery Types
Damaged Area (ha)Not Recovering (%)Recovering Slightly (%)Recovering Largely (%)Recovered Fully (%)
Qingchuan321,64317,3162.17 4.05 21.08 72.69
Lixian432,00795,76611.60 8.04 21.15 59.21
Pingwu595,20118,5483.88 5.44 35.01 55.67
Jiangyou272,271999116.07 15.63 27.31 40.99
Maoxian389,93060,7103.68 9.66 46.48 40.18
Mianzhu124,78627,7046.26 11.59 45.11 37.05
Wenchuan408,621138,1408.25 17.23 38.41 36.11
Beichuan308,51624,2856.24 13.02 49.90 30.85
Pengzhou142,32724,60413.84 24.50 33.12 28.54
Shifang82,21418,0489.26 23.63 41.57 25.54
Dujiangyan121,02722,79820.84 22.57 32.56 24.03
Anxian118,35217,7796.45 26.17 48.29 19.09

3.3.2. The Relationship between Vegetation Recovery and Earthquake Intensity

The proportion of the recovered fully type in the damage area was noticeably negatively associated with earthquake intensity. In areas where evidence of earthquake intensity increased (more heavily damaged in the damage area), vegetation recovery was slower. The level of recovered fully type was lowest in the intensity-XI (high intensity) zone, which indicates that only 22.15% had recovered to the level before the earthquake. The recovered fully type in the intensity-VII zone was highest, where 58.45% had recovered to the level before the earthquake. Vegetation with not recovering type accounted for 10.65% in the intensity-XI zone, and vegetation with not recovering type increased from 4.87% to 15.07% in intensity zones X to VII, respectively. (Figure 7 and Table 3).
Figure 7. The relationship between vegetation recovery and earthquake intensity.
Remotesensing 07 08757 g007
Table 3. The relationship between vegetation recovery and earthquake intensity.
IntensityTotal Area (ha)Vegetation Recovery Types
Damage Area (ha)Not Recovering (%)Recovering Slightly (%)Recovering Largely (%)Recovered Fully (%)
XI217,523 83,076 10.65 24.80 42.40 22.15
X345,750 95,789 4.87 18.21 45.80 31.13
IX648,980 63,497 5.96 13.74 40.15 40.15
VIII1,429,477 150,025 7.89 8.39 34.50 49.23
VII673,543 83,276 15.07 9.31 17.17 58.45
VI1621 25 100.00 0.00 0.00 0.00

3.3.3. The Relationship between Vegetation Recovery and Fault Zones

There are two notable zones of vegetation recovery in the fault zones located in the study area (Figure 6): recovered fully type accounted for 54.09% in the western portion of the Wenchuan-Maoxian fracture where the proportion of recovered vegetation is the highest near the fault zones, and the district between the Beichuan-Yingxiu fracture and the Guan-Anxian fracture indicates the least recovered fully (23.41%).

3.3.4. The Relationship between Vegetation Recovery and Soil Texture

The clay content in the topsoil of the study area was divided into eight grades using cluster analysis (Table 4).
The relationship between vegetation recovery and clay content in the topsoil is not obvious, but it was observed that the proportion of vegetation with no recovery trended down with increasing clay levels. When the clay content was 0%, the proportion of areas not recovering was 47.26%. When clay content was greater than 0%, the proportion of vegetation not recovering fluctuated slightly. (Figure 8).
Table 4. Clay grades in the topsoil and vegetation recovery.
GradeClay ContentTotal Area (ha)Vegetation Recovery Types
Damage Area (ha)Not Recovering (%)Recovering Slightly (%)Recovering Largely (%)Recovered Fully (%)
I07099 3630 47.26 5.13 8.50 39.12
II6‒15503,924 91,668 13.23 9.58 17.93 59.26
III18‒19121,035 25,247 6.55 22.46 54.32 16.67
IV20978,085 136,466 5.94 13.02 34.02 47.02
V21636,578 82,080 10.72 13.44 42.77 33.06
VI22851,507 118,671 5.90 17.96 44.17 31.97
VII23107,063 11,132 12.18 16.05 38.70 33.07
VIII39‒46111,603 6793 7.94 8.60 29.53 53.93
Figure 8. The relationship between vegetation recovery and clay content in the topsoil. Clay content is divided into eight grades using cluster analysis. Grade-I means the lowest and grade-VIII means the highest.
Remotesensing 07 08757 g008

3.3.5. The Relationship between Vegetation Recovery and Terrain

Altitude was also divided into eight grades using cluster analysis (Table 5).
The proportions of vegetation with recovering type in low altitude areas and high altitude area were both high, at 34.57% and 16.25%, respectively. Between the altitude-II and altitude-VII levels, the proportion of the vegetation with not recovering type was very low, in the 3% to 6% range. The proportion of recovered fully vegetation was lowest (21%) at altitude-I and highest (66.95%) at altitude-VII (Figure 9).
Table 5. The relationship between vegetation recovery and altitude.
GradeAltitude (m)Total Area (ha)Vegetation Recovery Types
Damage Area (ha)Not Recovering (%)Recovering Slightly (%)Recovering Largely (%)Recovered Fully (%)
I474‒864589,388 28,869 34.57 21.20 23.23 21.00
II865‒1357536,438 52,606 3.20 15.33 43.97 37.51
III1358‒1839461,275 66,550 4.18 17.80 49.26 28.77
IV1840‒2363370,913 70,219 5.44 18.50 51.59 24.47
V2364‒2898367,694 54,288 6.16 16.44 49.07 28.33
VI2899‒3467386,406 46,256 3.28 11.30 42.25 43.17
VII3468‒4071343,600 50,269 2.60 8.12 22.33 66.95
VIII4072‒6072261,181 10,6631 16.25 9.27 13.45 61.03
Figure 9. The relationship between vegetation recovery and altitude. Altitude is divided into eight grades using cluster analysis. Altitude-I means the lowest and altitude-VIII means the highest.
Remotesensing 07 08757 g009

3.3.6. The Relationship between Vegetation Recovery and Vegetation Types

Scrub, cultivated vegetation and coniferous forest are the main vegetation types in the study area. They account for 35%, 19% and 18% of the study area, respectively. Their respective proportions of recovered fully vegetation were 39.49%, 33.51% and 42.15%. Their proportions of vegetation with not recovering were 7.65%, 26.01% and 4.25%, respectively. However, the recovered fully proportion was at the maximum for meadows, approximately 58.66% and was at minimum for grass, approximately 31.58%. The not recovering proportion was at the maximum for cultivated vegetation, approximately 26.01% and was at the minimum for grass, approximately 0.00% (Table 6).
Table 6. The relationship between vegetation recovery and vegetation type.
Vegetation typeTotal Area (ha)Vegetation Recovery Types
Damage Area (ha)Not Recovering (%)Recovering Slightly (%)Recovering Largely (%)Recovered Fully (%)
Coniferous forest598,391 90,153 4.25 12.67 40.93 42.15
broad-leaved forest544,654 67,512 3.43 14.04 46.35 36.19
Mixed coniferous broad leaved forest12,070 2288 0.00 9.89 57.14 32.97
Scrub1,163,630 221,314 7.65 15.71 37.14 39.49
Grass2534 119 0.00 15.79 52.63 31.58
Meadow273,320 29,626 8.91 8.76 23.67 58.66
Alpine vegetation68,893 31,964 22.77 9.48 13.72 54.03
cultivated vegetation641,100 32,712 26.01 17.06 23.42 33.51
Non-vegetated area12,302 0 0000

3.4. Temporal Variation of Vegetation Recovery in the Damage Area from 2009 to 2013

3.4.1. Vegetation Recovery in the Damage Area

According to spatial distribution of vegetation recovery (Figure 10), the better vegetation recovery occurred in the northeast and southwest regions of the study area and the worse recovery was in the central and eastern regions. More digital information could be seen in Figure 11.
Figure 10. Vegetation recovery from 2009 to 2013. White areas mean vegetation is not damaged by the earthquake.
Remotesensing 07 08757 g010
Figure 11. Area variation in vegetation recovery in the damaged area over time.
Remotesensing 07 08757 g011
The damage area within the study area with no vegetation recovery declined from 95,094 ha in 2009 to 41,756 ha in 2013 with a reduction of 13,335 ha per year. The total area recovering slightly decreased from 101,963 ha in 2009 to 67,138 ha in 2013 at a rate of 8706 ha per year. The area in which vegetation had largely recovered increased from 110,106 ha in 2009 to 170,594 ha in 2013 with a reduction of 15,122 ha per year. Finally, the area that recovered fully increased from 168,525 ha in 2009 to 196,200 ha in 2013 at increments of 6919 ha per year (Figure 11).
In 2009, the proportions of the vegetation not recovering, vegetation recovering slightly, vegetation that had largely recovered and vegetation that recovered fully were 20%, 21%, 23% and 35%, respectively. By 2013, the proportions of the four types were 9%, 14%, 36% and 41%, respectively, which indicates that 41% of the vegetation had recovered to the level before the earthquake, 50% was recovering, and 9% showed no signs of recovery after five years. During the five years, the level of vegetation not recovering declined by 11%, the level of vegetation recovering slightly declined by 7%, the level of vegetation that had largely recovered increased by 13% and the vegetation that recovered fully increased by 6% (Table 7).
Table 7. The amount of variation (ha/year) and the rate of the vegetation recovery types per year between 2009 and 2013.
20092013Yearly Variation (ha/year)Yearly Variation Rate (%)
Area (ha)Proportion (%)Area (ha)Proportion (%)
Not recovering95,09419.99 41,7568.78 −13,335 −14.02
Recovering slightly101,96321.43 67,13814.11 −8706 −8.54
Recovering largely110,10623.15 170,59435.86 15,122 13.73
Recovered fully168,52535.43 196,20041.25 69194.11
In conclusion, between 2009 and 2013, the major trend in the severely afflicted earthquake area within the study area was a rapid decrease in vegetation not recovering and a rapid increase in vegetation that recovered fully.

3.4.2. The Transition Matrix for Vegetation Recovery Types

From 2009 to 2013, the vegetation that had largely recovered indicated the highest rate of increase, at 13.73% per year. The vegetation not recovering indicated the highest rate of decrease at 14.02% per year. During the five-year period, the area of vegetation that had largely recovered reached 115,888 ha, of which 52,956 ha (45.69%) was transformed by vegetation that recovered slightly. The vegetation not recovering lost 76,394 ha during the five-year period, of which 28,806 ha (37.71%) became vegetation that had largely recovered, and 24,713 ha (32.35%) was transformed into vegetation that had recovered fully. The area of vegetation recovering slightly decreased by 81,856 ha, of which 52,956 ha (64.69%) became vegetation that had largely recovered. From 2009 to 2013, the most prominent transition of the vegetation in the damaged area was from vegetation not recovering and vegetation recovering slightly to vegetation that had largely recovered (Table 7 and Table 8).
Table 8. The transition matrix of vegetation recovery types between 2009 and 2013 (ha).
2013Not RecoveringRecovering SlightlyRecovering LargelyRecovered Fully
2009
Not Recovering18,700 22,875 28,806 24,713
Recovering Slightly6188 20,106 52,956 22,713
Recovering Largely4431 12,688 54,706 38,281
Recovered Fully12,438 11,469 34,125 110,494
However, 81,338 ha of vegetation is currently undergoing degradation, which accounts for 17.10% of the damaged area. These degradation areas are primarily distributed on ridges or along rivers (Figure 12). The primary vegetation types in these areas are coniferous forest (31.39%) and scrub (34.17%). Of the 81,338 ha, approximately half of the vegetation (34,125 ha or 41.95%) had been transformed from fully recovered vegetation to vegetation that had largely recovered.
Figure 12. Regions with reverse development from 2009 to 2013, where vegetation recovery rate is worse than before. These areas are mainly distributed on ridges or along rivers.
Remotesensing 07 08757 g012

4. Discussion

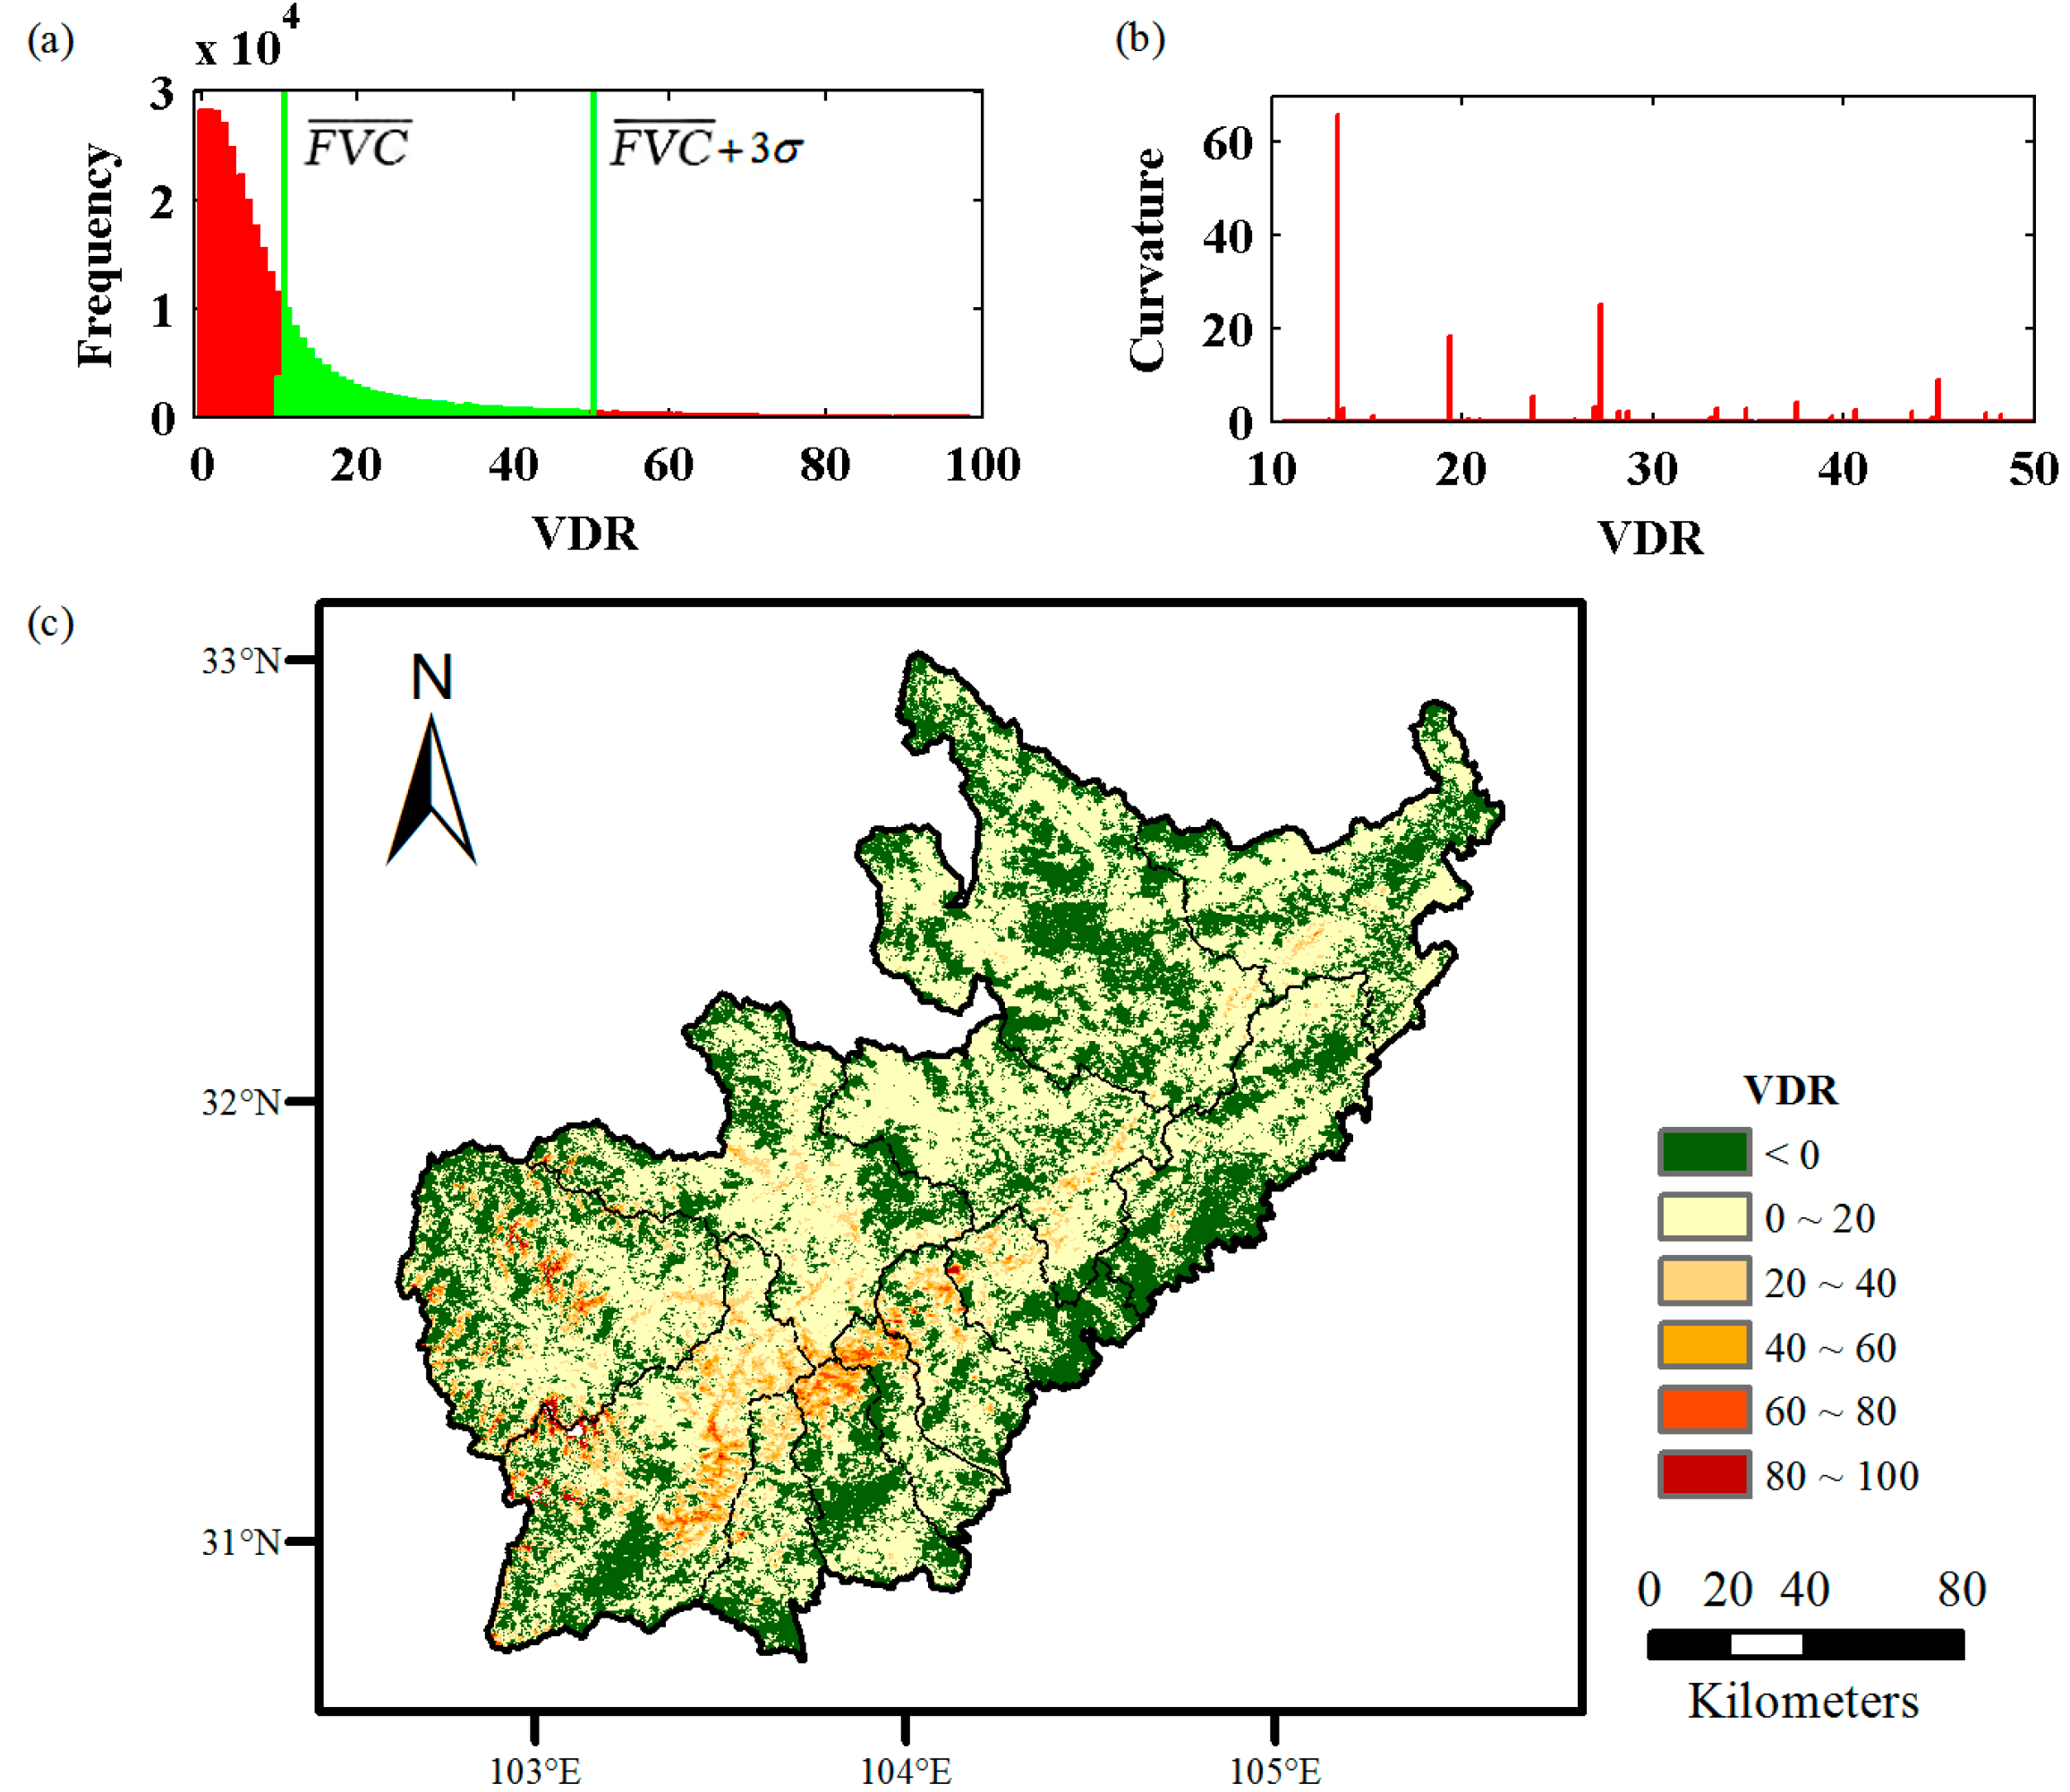
Vegetation damage rate (VDR) is used for describing earthquake-induced vegetation damage. It is assumed that curvature of VDR could reflect abrupt decreases in vegetation related to earthquakes. Based on this assumption, a new method is proposed to quantitatively extract vegetation damage areas. To validate this method, information from 4751 points was collected by field survey, and 2950 of the points (62.09%) were located within the damaged area. The locations of other points outside the damaged area may be due to the following reasons. (1) The landslides were so small (areas less than 250 m × 250 m) that MODIS could not recognize them; (2) The study area was located in mountainous regions covered with dense vegetation and some damaged regions may have been blocked due to the observation angle of the satellite; (3) The study area was covered by clouds that influence the extraction of landslides. Although the most effective monitoring of vegetation damage could have been achieved by using high resolution images such as Landsat TM or Quickbird, low levels of spatial coverage and high costs were the primary limitation. In this mountainous area, another consideration was cloud cover. Because of higher temporal resolution, it is easier for MODIS to remove cloud.
Similarly to Chou [18] and Lin [15], vegetation recovery rate (VRR) was used and was divided into four classes for vegetation recovery assessment. However, there were some differences as follows: (1) More aspects were synthesized during the study (
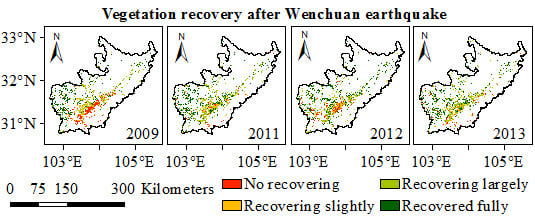
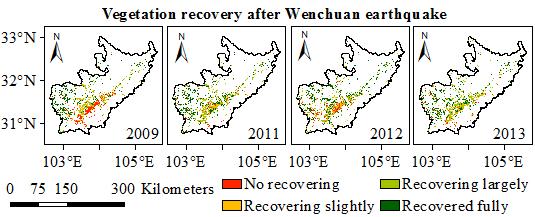
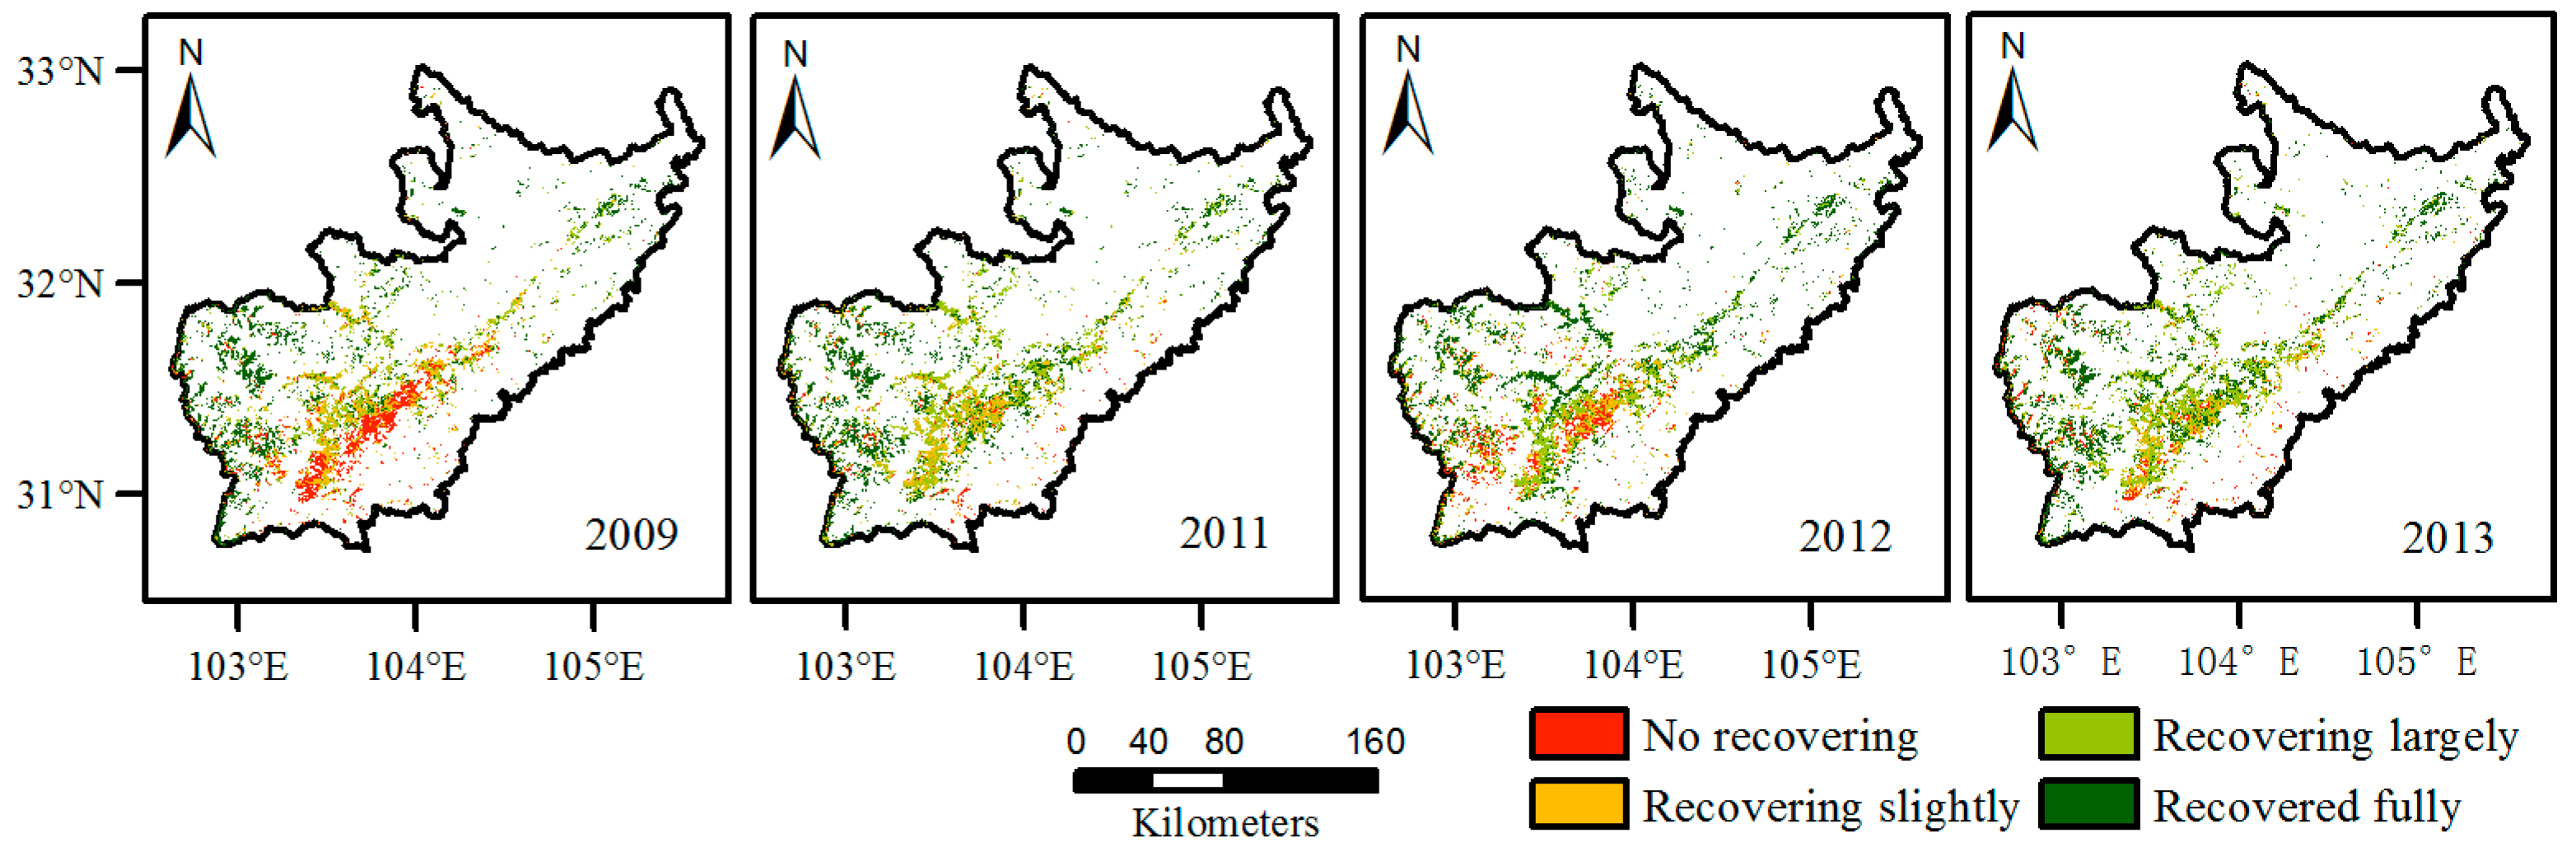
i.e., altitude, fault zones, earthquake intensity, soil texture and vegetation types); (2) Vegetation recovery was analysed over a longer time scale. Vegetation recovery was evaluated for the Wenchuan disaster area from 2009 to 2013, which corresponded to a five-year reconstruction period designated by the Chinese government. This information could provide a more realistic reference for the Chinese government department; (3) The transition matrix for vegetation recovery was applied. During the five-year study period, decreases in vegetation not recovering and recovering slightly promoted the increase of vegetation that largely recovered and vegetation that recovered fully. The most prominent transition was from the vegetation not recovering and vegetation recovering slightly to the vegetation that recovered largely. More interestingly, we also observed that 17.10% of the damaged area suffered degradation. These areas are primarily distributed on ridges or along rivers. This degradation may be caused by two reasons. One reason is that there is an insufficient water supply and poor topsoil on ridges. Another reason is that the Longmenshan Mountains have entered a new period of active geohazards following the Wenchuan [25]. Geohazards initiated by rainstorm will cause massive landslides and may block rivers and produce barrier lakes in five to 10 years [25]—an increase in erosion will occur between river banks and toe slopes.
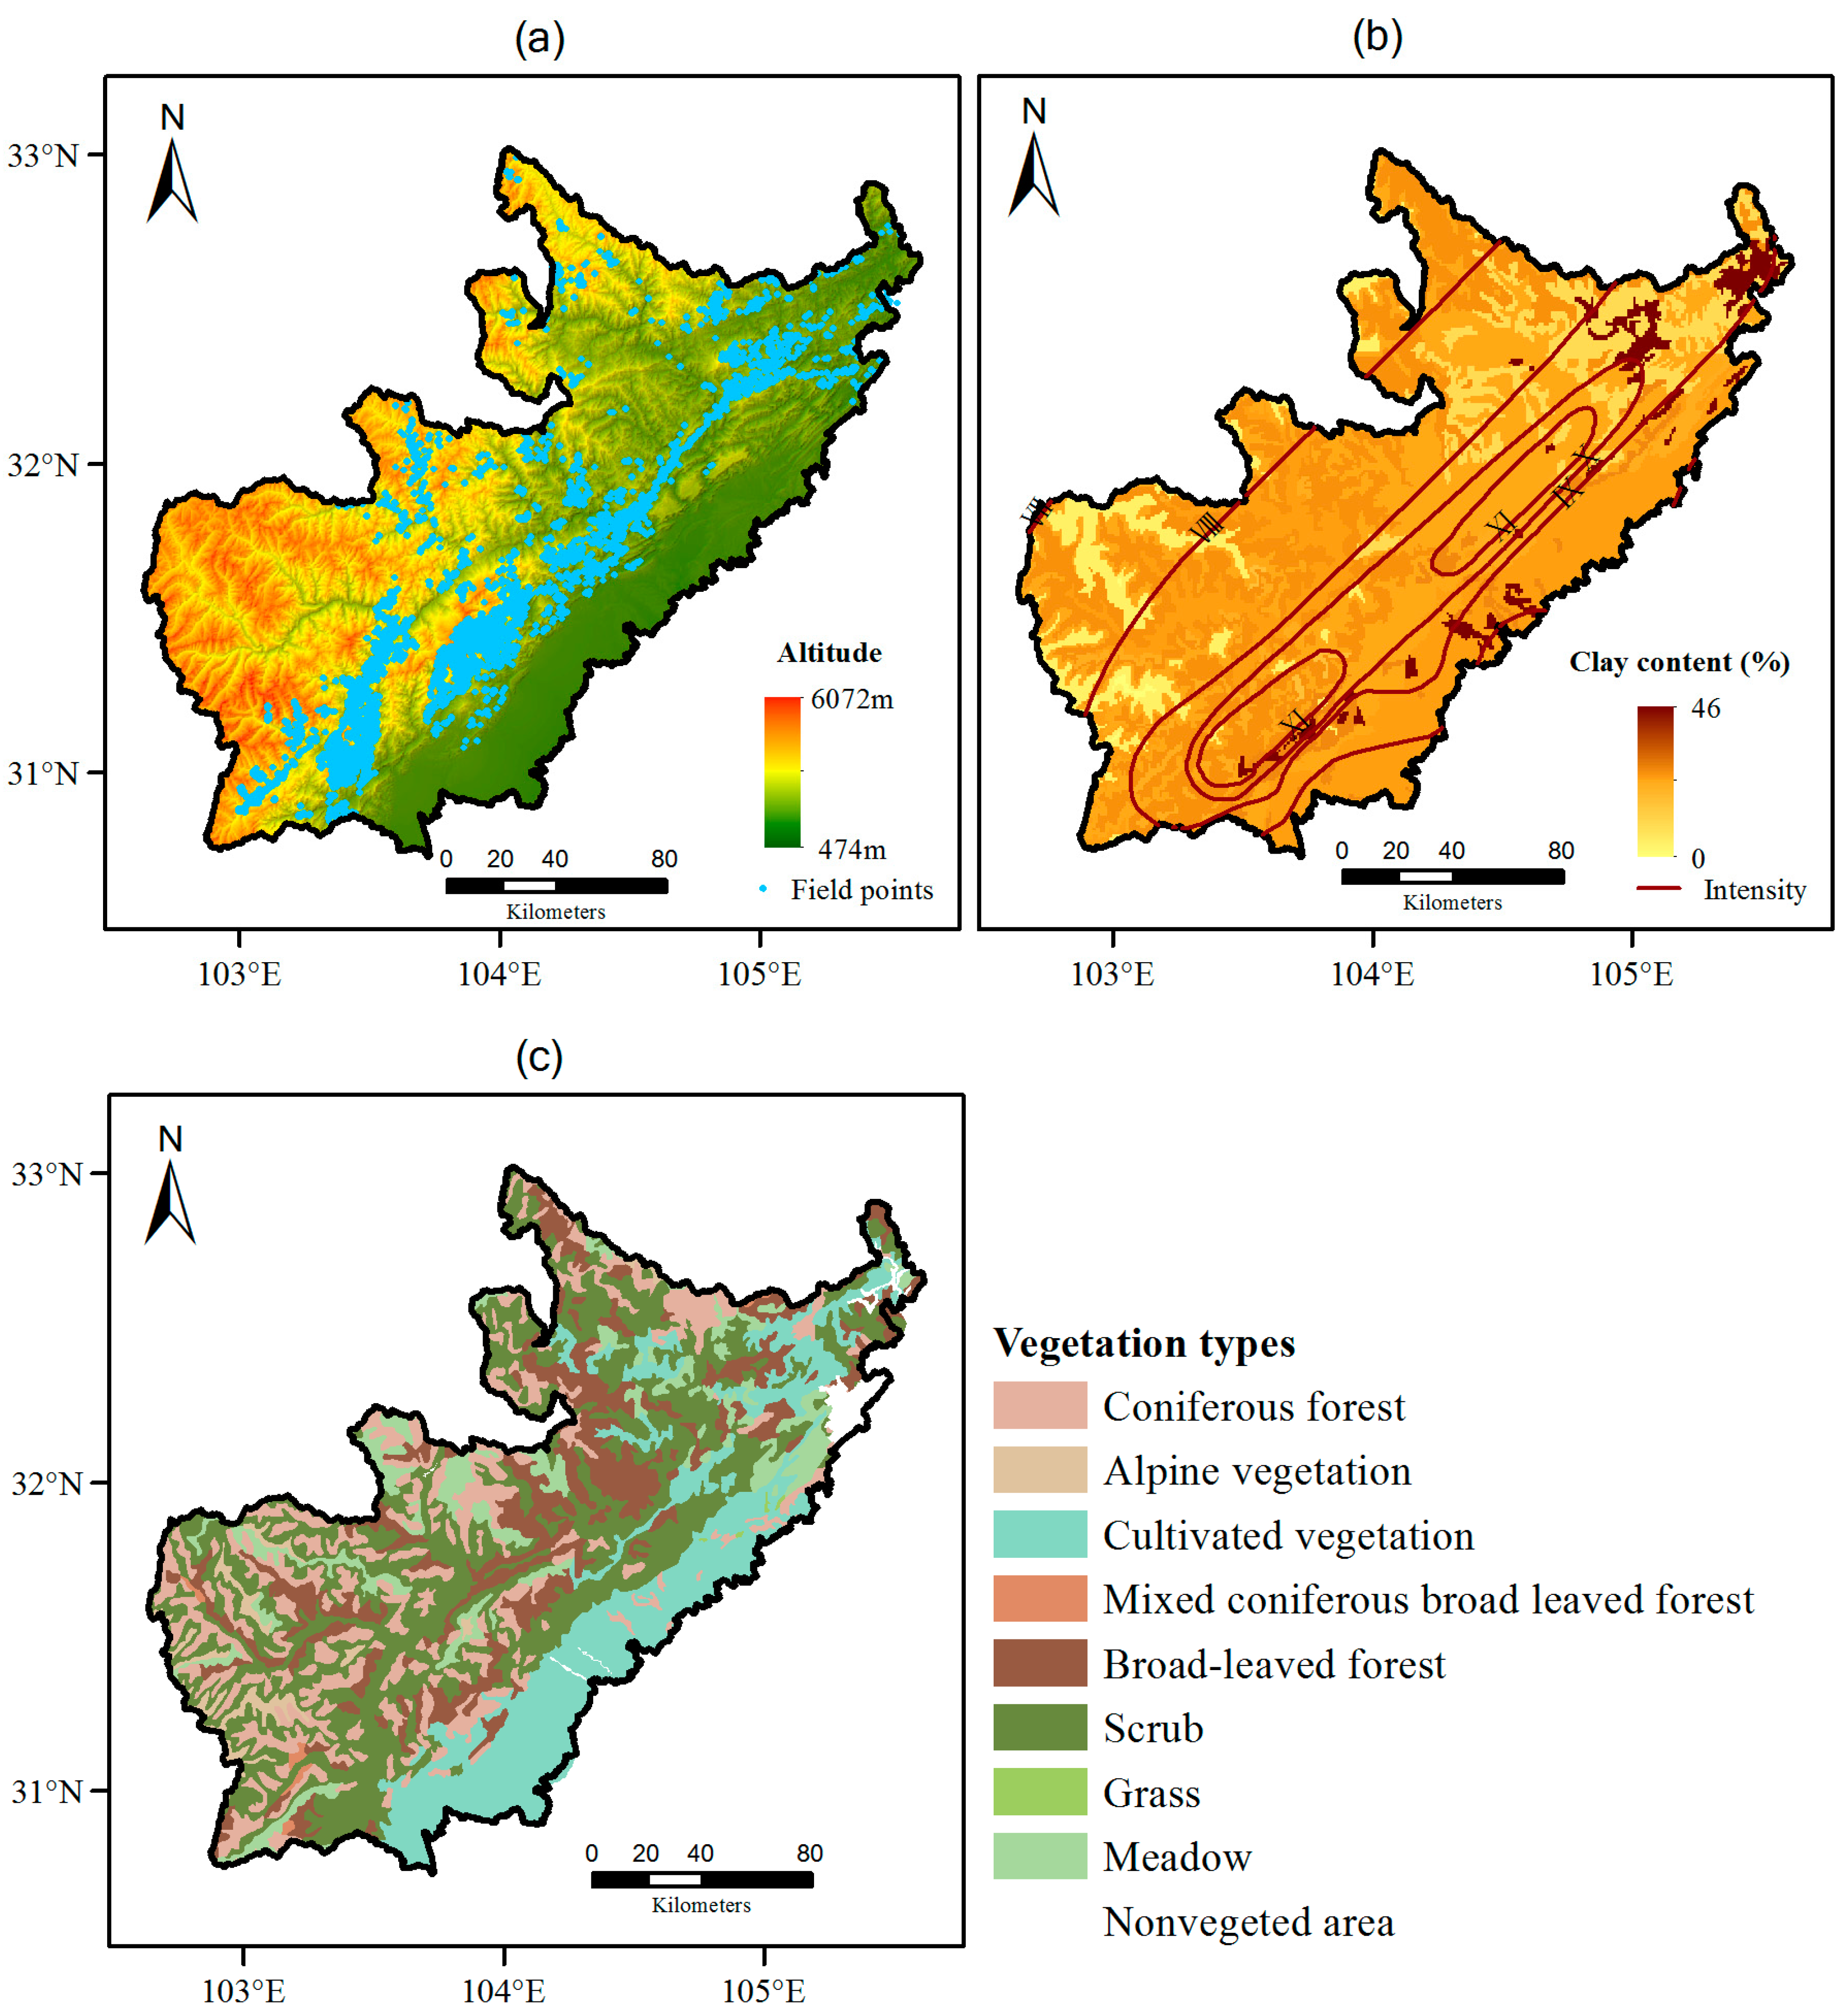
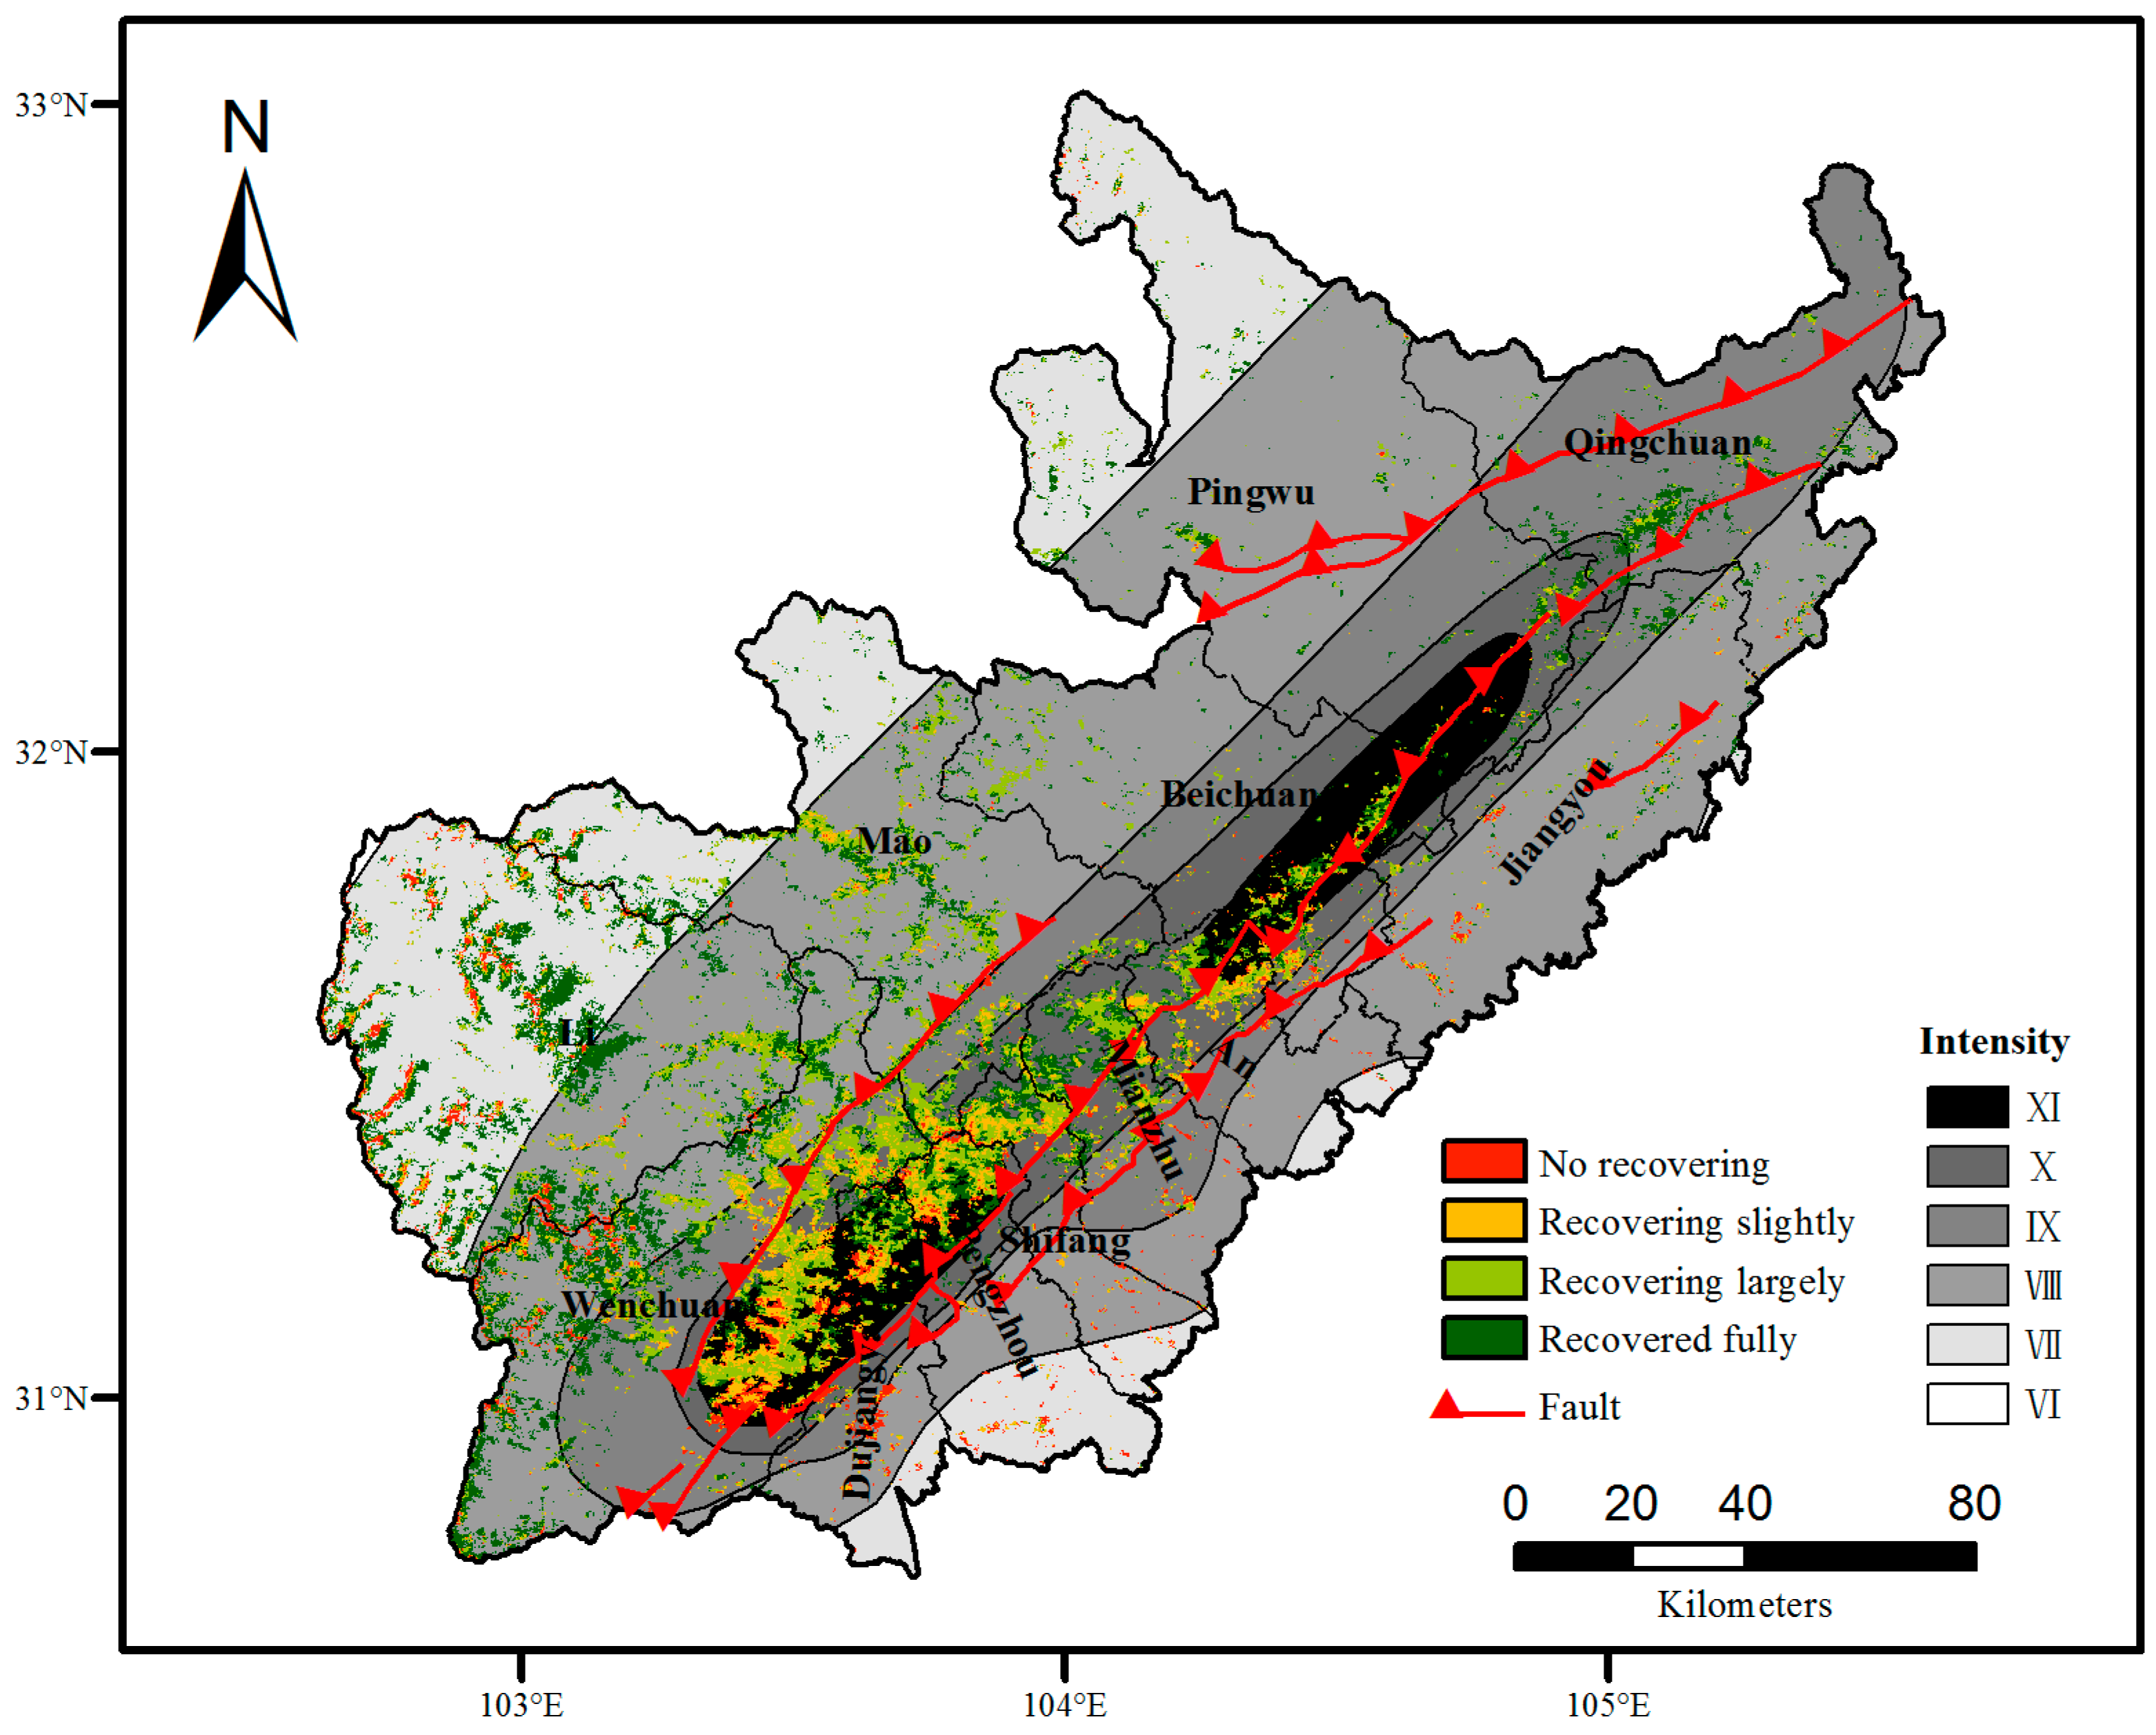
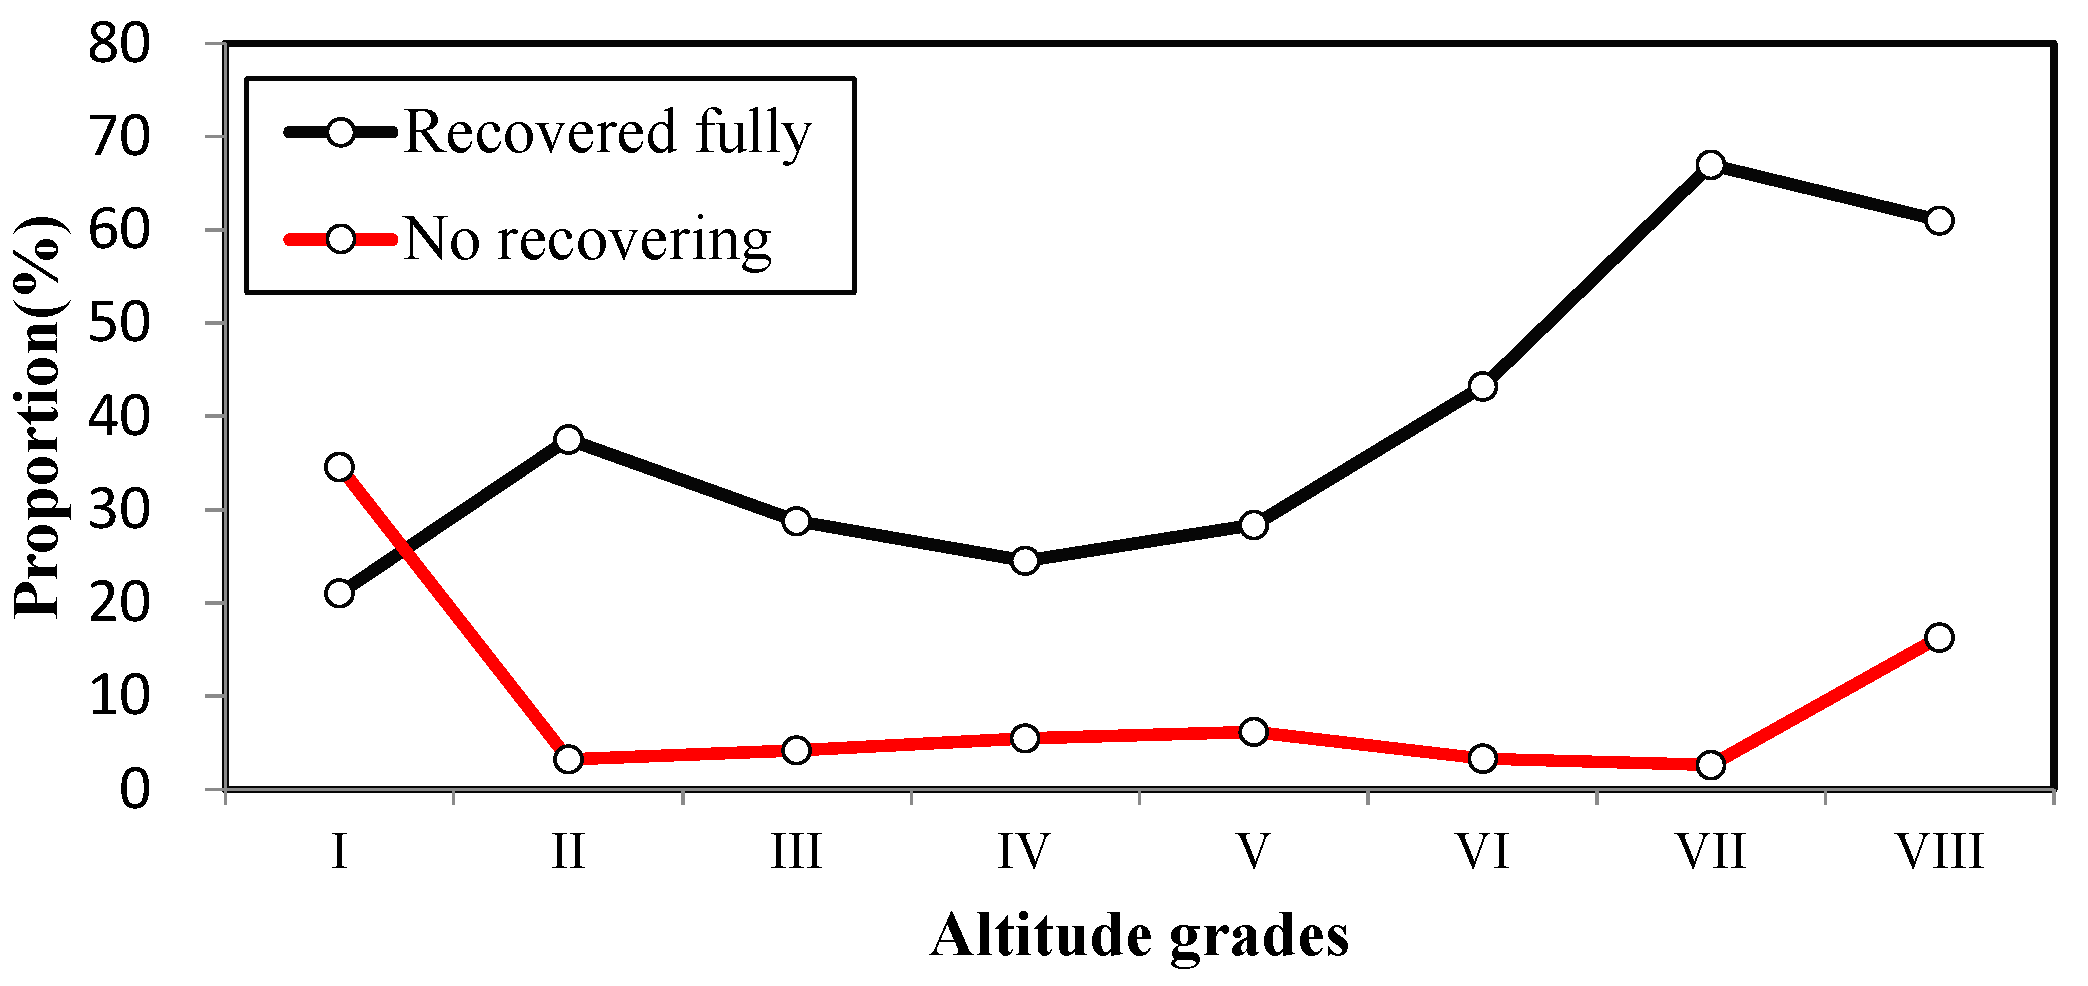
Vegetation recovery observed in our study was primarily distributed in the northeast and southwest regions of the study area. In the northeast regions, such as Qingchuan and Pingwu, vegetation recovered more easily because the relief is much lower than other regions and soil is fertile. However, it is noteworthy that in the southwest regions, such as Lixian, the vegetation recovery rate was also high, even though it is a mountainous region. Another similar finding is that vegetation recovery was stronger with increasing altitude (Figure 9). This may have been caused by two reasons. One reason is that the vegetation of the high altitude areas was damaged more severely, which provides potential for better recovery [
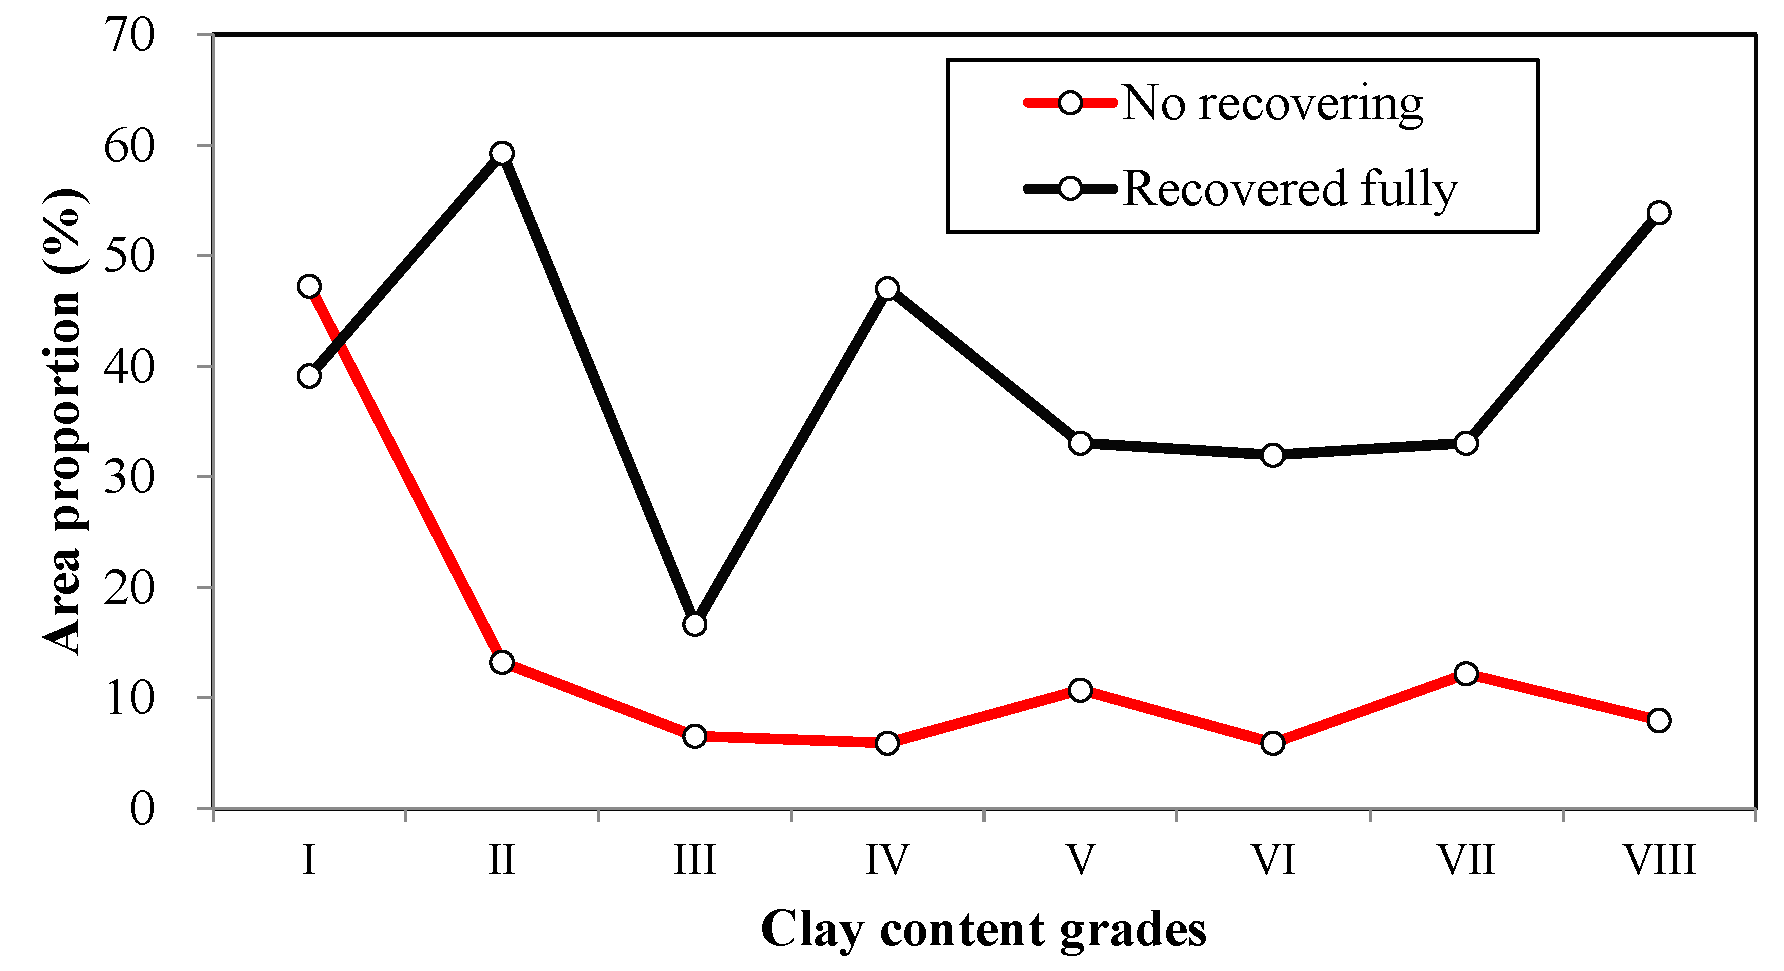
16]. Another reason is that the vegetation was primarily located on the hillsides where sufficient water could be supplied for herbs. In addition, the proportion of vegetation not recovering at high elevations was also high. This vegetation was located along the ridges where there was a lack of water. Therefore, the vegetation along the ridges did not recover as fast as vegetation on the hillsides. Altitude is an important factor for plant growth, but it is not decisive and it must interact with other factors such as topography and water supply to affect vegetation growth. Lu [16] suggested that soil moisture is another important factor for plant growth. Nevertheless, according to our study (Figure 8), there is no obvious relationship between clay content in the topsoil and vegetation recovery. However, a high clay content was beneficial for achieving lower levels of vegetation with no recovery (Figure 8).
Vegetation type is another significant consideration. According to our study, herb areas such as meadows indicated the best vegetation recovery and they recovered better than woody plants. This confirms Liu’s conclusions [19]. After Wenchuan earthquake, there has been sufficient precipitation for undersized vegetation (such as shrubs and herbs) under damaged trees which then became healthier [19]. However, recovery of woody plants will take more time. Therefore, herbs and scrub recovered better than woody plants. The proportion of full recovered grass was slightly lower (only approximately 31.58%). This proportion of recovery was low because the area of grass was small (accounting for 0.08% of the study area) and was influenced by random factors.
There are some uncertainties in vegetation recovery assessment. One uncertainty is due to cloud cover. Some data include levels of cloud cover that restrict the NDVI of vegetation and influences estimates of vegetation recovery rate. Although maximum value composite (MVC) and average value were used to limit cloud effects in our study, bias may also have been created if there was so much cloud cover in the image that we could not obtain enough clear-sky data. Another uncertainty was the VRR. Because VRR is not a normalized variable with a theoretical range from −∞ to +∞, some abnormal high or low values will influence the results, which is the primary reason why VRR is classified in this paper. A third uncertainty is that the MODIS data had low space resolution and could not recognize the smaller damaged area.

5. Conclusion

This is the first study to evaluate the vegetation recovery on a spatial and temporal basis in the five years following the Wenchuan earthquake. For a disaster event such as an earthquake, six aspects (i.e., altitude, fault zones, earthquake intensity, soil texture and vegetation types) are normally considered in analyses of vegetation recovery. Compared with previous studies, our study was comprehensive. We tried to include some important aspects for post-disaster assessment in this study, especially for vegetation recovery assessment after the earthquake. The Chinese government usually requires five years as a period for post-disaster reconstruction. This paper could be regarded as guidance for Chinese government departments whereby additional investment is needed for vegetation recovery.
Even though Zhang [13], Liu [19] and Cui [23] studied vegetation damage and recovery following the Wenchuan earthquake, they did not provide methods for extracting vegetation damage areas. Zhang [13] used field survey data that required a long period of time and thereby affected the timeliness of disaster relief. This paper uses a mathematical method to rapidly extract vegetation damaged areas. In terms of the techniques and methods, our method is similar to those described in [14,15,16,17,18,21,22]. We all use image difference technology. However, the referenced studies used experimental thresholds to extract vegetation damage areas. This approach is strongly subjective. For that reason, we have proposed a new method to numerically determine the threshold to extract vegetation damage areas with the goal of reducing the effect of human error and providing more objective and stable results. Using this method resulted in the recognition of 62.09% of the geological hazard points with MODIS data.
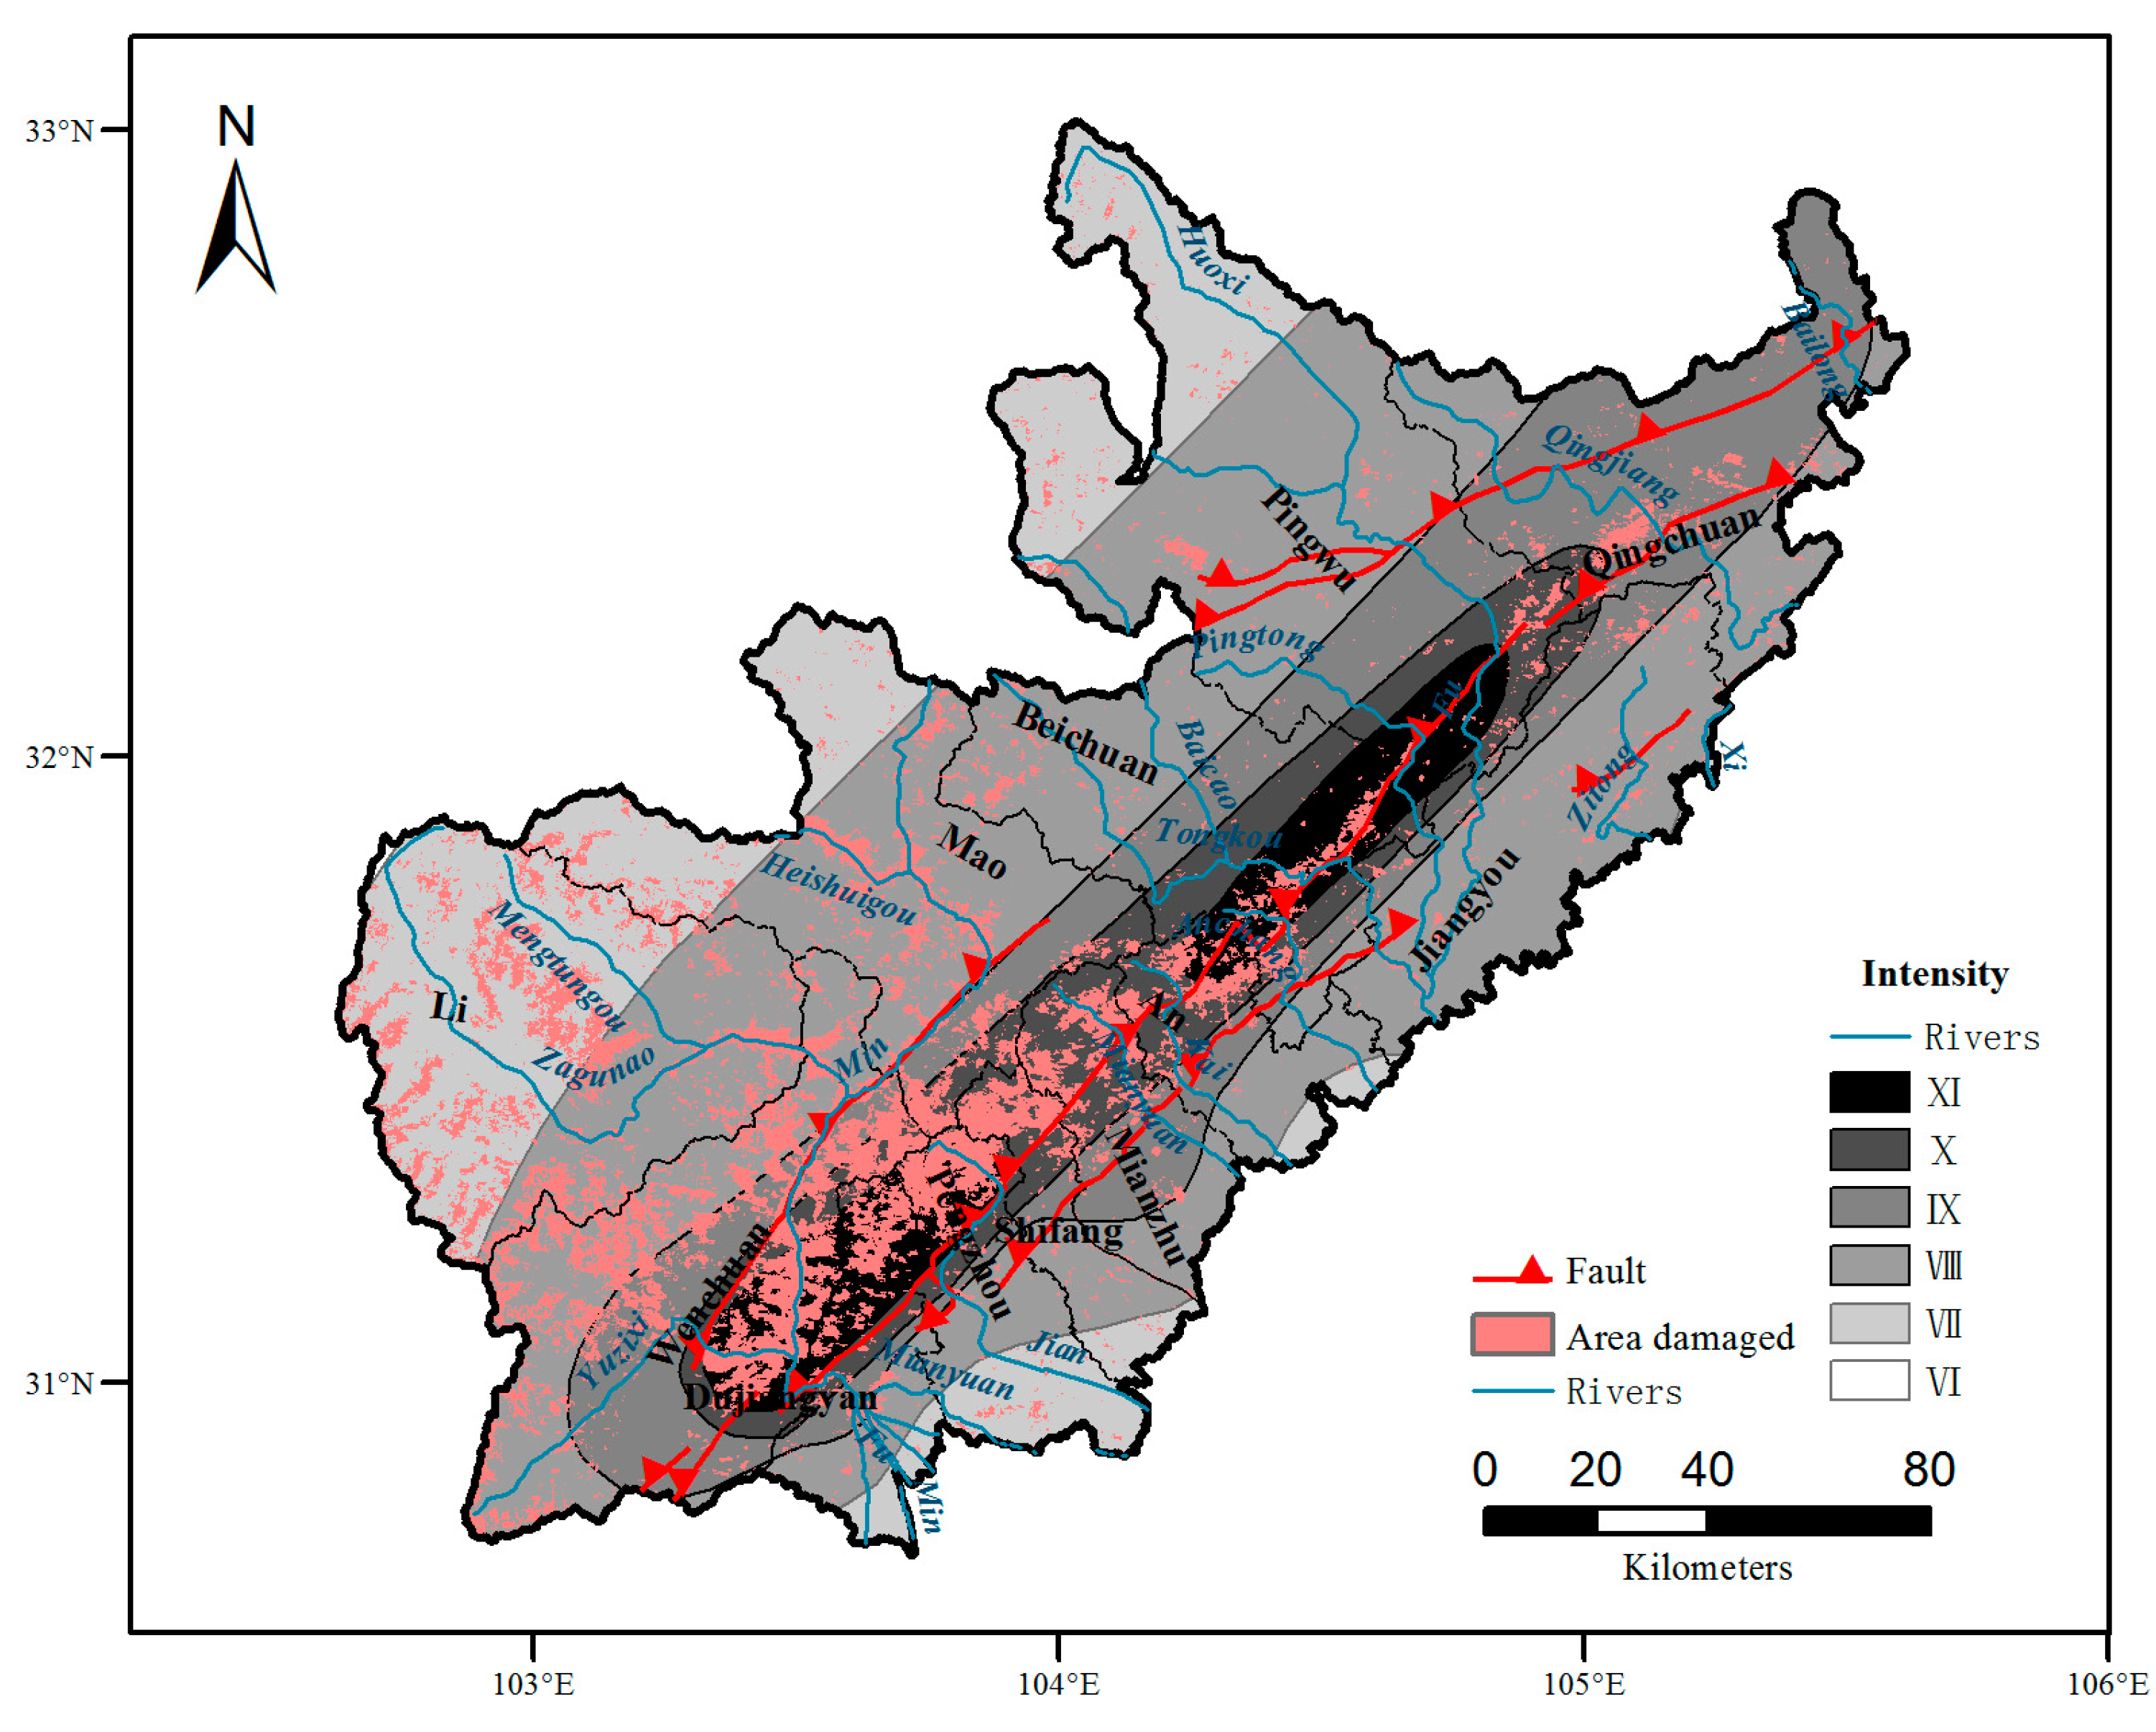
The total area of vegetation damage from the Wenchuan earthquake was 475,688 ha, which accounted for 14.34% of our study area and was primarily distributed in the central fault zone, the southwest mountainous area and along rivers in the mid-west region of the study area. Vegetation recovery in damage areas was better in the northeast region of the study area, and in the western portion of the Wenchuan-Maoxian fracture; vegetation recovery was better with increasing altitude. The relationship between vegetation recovery and clay content in the topsoil is not obvious. The best vegetation recovery was for meadows and the worst recovery occurred in mixed coniferous broad leaved forests.
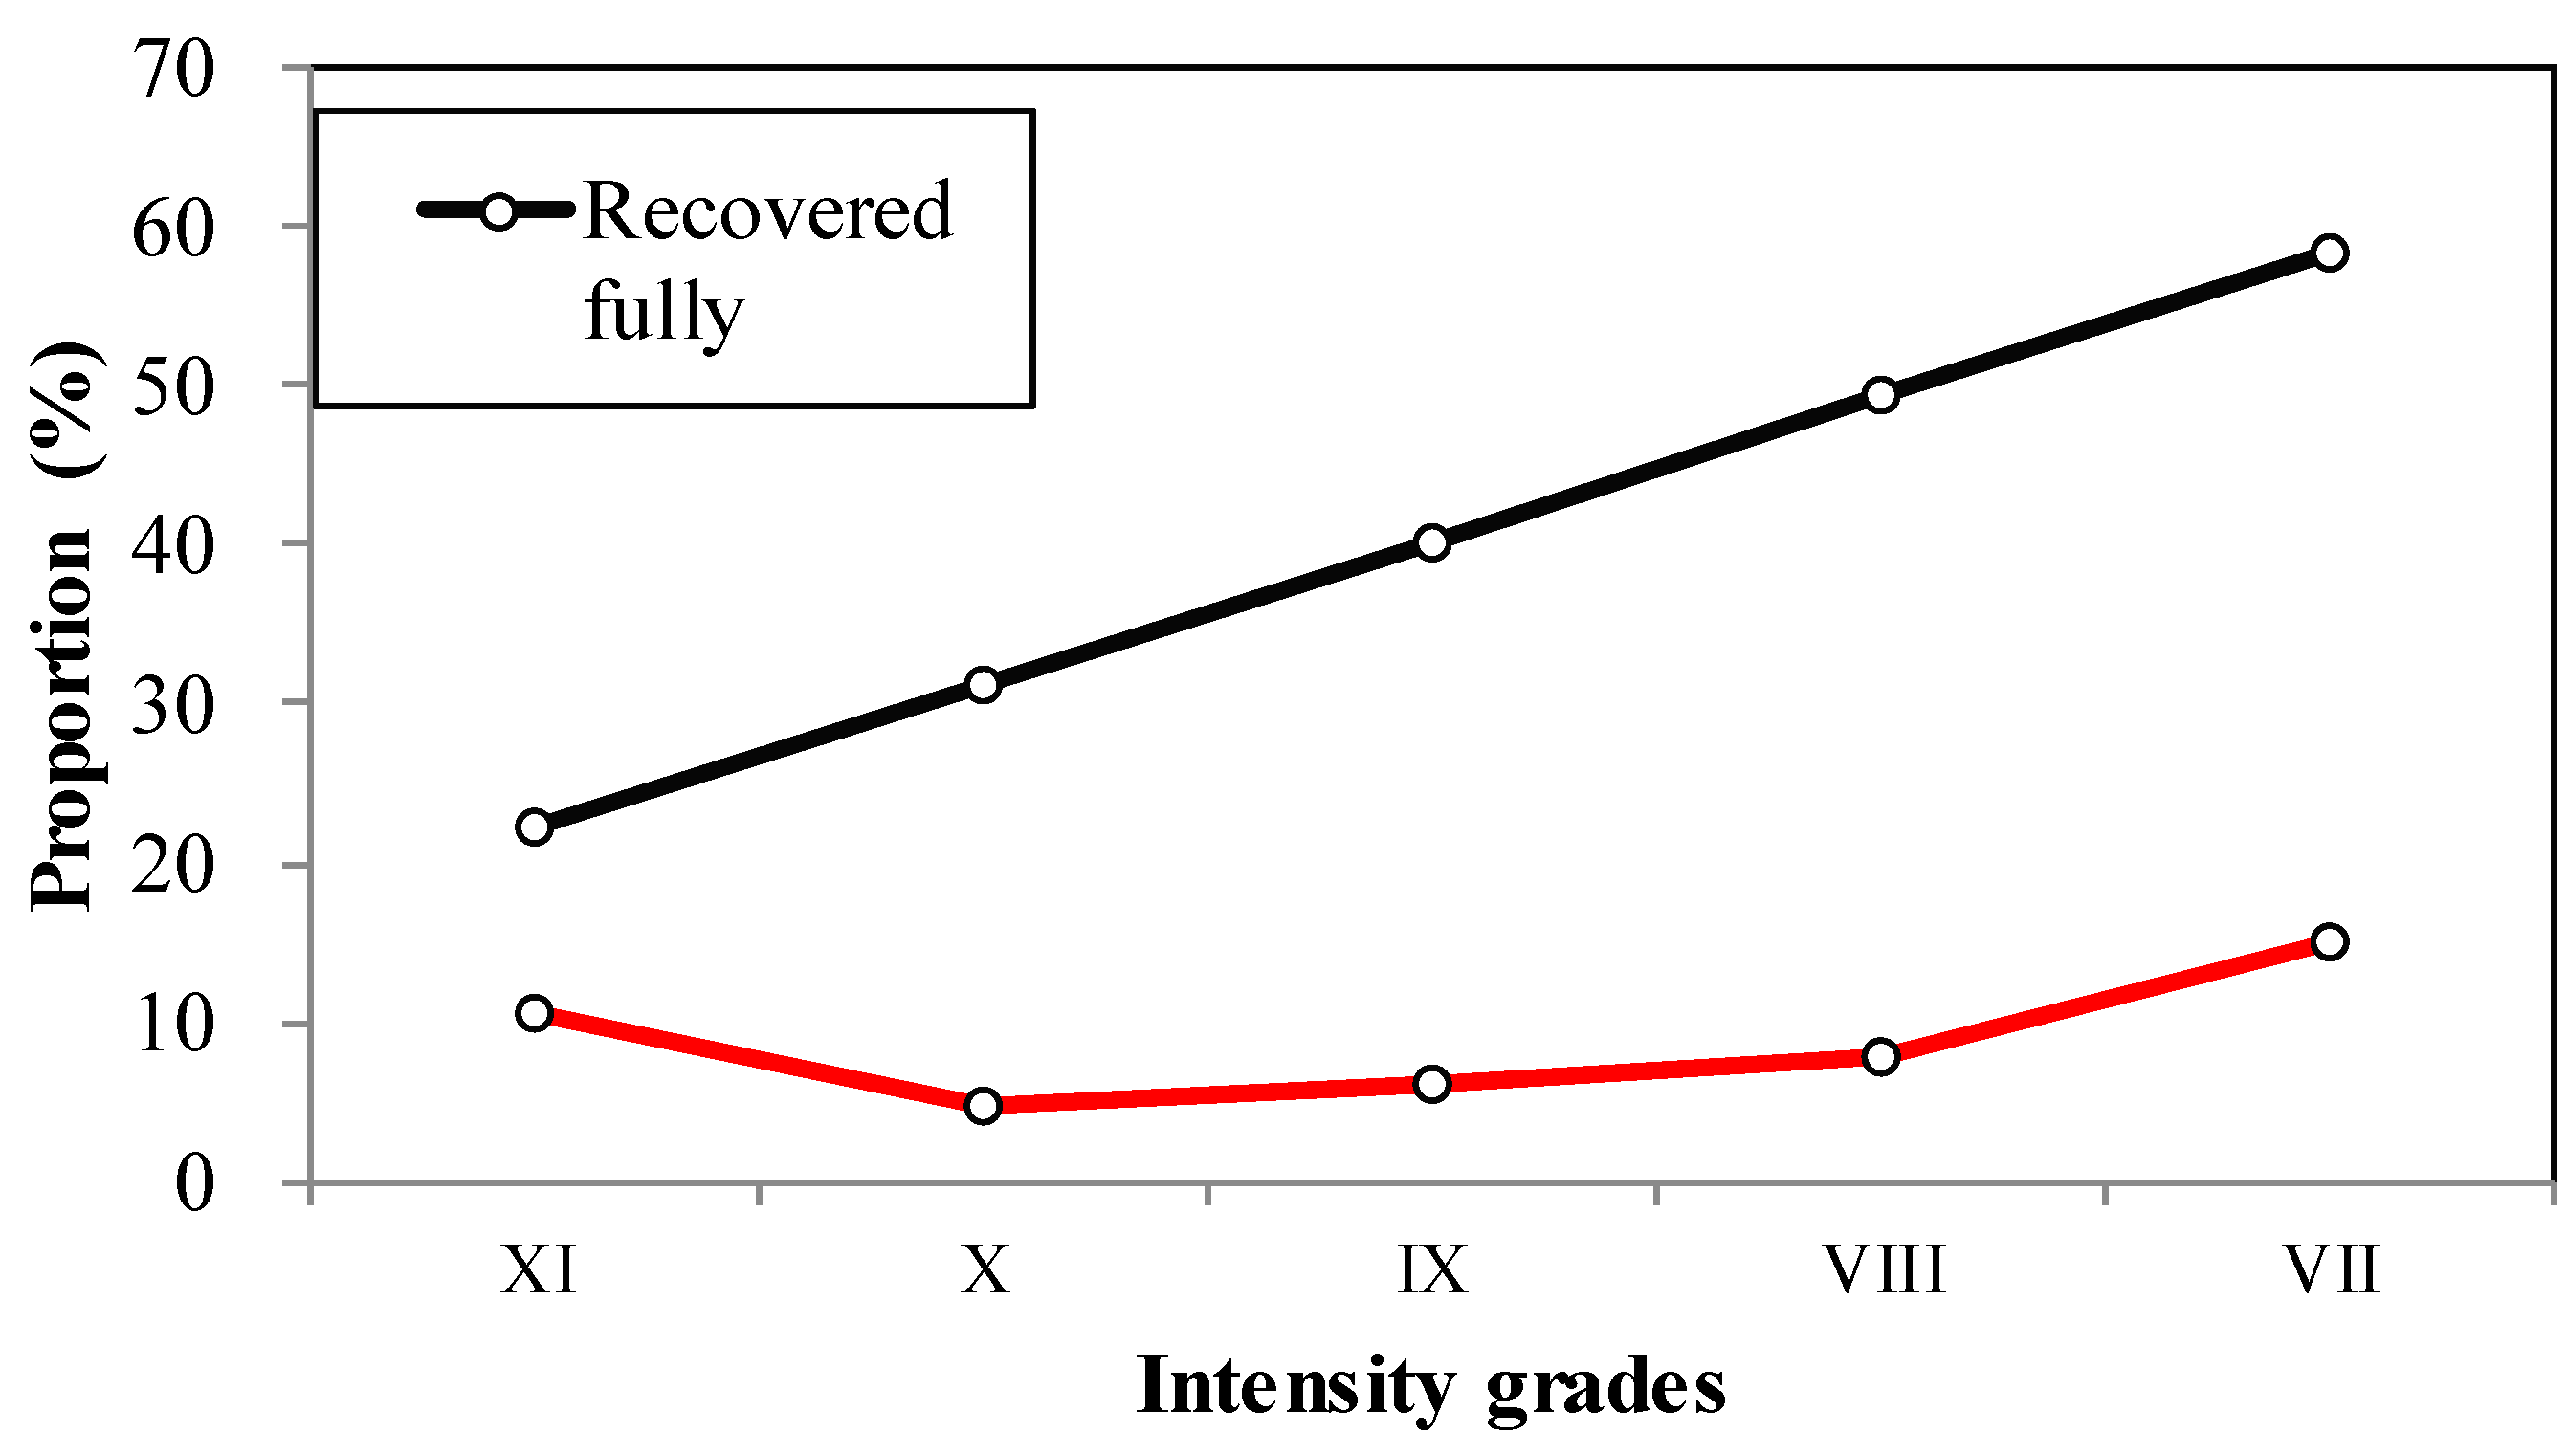
The best vegetation recovery occurred in the northeast and southwest regions of the study area and was better in the mid-west region, but the worst recovery was in the central and eastern regions. After five years of recovery in the severely afflicted area, recovering vegetation accounted for 40% of the damaged areas. The vegetation will continue to primarily transform from vegetation with no recovery to vegetation that has largely recovered, but will never fully recover. Some areas such as southeast proportion of the study area and the mountains have a high proportion of vegetation with no recovery. Since the earthquake, there have been many landslides, debris flows and other geological hazards in the disaster area. A total of 81,338 ha of vegetation is undergoing degradation. This area of degradation accounts for 17.10% of the damaged area. These areas are mainly distributed on ridges or along rivers, and the main vegetation types are coniferous forest (31.39%) and scrub (34.17%). These areas needs to be studied as part of further research. In summary, approximately 41% of the vegetation in the damaged area recovered fully during the study period and it will take years to reach the vegetation level before the earthquake.

Acknowledgements

This work is supported by funds from the National Natural Science Foundation of China (41171318), the National Key Technology Support Program (2012BAH32B03 and 2012BAH33B05) and the Public Science and Technology Research Funds for the Environment (2011467026 and 2012467044). We are thankful for field data support from Niu Xiaonan.

Author Contributions

Wei-Guo Jiang, Kai Jia, Jian-Jun Wu and Wen-Jie Wang conceived and designed the study. Wei-Guo Jiang and Kai Jia performed the experiments and wrote the paper. Wen-Jie Wang and Xiao-Fu Liu provided the conceptual advice and basic data. Zheng-Hong Tang served as scientific advisor. Wei-Guo Jiang, Kai Jia, Jian-Jun Wu, Zheng-Hong Tang, Wen-Jie Wang and Xiao-Fu Liu reviewed and edited the manuscript. All authors read and approved the manuscript.

Conflicts of Interest

The authors declare no conflict of interest.

References

  1. Verbesselt, J.; Zeileis, A.; Herold, M. Near real-time disturbance detection using satellite image time series. Remote Sens. Environ. 2012, 123, 98–108. [Google Scholar] [CrossRef]
  2. Monica, G.T. Disturbance and landscape dynamics in a changing world. Ecology 2010, 91, 2833–2849. [Google Scholar]
  3. Baumann, M.; Mutlu, O.; Wolter, P.T.; Krylov, A.; Vladimirova, N.; Radeloff, V.C. Landsat remote sensing of forest windfall disturbance. Remote Sens. Environ. 2014, 143, 171–179. [Google Scholar] [CrossRef]
  4. Bjorkman, L. The role of human disturbance in Late Holocene vegetation changes on Kullaberg, southern Sweden. Veg. Hist. Archaeobot. 2001, 10, 201–210. [Google Scholar] [CrossRef]
  5. Sturtevant, B.R.; Miranda, B.R.; Wolter, P.T.; James, P.M.A.; Fortin, M.J.; Townsend, P.A. Forest recovery patterns in response to divergent disturbance regimes in the Border Lakes region of Minnesota (USA) and Ontario (Canada). For. Ecol. Manag. 2014, 313, 199–211. [Google Scholar] [CrossRef]
  6. Wang, R.Z. Natural occurrence and backwater infection of C4 plants in the vegetation of the Yangtze hydropower Three Gorges Project region. Photosynthetica 2003, 41, 43–48. [Google Scholar] [CrossRef]
  7. Liu, Q.P.; Yang, Y.C.; Tian, H.Z.; Bo, Z.; Lei, G. Assessment of human impacts on vegetation in built-up areas in China based on AVHRR, MODIS and DMSP_OLS nighttime light data, 1992‒2010. Chin. Geogr. Sci. 2014, 24, 231–244. [Google Scholar] [CrossRef]
  8. Cohen, W.B.; Yang, Z.Q.; Kennedy, R. Detecting trends in forest disturbance and recovery using yearly Landsat time series: 2. TimeSync—Tools for calibration and validation. Remote Sens. Environ. 2010, 114, 2911–2924. [Google Scholar] [CrossRef]
  9. Cao, R.; Jiang, W.; Yuan, L.; Wang, W.; Lv, Z.; Chen, Z. Inter-annual variations in vegetation and their response to climatic factors in the upper catchments of the Yellow River from 2000 to 2010. J. Geogr. Sci. 2014, 24, 963–979. [Google Scholar] [CrossRef]
  10. Kokaly, R.F.; Rockwell, B.W.; Haire, S.L.; King, T.V.V. Characterization of post-fire surface cover, soils, and burn severity at the Cerro Grande Fire, New Mexico, using hyperspectral and multispectral remote sensing. Remote Sens. Environ. 2007, 106, 305–325. [Google Scholar] [CrossRef]
  11. Ward, D.P.; Petty, A.; Setterfield, S.A.; Douglas, M.M.; Ferdinands, K.; Hamilton, S.K.; Phinn, S. Floodplain inundation and vegetation dynamics in the Alligator Rivers region (Kakadu) of northern Australia assessed using optical and radar remote sensing. Remote Sens. Environ. 2014, 147, 43–55. [Google Scholar] [CrossRef]
  12. Prabakaran, N.; Paramasivam, B. Recovery rate of vegetation in the tsunami impacted littoral forest of Nicobar Islands, India. For. Ecol. Manag. 2014, 313, 243–253. [Google Scholar] [CrossRef]
  13. Zhang, J.D.; Hull, V.; Huang, J.Y.; Yang, W.; Zhou, S.; Xu, W.; Huang, Y.; Ouyang, Z.; Zhang, H.; Liu, J. Natural recovery and restoration in giant panda habitat after the Wenchuan earthquake. For. Ecol. Manag. 2014, 319, 1–9. [Google Scholar] [CrossRef]
  14. Lin, C.Y.; Lo, H.M.; Chou, W.C.; Lin, W. Vegetation recovery assessment at the Jou-Jou Mountain landslide area caused by the 921 Earthquake in Central Taiwan. Ecol. Model. 2004, 176, 75–81. [Google Scholar] [CrossRef]
  15. Lin, W.T.; Chou, W.C.; Lin, C.Y.; Huang, P.; Tsai, J. Vegetation recovery monitoring and assessment at landslides caused by earthquake in Central Taiwan. For. Ecol. Manag. 2005, 210, 55–66. [Google Scholar] [CrossRef]
  16. Lu, T.; Zeng, H.C.; Luo, Y.; Wang, Q.; Shi, F.; Sun, G.; Wu, Y.; Wu, N. Monitoring vegetation recovery after China’s May 2008 Wenchuan earthquake using Landsat TM time-series data: A case study in Mao County. Ecol. Res. 2012, 27, 955–966. [Google Scholar] [CrossRef]
  17. JIAO, Q.J.; Zhang, B.; Liu, L.Y.; Li, Z.; Yue, Y.; Hu, Y. Assessment of spatio-temporal variations in vegetation recovery after the Wenchuan earthquake using Landsat data. Nat. Hazards 2014, 70, 1309–1326. [Google Scholar] [CrossRef]
  18. Chou, W.C.; Lin, W.T.; Lin, C.Y. Vegetation recovery patterns assessment at landslides caused by catastrophic earthquake: A case study in central Taiwan. Environ. Monit. Assess. 2009, 152, 245–257. [Google Scholar] [CrossRef] [PubMed]
  19. Liu, Y.; Liu, R.G.; Ge, Q.S. Evaluating the vegetation destruction and recovery of Wenchuan earthquake using MODIS data. Nat. Hazards 2010, 54, 851–862. [Google Scholar] [CrossRef]
  20. Lin, W.T.; Chou, W.C.; Lin, C.Y. Earthquake-induced landslide hazard and vegetation recovery assessment using remotely sensed data and a neural network-based classifier: A case study in central Taiwan. Nat. Hazards 2008, 47, 331–347. [Google Scholar] [CrossRef]
  21. Lin, C.Y.; Chuang, C.W.; Lin, W.T.; Chou, W.C. Vegetation recovery and landscape change assessment at Chiufenershan landslide area caused by Chichi earthquake in central Taiwan. Nat. Hazards 2010, 53, 175–194. [Google Scholar] [CrossRef]
  22. Lin, W.T.; Lin, C.Y.; Chou, W.C. Assessment of vegetation recovery and soil erosion at landslides caused by a catastrophic earthquake: A case study in Central Taiwan. Ecol. Eng. 2006, 28, 79–89. [Google Scholar] [CrossRef]
  23. Cui, P.; Lin, Y.M.; Chen, C. Destruction of vegetation due to geo-hazards and its environmental impacts in the Wenchuan earthquake areas. Ecol. Eng. 2012, 44, 61–69. [Google Scholar] [CrossRef]
  24. Xing, H.L.; Xu, X.W. M8.0 Wenchuan Earthquake; Springer-Verlag: Berlin, Germany, 2011. [Google Scholar]
  25. Cui, P.; Chen, X.Q.; Zhu, Y.Y.; Su, F.; Wei, F.; Han, Y.; Liu, H.; Zhuang, J. The wenchuan earthquake (May 12, 2008), Sichuan province, China, and resulting geohazards. Nat. Hazards 2011, 56, 19–36. [Google Scholar] [CrossRef]
  26. Vegetation indices 16-Day L3 global 250m. Available online: https://lpdaac.usgs.gov/products/modis_products_table/mod13q1 (accessed on 20 May 2014).
  27. Holben, B.N. Characteristics of maximum-value composite images from temporal AVHRR data. Int. J. Remote Sens. 1986, 7, 1417–1434. [Google Scholar] [CrossRef]
  28. SRTM data processing methodology. Available online: http://srtm.csi.cgiar.org/SRTMdataProcessingMethodology.asp (accessed on 24 May 2014).
  29. Wenchuan 8.0 earthquake intensity distribution. Available online: http:/www.cea.gov.cn/manage/html/8a8587881632fa5c0116674a018300cf/_content/08_08/29/1219980517676.html (accessed on 25 May 2014).
  30. Zhang, X. Vegetation of China and Its Geographic Pattern—Illustration of the Vegetation Map of the People’s Republic of China (1:1000000); Geological Publishing House: Beijing, China, 2007. [Google Scholar]
  31. Cheng, H.F.; Zhang, W.B.; Chen, F. Advances in researches on application of remote sensing method to estimating vegetation coverage. Remote Sens. Land Resour. 2008, 1, 13–18. (In Chinese) [Google Scholar]

