Article

Inundations in the Inner Niger Delta: Monitoring and Analysis Using MODIS and Global Precipitation Datasets

by
Muriel Bergé-Nguyen
and
Jean-François Crétaux
*
CNES/Legos, 14 Av Edouard Belin, 31400 Toulouse, France
*
Author to whom correspondence should be addressed.
Remote Sens. 2015, 7(2), 2127-2151; https://doi.org/10.3390/rs70202127
Submission received: 26 May 2014 / Revised: 11 December 2014 / Accepted: 28 January 2015 / Published: 16 February 2015
(This article belongs to the Special Issue Earth Observation for Water Resource Management in Africa)

Abstract

:
A method of wetland mapping and flood survey based on satellite optical imagery from the Moderate Resolution Imaging Spectroradiometer (MODIS) Terra instrument was used over the Inner Niger Delta (IND) from 2000–2013. It has allowed us to describe the phenomenon of inundations in the delta and to decompose the flooded areas in the IND into open water and mixture of water and dry land, and that aquatic vegetation is separated from bare soil and “dry” vegetation. An Empirical Orthogonal Function (EOF) analysis of the MODIS data and precipitation rates from a global gridded data set is carried out. Connections between flood sequence and precipitation patterns from the upstream part of the Niger and Bani river watersheds up to the IND are studied. We have shown that inter-annual variability of flood dominates over the IND and we have estimated that the surface extent of open water varies by a factor of four between dry and wet years. We finally observed an increase in vegetation over the 14 years of study and a slight decrease of open water.

Graphical Abstract

1. Introduction

Satellite imagery is a classic tool used to monitor water extent over large areas of the Earth’s surface for long periods of time [1]. The current number and variety of space-borne instruments available to observe continental water content is very wide. The choice to use one sensor rather than another is generally driven by the type of targets and objectives of the study.
A flood occurs when a large and usually dry area is covered temporarily by a certain amount of water. It can also happen when a large amount of water flows into a channel that is not large enough to carry it; the excess water consequently spills over into the surrounding areas. In a flood, the lateral water spread dominates the vertical rising, until equilibrium is reached where underground recharge and evaporation compensate the surface water inflow in the floodplain. Floods may be caused by overspill from river channels, high local precipitation or both phenomena acting together. In the first scenario, a significant time gap may occur between the start of the upstream rainfall and the time of maximum inundation in the floodplain.
For example, Zwarts et al. [2] have shown that local rainfall is very limited and that water extent over the IND is driven by surface river flow variability in the upstream area of the delta.
The main purpose of this study is to provide a space-based tool for monitoring floods over the IND and to interpret their pluri-annual variability using global precipitation data.
In Section 2, we give an overview of flooding in the IND. In Section 3, we describe remote sensing and precipitation datasets and their processing. In Section 4, we present results for the phenomenology inter-annual water changes, aquatic vegetation and vegetation extent in IND and general rainfall patterns over upstream areas of the Niger and Bani rivers. In Section 5, we analyze the link between rainfall and inundation over the IND. Perspectives and conclusions are drawn in the last section.

2. Floods over the IND

The IND is a vast floodplain of 73,000 km2 located in the arid (north part of the delta: 15,000 km2) and semi-arid (south part of the delta: 58,000 km2) Sahelian zone (Figure 1). It is composed of large numbers of swamps, river channels, permanent lakes and non-permanent flooded areas. The IND is seasonally inundated (from September to November) due to rainfall over the Niger and Bani Rivers’ upstream areas (From June to September). This produces (when cumulated) an average annual discharge at the delta’s entries of 1490 m3 s−1 (period 1955–1996), which represents 47 km3.yr−1 [3]. Inundations in the southern part are characterized by a regular and rapid flow of water while in the northern part the water stays longer [3]. The evaporation rate over the IND varies both spatially and temporally: it is higher in the northern part (700 mm/year on average) than in the southern part (140 mm/year on average), and depending on the year can vary from 400 to 1300 mm/year [3]. Inundations over the IND are marked by very high inter-annual and long-term variability, which is linked to the amount of rainfall in the upstream rivers’ watersheds. Li et al. [4] highlighted large inter-decadal variations of rainfall over the last 50 years, with the wettest decade (1950–1960) and the driest (1970–1980) being due to climate variability over the Atlantic Ocean. Based on a hydrological water balance model, Mahé et al. [3] calculated that the flooded extent over the IND varied from dry to wet years by a factor of 5; from 40,000 km2 in 1955 to 9000 km2 in 1984.
Since the IND is a wetland located in an arid region, it serves as a crucial source for the economic activity in the region. Several million inhabitants are strongly dependent on water resources for agriculture, fishing, and pastoralism. Consequently, inter-annual inundation variability plays a major role in water management over the IND and severely impacts land use. Thus, the economic and ecological health of the region can be considered vulnerable to and dependent on these inter-annual inundation cycles. For example, Liersh et al. [5] have shown that a mix of upstream reservoir management and climate warming will provoke a decrease of inflow to the delta in the coming decades.
Figure 1. Map of the Niger River watershed (yellow) and Inner Niger Delta (IND) (zoom). Black lines represent country borders.
Remotesensing 07 02127 g001
In another recent study, it has been simulated from Global Climate Models (GCMs) that rainfall over the Bani River catchment area will likely decrease until the end of the 21st century by about 15% to 17%. Consequently, there will be a large reduction in river discharge into the IND [6]. Moreover, inundations in the IND influence local rainfall through vertical energy flux and water vapor from the land to the atmosphere [7]. They observed a resurgence of daytime cloud cover during inundations. This was in response to evaporation over the IND, which in turn increased the likeliness of storms in the mid-afternoon, mainly on the western border of the IND.
As a consequence of rainfall variability over West Africa, land surface occupation (water, vegetation, aquatic vegetation, and bare soil) is also changing from year to year resulting in very complex patterns that are influenced by the topography of river channels in the delta, presence of vegetation, and the total amount of water filling the IND. During periods of flood, the IND land is also subject to noticeable vegetation growth.
In this context, reliable spatio-temporal information about the extent of water and vegetation over the IND is useful in understanding the links with climate variability. In the past, in situ gauges measuring river discharge were installed principally at the entries and mouth of the delta [3]. Unfortunately, our ability to measure and forecast the total fresh water input in the IND each year is quite impossible because of: (1) economic and infrastructural problems generally affecting non-industrialized nations; (2) water flow physics across vast lowlands that are not permanently inundated; and (3) the fact that measuring water extent variations over such a large area is practically impossible from in situ measurements.
Space-based methods can be an answer to these difficulties in studying water extent over wetlands and floodplains.
Moreover, over the IND the seasonal inundations act as a source of significant evaporative losses, which have to be taken into account for regional water cycle modeling. For example, Dadson et al. [8] showed that flooded areas over the IND are doubling total losses from land surface over the region, that seasonal and inter-annual inundations control the evaporation rate, and also that it improves predictions of land-atmosphere energy and water vapor fluxes. Finally, knowledge of flooding dynamics in large floodplains within a river basin may also improve global climate simulations [9] and constrain hydrodynamical model parameters [1].

3. Data Sets and Methodologies

3.1. Datasets

3.1.1. Preamble

To characterize the process of inundations and their dynamics across floodplains, it is essential to measure some key variables related to water extent over the IND and regional patterns of rainfall upstream of the delta.
We will show the results obtained for water extent over the IND, and for the spatial and temporal variability of precipitation determined from global gridded data over the upstream watershed of the Niger and the Bani rivers and over the floodplains. As mentioned above, we expect to correlate the inter-annual variability of floods over the IND to surface discharges from upstream rivers (that are directly linked to rainfalls [2].
Water extent and precipitation rates over the upstream rivers and the IND have been mapped and we have produced a time series of the variables from 2000 to 2013. For water mapping, we use the MODIS instrument (Section 3.2) and for precipitation mapping, we use a global gridded dataset: TRMM 3B43 version 7 products (Section 3.3).

3.1.2. MODIS

The MODIS instrument is a multispectral imaging system installed onboard the Terra (launched in December 1999) and Aqua (launched in May 2002) satellites. MODIS provides Earth surface reflectance on thirty-six narrow bands of frequency; seven among them are from the visible to Mid Infrared part of the spectrum with a spatial resolution of 250 (two first bands) and 500 m (all bands):
  • Band 1: 620–670 nm.
  • Band 2: 841–876 nm.
  • Band 3: 459–479 nm.
  • Band 4: 545–565 nm.
  • Band 5: 1230–1250 nm.
  • Band 6: 1628–1652 nm.
  • Band 7: 2107–2155 nm.
A limitation of optical remote sensing data for flood monitoring is cloud cover. This is accentuated in tropical countries. In such situations, MODIS images cannot measure the ground surface radiance and consequently cannot provide continuous information on the water extent during a flood. However, the IND region is located at the boundary between the Sahara Desert and western tropical Africa and is not affected by cloud cover, except during the summer months of June to August. Moreover major floods over the IND occur at the end or after the rainy season, which reduces this problem.
The orbits of Terra and Aqua were designed to allow satellites to cross the equator at local time 10:30 AM and 1:30 PM respectively. Considering that cloud formation linked to flooding over the IND is highest during the afternoons [7], we chose to collect and analyze the mosaic of MODIS/Terra instrument on an 8-day time basis. The 8-day composite is a compilation in one image of the best signal observed for each pixel over the following 8-day period, which reduces errors due to cloud, aerosols and viewing angle. It limits the risk of having long periods without valid images. For a detailed description of MODIS algorithms and products, see [10]. Flood mapping is thus enabled thanks to this compositing approach that provides enough days of clear sky even during the rainy period. We observe less than 5% of noisy images due to cloud presence during this period. Moreover, the Terra Instrument allows calculation of the water extent over a longer period.

3.1.3. Rainfall Data

Many different datasets of precipitation at a global scale exist and we have chosen to use the most recent version (7) of the Tropical Rainfall Measuring Mission (TRMM) 3B43 dataset. TRMM is the National Aeronautics and Space Administration (NASA) mission launched in November 1997 and has on-board precipitation radar developed by the Japanese Aerospace Exploration Agency (JAXA). It was designed to measure the intensity and distribution of the rain, and map storm structures. Here we use data from the 3B43 algorithm because it merges satellite and in situ data, TRMM 3 hourly data, and the monthly in situ data of thousands of rain gauges around the world compiled by the Global Precipitation Climatology Centre (GPCC).
The spatial resolution of these products is 0.25° × 0.25°. It was produced over a calendar month-time resolution. The data was averaged over the IND (156 pixels from the TRMM datasets) on a monthly basis, and limited to the period 2000–2013 to correspond in time with MODIS data used in this study. An average climatology of precipitation was calculated every month (Each map represents the mean precipitation of the given month based on precipitation from the whole period data set). Monthly maps of anomalies are also produced: anomalies are calculated by the difference between monthly and average precipitation for each month over the whole period. The maps allow detection of geographical patterns for precipitation over the region of interest (ROI) and its inter-annual variability. It is then used to determine if the gradient of precipitation between the Niger and Bani rivers can explain the flood dynamics measured by MODIS. EOFs over the IND and upstream Niger and Bani rivers were also calculated to be compared to a similar analysis of MODIS images. It allows the separation of spatio-temporal modes of variability of rainfall (Section 3.2).
To summarize, we have produced:
  • Maps of monthly average climatology, and monthly and yearly anomalies.
  • Time series for total precipitation over both rivers on the upstream part of the IND including the IND.
  • EOF spatio-temporal modes for 14 years of data over the ROI.
A comparison of the results obtained using MODIS and precipitation data sets was also performed.

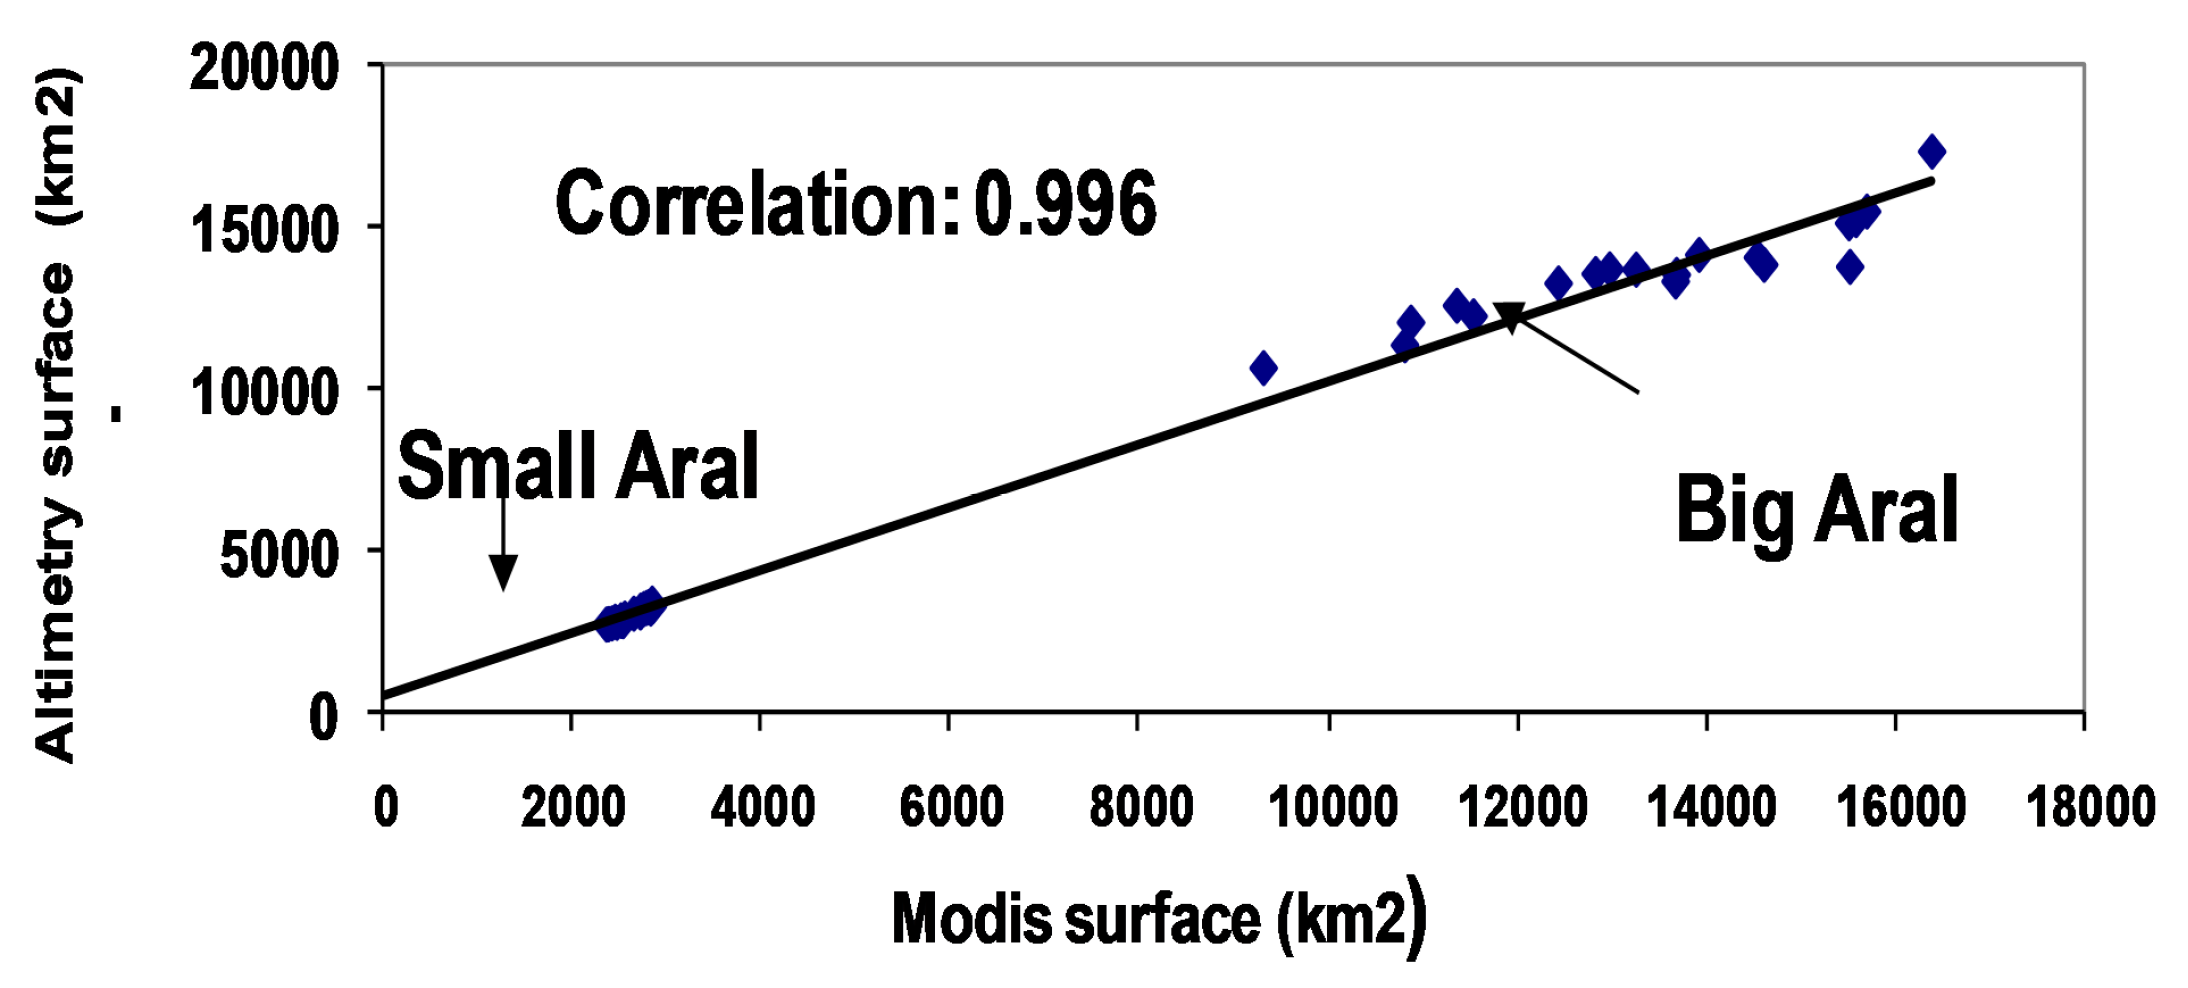
3.2. Methodology to Detect Water over the IND with MODIS and Validation

A method of land surface classification for hydrology has been developed using a combination of three of the seven MODIS bands and is acquired from MOD09A1 (MODIS/Terra Surface Reflectance 8-Day L3 Global 500 m SIN Grid V005), Version 5 product [11]. This method was applied to many different regions over the Earth and published in several works: the Aral Sea [12], The Andean Altiplano ([13,14]), Lake Tchad [11] , The IND ([15,16]), and the Ganga basin [17]. Other methods using MODIS images were published for similar studies [18,19,20,21,22,23].
Several other remote sensing instruments had already been used in the literature for flood mapping ([1,24,25,26,27,28,29,30,31]). Some of them have much higher spatial resolution (Landsat imagery, ASAR on Envisat, Radarsat instrument) but none has a combination of the following advantages for flood monitoring: a continuity of homogeneous data over a long period of time, a global coverage of the Earth over a short recurrent period (daily/weekly), and a free service.
Shallow depths and a high suspended sediment concentration, such as those observed along the IND considerably increase the amount of solar energy reflected by a body of water ([32,33,34]) have shown that strong water absorption at wavelength >1 μm in MODIS bands (5–7) does not allow illumination of sediments in the water or at the shallow bottom of a water column. Consequently, in order to avoid the problem of suspended particles, the most appropriate band to detect open water during a flood event is number 5 in Mid Infra-Red (MIR: 1230–1250 nm). A threshold value for reflectance in the IR band of MODIS should be attributed to discriminate water pixel from “no” water pixel.
In this paper, a simple combination of a threshold technique was performed on the MODIS Band 5 and Normalized Difference Vegetation Index (NDVI) to delineate the shallow, sediment laden, open waters of the IND flood plain. It was also used to discriminate between the mixture of water and dry land, aquatic vegetation and vegetation on dry land. It has been assumed that a small value of surface reflectance in band 5 allows characterizing open water. For MOD09GHK normalized products used in this study, the value of 1200 (a reflectance of 0.12 scale by a factor of 10,000 for distribution as integer) has been chosen as a cut-off value under which a pixel is supposed to be fully inundated.
When surface reflectance in band 5 increases to the threshold value of 2700, a test is made on NDVI to discriminate the pixel covered by a mixture of water, dry land and aquatic vegetation. NDVI is a robust index for monitoring temporal changes of vegetation photosynthetic activity ([35,36]). In the arid environment of our study area, a high level of vegetation photosynthetic activity can only be sustained by the presence of surface water or groundwater discharge. A threshold technique is used to select high NDVI values and to detect areas of high photosynthetic activity from aquatic vegetation and hydrophilic plants. NDVI ranges from negative values (generally considered as open water [37]) to >0.4 for dense vegetation.
To detect the presence of vegetation on dry land, NDVI is tested. For high reflectance in band 5 (superior to 2700): if the NDVI index is superior to 0.4, the pixel is considered to be covered with vegetation and if it is below 0.4 then the pixel is classified as dry land [11].
To validate this approach and to define the threshold values of NDVI and reflectance in band 5, a ground calibration was performed over the Diamantina floodplain in Central Australia in 2006. It was determined through aerial photography, laser and radar altimetry, and field measurements of different surface types taken from GPS measurements. The transition zones between different types of surfaces were precisely delineated and compared to the reflectance on the MODIS data which allowed fixing the threshold values given in Table 1 that then have been validated on other regions.
Table 1. Threshold value used for qualification of ground type is applied to monitor a flood event on the flood plain. Units are reflectance scaled by 10,000 as delivered in the MOD09GHK product (validation of this method is given in Section 3.2.3).
IndexOpen WaterMix Water/Dry LandAquatic VegetationVegetation Dry Land
Band 5<1200>1200 & <2700>1200 & <2700>2700>2700
NDVINo Test<0.4>0.4>0.4<0.4
MODIS images are given in HDF format. They are georeferenced and processed over the ROI centered on the IND area. The 8-day mosaic images were acquired over the period February 2000–December 2013 and processed with the algorithm described above. Three main products were obtained from this data processing:
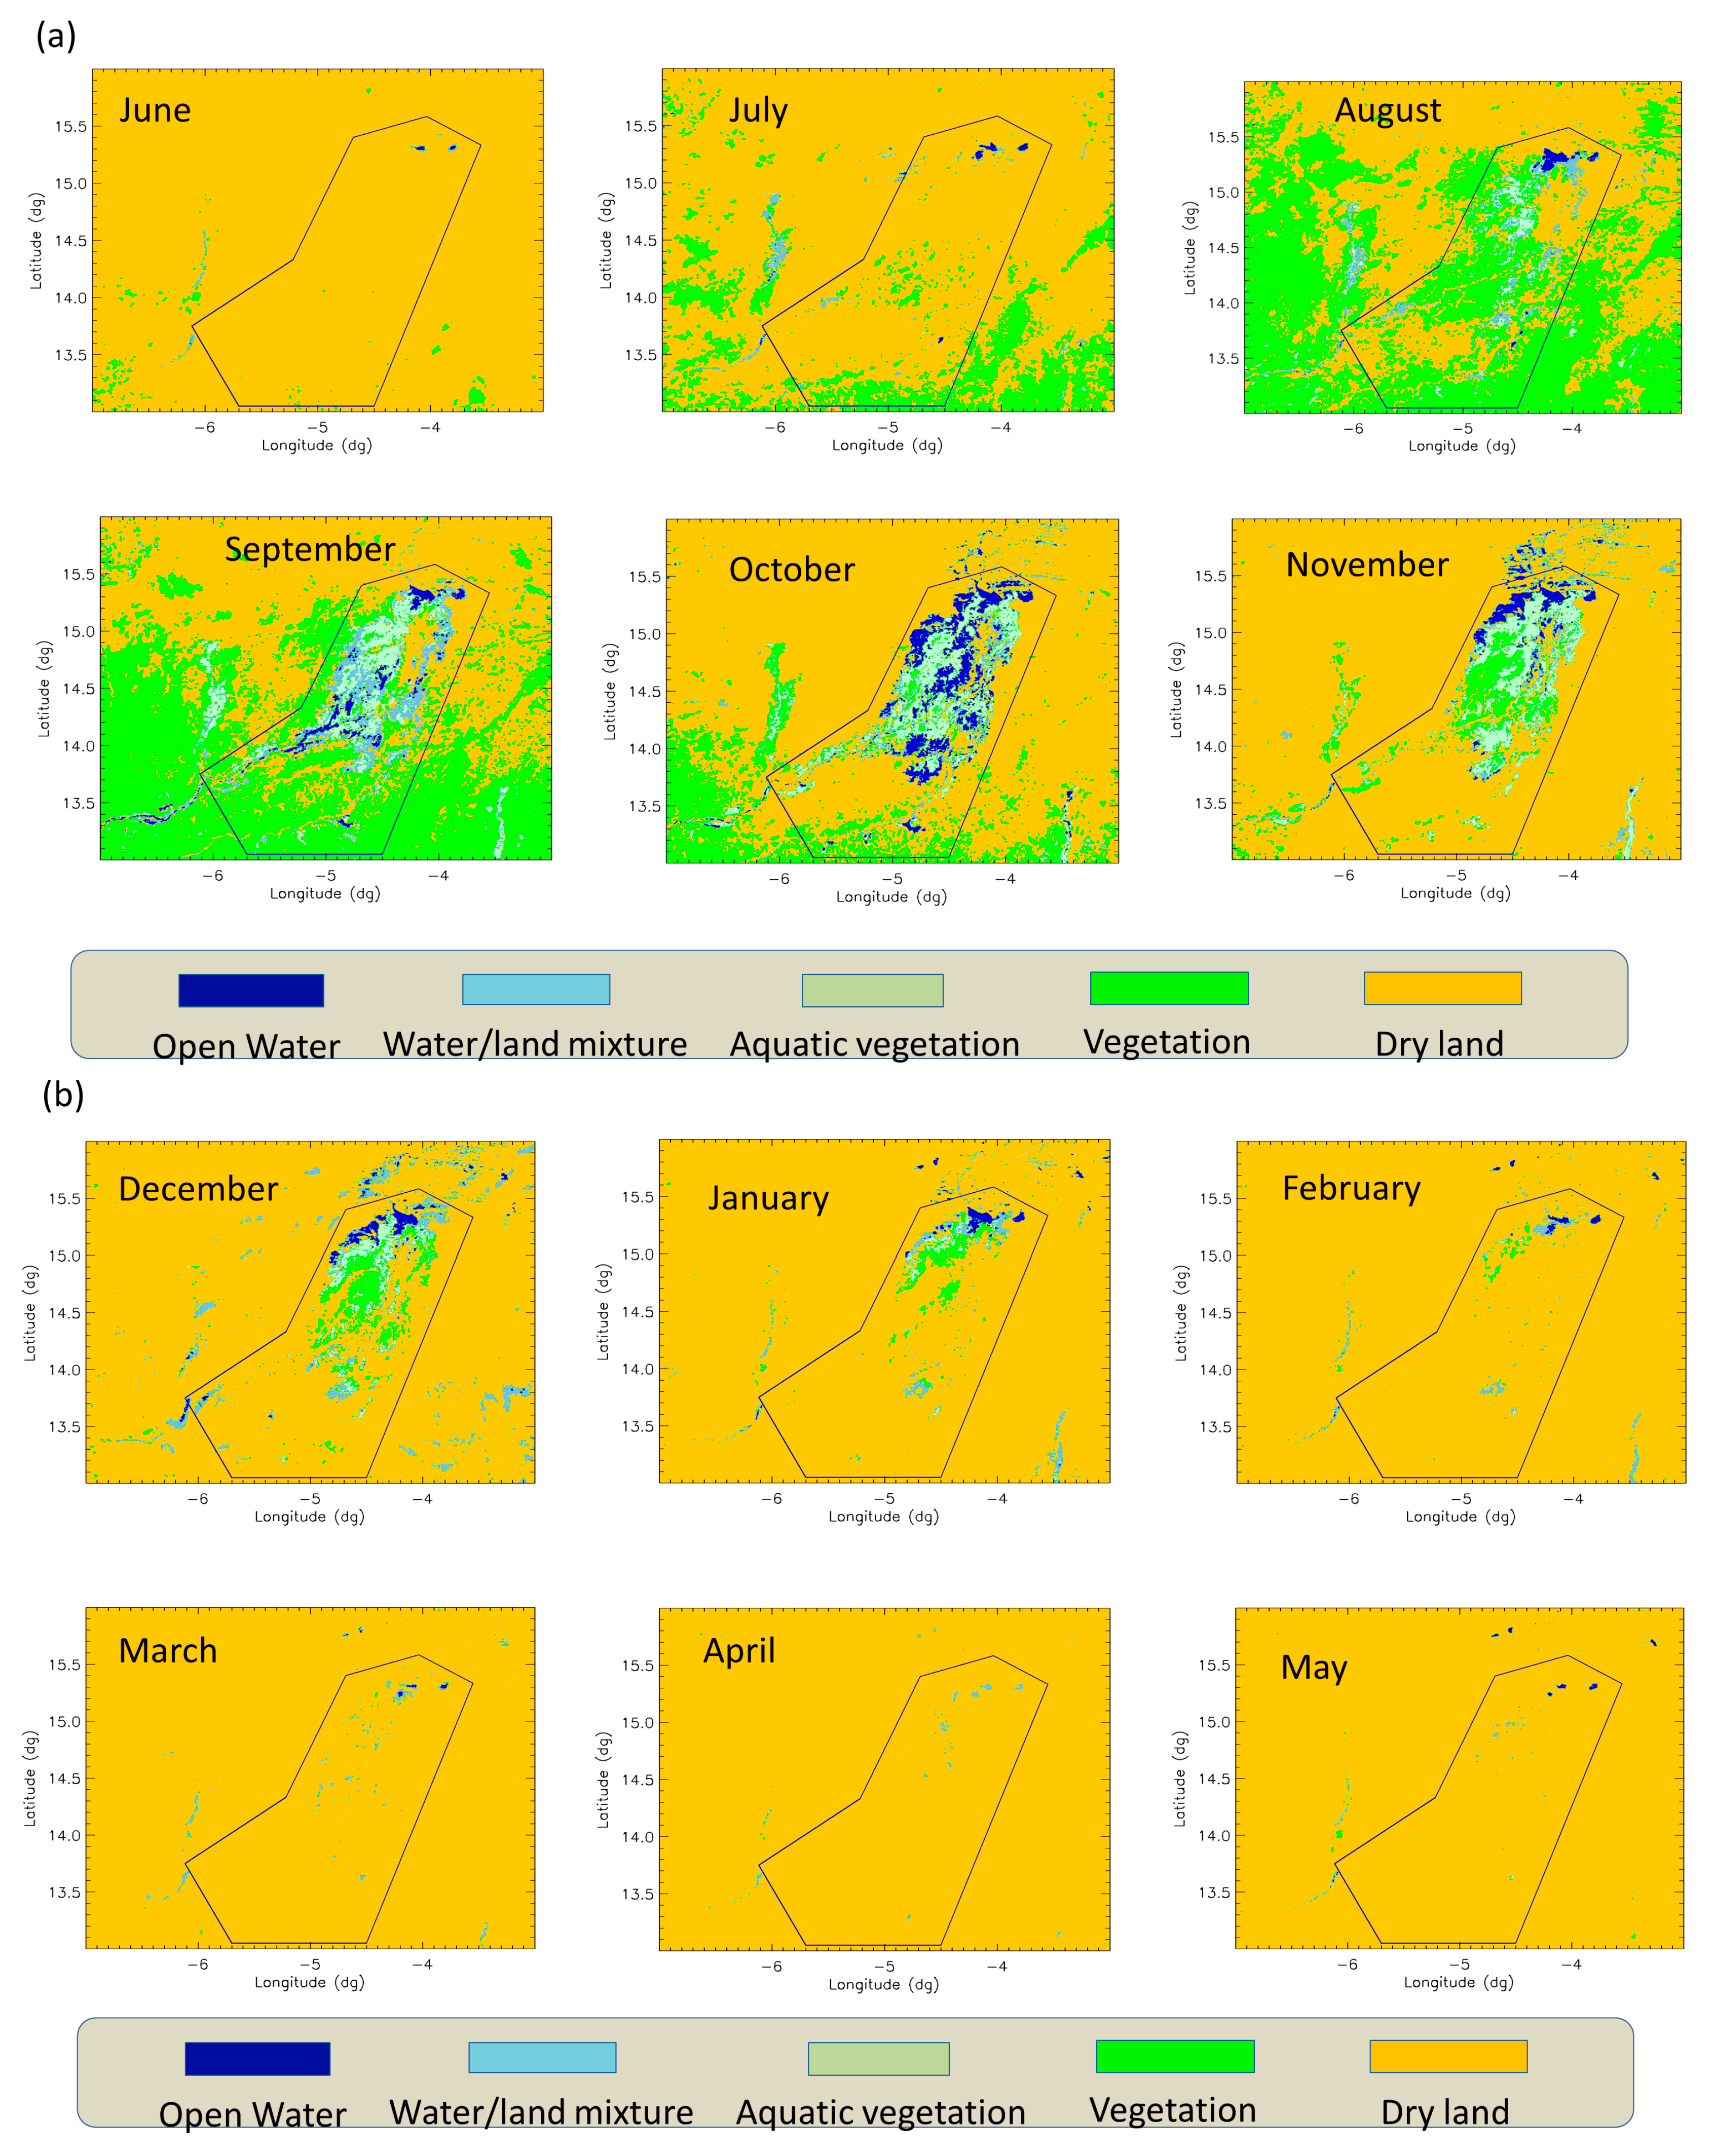
  • A synthetic map of ROI with classification obtained from MODIS images every 8 days.
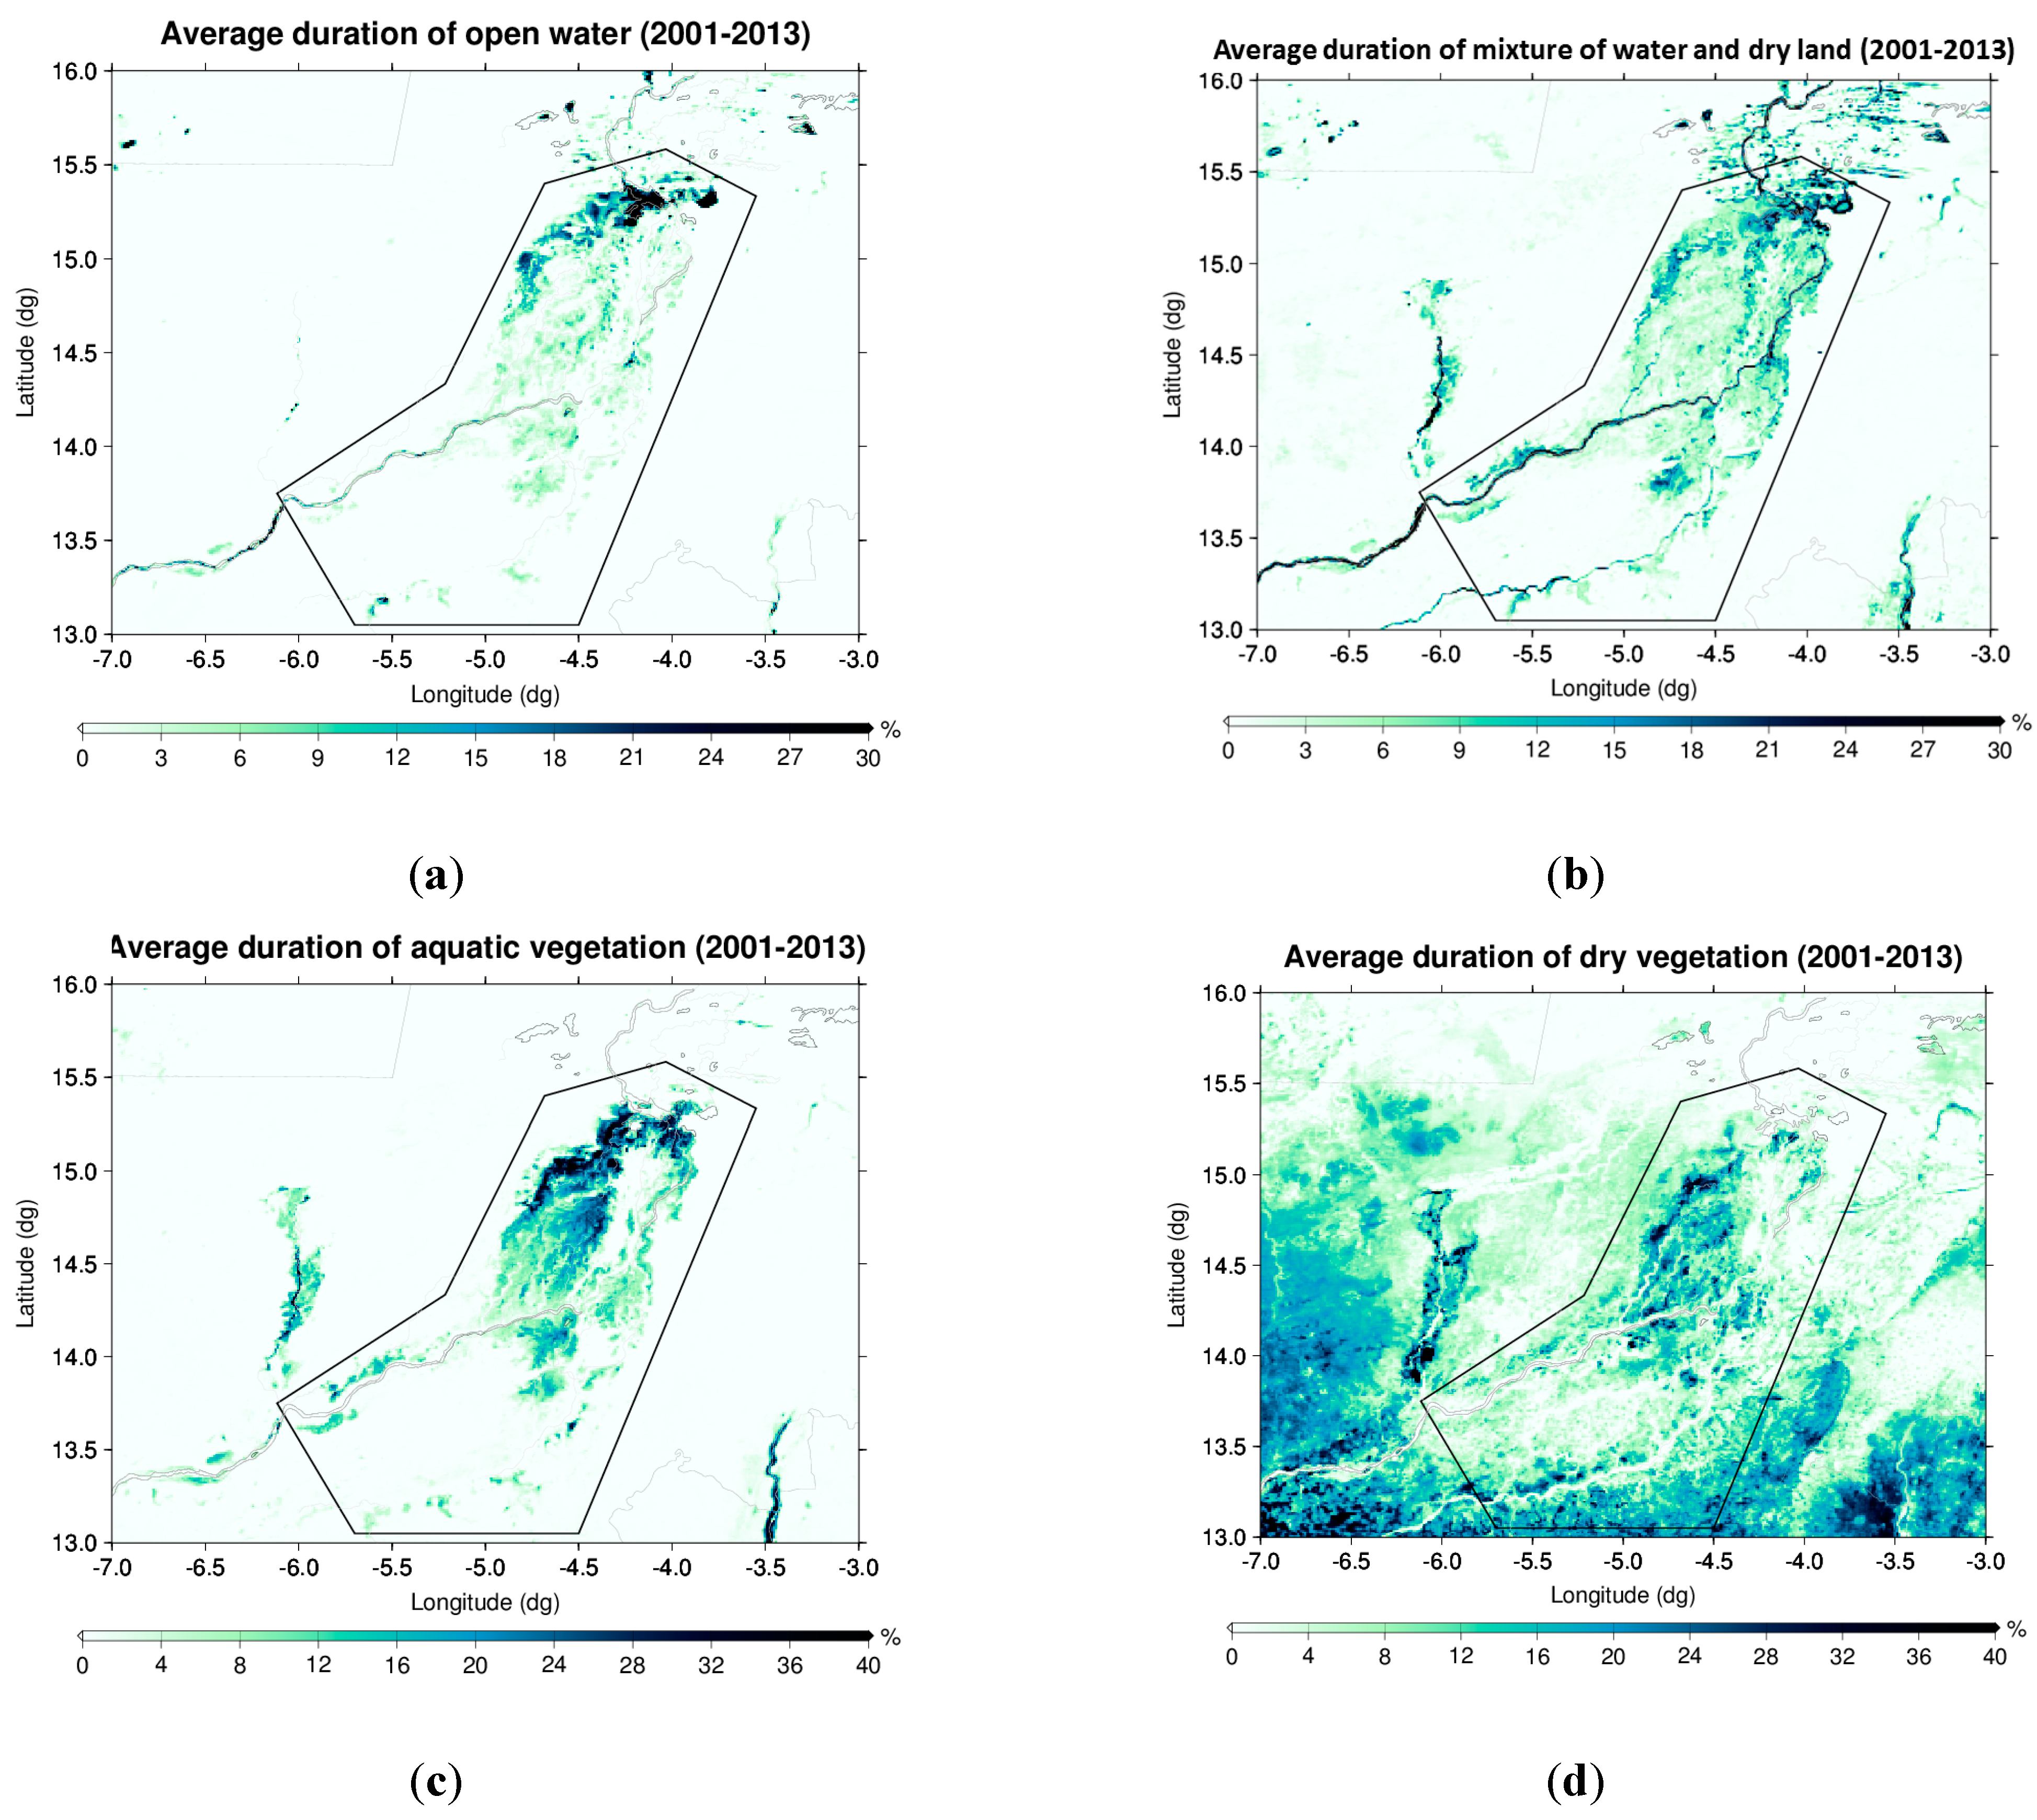
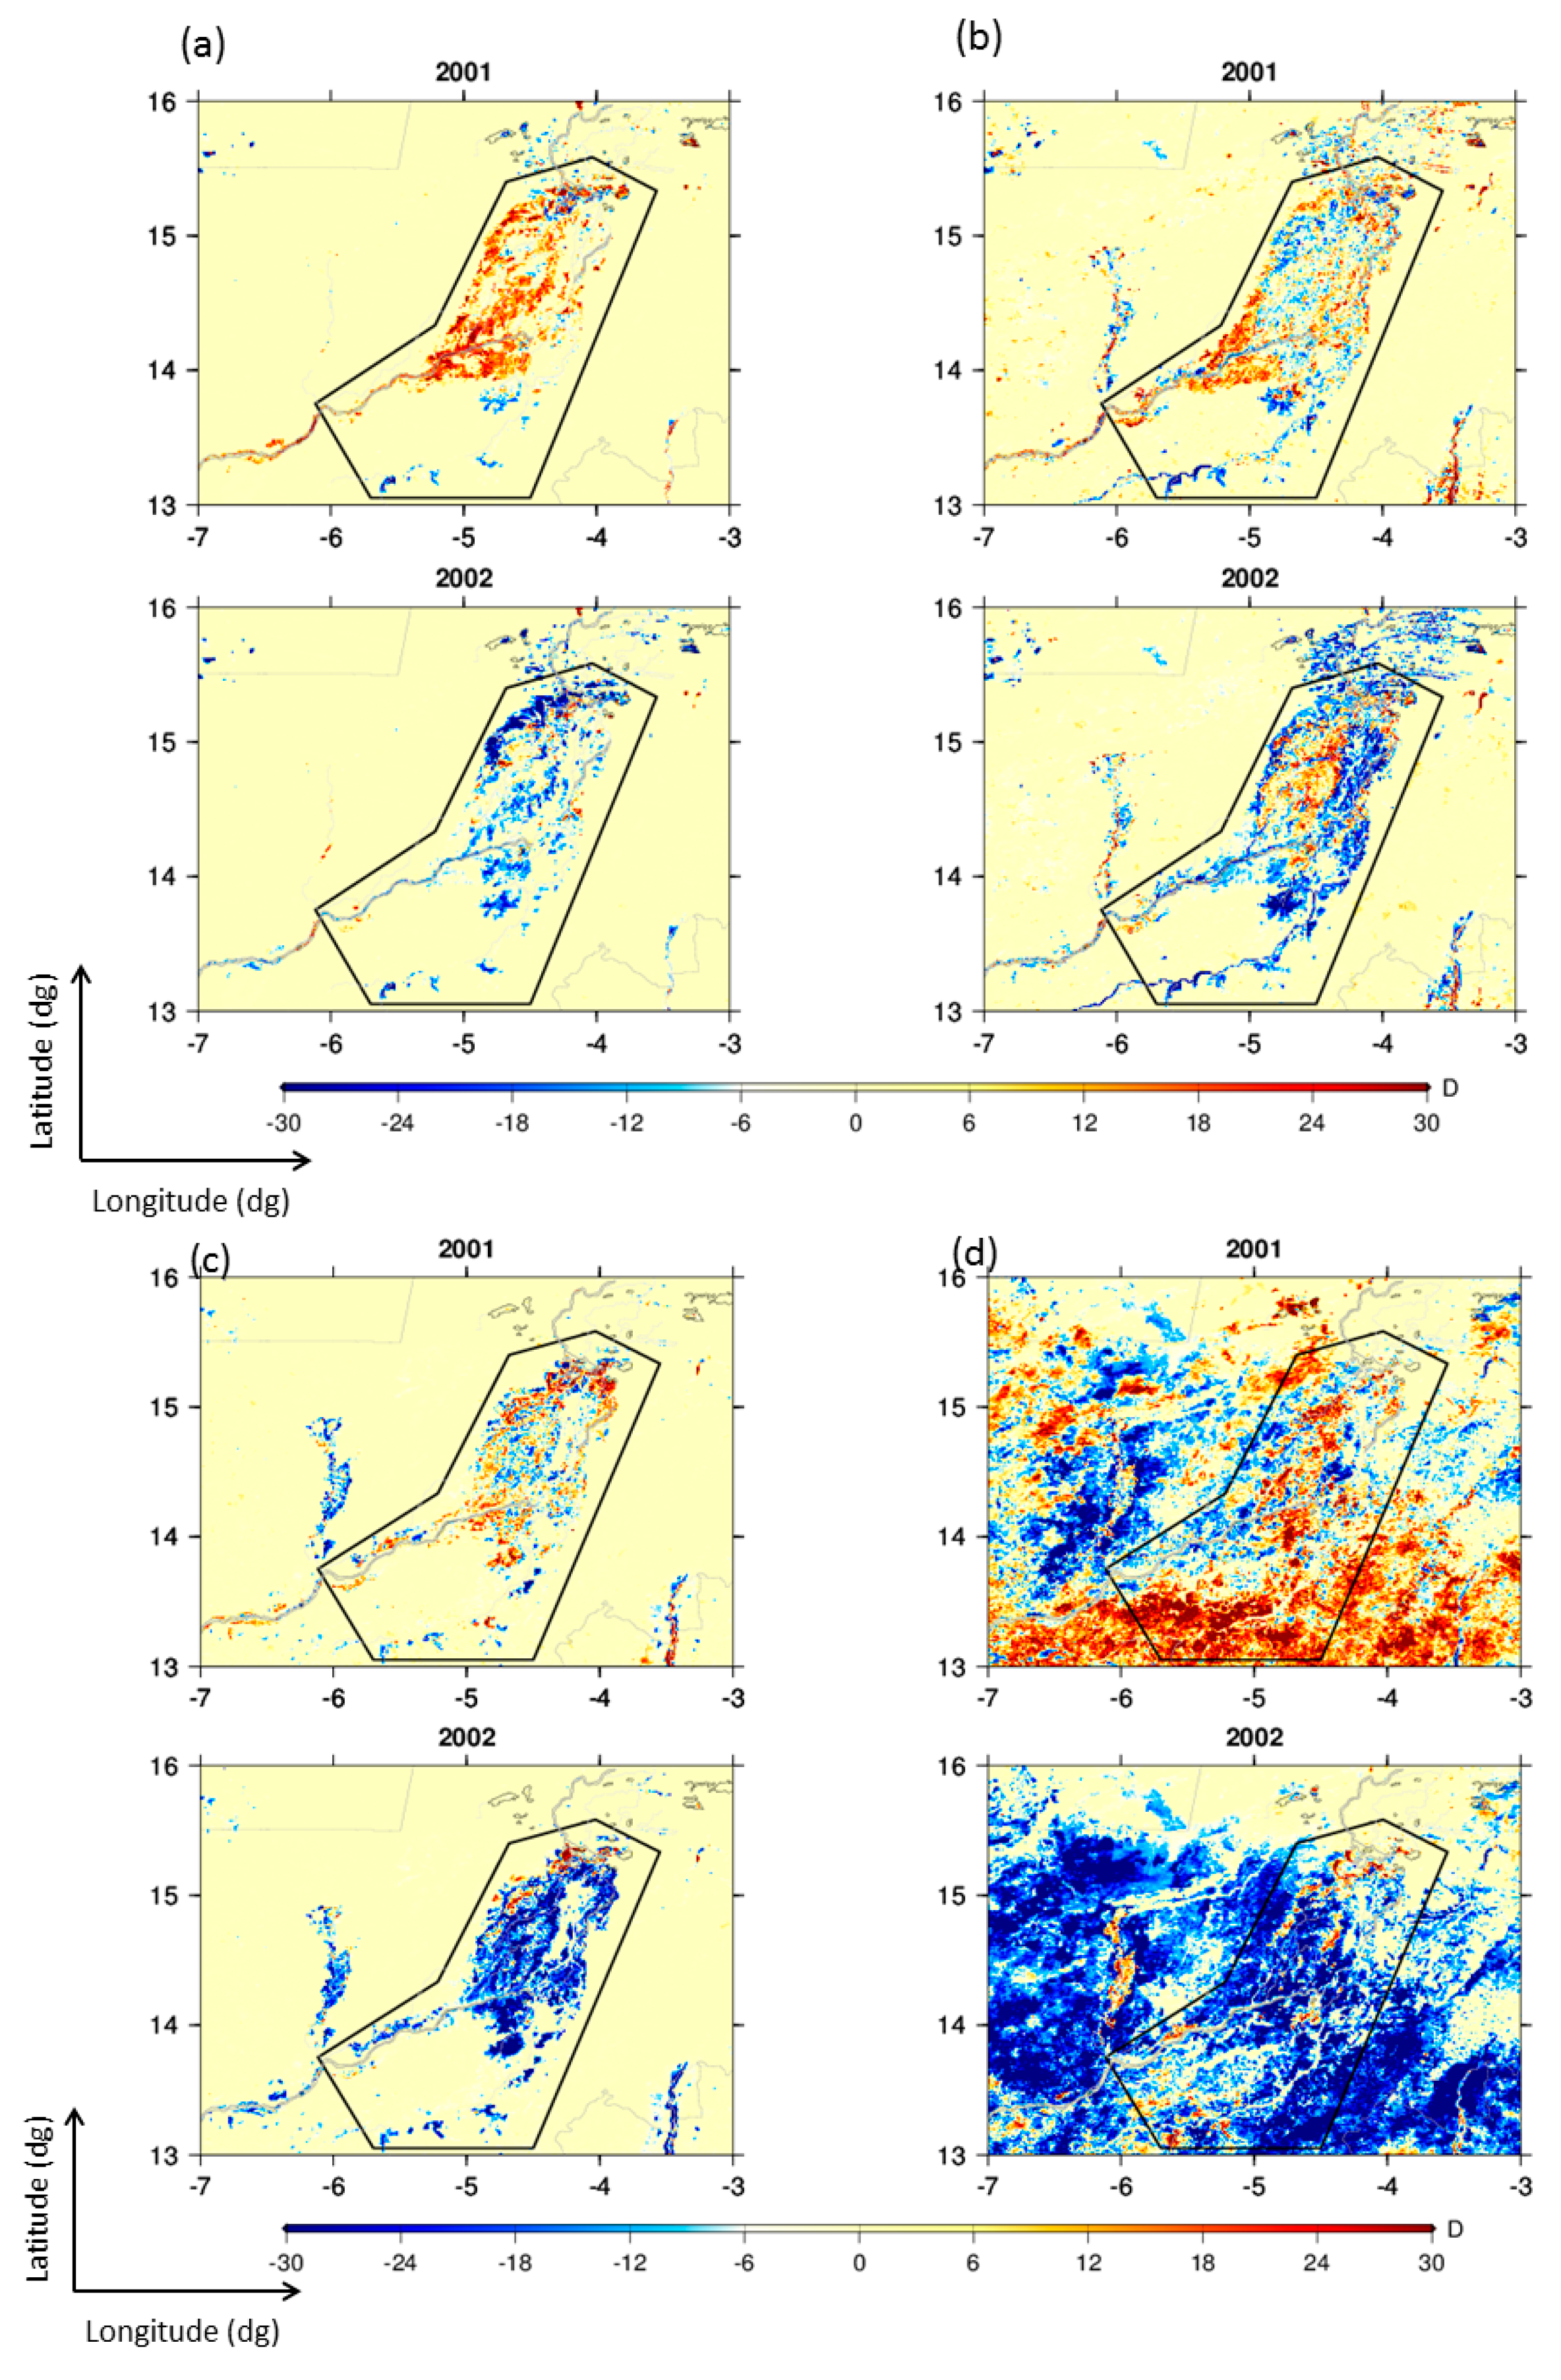
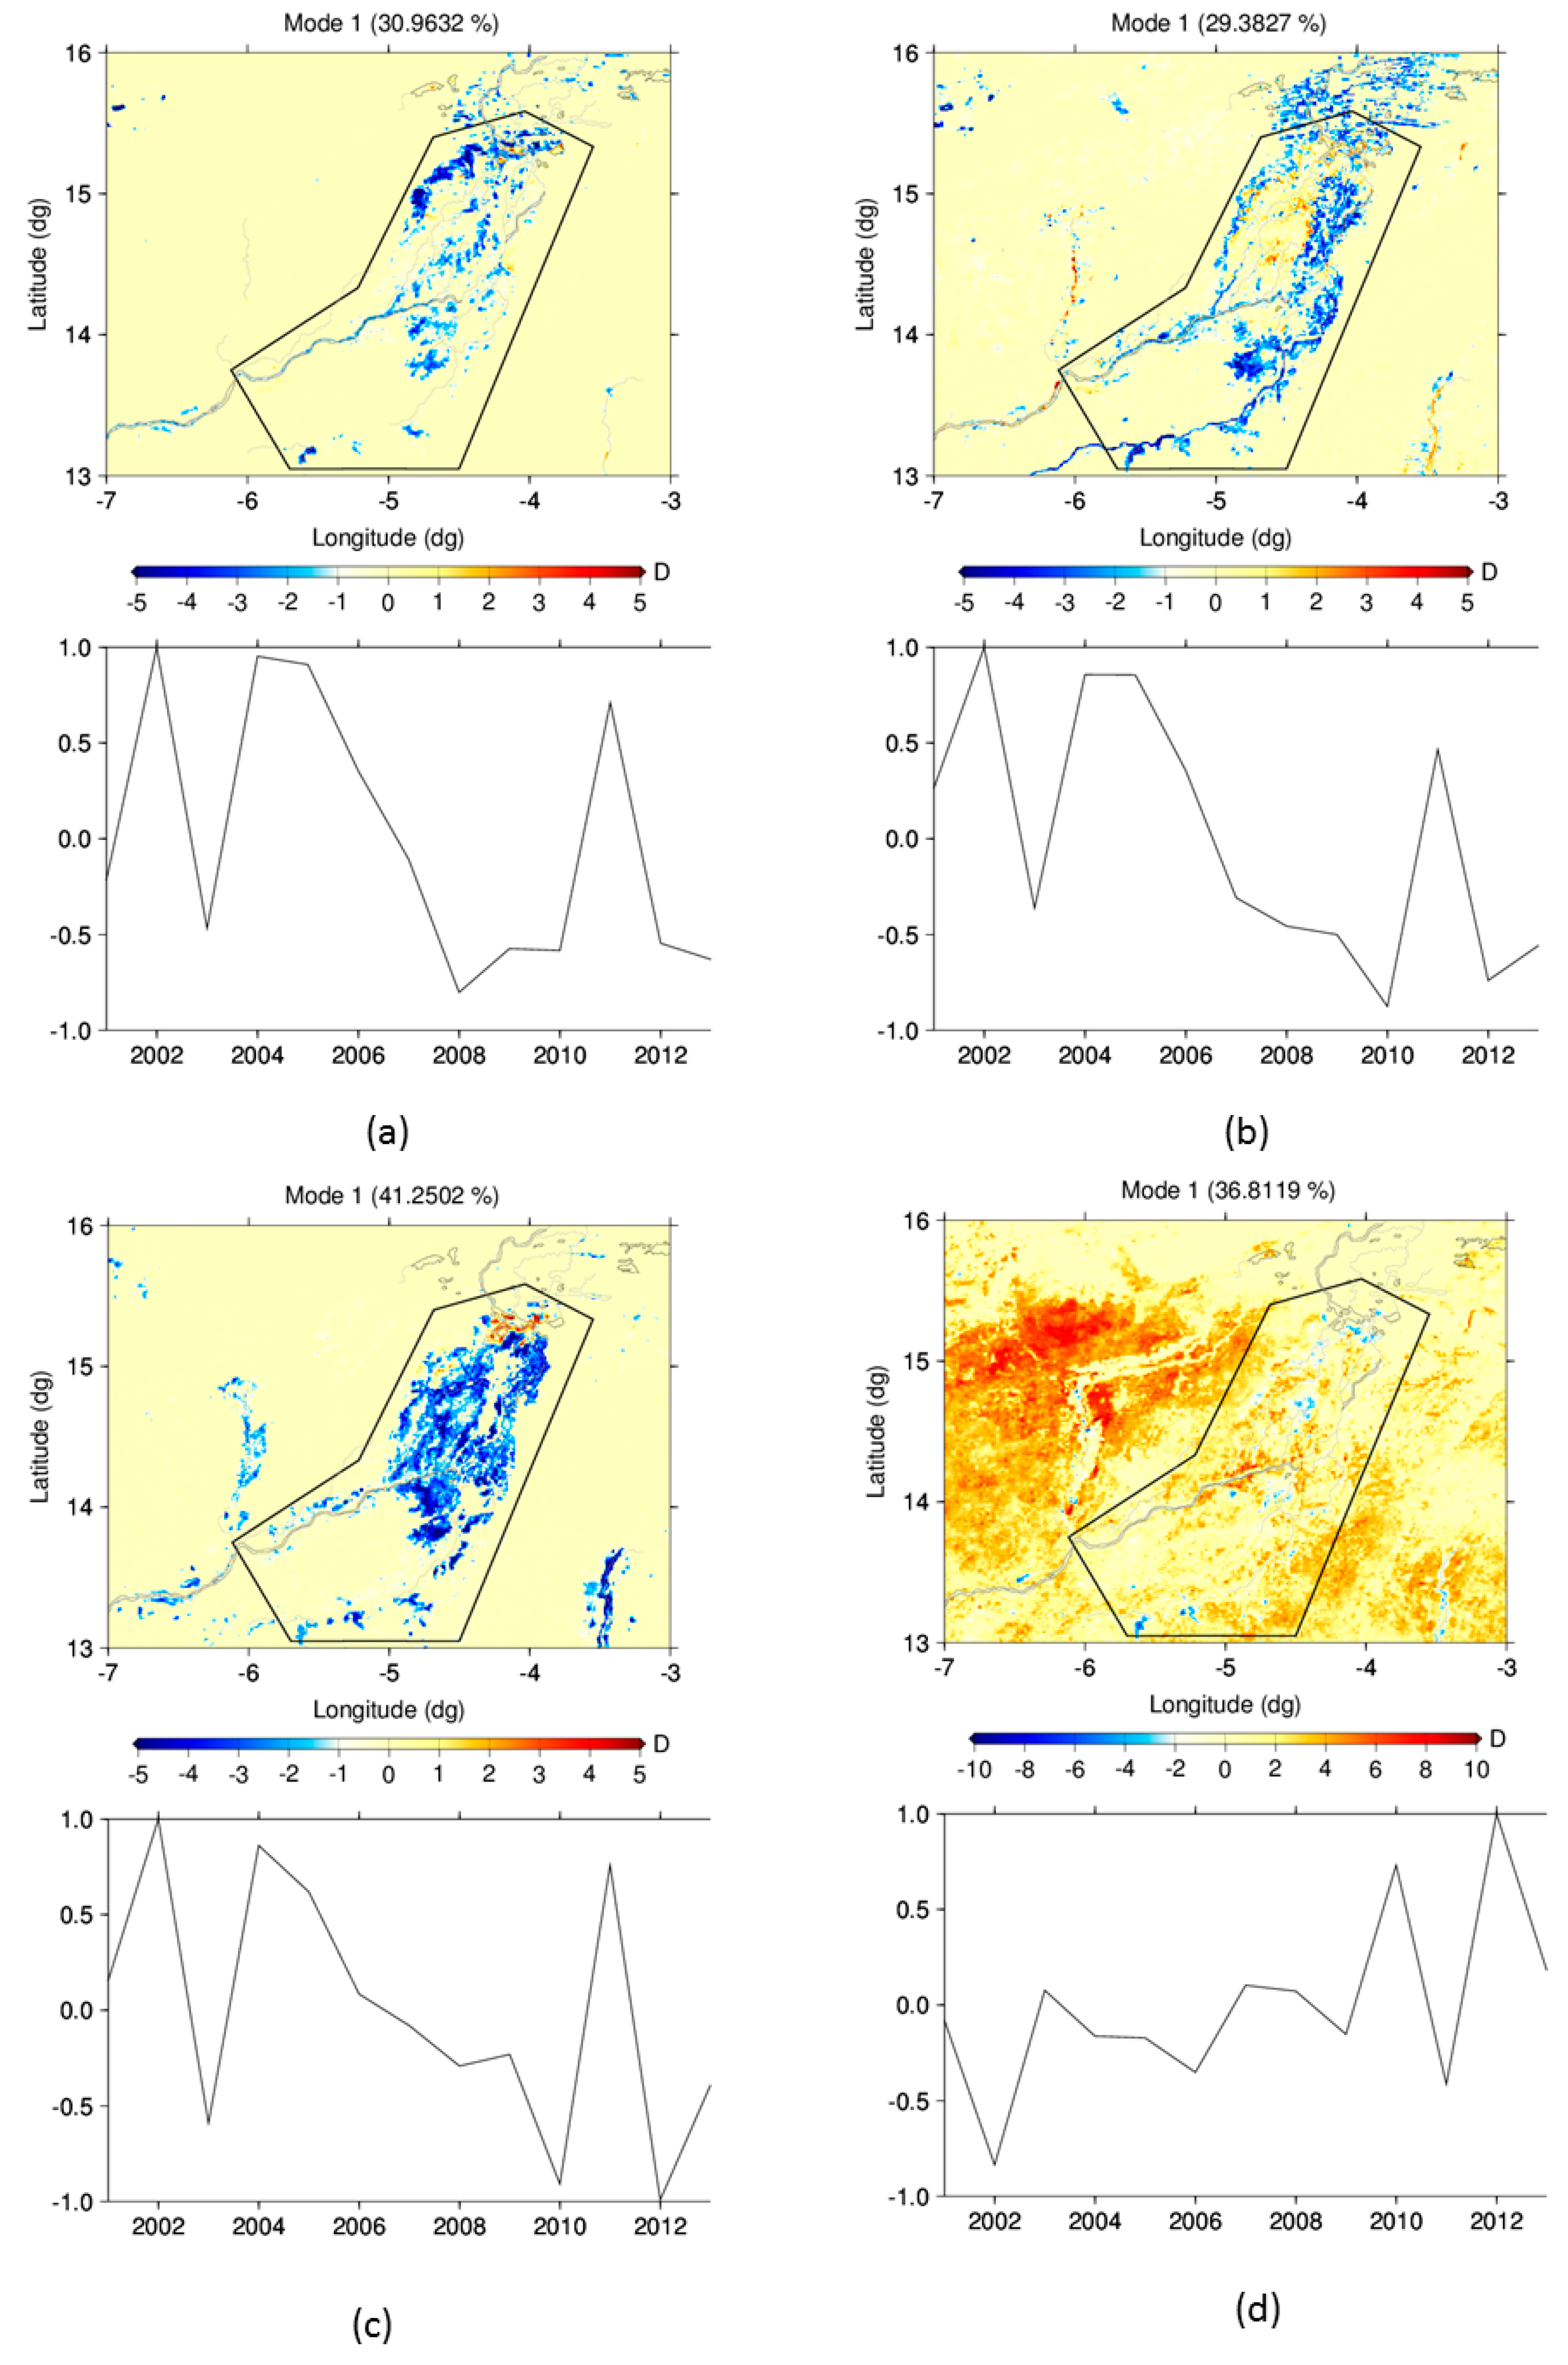
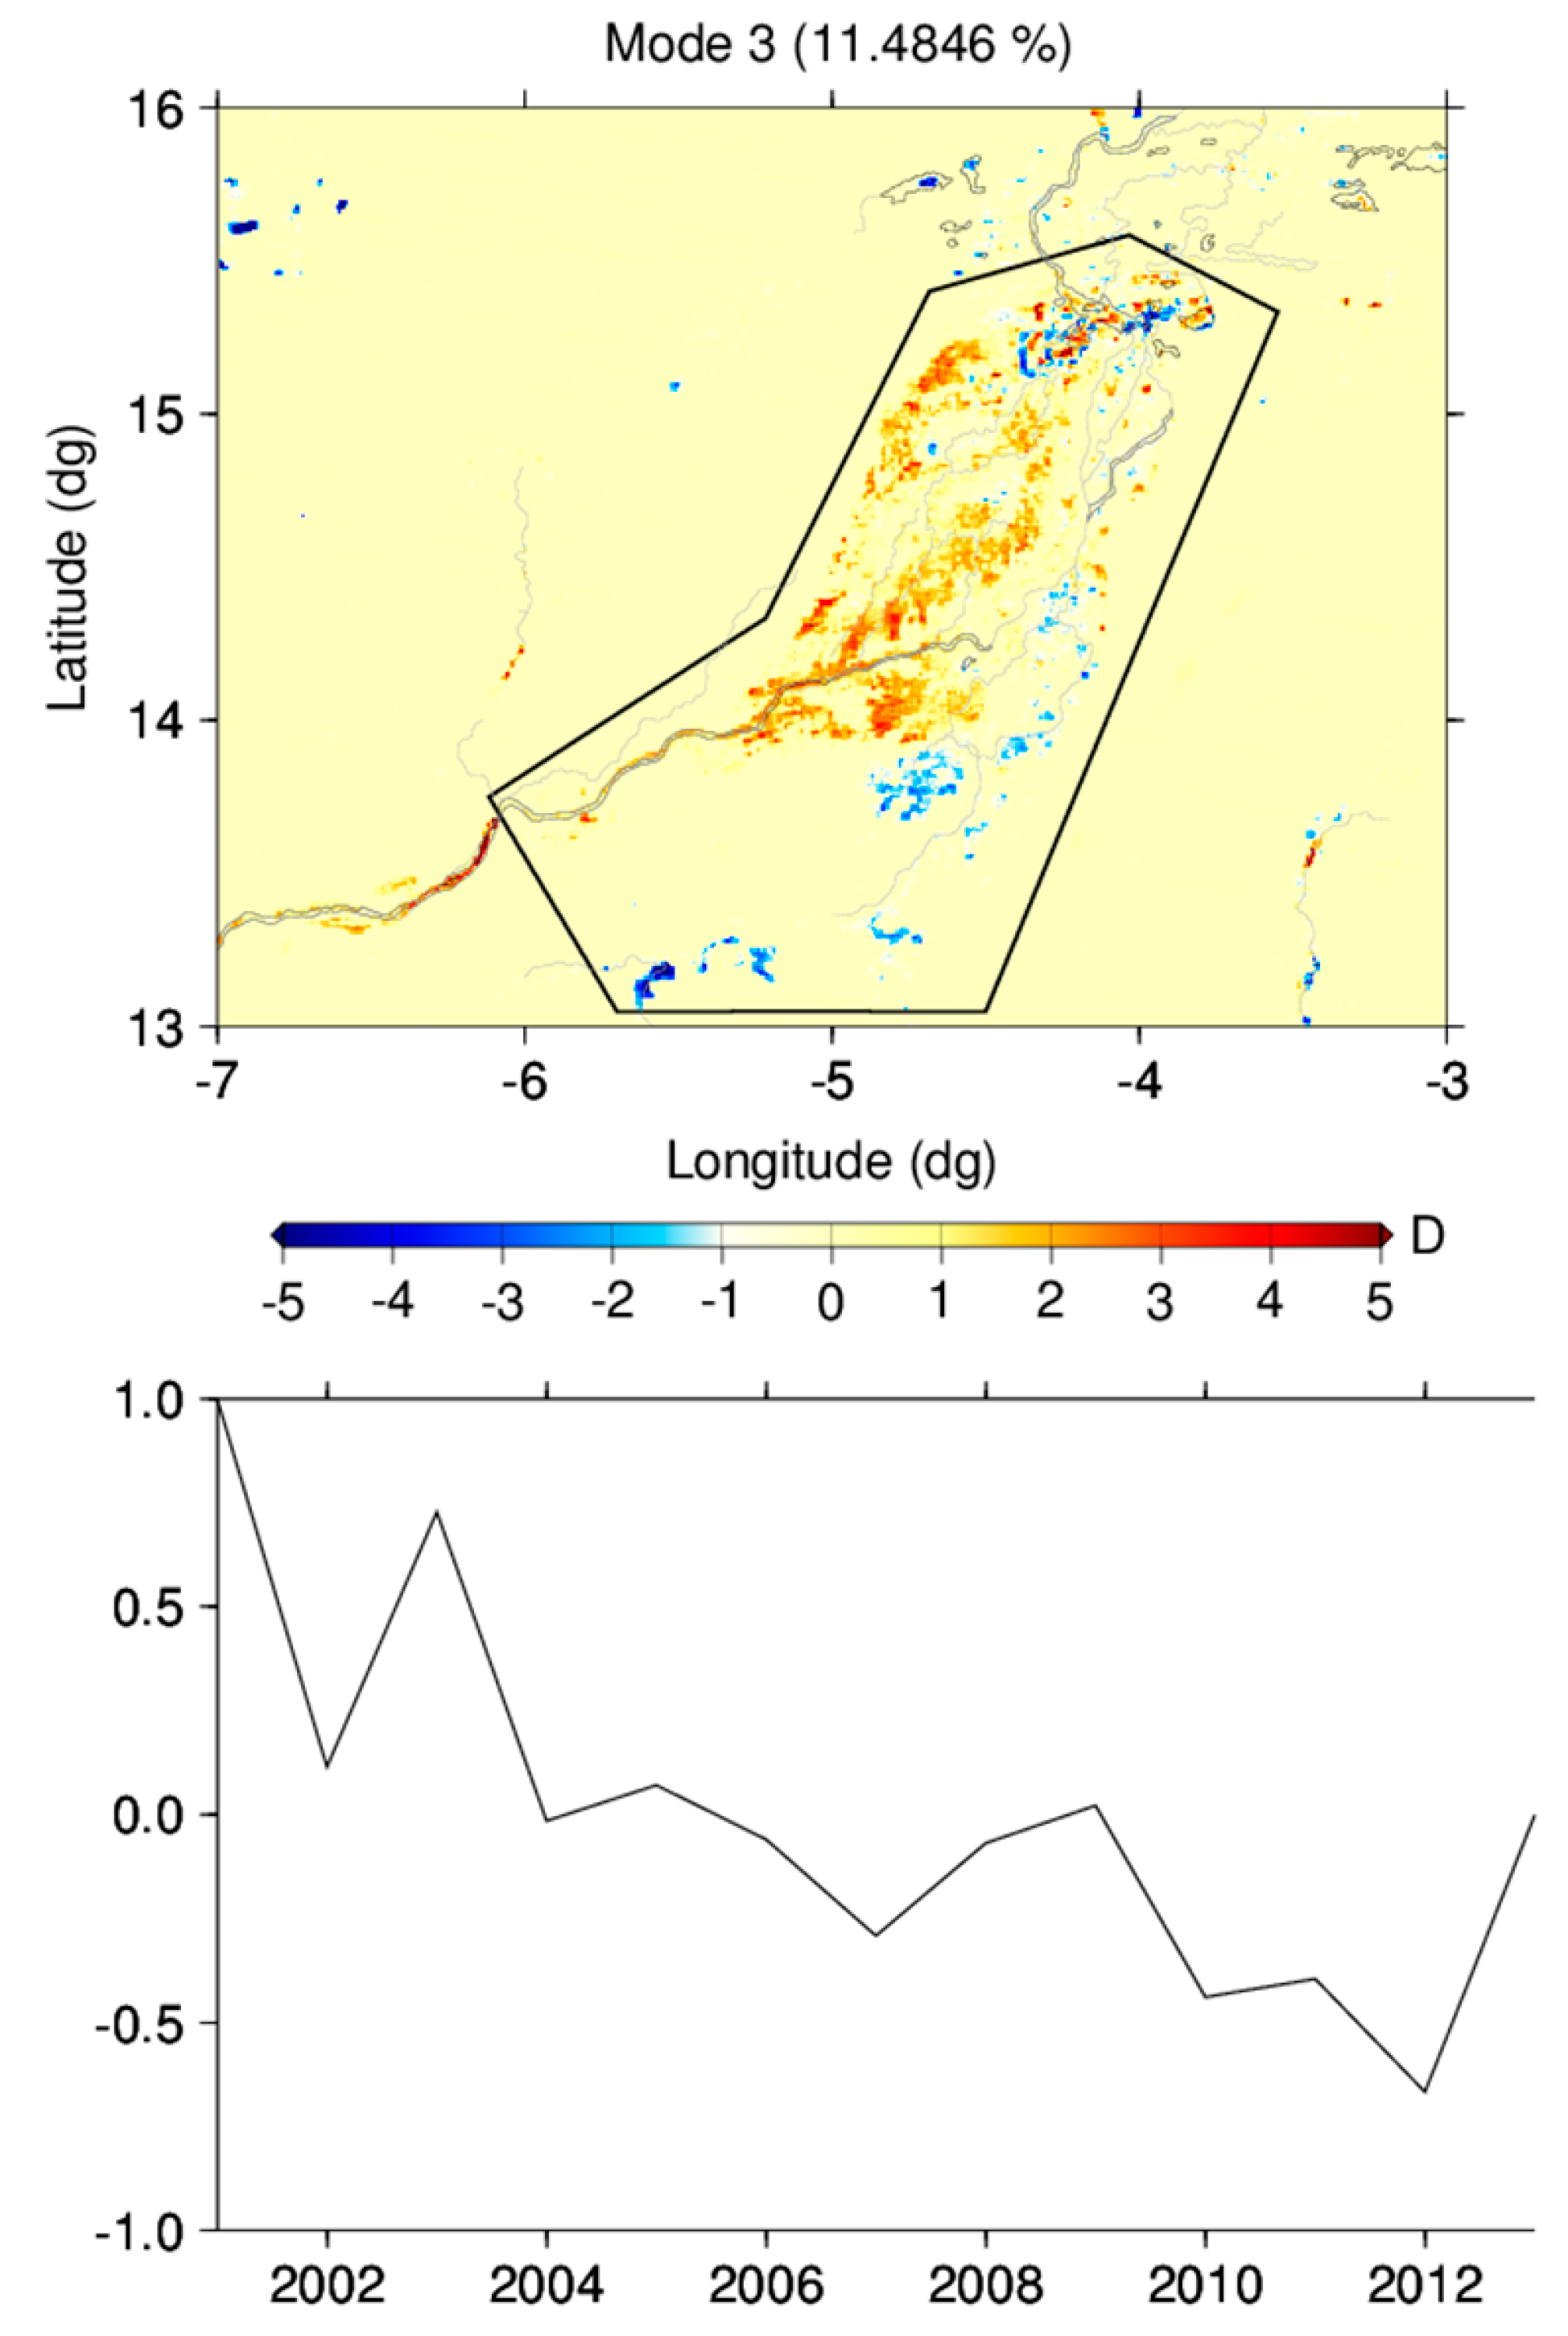
  • A map representing the average flood duration (in days) over the whole ROI, annual maps of flood duration anomalies with respect to average duration, and the Empirical Orthogonal Functions (EOFs, see Section 4.3) providing the spatio-temporal modes for each of the classes over the whole ROI.
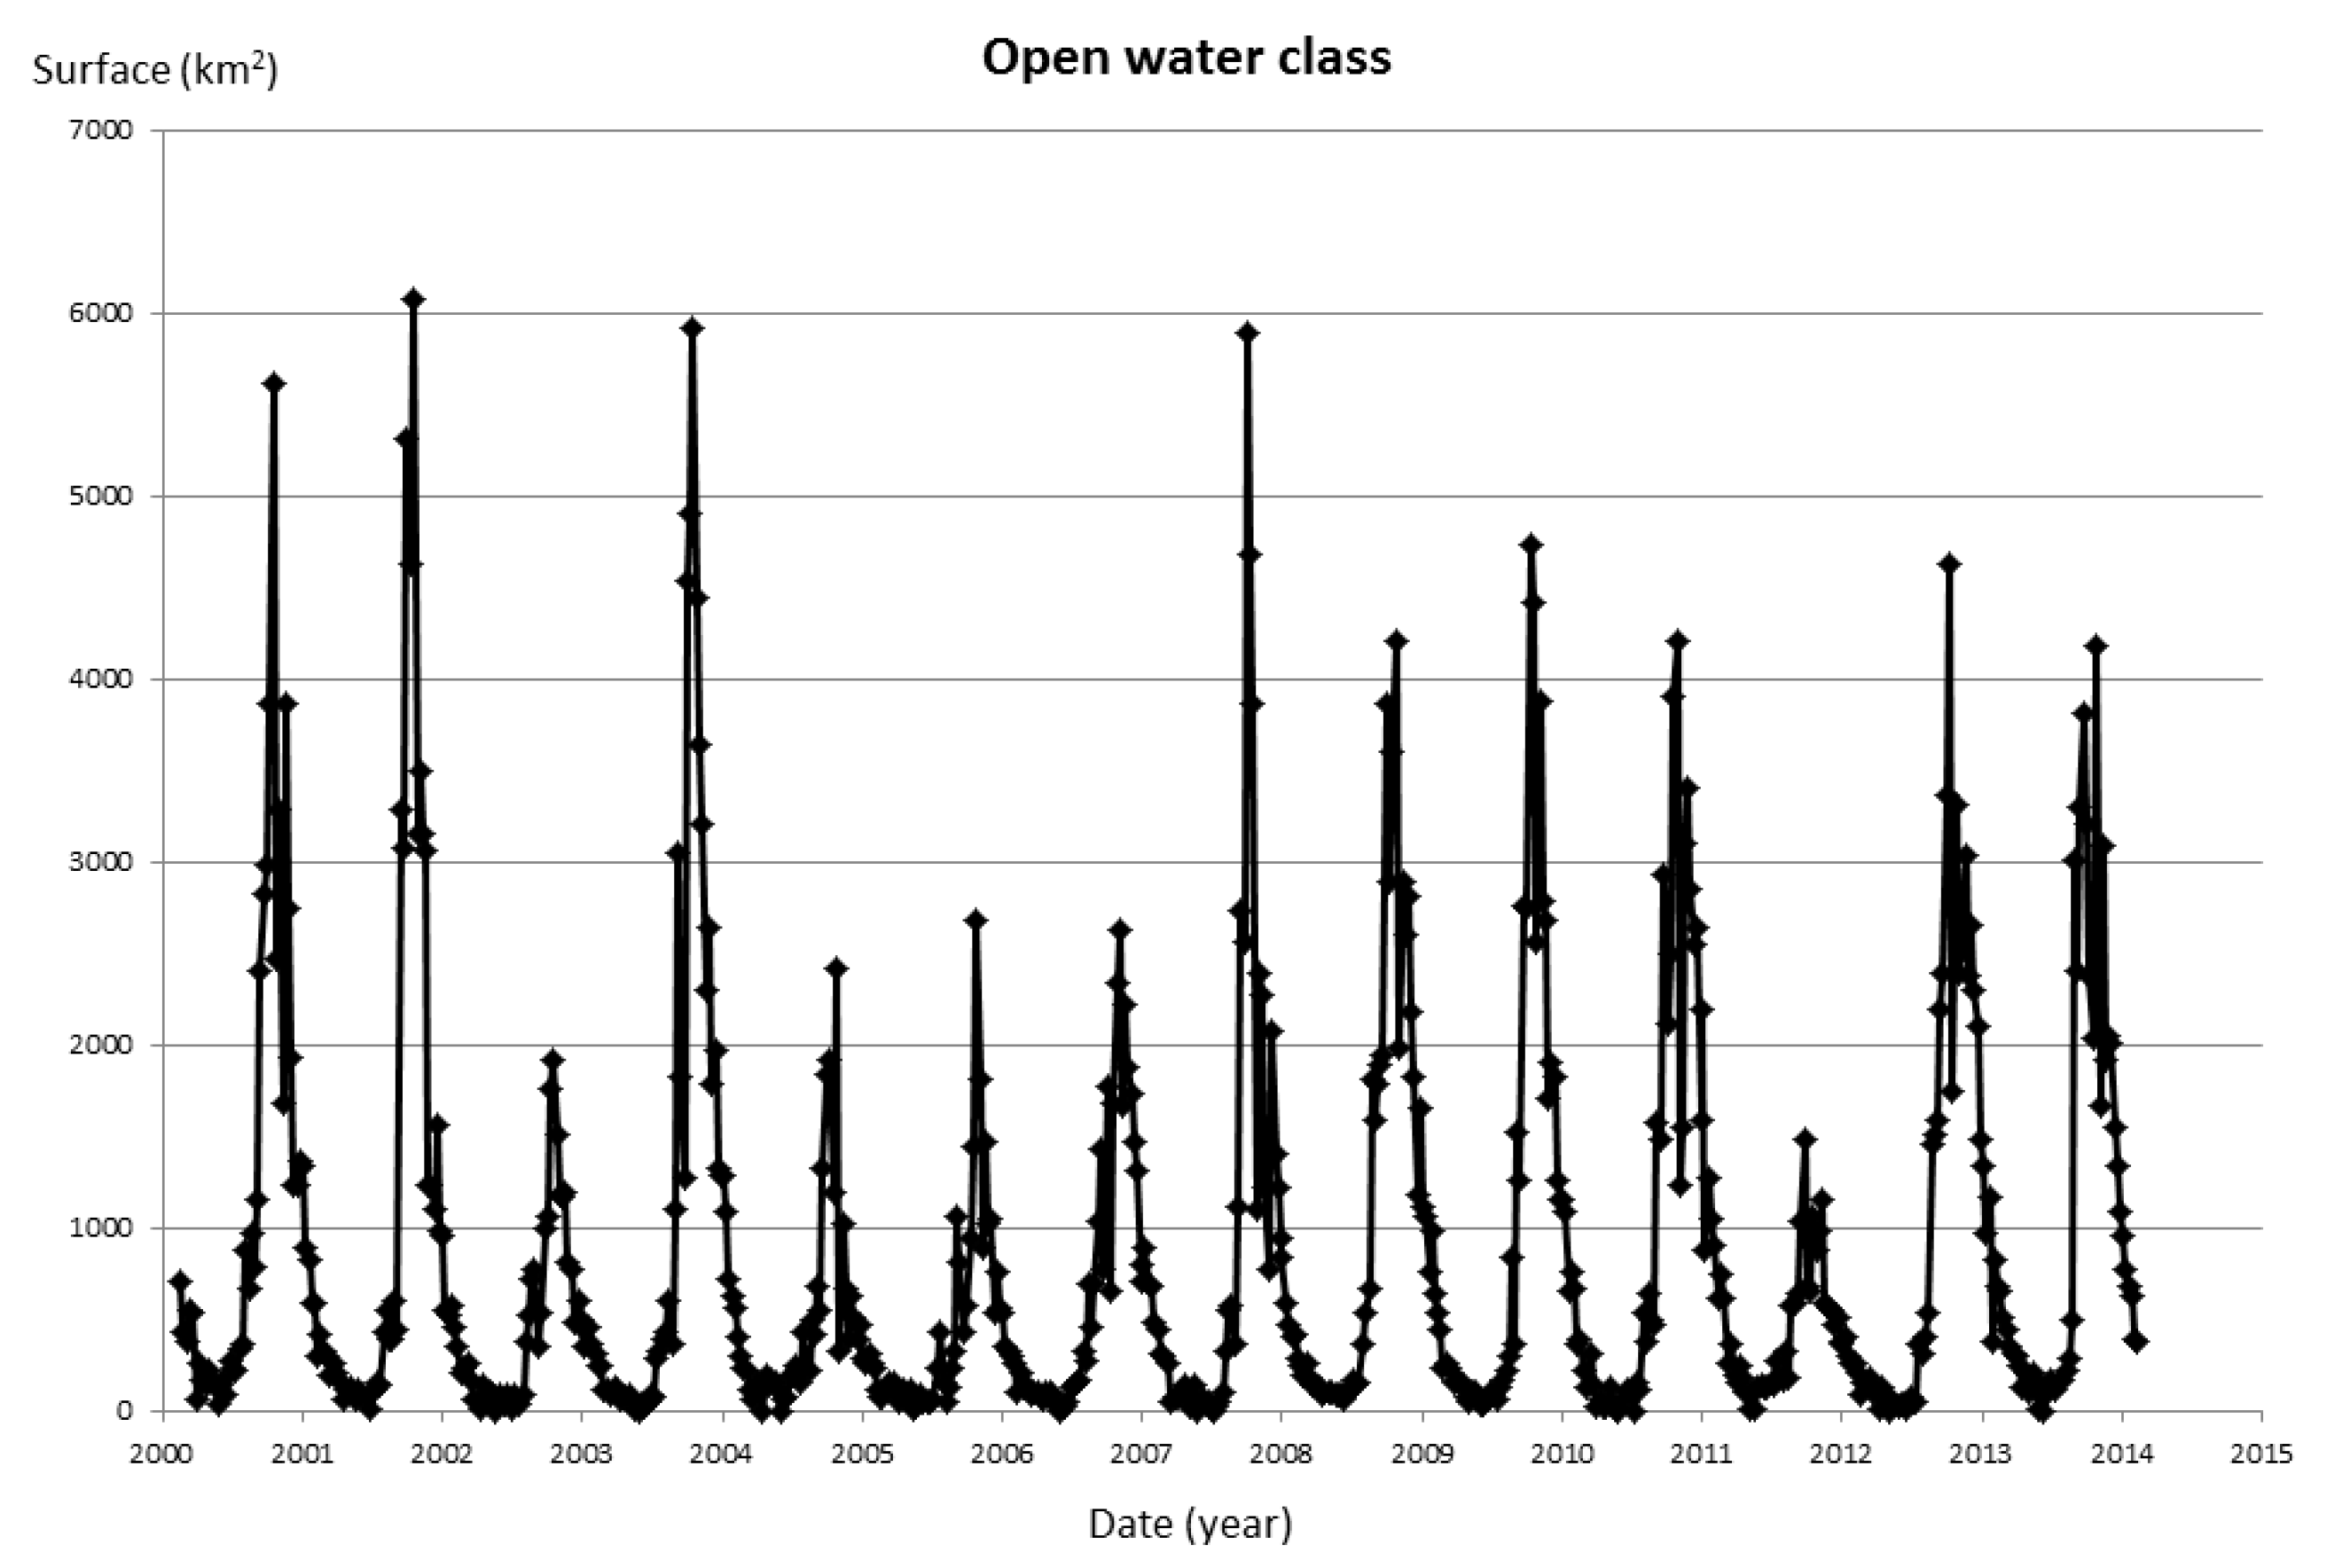
  • Evolution in time of the surface area of each class over the whole ROI.
The surface time series for each class was correlated with the precipitation rate over the Niger and Bani river basins upstream of the IND.
Validation was performed over the Aral Sea in Central Asia using previous results obtained in [38,39]. Variations in height, surface and volume of the Aral Sea were calculated for 1992 to 2005, with a combination of altimetry data from Topex/Poseidon and Jason satellites, and a digitized bathymetry map of the lake’s basin. We extended this calculation until 2007 for this study. Using a selection of 55 MODIS images over the period from 2000 to 2007, we calculated the surface variations of Small and Large Aral and compared with the results obtained by altimetry and bathymetry. The results are shown in Figure 2. The agreement between both methods of surface variation calculations is marked with a correlation coefficient of 0.996 and RMS differences of detected water extents less than 2%.
Figure 2. Scatter plot of classification of open water extent from Moderate Resolution Imaging Spectroradiometer and from a combination of satellite altimetry and digitized bathymetry of Aral Sea.
Remotesensing 07 02127 g002
The method was also validated over Lake Poopo in Bolivia. MODIS products were compared to Landsat imagery and resulted in a correlation of 0.97 [14]. They were used to study links between Lake Poopo and Lake Titicaca [13].
We compared our classification of the IND with results published in [40] for water and vegetation classifications. This was done by visual analysis of maps of inundated surfaces reproduced in [40] for 3 different dates and they showed good agreement qualitatively, but we did not assess this quantitatively. Images processed with our method were also used to validate the flood propagation model along the Niger River in [16]. Using our MODIS classification, Pedinotti et al. [16] observed improved comparison of their model outputs with downstream in situ discharges.
Furthermore, the MODIS data analysis done in this study allows downscaling low-resolution data as proposed in [17]. They used the MODIS classification presented here for water over the IND in synergy with the GIEMS database [17]. It provided water extent for the whole Earth on a monthly basis from 1993 to 2007 at a spatial resolution of 25 km.
Comparison of rainfall datasets to MODIS data products over the IND have been performed using the EOFs. The EOF analysis decomposes the spatio-temporal data in orthogonal modes of decreasing variance, expressed by spatial patterns and associated variations in time (also called principal component analysis (PCA)). In this method, we calculate the eigenvalues and eigenvectors of the covariance matrix of the data. We first calculated the 14-year average of MODIS data for each class and then subtracted it from the yearly average from 2000 to 2013. This allowed emphasis on inter-annual variability of the different modes. The theory of this method is fully described in [41,42] and the algorithm used in [43].

4. Results and Interpretation

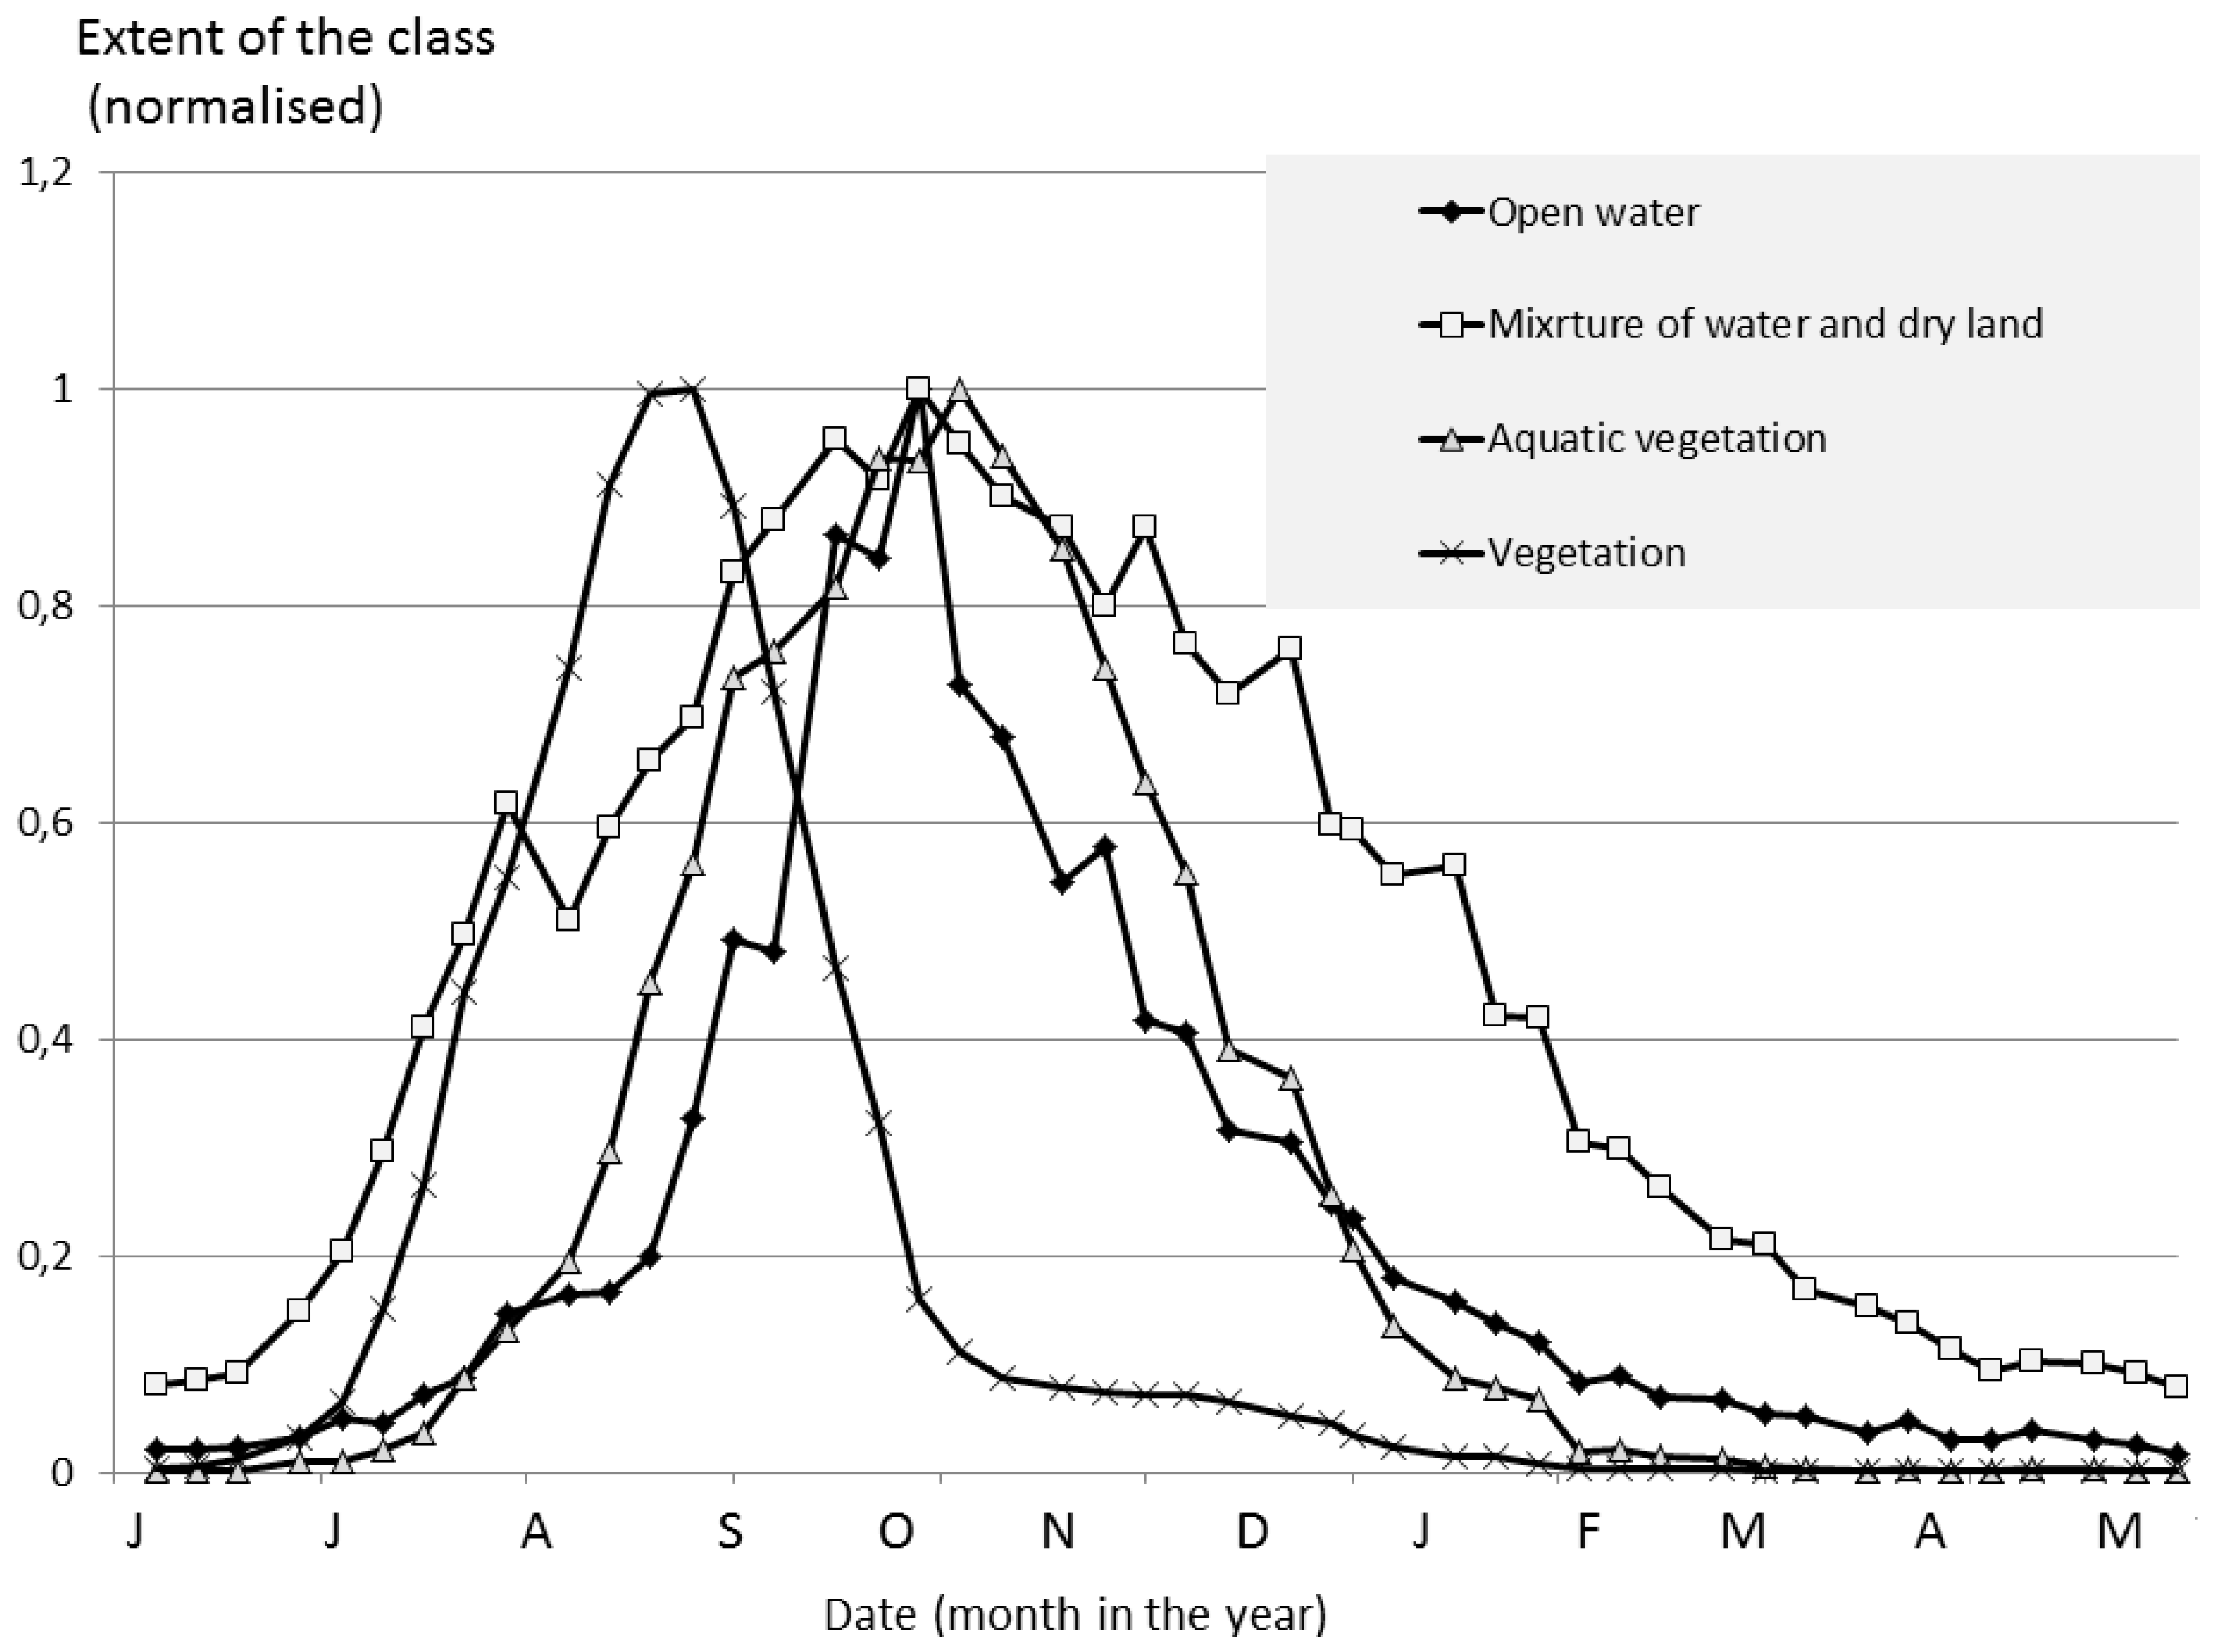
4.1. Land Surface Classification over the IND

Processing MODIS images has allowed the classification of Earth’s surface using the method described in Section 3.2.2 and also the monitoring of time variations for different surface types, from open water to vegetation on dry land. The maps are used principally as indicators to monitor floods over the IND. They will allow the examination of the flood process over the IND as a first step (Section 4.1.1) and second, to detect specific geographical patterns of very wet years compared to dry years using the multi-year analysis of MODIS data (Section 4.1.2). Phenomenology and inter-annual variability of vegetation and aquatic vegetation dynamics is also examined.

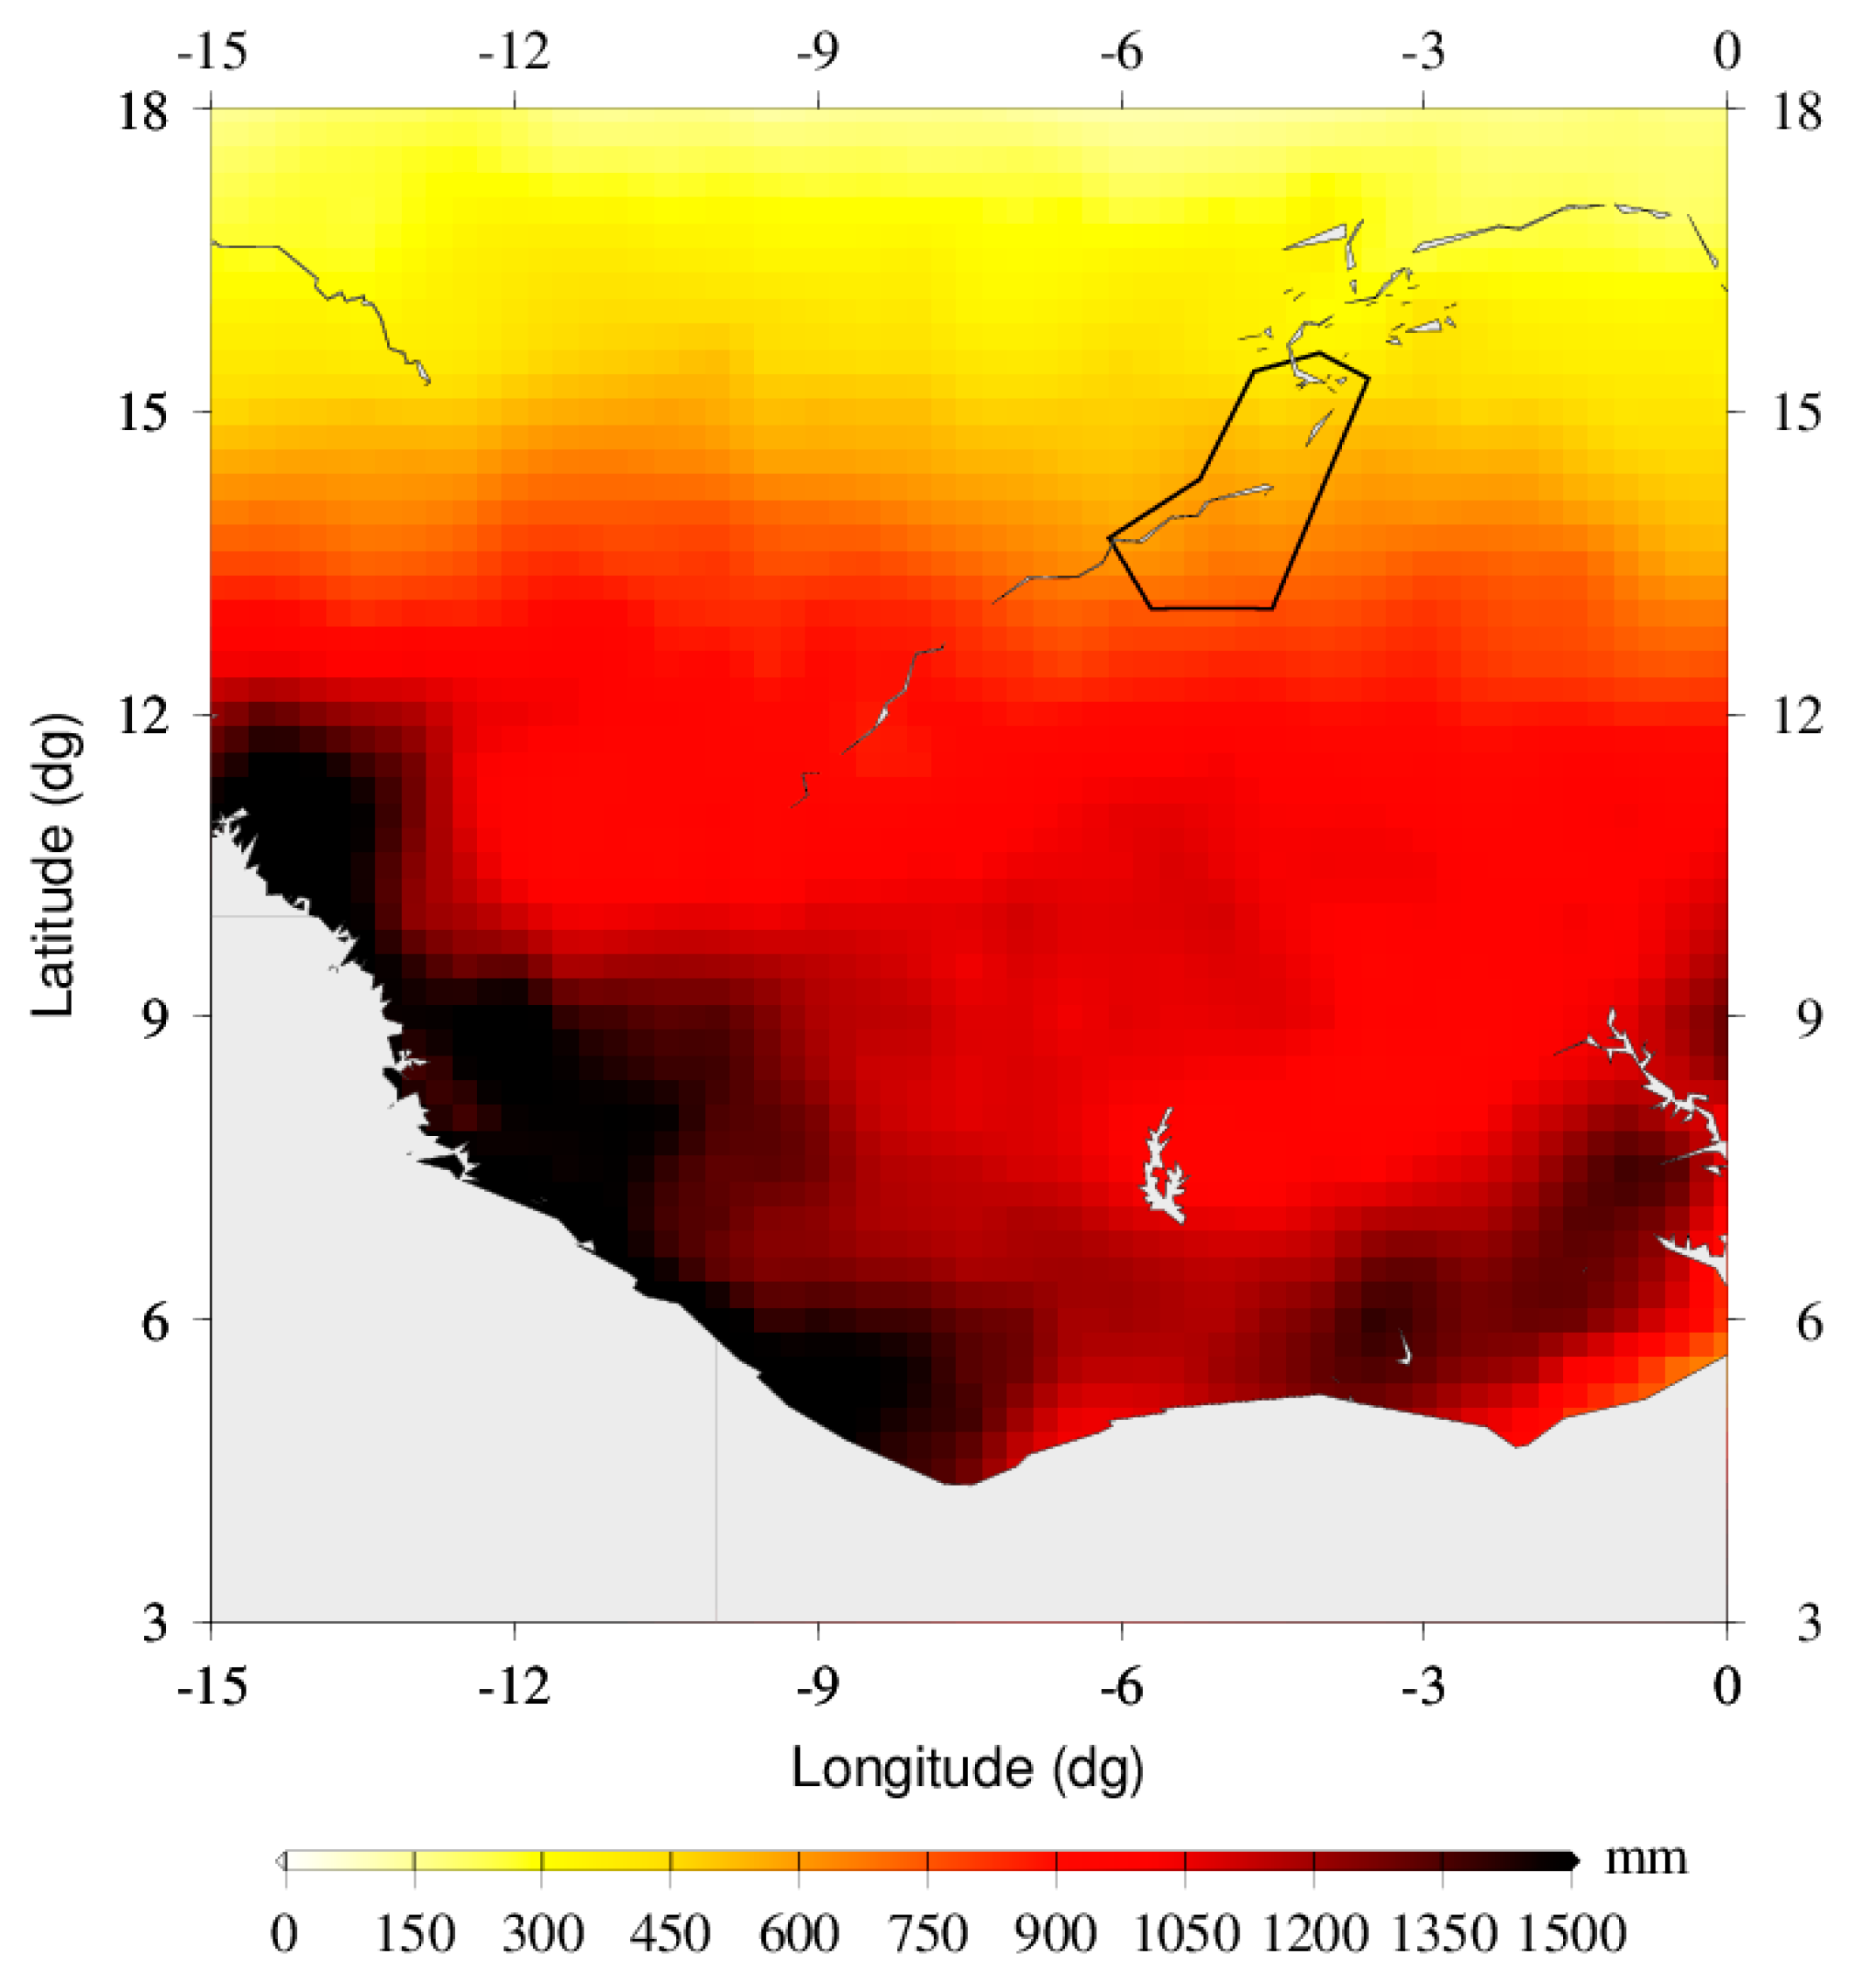
4.1.1. Mean Annual Flooding over the IND

For the period of our study and using the eight-day mosaic images, we classified the land over the ROI (Section 3.2). This is shown in Figure 3a,b and represents one full year (2003) using one selected image per month with the classification deduced from MODIS data. This figure illustrates the sequence of inundation over the IND. The first month selected in the set of images is June, just at the beginning of the rainy season, and the last is May of the following year.
Figure 3. Moderate Resolution Imaging Spectroradiometer classification of the Inner Niger Delta (IND) with one image per month in 2003–2004 being selected for illustration of the inundation phenomenon over the Inner Niger Delta (IND) (a) from June to November 2003, (b) from December 2003 to May 2004.
Remotesensing 07 02127 g003
In June, permanent lakes located in northern IND areas start to grow, with July marking the apparition of vegetation in the southern IND and on the delta itself. Vegetation grows regularly and the whole region is covered by the end of August. At the same time, free water is still limited to small areas like permanent lakes, the main parts of rivers, and some areas of the IND southwest of Lake Debo that are also covered with aquatic vegetation (Figure 3a,b). The end of August or beginning of September is marked by flow increase over the IND, which continues for around six weeks and reaches its peak by mid-October. Meanwhile, surrounding regions of the IND lose their vegetation cover. From November to January, water over the IND evaporates and remaining vegetation located over the delta simply dries out. We observe that surfaces are first covered with aquatic vegetation, and only then followed by vegetation. In January, the IND is almost completely dried up except for some very small areas near Lake Debo where it remains wet until June.
This inundation sequence is also illustrated in Figure 4. It represents (over the 14 years of this study) an average surface extent of different classes detected by MODIS over the ROI. In order to be comparable, these average surfaces were normalized. This figure shows that the peak of vegetation occurs at the beginning of September, whereas the peak for open water, mixture of water and dry land and aquatic vegetation appears one and a half months later.
Figure 4. Normalized total extent of each of the classes over the Inner Niger Delta (IND) during a hydrological year (starting in June, finishing in May). All years have been averaged over each time portion of eight days.
Remotesensing 07 02127 g004
Aquatic vegetation and open water are also in phase, which signifies that when the main flood occurs a small part of the IND is already covered by water or by aquatic vegetation (probably due to local rainfall). The peak of open water is also significantly narrower than that of aquatic vegetation. Mixture of water and dry land most likely indicates that:
  • The inundated surface is shallow.
  • The vertical topography slope of the IND is small.
  • Downstream water flow is probably slower due to the presence of vegetation.
From January to May, the IND and surrounding regions dry out. Surface water evaporates completely except for some permanent small lakes such as Lake Debo in the northern part of the IND. Vegetation fully disappears from the region, most notably in the Delta.
The average duration of time over the period 2001–2013 of each class is also given in Figure 5a–d (2000 is excluded because the first images were collected in mid February 2000).
Figure 5. Average duration (in percentage per year) of (a) open water; (b) mixture of water and dry land; (c) aquatic vegetation; and (d) vegetation calculated from 2001 to 2013 (2000 has not been taken into account because the first MODIS data was collected in February of this year).
Remotesensing 07 02127 g005
Figure 5a shows that flow duration in the southern part of the delta is rather short (less than a month) and very heterogeneously distributed. The “NW belt” of long duration (more than two months) is highlighted in dark blue. Due to the images’ spatial resolution both the Niger and Bani rivers do not appear as permanently covered with water. These can be better viewed in Figure 5b, which shows the duration of mixed water (pixel covered both with water and dry land). This is confirmation that the southern part of the delta is a zone of rapid water flow and that the northern part behaves as a pool where water stays longer [3]. A much larger surface is covered with aquatic vegetation and mixture of water and dry land for periods exceeding one month (Figure 5b,c). Over the IND aquatic vegetation duration is also noticeably longer on the left bank of the Niger River than on its right bank where the Bani River is located. Along the NW belt mentioned above, aquatic vegetation duration often exceeds three months (Figure 5c). Dry vegetation (Figure 5d) is present almost everywhere over the IND for long period of time (more than three months) and up to three to four months on the delta’s west bank.

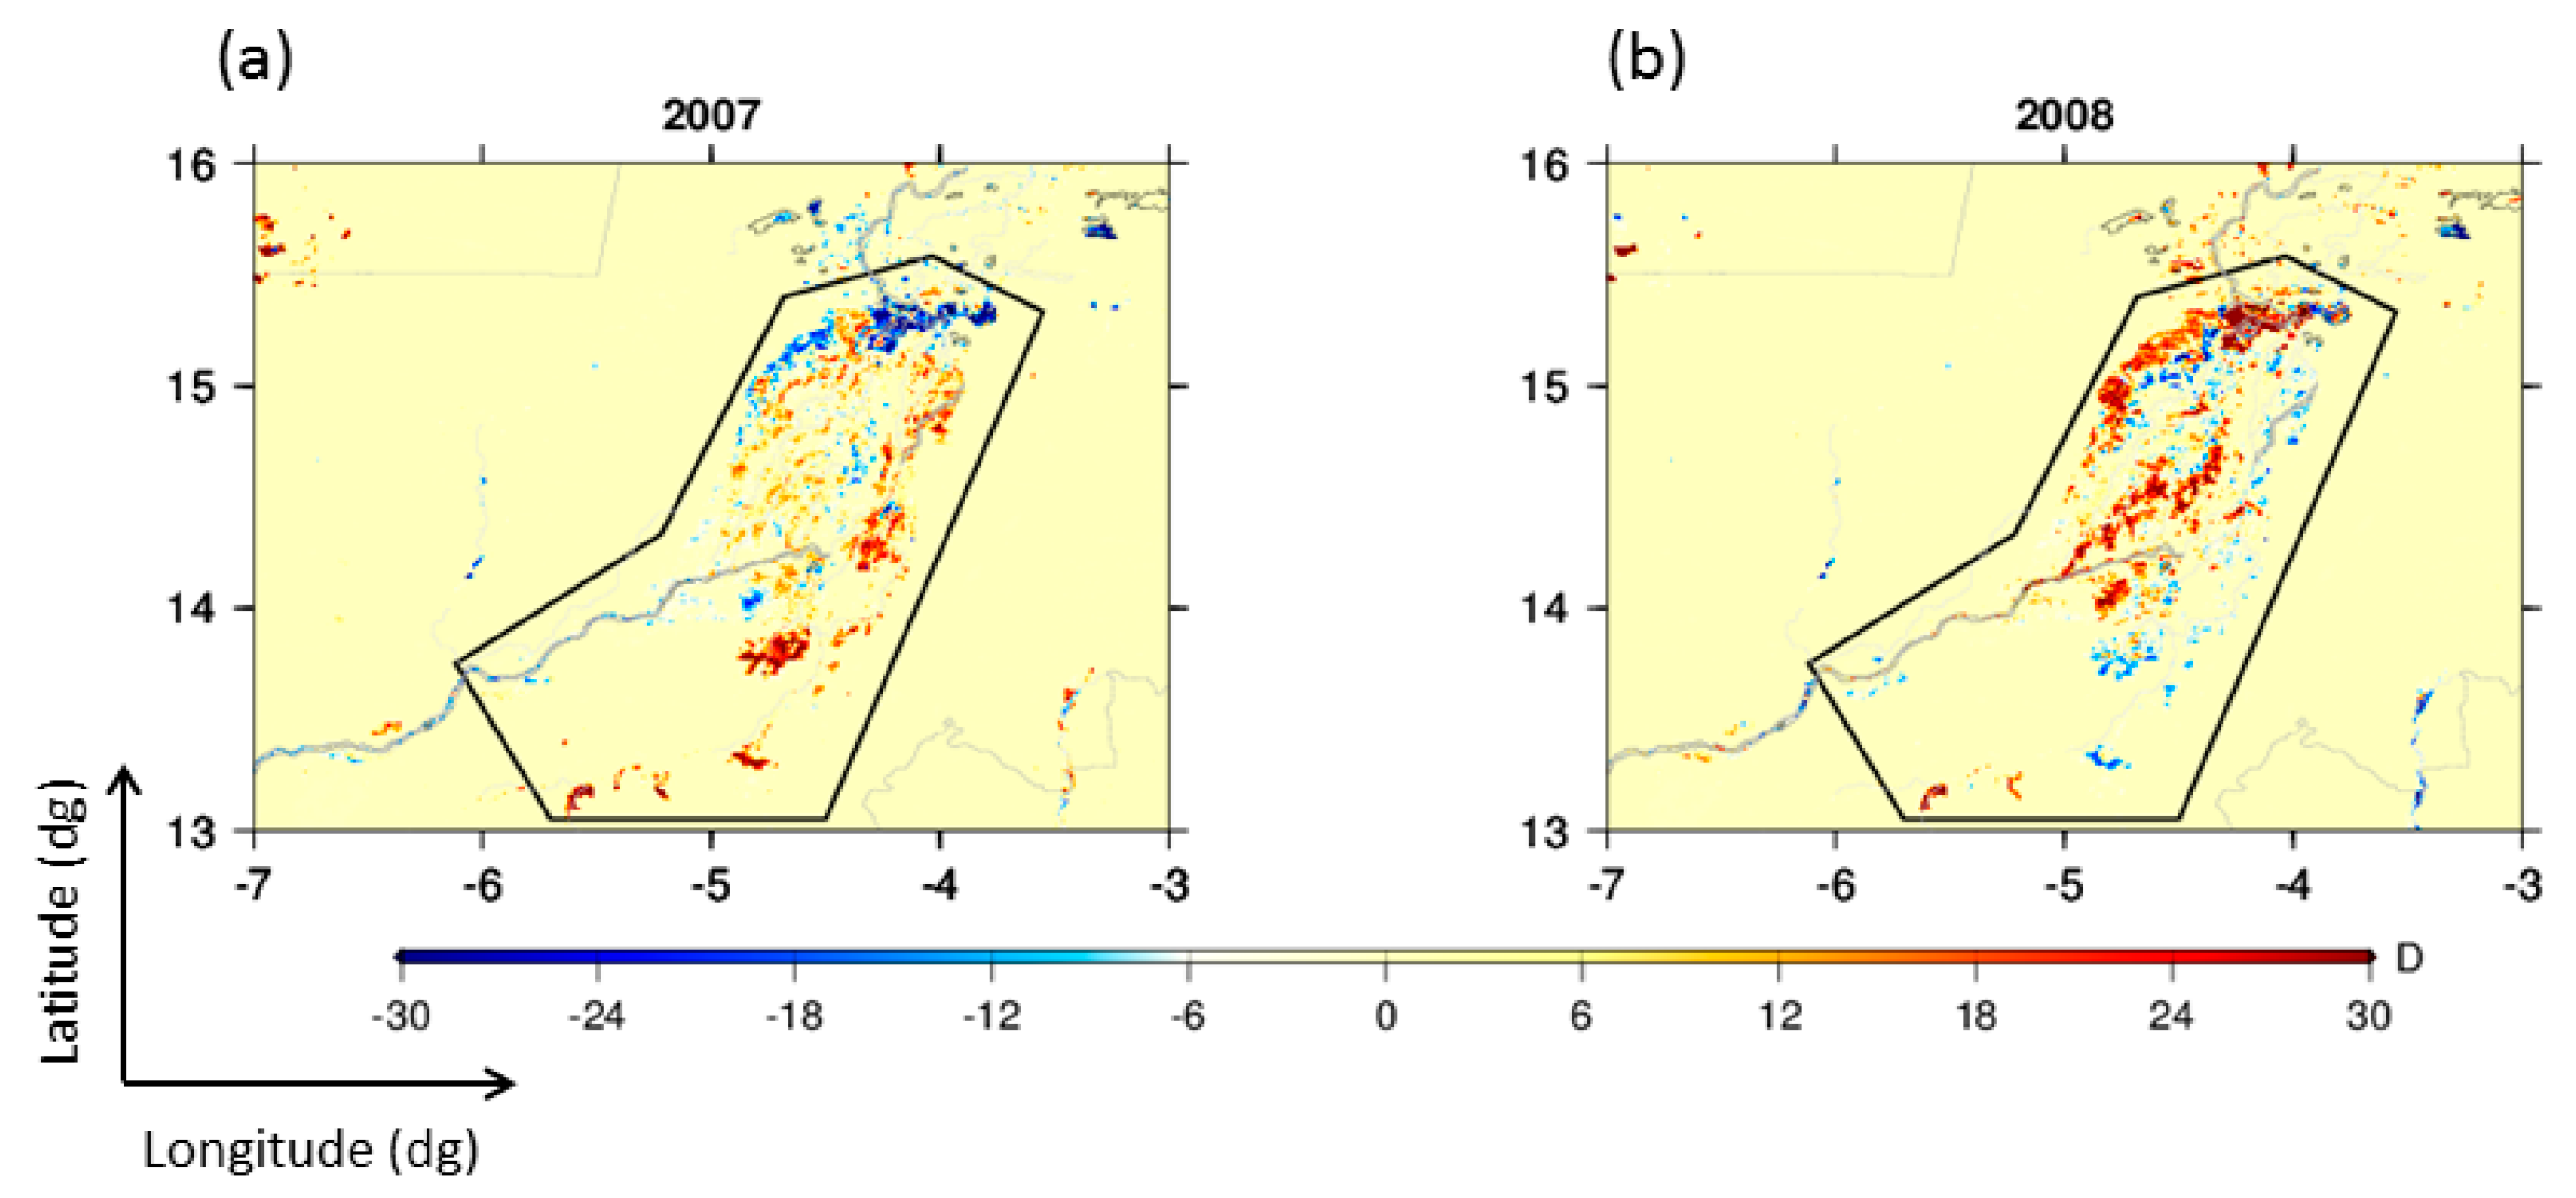
4.1.2. Inter-Annual Variability of Floods over the IND

Satellite images may be used to classify the land surface in time. In the case of the IND it will allow monitoring the inter-annual dynamics of different classes, and their correlation with climatic condition changes over IND and Niger and Bani river watersheds.
High variability of inundated surfaces from one year to another is well illustrated in Figure 6, which shows a two year period (2001: high inundation year and 2002: low inundation year) when MODIS images were taken at the date of maximum extent of flood. The inundation patterns observed over these two ‘extreme’ years show a very high spatial variability of inter-annual flooding. This is also illustrated in Figure 7: between the wettest year (2001) and the driest one (2011) where the maximum extent of open water class varies by a factor of four. This is less pronounced for the three other classes with a factor of 2 to 2.5 calculated between wet and dry years. Another visualization of inter-annual variability of floods is given in Figure 8a,b. They show the anomaly of duration in each class for the wet (2001) and dry (2002) years with respect to the average year. They illustrate that not only surface extent varies significantly from the wet to dry years, but also the total duration of open water, mixture of water and dry land, aquatic vegetation, and vegetation. This is particularly marked for aquatic vegetation and vegetation. Indeed, for open water duration anomalies (Figure 8a), we observe up to 60 days of duration differences, principally concentrated on the NW belt. For aquatic vegetation and vegetation, we see that on almost the entire delta the differences are about 60 days between 2001 and 2002 (Figure 8b). It is also noteworthy that we observe the exact opposite behavior with the inter-annual variability of the maximum surface extent for each of the classes. The differences between wet and dry years are more pronounced for the open water class than for the three others. This indicates that for open water the time of residency is less sensitive to the inundation magnitude.
Figure 6. Map of Moderate Resolution Imaging Spectroradiometer classification for the day of maximum inundation for 2001 (high inundation) and 2002 (low inundation).
Remotesensing 07 02127 g006
Figure 7. Time series of surface extent of open water class calculated from MODIS data.
Remotesensing 07 02127 g007
Figure 8. Yearly anomalies of duration (in day) of presence of (a) open water and (b) mixture of water and dry land; (c) aquatic vegetation; and (d) vegetation for 2001 and 2002.
Remotesensing 07 02127 g008
Finally, another specific geographical pattern of inter-annual flooding appears in the year 2007. 2007 is one of the four high flood years (the three others being 2000, 2001 and 2003 (Figure 7)). However, the principle origin of the 2007 high flood is the Bani River to the south, which is not the case for the other years. Indeed the anomaly of water duration along the Niger River particularly at the entrance of the delta is very close to zero in 2007 (Figure 9). This can be contrasted with 2008 (another high flood year) in which the Bani River does not seem to supply excess water to the delta, while the Niger ‘entrance’ to the delta remains flooded much longer (about 30 days) than in an average year. This may also explain why the NW belt presents a deficit in the number of flooded days in 2007, given that 2007 is among the most flooded years. This reveals that flooding in the IND is a combination of high water in both the Bani and Niger rivers, but with changes in their roles from one year to another one. This is a factor of complexity for understanding flood processes in the IND.
Figure 9. Yearly anomalies of duration (in day) of presence of open water for (a) 2007 and (b) 2008.
Remotesensing 07 02127 g009

4.2. Rainfall

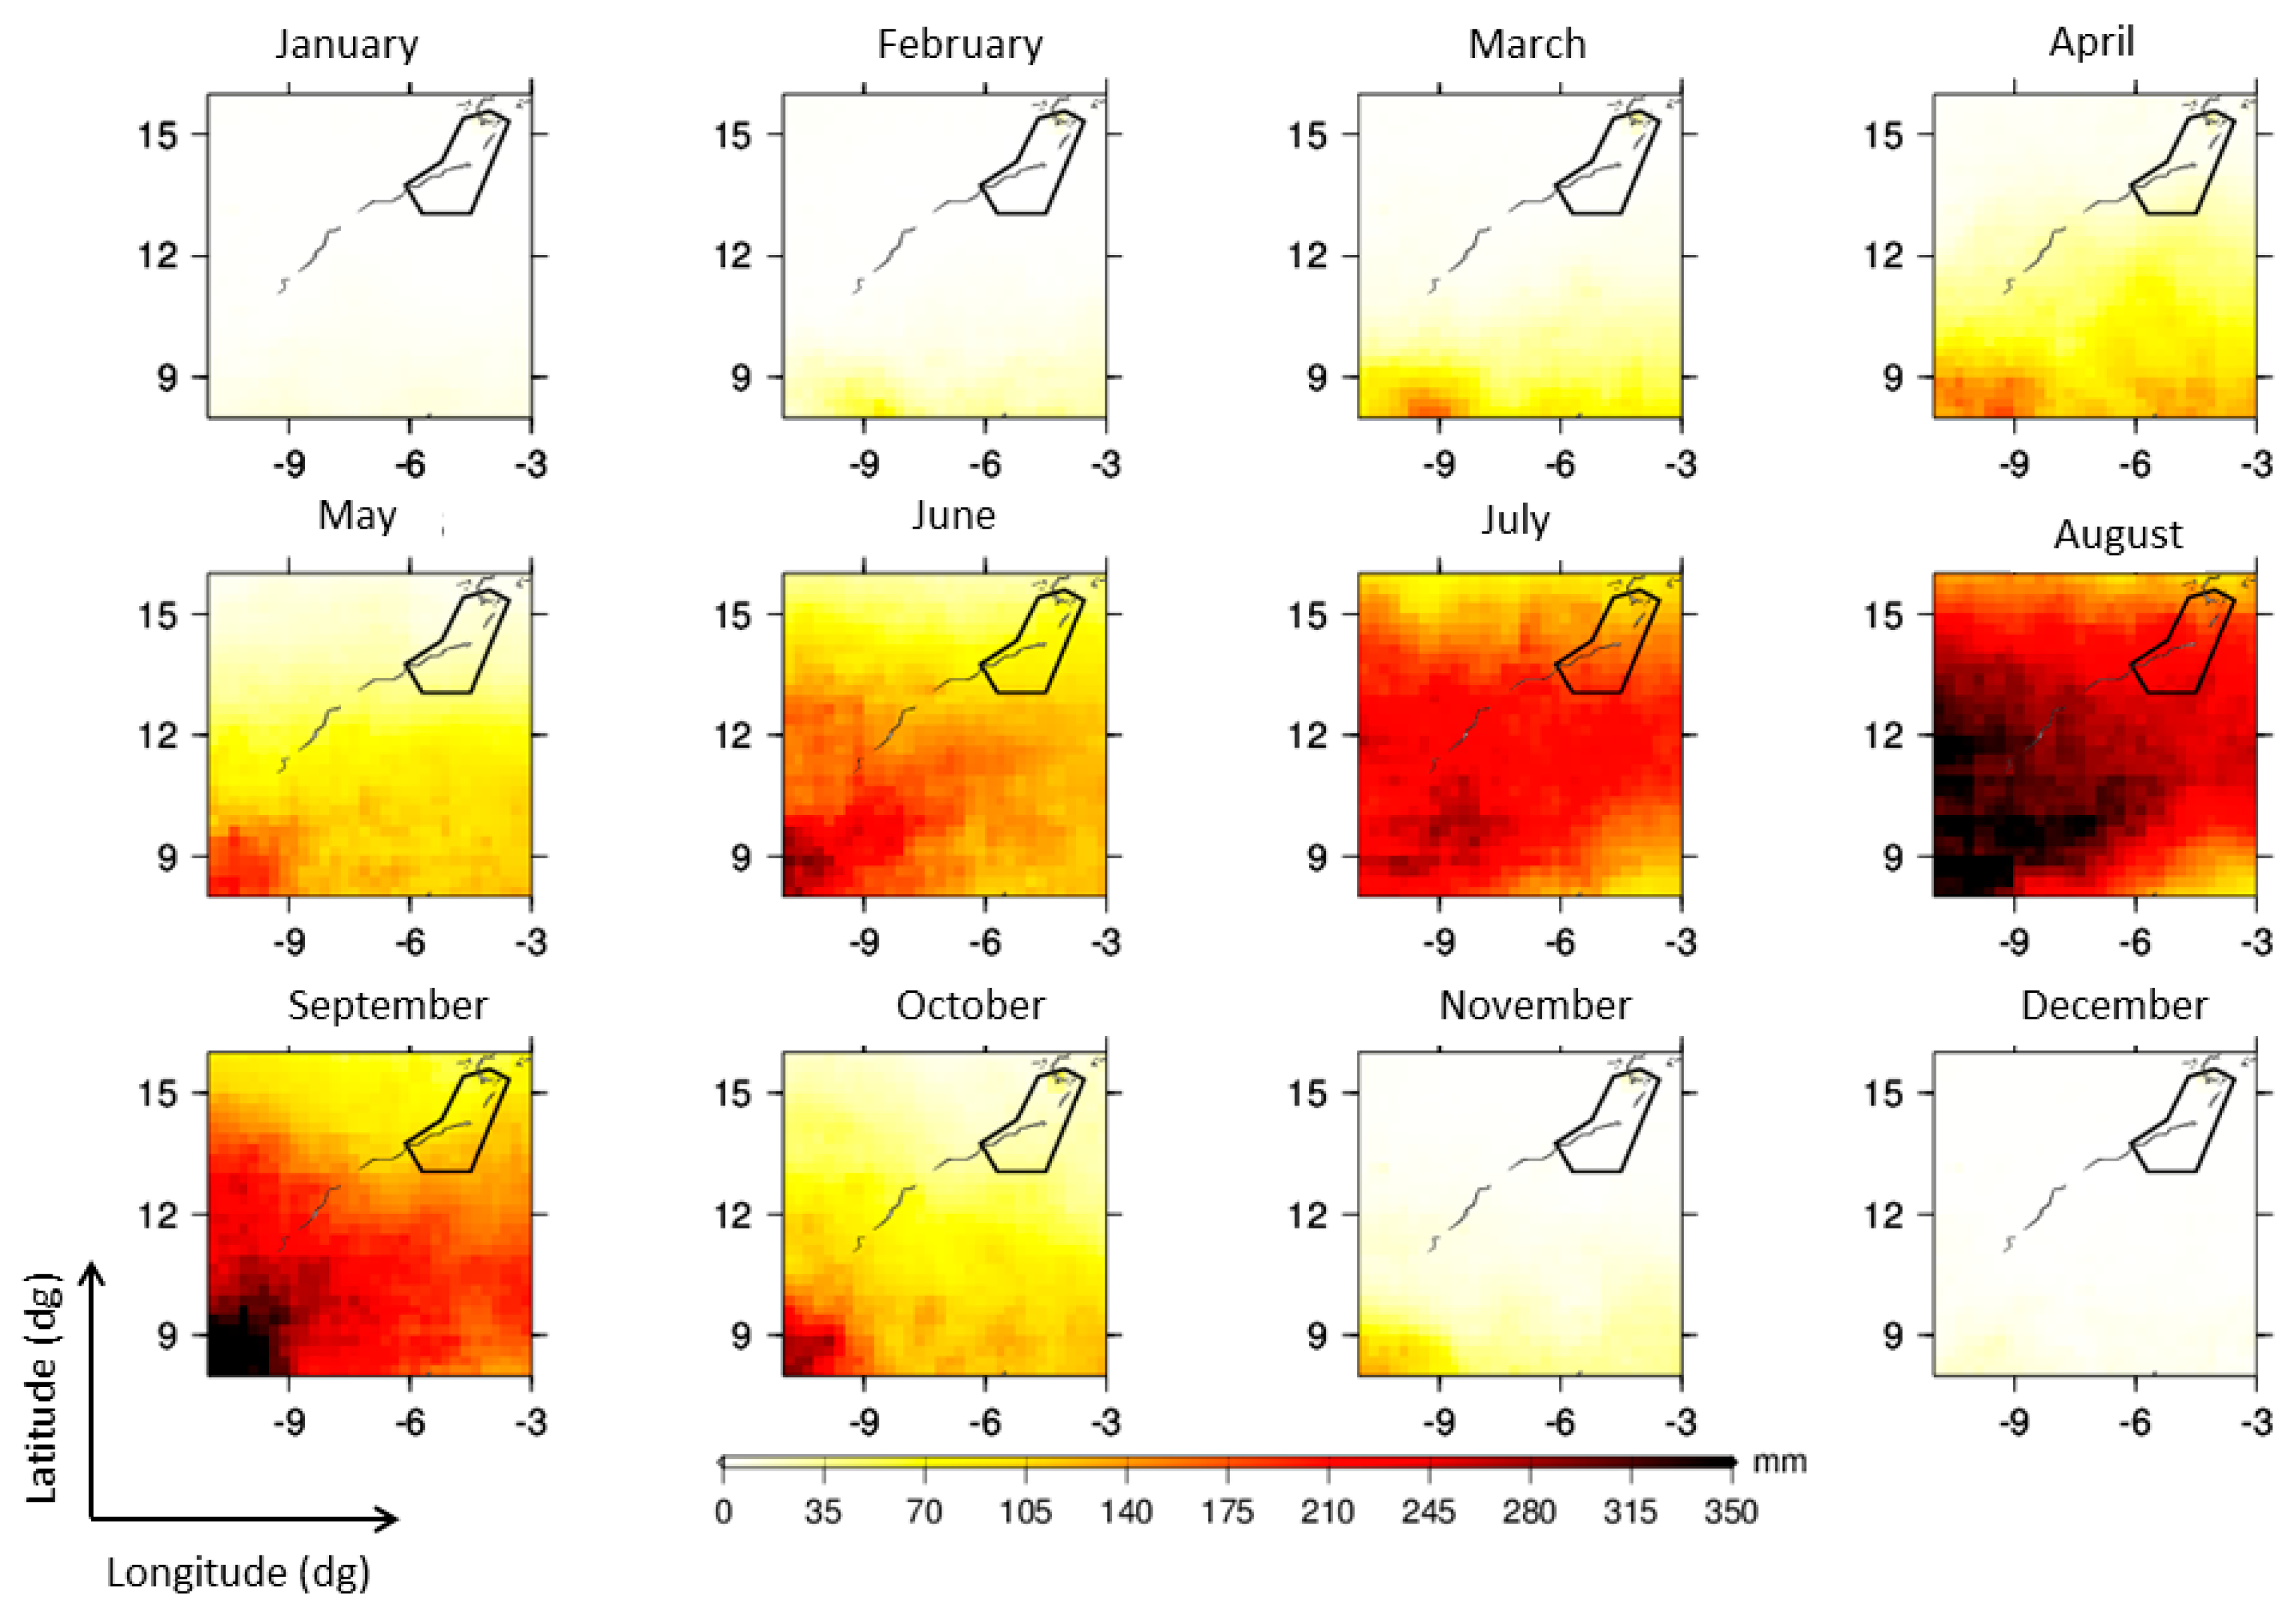
4.2.1. Seasonal Rainfall over West Africa

Precipitation over this region is the main contributor to inundations over the IND [2]. The exact correlation between the amount of precipitation and its geographical patterns with spatio-temporal variability of the water extent over the IND is the main issue explored in this study.
Figure 10 shows mean annual rainfall over West Africa in the vicinity of the IND from TRMM 3B43 data. This map highlights the latitudinal pattern of annual precipitation with a strong gradient from south to north of the region. In the south, where the two rivers take their source, the annual rainfall is about 1200–1500 mm, while the north, where the IND is located, is a semi-arid region with less than 300 mm/yr of rainfall.
Using the precipitation data sets, we then calculated a so-called-seasonal “climatology”: a monthly map of average rainfall deduced from the full period of observation (Figure 11). Firstly, the period from November to April marks the dry season with zero precipitation over both rivers. Over the IND, the dry season continues until June with very low rainfall: less than a few dozen mm in May. In May, more significant rainfall occurs over the source of the Niger and Bani rivers. But the start of the wet season in June is when strong precipitation over the Atlantic coast of West Africa moves northeastward. Meanwhile, it starts to rain over the IND itself, with increasing precipitation in July and August. In August, precipitation is at its maximum over the entire region. It then starts to decrease from the IND to the southwest until November when it is totally dry everywhere (Figure 11).
Figure 10. Map of mean annual precipitation over the Inner Niger Delta (IND) and upstream basins of Niger and Bani rivers, taken from Tropical Rainfall Measuring Mission (TRMM) 3B43 data from 2000 to 2013.
Remotesensing 07 02127 g010
Figure 11. Maps on monthly average precipitation from Tropical Rainfall Measuring Mission (TRMM) 3B43.
Remotesensing 07 02127 g011
Figure 12. (a) Annual normalized precipitation over the Region Of Interest (ROI) from Tropical Rainfall Measuring Mission 3B43 compared to annual normalized coverage area of vegetation over the Inner Niger Delta (IND) measured by Moderate Resolution Imaging Spectroradiometer; (b) annual rainfall anomalies with respect to the global mean.
Remotesensing 07 02127 g012

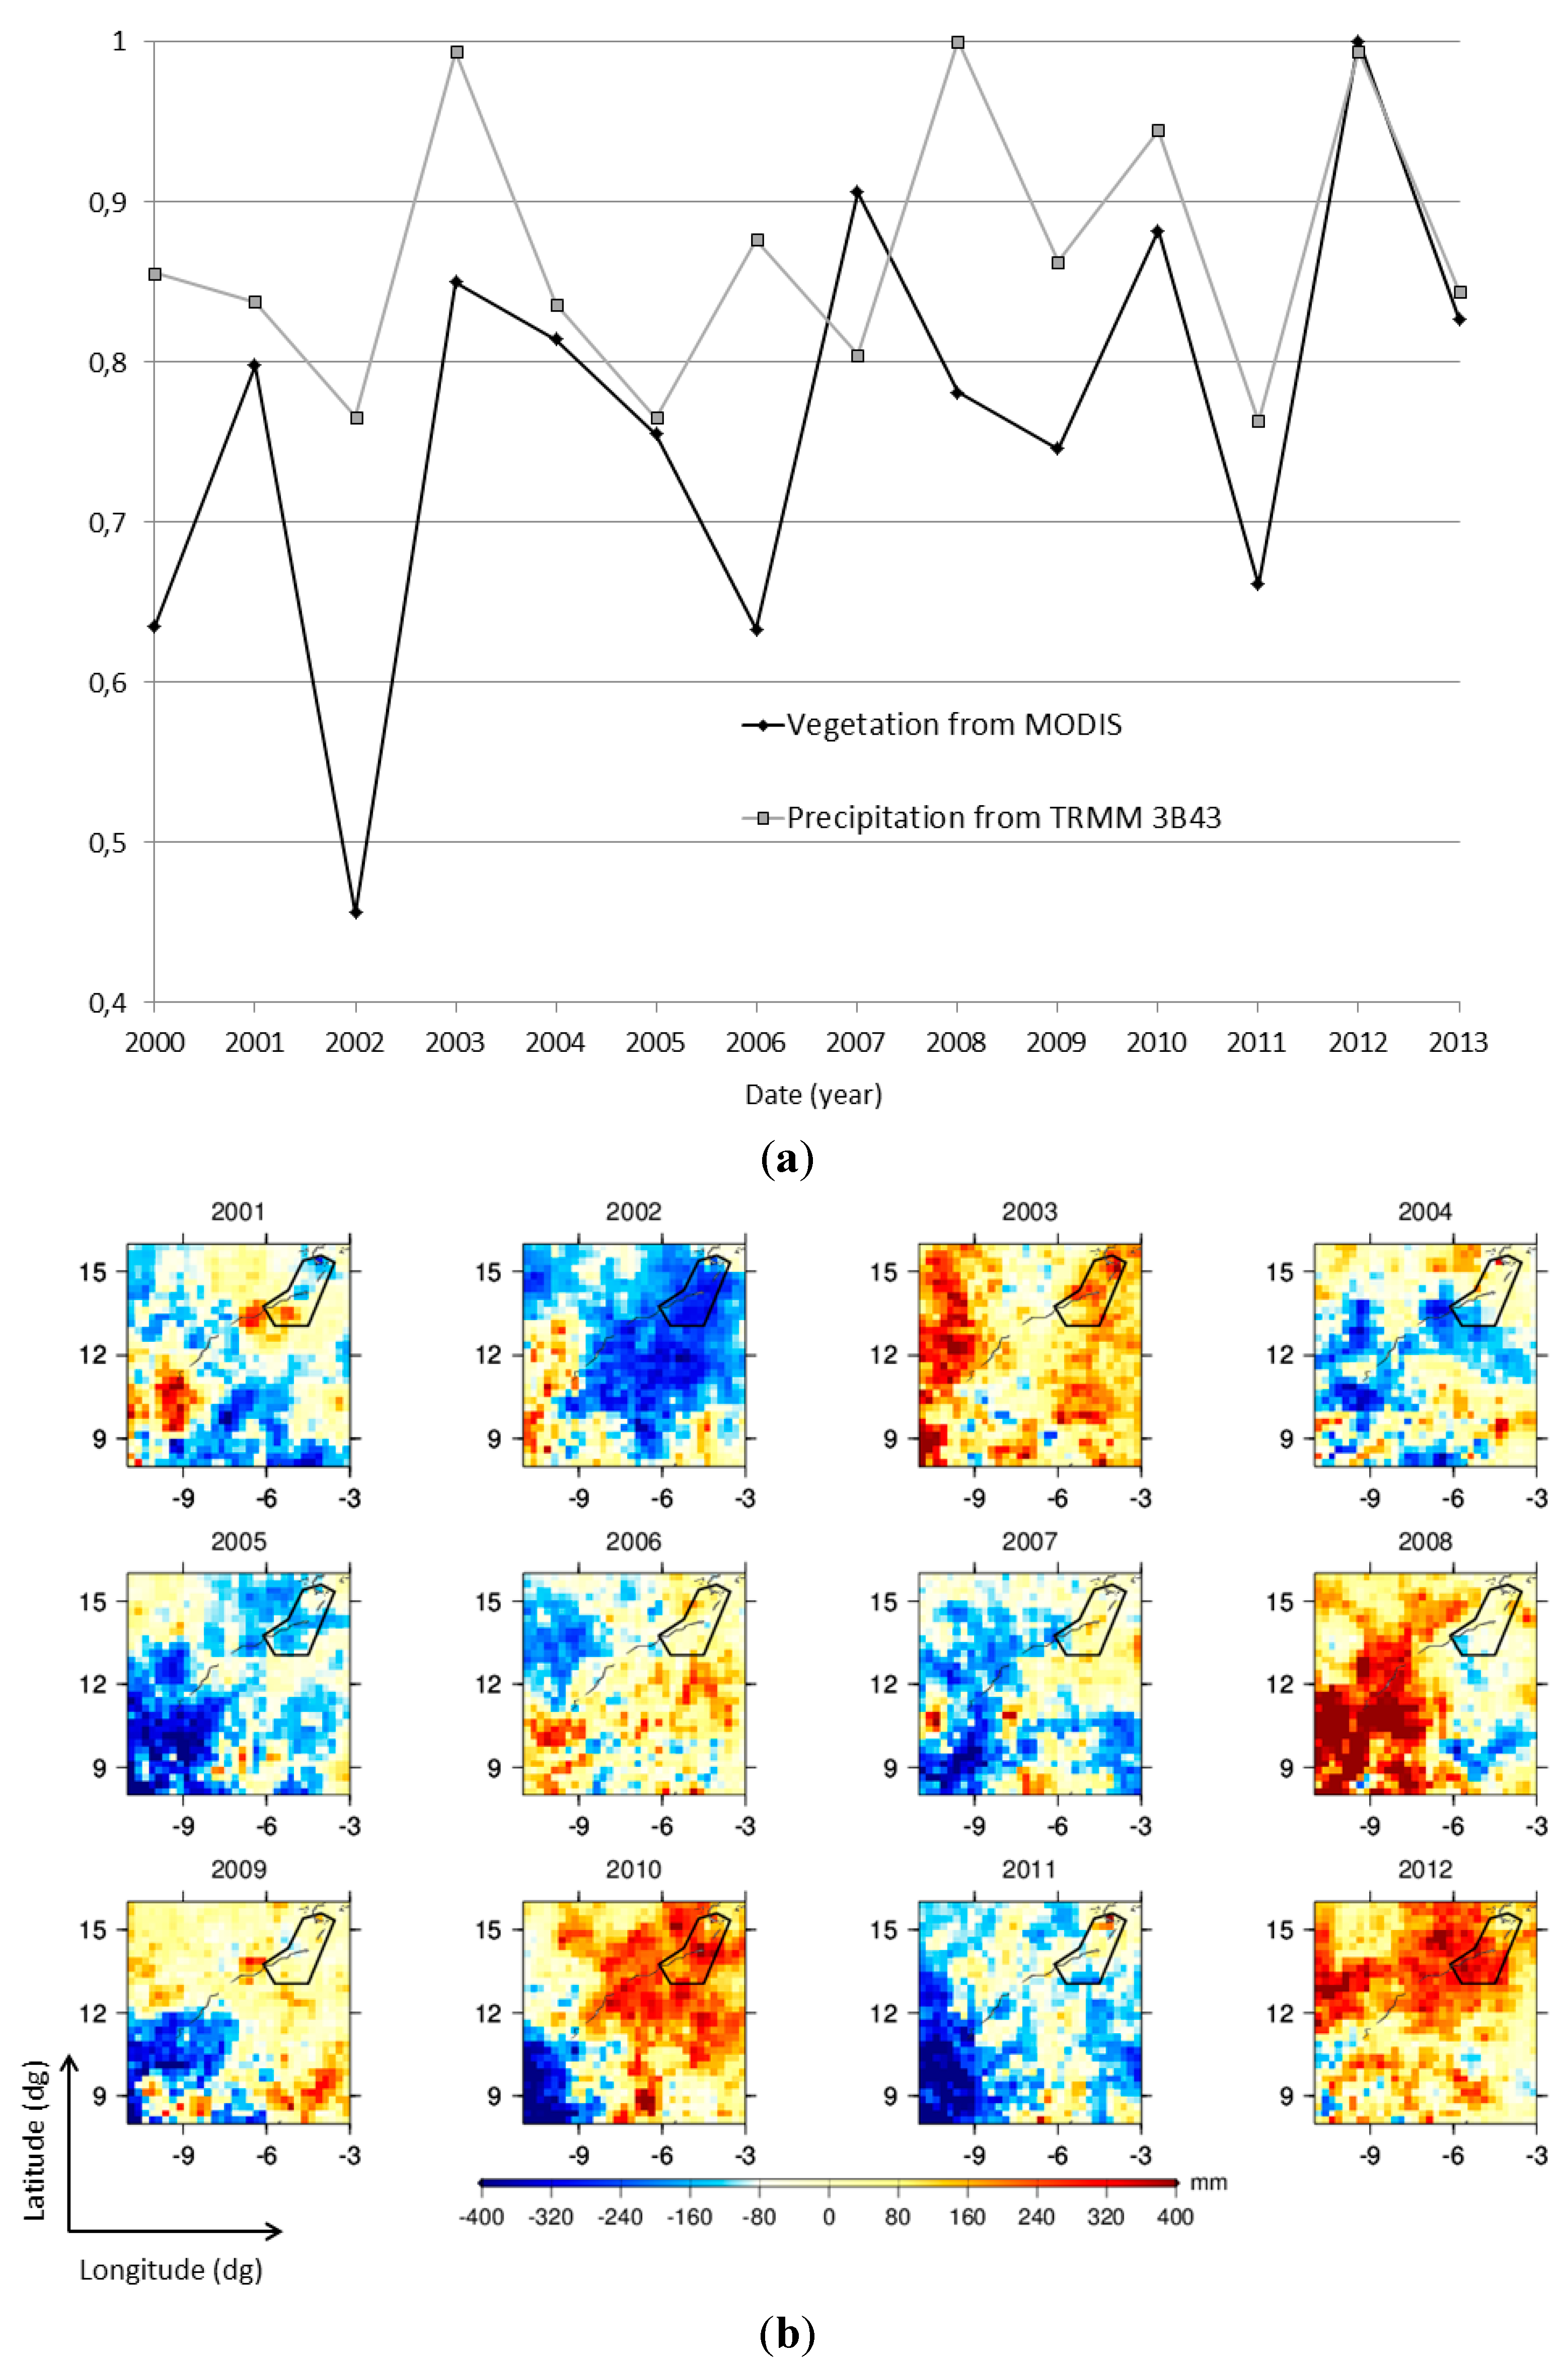
4.2.2. Rainfall Inter-Annual Variability

As seen above, the inundation over the IND has strong inter-annual variability. Precipitation over this region also presents significant inter-annual fluctuations from a dry year with around 800 mm/yr to 1100 mm/yr on average for a wet year. From the precipitation data, four years appear as wet years: 2003, 2008, 2010 and 2012 (Figure 12a). Figure 12b shows for each year, from 2001 to 2012, the variations in space of yearly precipitation anomalies (difference of yearly precipitation to global average) from dry to wet years. First, we can see a high spatial heterogeneity of rainfall anomaly distribution from year to year. The year 2003 is very interesting as it can be seen that precipitation data present positive anomalies, but with high spatial heterogeneity. In contrast, years 2010 and 2012 have a very strong positive anomaly near the IND and the upstream part of the Niger and Bani rivers. The year 2008 presents a dipole of a positive anomaly in the west (where the Niger River is located) and a negative one in the east (where the Bani River is located). The year 2002 is a very dry year for the whole area of study.

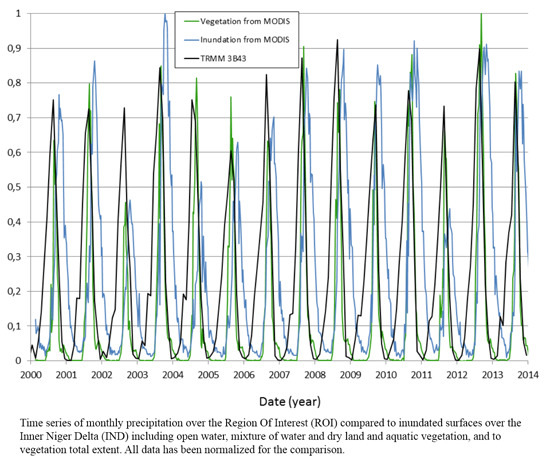
4.3. Links between Rainfall and Floods over the IND

It is already well known that inundations over the IND are linked to precipitation upstream of the delta. If we analyze the annual precipitation anomaly patterns and compare it to flood patterns over the IND, some additional and more detailed conclusions can be drawn.
From MODIS data we also calculated the total surface using the three classes that include water: open water, mixture of water and dry land, and aquatic vegetation. The time series is given in Figure 13 where the total inundated surface calculated every eight days is compared to monthly rainfall. The data was normalized in order to make a comparison. The first conclusion to be drawn from this figure concerns the time shift between maximum rainfall over the Niger and Bani river basins and the maximum flood over the IND. We found one and a half months with a standard deviation of eight days. It tends to confirm that inundations are due to rainfall in the upstream river areas located a few hundred kilometers away from the IND. If we calculate the correlation between annual rainfall and maximum inundation over the IND, we obtain 0.65. No decadal trend was observed from this analysis showing that for inundations (total of the three “water” classes), the inter-annual variability dominates the long-term trend.
In Section 4.1.2 it can be seen that in 2007 the Bani River was possibly the main contributor to the inundation (Figure 9). This is well confirmed by analysis of the precipitation spatio-temporal variability. In Figure 10b, it is clear that positive anomalies of rainfall in 2007 were localized over the Bani River, while the Niger River globally presents a negative anomaly. Therefore, there is an explanation of why an inundation higher than normal was observed in 2007, although this year was not considered as one of the wettest years of the study period. From Figure 13 we also see that 2002, 2004, 2005 and 2011 are the four driest years in terms of inundation. Annual rainfall anomalies (Figure 12a,b) also show that these years were characterized by a large rainfall deficit over the Niger and Bani rivers upstream of the delta.
If the precipitation data is now compared with vegetation cover over the IND, we see an increase in vegetation of 21% over the 14-year study while only a slight 6% total precipitation increase is apparent (Figure 12a). Monthly rainfall is also compared with the eight-day vegetation class from MODIS (Figure 13). It shows that maximum rainfall corresponds exactly to maximum vegetation cover over the IND. But the apparition of vegetation is shifted each year by more than three months after the first rainfall in March and April. This is easily explained by Figure 11 which shows that if rainfall appears earlier in the year over the upstream river basins, it will start only in June or July over the IND.
Figure 13. Time series of monthly precipitation over the Region Of Interest (ROI) compared to inundated surfaces over the Inner Niger Delta (IND) including open water, mixture of water and dry land and aquatic vegetation, and to vegetation total extent. All data has been normalized for the comparison.
Remotesensing 07 02127 g013
To complete the comparison between rainfall and inundation over the IND, we performed an EOF analysis over the different datasets.
Figure 14a–d shows the first mode of spatio-temporal variations for the water, mixture of water and dry land, aquatic vegetation and vegetation. The EOF was applied from 2001 to 2013, excluding year 2000 as the first processed MODIS images date back to February 2000. For each of the four classes, the first mode represents 30%–40% of signal variance. Its temporal variation is well correlated with the time series of surface extent for each of these classes. For example, for open water it is directly recognized from mode 1 that the years 2002, 2004, 2005, 2006 and 2011 are considered as globally dry, as was already observed in Figure 13. In order to recompose the total signal we must add the factor of the spatial and temporal modes of the whole decomposition. Here positive values of temporal mode correspond to dry year as the spatial mode is negative over the entire ROI. It can also be seen that for the three first classes, temporal variations are very similar with only slight differences, which enhances the assumption that rainfall inter-annual variability is the main driver for these classes. For vegetation (Figure 14d), a global increase over the study period is observed (with the main signal in the west outside of the delta), which is also confirmed by direct calculation of annual vegetation cover (Figure 12a). It is noteworthy that spatial mode 1 of open water classes clearly exhibits the presence of the alleged NW belt (Section 4.1 Figure 5a). There is a globally distributed increase in aquatic vegetation over the IND, and that for all classes, the dry year of 2011 is well explained by the first mode of variations.
Figure 14. Moderate Resolution Imaging Spectroradiometer Empirical Orthogonal Functions (EOF) mode 1 for (a) open water; (b) mixture of water and dry land; (c) aquatic vegetation and (d) vegetation over the Region Of Interest (ROI) (black line’s polygon). Units of Empirical Orthogonal Functions time series are normalized.
Remotesensing 07 02127 g014
The same computation was made with the rainfall data. EOFs for the first three modes (explaining approximately 65% of the signal variance) are given in Figure 15a–c. Mode 1 is exclusively representative of rainfall over the upstream part of the Niger River (south west of the watershed: red zone in Figure 15a), while mode 2 exhibits a dipole between the delta area and upstream of the Niger River (Figure 15b). Mode 3 (still explaining 7% of the variance for total rainfall) presents specific spatial patterns with mainly two small regions participating in the signal: the far upstream of the Niger River and the west part of the delta (blue zones in Figure 15c). A large signal on mode 3 is also present in the south (red zones in Figure 15c) but is located outside the watershed of the two rivers.
Mode 1 explains some of the inter-annual inundation variability observed over the IND. We see that the two years of high inundation (2003 and 2008) are quite fully explained by this first mode (Figure 15a). The high peak on mode 2 observed in 2010 with spatial signal closer to the IND (Figure 15b) explains why this was a highly inundated year. In 2012, the conjunction of high precipitation in the entire basin (mode 1 and 2 spatial distribution complete each other for this year) explains the inundation. In 2001, mode 3 seems responsible for the observed excess of open water over the IND. For this year again, it seems that precipitation excess is localized far upstream of the Niger and close to the delta in the west (map of spatial mode 3: Figure 15c). Mode 3 also contributes slightly to the 2008 inundation, in addition to mode 1. The dry years of 2002, 2004, 2005 and 2011 are well explained by mode 1, with a deficit of water over the upstream Niger (Figure 15a). In 2002, the drought is amplified by mode 2, which indicates a general deficit of rainfall (as also seen in Figure 12b). For 2004, amplification comes from the western part of the delta (Figure 15c).
Figure 15. Three first Empirical Orthogonal Functions (EOF) modes (ac) of precipitation over the Region of Interest, calculated with Tropical Rainfall Measuring Mission (TRMM) 3B43 data.
Remotesensing 07 02127 g015
Figure 15a,b also highlights that mode 1 is dominated by inter-annual variability with a slight additional decreasing trend over the study period while mode 2 shows increasing rainfall near the IND. This may explain why inundation over the IND is marked by a trend and why the direct increase in precipitation near the delta may be a cause of vegetation growth in this area. If temporal variability of mode 2 of the rainfall and mode 1 of the vegetation cover are compared over the IND, the correlation is 0.73. Strong vegetation growth was also observed near the western delta (Figure 14d), which is also in good agreement with observations by [7]. It could be a combination of modes 2 and 3, which exhibit rainfall anomalies over this region.
Figure 16 shows the third mode of the open water class over the IND representing 11% of signal variance, and we can observe a dipole between the part of the delta fed by the Niger River and the part of the delta fed by the Bani River. This indicates a slight decrease of several days per year in inundation in the west part of the IND and an increase in the eastern part. The decrease in precipitation over the Niger River observed by mode 1 of rainfall (Figure 15a without any signal over the Bani River) and combined with an increase in precipitation over the Bani (which can be observed from mode 2 of rainfall (Figure 15b)) may explain this dichotomy between western and eastern parts of the delta. The spatial repartition of the signal from mode 2 also includes a part of the Niger River but in the region near the delta. This region has lower rainfall than over the upstream area and therefore does not compensate the general decrease, as observed by mode 1 in the upstream part of Niger River.
Figure 16. Empirical Orthogonal Functions (EOF) modes of Moderate Resolution Imaging Spectroradiometer open water class over the Region Of Interest (ROI).
Remotesensing 07 02127 g016
The EOF analysis therefore allows a more detailed description of the geographical patterns of inundations over the delta and the dichotomy of both rivers contributing to the delta.

5. Conclusions

In this study, we applied a methodology based on MODIS imagery analysis to detect water and vegetation over the Inner Niger Delta floodplains. Understanding inundation sequences and processes for regions such as the Inner Niger Delta are crucial for economic purposes as land use is affected. Precise yearly flood monitoring is crucial for pastoral agriculture, particularly in the frame of inter-annual climate fluctuations.
We have shown that MODIS images are suitable to achieve global coverage and continuous monitoring of floodplain inundations like that of the Inner Niger Delta and it has allowed us to describe the phenomenon of inundations in the delta in terms of water and vegetation extents. We have demonstrated that inter-annual variability of flood patterns dominates the IND. Another interesting result of this study, deduced from Empirical Orthogonal Functions analysis of MODIS and TRMM 3B43 data, is the characterization of the respective roles of the Niger and Bani rivers in the flooding process over the IND. We have determined the link between spatial patterns of water (including open water, mixture of water and dry land, and aquatic vegetation) and vegetation with rainfall on the upstream part of the two rivers and over the IND. We observed a factor of four on the total open water extent between dry and wet years and estimated the time residency of different types of surface over the Inner Niger Delta presenting high inter-annual anomalies. Moreover, a general increase in vegetation over the study period (2000–2013) and a slight decrease of open water has been revealed. For inundated areas the inter-annual variability is predominant.
In addition to in situ observations and hydrological modeling (global/regional climate and hydrodynamical models), space observations may significantly help improve our understanding of hydrological processes in floodplains and their interaction with climate variability. Assimilation of remote sensing data in a model of an ungauged basin is a recurrent issue, especially in a complex geographical system like the Inner Niger Delta, which is a mix of small rivers, channels, swamps and lakes [44].

Acknowledgments

The authors wish to thank the Centre National d’Etudes Spatiales (CNES) for financing our work through the TOSCA project. The MODIS data was downloaded from the National Aeronautics and Space Administration (NASA) and is courtesy of the online Earth data web site named: Earth Observing System Data and Information System EOSDIS, URL: https://earthdata.nasa.gov/. The TRMM dataset was downloaded from the http://mirador.gsfc.nasa.gov/collections/TRMM_3B43__006.shtml web site of Goddard Space Flight Center, USA.

Author Contributions

Muriel Bergé-Nguyen was responsible of the development of the software allowing processing and interpreting the different data sets. She has prepared all figures in the manuscript, and is in charge of data processing of TRMM and MODIS datasets. Jean-François Crétaux had the original idea for the study, led the data analysis in coordination with Muriel Bergé-Nguyen, and drafted the manuscript. All authors read and approved the final manuscript.

Conflicts of Interest

The authors declare no conflict of interest.

References

  1. Alsdorf, D.E.; Rodriguez, E.; Lettenmaier, D.P. Measuring surface water from Space. Rev. Geophys. 2007, 45. [Google Scholar] [CrossRef]
  2. Zwarts, L.; Cisse, N.; Diallo, N. Hydrology of the upper Niger. In The Niger, a Lifeline. Effective Water Management in the Upper Niger Basin; Zwarts, L., Van Beukering, P., Kone, B., Wymenga, E., Eds.; Inst. for Inland Water Management and Waste Water Treatment: Lelystad, The Netherlands, 2005; pp. 15–41. [Google Scholar]
  3. Mahe, G.; Bamba, F.; Soumaguel, A.; Orange, D.; Olivry, J.-C. Water losses in the inner delta of the River Niger: Water balance and flooded area. Hydrol. Process. 2009, 23, 3157–3160. [Google Scholar] [CrossRef]
  4. Li, K.Y.; Coe, M.T.; Ramankutty, N. Investigation of hydrological variability in West Africa using land surface models. J. Clim. 2005, 18, 3173–3188. [Google Scholar] [CrossRef]
  5. Liersch, S.; Cools, J.; Kone, B.; Koch, H.; Diallo, M.; Reinhardt, J.; Fournet, S.; Aich, V.; Hattermann, F.F. Vulnerability of rice production in the Inner Niger Delta to water resources management under climate variability and change. Environ. Sci. Policy 2013, 34, 18–33. [Google Scholar] [CrossRef]
  6. Ruelland, D.; Collet, L.; Ardoin-Bardin, S.; Roucou, P. How could hydro-climatic conditions evolve in the long term in West Africa? The case study of the Bani River Catchment. Hydro-climatology: Variability and change. In Proceedings of the Symposium J-H02 Held during IUGG2011, Melbourne, Australia, 28 June–7 July 2011; pp. 195–201.
  7. Taylor, C.M. Feedbacks on precipitation from an African wetland. Geophys. Res. Lett. 2010, 37. [Google Scholar] [CrossRef]
  8. Dadson, S.J.; Ashpole, I.; Harris, P.; Davies, H.N.; Clark, D.B.; Blyth, E.; Taylor, C.M. Wetland inundation dynamics in a model of land surface climate: Evaluation in the Niger inland delta region. J. Geophys. Res. 2010. [Google Scholar] [CrossRef]
  9. Coe, M.T. Simulating continental surface waters: An application to Holocene northern Africa. J. Clim. 1997, 10, 1680–1689. [Google Scholar] [CrossRef]
  10. Justice, C.O.; Townshend, J.R.G.; Vermote, E.F.; Masuoka, E.; Wolfe, R.E.; Saleous, N.; Roy, D.P.; Morisette, J.T. An overview of MODIS Land data processing and product status. Remote Sens. Environ. 2002, 83, 3–15. [Google Scholar] [CrossRef]
  11. Crétaux, J.-F.; Bergé-Nguyen, M.; Leblanc, M.; Abarca-Del-Rio, R.; Delclaux, F.; Mognard, N.; Lion, C.; Pandey, R.K.; Tweed, S.; Calmant, S.; et al. Flood mapping inferred from remote sensing data. Int. Water Technol. J. 2011, 1, 48–62. [Google Scholar]
  12. Cretaux, J.-F.; Letolle, R.; Calmant, S. Investigations on Aral Sea regressions from Mirabilite deposits and remote sensing. Aquat. Geochem. 2009, 15, 277–291. [Google Scholar] [CrossRef]
  13. Abarca-del-Rio, R.; Cretaux, J.-F.; Berge-Nguyen, M.; Maisongrande, P. Does the Titicaca Lake still control the Poopo lake water levels? An investigation using satellite altimetry, and MODIS data (2000–2009). Remote Sens. Lett. 2012, 3, 707–714. [Google Scholar] [CrossRef]
  14. Arsen, A.; Crétaux, J.-F.; Berge-Nguyen, M.; Abarca-Del-Rio, R. Remote sensing derived bathymetry of Lake Poopó. Remote Sens. 2014, 6, 407–420. [Google Scholar] [CrossRef]
  15. Pedinotti, V.; Boone, A.; Decharme, B.; Cretaux, J.-F.; Mognard, N.; Panthou, G.; Papa, F.; Tanimoun, B.A. Evaluation of the ISBA-TRIP continental hydrologic system over the Niger Basin using in situ and satellite derived datasets. Hydrol. Earth Syst. Sci. 2012, 16, 1745–1773. [Google Scholar] [CrossRef] [Green Version]
  16. Aires, F.; Papa, F.; Prigent, C.; Crétaux, J.-F.; Bergé-Nguyen, M. Characterization and space/time downscaling 1 of the inundation extent over the Inner Niger Delta using GIEMS and MODIS data in preparation to the SWOT mission. J. Hydrometeorol. 2014, 15, 171–192. [Google Scholar] [CrossRef]
  17. Pandey, R.K.; Cretaux, J.-F.; Berge-Nguyen, M.; Tiwari, V.M.; Drolon, V.; Calmant, S. Water level estimation by remote sensing for 2008 flood of Kosi. Int. J. Remote Sens. 2014, 35, 424–440. [Google Scholar] [CrossRef]
  18. Yésou, H.; Huber, C.; Lai, X.; Averty, S.; Li, J.; Daillet, S.; Bergé-Nguyen, M.; Chen, X.; Huang, S.; James, B.; et al. Nine years of water resources monitoring over the middle reaches of the Yangtze River, with ENVISAT, MODIS, Beijing-1 time series, altimetric data and field measurements. Lakes Reserv. Res. Manag. 2011, 16, 231–247. [Google Scholar] [CrossRef]
  19. Li, S.; Sun, D.; Goldberg, M.; Stefanidis, A. Derivation of 30-m resolution water maps from TERRA/MODIS and SRTM. Remote Sens. Environ. 2013, 134, 417–430. [Google Scholar] [CrossRef]
  20. Brakenridge, G.R.; Anderson, E. MODIS-based flood detection, mapping and measurement: The potential for operational hydrological applications. Earth Environ. Sci. 2006, 72, 1–12. [Google Scholar]
  21. Sun, D.L.; Yu, Y.Y.; Goldberg, M.D. Deriving water fraction and flood maps from MODIS images using a decision tree approach. IEEE J. Selected Topics Appl. Earth Obs. Remote Sens. 2011, 4, 814–825. [Google Scholar] [CrossRef]
  22. Sun, D.L.; Yu, Y.Y.; Zhang, R.; Li, S.; Goldberg, M.D. Towards operational automatic flood detection using EOS/MODIS data. Photogramm. Eng. Remote Sens. 2012, 78, 637–646. [Google Scholar] [CrossRef]
  23. Sakamoto, T.; Nguyen, N.V.; Kotera, A.; Ohno, H.; Ishitsuka, N.; Yokozawa, M. Detecting temporal changes in the extent of annual flooding within the Cambodia and the Vietnamese Mekong Delta from MODIS time series imagery. Remote Sens. Environ. 2007, 109, 295–313. [Google Scholar] [CrossRef]
  24. Smith, L.C. Satellite remote sensing of river inundation area, stage, and discharge, a review. Hydrol. Process. 1997, 11, 1427–1439. [Google Scholar] [CrossRef]
  25. Henry, J.-B.; Chastanet, P.; Fellah, K.; Desnos, Y.-L. Envisat multi-polarised ASAR data for flood mapping. Int. J. Remote Sens. 2006, 27, 1921–1929. [Google Scholar] [CrossRef]
  26. Frappart, F.; Do Minh, K.; L’Hermitte, J.; Ramilllien, G.; Cazenave, A.; le Toan, T.; Mognard-Campbell, N. Water volume change in the lower Mekong Basin from satellite altimetry and imagery data. Geophys. J. Int. 2006, 167, 570–584. [Google Scholar] [CrossRef]
  27. Töyrä, J.; Pietroniro, A.; Martz, L.W. Multisensor hydrologic assessment of a freshwater wetland. Remote Sens. Environ. 2001, 75, 162–173. [Google Scholar] [CrossRef]
  28. Töyrä, J.; Pietroniro, A. Towards operational monitoring of a northern wetland using geomatics-based techniques. Remote Sens. Environ. 2005, 97, 174–191. [Google Scholar] [CrossRef]
  29. Matgen, P.; Schumann, G.; Henry, J-B.; Hoffman, L.; Pfister, L. Integration of SAR-derived river inundation areas, high-precision topographic data and a river flow model toward near real-time flood management. Int. J. Appl. Earth Obs. Geoinf. 2007, 9, 247–263. [Google Scholar] [CrossRef]
  30. Martinez, J.-M.; le Toan, T. Mapping of flood dynamics and spatial distribution of vegetation in the amazon floodplain using multitemporal SAR data. Remote Sens. Environ. 2007, 108, 209–223. [Google Scholar] [CrossRef]
  31. Bartsch, A.; Pathe, C.; Scipal, K.; Wagner, W. Detection of permanent open water surfaces in central Siberia with Envisat ASAR wide swath data with special emphasis on the estimation of methane fluxes from tundra wetlands. Hydrol. Res. 2008, 39, 89–100. [Google Scholar] [CrossRef]
  32. Engman, E.T.; Gurney, R.J. Remote Sensing in Hydrology; Chapman and Hall: London, UK, 1991; p. 225. [Google Scholar]
  33. Bukata, R.P. Satellite Monitoring of Inland and Coastal Water Quality: Retrospection, Introspection, Future Directions; Taylor and Francis: New York, NY, USA, 2005; p. 246. [Google Scholar]
  34. Li, R.-R.; Kaufman, Y.J.; Gao, B.-C.; Davis, C.O. Remote sensing of suspended sediments and shallow coastal waters. IEEE Trans. Geosci. Remote Sens. 2003, 41, 559–566. [Google Scholar] [CrossRef]
  35. Lyon, J.G.; Yuan, D.; Lunetta, R.S.; Elvidge, C.D. A change detection experiment using vegetation indices. Photogramm. Eng. Remote Sens. 1998, 64, 143–150. [Google Scholar]
  36. Lunetta, R.S.; Knight, J.F.; Ediriwickrema, J.; Lyon, J.G.; Worthy, L.D. Land-cover change detection using multi-temporal MODIS NDVI data. Remote Sens. Environ. 2006, 105, 142–154. [Google Scholar] [CrossRef]
  37. Mohamed, Y.A.; Bastiaanssen, W.G.M.; Savenije, H.H.G. Spatial variability of evaporation and moisture storage in the swamps of the upper Nile studied by remote sensing techniques. J. Hydrol. 2004, 289, 145–164. [Google Scholar] [CrossRef]
  38. Aladin, N.V.; Crétaux, J.-F.; Plotnikov, I.S.; Kouraev, A.V.; Smurov, A.O.; Cazenave, A.; Egorov, A.N.; Papa, F. Modern hydro-biological state of the Small Aral Sea. Environmetric 2005, 16, 375–392. [Google Scholar] [CrossRef]
  39. Crétaux, J.-F.; Kouraev, A.V.; Papa, F.; Bergé Nguyen, M.; Cazenave, A.; Aladin, N.V.; Plotnikov, I.S. Water balance of the Big Aral sea from satellite remote sensing and in situ observations. J. Great Lakes Res. 2005, 31, 520–534. [Google Scholar] [CrossRef]
  40. Seiler, R.; Csaplovis, E.; Vollmer, E. Monitoring land cover changes of the Niger inland delta ecosystem (Mali) by means of envisat-Meris data. In African Biodivers; Springer US: New York, NY, USA, 2005; pp. 395–404. [Google Scholar]
  41. Preisendorfer, R.W. Principal Component Analysis in Meteorology and Oceanography; Elsevier Science: New York, NY, USA, 1988; p. 425. [Google Scholar]
  42. Von Storch, A.; Zwiers, W. Empirical orthogonal function. In Statistical Analysis in Climate Research, 3nd ed.; Cambridge University Press: Cambridge, UK, 2003; pp. 293–312. [Google Scholar]
  43. Toumazou, V.; Crétaux, J.-F. Using a Lanczos eigen solver in the computation of Empirical Orthogonal Functions. Mon. Weather Rev. 2001, 129, 1243–1250. [Google Scholar] [CrossRef]
  44. Bates, P.D.; Horritt, M.S.; Smith, C.N.; Mason, D. Integrating remote sensing observations of flood hydrology and hydraulic modelling. Hydrol. Process. 1997, 11, 1777–1795. [Google Scholar] [CrossRef]

