Assessing Consistency of Five Global Land Cover Data Sets in China

Abstract
: Global land cover mapping with high accuracy is essential to downstream researches. Five global land cover data sets derived from moderate-resolution satellites, i.e., Global Land Cover Characterization (GLCC), University of Maryland land cover product (UMd), Global Land Cover 2000 project data (GLC2000), MODIS Land Cover product (MODIS LC), and GLOBCOVER land cover product (GlobCover), have been widely used in many researches. However, these data sets were produced using different data sources and class definitions, which led to high uncertainty and inconsistency when using them. This study looked into the consistencies and discrepancies among the five data sets in China. All of the compared data sets were aggregated to consistent spatial resolution and extent, along with a 12-class thematic classification schema; intercomparisons among five datasets and each with reference data GLCD-2005 were performed. Results show reasonable agreement across the five data sets over China in terms of the dominating land cover types like Grassland and Cropland; while discrepancies of Forest classes, particularly Shrubland and Wetland among them are great. Additionally, GLC2000 has the highest agreement with GLCD-2005; MODIS LC gets the highest map-specific consistency compared with others; whereas UMd has the lowest agreement with GLCD-2005, but also has the lowest map-specific consistency.
1. Introduction
Land cover, the observed (bio)physical cover on the earth’s surface [1], is important ecosystem-based information. It is essential for scientific studies, sustainable management of land resources, and political purposes [2]. Issues such as biogeochemical and climate cycling, terrestrial modeling including Land Surface Model (LSM) [3], Simple Biosphere Model Version 2.0 (SiB2) [4,5], Common Land Model (CLM) [6] and CoLM [7], environmental studies such as soil erosion [8], desertification and biological diversity [9], all benefit from the availability of land cover information [10,11]. Therefore, it is very necessary to produce accurate land cover datasets at global and regional scales.
One of the major data sources for producing land cover datasets is satellite data, which provides a synoptic view of earth surface at various spatial scales and regular time intervals [12], and facilitates mapping and monitoring areas where are difficult or unable to access as well. In the past decades, land cover maps at different scales have been generated from satellite data [13–24], of which five available global land cover data sets have been widely used in a variety of applications: (i) Global Land Cover Characterization Database (GLCC) [19,25], (ii) University of Maryland land cover product (UMd) [17], (iii) Global Land Cover 2000 project data (GLC2000) [26], (iv) Moderate Resolution Imaging Spectro-radiometer annual Land Cover product (MODIS LC) [15], and (v) GLOBCOVER land cover product (GlobCover) [13]. All of these data sets have been produced from moderate-resolution satellites, and thematically focused on characterizing the various vegetation types worldwide [27].
Despite the multiplicities of available information for the five land cover data sets, both data producers and potential users are troubled with the lack of interoperability among them and the deficiency of sufficient information on accuracy evaluation [28,29]. Firstly, users have little guidance on which dataset to use and why, since each of them was produced using different data inputs and algorithms, which led to the fact that they were not designed to be comparable and basically exist as independent data sets. Secondly, the nature of the differences, the spatial agreements/disagreements and the relative qualities of data sets are rewarding to both data producers and end users. From the producer’s perspective, areas of spatial agreement can be used effectively as one of the ancillary data sets during training areas’ selection; whereas areas of disagreement could identify the limits deserving for further improvement in future land cover characterization and mapping. On the other hand, in-depth understanding of similarities and differences will help users make informed decisions regarding the selection of land cover data needed for their specific applications [30]. Areas of agreement could be utilized conveniently by users as accurate and reliable information, while areas of disagreement might inspire users to verify the information in these areas by consulting additional information. In these regards, it is desirable to perform a comparison between the five global land cover data sets, and to highlight their individual strengths and weaknesses before using them for a variety of studies at regional to global scales.
In general, the quality of a satellite-derived land cover data can be identified with reference to an absolute scale that can be measured independently of the land cover map using in situ data, or to a relative scale that can be assessed using another land cover reference map, or both combined [31]. Various assessments of the global land cover data sets were carried out in early studies [27,29,30,32–41]. However, the assessments were not evenly distributed among the global, and China has not been given enough attention regarding accuracy assessment of land cover dataset. China has a large territory, the largest population, and long history of human activities. Its land cover is featured with high diversity and high degree of fragmentation, making it very challenge to produce an accurate land cover map; existing global land cover data sets are likely to have high uncertainties over China. In order to better understand the degree and distribution of the uncertainties of the five global land cover data sets (i.e., GLCC, UMd, GLC2000, MODIS LC, and GlobCover) over China, this study will have a closer look on their consistencies and discrepancies, involving thematic similarities, spatial agreements and general patterns of map-specific consistency, and try to give users an insight into different land cover data sets when making wiser choices for their applications.
2. Data Sources
2.1. Global Land Cover Data Sets
In this study, three US and two European global land cover data sets were chosen for consistency assessments over China:
- (1)
GLCC with the International Geosphere-Biosphere Programme (IGBP) Land Cover Legend produced by the United States Geological Survey (USGS) [19];
- (2)
UMd with the Simplified IGBP Land Cover Classification System developed by the University of Maryland [17];
- (3)
GLC2000 with the Land Cover Classification System (LCCS) of Food and Agricultural Organizations (FAO) generated by European Commission’s Joint Research Center (EC-JRC) [26];
- (4)
MODIS LC (Collection 5) with the IGBP land cover classification scheme produced by Boston University [42], and
- (5)
GlobCover with the FAO LCCS created by European Space Agency (ESA) [43].
Selection of the five global land cover data sets takes into account several considerations: GLCC and UMd were the first generated 1 km global land cover maps; MODIS LC was standard MODIS land products; GLC2000 was the first global maps produced by the collaboration of regional experts, and GlobCover had a finer spatial resolution at the global scale. The characteristics of these data sets are summarized in Table 1, which indicates the major differences between them are related to: (i) sensor capabilities (i.e., spatial and spectral properties and resolution), (ii) raw data processing (e.g., algorithms for cloud detection, corrections for atmospheric distortions), (iii) acquisition year of data set, (iv) selection of input data for classification, (v) land cover legend, (vi) classification algorithms, and (vii) validation of the product.
2.2. Reference Data
The Geodata Land Cover Dataset for year 2005 (GLCD-2005) at a scale of 1–250,000, funded by Ministry of Science and Technology (MOST) of China and developed by the Chinese Academy of Sciences (CAS), is the first dataset that presents the general land cover landscape of China after 2000 with high accuracy. In this study, GLCD-2005 was used as reference data for comparison with the five global data sets in China. A hierarchical land cover classification system of remote sensing considering terrestrial ecosystem characteristic was applied to the database covering 25 land cover classes, grouped into six aggregated classes (i.e., forest, grassland, cropland, built-up, wetland/water, and bare ground).
In order to combine the accuracy of interpretation and speediness of self-classification, the GLCD was mapped mainly by supervised decision tree combined with visual interpretation based on expert knowledge, under the control of polygon’s position and borderline provided by the National Land Use Data at a scale of 1:100,000 in China [18], with the data source of MODIS vegetation index products at 250 m resolution, including 16-day MODIS Normalized Difference Vegetation Index (NDVI) and Enhanced Vegetation Index (EVI) available at Land Process Distributed Active Archive Center (LP DAAC) [44]. Also, a series of ancillary data, such as Grass and Soil thematic maps of China, and Digital Elevation Model (DEM) were used to support the classification procedure. Accuracy assessment of GLCD-2005 was implemented using field survey datasets in 2005, and the result revealed that overall accuracy of this dataset was ranging from 80% to 91% [44–46].
2.3. Data Pre-Processing
Five compared global land cover data sets were distributed in different geographic reference systems, spatial resolutions, and coverage (Table 2). To facilitate comparison, these data sets were co-registered and reprojected to the Sinusoidal projection [47] with map datum WGS_84, which is a pseudocylindrical equal-area map projection and has been widely used in the MODIS products; and then were rescaled to 1 km spatial resolution with the same coverage extent (180°W–180°E, 55°S–90°N). Because Antarctica is excluded by several global land cover data sets (e.g., GLC2000), it is not included in data processing.
As the data sets have coarser resolutions, directly resampling using nearest neighbor method may cause non-ignorable disagreement between the original and the rescaled data sets. Maximum area method has been proved to be a much robust approach for aggregating discrete land cover data [48,49]. In order to minimize the impact from rescaling, the five global land cover data sets were resampled to a grid with 250 m resolution, which is much finer than the source data, and the 250 m grid was aggregated to a 1 km resolution grid using maximum area method to pick the dominated land cover type for each 1 km × 1 km pixel. Both the 250 m and the 1 km resolution grids were designed to be in Sinusoidal projection and share the same extent to minimize some influential issues during the aggregation processes. Reference data GLCD-2005 was also aggregated to the 1 km grid using maximum area method to facilitate comparisons.
3. Methods
3.1. Classification Scheme Conversion
All of the global data sets and GLCD-2005 were dedicated to providing a spatial distribution of diverse land cover types over the Earth’s surface. However, differences in their land cover legends are conspicuous (Table 3). Therefore, reconciling the map legends is the second crucial precondition for facilitating comparisons of different land cover data sets. In this study, we defined the target legend with 12 major classes upon several parameters of classification standard for Plant Functional Types (PFTs) [50–52], i.e., the occurrence of life forms and leaf attributes (leaf type/leaf longevity), which are two of the common classifiers defined by LCCS [37]. A legend conversion table for the original legends of compared land cover data sets and the target legend is given in Table 4. Recognizing that translating numerous land cover types into a small number may lead to a misrepresentation of source dataset on account of the transferability of classes from one to another [35], this arbitrary trade-off seemed to preserve the nature of the land cover landscape of China.
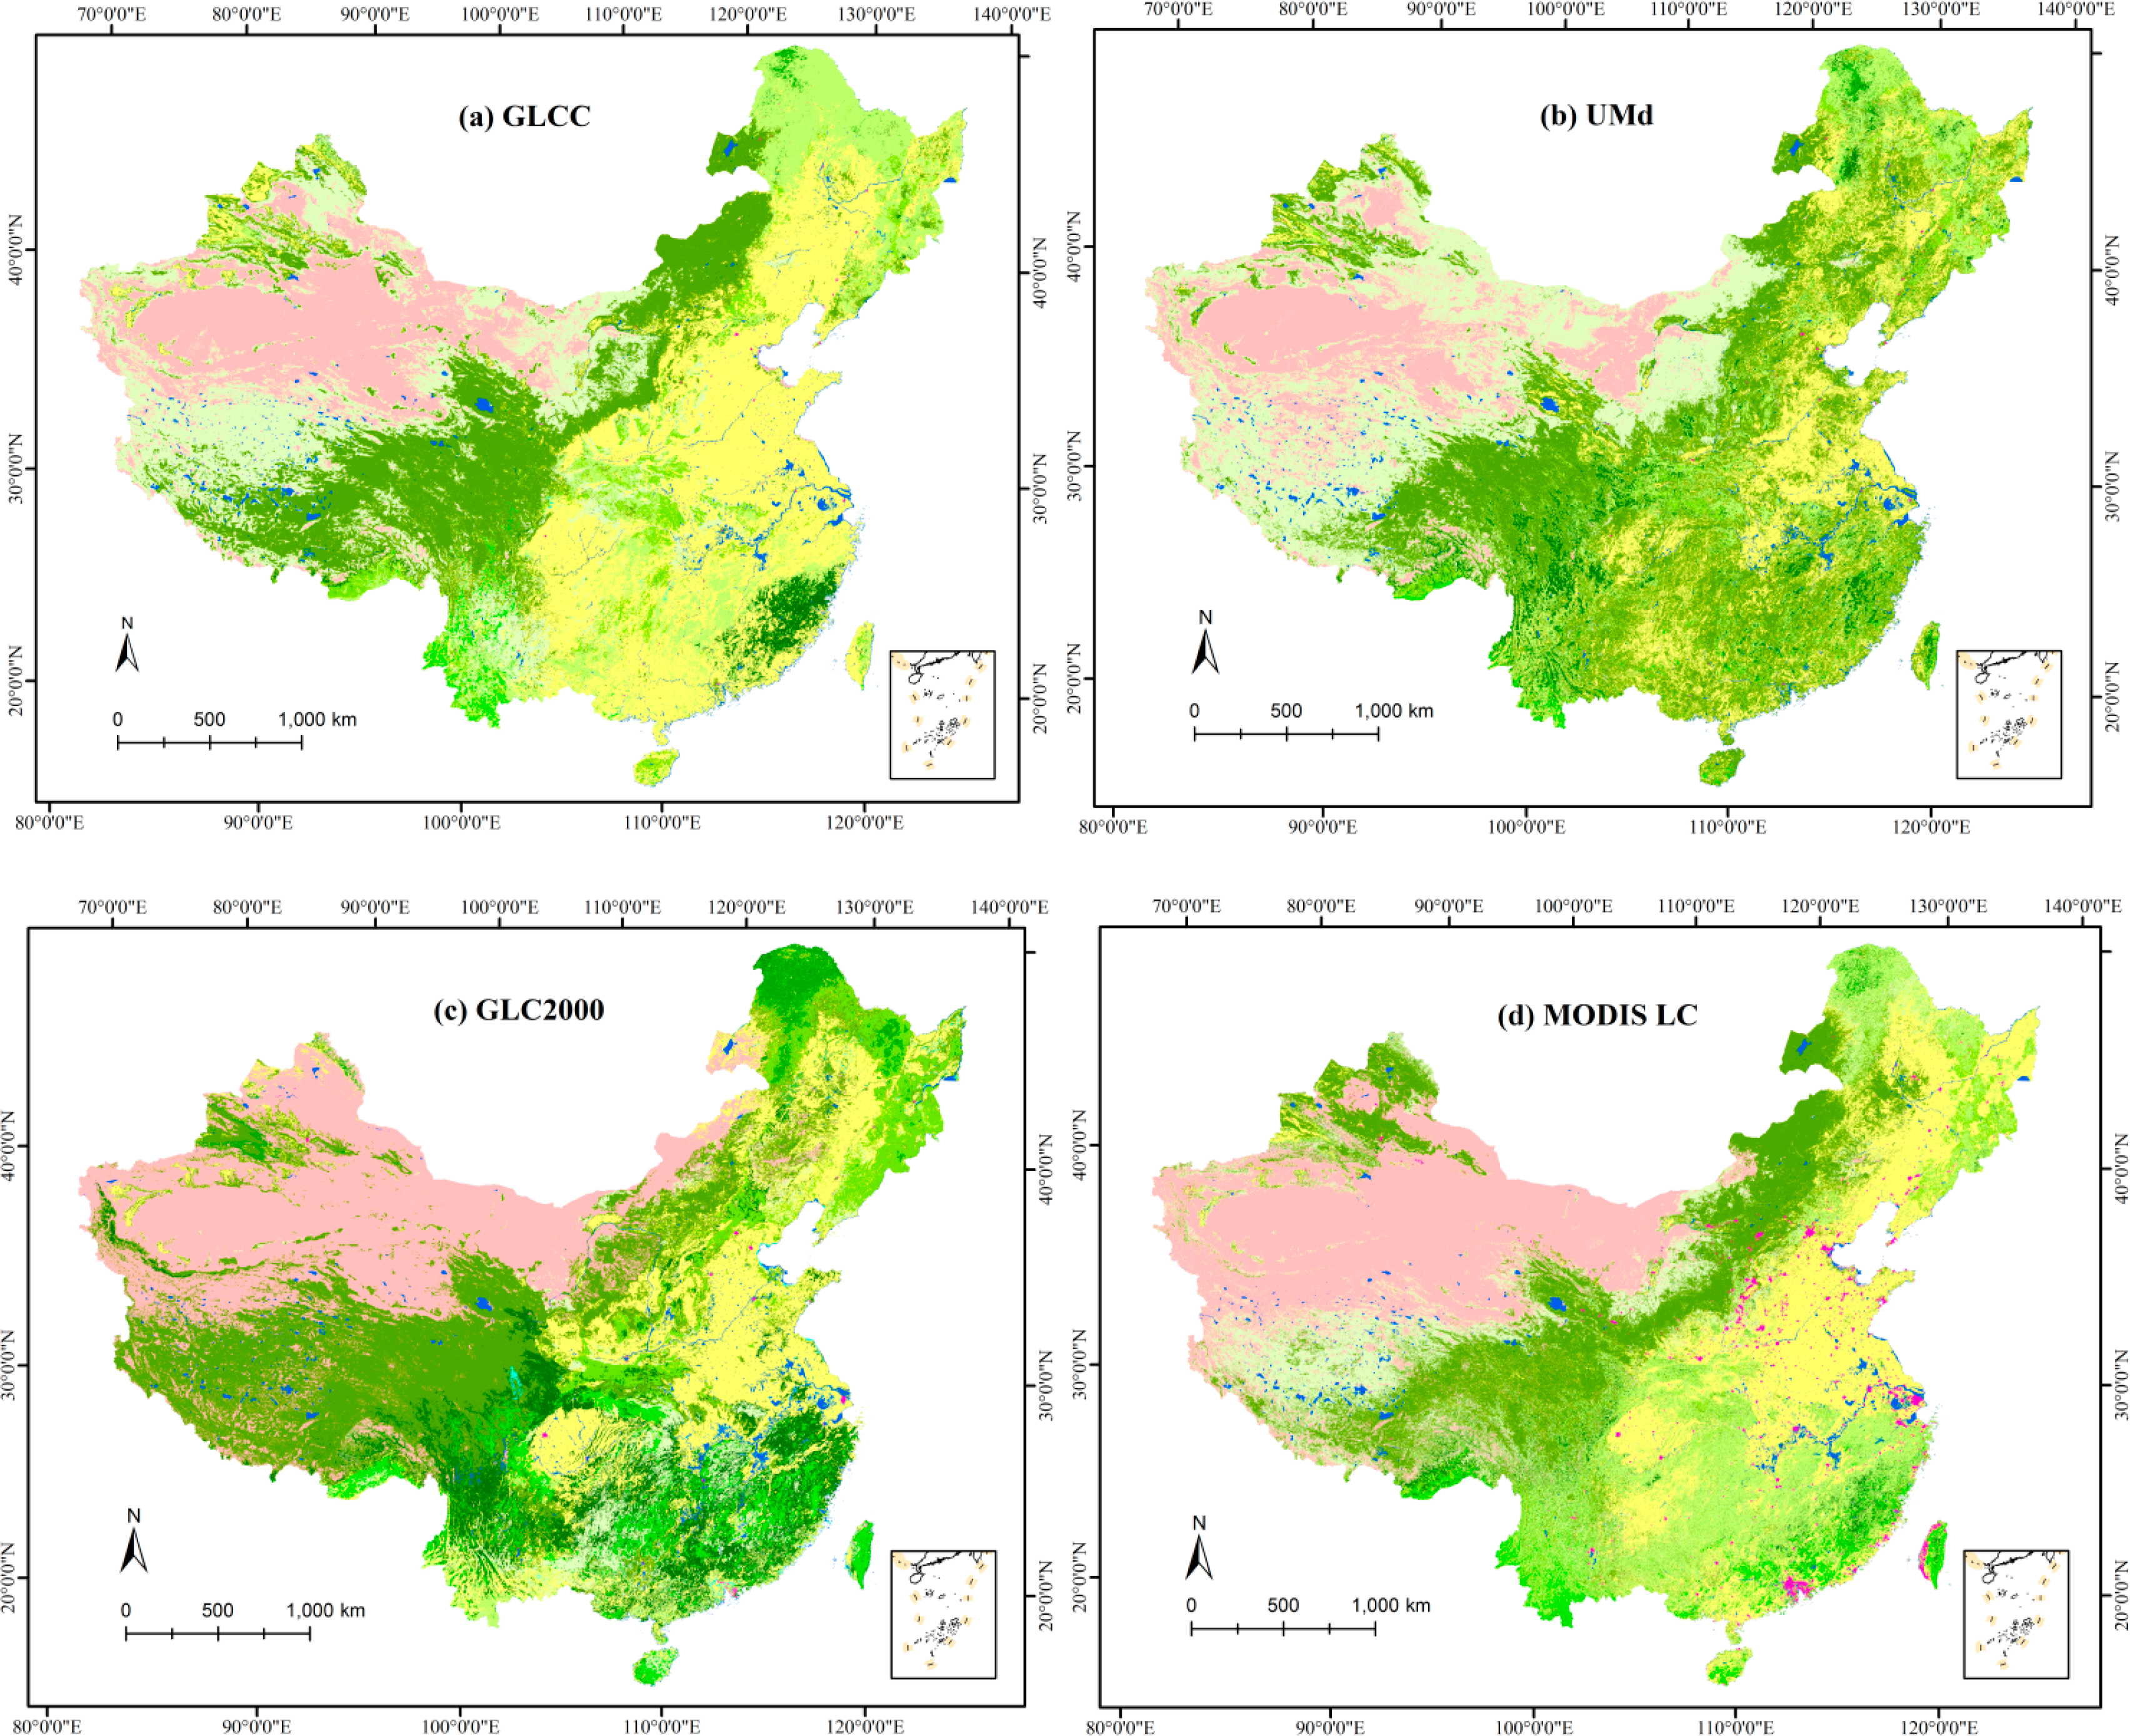
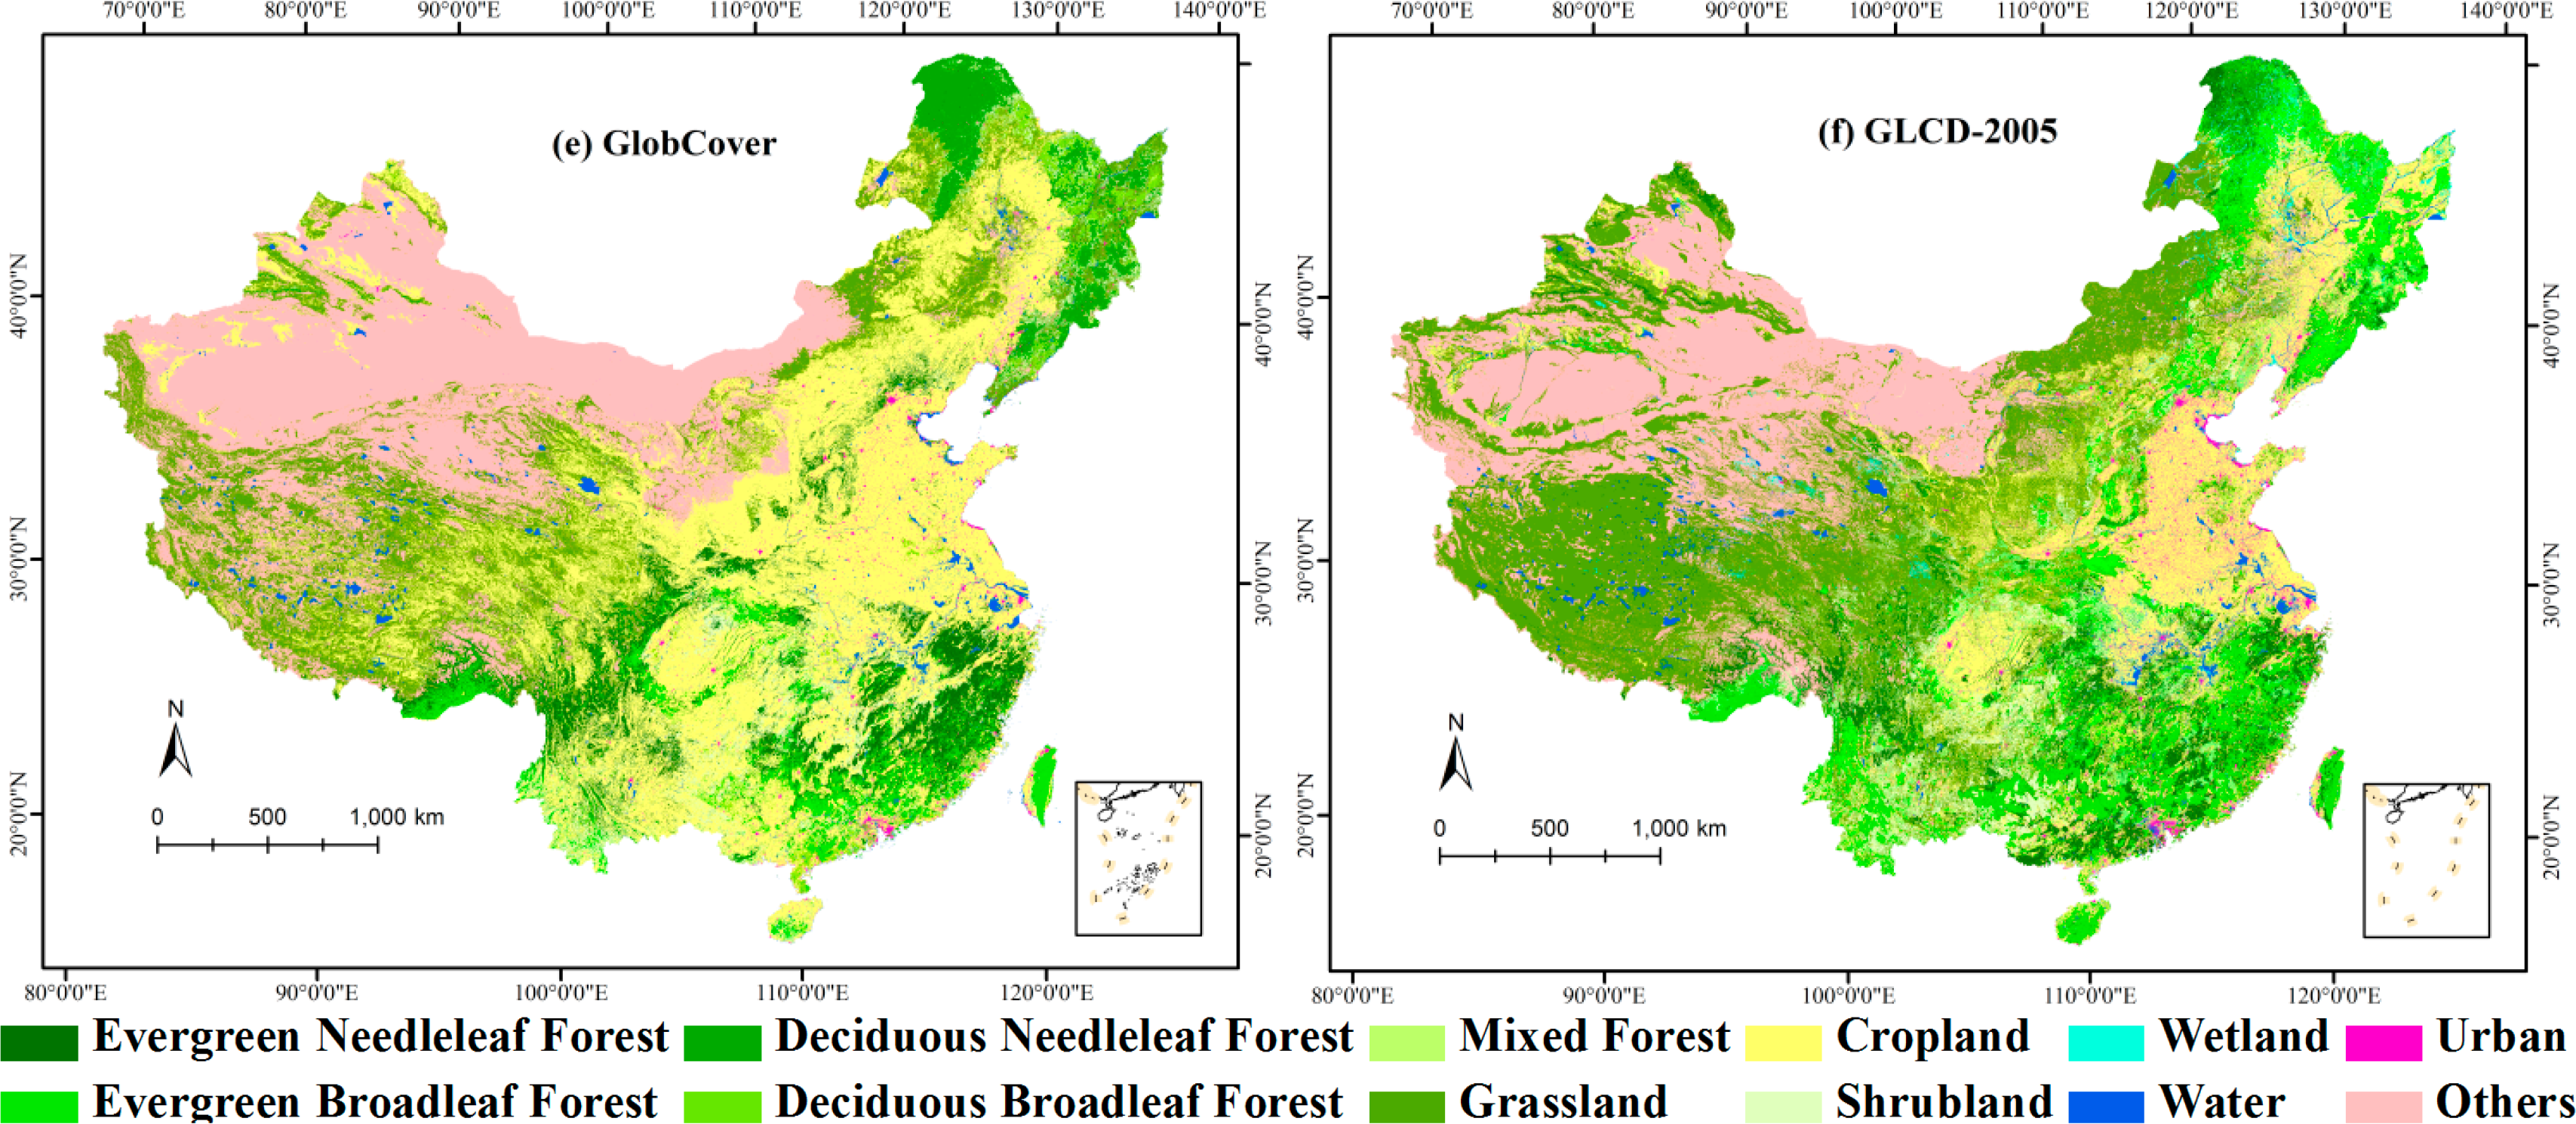
Regarding the visual requirement for maps across China, the reclassified data sets of (a) GLCC, (b) UMd, (c) GLC2000, (d) MODIS LC, and (e) GlobCover in China, as well as (f) GLCD-2005 are displayed with Albers Equal Area projection as shown in Figure 1 (relative figures over China in the following sections are visualized in the same way).
3.2. Areal and Spatial Comparison
Two essential components of the comparative assessments between different land cover data sets are comparisons in terms of the quantity and the location of each class, respectively [53]. Comparison in terms of quantity, mainly referring to areal comparison, considers whether the area proportion of each class on the classification data set is similar to the proportion of the corresponding category on the reference data. Comparison in terms of location concerns the issue on spatial (dis)agreement of each category pixel by pixel usually. Typical per-pixel comparisons between different datasets can be divided into two sets, one is the fuzzy approach [54–57], and another is the crisp or Boolean approach [27,32,33,36]. As the fuzzy method requires expert knowledge to quantify uncertainty in classification and transition zones of boundaries [29], the crisp or Boolean approach, which is based on cross-walking between classes, is preferred here.
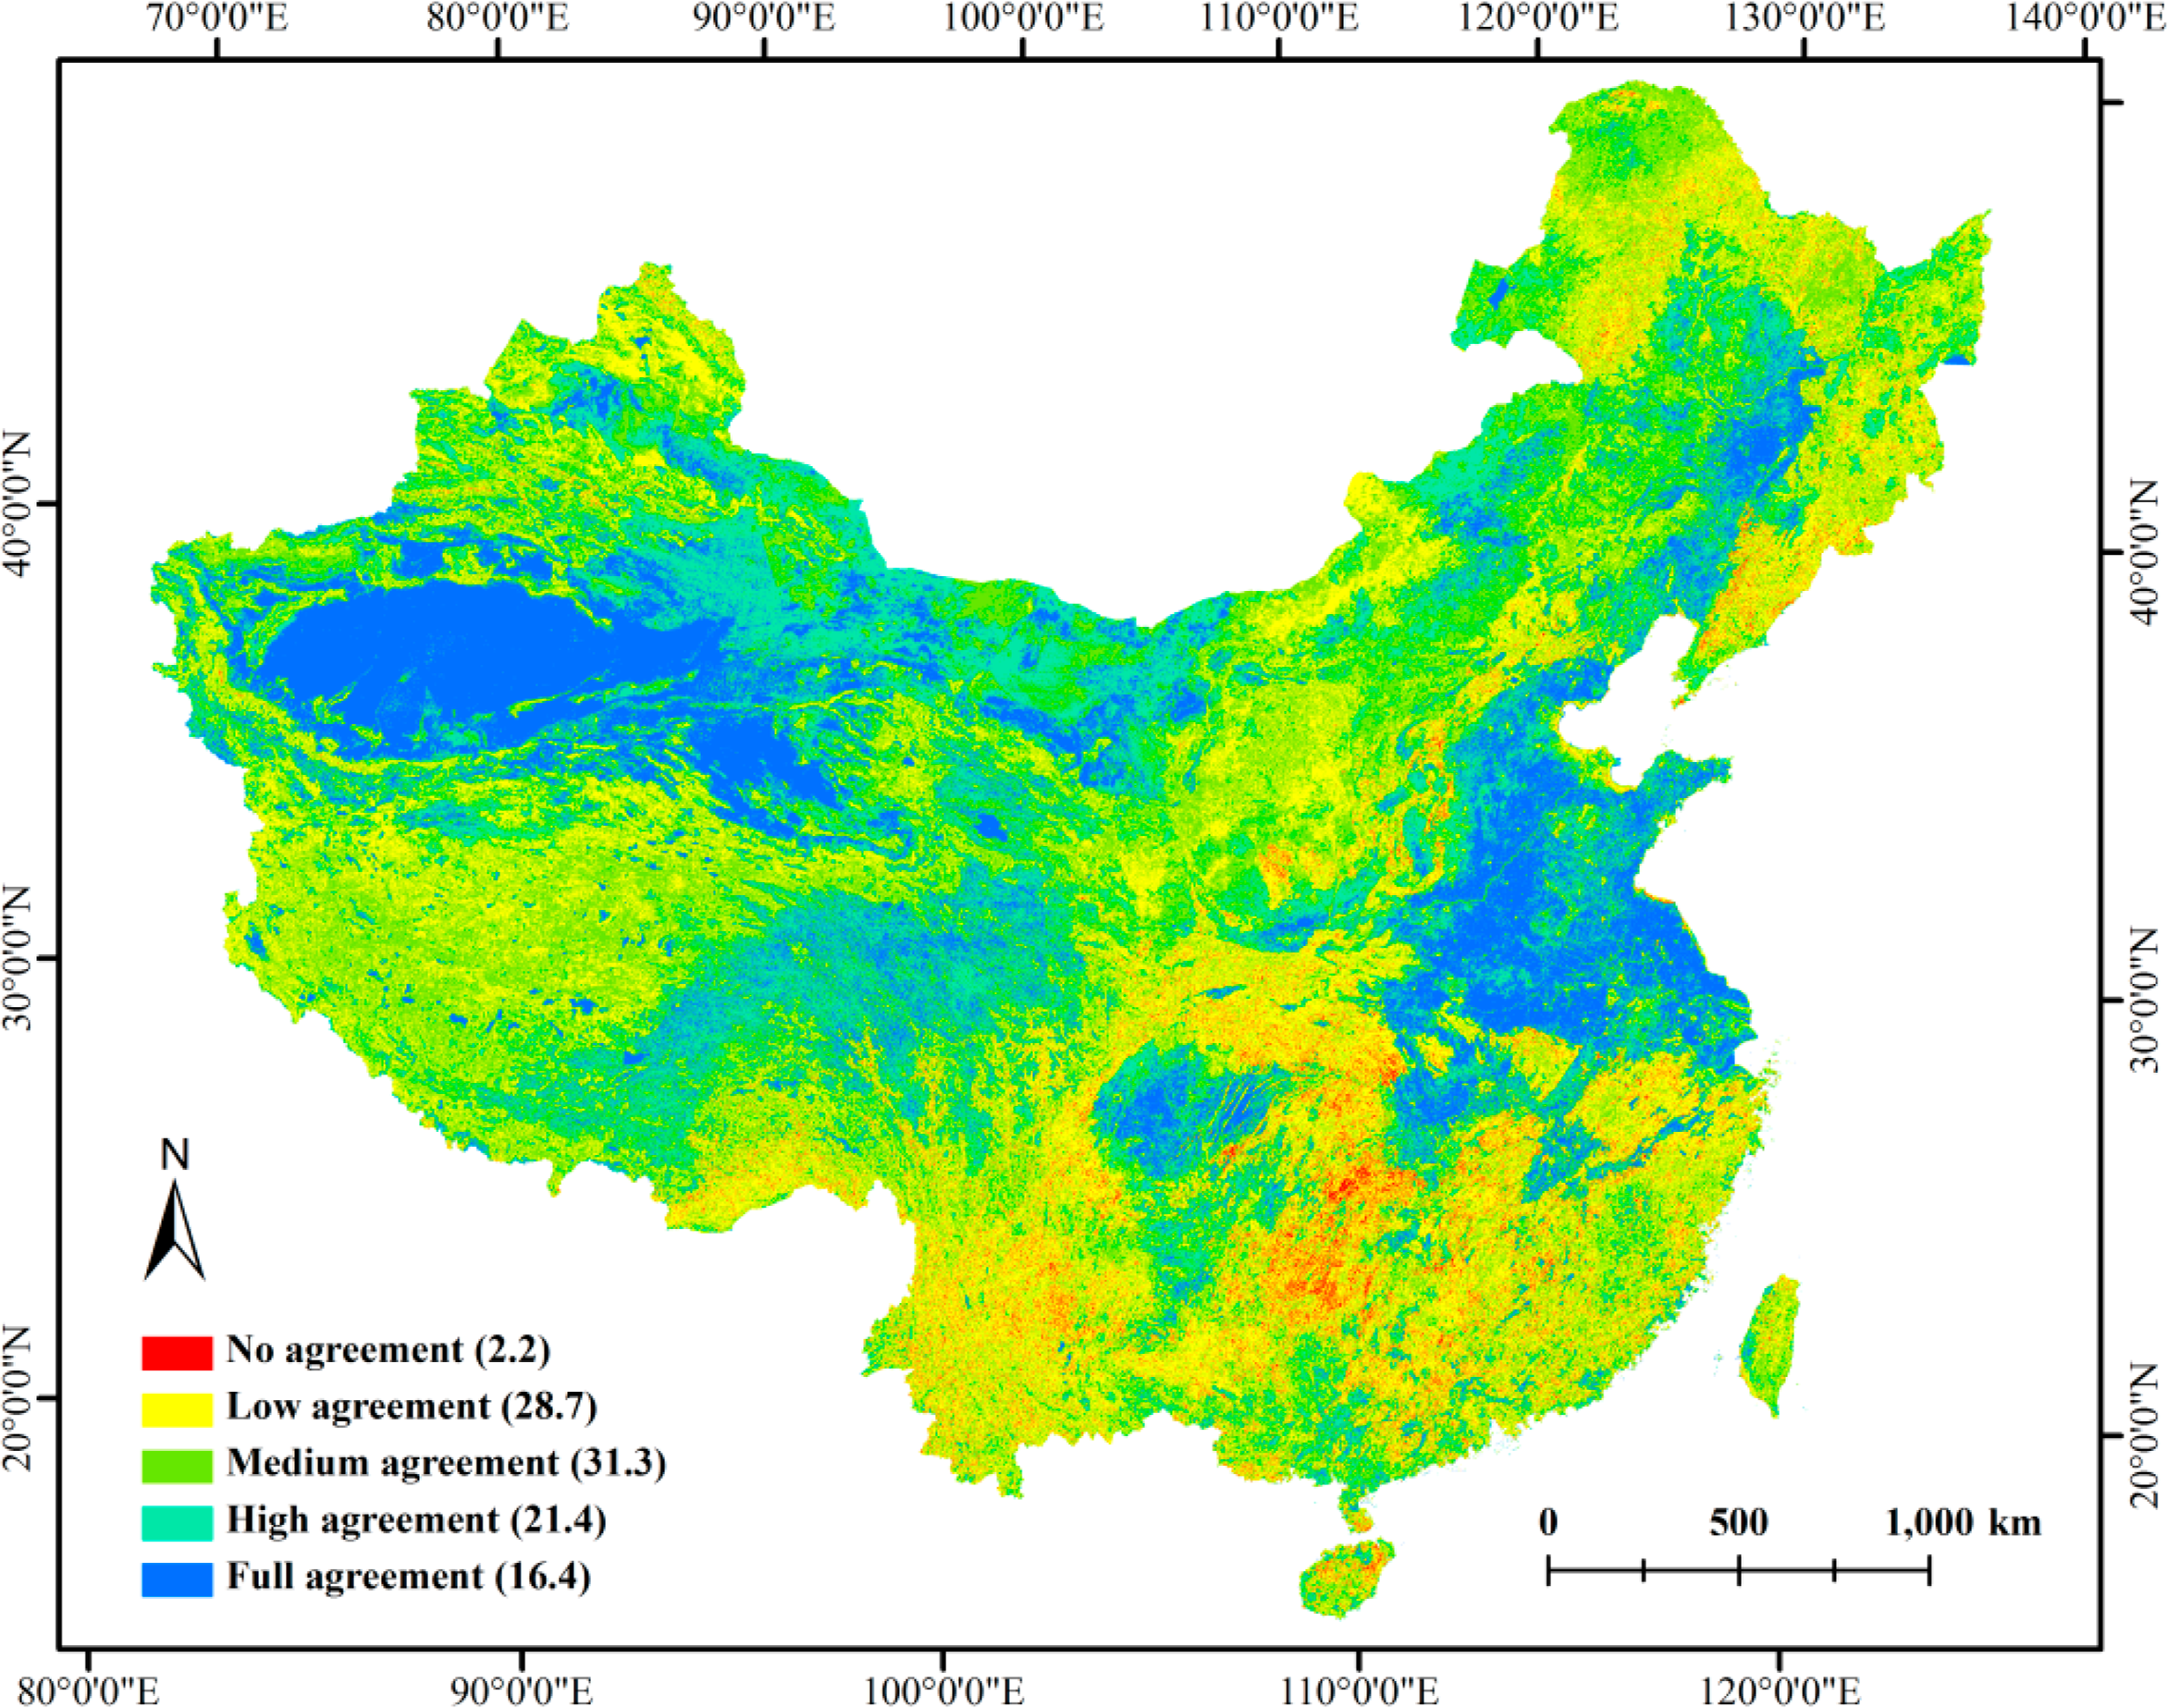
After being assigned to the target legend according to Table 4, the five global data sets were then overlaid to produce an agreement map, which indicates the level of agreement among these data sets. Consulting to McCallum et al. [36], five levels of agreement were distinguished in this pixel-based comparison process:
- (i)
No agreement for pixels with a unique aggregated class in each data set.
- (ii)
Low agreement for pixels where only two of the five data sets are in agreement.
- (iii)
Medium agreement for pixels where three of the five data sets are in agreement.
- (iv)
High agreement when four of the five data sets agree for the same pixel.
- (iv)
(v) Full agreement for where all the five data sets within a pixel are in agreement.
Similarly, we overlaid each global land cover data set with the reclassified GLCD-2005, respectively. Pixels with the same land cover class in both data sets were considered as areas of “agreement”, whereas pixels with different land cover classes were labelled as areas of “disagreement”.
3.3. Consistency Evaluation
To investigate the degree of agreement in terms of aggregated classes among the five global land cover data sets across China on a quantitative basis, we calculate the consistency between each land cover combination pair upon pixel-based confusion matrices rather than accuracy, given that validation against ground “true” was not provided.
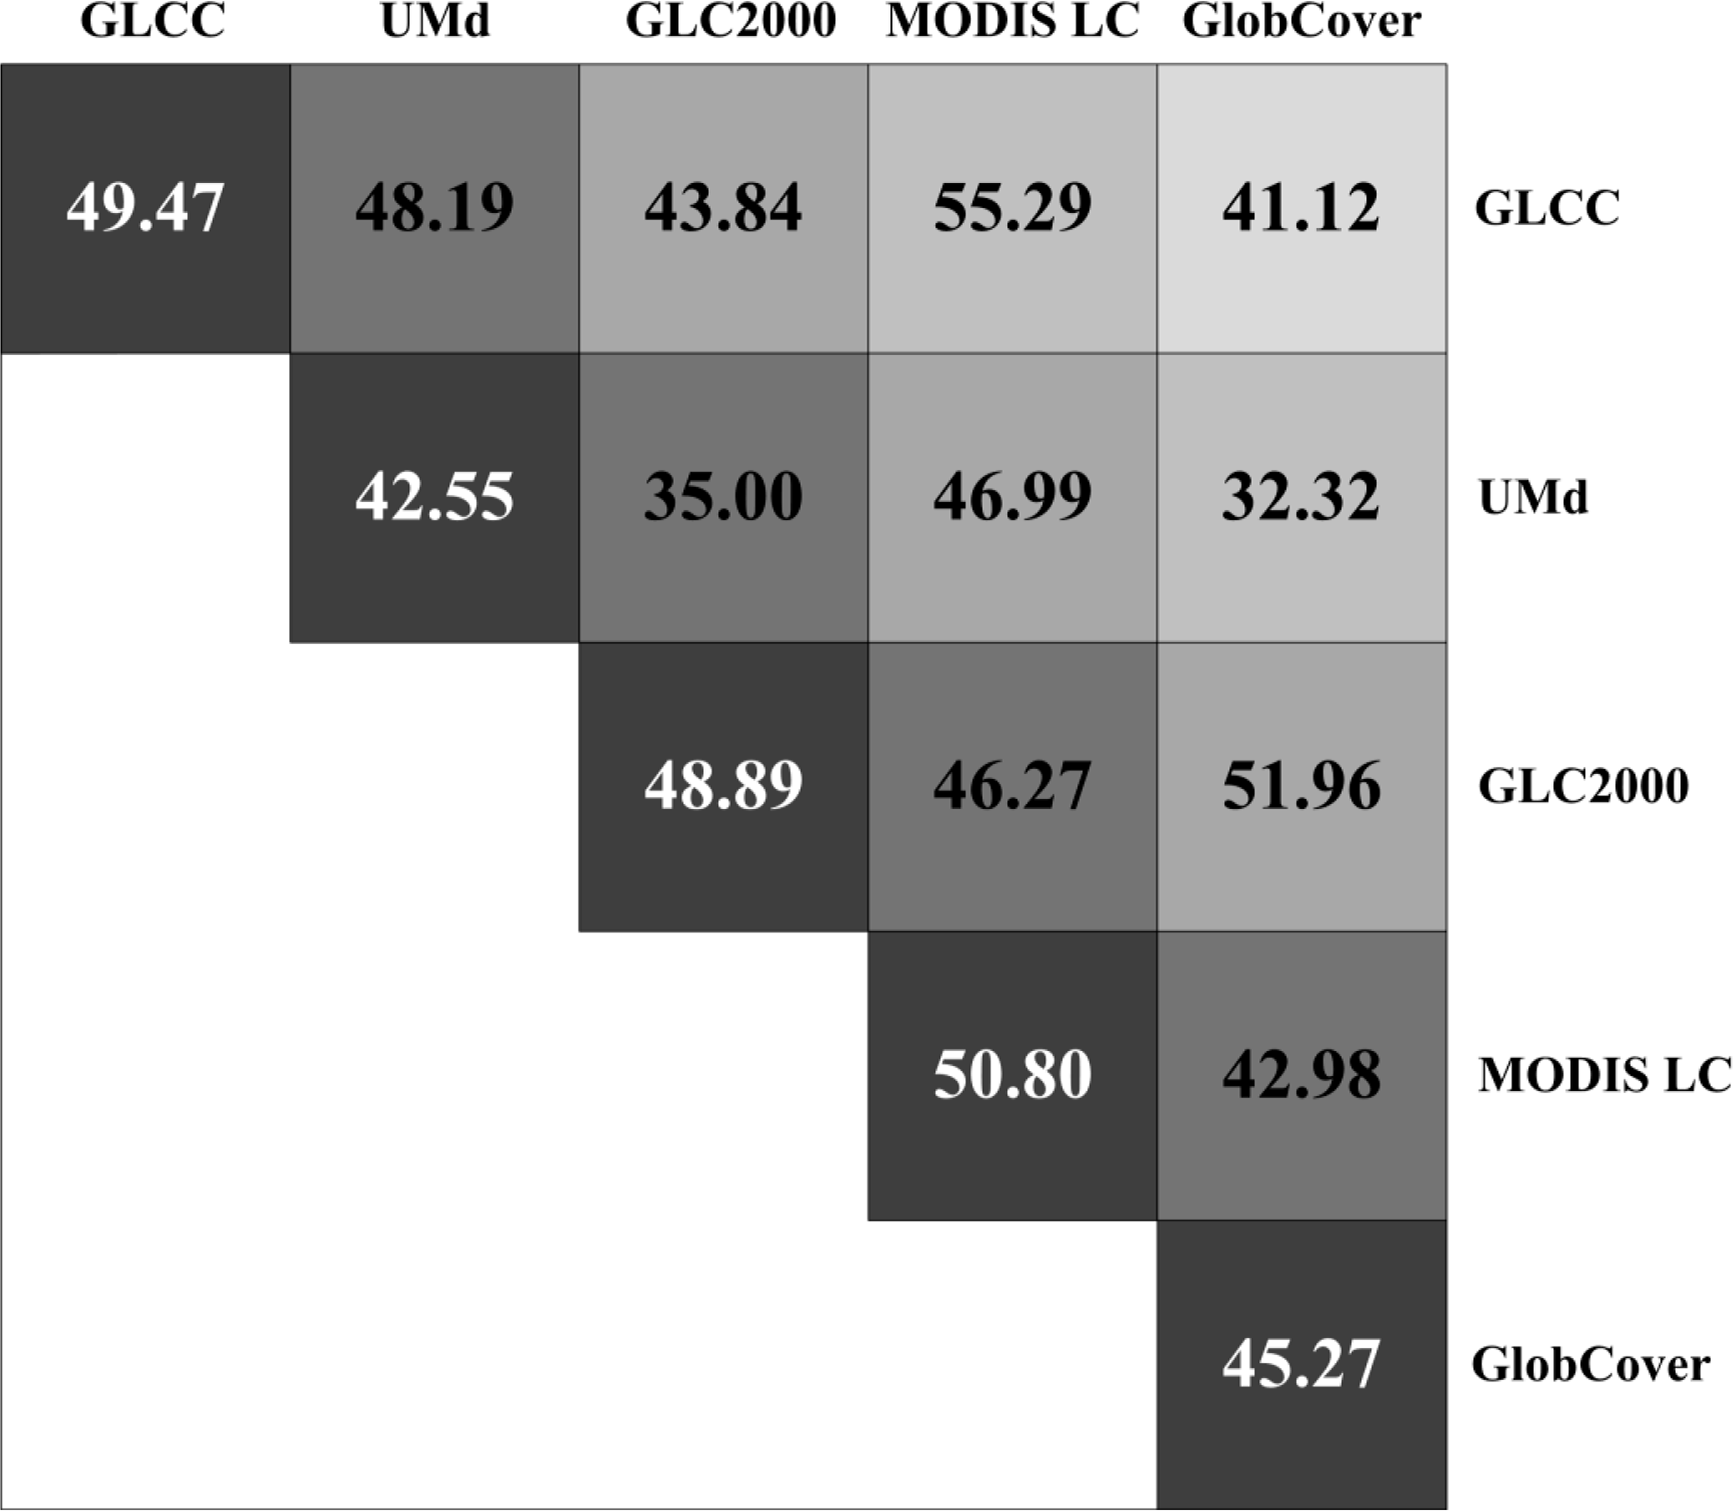
From the confusion matrices between land cover pairs we derive overall consistency, which is defined as the percentage of pixels where both data sets agree on the aggregated class. Then, the calculated overall consistency estimates where the considered data set was a comparison partner are averaged as an estimate of the map-specific consistency of the land cover data set (Equation (1)).
Ca* separately denote the overall consistency between pairs of data set a and another data set (i.e., b, c, d, or e) in China.
Indices a–e are the global land cover data sets (GLCC, UMd, GLC2000, MODIS LC, GlobCover) in China.
4. Results and Analyses
4.1. Thematic Similarities
Initially, a total percent area comparison of GLCC, UMd, GLC2000, MODIS LC, and GlobCover that assigned to each with twelve target classes was performed in China (Figure 2), and the result suggests that there is reasonable agreement across the five products for Grassland, Cropland, and Water and Others, particularly. However, substantial disagreements exist for Evergreen/Deciduous Forests classes, Shrubland, Urban, especially Mixed Forest and Wetland (except UMd).
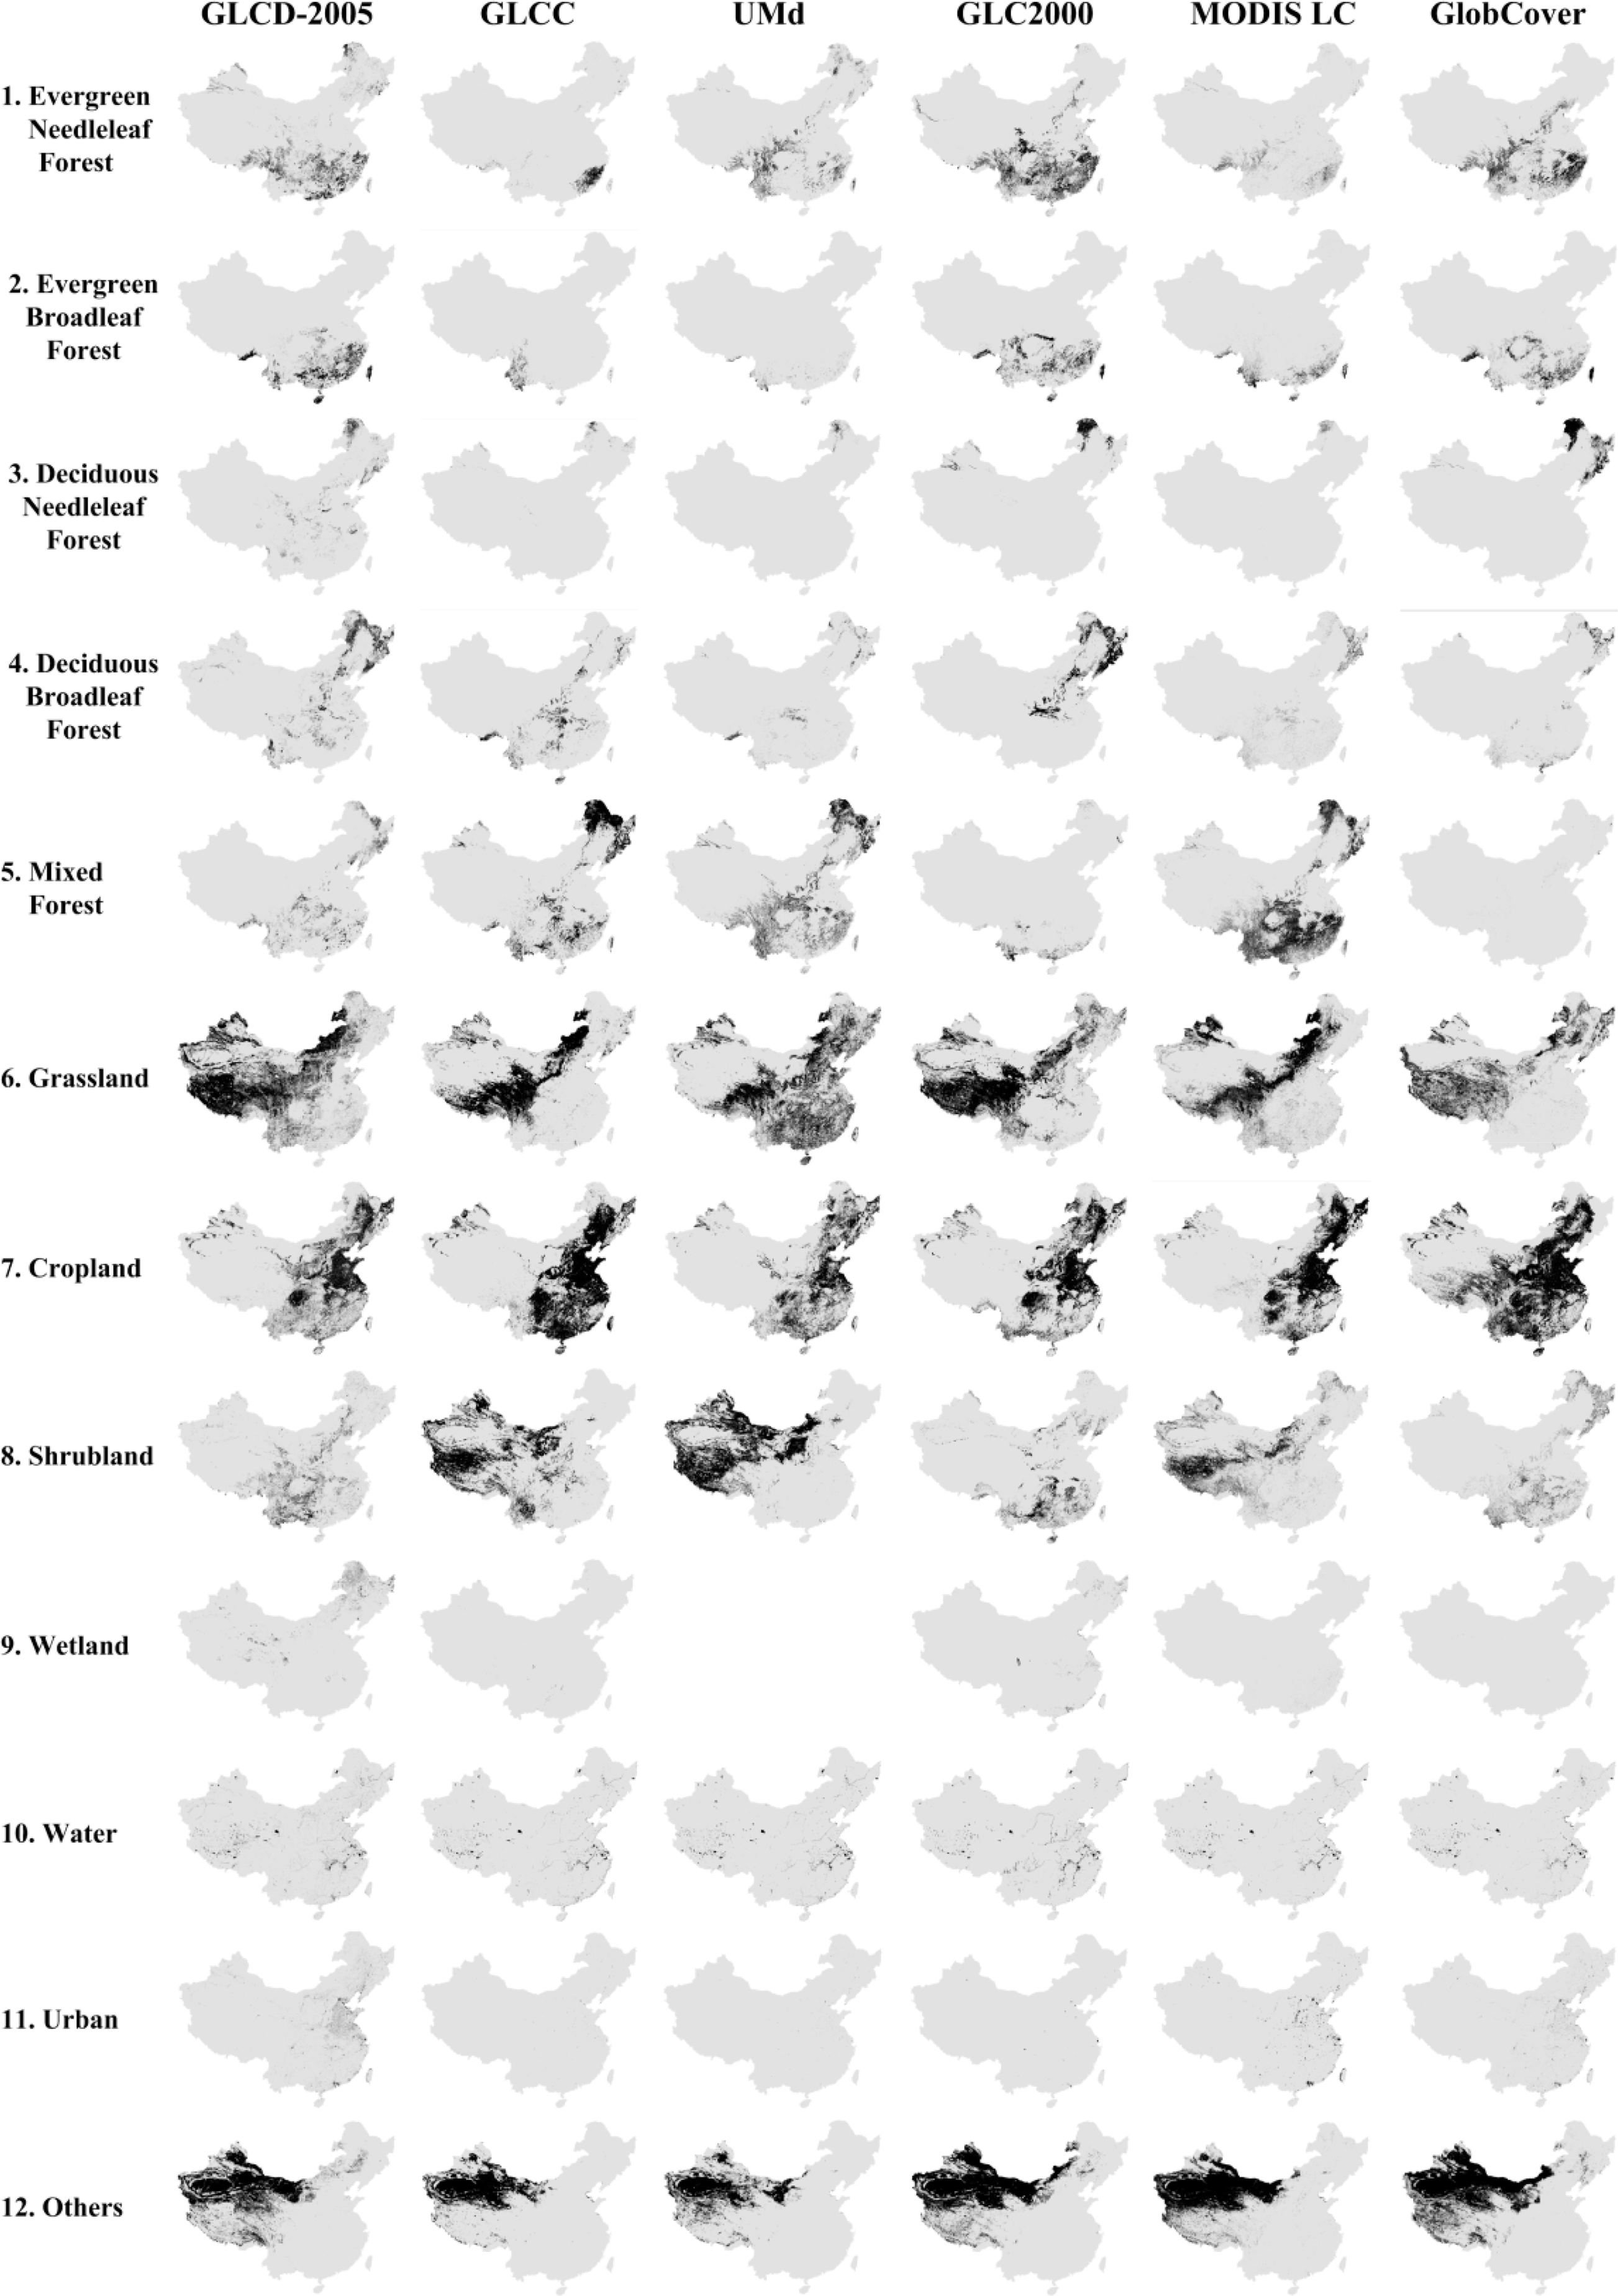
Visualizations of the distribution pattern and percent area composite of various assigned land cover categories across five data sets compared with GLCD-2005 are presented in Figure 3. The dominated land cover types of China land mass like Grassland, Cropland and Others, the sum of which account for about 70%, are similarly identified across the five data sets and the reference data. Besides, most of the large patches are distributed around the Northwestern and Eastern China. However, compared with GLCD-2005, major differences appear in Shrubland across the five global land cover data sets except GLC2000 and GlobCover; the discrepancy of Mixed Forest is conspicuous across all of the five data sets.
4.2. Spatial (Dis)Agreement
The per-pixel comparison of the five land cover data sets, reclassified to the aggregated classes defined at Table 4, is presented in Figure 4. It is visible that among these data sets over China, there is an understandable agreement on the distributional pattern of different generalized land cover types, especially for large, homogenous patches, such as Grassland and Cropland, while disagreement can also be found primarily for small, heterogeneous patches along edges and transition zones. Besides, areas of full agreement are often adjacent to areas of high agreement, areas of medium agreement are adjacent to areas of low agreement, and areas of no agreement are also adjacent to areas of low agreement. Statistically, no agreement takes up less than 2.5%, high to full agreement amount to about 38%, despite 31% are in medium agreement (3 of 5 agree) and 29% are in low agreement (only 2 of 5 agree).
Additionally, areas of no agreement across the five land cover data sets distribute sparsely and mostly in several parts of Southwestern China, while areas of full agreement and high agreement mainly occur in the regions of prevailing land covers exist, such as Others in Western, Southern and Eastern Xinjiang, Grassland in Western Tibet, Northwest and South of Qinghai, extending to Northeast of Inner Mongolia and Southwest of Heilongjiang, as well as Cropland in Central and Eastern China.
Furthermore, maps of agreement between each compared land cover data set and the reference data were created (Figure 5), and the levels of agreement were calculated (Table 5). Among all map pairs, GLC2000 agrees best with GLCD-2005 in that the “agreement” takes up about 52.2%, followed by GlobCover, MODIS LC, and GLCC in a descending order of agreement; UMd has the lowest agreement to GLCD-2005 with about 67% “disagreement”. Spatially, regions of agreement between these data set pairs are primarily appear in Southern Xinjiang and Qinghai, Northwest of Inner Mongolia, Southeast of Tibet and Sichuan, some regions of Jiangsu, Shanghai and Shandong provinces, central Jilin, and Southwest of Heilongjiang as well.
4.3. Consistency Analysis
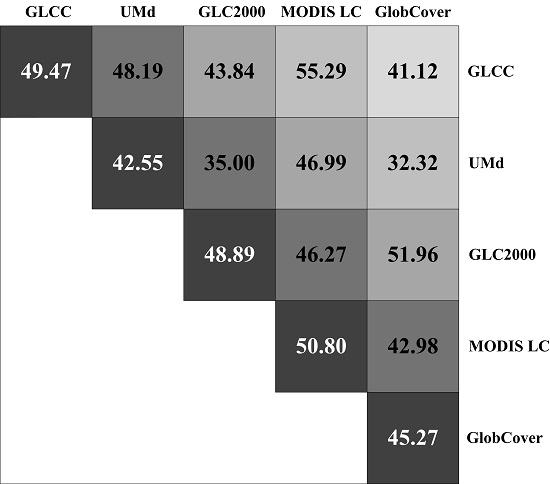
Figure 6 illustrates the calculated overall consistency between any two of the five global data sets for the aggregated land cover classes in China, of which the map-specific consistency of each data set is presented along the diagonal. This figure indicates that MODIS LC has the highest map-specific consistency (50.8%) among all of the compared data sets, while UMd gets the lowest one (42.6%). Among all data set pairs, MODIS LC agrees best with GLCC (overall consistency is about 55.3%), whereas UMd agrees worst with GlobCover (overall consistency is 32.3%). Moreover, the overall consistencies between all data set pairs across China are less than 50% except MOIDS LC and GLCC (55.3%), accompanied with GlobCover and GLC2000 pair (52.0%).
5. Discussions
From above assessments and analyses, we can find that discrepancies among the compared data sets could either be real or simply be due to differences in their sensors, temporal periods, original classification algorithms, or classification schemes. However, even if land cover changes between the acquisition dates has an effect on this comparison [28,29], it cannot be the primary factor since natural ecosystems typically vary on a decade or longer. This can be demonstrated in this study through the comparison result between GlobCover and GLCD-2005 that, the agreement between these two data sets is not the highest among the compared pairs, although there is no difference between their temporal periods. In terms of classification of land cover mapping, the first important issue is class separability [28], which has already been viewed as a general problem of optical remote sensing in discriminating certain categories with multi-temporal spectral signatures that overlap with other categories, such as Shrubland or Wetland. Classification schemes and class definitions are also problematic in several ways. Mixed classes lack clear definitions; more or less arbitrary thresholds are applied to distinguish between classes, which pose significant challenges for users of land cover data sets that classification schemes may be not flexible or suitable enough for their applications. The third noticeable issue refers to cartographic standards as mapping a continuum transition with a discrete classification scheme. Especially for areas of mixed classes, different maps may give distinct estimates, all of which may be right or wrong to some extent, since final land cover maps are definitely very sensitive to classification algorithms and representation of mixed cartographic units.
Aside from above internal factors, a number of external factors are also the sources of discrepancies between these data sets, including map projections, resolution unifications and classification scheme conversion. External factors mentioned above may attribute to the preparations and modifications done to the different data sets to meet the need of this study. As in the legend conversion, substantial differences of identification criteria for the same or similar categories are undeniable [32]. For instance, the GLCC/MODIS LC-IGBP height threshold for dividing trees and shrubs is 2 m, while in the UMd-simplified IGBP and GlobCover-LCCS it is 5 m, and GLC2000-LCCS is 3 m. For coverage thresholds, the IGBP separates closed coverage (>60%) and open coverage (10–60%), while in the simplified IGBP and LCCS, closed coverage is defined as >40%, open coverage is 10–40% and 15–40%, respectively. When classification scheme transformation was performed, differences and uncertainties were already introduced.
6. Conclusions
To our knowledge, this effort has been the first investigation of the consistencies and differences of all the five global land cover data sets (i.e., GLCC, UMd, GLC2000, MODIS LC, and GlobCover) for China land mass. Although initiatives of these examined data sets were implemented with the same purpose of providing accurate land cover information, different satellite sensors and classification approaches were used. It is no wonder that all these data sets produced different results, and it would be too arbitrary to say which data set is more suitable for a specific application, but the study provides a reference for users to understand the extent and degree of uncertainty or potential errors within these data sets as well as a guideline for further validation of quality assessment.
Based on the intermap comparison of five global land cover data sets and reference data regarding 12 aggregated classes, (1) the thematic similarities, (2) spatial agreement and (3) map-specific consistency between them are identified. Generally, identified from the comparison results of the thematic similarities, the Forest classes, and especially Shrubland, Mixed Forest and Wetland are very problematic across China; while the dominated land cover types like Grassland and Cropland are similarly identified across the five data sets. Spatially, regions of disagreement among these data sets are primarily related to transitional zones with mixed classes, such as regions of Southwest China, although the sum of no agreement and low agreement takes up less than 32.0%, while high to full agreement amount to about 38.0%. Compared with the reference data set GLCD-2005, areas of agreement across the five data sets are distributed around the Northwestern and Eastern China; major differences appear in Shrubland across GLCC, UMd and MODIS LC, and the discrepancy of Mixed Forest is conspicuous across all of the compared data sets. In addition, among all map pairs, GLC2000 has the highest agreement (52.2%) with GLCD-2005, while UMd has the highest disagreement (66.9%) with GLCD-2005. Further, regarding consistencies among the five data sets, MODIS LC has the highest map-specific consistency (50.8%) whereas UMd gets the lowest one (42.6%).
For the next step, a rigorous validation of the five global land cover data sets against test samples could be carried out for a larger area, such as continental or global, providing a guide line for users to choose and use these global land cover data sets in their researches. Furthermore, there is also a need to exploit the synergies and harmonization of different land cover data sets based on examining the agreements and disagreements between them, towards creating a consensus land cover data with combining information provided from other relative global ancillary data. Such a data set can be used to extend and enrich the initiatives fostered by Global Observation of Forest and Land Cover Dynamics (GOFC-GOLD) in conjunction with FAO and Global Terrestrial Observing Systems (GTOS) [58].
Acknowledgments
Funding support for this work was provided by the following programs: International Science & Technology Cooperation Program of China (Grant No. 2011DFG23500), China Postdoctoral Science Foundation (No. 2014M550816), Data Sharing Network of Earth System Science (Grant No. 2005DKA32300), and National Natural Science Foundation of China (Grant No. 41101364). The authors are indebted to the individuals who have contributed to the generation of the five global land cover data sets compared in this study. Thanks are also given to Data Sharing Infrastructure of Earth System Science [59] for providing the GLCD-2005 totally free.
Author Contributions
Yan Bai drafted the manuscript and was responsible for the research design, data processing and results analysis. Min Feng reviewed the manuscript and was responsible for the research design, technical support and analysis. Hao Jiang and Yingzhen Liu supported the data preparation. Juanle Wang and Yunqiang Zhu provided some useful suggestions on data comparison. All of the authors contributed to editing and reviewing the manuscript.
Conflicts of Interest
The authors declare no conflict of interest.
References
- Di Gregorio, A.; Jansen, L.J.M. Land Cover Classification System (LCCS): Classification Concepts and User Manual; Food and Agriculture Organization of the United Nations: Rome, Italy, 2000; p. 3. [Google Scholar]
- Sutherland, W.J.; Adams, W.M.; Aronson, R.B.; Aveling, R.; Blackburn, T.M.; Broad, S.; Ceballos, G.; CÔTÉ, I.M.; Cowling, R.M.; Da Fonseca, G.A.B.; et al. One hundred questions of importance to the conservation of global biological diversity. Conserv. Biol 2009, 23, 557–567. [Google Scholar]
- Bonan, G.B. Land Surface Model (LSM Version 1.0) for Ecological, Hydrological, and Atmospheric Studies: Technical Description and User’s Guide; National Center for Atmospheric Research: Boulder, Colorado, CO, USA, 1996; p. 159. [Google Scholar]
- Sellers, P.J.; Los, S.O.; Tucker, C.J. A revised land surface parameterization (SiB2) for atmospheric gcms. Part II: The generation of global fields of terrestrial biophysical parameters from satellite data. J. Climate 1996, 9, 706–737. [Google Scholar]
- Sellers, P.J.; Randall, D.A.; Collatz, G.J.; Berry, C.B.; Field, D.A.; Dazlich, C.; Zhang, G.D.; Collelo, L.B. A revised land surface parameterization (SiB2) for atmospheric GCMs. Part I: Model formulation. J. Climate 1996, 9, 676–705. [Google Scholar]
- Zeng, X.B.; Dai, Y.J.; Shaikh, M.; Dickinson, R.E.; Myneni, R. Common Land Model (CLM) and its coupling with the NCAR CCM3. In Proceedings of 2001 12th Symposium on Global Change and Climate Variations, Tucson, AZ, USA, 14–18 January 2001; pp. 19–20.
- Dai, Y.; Zeng, X.; Dickinson, R.; Baker, I.; Bonan, G.; Bosilovich, M.; Denning, A.; Dirmeyer, P.; Houser, P.; Niu, G.; et al. The common land model. Bull. Amer. Meteorol.Soc 2003, 84, 1013–1023. [Google Scholar]
- Douglas, I. Hydrological investigations of forest disturbance and land cover impacts in South-East Asia: A review. Phil. Trans. Roy. Soc. B-Biol. Sci 1999, 354, 1725–1738. [Google Scholar]
- Chapin, F.S.; Zavaleta, E.S.; Eviner, V.T.; Naylor, R.L.; Vitousek, P.M.; Reynolds, H.L.; Hooper, D.U.; Lavorel, S.; Sala, O.E.; Hobbie, S.E.; et al. Consequences of changing biodiversity. Nature 2000, 405, 234–242. [Google Scholar]
- Lambin, E.F.; Geist, H.J.; Lepers, E. Dynamics of land-use and land-cover change in tropical regions. Annu. Rev. Env. Resour 2003, 28, 205–241. [Google Scholar]
- Feddema, J.; Oleson, K.; Bonan, G.; Mearns, L.; Buja, L.; Meehl, G.; Washington, W. The importance of land-cover change in simulating future climates. Science 2005, 310, 1674–1678. [Google Scholar]
- Xie, Y.; Sha, Z.; Yu, M. Remote sensing imagery in vegetation mapping: A review. J. Plant Ecol 2008, 1, 9–23. [Google Scholar]
- Arino, O.; Gross, D.; Ranera, F.; Bourg, L.; Leroy, M.; Bicheron, P.; Latham, J.; Di Gregorio, A.; Brockman, C.; Witt, R.; et al. GlobCover: ESA service for global land cover from MERIS. In Proceedings of 2007 Geoscience and Remote Sensing Symposium, Barcelona, Spain, 23–28 July 2007; pp. 2412–2415.
- Bartalev, S.A.; Belward, A.S.; Erchov, D.V.; Isaev, A.S. A new SPOT4-VEGETATION derived land cover map of Northern Eurasia. Int. J. Remote Sens 2003, 24, 1977–1982. [Google Scholar]
- Friedl, M.A.; McIver, D.K.; Hodges, J.C.F.; Zhang, X.Y.; Muchoney, D.; Strahler, A.H.; Woodcock, C.E.; Gopal, S.; Schneider, A.; Cooper, A.; et al. Global land cover mapping from MODIS: Algorithms and early results. Remote Sens. Environ 2002, 83, 287–302. [Google Scholar]
- Gong, P.; Wang, J.; Yu, L.; Zhao, Y.; Zhao, Y.; Liang, L.; Niu, Z.; Huang, X.; Fu, H.; Liu, S.; et al. Finer resolution observation and monitoring of global land cover: First mapping results with Landsat TM and ETM+ data. Int. J. Remote Sens 2013, 34, 2607–2654. [Google Scholar]
- Hansen, M.C.; Defries, R.S.; Townshend, J.R.G.; Sohlberg, R. Global land cover classification at 1 km spatial resolution using a classification tree approach. Int. J. Remote Sens 2000, 21, 1331–1364. [Google Scholar]
- Liu, J.; Zhuang, D.; Zhang, Z.; Gao, Z.; Deng, X. The establishment of land-use spatial-temporal database and its relative studies in China. Geoinf. Sci 2002, 4, 3–7. [Google Scholar]
- Loveland, T.R.; Reed, B.C.; Brown, J.F.; Ohlen, D.O.; Zhu, Z.; Yang, L. Development of a global land cover characteristics database and IGBP DISCover from 1 km AVHRR data. Int. J. Remote Sens 2000, 21, 1303–1330. [Google Scholar]
- Mayaux, P.; Bartholomé, E.; Fritz, S.; Belward, A. A new land-cover map of africa for the year 2000. J. Biogeogr 2004, 31, 861–877. [Google Scholar]
- Mayaux, P.; Strahler, A.; Eva, H.; Herold, M.; Shefali, A.; Naumov, S. Validation of the global land cover 2000 map. IEEE Trans. Geosci. Remote Sens 2006, 44, 1728–1739. [Google Scholar]
- Nowak, D.; Greenfield, E. Evaluating the national Land Cover Database tree canopy and impervious cover estimates across the conterminous United States: A comparison with photo-interpreted estimates. Environ. Manage 2010, 46, 378–390. [Google Scholar]
- Zhao, Y.S.; Liao, A.P.; Chen, L.J. The creation of national land cover database in China. Sci. Surv. Map 2007, 32, 138–198. [Google Scholar]
- Tateishi, R.; Uriyangqai, B.; Al-Bilbisi, H.; Ghar, M.A.; Tsend-Ayush, J.; Kobayashi, T.; Kasimu, A.; Hoan, N.T.; Shalaby, A.; Alsaaideh, B.; et al. Production of global land cover data—GLCNMO. Int. J. Digit. Earth 2010, 4, 22–49. [Google Scholar]
- Townshend, J.R.G. Global data sets for land applications from the advanced very high resolution radiometer: An introduction. Int. J. Remote Sens 1994, 15, 3319–3332. [Google Scholar]
- Bartholome, E.; Belward, A. Glc2000: A new approach to global land cover mapping from earth observation data. Int. J. Remote Sens 2005, 26, 1959–1977. [Google Scholar]
- Herold, M.; Mayaux, P.; Woodcock, C.E.; Baccini, A.; Schmullius, C. Some challenges in global land cover mapping: An assessment of agreement and accuracy in existing 1 km datasets. Remote Sens. Environ 2008, 112, 2538–2556. [Google Scholar]
- Jung, M.; Henkel, K.; Herold, M.; Churkina, G. Exploiting synergies of global land cover products for carbon cycle modeling. Remote Sens. Environ 2006, 101, 534–553. [Google Scholar]
- Kaptué Tchuenté, A.T.; Roujean, J.L.; De Jong, S.M. Comparison and relative quality assessment of the GLC2000, GLOBCOVER, MODIS and ECOCLIMAP land cover data sets at the African continental scale. Int. J. Appl. Earth Observ. Geoinf 2011, 13, 207–219. [Google Scholar]
- Giri, C.; Zhu, Z.; Reed, B. A comparative analysis of the Global Land Cover 2000 and MODIS land cover data sets. Remote Sens. Environ 2005, 94, 123–132. [Google Scholar]
- Lu, L.; Li, X.; Dong, Q.H.; Swinnen, E.; Veroustraete, F. The mapping and validation of land cover in northwest China from SPOT-4 VEGETATION. J. Remote Sens 2003, 7, 214–220. [Google Scholar]
- Bai, L. Comparison and Validation of Five Global Land Cover Products over the African Continent, Ph.D. Thesis, Lund University, Sölvegatan, Sweden. December 2010.
- Fritz, S.; See, L.; Rembold, F. Comparison of global and regional land cover maps with statistical information for the agricultural domain in Africa. Int. J. Remote Sens 2010, 31, 2237–2256. [Google Scholar]
- Hansen, M.C.; Reed, B. A comparison of the IGBP DISCover and University of Maryland1 km global land cover products. Int. J. Remote Sens 2000, 21, 1365–1373. [Google Scholar]
- Latifovic, R.; Olthof, I. Accuracy assessment using sub-pixel fractional error matrices of global land cover products derived from satellite data. Remote Sens. Environ 2004, 90, 153–165. [Google Scholar]
- McCallum, I.; Obersteiner, M.; Nilsson, S.; Shvidenko, A. A spatial comparison of four satellite derived 1 km global land cover datasets. Int. J. Appl. Earth Observ. Geoinf 2006, 8, 246–255. [Google Scholar]
- Neumann, K.; Herold, M.; Hartley, A.; Schmullius, C. Comparative assessment of CORINE2000 and GLC2000: Spatial analysis of land cover data for Europe. Int. J. Appl. Earth Observ. Geoinf 2007, 9, 425–437. [Google Scholar]
- Ran, Y.; Li, X.; Lu, L. Evaluation of four remote sensing based land cover products over China. Int. J. Remote Sens 2010, 31, 391–401. [Google Scholar]
- Wu, W.; Shibasaki, R.; Yang, P.; Ongaro, L.; Zhou, Q.; Tang, H. Validation and comparison of 1 km global land cover products in China. Int. J. Remote Sens 2008, 29, 3769–3785. [Google Scholar]
- Nakaegawa, T. Uncertainty in land cover datasets for global land-surface models derived from 1-km global land cover datasets. Hydrol. Process 2011, 25, 2703–2714. [Google Scholar]
- Ning, J.; Zhang, S.; Cai, H.; Bu, K. A comparative analysis of the MODIS land cover data sets and Globcover land cover data sets in Heilongjiang Basin. J. Geoinf. Sci 2012, 14, 240–249. [Google Scholar]
- Friedl, M.A.; Sulla-Menashe, D.; Tan, B.; Schneider, A.; Ramankutty, N.; Sibley, A.; Huang, X. MODIS collection 5 global land cover: Algorithm refinements and characterization of new datasets. Remote Sens. Environ 2010, 114, 168–182. [Google Scholar]
- Bicheron, P.; Defourny, P.; Brockman, C.; Schouten, L.; Vancutsem, C.; Huc, M.; Bontemps, S.; Leroy, A.; Achard, F.; Herold, M.; et al. Globcover: Product Description and Validation Report; Medias: Toulouse, France, 2008; p. 47. [Google Scholar]
- Zhang, Z.X.; Wang, X.; Wang, C.Y.; Zuo, L.J.; Wen, Q.K.; Dong, T.T.; Zhao, X.L.; Liu, B.; Yi, L. National land cover mapping by remote sensing under the control of interpreted data. J. Geoinf. Sci 2009, 11, 216–224. [Google Scholar]
- Liao, S.B.; Liu, R.; Yin, F. Validation for accuracy of land cover remote sensing mapping of China at scale of 1:250,000 in East Inner Mongolia. Geogr. Res 2011, 30, 555–563. [Google Scholar]
- Liao, S.B.; Zhu, H.Z.; Bai, Y.; Cao, J.; Liu, R.; Zhu, L.J.; Wang, J.L. Field validation of accuracy of remote sensing mapping for land cover of China at a scale of 1 to 250,000 in Qinlin-Dabashan area. China Land Sci 2011, 25, 80–85. [Google Scholar]
- Seong, J.C.; Mulcahy, K.A.; Usery, E.L. The sinusoidal projection: A new importance in relation to global image data. Prof. Geogr 2002, 54, 218–225. [Google Scholar]
- Liu, M.L.; Tang, X.M.; Liu, J.Y.; Zhuang, D.F. Research on scaling effect based on 1 km grid cell data. J. Remote Sens 2001, 5, 183–190. [Google Scholar]
- Zhao, L. Study on Scale Effect of Scaling with Land Use Spatial Data. Master’s Thesis, China Agricultural University, Beijing, China. June 2005. [Google Scholar]
- Diaz, S.; Cabido, M. Plant functional types and ecosystem function in relation to global change. J. Veg. Sci 1997, 8, 463–474. [Google Scholar]
- Gitay, H.; Noble, I.R. What are functional types and how should we seek them? In Plant Functional Types; Smith, T.M., Shugart, H.H., Woodward, F.I., Eds.; Cambridge University Press: Cambridge, UK, 1997; pp. 3–19. [Google Scholar]
- Milchunas, D.G.; Lauenroth, W.K. Quantitative effects of grazing on vegetation and soils over a global range of environments. Ecol. Monogr 1993, 63, 327–366. [Google Scholar]
- Lambin, E.F.; Geist, H. Land-Use and Land-Cover Change: Local Processes And Global Impacts; Springer: Berlin, Germany, 2006; pp. 130–131. [Google Scholar]
- Fritz, S.; See, L. Identifying and quantifying uncertainty and spatial disagreement in the comparison of global land cover for different applications. Global Change Biol 2008, 14, 1057–1075. [Google Scholar]
- Hagen, A. Fuzzy set approach to assessing similarity of categorical maps. Int. J. Geogr. Inf. Sci 2003, 17, 235–249. [Google Scholar]
- Zhang, J.X.; Stuart, N. Fuzzy methods for categorical mapping with image-based land cover data. Int. J. Geogr. Inf. Sci 2001, 15, 175–195. [Google Scholar]
- Woodcock, C.E.; Gopal, S. Fuzzy set theory and thematic maps: Accuracy and area estimation. Int. J. Geogr. Inf. Sci 2000, 14, 153–172. [Google Scholar]
- Herold, M.; Woodcock, C.E.; Antonio, D.G.; Mayaux, P.; Belward, A.S.; Latham, J.; Schmullius, C.C. A joint initiative for harmonization and validation of land cover datasets. IEEE Trans. Geosci. Remote Sens 2006, 44, 1719–1727. [Google Scholar]
- Data Sharing Infrastructure of Earth System Science. Available online: http://www2.geodata.cn (accessed on 10 June 2014).


| GLCC | UMd | GLC2000 | MODIS LC | GlobCover | |
|---|---|---|---|---|---|
| Sensor | AVHRR | AVHRR | SPOT-4 VEGETATION | MODIS | MERIS |
| Time | April 1992–March 1993 | April 1992–March 1993 | November 1999–December 2000 | January 2001–December 2002 | December 2004–June 2006 |
| Spatial Resolution | 1 km | 1 km | 1 km | 500 m | 300 m |
| Input Data | 12 Monthly NDVI composites, DEM, ecoregions, regional land cover, DCW urban | 41 Metrics derived from NDVI and AVHRR bands 1–5, EROS urban, MODIS water mask | Daily mosaics of 4 spectral channels and NDVI of SPOT, JERS-1 and ERS Radar data; DMSP data, DEM | Monthly MODIS L2/L3 composites, EOS land/water mask, MODIS 16-day EVI, MODIS 8-day land surface temperature, DEM | MERIS L1B data, MERIS FR mosaics |
| Classification Technique | Unsupervised classification with post-classification refinement | Supervised classification decision tree | Generally unsupervised classification | Supervised decision tree, neural networks | Generally unsupervised classification |
| Classification Scheme | USGS IGBP (17 classes) | Simplified IGBP (14 classes) | FAO LCCS (23 classes) | IGBP (17 classes) | UN LCCS (22 classes) |
| Data for Validation | Landsat TM and SPOT images | Other digital datasets | High resolution satellite data, and ancillary information | High resolution land cover information | SPOT-VEGETATION NDVI, and Virtual/Google Earth |
| Overall Accuracy | Globally 66.9% | Globally 69% | Globally 68.6 ± 5% | Globally 75% | Globally 67.1% |
| Projection | Datum | |
|---|---|---|
| GLCC | Interrupted Goode Homolosine | WGS_1984 |
| UMd | Interrupted Goode Homolosine | WGS_1984 |
| GLC2000 | Geographic(Lat/Lon) | WGS_1984 |
| MODIS LC | Sinusoidal | WGS_1984 |
| GlobCover | Plate Carrée | WGS_1984 |
| GLCC | UMd | GLC2000 | MODIS LC | GlobCover | GLCD-2005 | ||||||
|---|---|---|---|---|---|---|---|---|---|---|---|
| 1 | Evergreen Needleleaf Forest | 1 | Evergreen Needleleaf Forest | 1 | Tree Cover, broadleaved, evergreen | 1 | Evergreen Needleleaf Forest | 11 | Post-flooding or irrigated croplands (or aquatic) | 11 | Evergreen Needleleaf Forest |
| 2 | Evergreen Broadleaf Forest | 2 | Evergreen Broadleaf Forest | 2 | Tree Cover, broadleaved, deciduous, closed | 2 | Evergreen Broadleaf Forest | 14 | Rainfed croplands | 12 | Evergreen Broadleaf Forest |
| 3 | Deciduous Needleleaf Forest | 3 | Deciduous Needleleaf Forest | 3 | Tree Cover, broadleaved, deciduous, open | 3 | Deciduous Needleleaf Forest | 20 | Mosaic cropland/vegetation (grassland/shrubland/forest) | 13 | Deciduous Needleleaf Forest |
| 4 | Deciduous Broadleaf Forest | 4 | Deciduous Broadleaf Forest | 4 | Tree Cover, needle-leaved, evergreen | 4 | Deciduous Broadleaf Forest | 30 | Mosaic vegetation (grassland/shrubland/forest)/cropland | 14 | Deciduous Broadleaf Forest |
| 5 | Mixed Forest | 5 | Mixed Forest | 5 | Tree Cover, needle-leaved, deciduous | 5 | Mixed Forest | 40 | Closed to open broadleaved evergreen or semi-deciduous forest | 15 | Mixed Forest |
| 6 | Closed Shrublands | 6 | Woodlands | 6 | Tree Cover, mixed leaf type | 6 | Closed Shrublands | 50 | Closed broadleaved deciduous forest | 16 | Shrub |
| 7 | Open Shrublands | 7 | Wooded grasslands | 7 | Tree Cover, regularly flooded, fresh water | 7 | Open Shrublands | 60 | Open broadleaved deciduous forest/woodland | 21 | Meadow grassland |
| 8 | Woody Savannas | 8 | Closed Shrublands | 8 | Tree Cover, regularly flooded, saline water | 8 | Woody Savannas | 70 | Closed needleleaved evergreen forest | 22 | Typical grassland |
| 9 | Savannas | 9 | Open Shrublands | 9 | Mosaic: Tree Cover/Other natural vegetation | 9 | Savannas | 90 | Open needleleaved deciduous or evergreen forest | 23 | Desert grassland |
| 10 | Grasslands | 10 | Grasslands | 10 | Tree Cover, burnt | 10 | Grasslands | 100 | Closed to open mixed broadleaved and needleleaved forest | 24 | Alpine meadow |
| 11 | Permanent Wetlands | 11 | Croplands | 11 | Shrub Cover, closed-open, evergreen | 11 | Permanent Wetlands | 110 | Mosaic forest or shrubland/grassland | 25 | Alpine grassland |
| 12 | Croplands | 12 | Bare ground | 12 | Shrub Cover, closed-open, deciduous | 12 | Croplands | 120 | Mosaic grassland/forest or shrubland | 26 | Shrub grassland |
| 13 | Urban and Built-Up | 14 | Urban and Built-Up | 13 | Herbaceous Cover, closed-open | 13 | Urban and Built-Up | 130 | Closed to open broadleaved or needleleaved, evergreen or deciduous) shrubland | 31 | Paddy field |
| 14 | Cropland/Natural Vegetation Mosaic | 0 | Water | 14 | Sparse Herbaceous or sparse shrub cover | 14 | Cropland/Natural Vegetation Mosaic | 140 | Closed to open herbaceous vegetation (grassland, savannas or lichens/mosses) | 32 | Irrigated land |
| 15 | Snow and Ice | 15 | Regularly flooded shrub and/or herbaceous cover | 15 | Snow and Ice | 150 | Sparse vegetation | 33 | Dry land | ||
| 16 | Barren or Sparsely Vegetated | 16 | Cultivated and managed areas | 16 | Barren or Sparsely Vegetated | 160 | Closed to open broadleaved forest regularly flooded | 41 | Urban construction land | ||
| 17 | Water Bodies | 17 | Mosaic: Cropland/Tree Cover/Other Natural Vegetation | 0 | Water | 170 | Closed broadleaved forest or shrubland permanently flooded | 42 | Rural settlement | ||
| 18 | Mosaic: Cropland/Shrub and/or Herbaceous cover | 180 | Closed to open grassland or woody vegetation on regularly flooded or waterlogged soil | 51 | Swamp | ||||||
| 19 | Bare Areas | 190 | Artificial surfaces and associated areas | 52 | Coastal wetland | ||||||
| 20 | Water Bodies | 200 | Bare areas | 53 | Inland water | ||||||
| 21 | Snow and Ice | 210 | Water bodies | 54 | River beach | ||||||
| 22 | Artificial surfaces and associated areas | 220 | Permanent snow and ice | 55 | Ice and snow | ||||||
| 61 | Bare rock | ||||||||||
| 62 | Bare land | ||||||||||
| 63 | Desert | ||||||||||
| Target Legend | GLCC | UMd | GLC2000 | MODIS LC | GlobCover | GLCD-2005 |
|---|---|---|---|---|---|---|
| Evergreen Needleleaf Forest | 1 | 1 | 4 | 1 | 70 | 11 |
| Evergreen Broadleaf Forest | 2 | 2 | 1 | 2 | 40 | 12 |
| Deciduous Needleleaf Forest | 3 | 3 | 5 | 3 | 90 | 13 |
| Deciduous Broadleaf Forest | 4 | 4 | 2, 3 | 4 | 50, 60 | 14 |
| Mixed Forest | 5, 8 | 5, 6 | 6, 9, 10 | 5, 8 | 100 | 15 |
| Grassland | 9, 10 | 7, 10 | 13 | 9, 10 | 120, 140, 150 | 21, 22, 23, 24, 25, 26 |
| Cropland | 12, 14 | 11 | 16, 17, 18 | 12, 14 | 11, 14, 20, 30 | 31, 32, 33 |
| Shrubland | 6, 7 | 8, 9 | 11, 12 | 6, 7 | 110, 130 | 16 |
| Wetland | 11 | * | 7, 8, 15 | 11 | 160, 170, 180 | 51, 52 |
| Water | 17 | 0 | 20 | 0 | 210 | 53, 54 |
| Urban | 13 | 14 | 22 | 13 | 190 | 41, 42 |
| Others (i.e., snow and ice, barren) | 15, 16 | 12 | 14, 19, 21 | 15, 16 | 200, 220 | 55, 61, 62, 63 |
*Wetland is absent in UMd.
| Reference Data | Agreement Levels | Land Cover Data Sets | ||||
|---|---|---|---|---|---|---|
| GLCC | UMd | GLC2000 | MODIS LC | GlobCover | ||
| GLCD-2005 | Agreement | 42.4 | 33.1 | 52.2 | 45.8 | 46.8 |
| Disagreement | 57.6 | 66.9 | 47.8 | 54.2 | 53.2 | |
© 2014 by the authors; licensee MDPI, Basel, Switzerland This article is an open access article distributed under the terms and conditions of the Creative Commons Attribution license (http://creativecommons.org/licenses/by/3.0/).
Share and Cite
Bai, Y.; Feng, M.; Jiang, H.; Wang, J.; Zhu, Y.; Liu, Y. Assessing Consistency of Five Global Land Cover Data Sets in China. Remote Sens. 2014, 6, 8739-8759. https://doi.org/10.3390/rs6098739
Bai Y, Feng M, Jiang H, Wang J, Zhu Y, Liu Y. Assessing Consistency of Five Global Land Cover Data Sets in China. Remote Sensing. 2014; 6(9):8739-8759. https://doi.org/10.3390/rs6098739
Chicago/Turabian StyleBai, Yan, Min Feng, Hao Jiang, Juanle Wang, Yunqiang Zhu, and Yingzhen Liu. 2014. "Assessing Consistency of Five Global Land Cover Data Sets in China" Remote Sensing 6, no. 9: 8739-8759. https://doi.org/10.3390/rs6098739