Geographic Object-Based Image Analysis Using Optical Satellite Imagery and GIS Data for the Detection of Mining Sites in the Democratic Republic of the Congo

Abstract
:1. Introduction
2. Mining and Conflict in the Democratic Republic of the Congo
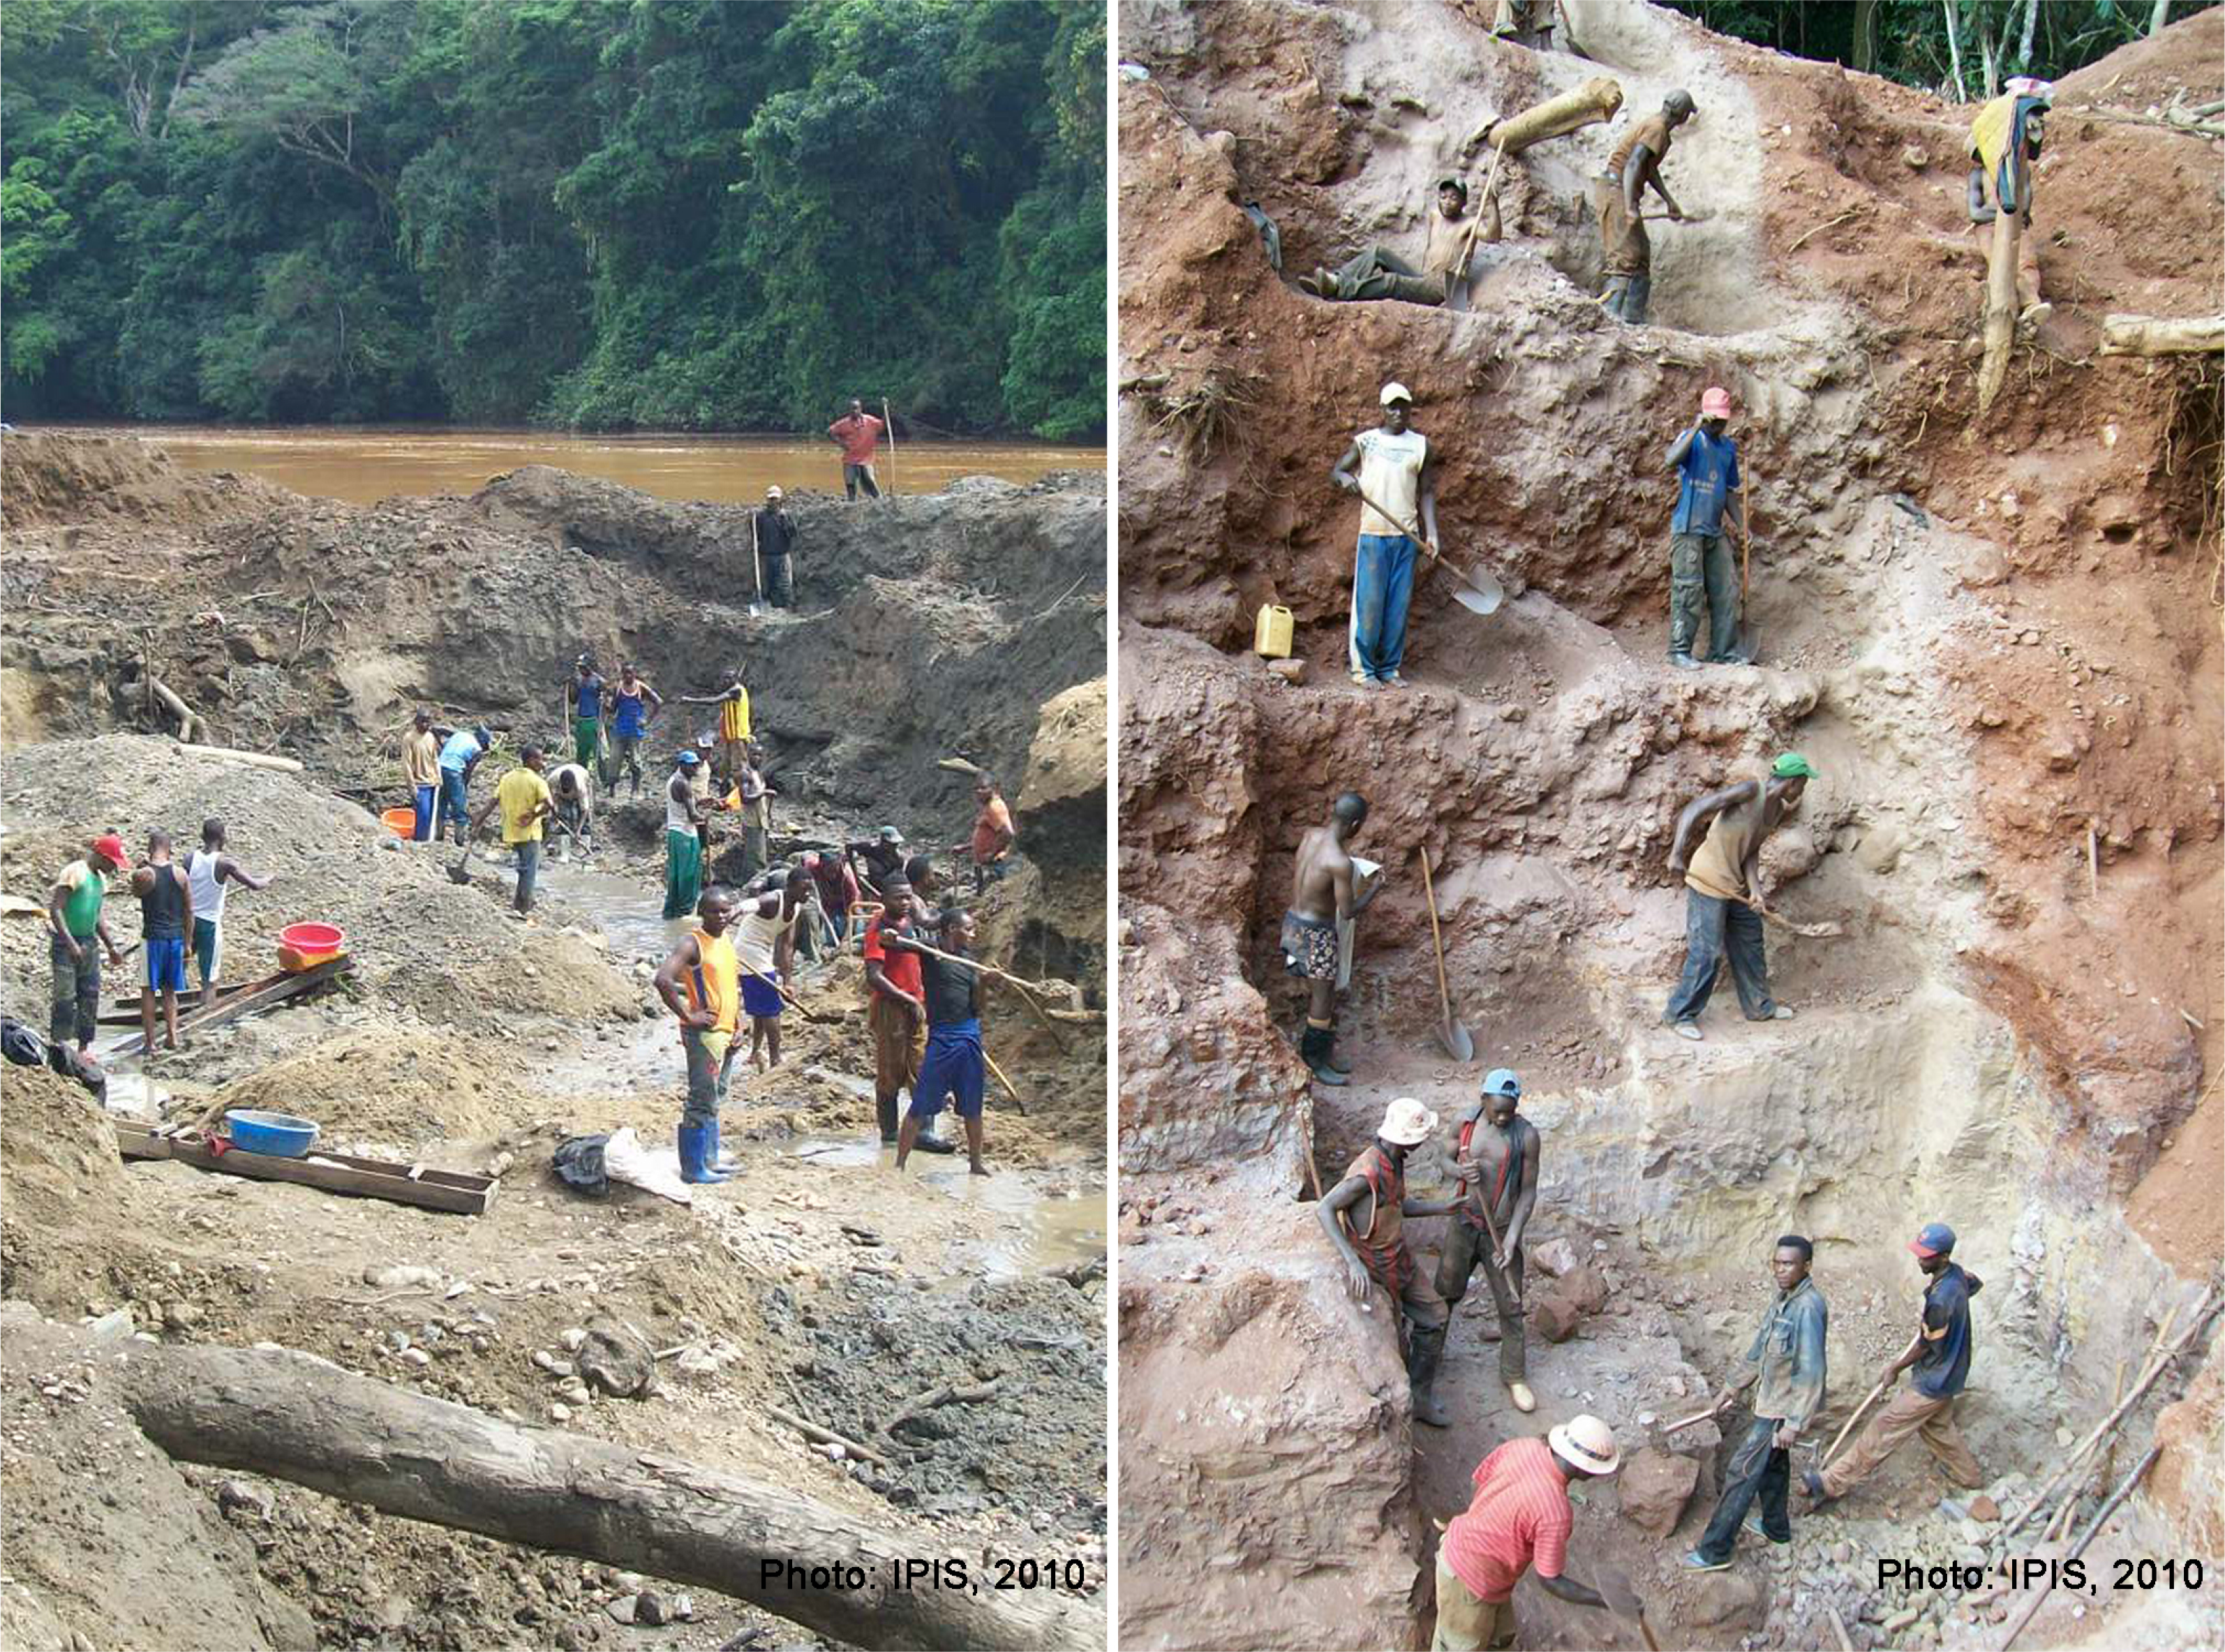
2.1. Artisanal and Small-Scale Mining
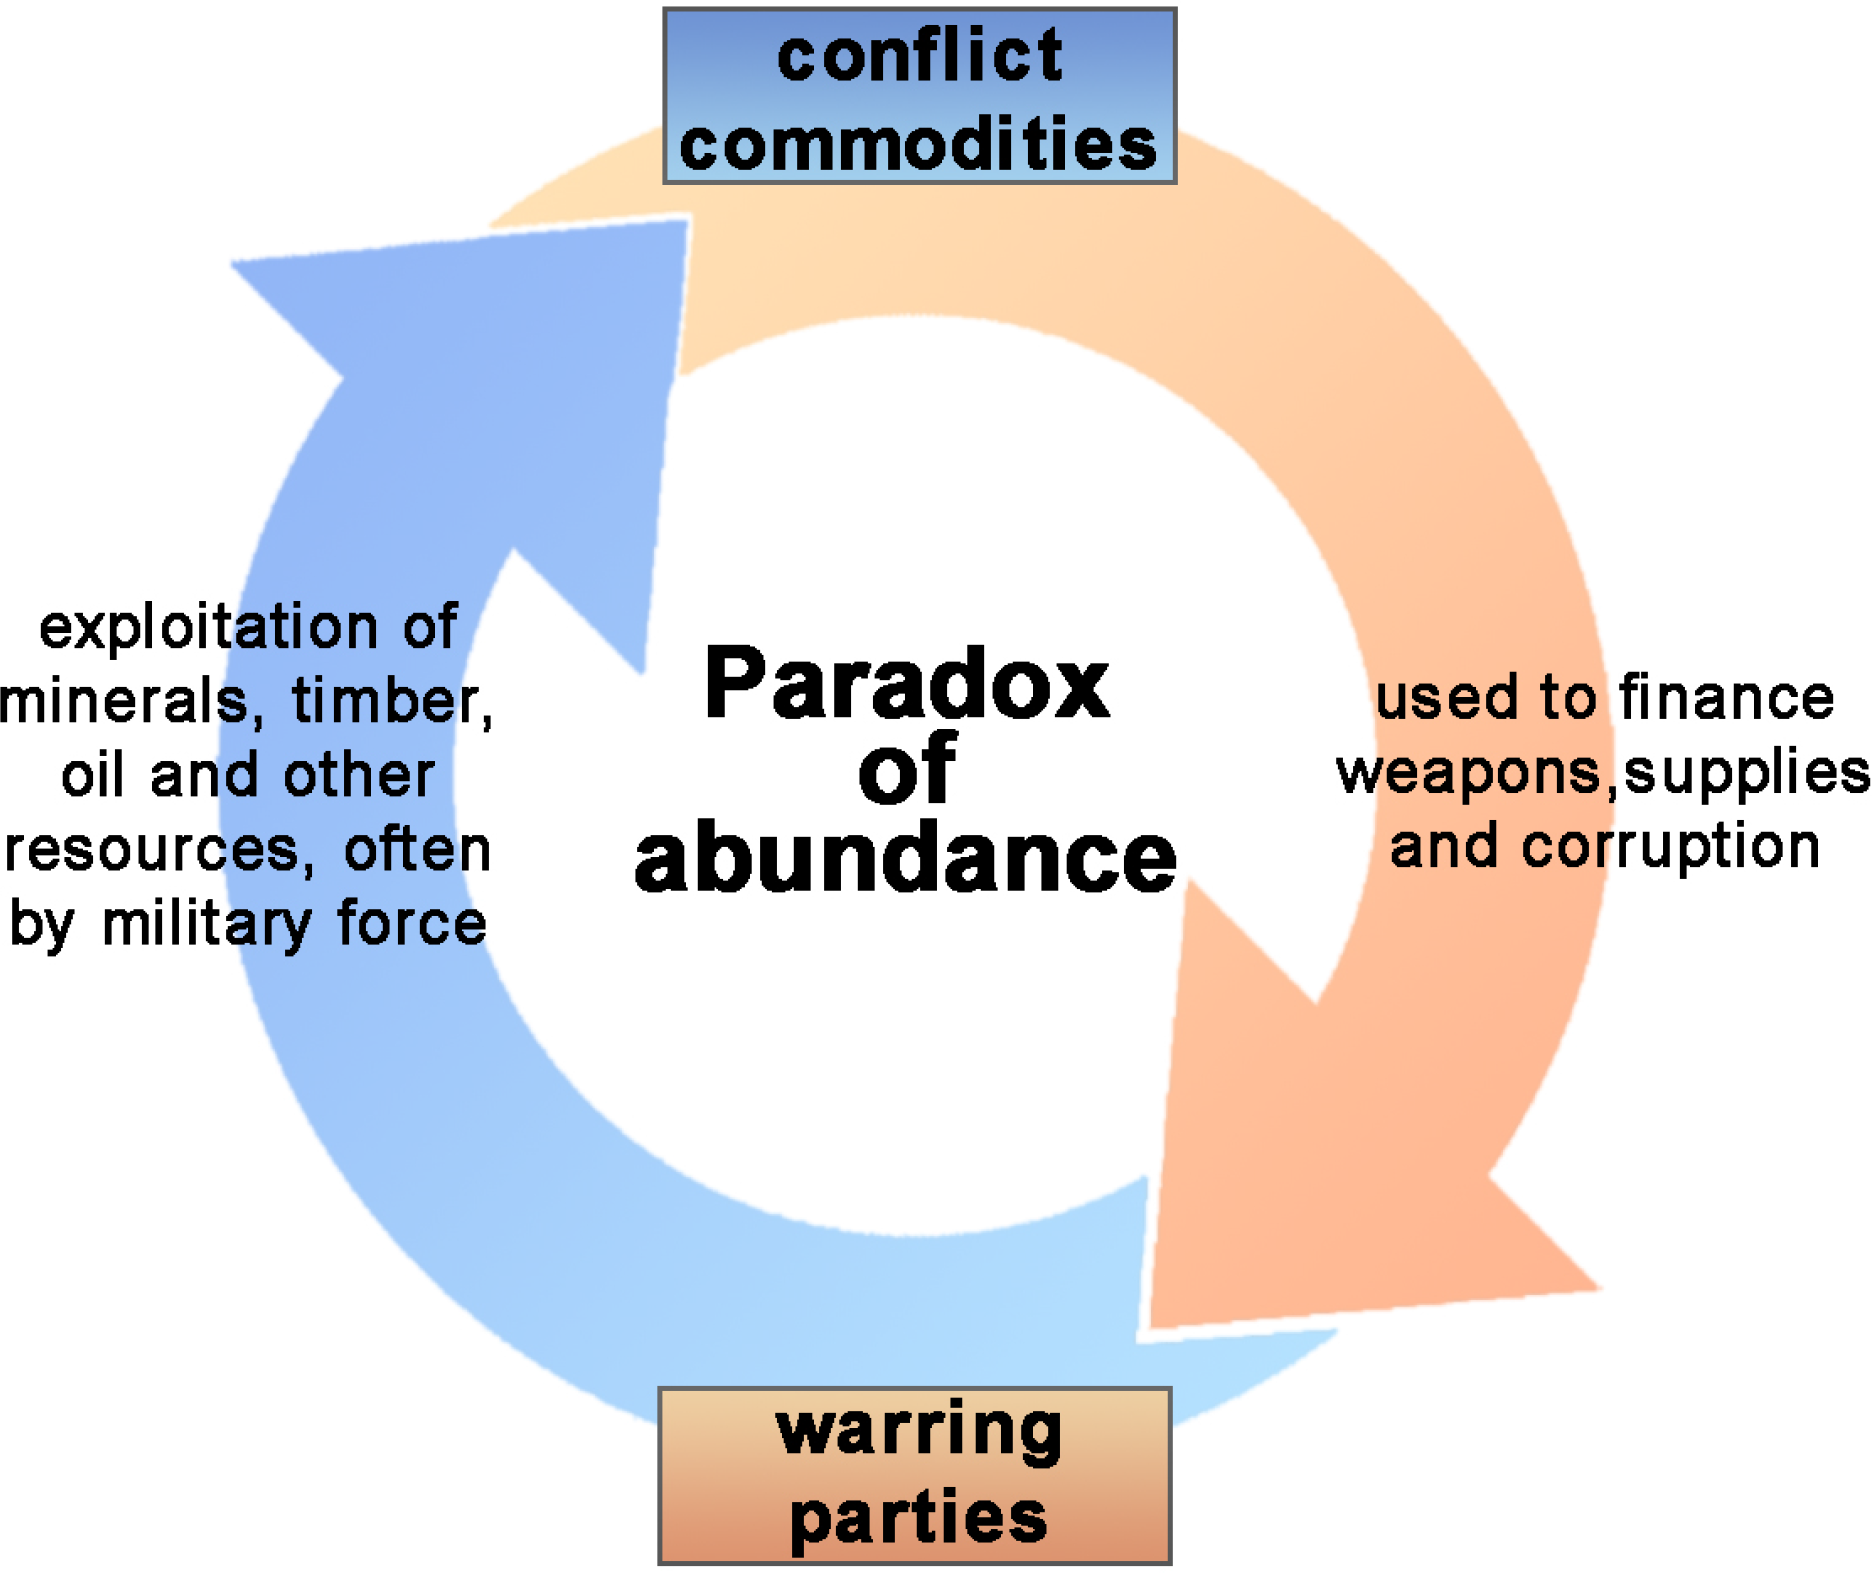
2.2. The Conflict Situation
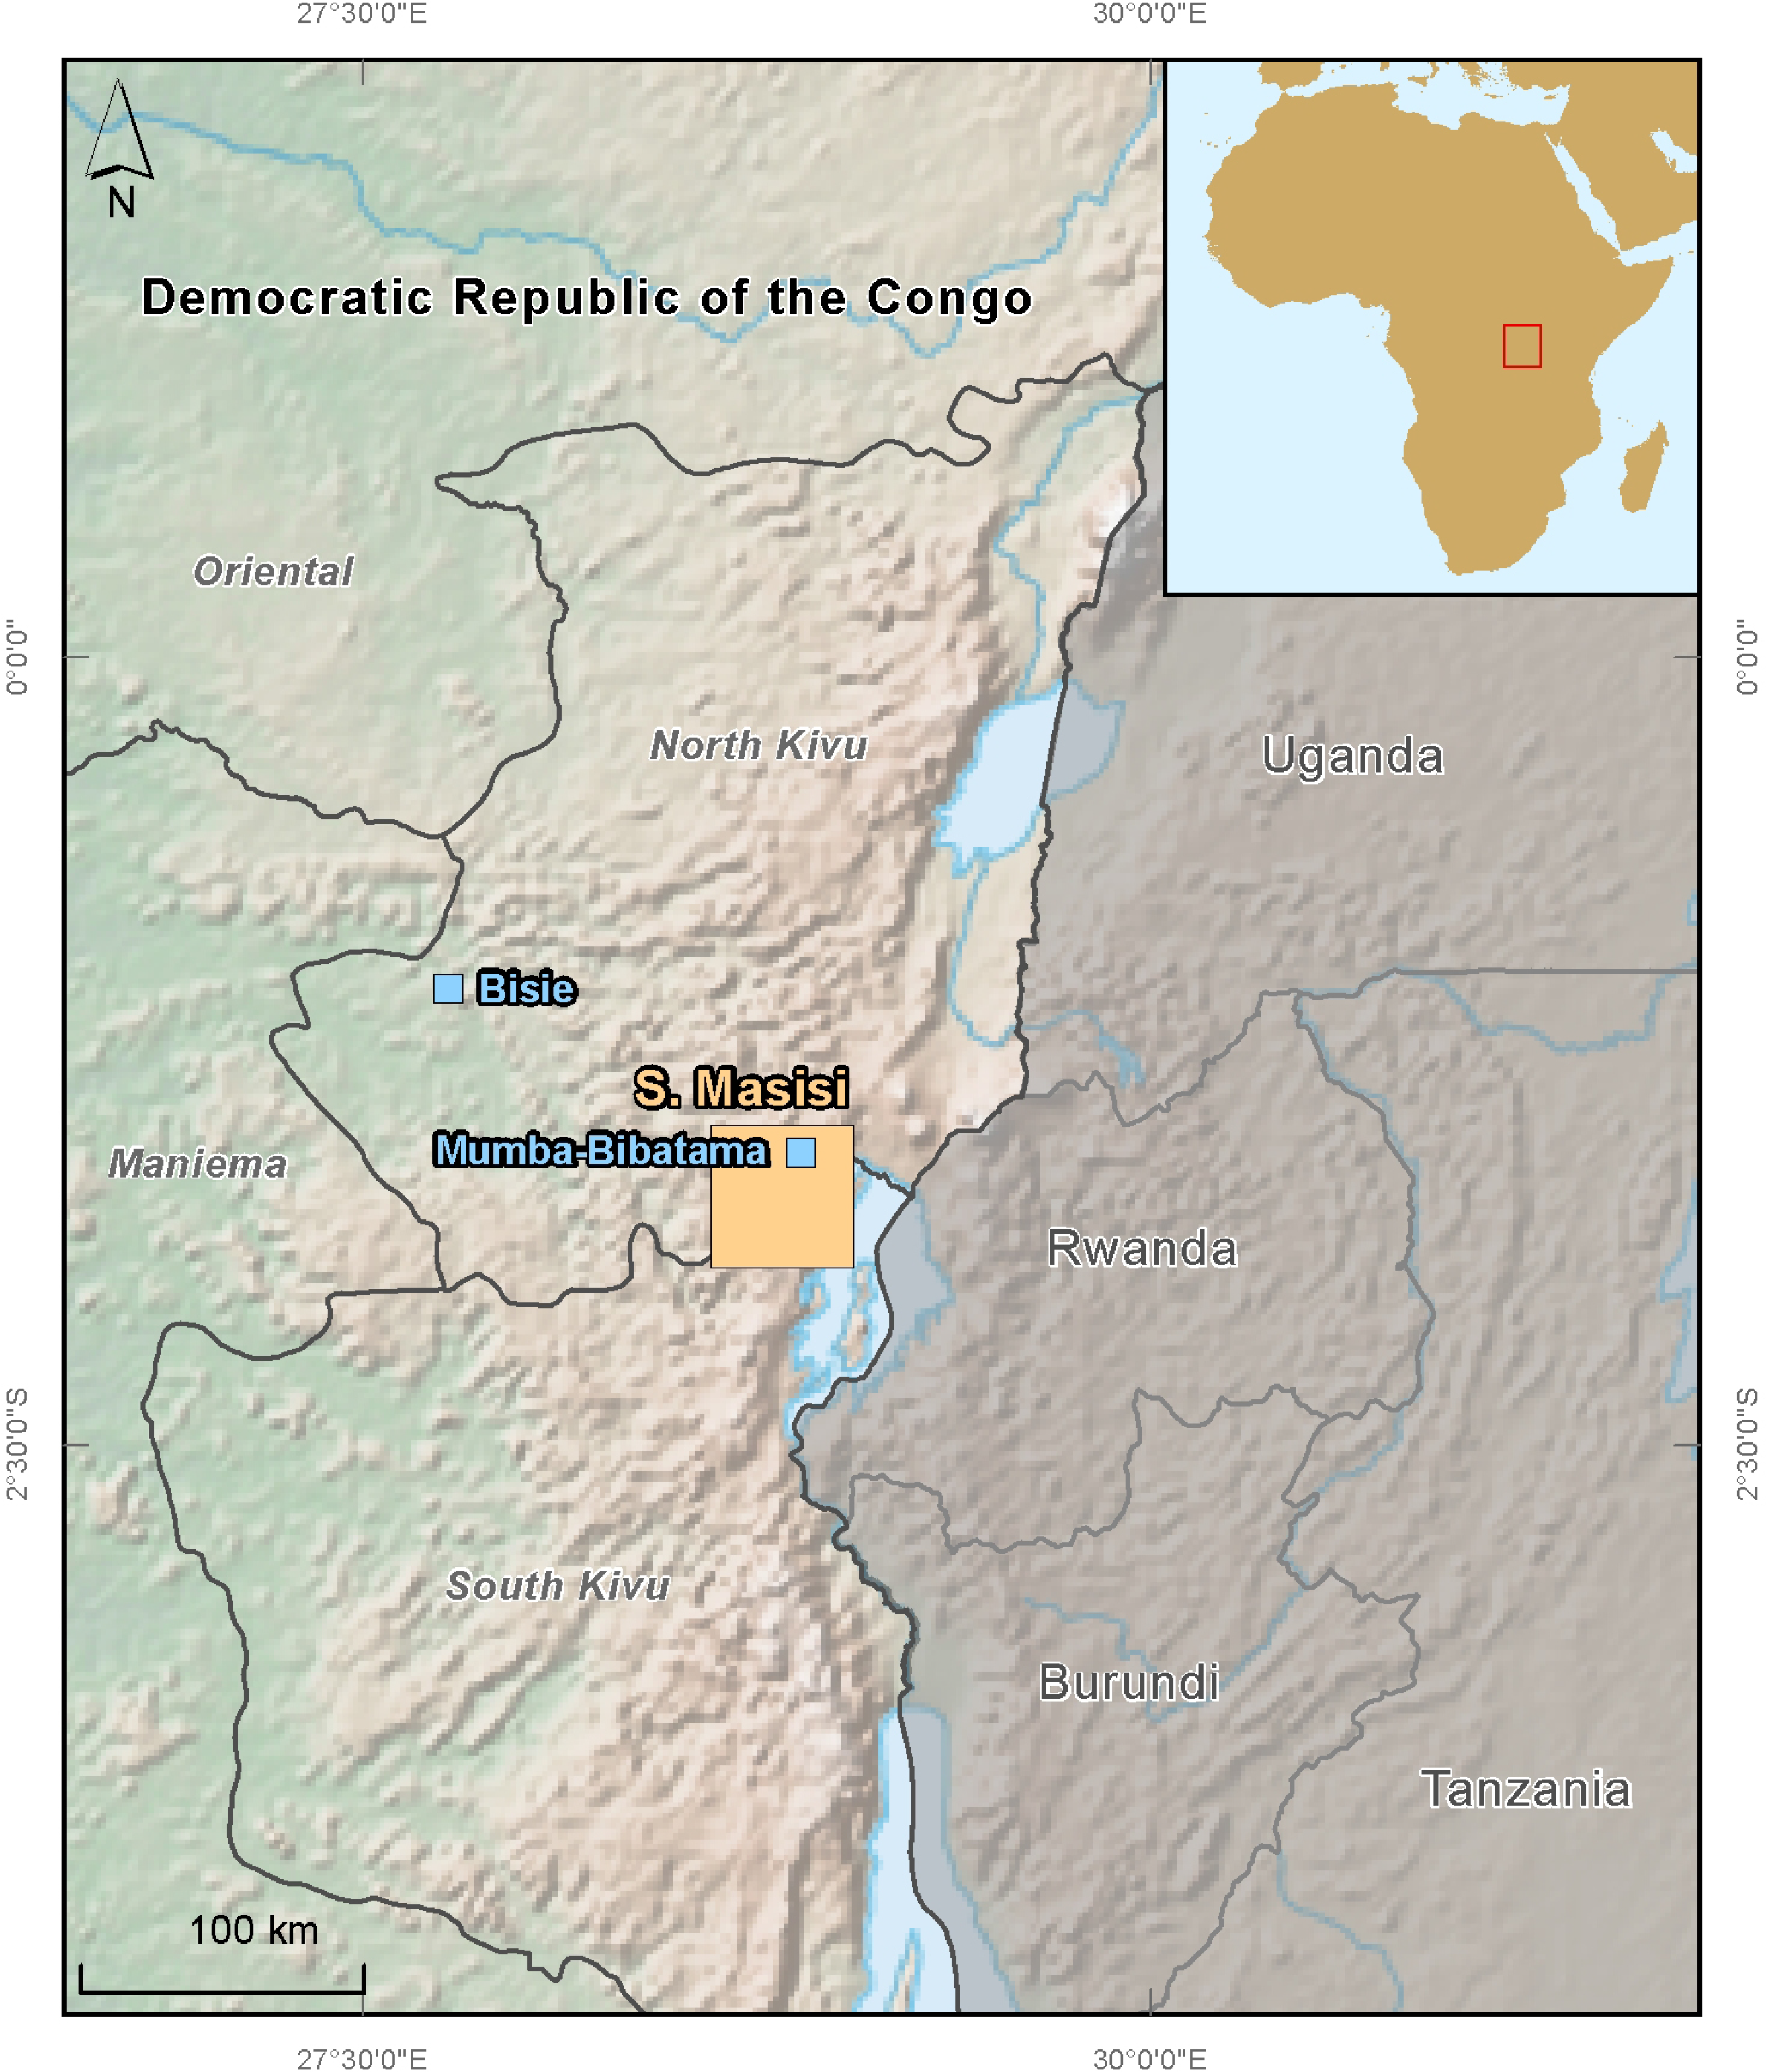
3. Study Area and Data
4. Methodology
4.1. Geographic Object-Based Image Analysis
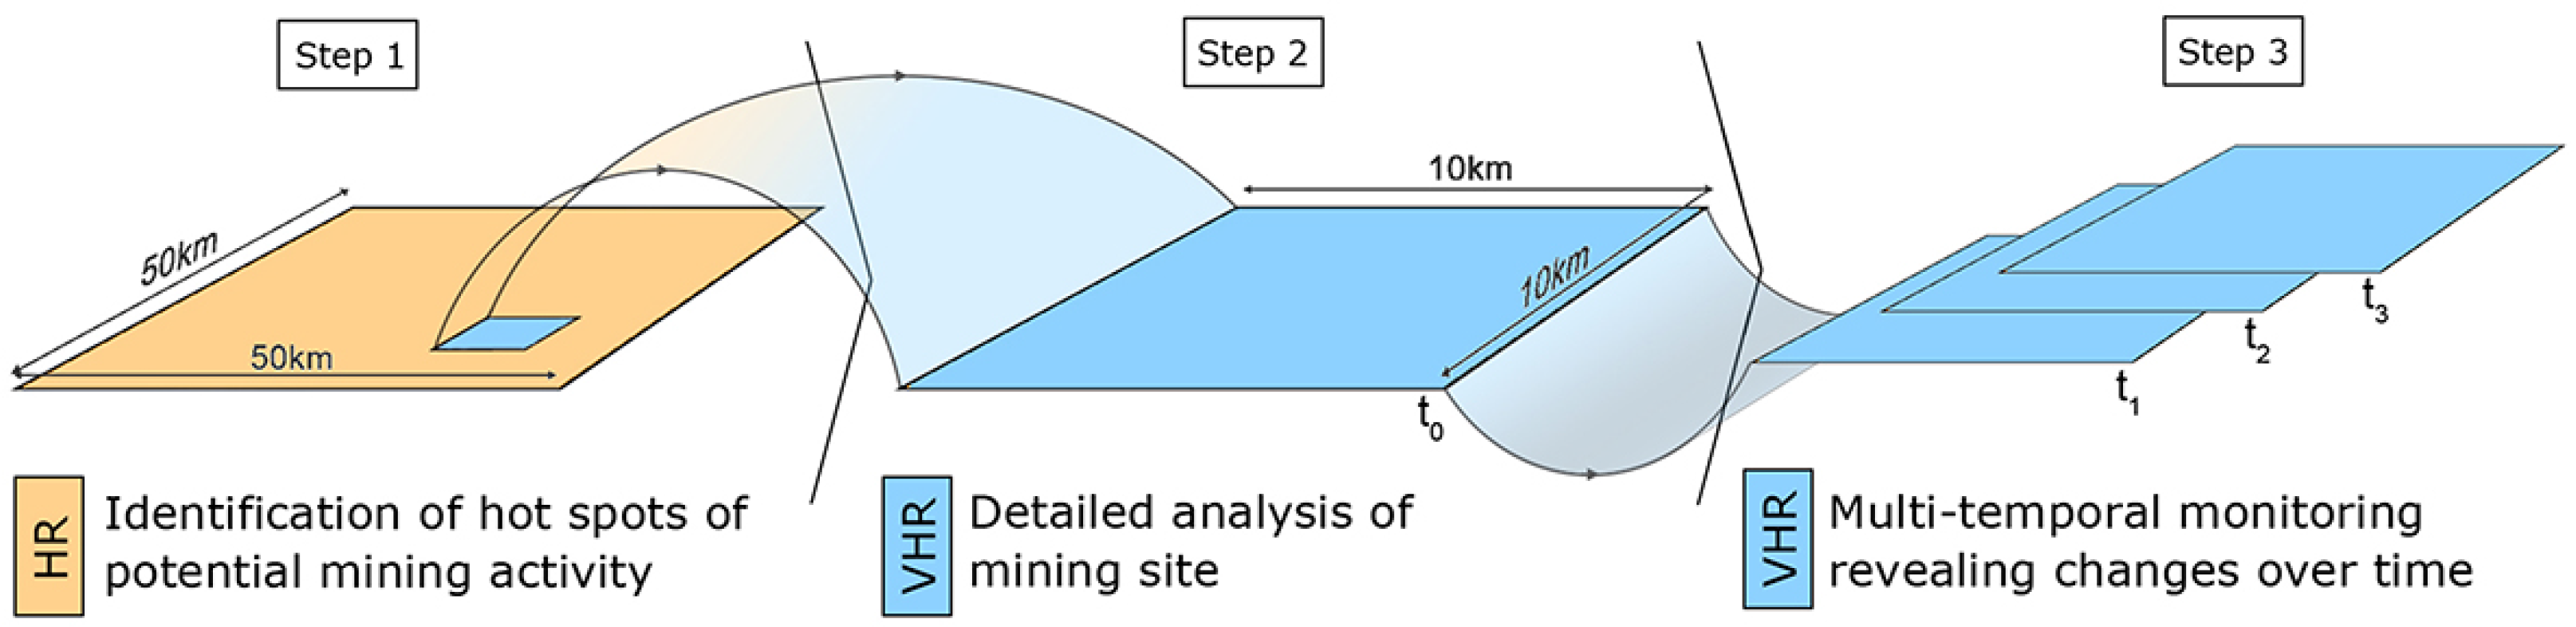
4.2. Workflow
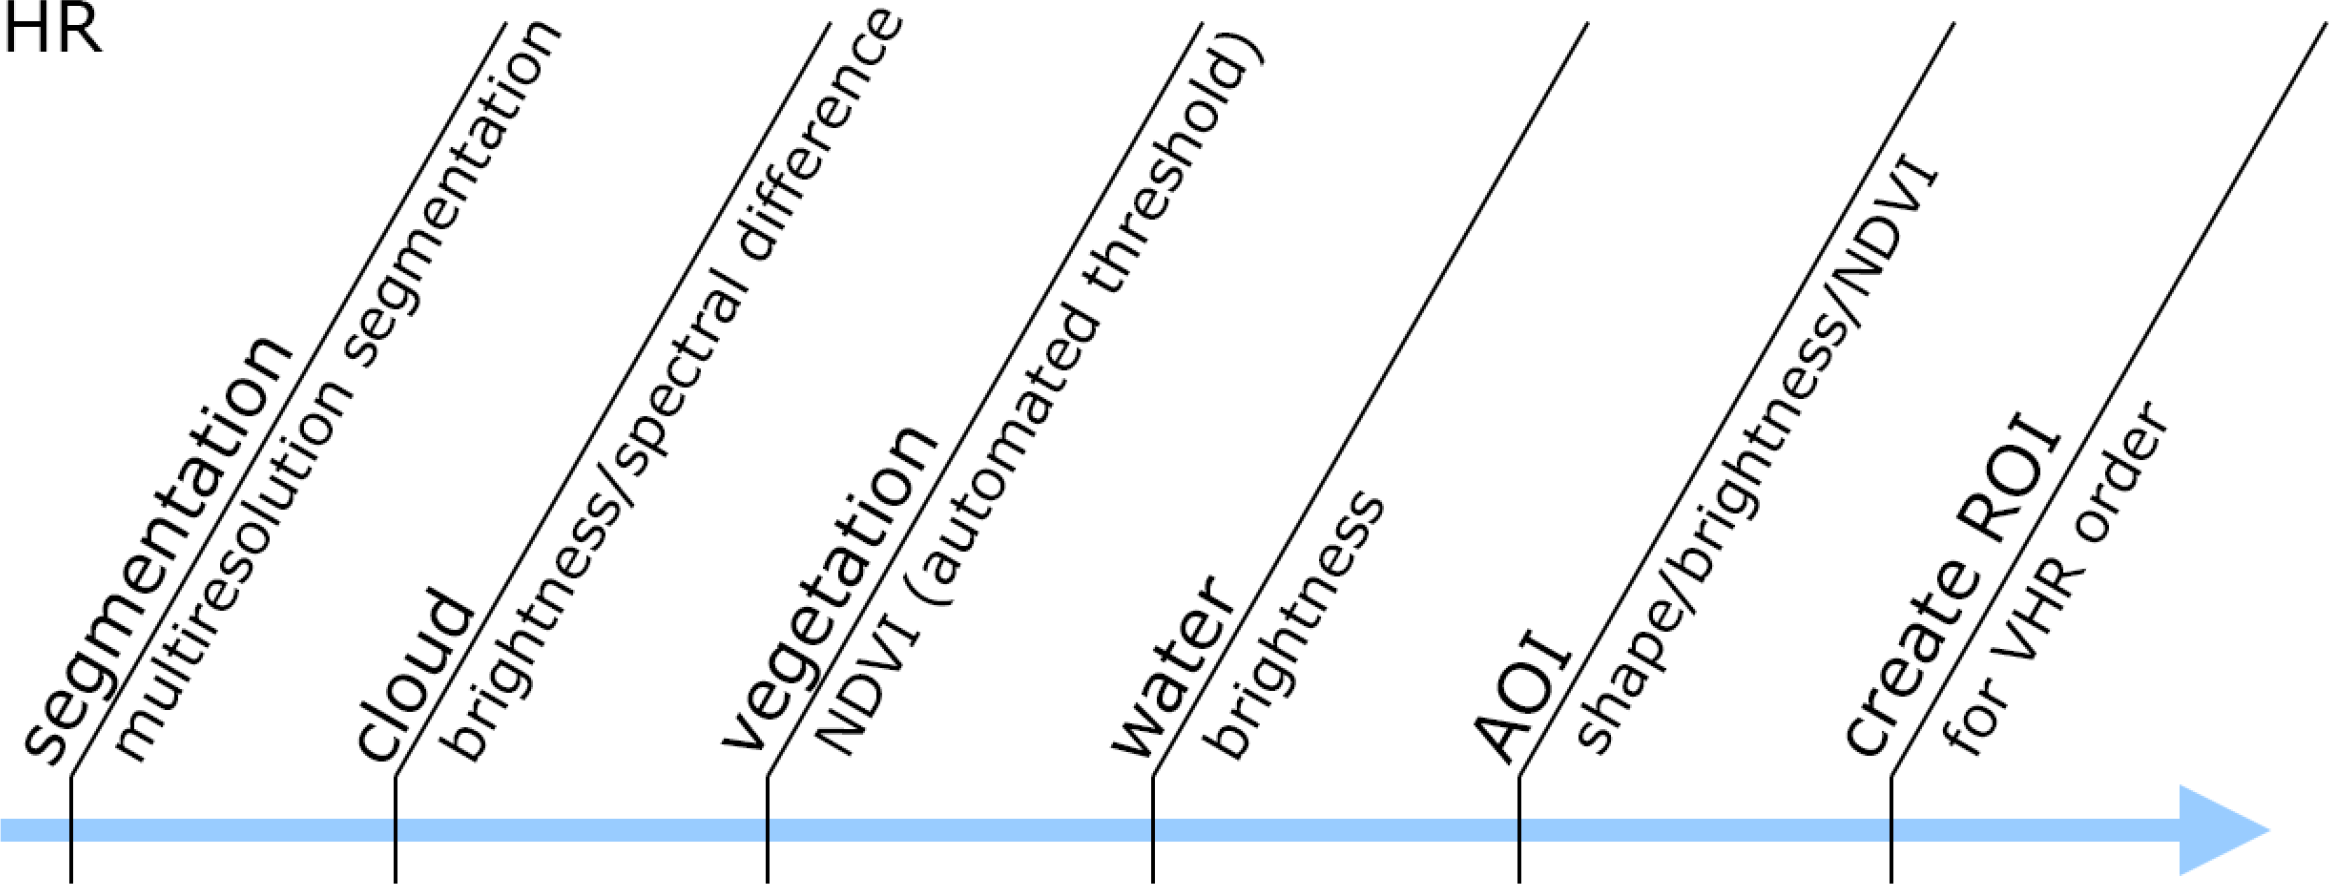
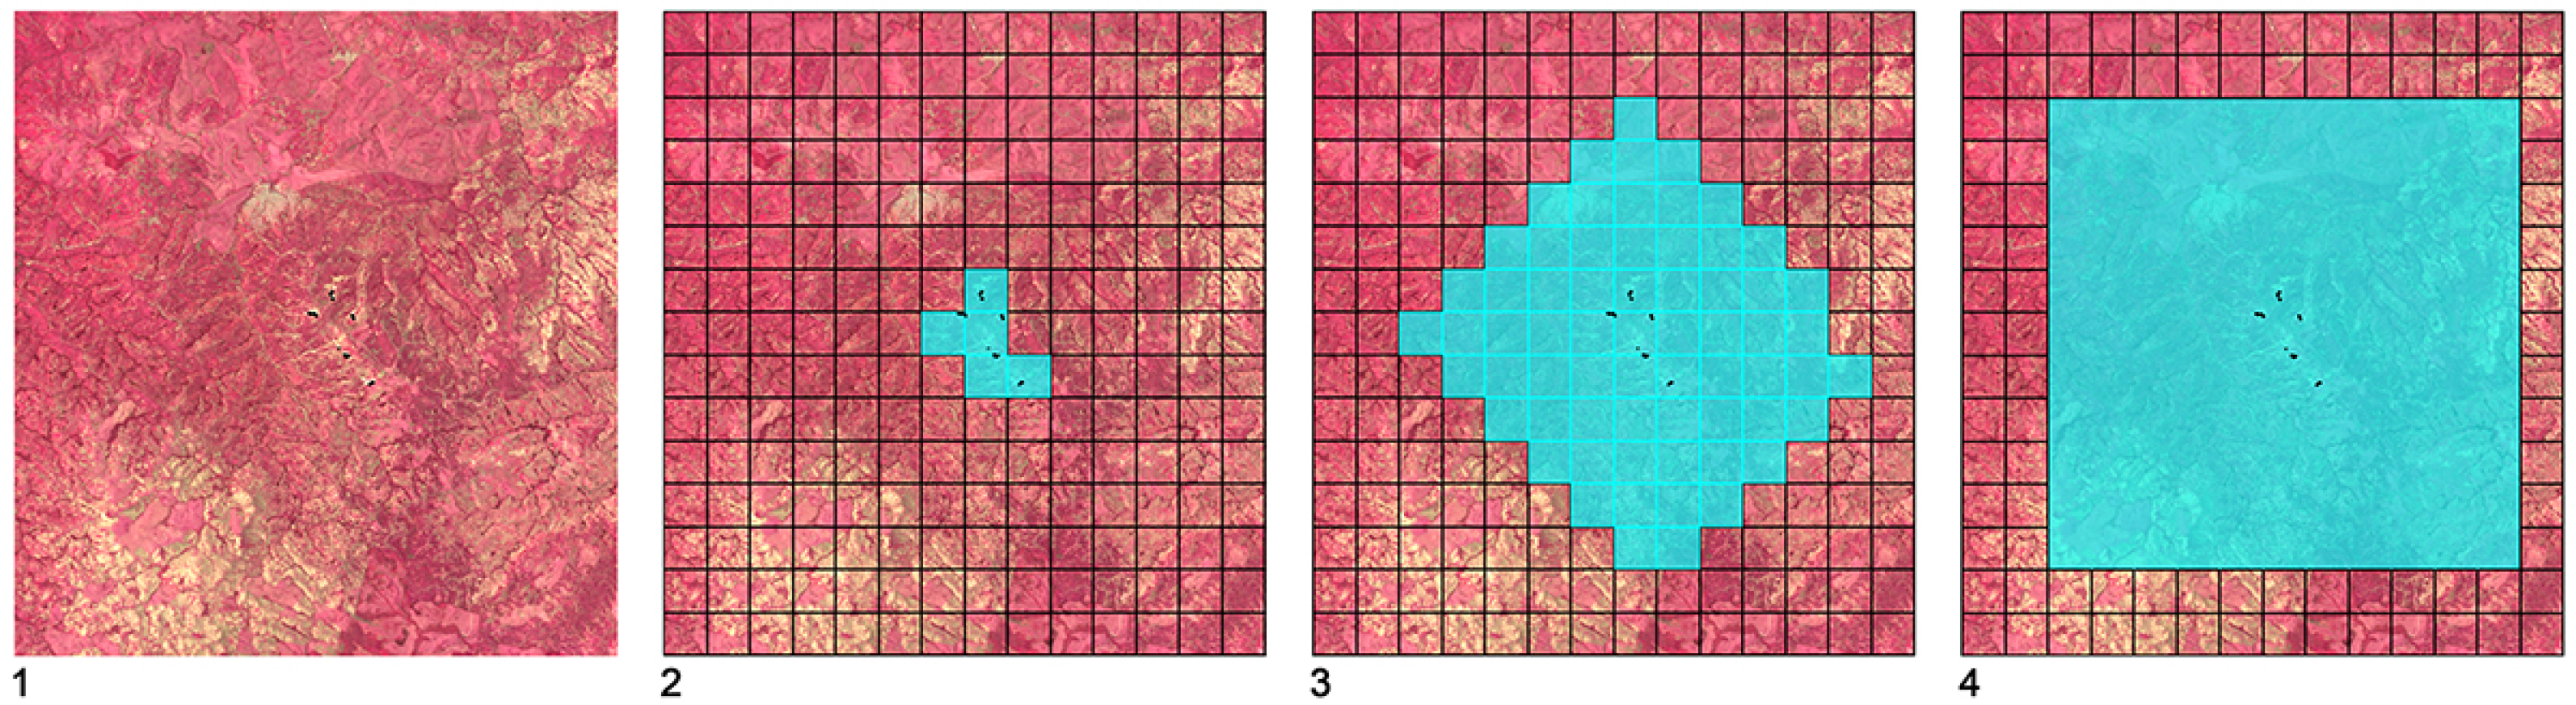
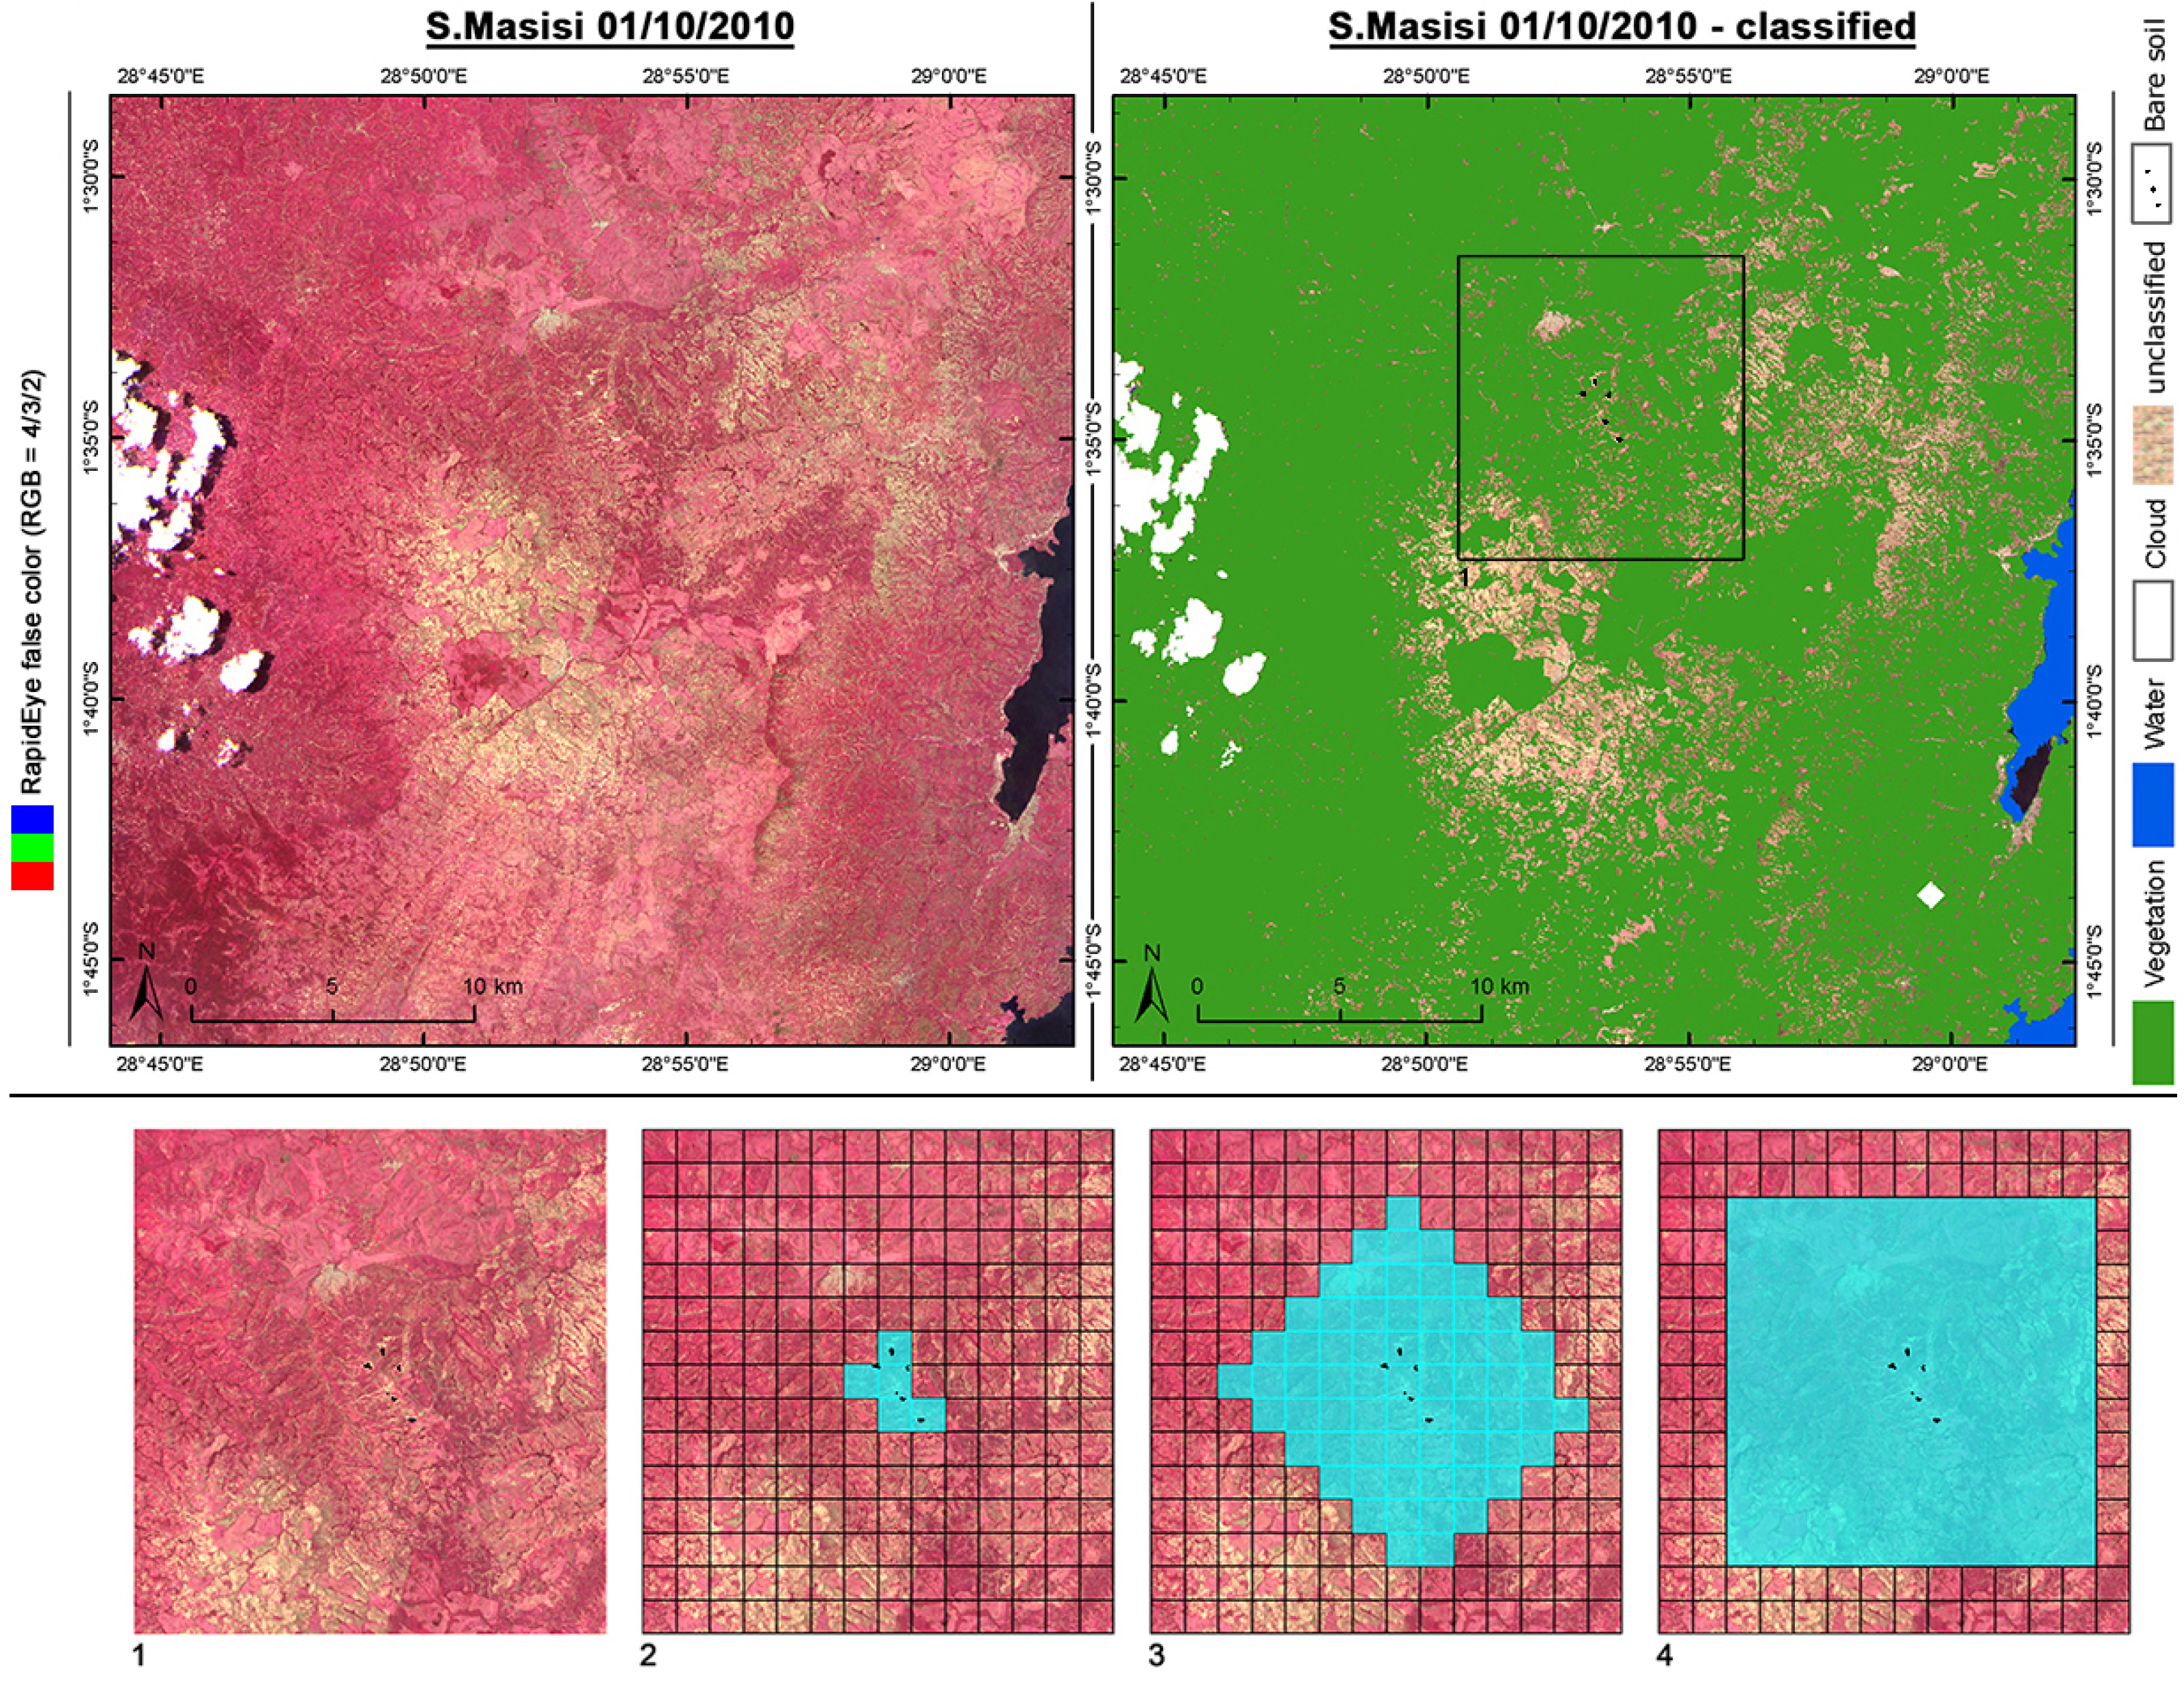
4.3. Identification of Hot Spots of Potential Mining Activity in Southern Masisi
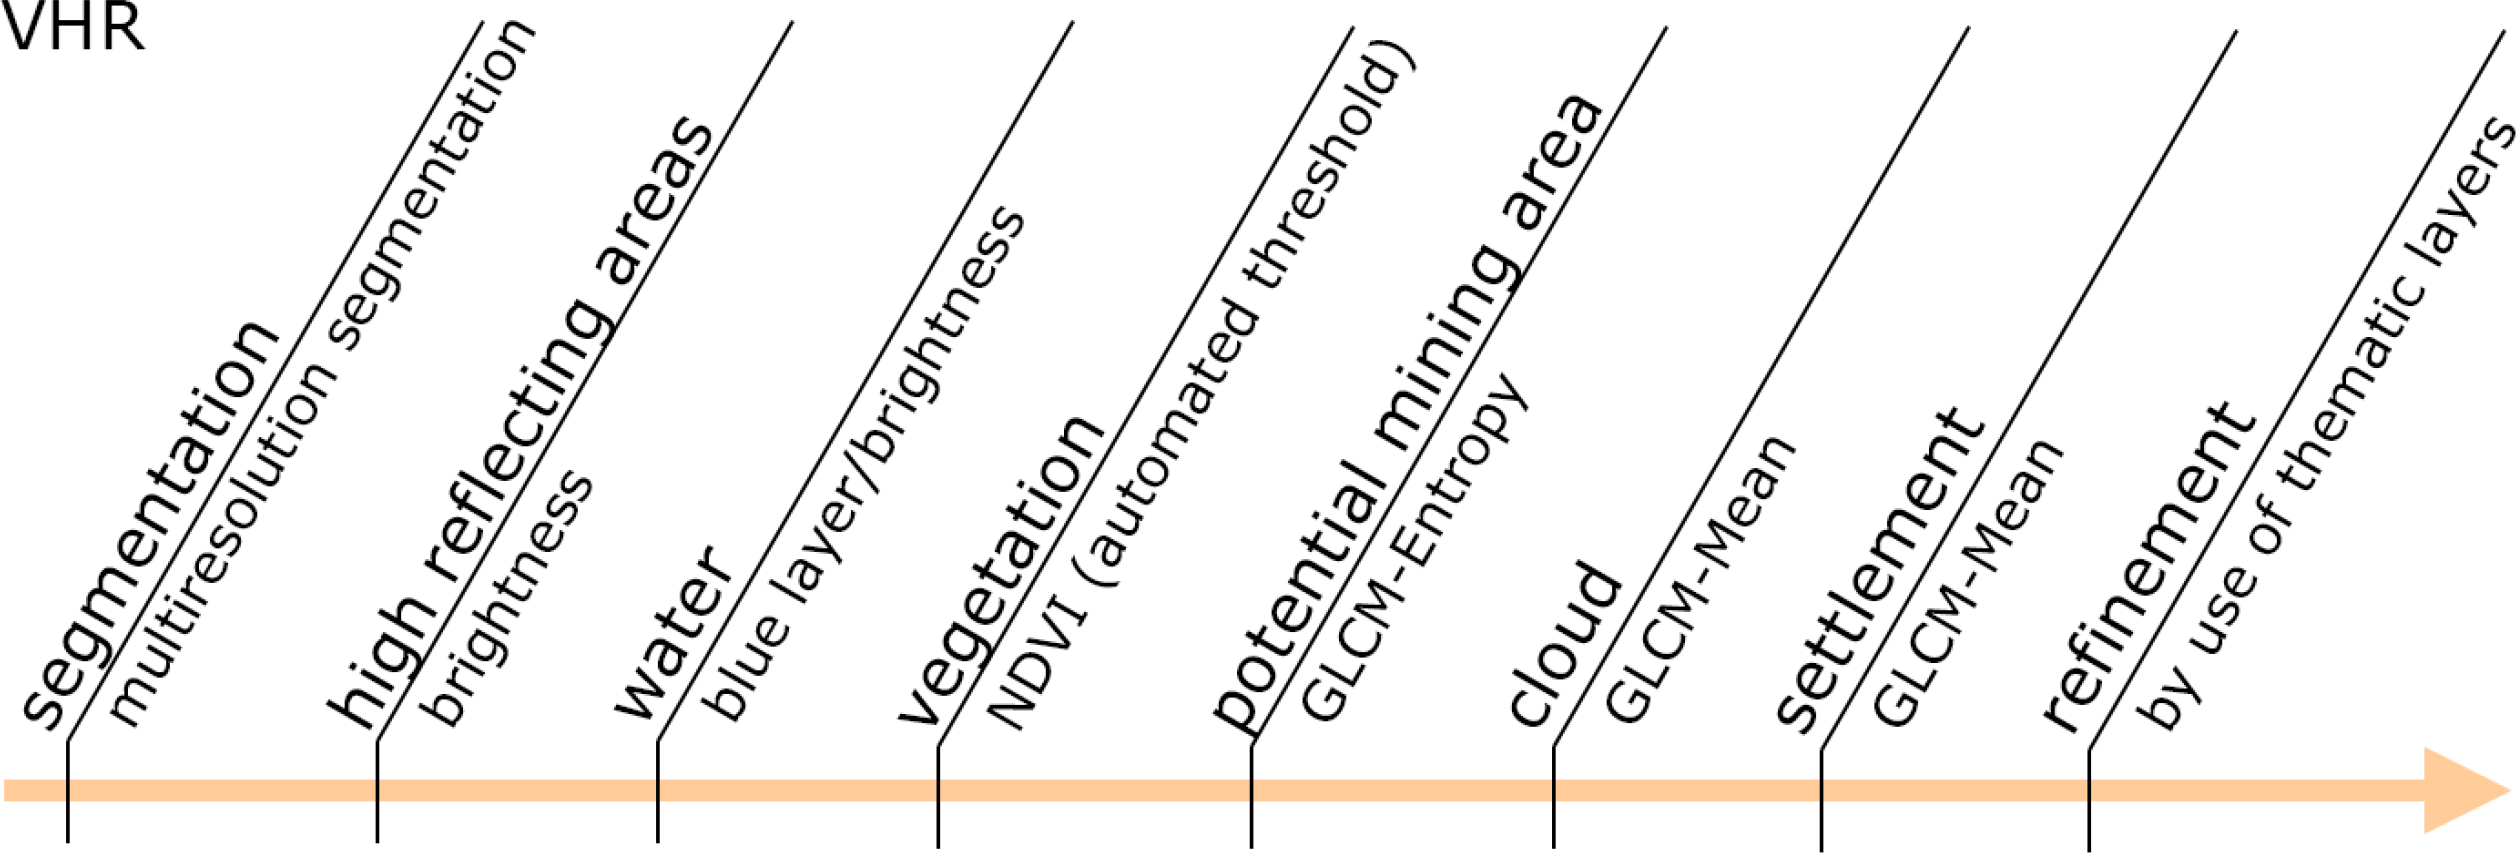
4.4. Detailed Analysis of Mining Sites
4.5. Multi-Temporal Monitoring
4.6. Accuracy Assessment
5. Results and Discussion
5.1. Results and Discussion for Identified Hot Spot Areas
5.2. Results and Discussion for the Detailed Analysis
5.3. Tracking Change over Time
5.4. Political Background Related to the Remote Sensing Results
6. Conclusion
Acknowledgments
Author Contributions
Conflicts of Interest
References
- Kahl, M.; Kantel, V.; Paes, W.C.; Schure, J.; Weller, E. Armer reicher Kontinent. Konfliktresourcen in Afrika; Technical Report; Bonn International Center for Conversion (BICC): Bonn, Germany, 2007. [Google Scholar]
- Johnson, D.; Kayser, C. Resource politics in sub-saharan Africa. In Hamburg African Studies; Basedau, M., Mehler, A., Eds.; Institut für Afrikakunde: Hamburg, Germany, 2005; Volume 14, pp. 145–172. [Google Scholar]
- Haken, N.; Messner, J.J.; Hendry, K.; Taft, P.; Lawrence, K.; Umaña, F. Failed State Index IX 2013; Technical Report; Found for Peace: Washington DC, USA, 2013. [Google Scholar]
- United Nations Development Program. Human Development Report 2011; Technical Report; United Nations Development Program (UNDP): New York, NY, USA, 2011. [Google Scholar]
- De Koning, R. Artisanal Mining and Postconflict Reconstruction in the Democratic Republic of the Congo; Stockholm International Peace Research Institute (SIPRI): Solna, Sweden, 2009. [Google Scholar]
- Oboth, C. The curse of Coltan: Conflict in the Kivus. In Proceedings of the National Conference on Undergraduate Research (NCUR), Ithaca College, NY, USA, 31 March–2 April 2011.
- GlobalWitness. Under-Mining Peace: Tin—The Explosive Trade in Cassiterite in Eastern DRC; Technical Report; Global Witness Publisher: Washington DC, USA, 2005. [Google Scholar]
- Spittaels, S.; Hilgert, F. Accompanying Note on the Interactive Map of Militarised Mining Areas in the Kivus; Technical Report; International Peace Information Service (IPIS): Antwerpen, Belgium, 2009. [Google Scholar]
- Hayes, K.; Burge, R. Coltan Mining in the Democratic Republic of Congo: How Tantalum-Using Industries Can Commit to the Reconstruction of the DRC; Fauna & Flora International: Cambridge, UK, 2003. [Google Scholar]
- Carpenter, L. Conflict Minerals in the Congo: Blood Minerals and Africas Under-Reported First World War; Technical Report; Suffolk University: Boston, MA, USA, 2012. [Google Scholar]
- Schoepfer, E.; Spröhnle, K.; Blaes, X.; Kemper, T. Monitoring Natural Resources in Conflict Areas: The Case of the Democratic Republic of the Congo; Technical Report; Copernicus Publications: Göttingen, Germany, 2012. [Google Scholar]
- Schoepfer, E.; Spröhnle, K.; Hilgert, F. Mapping “Conflict Minerals”: How G-MOSAIC Supports the International Peace Information Service; Technical Report; Copernicus Publications: Göttingen, Germany, 2012. [Google Scholar]
- Mildner, S.A.; Lauster, G.; Wodni, W. Scarcity and abundance revisited: A literature review on natural resources and conflict. Int. J. Confl. Violence 2011, 5, 155–172. [Google Scholar]
- Le Billon, P. Fuelling War: Natural Resources and Armed Conflicts; Number 373; Routledge: London, UK, 2013. [Google Scholar]
- Van Wyk, J.A. Space for peace? The use of space technology to monitor conflict trends and human security in Africa. Confl. Trends 2008, 4, 12–17. [Google Scholar]
- Wilson, S.A.; Wilson, C.O. Modelling the impacts of civil war on land use and land cover change within Kono District, Sierra Leone: A socio-geospatial approach. Geocarto Int 2013, 28, 476–501. [Google Scholar]
- Ernst, C.; Mayaux, P.; Verhegghen, A.; Bodart, C.; Christophe, M.; Defourny, P. National forest cover change in Congo Basin: Deforestation, reforestation, degradation and regeneration for the years 1990, 2000 and 2005. Glob. Chang. Biol 2013, 19, 1173–1187. [Google Scholar]
- Zhuravleva, I.; Turubanova, S.; Potapov, P.; Hansen, M.; Tyukavina, A.; Minnemeyer, S.; Laporte, N.; Goetz, S.; Verbelen, F.; Thies, C. Satellite-based primary forest degradation assessment in the Democratic Republic of the Congo, 2000–2010. Environ. Res. Lett 2013, 8, 1–13. [Google Scholar]
- Potapov, P.; Turubanova, S.; Hansen, M.C.; Adusei, B.; Broich, M.; Altstatt, A.; Mane, L.; Justice, C. Quantifying forest cover loss in Democratic Republic of the Congo, 2000–2010 with Landsat ETMC data. Remote Sens. Environ 2012, 122, 106–116. [Google Scholar]
- Schoepfer, E.; Kranz, O. Monitoring natural resources in conflict using an object-based multi-scale image analysis approach. In Proceedings of GEOBIA 2010, Ghent, Belgium, 29 June–2 July 2010; Addink, E., van Coillie, F., Eds.; XXXVIII-4/C7.
- GlobalWitness. Same Old Story: A Background Study on Natural Resources in the Democratic Republic of Congo; Technical Report; Global Witness Pub.: Washington DC, USA, 2004. [Google Scholar]
- Garrett, N. Walikale—Artisanal Cassiterite Mining and Trade in North Kivu—Implications for Poverty Reduction and Security; Communities and Small-scale Mining (CASM): London, UK, 2008. [Google Scholar]
- GlobalWitness. “Faced with a Gun, What Can You Do?”: War and the Militarisation of Mining in Eastern Congo; Technical Report; Global Witness Publisher: London, UK, 2009. [Google Scholar]
- International Peace Information Service. The Formalisation of Artisanal Mining in the Democratic Republic of the Congo and Rwanda; Technical Report; IPIS: Antwerpen, Belgium, 2012. [Google Scholar]
- Hayes, K.; Perks, R. Women in the artisanal and small-scale mining sector of the Democratic Republic of the Congo. In High-value Natural Resources and Post-Conflict Peacebuilding; Routledge: New York, NK, USA, 2012; pp. 529–544. [Google Scholar]
- Perks, R. Towards a Post-Conflict Transition: Woman and Artisanal Mining in the Democratic Republic of Congo; Technical Report; Australian National University: Canberra, Australian, 2011. [Google Scholar]
- Nadira, L. The resource curse revised: Conflict and Coltan in the Congo. Harv. Int. Rev 2007, 29, 34–38. [Google Scholar]
- United Nations Environment Program. Annual Report 2009; Technical Report; UNEP: Nairobi, Kenya, 2009. [Google Scholar]
- International Peace Information Service. Interactive Map of Militarised Mining Areas in the Kivus (August 2009); Technical Report; International Peace Information Service (IPIS): Antwerpen, Belgium, 2009. [Google Scholar]
- Spittaels, S.; Hilgert, F. Mapping Conflict Motives: Eastern DRC; Technical Report; International Peace Information Service (IPIS): Antwerpen, Belgium, 2008. [Google Scholar]
- Wimmer, S.Z.; Hilgert, F. Bisie. A One-Year Snapshot of the DRC’s Principal Cassiterite Mine; Technical Report; International Peace Information Service (IPIS): Antwerpen, Belgium, 2011. [Google Scholar]
- IPIS. Mining Concessions (CaMi, 31 December 2008). Technical Report, 2008. Available online: http://www.ipisresearch.be/maps/MiMiKi/Concessions/WEB/INDEX.HTML (accessed on 6 May 2014).
- Baregu, M. Understanding Obstacles to Peace: Actors, Interests, and Strategies in Africa’s Great Lakes Region; Technical Report; International Development Research Centre (IDRC): Kampala, Uganda, 2011. [Google Scholar]
- Krauß, T.; d’Angelo, P.; Schneider, M.; Gstaiger, V. The fully automatic optical processing system CATENA at DLR. In International Archives of the Photogrametry, Remote Sensing and Spatial Information Sciences; Heipke, C., Jacobsen, K., Rottensteiner, F., Sörgel, U., Eds.; International Society for Photogrametry and Remote Sensing (ISPRS): Hannover, Germany, 2013; pp. 177–181. [Google Scholar]
- Richter, R. Correction of atmospheric and topographic effects for high spatial resolution satellite imagery. Int. J. Remote Sens 1997, 18, 1099–1111. [Google Scholar]
- Lillesand, T.M.; Kiefer, R.W.; Chipman, J.W. Remote Sensing and Image Interpretation; John Wiley & Sons Ltd: Hoboken, NJ, USA, 2004. [Google Scholar]
- Schoepfer, E.; Kranz, O. Konfliktressourcen in der Demokratischen Republik Kongo—Objektbasierte multiskalare Analyse von Erdbeobachtungsdaten zur Erfassung von Minenstandorten. In Proceedings of the Angewandte Geoinformatik 2010–22, AGIT-Symposium, Salzburg, Austria, 7–9 July 2011; Strobl, J., Blaschke, T., Griesebner, G., Eds.; Wichmann Herbert: Heidelberg, Germany, 2010; pp. 911–916. [Google Scholar]
- Blaschke, T.; Strobl, J. What’s wrong with pixels? Some recent developments interfacing remote sensing and GIS. GeoBIT/GIS 2001, 6, 12–17. [Google Scholar]
- Blaschke, T. Object-based image analysis for remote sensing. ISPRS J. Photogramm. Remote Sens 2010, 65, 2–16. [Google Scholar]
- Blaschke, T.; Hay, G.J.; Kelly, M.; Lang, S.; Hofmann, P.; Addink, E.; Feitosa, R.Q.; van der Meer, F.; van der Werff, H.; van Coillie, F.; et al. Geographic Object-Based Image Analysis—Towards a new paradigm. ISPRS J. Photogramm. Remote Sens 2014, 87, 180–191. [Google Scholar]
- Benz, U.; Hofmann, P.; Willhauck, G.; Lingenfelder, I.; Heynen, M. Multi-resolution, object-oriented fuzzy analysis of remote sensing data for GIS-ready information. ISPRS J. Photogramm. Remote Sens 2004, 58, 239–258. [Google Scholar]
- Neubert, M.; Herold, H.; Meinel, G. Assessing image segmentation quality—Concepts, methods and application. In Object-Based Image Analysis; Springer Verlag: Berlin/Heidelberg, Germany, 2008; pp. 769–784. [Google Scholar]
- Baatz, M.; Schäpe, A. Multiresolution segmentation: An optimization approach for high quality multi-scale image segmentation. In Angewandte Geographische Informationsverarbeitung XII; Herbert Wichmann Verlag: Heidelberg, Germany, 2000; pp. 12–23. [Google Scholar]
- Blaschke, T.; Lang, S. Object-based image analysis for automated information extraction—A synthesis. In Proceedings of the Measuring the Earth II ASPRS Fall Conference, San Antonio, TX, USA, 6–10 November 2006; pp. 6–10.
- Blaschke, T.; Lang, S.; Hay, G.J. Object-Based Image Analysis; Springer Verlag: Berlin/Heidelberg, Germany, 2008. [Google Scholar]
- Hay, G.J.; Castilla, G. Geographic Object-Based Image Analysis (GEOBIA): A new name for a new discipline. In Object-Based Image Analysis; Springer Verlag: Berlin/Heidelberg, Germany, 2008; pp. 75–89. [Google Scholar]
- Lang, S. Object-based image analysis for remote sensing applications: Modeling reality–dealing with complexity. In Object-Based Image Analysis; Springer Verlag: Berlin/Heidelberg, Germany, 2008; pp. 3–27. [Google Scholar]
- Luethje, F. Object-Based Image Analysis Using Optical Satellite Imagery and GIS Data for the Detection of Mining Sites in the Democratic Republic of the Congo, University of Heidelberg, Heidelberg, Germany, 2011.
- Tiede, D.; Lang, S.; Hoffmann, C. Type-specific class modelling for one-level representation of single trees. In Object-Based Image Analysis; Blaschke, T., Lang, S., Hay, G., Eds.; Springer Verlag: Berlin/Heidelberg, Germany, 2008; pp. 133–151. [Google Scholar]
- Haralick, R.M.; Shanmugam, K.; Dinstein, I.H. Textural features for image classification. IEEE Trans. Syst. Man Cybern 1973, 610–621. [Google Scholar]
- Lu, D.; Mausel, P.; Brondizio, E.; Moran, E. Change detection techniques. Int. J. Remote Sens 2004, 25, 2365–2401. [Google Scholar]
- Coppin, P.; Jonckheere, I.; Nackaerts, K.; Muys, B.; Lambin, E. Digital change detection methods in ecosystem monitoring: A review. Int. J. Remote Sens 2004, 25, 1565–1596. [Google Scholar]
- Kennedy, R.; Townsend, P.; Gross, J.; Cohen, W.; Bolstad, P.; Wang, Y.; Adams, P. Remote sensing change detection tools for natural resource managers: Understanding concepts and tradeoffs in the design of landscape monitoring projects. Remote Sens. Environ 2009, 113, 1382–1396. [Google Scholar]
- Hussain, M.; Chen, D.; Chenga, A.; Weib, H.; Stanley, D. Change detection from remotely sensed images: From pixel-based to object-based approaches. ISPRS J. Photogramm. Remote Sens 2013, 80, 91–106. [Google Scholar]
- Congalton, R. A review of assessing the accuracy of classifications of remotely sensed data. Remote Sens. Environ 1991, 37, 35–46. [Google Scholar]
- Congalton, R.; Green, K. Assessing the Accuracy of Remotely Sensed Data: Principles and Practices 2009, 2nd ed.; CRC Press/Taylor & Francis: Boca Raton, FL, USA, 2009; p. 183. [Google Scholar]
- De Koning, R. Conflict Minerals in the Democratic Republic of the Congo: Aligning tRade and Security Interventions; Stockholm International Peace Research Institute (SIPRI): Solna, Sweden, 2011. [Google Scholar]
- Prendergast, J.; Bafilemba, F.; Benner, A. Why a Certification Process for Conflict Minerals Is Urgent. A View from North Kivu; Technical Report; The Enough Project: Washington DC, USA, 2011. [Google Scholar]
- Bafilemba, F. Behind the Ban—An Update from Congo (Field Dispatch). Technical Report, 2014. Available online: http://www.enoughproject.org/publications/field-dispatch-behind-ban-update-congo (accessed on 21 January 2014).
- Verbruggen, D.; Francq, E.; Cuvelier, J. Guide to Current Mining Reform Initiatives in Eastern DRC; Technical Report; International Peace Information Service (IPIS): Antwerpen, Belgium, 2011. [Google Scholar]
- British Broadcasting Corporation DR Congo Lifts Ban on Mining Gold, Tin and Coltan. Technical Report, 2011. Available online: http://www.bbc.co.uk/news/world-africa-12700898 (accessed on 10 March 2014).
- Dunnebacke, A. Congolese Mining Ban Fails to End Armed Control of Trade. Technical Report, Global Witness, 2011. Available online: http://www.globalwitness.org/library/congolese-mining-ban-fails-end-armed-control-trade (accessed on 10 March 2014).


| Location | Satellite | Aqcuisition Date (day/month/year) | Resolution (m pansharpened) | Extent (km) |
|---|---|---|---|---|
| Southern Masisi | RapidEye | 1 October 2010 | 6.5 | 50 × 50 |
| Bisie | GeoEye-1 | 2 April 2010 | 0.5 | 10 × 10 |
| GeoEye-1 | 8 September 2010 | 0.5 | 10 × 10 | |
| IKONOS | 10 March 2011 | 1 | 10 × 10 | |
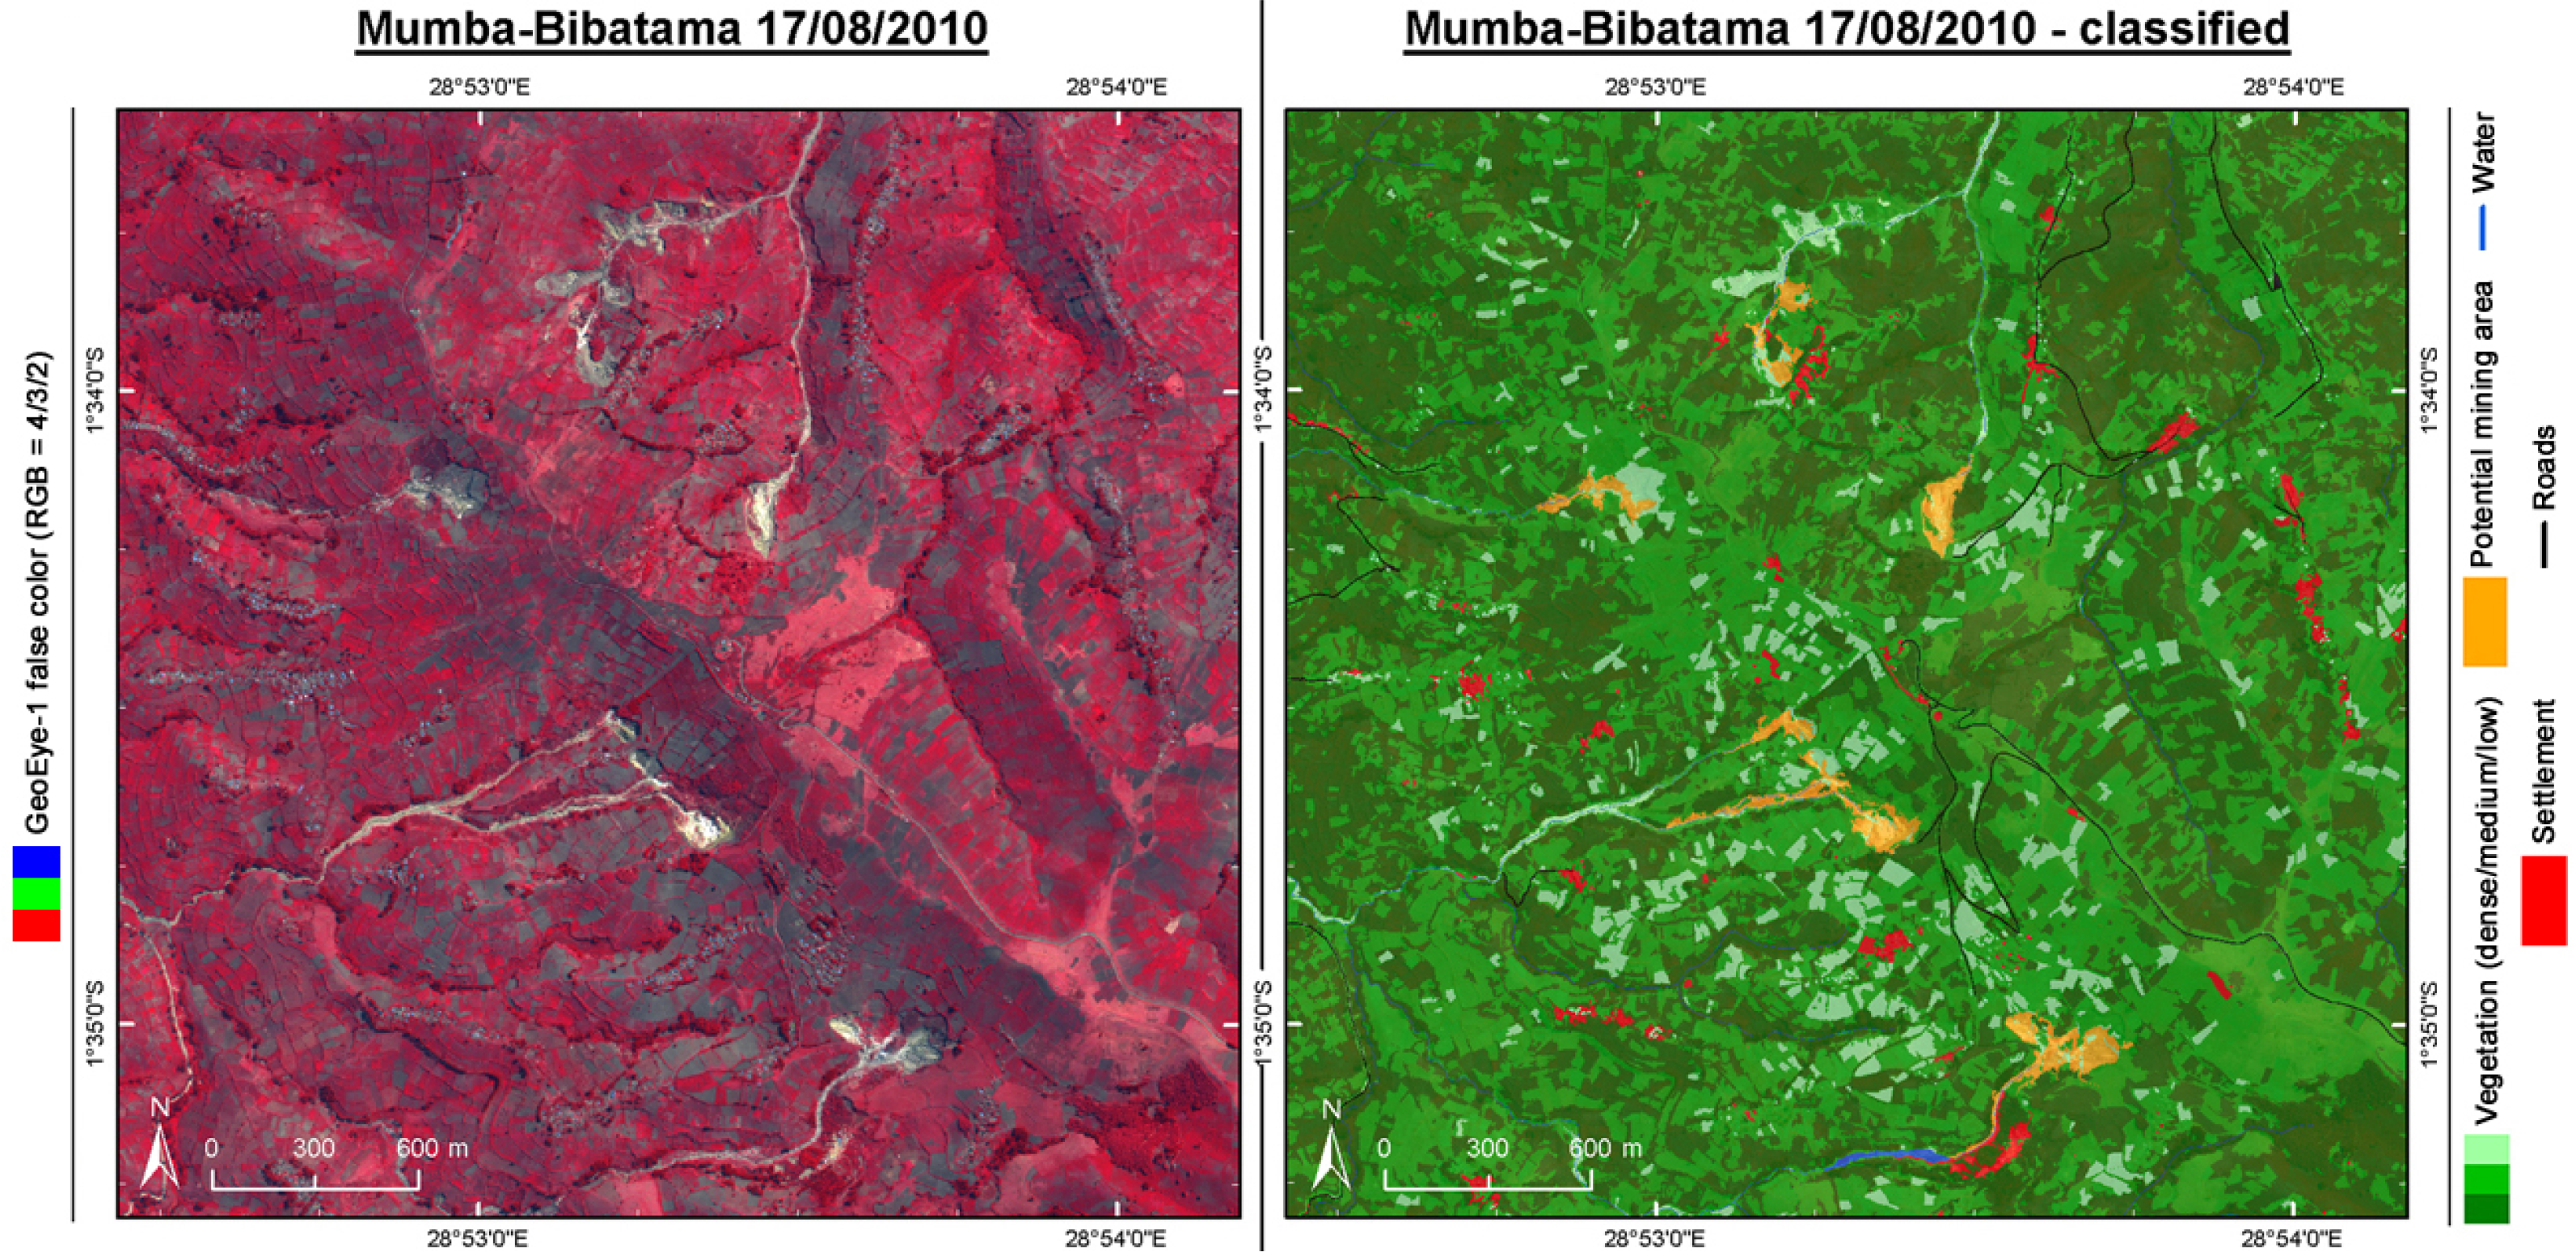
| Mumba-Bibatama | GeoEye-1 | 17 August 2010 | 0.5 | 10 × 10 |
| Class | Value Range | Arithmetic Expression |
|---|---|---|
| high reflecting areas | Maximum-var | GLCM-Entropy-MAX >= x > GLCM-Entropy-var% |
| cloud | Maximum-var | GLCM-Mean-MAX >= x > GLCM-Mean-var% |
| Location | Acquisition Date (day/month/year) | Samples Classified (n) | Samples Unclassified (n) | Producers Accuracy | Users Accuracy | Overall Accuracy (%) |
|---|---|---|---|---|---|---|
| Southern Masisi | 1 October 2010 | 25 | 2 | 0.926 | 1 | 92.6 |
| Bisie | 2 April 2010 | 93 | 7 | 0.93 | 1 | 93 |
| 8 September 2010 | 94 | 6 | 0.94 | 1 | 94 | |
| 10 March 2011 | 91 | 9 | 0.91 | 1 | 91 | |
| Mumba-Bibatama | 17 August 2010 | 93 | 7 | 0.93 | 1 | 93 |
© 2014 by the authors; licensee MDPI, Basel, Switzerland This article is an open access article distributed under the terms and conditions of the Creative Commons Attribution license (http://creativecommons.org/licenses/by/3.0/).
Share and Cite
Luethje, F.; Kranz, O.; Schoepfer, E. Geographic Object-Based Image Analysis Using Optical Satellite Imagery and GIS Data for the Detection of Mining Sites in the Democratic Republic of the Congo. Remote Sens. 2014, 6, 6636-6661. https://doi.org/10.3390/rs6076636
Luethje F, Kranz O, Schoepfer E. Geographic Object-Based Image Analysis Using Optical Satellite Imagery and GIS Data for the Detection of Mining Sites in the Democratic Republic of the Congo. Remote Sensing. 2014; 6(7):6636-6661. https://doi.org/10.3390/rs6076636
Chicago/Turabian StyleLuethje, Fritjof, Olaf Kranz, and Elisabeth Schoepfer. 2014. "Geographic Object-Based Image Analysis Using Optical Satellite Imagery and GIS Data for the Detection of Mining Sites in the Democratic Republic of the Congo" Remote Sensing 6, no. 7: 6636-6661. https://doi.org/10.3390/rs6076636