1. Introduction
The geomorphological changes of areas affected by crustal deformation, eruptive events, gravitative instabilities, landslide and glacier evolution and other phenomena can be detected and quantified by means of the comparison between multi-temporal models providing a space-time description of geophysical processes [
1–
6]. Several techniques, including global positioning system (GPS) static and kinematic methodology [
7], digital aerial and terrestrial photogrammetry [
8], airborne and terrestrial laser scanning [
9], satellite-based and ground-based interferometric radar [
10] and optical satellite imagery systems [
11], are suitable surveying methods that provide appropriate spatial resolution.
Digital aerial photogrammetry allows one to extract high resolution Digital Terrain Models (DTMs) using automatic or semi-automatic procedures based on well-defined shape comparison methodologies or on the grey/color level. Photogrammetric surveys performed in different periods over a deformation area allowed the reconstruction of the 3D movements by the comparison of each extracted DTMs and/or the coordinates of the same natural or artificial points distributed in the study area and recognized on multi-temporal stereoscopic images; in this case, 3D displacement vectors of ground points can be generated. Moreover, models acquired at high resolution and precision repeatedly over an area undergoing significant morphological changes can be used to estimate the mass movements [
12–
14].
The terrestrial laser scanning (TLS) allows an accurate (subcentimeter precision at 100 m acquisition distance) and cost-effective representation of the topographical details of the observed surface and is currently used in geologic surveys, engineering practice, cultural heritage and mobile mapping [
15]. Multi-temporal TLS data of an unstable slope can be used to compute the corresponding surface displacement and strain field [
16]. Besides the geometric data, the point cloud provided by a TLS observation contains radiometric information,
i.e., the intensity of the received pulses, which can be used for classification purposes [
17]. Moreover, some instruments are equipped with a calibrated camera to add RGB color data to the intensity data. The surfaces acquired in a geological/geophysical TLS survey generally are irregular at the scale of the spot size (some cm for 100 m observation distance). This fact implies that the intensity of the backscattered signal is almost constant if the incidence angle varies and that the probability of a returned pulse having enough power to allow the detection is high for a wide spectrum of incidence angles. Therefore, a point on the surface can be observed also in bad geometrical conditions, even if the spot spreading leads to a worsen precision for high incidence angles.
The TLS and other remote sensing techniques, like digital photogrammetry, can be integrated to profit from the strength of each single technique and overcome the corresponding weakness, leading to a better modeling of the observed system [
18].
A static GNSS (Global Navigation Satellite System) measurement is able to provide highly accurate estimations of the coordinates of the measured points (later on, the term GPS is used instead of GNSS because only satellites belonging to the NAVSTAR GPS constellation have been used to obtain the results discussed here). For this reason, such a technique is widely used in monitoring of slow or fast ground surface deformations of the Earth’s crust to study motions at different scales, from the scale of regional tectonics (hundred km) to the scale of a landslide (hundred m). A continuous GPS station (CGPS) can provide position data with submillimeter precision. A geodetic network generally has some CGPSs and several episodic GPS stations (EGPSs), which operate for short periods of time, ranging from a few hours to a few months. The cost of an EGPS is very much lower than the CGPS one, and thanks to this fact, the required spatial resolution of the network can be reached with reasonable financial resources. Nevertheless, the EGPS precision is worse than the CGPS, one and reliable uncertainties must be estimated on the basis of the survey duration and distribution in the time, as well as taking into account antenna repositioning errors [
19].
In this paper, the results from the integration of digital photogrammetry, TLS and GPS data are provided in the frame of monitoring the more recent surface variations of a steep slope in Vulcano Island.
2. The Case Study: Vulcano Island
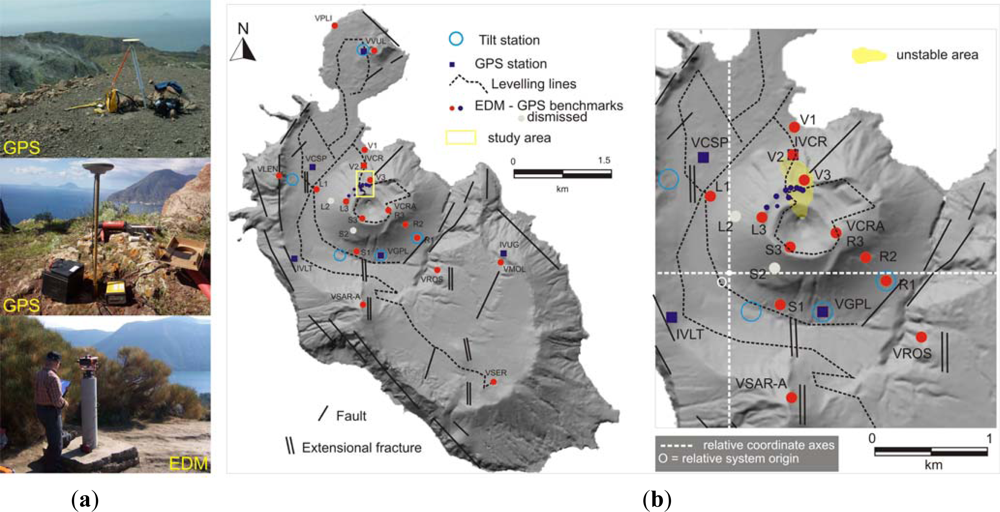
The island of Vulcano (
Figure 1) is a composite volcanic edifice located in the south-central sector of the Aeolian Archipelago (Tyrrhenian Sea, Italy), representing the southern half of the Lipari-Vulcano Volcanic Complex, that is, a NNW-SSE elongated volcanic ridge located along the off-shore prolongation of the Tindari-Letojanni fault system (TL). This tectonic lineament is affected by right-lateral transtensive motion on-shore, while it shows transpressive kinematics at Vulcano and Lipari islands, moving in response to a roughly NE regional extension field and an orthogonal contraction that is dominant at Vulcano [
20–
22]. Also seismic profiles highlight a compressive structure (anticline) in the area south of Vulcano, along the same direction of the TL system.
Figure 1 shows Vulcano N-S and NE-SW striking normal faults, which are tension fractures associated with the main NNW-SSE shear zone. The primary volcanic structures (dikes, vents and eruptive fissures) are aligned along these directions [
23]. A recent detailed analysis of local seismicity also highlights a similar NE-SW oriented seismogenic source located beneath the northernmost part of Vulcano at a 3–8 km depth [
24]. Eruptive activity of Vulcano has been characterized by a SSE to NNW migration of the eruptive centers: the primordial Vulcano (120–100 ka), the Lentia complex (28–13 ka), La Fossa cone (6 ka to 1888–1890 A.D.) and Vulcanello (183 B.C. to 1550 A.D.) [
25]. Historical eruptions on the island have taken place at Vulcanello and La Fossa cone (391 m a.s.l.), with volcanic products consisting mainly of pyroclastic material with lesser volumes of lava flow.
At present, volcanic activity is restricted to fumarolic degassing, mainly at the northern rim of La Fossa cone, with maximum temperatures generally ranging between 200 °C and 300 °C. La Fossa is also characterized by the occurrence of periodical anomalous degassing episodes with increasing temperature and output of the fumaroles more than by chemical changes (see e.g., [
26]). In particular, between 1970 and 1990, La Fossa’s fumarolic field showed increased temperatures at fumaroles vents and gas output, as well as by chemical changes in the gases emitted by the fumaroles and in sampled thermal waters [
27,
28]. During this period, also several new fractures opened along the crater rim [
29]. Increased fumarolic activity and temperature and ground fracturing resulted in enhanced slope instability, causing part of the northeastern sector (a volume of ∼2 × 10
5 m
3) to slide into the sea on 20 April 1988 [
30]. Although vent temperatures have generally been declining since the mid-1990s, the fumarolic system is still active and undergoes changes in vent temperature, location and gas output [
31–
34].
The ground deformation at Vulcano is currently monitored by GPS, electro-optical distance measurements (EDM) and leveling campaigns and by continuous tilt and GPS. EDM and leveling measurements began at the end of 1970s, and since 1997, the EDM benchmarks have been surveyed by GPS. In the late 1980s, continuous ground deformation monitoring based on tilt stations started. The network was expanded with five stations after 1994, to improve the areal coverage of Vulcano, and have a high signal-to-noise ratio. A network with three CGPSs was installed on Vulcano Island in 1995. Furthermore, this network was recently enriched by means of three further CGPSs.
More recent studies [
35,
36] pointed out critical zones of La Fossa crater rim characterized by potential landslide hazard, since they are located above an unstable portion of the northern volcano flank (
Figure 1). The northern section of the crater is just above Vulcano’s harbor and main village; an accurate check of surface variation, therefore, is required. The fact that such a crater section involves the steepest slopes, where no direct geodetic measurements are possible, should be noted. This fact suggests the use of remote sensing techniques to monitor possible motions of the flank, as well as an analysis of stability of the involved rock mass. This paper describes the more recent results obtained by integration of geodetic (GPS) and terrestrial remote sensing data acquired since 2009 up to now and geodetic and aerial photogrammetry data acquired in the recent past.
3. Measurements
The recognition and analysis of the potentially unstable areas of La Fossa cone is carried out by integration of data provided by Digital Aerial Photogrammetry, Terrestrial Laser Scanning and GPS surveying in the 1996–2011 time span.
3.1. Remote Sensing Measurements
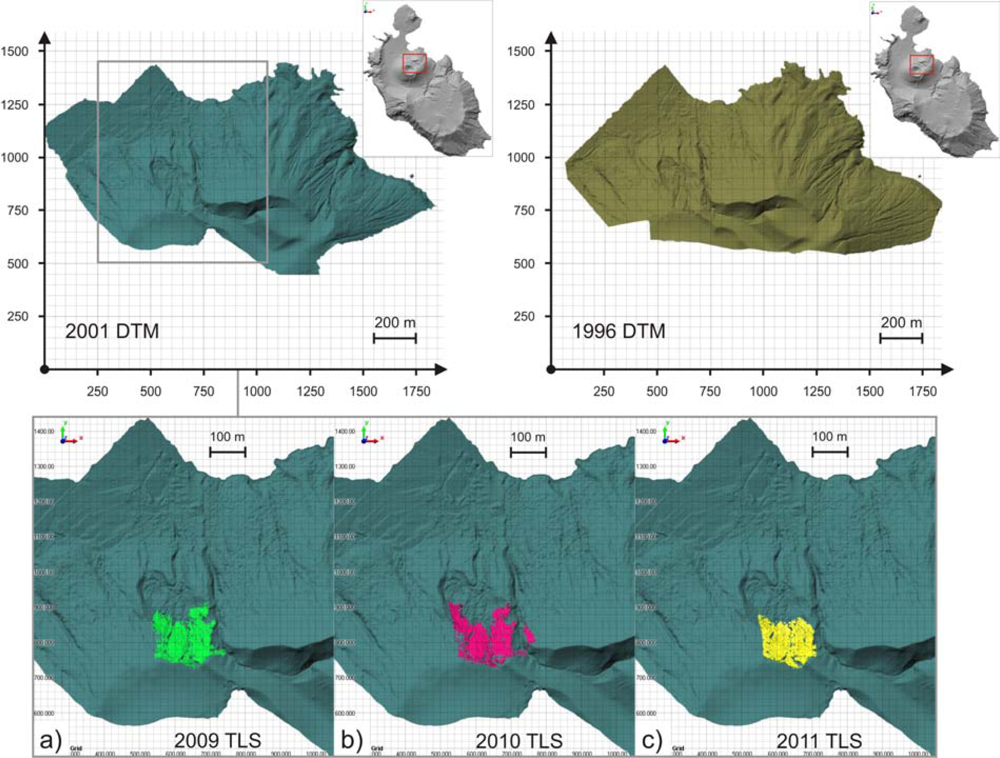
The models extracted from stereoscopic images analysis refers to two aerial campaigns performed in 1996 and 2001. The 1996 survey of the entire island, performed with a Leica Wild RC20 film camera, consisted of a block formed by 4 strips, including 36 photos at 1:10,000 scale [
2]. The camera positions were determined by means of kinematic GPS measurements (with the base station on the ground), leading to a preliminary registration into the WGS-84 reference frame, allowing the reduction of the number of ground control points [
37]. The images were digitized at 1,000 dpi resolution, which corresponds to a ground sampling distance of about 25 cm. After the standard procedure for image orientation, the automatic correlation module of the Digital Photogrammetric Workstation Leica/Helava DPW 770 was used for automatic extraction of DTM from digital stereo pairs, and a 10 m grid DTM of the entire island was generated.
A more detailed analysis was performed for the La Fossa cone area, where images at larger scale (1:5,000) were acquired in both 1996 and 2001. In particular, the Forgia Vecchia area and surroundings,
i.e., the N flank of La Fossa cone, was carefully investigated due to the presence of instability phenomena [
38]. In this case, the ground resolution of the digitized images was about 12 cm, allowing the extraction of a higher spatial resolution DTM (1 m grid instead of 10 m). The photogrammetry-based, 1 m grid DTMs were used in the analyses shown here. In a previous work, the DTMs were registered into a common reference frame by means of a set of ground control points measured with GPS fast static surveys [
37]. Subsequently, the alignment was improved using a specific tool based on least square surface matching procedures, and the model comparison was obtained, forming direct coordinate differences.
The TLS instrument used to episodically survey the Forgia Vecchia area since 2009 is the Optech ILRIS 3D ER [
39], able to acquire accurate data in the range from 3 m to beyond 1–2 km. The signal wavelength is 1,535 nm, and the pulse repetition frequency is 2.5 kHz. The beam divergence is 0.17 mrad, and the minimum angular step is 0.02 mrad. The spot diameter
D of the laser beam on a surface orthogonal to the line-of-sight (LOS) is related to the acquisition distance,
d, by the law
D = 1.7 · 10
−4d +0.012, where
D and
d are both expressed in m. The precision of a single point acquisition, ∼7 mm at 100 m, is dominated by laser beam width and errors on laser beam direction and linearly worsens with distance. Recent studies [
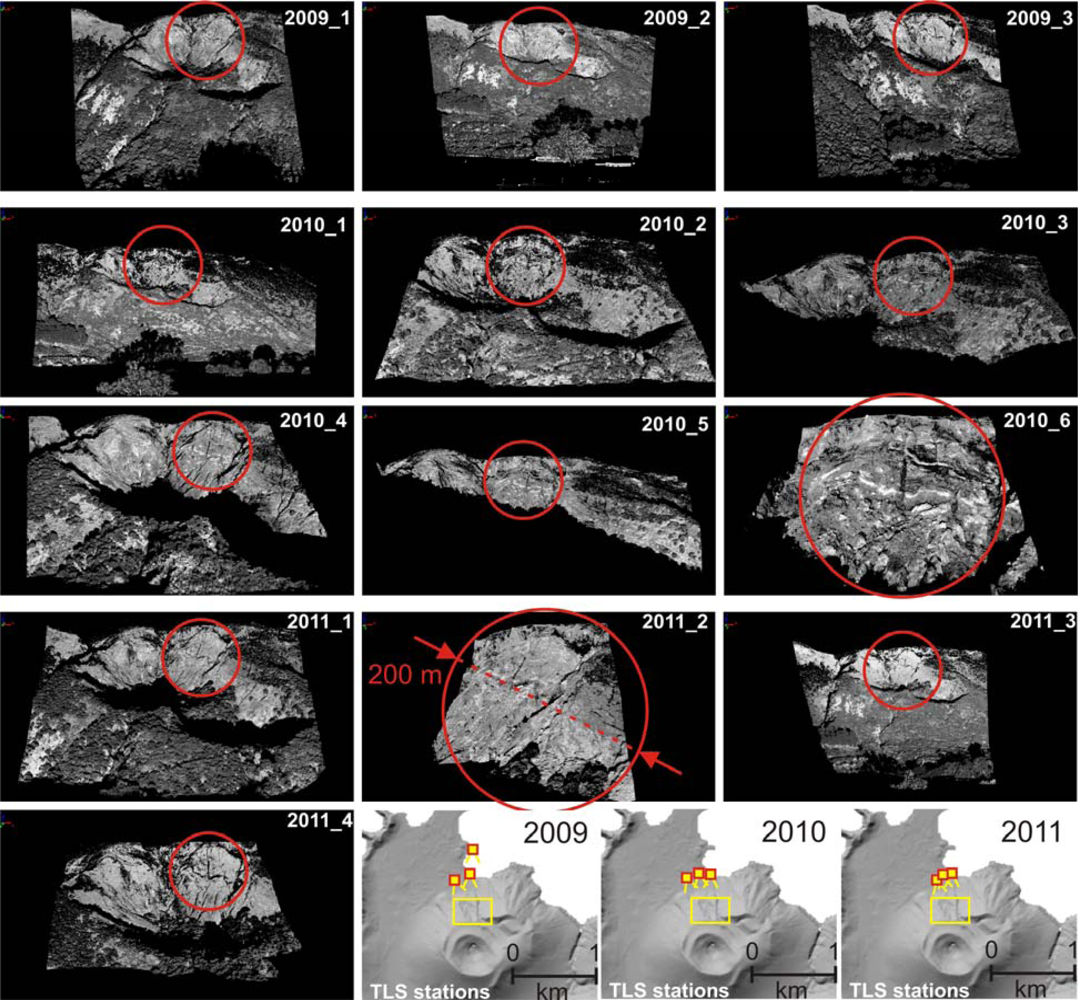
40] show that the real spatial resolution strongly depends on the ratio between spot and spacing, and it is possible to reach values till 1/3 of spot diameter. For each survey, several point clouds were acquired from different points of view at ranges of about 650–800 m, close to a configuration limit for effective acquisition.
If a TLS measurement is carried out in optimal conditions (the laser beam almost normal to the observed surface and about the same acquisition distance for the whole scan, with similar perturbations on signal propagation), the estimation of the instrumental error is simple. If a large area with scattered acquisition distance is observed instead, the accuracy depends on the distance. Besides the dominant effects of the dependence of spot size on distance, effects related to the travel path in air can also occur, but the first ones are strongly dominant. A series of statistical analyses was carried out in order to estimate the uncertainty of the TLS data in the specific observational conditions. These statistical analyses show that, for an 800 m acquisition distance, the standard deviation of the differences between the multi-temporal, aligned point clouds is 7 cm, with a mean of 2 cm, in the areas where no morphological changes occurred. In the areas characterized by fumaroles or other external volcanic activities and, therefore, characterized by possible changes of shape, the standard deviation is 40 cm and the mean −80 cm. The fact that uncertainties of the observational data are significantly lower than the size of the possible variations should be noted.
The TLS data registration was carried out in standard way. After a preliminary manual data cleaning, the point clouds obtained in a same measurement session were registered into a common, but relative reference frame starting from a first manual rough registration and then applying the surface-to-surface ICP algorithm available in the IMAlign module of the PolyWorks software package [
41] to refine the results and provide accurate roto-translation matrices. The surface-to-surface ICP approach requires a preliminary modeling, where a 2.5D model referred to a regular grid, defined on a plane orthogonal to the TLS’ LOS, is generated by data interpolation for each point cloud, but the performance in terms of computation time and alignment precision is very high. The surface-to-surface ICP algorithm minimizes the distance between the models in the overlapping area. This strategy is appropriate, because the distances between the two surfaces are minimized, and their curvatures are locally matched [
42]. Finally, for each campaign, a global point cloud and the corresponding triangulated model with a mean 5–10 cm mean triangle side were generated (
Figure 2). These global point clouds and triangulated models, defined for each campaign with respect to a relative reference frame, will be subsequently referred to the same reference frame with the procedure shown in Section 4, to allow the data comparison. The areas covered by aerial photogrammetry (the whole Volcano Island) and TLS (the Forgia Vecchia area, which is the N part of the La Fossa cone) are shown in
Figure 3.
3.2. GPS Measurements
Like other developed countries, Italy is covered by a GPS-based geodetic network aimed to allow an accurate evaluation of both the velocity and the deformation pattern at a regional scale. According to the Nyquist-Shannon sampling theorem [
43], if a network has a mean spacing,
d, the minimum size of the features that can be recognized is 2
d. This fact implies that a large number of GPS stations is necessary for a detailed characterized of the crustal kinematics. The Italian network RING (Rete Integrata Nazionale GPS, managed by the Istituto Nazionale di Geofisica e Vulcanologia [
44]) consists of a series of continuous GPS stations (CGPSs), whose mean spacing is ∼100 km. In order to solve the problem of the spatial sampling in a cost-effective way, in the more interesting areas (e.g., the Aeolian area), several episodic GPS stations (EGPSs) are used to make the networks denser, reaching a 20–30 km spacing. An EGPS used in geodetic studies is generally equipped by a permanent steel or concrete mount with a deep foundation, on which the GPS receiver is placed for short periods of time (from a few hours to a few months). The expensive power supply and online data transmission systems are avoided in the case of an EGPS. Sometimes, very short EGPS measurements can be carried out with removable mounts, like a topographical tripod or bipod.
A geodetic network, consisting on concrete pillars, lies on the Lipari and Vulcano islands, since the 1970s, initially measured by electro-optical distance measurements (EDM). Currently, GPS surveys (always EGPS measurements) are routinely carried out with the pillars of the Lipari-Vulcano geodetic network in static mode with 24 h sessions. A denser network, consisting in poles driven into the ground, covers the La Fossa cone and is currently measured by 30 min fast-static sessions [
22]. A further geodetic network, again consisting in poles driven into the ground, lies along the northern rim of the La Fossa crater and is aimed to monitor the stability of this slope. Like the Lipari-Vulcano network, it was measured by EDM techniques from the northern promontory of the island [
35,
36] and is currently used for EGPS measurements. In particular, the last geodetic measurements over this portion of La Fossa crater rim were performed in 2010 (13 points) and 2012 (10 points) by means of semi-kinematic measurements after a 1 hour static initialization at the westernmost benchmark (
Figures 1,
2,
3 and
4). Tripods were used to accurately set-up the antenna (Leica AX1202GG) over the benchmarks that were measured twice, during the forwards and backwards paths, adopting the same surveying strategy applied on Mount Etna geodetic monitoring [
45,
46].
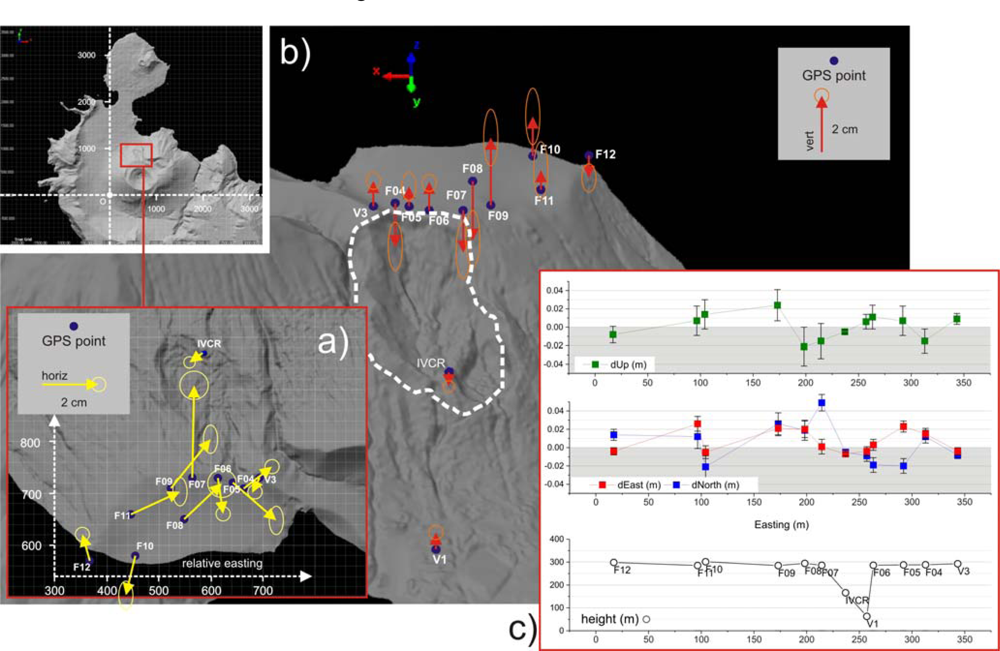
Results are shown in
Figure 4, where a potential instability of the studied area appears, as highlighted by the EDM time series studied by [
36]. Significant ground deformation affects mainly the upper northern crater rim. Ground motion is apparently not uniform, especially in the vertical component. The fact that the lower stations on the crater slope (V1 and IVCR, formerly V2) show no significant motion, neither in the horizontal nor in the vertical components, should be noted, since it confirms the instability of the upper parts.
4. Multi-Temporal Model Comparison
The DTM based on 1996 photogrammetric data is used as a reference model. As already stated in Section 3, such a model is registered into the WGS-84 reference frame by means of about 50 targets measured by GPS. The 2001 photogrammetric-based DTM is aligned to such a reference model by using the standard surface-to-surface ICP procedure implemented in PolyWorks and subsequently used as a reference for the next alignment. Since such a DTM has been also georeferenced by means of targets, like the case of the 1996 one, a test on alignment is possible. The comparisons between the two DTMs with different registration methods provide similar results, validating the ICP-based approach. Clearly, such an approach is based on the assumption that possible significant changes of the shape of the observed slope do not affect the results of a surface matching-based algorithm, like the ICP, and the results confirm that this assumption is reasonable. The use of an ICP-based alignment, instead of a traditional approach based on control points, is necessary in the case of TLS data, because the Forgia Vecchia area cannot be accessed for the placement of targets. The 2009 TLS triangulated model is aligned on the 2001 DTM by means of the ICP algorithm, and similarly, the 2010 TLS model is aligned on the 2009 one. Finally, the 2011 TLS model is aligned to the 2010 one. In this way, the effects on the data registration of possible local changes of shape with time can be reduced with respect to the case of alignment of each model to the reference DTM. For each model alignment, the roto-translation matrix is obtained and applied to the corresponding point cloud. In this way, the multi-temporal photogrammetric and TLS based models, as well as the TLS point clouds, are referred to the same reference frame, and a comparison between multi-temporal data can be carried out.
Since the surface-to-surface ICP algorithm is characterized by high convergence velocity and high accuracy, the proposed procedure provides good results. In particular, despite the fact that the resolution of photogrammetric and TLS models are quite different, the large amount of data well distributed on the observed surface allows a good alignment for each pair of models, with standard deviation of alignment residuals of about 25 cm for the photogrammetric DTM alignment and, finally, about 3 cm and 5 cm for the alignment between consecutive and non-consecutive TLS models, respectively. The estimate of the alignment error between the first model (1996 photogrammetric DTM) and the last one (2011 TLS model), therefore, is representative for model registration into the same reference frame. However, the effects of the lower resolution of coarse models (i.e., the photogrammetric ones) dominate the final result in terms of detecting and estimating deformations (see Section 5 for a discussion about this fact, which requires data integration). In conclusion, a good alignment allows a good model comparison. As seen in Section 3.1, the error due to instrumental uncertainty and alignment error has a 7 cm standard deviation and a 2 cm mean. These values are significantly lower than the typical size of changes that should be detected, a fact that confirms the validity of the proposed method.
In the case of photogrammetric data, the comparison is directly carried out on the DTMs. In the case of TLS data, each pairwise comparison is carried out between a reference model and a point cloud. The results are shown in
Figures 5 and
6. The fact that the upper part of Forgia Vecchia slope is strongly characterized by variations related to rock-mass collapses and swelling, as is typical of landslide evolution, should be noted.
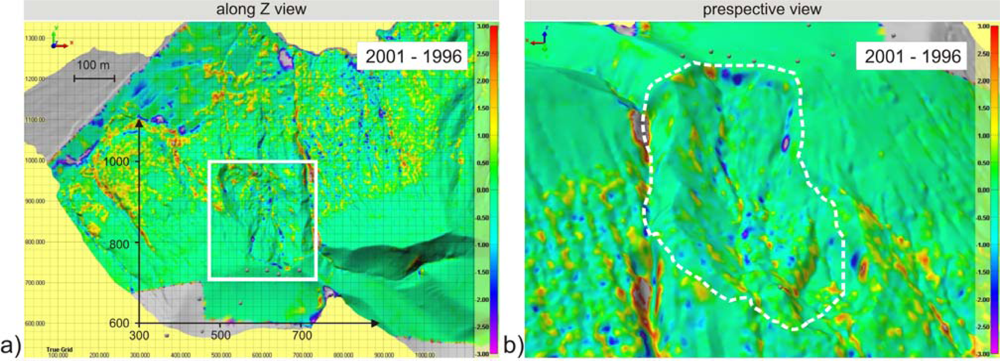
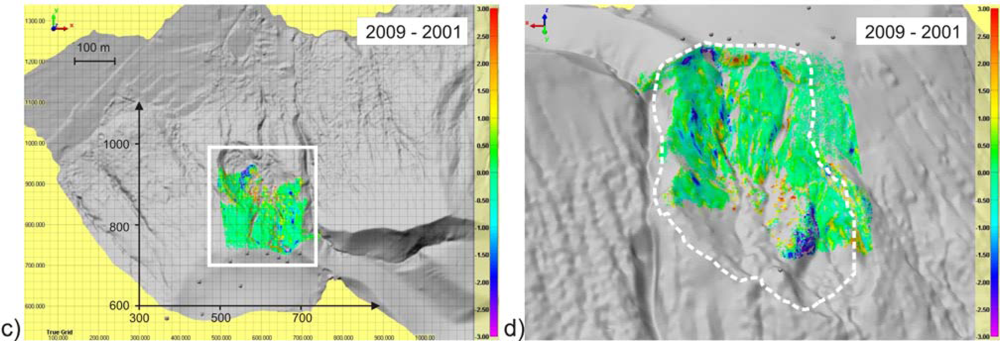
The first comparison, related to 1996–2001 time span and, therefore, representative of the cumulative variations, occurred in about five years, show values larger than 1–2 m with both positive and negative signs (
Figure 5(a,b)). Since the reference is the 1996 DTM, a vertical positive value is an elevation increment with the time. The same for the horizontal directions,
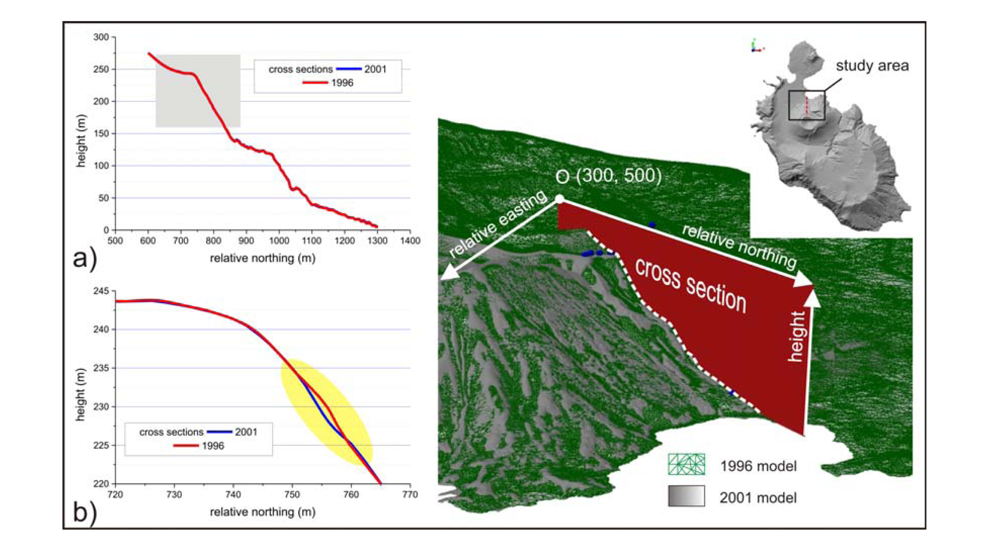
i.e., positive signs, correspond to motion towards E and N with the time. The multi-temporal cross-sections plotted in
Figure 6 confirm the results and allow a more detailed investigation of the area along a direction only,
i.e., the N direction from the crater rim to the sea (the abscissa in
Figure 6(a,b) therefore is a relative northing). The cross-section change highlights a mass loss,
i.e., material has fallen along the slope. The specific results, therefore, represents landslide activity and seems to be uncorrelated with a direct volcanic activity.
The second comparison, related to about eight years in the 2001–2009 time span, shows similar values in absolute values, but different signs (
Figure 5(c,d)), leading to different data interpretation. The surface kinematics seems, therefore, to be relatively complex.
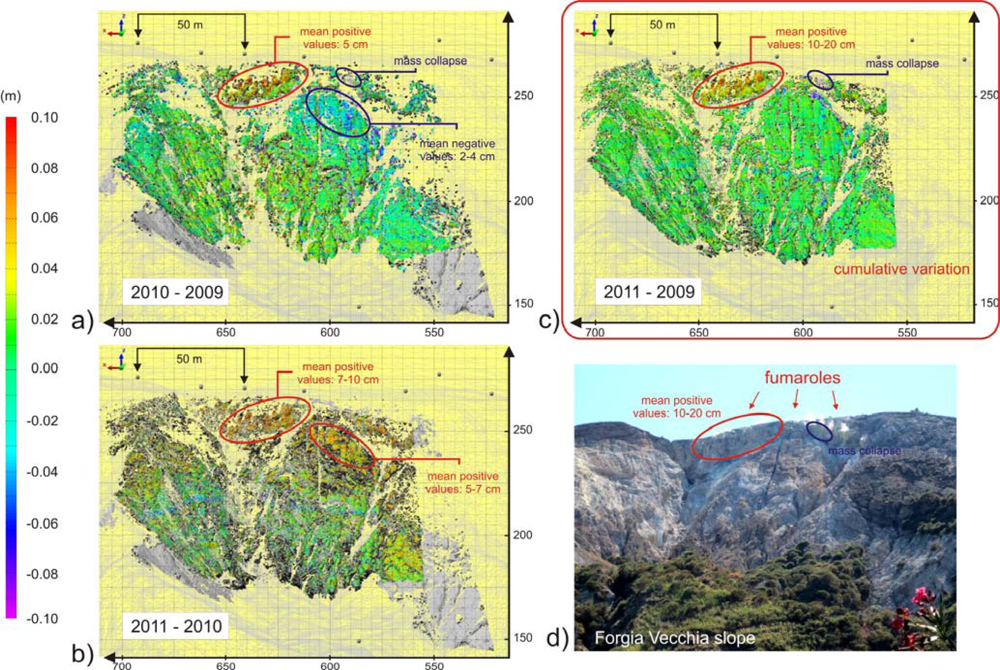
The results of the more recent slope monitoring activities are obtained by a comparison between the models built with the yearly collected TLS data.
Figure 7 shows the differences occurred in 2009–2010, 2010–2011 and 2009–2011 time span. In the case of the 2009–2011 time span, cumulative variations are shown. These results allow a clear recognition of zones characterized by positive variations along the normal direction to the reference surface, with a mean annual rate of about 10–20 cm. In the 2009–2010 time span, negative variations also occurred in a delimitated area (2–4 cm), but the kinematics is subsequently changed, leading to a 5–7 cm positive cumulative variation from 2009 to 2011. In
Figure 7, an area characterized by mass collapse (detected by visual inspection of the site and the point cloud) is also highlighted
All the described comparisons are obtained by means of a standardized procedure based on an iterative, but also interactive process. At first, the difference map is obtained by alignment of the all the points belonging to the common areas between two scans or models. The differences between the scans or models are computed, and the zones affected by significant differences are therefore highlighted. These highlighted points, which lie on areas probably affected by morphological changes, are excluded in the next step of alignment/comparison procedure. The process is repeated until no more variations are recognizable in the computed differences maps.
5. Discussion
The monitoring of unstable volcanic areas can be obtained by integrating remote sensing and GPS measurements in the frame of fast, simple and low cost approach. The available aerial photogrammetric images are characterized by a relatively low spatial resolution (12–25 cm at the ground for the specific case study), but provide the coverage of wide areas, in this case, the whole Vulcano Island. These data can therefore be used to both observe the surface variations of the complete volcano flank, occurring in the last two decades, and provide a good reference model to which the first TLS point cloud, taken in 2009, can be aligned. The comparison between the multi-temporal photogrammetric- and/or the TLS-based models allow the observation of the main surface variations between 1996 up to now. Two main issues act on the quality of the alignment between all these models and, in particular, the alignment between the TLS-based models: (i) the existence of shading-induced gaps in TLS point clouds and (ii) the fact that changes could occur in the overlapping areas. These fact are now discussed.
Each TLS point cloud, as well as the corresponding digital model, shows some lacks of connection between all its components, because of shadow zones, due to the very constrained acquisition geometry, that lead to several data gaps. Example of large gaps can be seen, e.g., in point clouds 2010_2, 2010_4 and 2011_1 (
Figure 2). In order to minimize the effects of these spatial data gaps, the viewpoint positions are to be optimized, but in some cases, like the specific case study, it is impossible.
Figure 7 shows that some gaps also affects the whole point clouds. In order to solve the problem of data gaps, the point clouds, and the corresponding models, must be adequately dense, and the data must be adequately well distributed in the space. Since the collected TLS data are quite dense, the 2009, 2010 and 2011 point clouds can be correctly aligned, despite the data gaps.
Another issue is related to possible changes occurring in the overlapping areas. In order to have a successful registration based on a surface matching algorithm like the ICP one, the morphology of the overlapping areas must be unchanged within the required registration error. If changes occur instead, the changed areas must be selected and excluded from the comparison process. This issue can be solved by means of two approaches, which should be applied together. At first, the GPS data or other data, like EDM, can be used to detect the areas unaffected by motions, which can be used for the alignment and the areas affected by motions instead. The second approach is based on the analysis of the displacement pattern that appears after the data comparison, to verify its significance. The areas affected by morphological changes should appear as delimited, high variation zones in general conditions of low variation (see, e.g.,
Figures 5,
6 and
7). In a similar way, if a cross-section is generated, delimited changed profile portions should emerge in a profile relatively unchanged. The fact that, in order to improve the registration results, these approaches are to be carried out together, must be noted.
The data analysis shows that, in the last three years, some zones in the upper crown of the slope are affected by positive difference of the order of 7–10 cm/y and that other zones are affected by negative values related to either mass collapses or small surface lowering (
Figure 7). The main differences, both positive and negative, are observed in zones affected by a higher fumarolic activity.
The evidence of ground motions in the northern part of the crater rim, immediately above the upper part of the observed area, can be inferred by GPS measurement in the last 2010–2012 time span (
Figure 4). The results show different trends regarding both vertical and horizontal displacements of points distributed along the rim of the order of some centimeters, thus revealing a complex kinematic, in agreement with the results of the EDM time series [
36]. These time series, related to the 1994–1998 time span, show a progressive lengthening of the VVUL-V3 baseline (VVUL is a benchmark in the N part of Vulcano Island and V3 is placed on the La Fossa crater rim; see
Figure 1).
The information provided by punctual episodic GPS and EDM measurements, integrated with the information from surface monitoring carried out by means of multi-temporal models comparison, describes a clear evolution consisting in sequences of blowing up and collapses in the upper part of the slope. Deformations are distributed in a very complex arrangement, mainly on the crater rim, testifying a disarticulation of the uppermost part of the slope, where it is steeper and fumaroles are more active. The strongest northwards and north-eastwards (towards the slope) motions are recorded by GPS stations placed on the western part of the detachment, i.e., above the most fumarolized area. This result is also in good agreement with TLS measurements, which highlight significant changes in the uppermost and western part of the slope only. In particular, no significant changes occur in the lower parts of the La Fossa cone.
The data available at present do not provide clear evidence of a large failure involving the entire slope at depth. To have a confirmation of such evidence, the slope stability is investigated by means of the Bishop’s method [
47]. This method allows an evaluation of the stability of a rotational landslide in a 2D approach and provides the coordinates of the center of the most critical slip circle, as well as the corresponding safety factor,
F. For each circular sliding surface,
F is simply given by the ratio between the sum of the resisting (friction) forces and the sum of the gravitational sliding forces. The slope is stable if no a theoretical surface having
F < 1 exists.
The Bishop’s method is applied on the N-S cross-section of the slope. A simple uniform stratigraphy is used for the calculation. The La Fossa cone is assumed to be composed by a lithology only,
i.e., tuffs, with a mean density of 1,900 kg/m
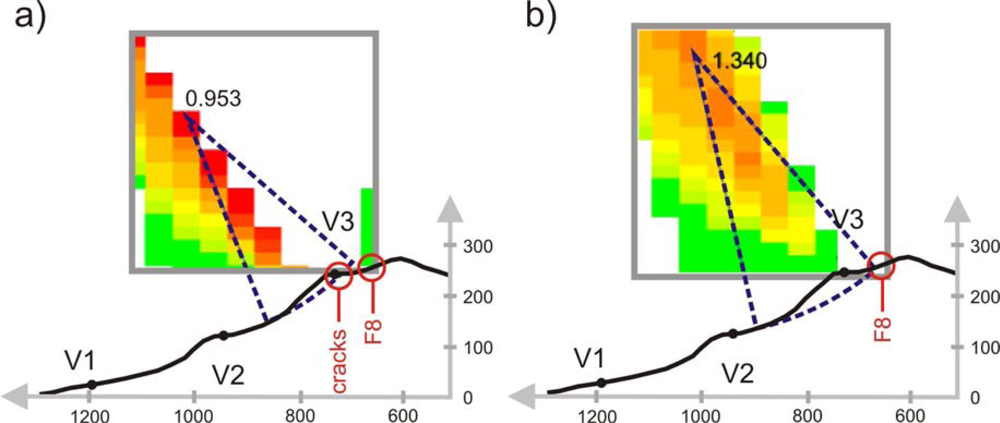
3. A repose angle of 35° and no cohesion are considered. The latter corresponds to the worst possible case. Two scenarios are hypothesized. In the first one (
Figure 8(a)), the positions of the cracks are constrained at the positions reported by [
37] and at the position of the furthest moving benchmark,
i.e., F8. In this way, the program that implements the Bishop’s method searches the most critical sliding circle intersecting the topography at one of the two constraints. The most critical sliding circle is very shallow. It intersects the cracks, but excludes the F8 benchmark and is characterized by
F = 0.95,
i.e., a sub-critical safety factor. In the second scenario (
Figure 8(b)), only the position of the furthest moving benchmark is fixed, and the sliding circle is forced to involve it. In this way,
F can be estimated, taking into account all of the moving benchmarks and involving a greater rock volume. The most critical circle shows
F = 1.34. This result confirms that no incipient instability affecting the entire northern crater rim is expected. According to the results obtained in the first scenario, a possible landslide could involve only the shallowest and uppermost part of the cone. Although the stability models come from a simplified modeling of the slope, the results are validated by the fact that no critical circles involve the slope below the benchmark V2, which is stable (
Figure 4(c)).
These reassuring results are related to the present state of the Forgia Vecchia area of the La Fossa volcano flank. The fact that the village and the harbor are threatened by possible material falls suggests a permanent monitoring of the area, to highlight possible changes that could lead to significant landslide events. For this reason, the EGPS V2 (in the 70s–80s an EDM benchmark) has been recently converted to a CGPS, named IVCR.
6. Conclusions
The aim of the described monitoring activities is the acquisition of useful information for stability analysis purposes. In particular, the stability conditions of the Forgia Vecchia area (northern flank of the La Fossa cone of Vulcano Island) are studied, because possible rock mass falls could threaten a village and the harbor. To perform this, data provided by remote sensing (digital photogrammetry and terrestrial laser scanning) and GPS are integrated to provide a reliable picture or the volcano flank kinematics and, in particular, possible changes of the kinematics with time.
The results obtained in the case study are based on aerial photogrammetry data acquired in 1996 and 2001, laser scanning data collected in the 2010–2012 time span and episodic GPS measurements carried out since 1997. The photogrammetric data are characterized by ground resolution of 12–25 cm, leading to a 10 m side DTM for the whole Vulcano Island and a 1 m side DTM for the La Fossa cone. The acquisition distance of TLS data is 650–800 m, with 5 cm mean spatial sampling step, leading to triangulated models with a 5–10 cm triangle side. Information provided by less recent electro-optical distance measurements (EDM), leveling campaigns and tilt measurements is also taken into account. Although the emphasis is on the more recent evolution of the area, all the data are used in order to have a correct registration into a common reference frame of all the models and, therefore, to provide reliable displacement results.
The results show a complex kinematics, correlated with the fumarolic activity, i.e., that the higher morphological changes occur where higher activity exist. A reliable estimate of the data uncertainty, due to both TLS instrumental error and data alignment procedure and obtained by means of statistical analysis, is 7 cm for an 800 m acquisition distance in those areas where no morphological changes occurred. This result, which reaches 40 cm, should be compared with the one obtained in the areas characterized by fumaroles or other external volcanic activities. The procedure used, therefore, is able to highlight morphological changes with adequate precision and resolution.
Finally, a stability analysis carried out with the Bishop’s method shows that no generalized collapse of the cone is expected (safety factor F ≥ 1.34 for the entire northern crater), but some minor landslide phenomena could occur (in the upper part of the crater, an area characterized by F = 0.95 exists). An important result is that a continuous monitoring of the La Fossa cone (in particular, of the Forgia Vecchia area) is recommended to highlight possible changes of the stability conditions.
Besides the results obtained in the specific case study, which can be directly used for landslide hazard assessment, this study has an important general result. It is confirmed that the implemented approach, based on integration of data provided by different techniques, is a useful tool for the kinematical characterization of a steep slope like the flank of an active volcano. On a steep slope, the positioning of a good number of geodetic benchmarks generally is impossible, and multi-temporal remote sensing data are to be taken and interpreted. Clearly, the volcanic or non-volcanic nature of the environment of the studied steep slope is irrelevant for the purposes of the proposed integrated approach.


