Article

Tracking Fires in India Using Advanced Along Track Scanning Radiometer (A)ATSR Data

by
Amarnath Giriraj
1,2,3,*,
Shilpa Babar
1,4,
Anke Jentsch
5,
Singuluri Sudhakar
1 and
Manchi Sri Ramachandra Murthy
1
1
Forestry and Ecology Division, National Remote Sensing Centre, Hyderabad 500 037, India
2
Department of Biogeography, University of Bayreuth, D-95440, Bayreuth, Germany
3
MENRIS Division, International Centre for Integrated Mountain Development, GPO Box 3226, Kathmandu, Nepal
4
Department of Environmental Sciences, University of Pune, Pune 411 007, India
5
Helmholtz Centre for Environmental Research UFZ, Leipzig 04318, Germany
*
Author to whom correspondence should be addressed.
Remote Sens. 2010, 2(2), 591-610; https://doi.org/10.3390/rs2020591
Submission received: 1 December 2009 / Revised: 27 January 2010 / Accepted: 1 February 2010 / Published: 24 February 2010

Abstract

:
Forest fires pose a threat more serious than illegal felling in developing countries and are a cause of major concern for environmental security. Fires in tropical forests, though not devastating on a large scale as compared to large and infrequent fires in boreal or Mediterranean systems, still cause loss to biodiversity and economic and monetary value. In India, human-induced forest fires increasingly affect legally protected nature conservation areas. An array of satellite sensors that are now available can be deployed to monitor such events on a global and local scale. The present study uses night-time Advanced Along Track Scanning Radiometer (A)ATSR satellite data from the last nine years to identify high fire-prone zones, fire affected areas in protected zones and the distribution of these incidents in relation to bio-geographic zones. Central India, with its vegetation type that is just right for fire ignition and spread, was observed to be the most severely affected area with maximum fire incidences. The bio-geographic zone comprising this area–such as the Deccan peninsula, which includes provinces like Central Highlands, Eastern Highlands, Central Plateau and Chhota Nagpur–was observed to be the most affected, accounting for approximately 36% of the total fire occurrences during the period 1997–2005. In protected areas, 778 fire incidents were observed within the last eight years. Comparison of (A)ATSR fire locations with MODIS active fire data for the Western Ghats (mainly of tropical evergreen forests and savannahs) and the Eastern Ghats (tropical deciduous) showed a spatial agreement of 72% with a minimum distance between the two products of 100 m. This study focuses on regions in India that are vulnerable to forest fires during specific time-frames and appraises the situation with an aim to minimize such incidents, if not completely stop the fire spread and its consequent destruction and loss. Our main objective is to understand seasonal and spatial variation in fire pattern and to identify zones of frequent burning.

1. Introduction

Monitoring and management of forest fires is very important in tropical countries like in India, where annually 55% of the total forest cover is prone to fires [1] causing adverse ecological, economic and social impacts. Most significantly, tropical forest fires emit substantial amounts of gases (CO2, CO, CH4, NOx) and particulates into the atmosphere [2,3,4,5]. Together, these emissions influence the chemistry of the Earth’s atmosphere, radiation budget, and overall climate [6]. Forest fires are largely found largely within the tropics, as evidenced by assessment of satellite imagery [7], which shows that over 70% of global fire events in any given year are found within this region [7]. Global assessments on the seasonal variability of fire occurrence were studied in detail by [7,8,9]. Studies on the variability of active fires on a continental scale include: [10,11] in Africa, [12] in South America and [13] in Canada.
Irrespective of fire distribution patterns on a global scale, biomass burning has several ecological effects, such as the loss of animal habitat and biodiversity [14], modification of vegetation succession patterns [15,16], and alteration of biological nutrient cycling [17]. In order to assess this array of impacts, techniques must be developed for accurately measuring the spatial and temporal distribution of vegetation fires. Quantification of forest fire can be analyzed in terms of biodiversity loss, nutrient, soil moisture and other intangible benefits. Specifically, factors like flammability (plants containing resins, oils etc.), phenology (extent of living and dead material), vegetation structure, location of the fuel within the vegetation, weather conditions (humidity, wind speed, temperature) and fuel moisture levels influence the combustion of vegetation [18]. All these factors influence the fire duration and intensity, and consequently affect the flaming and smouldering phases of burning activity

1.1. Fire and Its Impact in Indian Tropical Forests

Among the various tropical forests in the Indian subcontinent, deciduous forests are largely prone to forest fires and account for approximately 40% of all forest fires in India [19,20]. A majority of the tropical dry forests around the world have been converted into anthropogenic grassland as a result of fire and other land use conversion [21,22]. It is difficult to understand the role of fire in the conservation and management of these endangered ecosystems. Studies from the Forest Survey of India (FSI) [23] showed that an average of 54.7% of forest is affected by fire and 72.1% of the forest area is subjected to grazing. Annually 3.73 million hectares of the forest area are burnt [24], resulting in economic losses of approximately USD 110 million [25].
Studies reveal that in India human activity is generally the principal cause of forest fires [26]. People have been clearing and burning forests for shifting cultivation for millennia [27,28], though this is now a dying practice in most parts of the country, except in the northeast [29]. Nonetheless, local communities on the fringes of the forest continue to burn forests to promote the growth of fresh fodder for their livestock and livelihood [27], and to facilitate the collection of non-timber forest products [30,31,32].
Vegetation fires studied worldwide [33,34,35,36] show that a majority of these fires are being set by man in areas with low water deficit [37]. As a result, occurrence of fire has a seasonal pattern, often influenced by land use activity, though its intensity and exact location will be different than the preceding year. Forests in the Indian region are especially prone to fires during the summer season (February–April). Monitoring these fires has become easier with the availability of satellite data obtained with high temporal repeatability, spectral variability and wide spatial coverage. To track fire incidence, fire progression and to assess damage, international organizations like NOAA (U.S. National Oceanic and Atmospheric Administration), NASA and satellites like Terra and Aqua, IRS P4 (OCEANSAT), IRS P6-AWiFS (Indian Remote Sensing - Advanced Wide Field Sensor) and SPOT-VGT (Système Pour l'Observation de la Terre-Vegetation) are being used. Till recently, polar satellites most widely used for detection tasks have been the NOAA-AVHRR (Advanced Very High Resolution Radiometer) [38], the EOS-MODIS (Moderate resolution Imaging Spectroradiometer) [39] and the European sensor ATSR-2. In March 2002, the ESA put into orbit the ENVISAT satellite allowing us to put the advanced sensor AATSR (Advanced Along Track Scanning Radiometer) into operation.
To understand and quantify the fire regime in India, we used (A)ATSR data, which was provided by the European Space Agency ATSR World Fire Atlas. The derived datasets are useful for detecting fires that occupy small areas on the ground, as the band is sensitive to small variations in radiation due to fire. The current study was taken up with the objectives of: (i) assessing the distribution of fire occurrences in India; (ii) understanding the seasonal variation in fire occurrence; (iii) relating the fire distribution pattern to bio-geographic zones and protected areas of India and (iv) highlighting the use of such datasets for regular monitoring of fires. The study is the first of its kind in India using satellite data from (A)ATSR for the entire fire season over nine years.

2 Materials and Methods

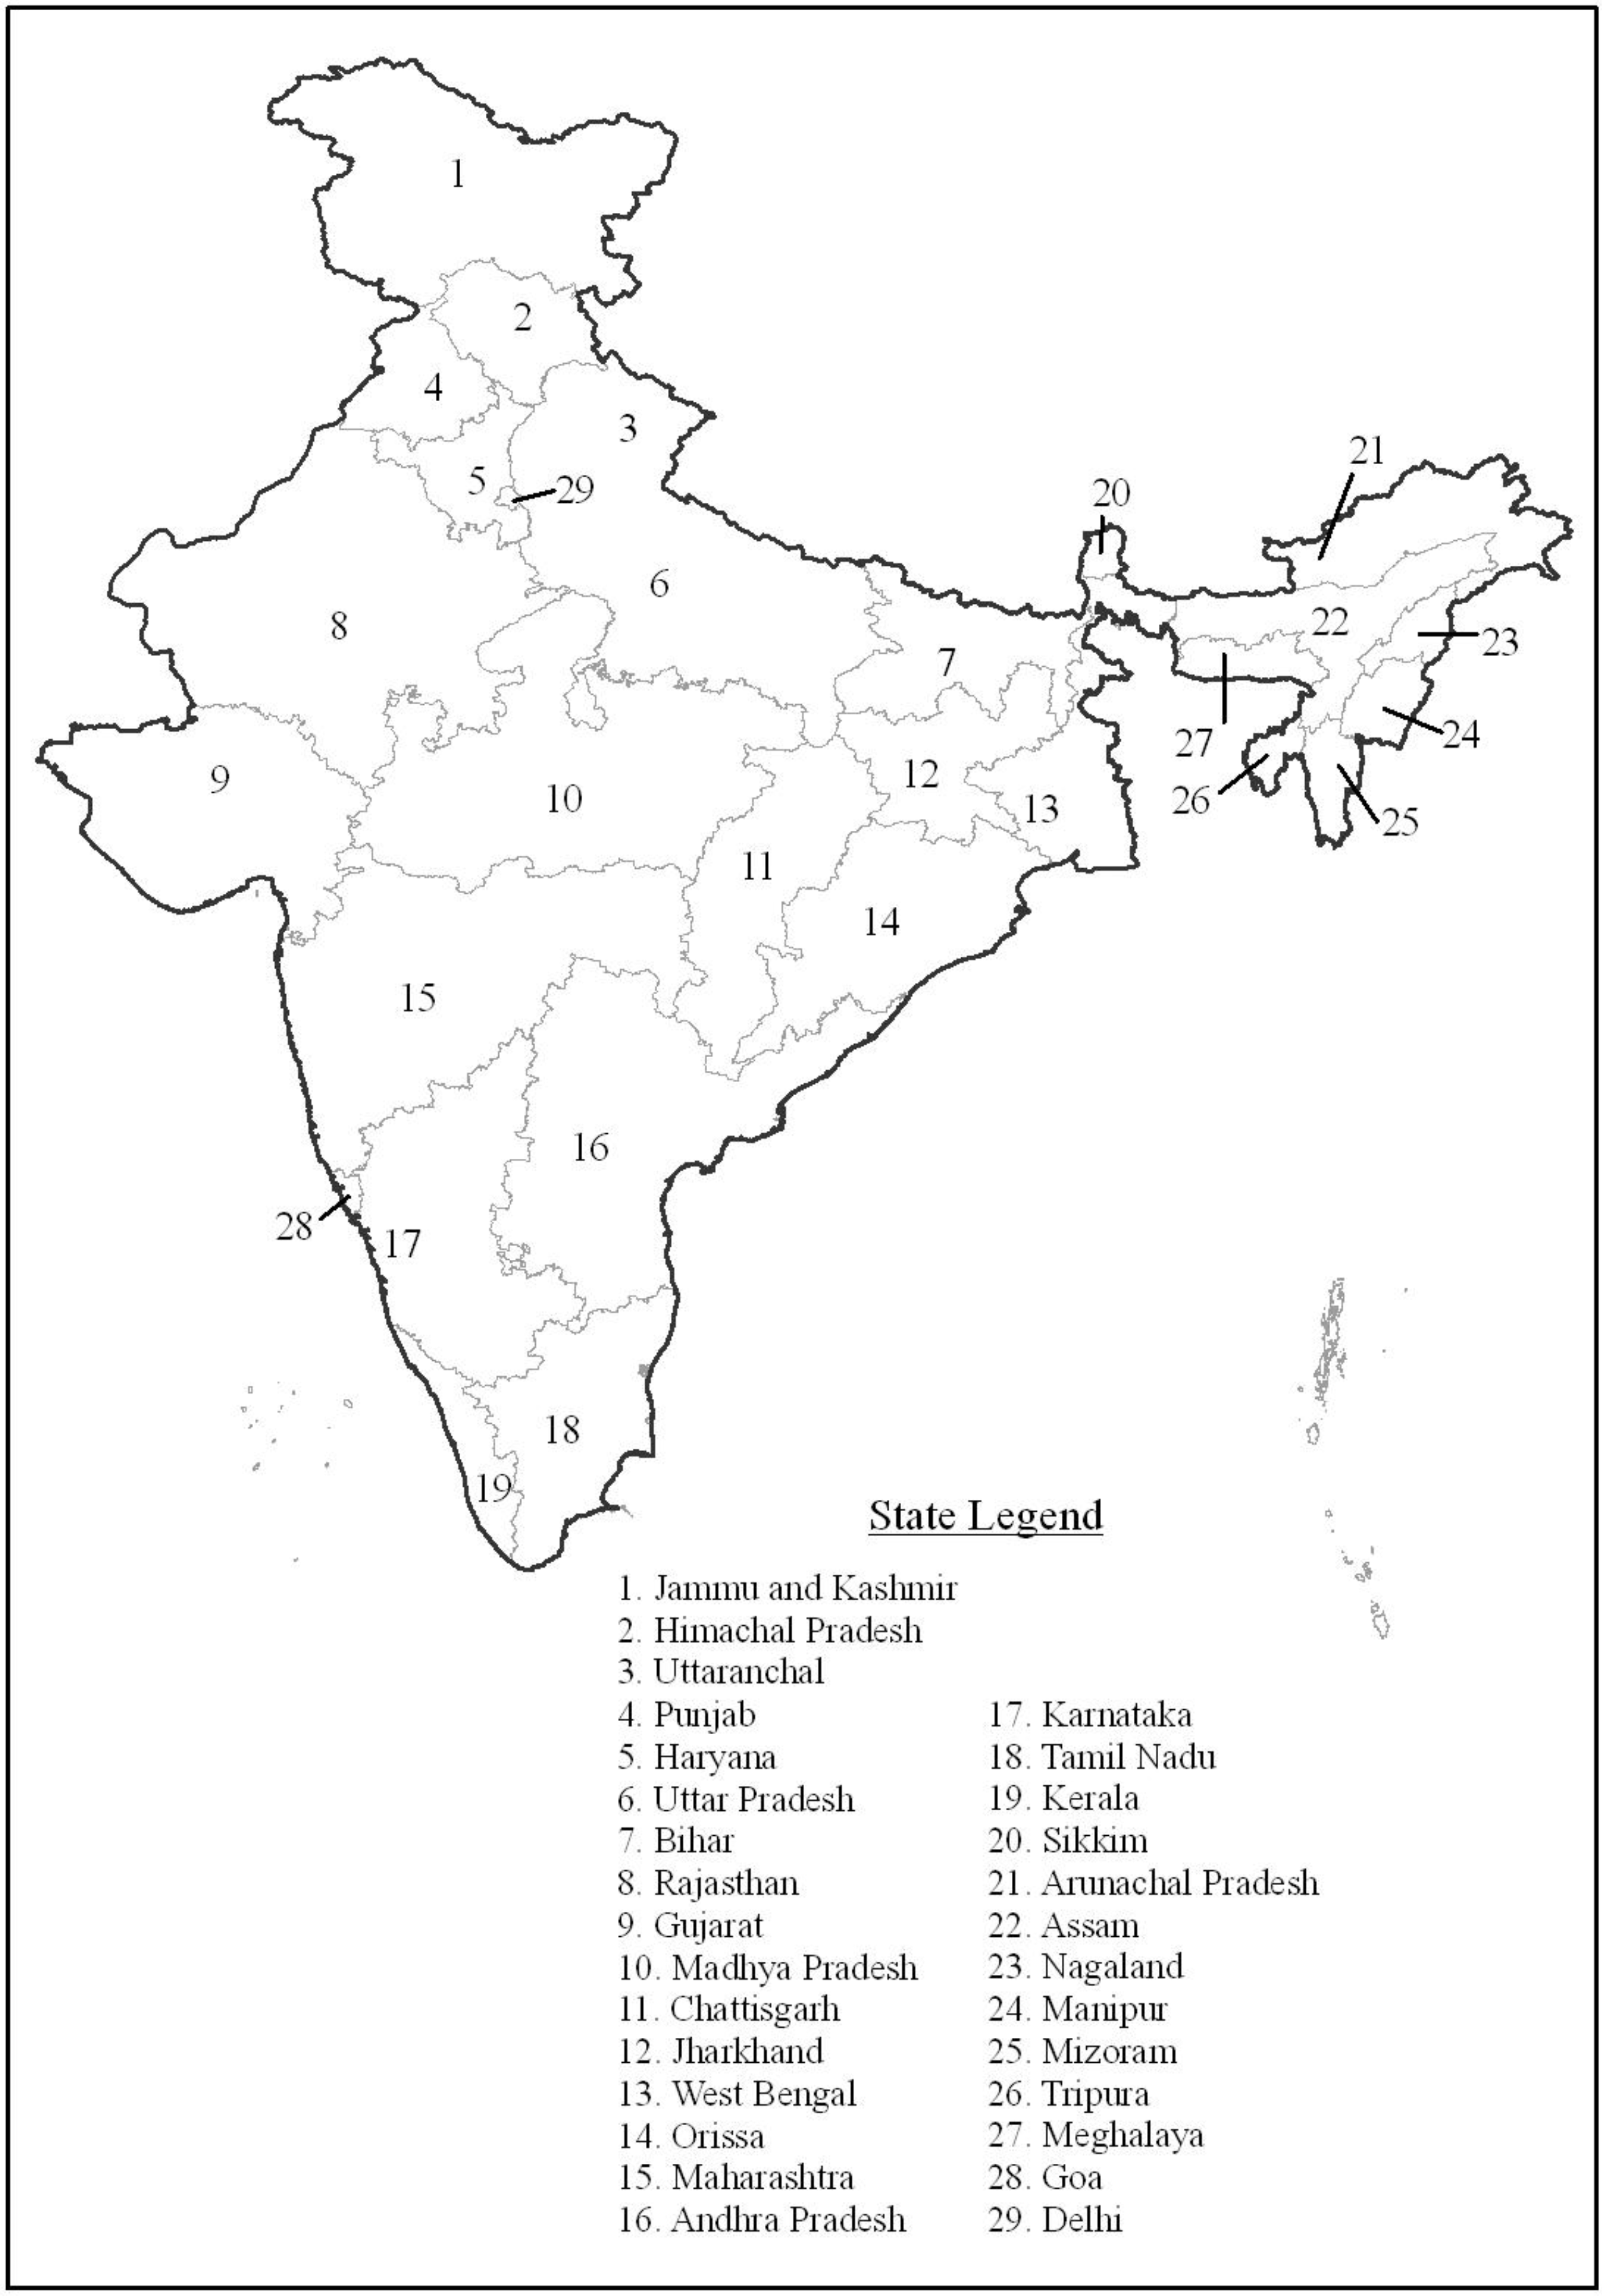
2.1. Site Description

The present study was carried out over the entirety of India. The Indian forest covers some 76.5 million hectares out of a total geographical area of 328.7 million hectares, thus constituting 23.38% of the total area of the nation [23]. India possesses a rich flora of flowering plants (17,000 species) with a high degree of endemism (33.5%) [40] and has two world biodiversity hotspots. The vegetation in the Indian sub-continent is distributed mainly in four distinct geographical zones, viz., Himalayas, Vindhyas, Western and Eastern Ghats. The entire geographical area is divided into 26 biogeographical zones [41] (Figure 1). These bio-geographical zones are categorized based on temperature, precipitation and climatic patterns. 103 forest types are described by [42], of which many are prone to fire. Among other major factors seasonal pattern plays an important role in the vegetation formation. Winter season in India extends from December to February, followed by peak summer from March to May. Major fire incidences are noticed during this peak season, which coincides with the period of high amounts of ignition material available on the forest floor. By January most of the deciduous trees shed their leaves, and after June, the south-west monsoon sets in providing the needed moisture to prevent the fire from igniting the dry flora and spreading across the forest.
Figure 1. Map showing the study area (a) with state boundaries and (b) bio-geographical zones.
Remotesensing 02 00591 g001aRemotesensing 02 00591 g001b
Hence, the months of January to June were chosen for analysis to understand the spread of fire as a function of seasonal pattern. The deciduous forest, spread mainly across the Vindhyas, the middle and southern Eastern Ghats, the eastern slopes and foothills of the Western Ghats and the coniferous forests in the Himalayan region are vulnerable to fires every year, but, in the north-eastern states of India forest fires are mainly due to shifting cultivation and not due to the enhancement of grass cover as generally reported in other parts of the country.

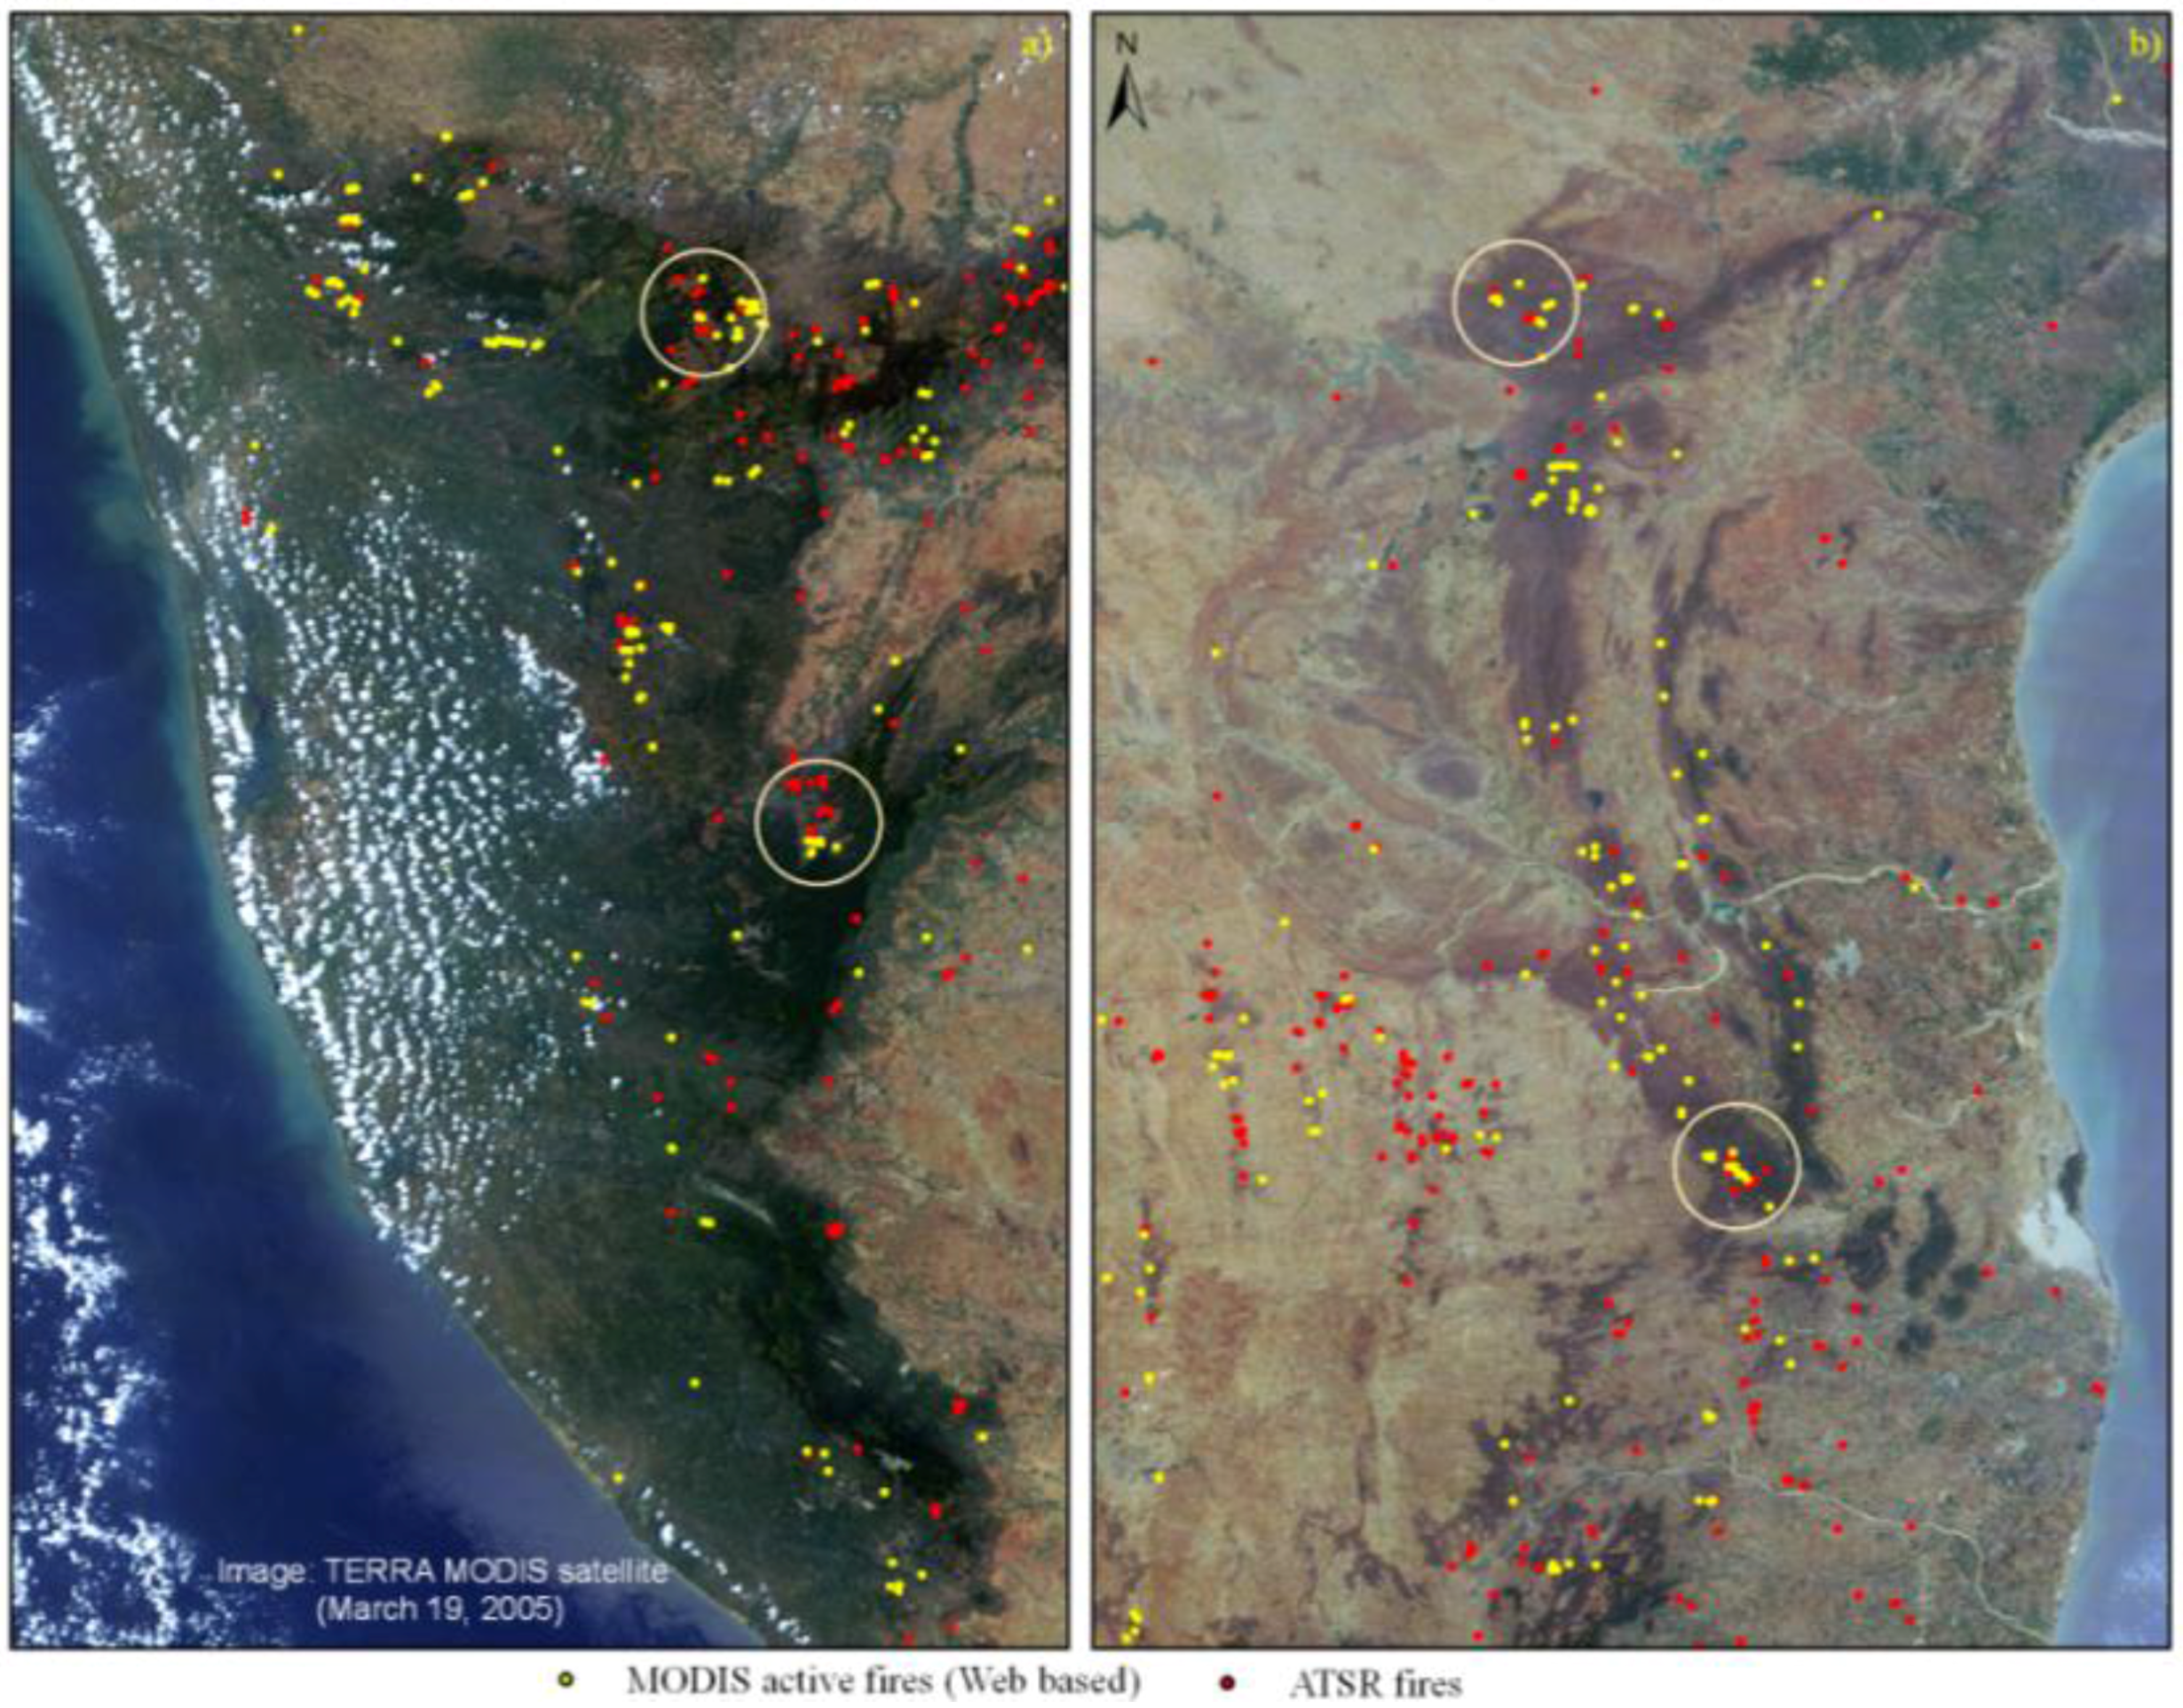
2.2. Data Sources and Research Method

Advanced Along Track Scanning Radiometer (A)ATSR night-time satellite data were obtained from ATSR World Fire Atlas (WFA) for the month of January to June for the years 1997–2005 and processed for Algorithm 1 [43,44] have given explanation on the (A)ATSR characteristics, validation and relation to climatic variables. The European Space Agency processed the (A)ATSR images with two different algorithms, i.e., a threshold of 312 Kelvin (Algorithm 1) and a threshold of 308 Kelvin (Algorithm 2). As is already known, the satellite has two different ways of observation: the nadir vision and the observation with a sloping angle of 55º in front of the sub-satellite point at a distance of approximately 1,000 km above the ground. The latter observation is used for atmospheric correction processes and it is carried out 150 seconds after the former. With respect to the spectral characteristics, (A)ATSR has seven bands centred at 0.56, 0.66, 0.87, 1.61, 3.70, 10.85 and 12 µm respectively with a spatial resolution of 1 km. As this detection done during the night time, there is no artefact due to solar reflection. Also, as this instrument is having radiometric sensitivity, it allows detection of little or not much extended fires. The detection capability of the 3.7 μm channel ranges from a burning area of 0.1 ha at 600 to 0.01 ha at 800 K. In this study we used only the dataset created with the 308 K threshold, designated algorithm 2 [45,46,47,48,49].
Table 1. Observation of fire occurrences in different states using A(A)TSR night-time data between 1997 and 2005 for the months of January to June.
Remotesensing 02 00591 i001
Nine year fire locations were obtained in ASCII format from WFA and exported to ESRI shape file and were extracted for the study region. These coordinates were further projected in the Arc-Info environment and later overlaid on the political map of India with different state boundaries for analysis. Further, it was clipped with FSI density map (percent forest cover) to understand fire distribution in forest only, excluding agricultural and barren areas. To understand the distribution of fire occurrences within different states, biogeographic zones, global land cover data, and protected area are based on data from International Union for Conservation of Nature–United Nations Environmental Programme (IUCN-UNEP) [50]. The dataset uses ‘overlay’ function in the ARC module of the Arc Info GIS software.

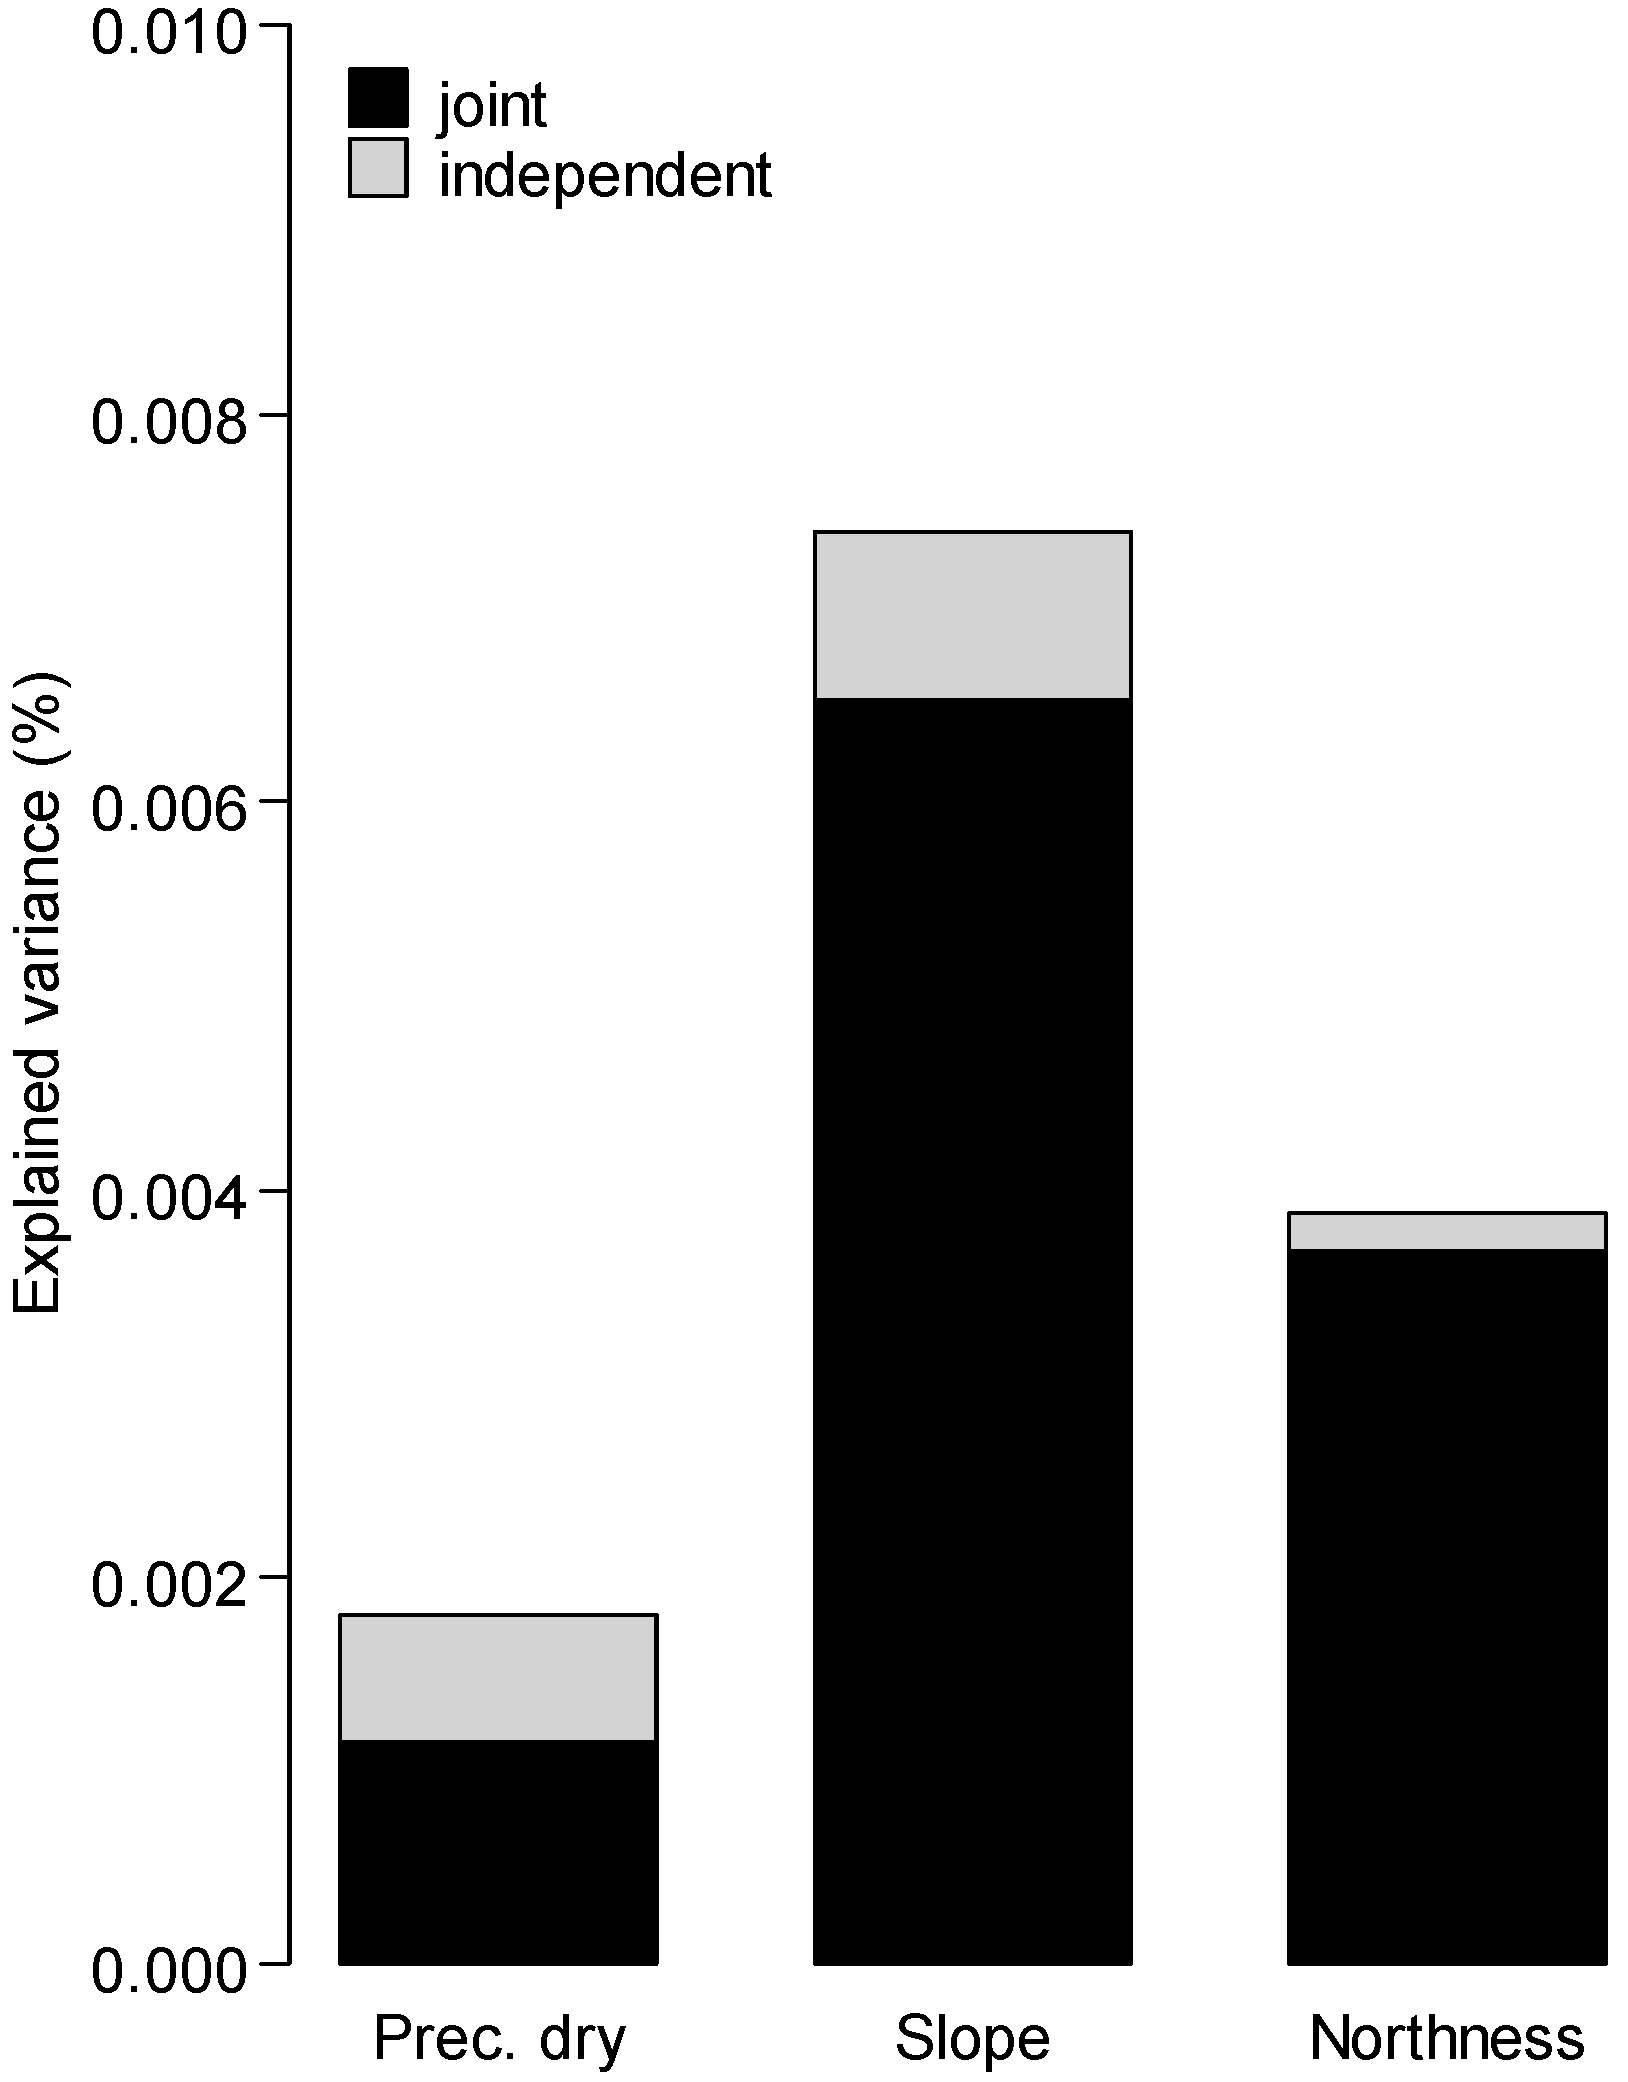
2.3. Correlation of Fire Data with Climate, Vegetation and Human Activities

Climate, vegetation and population density layers coinciding with the fire data were used in this study to perform individual correlation among fires. Global climate data were obtained from WorldClim, a set of global climate layers (climate grids) with spatial resolution of a square kilometer (http://worldclim.org) [51] and AVHRR Global Land Cover data (http://www.landcover.org/data/landcover/). Population density information was sourced from Census of India [52]. In the first stage, all variables received from Worldclim were integrated with the fire locations and it was observed some of the variables do not have any correlation. Thus, variables such as Annual Mean Temperature (Bio1), Mean Diurnal Range (Bio2), Isothermality (Bio3), Temperature Seasonality (Bio4), Max Temperature of the Warmest Month (Bio5), Temperature Annual Range (Bio7), Annual Precipitation (Bio12) and Precipitation of the Driest Month (Bio14) were used in this study. Additionally, elevation, aspect and slope from the USGS Hydro-1K dataset [53] were gathered for the detected hotspots. These variables were subjected to hierarchical partitioning [54,55] to separate the independent influence of each of these variables on the presence or absence of fire (again with a binomial (logit) response function). The calculations were performed using R 2.6.2 statistical software [56] including the package hier.part [57].

3. Results

The distribution of fire events derived from Forest Survey of India (FSI) was clipped to obtain fire counts over the Indian sub-continent for a period of 9 years (1997–2005) as given in Figure 2.
Figure 2. Distribution of forest fire using A(A)TSR data over Indian sub-continent between 1997 and 2005.
Remotesensing 02 00591 g002aRemotesensing 02 00591 g002b
In Central Indian states, i.e., Maharashtra, Chhattisgarh and Madhya Pradesh, the fire occurrence is predominantly during April. High record of fire incidences was observed for the year 1999, particularly during March and April primarily due to prolonged dry seasons and droughts (Figure. 3).
Figure 3. Fire occurrence data using A(A)TSR night-time data over Indian region for peak fire season from January to June (1997–2005).
Remotesensing 02 00591 g003
A total of 5,907 fire occurrences were observed in different forest types. Out of 10,733 fire incidences, nearly 65% of night-time fire occurrences were noticed in the dense forests having a canopy closure of 40% (Figure 4).
Figure 4. Map showing fire distribution in different forest density classes using A(A)TSR night-time data for the peak fire season (Jananuary–June) from 1997 to 2005.
Remotesensing 02 00591 g004
An assessment has been made on the occurrence of fire locations in dense, open and scrub categories using (A)ATSR fire locations. Dense forests are largely prone to fire than open forests and scrubs, the latter having least fire incidents. Comparison of fire occurrences with forest density and land cover classes shows 45% (4826 fire occurrences) of the fire occurrences in areas other than forests, which include croplands and barren or sparsely vegetated land. A majority of fire occurrences is observed in the woodland (56.8%) and wooded grassland (24.6%) class respectively (Table 2). A total of 11.7% fire occurrence is contributed by evergreen and deciduous forests and 4.4% by shrub-lands respectively. This indicates that the occurrence of fire in dense forests on a recurrent basis might affect the regeneration patterns. However, the analysis using fire occurrence data spread over several years will fine-tune the estimates.
Table 2. Distribution of fire occurrence using (A)ATSR night-time satellite data for different vegetation and land cover class. Land cover class mapping was carried out using AVHRR satellite data received from Global Land Cover facility.
Remotesensing 02 00591 i002
A more differentiated pattern of forest fire occurrence as a function of vegetation type is observed in the northern and north-eastern states of India, i.e., Madhya Pradesh, Chattisgarh, Maharasthra, Orissa and Mizoram. Here, fire counts are in the order of 1–2% of the forested area. These states are characterized by a high proportion of deciduous forests, which provide large amounts of dry defoliated material acting as fuel for burning. This may be due to the high fluctuation of ground surface temperature and variation in phenology of forests in these areas.
The bio-geographic zones of India are large distinctive units of similar ecology, biome representation, community and species. The biotic provinces are secondary units within a zone giving weight to particular communities separated by dispersal barriers or gradual change in environmental factors. India is divided into 10 zones and 26 provinces (Figure 1). In the present study, the bio-geographic zone Deccan Peninsula [Eastern Highlands (6C) and Central Highlands (6A)] was found to be prone to the highest fire frequency (Figure 5). Islands, [Andamans (10A), Nicobars (10B) and Lakshadweep (8C)], East Coast (8B) and Desert were the areas with no fire occurrence at all. North East Hills (9B) were found to have high fire frequencies, mainly due to shifting cultivation patterns, which is a common practice in this area. Apart from Central Highlands (6A) and Eastern Highlands (6C), Central Plateau (6D) of Deccan Peninsula and Punjab Plains (4A) also has high fire frequencies. All the areas with high fire occurrences belong to the driest parts of India, with vegetation predominantly composed of dry deciduous forests. These dry deciduous forests are characterized by a higher proportion of teak (Tectona grandis) and sal (Shorea robusta), which results in higher flammability. In the Himalayan region (1A–2D), fire frequency is also high due to the dominant role of coniferous forests having Pinus species, which has high flammability due to its high resin content. Malabar Plains (5A) and Western Ghats Mountain (5B) have less fire occurrences due to the dominant presence of wet evergreen and semi evergreen forest in its vegetation. However, at edges, where these forests are maltreated and have more disturbance and intrusions, they are replaced by dry deciduous and scrub forests, which burn more readily.
Figure 5. Distribution of fire occurrence across bio-geographic zones using A(A)TSR night-time data.
Remotesensing 02 00591 g005
From the conservation point of view, the bio-geographic zones 6A, 6C, 6D and 9B are of highest priority (Figure 5 and Figure 1 refer to bio-geographic zones). In 6A–6C, regular human induced fires-probably due to high temperature and a larger fraction of deciduous and mixed deciduous forests-contribute to a considerable fire regime that needs to be dealt with by conservation authorities. In 9B, irregular human induced fires, mainly due to shifting cultivation, contribute to the fire regime. Highest fire frequency was observed in the protected areas Melghat (88 incidences between 1997 and 2005), Corbett (53) and Ranthambore National Parks (50) (Table 3). In protected areas, 778 fire incidences have been observed within the last eight years. Remarkably, a disproportionately high number of fire events in protected areas (601 out of 778) have happened in dense forests distributed in dry deciduous forest types. Regarding the fire frequency, core area of the Melghat National Park, approx. 10% of the area is being repeated annually and for the fires in the buffer and multiple use area of the reserve is frequent. Similar such intensity of fires was observed in Corbett and Ranthambore National Parks and causes are related to human activities unlike natural causes.
Correlation on fire datasets with other variables using hierarchical partitioning showed that slope and northness are significant on a p < 0.05 level. However, total explained variance is extremely low: r2 = 0.011. This indicates that the only two variables that influence fire presence/absence are slope and northness of exposition. However, their combined explanatory value for fire presence/absence is 1.1% only. Both variables are largely overlapping with their joint contribution for the explanation of fire presence being rather high and their independent contribution being low (Figure 6). In turn, none of the vegetation types influences fire presence.
Table 3. Fire distribution in forest density classes using A(A)TSR night-time data for some protected areas in India (1997–2005).
Remotesensing 02 00591 i003
Figure 6. Hierarchical partitioning of the variance in fire presence/absence explained by precipitation of the driest month, slope and northness, into joint and independent contribution
Remotesensing 02 00591 g006

4. Discussion

The analysis of forest fires in India demonstrates the importance of the fire regime in the entire subcontinent, with potentially severe consequences for the conservation of biodiversity. Our results show that although the frequency of fires varies across different forest densities (ground fires), all types of forest ecosystems in India burn frequently. Thus, in developing countries forest fire could be a more serious problem than illegal felling. Anthropogenic fires favouring species invasion have detrimental consequences on Indian forests [35,8,9,10,11,12,13,14,15,16,17,18,19,20,21,22,23,24,25,26,27,28,29,30,31,32,33,34,35,36,37,38,39,40,41,42,43,44,45,46,47,48,49,50,51,52,53,54,55,56,57,58,59]. Fire occurrence noticed in the present study was extraordinarily high for the year 1999 (n = 2,435), although the years 1997–1998 were the most destructive ones in south-east Asia and Amazonia due to large fires promoted by the influence of El Niño [60,61]. In Indonesia, these fires are said to be among the largest biological selection events in modern history [60,62].
Fire occurrence given by the A(A)TSR satellites in the bio-geographic zones (Deccan, Central Plateau and North East) and states of India (Andhra Pradesh, Chattisgarh, Madhya Pradesh and Mizoram) reach a regular seasonal maximum during March and April. Rising summer temperatures and dry weather conditions promote the occurrences of fire due to human ignition in this region. As the summer progresses to March and April, parts of Central India and Western Ghats predominantly covered with deciduous forests, become dry and leaf-fall aids in quick ignition of fire. In month of May, fires almost subside in the south and become predominant in the northern pine forests of the Himalayan zone. Himalayan zone forests, situated in northern parts of India, predominantly composed of Pinus roxburghii experience heavy fire episodes every year during May and June. High summer temperatures in this region occur around mid-April to May. These fires are attributed to the fact that the temperate forests of the region that have moist conditions till April become more susceptible to human induced fires by May due to dry weather conditions.
These seasonal fire patterns in relation to bio-geographic zones and states are in accordance with other studies using MODIS and DMSP-OLS derived data [35]. Fire occurrences reported by [35] over the Indian region using MODIS and DMSP-OLS satellites showed higher values than in the present study. Comparison of fire locations between A(A)TSR and MODIS active fires (http://maps.geog.umd.edu/firms/) carried out for the Western Ghats (mainly of tropical evergreen forests and savannahs) and Eastern Ghats (tropical deciduous) showed a fire accuracy of 72% with a minimum distance of 100 m between the two products (Figure 7). Comparison of different fire products would help us to understand its reliability and accuracy during the near real-time monitoring of forest fires. The reason could be that A(A)TSR provides night-time fire products, and the majority of fires that occur during the early afternoon have been monitored by MODIS satellites. A number of earlier studies [8,63,64,65,66] indicated that in most ecosystems the daily maximum of fire activity occurs in the early afternoon, when the weather conditions are optimal for biomass burning.
Taking into account the bio-geographic zones of frequent burning, Deccan Peninsula and North East are among the areas of highest priority (Figure 5). The high fire frequency in the Deccan region could be due to the interaction of human ignition, a favourable summer temperature regime and a large fraction of deciduous forests. In contrast, in the North East Hills irregular human induced fires, mainly due to shifting cultivation, contribute to the fire regime (Figure 5). More comprehensive studies on the location of fire occurrence [8,35,35], the extent of burnt area [59] and on quantification in terms of timber, economic loss [29,67,68,69] and ecological loss [32,58,59,60] were carried out.
Slope aspect has long been recognised as an important topographic variable as it influences the amount of solar radiation received throughout the year and has a strong effect on local air temperature, humidity, and soil moisture [70]. Our results indicate that it has a significance in slope and aspect class with p < 0.05 level. [71] confirmed no significant relationship (slope and aspect) influencing wildlife occurrences and its distribution in eastern Kentucky, USA. The authors in [72] found that the number of fires is strongly correlated to forest area and negatively correlated to precipitation and temperature. However, the relationship between environmental variables and forest fire characteristics may be much more complicated. They also suggested that the actual evapotranspiration may explain forest fires better than mean temperature or precipitation, and that there may be a time lag between forest fires and environmental variables in this analysis.
Figure 7. Comparison of A(A)TSR night-time data with MODIS (TERRA) active fire locations for the year 2005. (a) Occurrence of fire in the Western Ghats region, mainly in the tropical rain forest and the Savannahs and (b) Tropical deciduous forest of Eastern Ghats (Background image: MODIS TERRA satellite data of March 19th 2005).
Remotesensing 02 00591 g007
In India, large tracts of forests have been lost to agricultural plantations of coffee, tea, rubber, eucalyptus and sal and to a number of hydroelectric projects [73,74,75]. Across the Western Ghats, 40% of the natural vegetation was lost between 1920 and 1990. This has resulted in increased fragmentation of the remaining habitats [76]. Fragmented areas are more vulnerable to escaped agricultural fires along their extensive edges. Their reduced patch sizes increase the likelihood that entire fragments will burn during each fire event. In the north-east states, the tribal custom of slash and burn (Jhum) cultivation, where forest patches are cleared using fire and used for agriculture, is practised widely. After some years when the soil loses fertility, these patches are abandoned and new land is cleared.
Although we are unable to clearly stratify fire occurrences in relation to forest type, we can state that the majority of fires were seen in deciduous forests and grassland ecosystems, as well as in tropical broad-leaved evergreen forests of Western Ghats and north-east India. These tropical evergreen forests appear to be the ecosystems most threatened by fire. Studies reveal that [77,78,79] these evergreen forests, though resistant to fire propagation are sensitive to fire-related damage and exhibit high mortality levels when fires do occur. In general, species in tropical evergreen forests are poorly adapted to fire disturbance [77], because of their thin bark, buttressed trunks, and stilt root systems [80,81]. Recent studies on the extent of forest fires in India suggest that about 50% of the country’s forests burn yearly [82].
Our results clearly indicate that a majority of the protected areas are prone to human-induced fire, additionally threatened by forest fragmentation. Some of the fires in protected areas are man-made, induced to get more grass for the herbivores. The occurrence of fire in the protected and non-protected areas seems to have different fire-return intervals, probably due to local communities dwelling on the edges of the forests igniting tree patches for their livelihood. Species such as Phyllanthus emblica, Terminalia chebula, Madhuca longifolia, Diospyros melanoxylon leaves, Cymbopogon species grass and other tree species are harvested heavily and this contributes to human-induced fire. Thus, protected areas, especially those with high fire occurrence need to be given priority for conservation.

5. Conclusions

Results obtained in this study demonstrate the potential use of (A)ATSR satellite data in understanding the spatial and temporal variability on fire occurrences in different land cover types, biogeographic zones as well as in bioclimatic conditions. The study showed partial relationship on forest fires with variables like climate (dry month) and slope, northness (cosine of aspect). It showed that fire patterns can be attributed to spatial resolution, local climatic condition or other variables that need to be understood. We suggest the use to biophysical variables like Vegetation Index, biomass or Land Surface Temperature (LST) over time to explain forest fires better than mean temperature or precipitation. The results are valuable to identify the regions mostly affected by each event, and to support ecological studies and atmospheric impact assessments. In order to create a comprehensive forest / fire management plan at a regional and local level, a thorough understanding of fire behavior in the region is needed, and for this, consistent and comprehensive wildland fire statistics and demography are important. Currently, only a few countries are in the position to present reliable wildland fire statistics indicating the number of forest fires or the area affected, and the ones that do are not consistent with each other. Today remote sensing offers continuous coverage on the daily occurrence of fire pattern and its ignition rate, but it is difficult to validate due to the lack of availability and uniformity of fire data records at field level which limits our understanding of the importance of forest fires across the region. The issue of standardized wildland fire reporting should be addressed at the national and regional level. The present study clearly demonstrates the usefulness of satellite remote sensing technique for precise delineating the location and extent of forest fire. Such information can be put into Geographical Information System (GIS) along with other parameters for further analysis, modeling for forest fire hazard zonation, which would certainly improve both the management of the forests and forest fires.

Acknowledgements

We are grateful to Directors of National Remote Sensing Centre, French Institute of Pondicherry and Deputy Director (RS/GIS–AA), NRSC, for their kind encouragement and valued directions. The authors sincerely acknowledge the data provided by "ATSR World Fire Atlas", European Space Agency. We are thankful to NASA/University of Maryland for providing MODIS Active Fire datasets under FIRMS [distributors] Available on-line [http://maps.geog.umd.edu]. We sincerely thank Vroni Retzer, Department of Biogeography, University of Bayreuth, Germany for statistical analysis. The findings expressed in the paper are mine and are not necessarily related to the views of ICIMOD.

References

  1. Gubbi, S. Fire, fire burning bright in Deccan Herald, Bangalore, India. Available online: http://www.wildlifefirst.info/images/wordfiles/fire.doc (accessed on January 2004).
  2. Andreae, M.O.; Atlas, E.; Harris, G.W.; Helas, G.; de Kock, A.; Koppmann, R.; Maenhaut, W.; Mano, S.; Pollock, W.H.; Rudolph, J.; Scharffe, S.; Schebeske, G.; Welling, M. Methyl halide emissions from savanna fires in southern Africa. J. Geophys. Res. 1996, 101, 23603–23613. [Google Scholar] [CrossRef]
  3. Hao, W.M.; Liu, M.H. Spatial and temporal distribution of biomass burning. Global Biogeochem. Cycle. 1994, 8, 495–503. [Google Scholar] [CrossRef]
  4. Muller, J.; Brasseur, G.P. IMAGES: a three-dimensional chemical-transport model of the global troposphere. J. Geophys. Res. 1995, 100, 16455–16490. [Google Scholar] [CrossRef]
  5. Ward, D.E. Factors Influencing the emissions of gases and particulate matter from biomass burning. Ecolog. Stud. Anal. Syn. USA 1990, 84, 418–425. [Google Scholar]
  6. Crutzen, P.J.; Andreae, M.O. Biomass burning in the tropics: impact on atmospheric chemistry and biogeochemical cycles. Science 1990, 250, 1669–1678. [Google Scholar] [CrossRef] [PubMed]
  7. Dwyer, E.J.; Pereira, J.M.C.; Gŕegoire, J.M.; DaCamera, C.C. Characterization of the spatio-temporal patterns of global fire activity using satellite imagery for the period April 1992 to March 1993. J. Biogeo. 1999, 1, 57–69. [Google Scholar] [CrossRef]
  8. Csiszar, I.; Denis, L.; Giglio, L.; Justice, C.O.; Hewson, J. Global fire activity from two years of MODIS data. Int. J. Wild. Fire 2005, 14, 117–130. [Google Scholar] [CrossRef]
  9. Robinson, J.M. Fire from space: global evaluation using infrared remote sensing. Int. J. Remote Sens. 1991, 12, 3–24. [Google Scholar] [CrossRef]
  10. Cooke, W.F.; Koffi, B.; Gŕegoire, J.M. Seasonality of vegetation fires in Africa from remote sensing data and application to a global chemistry model. J. Geophys. Res. 1996, 101, 21051–21066. [Google Scholar] [CrossRef]
  11. Barbosa, P.M.; Stroppiana, D.; Gŕegoire, J.M.; Pereira, J.M.C. An assessment of vegetation fire in Africa (1981–1991): Burned areas, burned biomass, and atmospheric emissions. Global Biogeo. Cycle 1999, 13, 933–950. [Google Scholar] [CrossRef]
  12. Prins, E.M.; Menzel, W.P. Geostationary satellite detection of biomass burning in South America. Int. J. Remote Sens. 1992, 13, 2783–2799. [Google Scholar] [CrossRef]
  13. Amiro, B.D.; Todd, J.B.; Wotton, B.M.; Logan, K.A.; Flannigan, M.D.; Stocks, B.J.; Mason, J.A.; Martell, D.L.; Hirsch, K.G. Direct carbon emissions from Canadian forest fires, 1959 to 1999. Canadian J. For. Res. 2001, 31, 512–525. [Google Scholar] [CrossRef]
  14. Lovejoy, T.E. Biomass burning and the disappearing tropical rainforest. In Global Biomass Burning; Levine, J.S., Ed.; MIT Press: Cambridge, UK, 1991; pp. 77–82. [Google Scholar]
  15. Christensen, N.L. Fire regimes and ecosystem dynamics. In Fire in the Environment; Crutzen, P.J., Goldammer, J.G., Eds.; Wiley: New York, NY, USA, 1993; pp. 233–244. [Google Scholar]
  16. White, P.S.; Jentsch, A. The search for generality in studies of disturbance and ecosystem dynamics. In Progress in Botany 62; Kessler, E., Lüttge, U., Kadereit, J.W., Beyschlag, W., Eds.; Springer: Berlin, Heidelberg, Germay, 2001; pp. 399–449. [Google Scholar]
  17. Menaut, J.C.; Abbadie, L.; Vitousek, P.M. Nutrient and organic matter dynamics in tropical ecosystems. In Fire in the Environment; Crutzen, P.J., Goldammer, J.G., Eds.; Wiley: New York, NY, USA, 1993; pp. 215–230. [Google Scholar]
  18. Meyn, A.; White, P.S.; Buhk, C.; Jentsch, A. Environmental drivers of large, infrequent wildfires: the emerging conceptual model. Progress Phys. Geog. 2007, 31, 287–312. [Google Scholar] [CrossRef]
  19. Rodgers, W.A.; Panwar, H.S.; Mathur, V.B. Wildlife Protected Area Network in India—A Review: Executive Summary; Wildlife Institute of India: Dehradun, India, 2002; p. 44.
  20. Wikramanayake, E.D.; Dinerstein, E.; Robinson, J.G.; Karanth, K.U.; Rabinowitz, A.; Olson, D.; Mathew, T.; Hedao, P.; Corner, M.; Hemley, G.; Bolze, D. An ecology-based method for defining priorities for large mammal conservation: the tiger as case study. Cons. Biol. 1998, 12, 865–878. [Google Scholar] [CrossRef]
  21. Murphy, P.G.; Lugo, A.E. Ecology of tropical dry forest. Annual Review of Ecology and Systematics 1986, 17, 67–88. [Google Scholar] [CrossRef]
  22. Sagar, R.; Singh, J.S. Local plant species depletion in a tropical deciduous forest of northern India. Environ. Conser. 2004, 31, 55–62. [Google Scholar] [CrossRef]
  23. State of the Forest Report (SFR); Forest survey of India, Ministry of Environment and Forests: New Delhi, India, 2001.
  24. Bahuguna, V.K. Forest fire prevention and control strategies in India. Int. For. Fire News 1999, 20, 5–9. [Google Scholar]
  25. MoEnF. National Forestry Action Plan; Ministry of Environment and Forests (MoEnF), Government of India: New Delhi, India, 1999.
  26. Saha, S.; Howe, H.F. The bamboo fire cycle hypothesis: a comment. Amer. Nat. 2001, 158, 659–663. [Google Scholar] [CrossRef] [PubMed]
  27. Gadgil, M.; Meher-Homji, V.M. Ecology and Management of World’s Savannas; Tothill, V.M., Mott, J.C., Eds.; Australian Academy of Science: Canberra, Australian, 1985; pp. 107–113. [Google Scholar]
  28. Schule, W. Landscapes and climate in prehistory: interactions of wildlife, man, and fire. Fire in the tropical biota: ecosystem processes and global challenges. Ecol. Stud. 1990, 84, 273–318. [Google Scholar]
  29. Raman, T.R.S.; Rawat, G.S.; Johnsingh, A.J.T. Recovery of tropical rainforest avifauna in relation to vegetation succession following shifting cultivation in Mizoram, North-East India. J. Applied Ecol. 1998, 35, 214–231. [Google Scholar] [CrossRef]
  30. Ganesan, R.; Setty, R.S. Regeneration of amla (Phyllanthus emblica and P. indofischeri), an important NTFP from southern India. Cons. Soc. 2004, 2, 365–375. [Google Scholar]
  31. Rodgers, W.A. The role of fire in the management of wildlife habitats: a review. Indian For. 1986, 112, 845–857. [Google Scholar]
  32. Saha, S. Anthropogenic fire regime in a deciduous forest of central India. Current Science 2002, 82, 1144–1147. [Google Scholar]
  33. Bond, W.J.; Woodward, F.I.; Midgley, G.F. The global distribution of ecosystems in a world without fire. New Phytol. 2005, 165, 525–537. [Google Scholar] [CrossRef] [PubMed]
  34. Goldammer, J.G.; Furyaev, V.V. Fire in Ecosystems of Boreal Eurasia; Kluwer Academic: Dordrecht, the Netherlands, 1996. [Google Scholar]
  35. Kiran-Chand, T.R.; Badarinath, K.V.S.; Krishna-Prasad, V.; Murthy, M.S.R.; Elvidge, C.D.; Tuttle, B.T. Monitoring forest fires over the Indian region using Defense Meteorological Satellite Program-Operational Linescan System nighttime satellite data. Remote Sens. Environ. 2006, 103, 165–178. [Google Scholar] [CrossRef]
  36. Wooster, M.J.; Ceccato, P.; Flasse, S.P. Indonesian fires observed using AVHRR. Int. J. Remote Sens. 1998, 19, 383–386. [Google Scholar] [CrossRef]
  37. Di Bella, C.M.; Jobbágy, E.G.; Paruelo, J.M.; Pinnock, S. Continental fire density patterns in South America. Global Ecol. Biogeo. 2006, 15, 192–199. [Google Scholar] [CrossRef]
  38. Li, Z.; Kaufman, Y.J.; Ichoku, C.; Fraser, R.; Trishchenkp, A.; Giglio, L.; Jin, J.; Yu, X. A review of AVHRR-based active fire detection algorithms: principles, limitations and recommendations. In Global and Regional Vegetation Fire Monitoring from Space: Planning a Coordinated International Effort; SPB Academic: The Hague, The Netherlands, 2001; pp. 199–225. [Google Scholar]
  39. Giglio, L.; Justice, C.O. Effect of wavelength selection on characterization of fire size and temperature. Int. J. Remote Sens. 2003, 24, 3515–3520. [Google Scholar] [CrossRef]
  40. Nayar, M.P. Hot Spots of Endemic Plants of India, Nepal and Bhutan; Tropical Botanical Garden and Research Institute: Thiruvananthapuram, India, 1996. [Google Scholar]
  41. Rodger, W.A.; Panwar, H.S. Planning Wildlife Protected Areas Network in India; Wildlife Institute of India: New Delhi, India, 1988; Volumes 1 and 2.
  42. Champion, H.G.; Seth, S.K. A Revised Survey of Forest Types of India; Government of India: New Delhi, India, 1968.
  43. Arino, O.; Plummer, S.; Defrenne, D. The ATSR-2 and AATSR World Fire Atlas Products: Validation, Consistency and Relationship with Climate Variables, ENVISAT; Austria, 2004. [Google Scholar]
  44. Arino, O.; Plummer, S.; Defrenne, D. Fire Disturbance: the Ten Years Time Series of the ATSR World Fire Atlas. In Proceedings MERIS-AATSR Symposium, Frascati, Italy, September 2005.
  45. Mota, B.W.; Pereira, J.M.C.; Oom, D.; Vasconcelos, M.J.P.; Schultz, M. Screening the ESA ATSR-2 World Fire Atlas (1997–2002). Atmos. Chem. Phys. Discuss. 2005, 5, 4641–4677. [Google Scholar] [CrossRef]
  46. Malingreau, J.P. The contribution of remote sensing to the global monitoring of fires in tropical and subtropical ecosystems. In Fire in the Tropical Biota; Goldammer, J.G., Ed.; Springer-Verlag: Berlin, Germany, 1990; pp. 337–370. [Google Scholar]
  47. Kaufmann, Y.J.; Setzer, A.; Justice, C.; Tucker, C.J.; Pereira, J.M.C.; Fung, I. Remote sensing of biomass burning in the tropics. In Fire in the Tropical Biota; Goldammer, J.G., Ed.; Springer-Verlag: Berlin, Germany, 1990; pp. 371–399. [Google Scholar]
  48. Kennedy, P.J.; Belward, A.S.; Gregoire, J.M. An improved approach to fire monitoring in West Africa using AVHRR data. Int. J. Remote Sens. 1994, 15, 2235–2255. [Google Scholar] [CrossRef]
  49. Prata, A.J. Land surface temperatures derived from the advanced very high resolution radiometer and the along-track scanning radiometer. 2: experimental results and validation of AVHRR algorithms. J. Geophys. Res. 1994, 99, 13025–13058. [Google Scholar] [CrossRef]
  50. World Database on Protected Areas (2004). World Conservation Union (IUCN) and UNEP-World Conservation Monitoring Centre (UNEP-WCMC). Available online at: http://www.wdpa.org/Default.aspx (accessed on 2 February 2010).
  51. Hijmans, R.J.; Cameron, S.E.; Parra, J.L.; Jones, P.G.; Jarvis, A. The WorldClim interpolated global terrestrial climate surfaces. 2004; Version 1.3. [Google Scholar]
  52. Census of India. Population Census of India, Government of India. 2001. [Google Scholar]
  53. USGS. HYDRO1k Elevation Derivative Database. U.S. Geological Survey. Available online at: http://eros.usgs.gov/ (accessed on 21 December 2009).
  54. Chevan, A.; Sutherland, M. Hierarchical Partitioning. Amer. Statist. 1991, 45, 90–96. [Google Scholar]
  55. Mac Nally, R. Multiple regression and inference in ecology and conservation biology: further comments on identifying important predictor variables. Biod. Cons. 2002, 11, 1397–1401. [Google Scholar] [CrossRef]
  56. R Development Core Team. R: A Language and Environment for Statistical Computing; R Foundation for Statistical Computing: Vienna, Austria, 2007; Available online: http://www.R-project.org/ (accessed on 16December 2009).
  57. Mac-Nally, R.; Walsh, C.J. Hierarchical partitioning public-domain software. Biod. Cons. 2004, 13, 659–660. [Google Scholar] [CrossRef]
  58. Hiremath, A.J.; Sundaram, B. The fire-Lantana cycle hypothesis in Indian forests. Cons. Soc. 2005, 3, 26–42. [Google Scholar]
  59. Kodandapani, N.; Cochrane, M.A.; Sukumar, R. Conservation threat of increasing fire frequencies in the Western Ghats, India. Cons. Biol. 2004, 18, 1553–1561. [Google Scholar] [CrossRef]
  60. Brown, N. Out of control: fires and forestry in Indonesia. Trend. Ecol. Evolut. 1998, 13, 41–44. [Google Scholar] [CrossRef]
  61. Laurance, W.F. A crisis in the making: responses of Amazonian forests to land use and climate change. Trend. Ecol. Evolut. 1998, 13, 411–415. [Google Scholar] [CrossRef]
  62. Kinnaird, M.F.; O'Brien, T.G. Ecological effects of wildfire on lowland rainforest in Sumatra. Cons. Biol. 1998, 12, 954–956. [Google Scholar] [CrossRef]
  63. Eva, H.; Lambin, E.F. Remote sensing of biomass burning in tropical regions: sampling issues and multisensor approach. Remote Sens. Environ. 1998, 64, 292–315. [Google Scholar] [CrossRef]
  64. Menzel, W.P.; Prins, E.M. Monitoring biomass burning with the new generation of geostationary satellites. In Biomass Burning and Global Change: Remote Sensing, Modeling and Inventory Development, and Biomass Burning in Africa; Levine, J.S., Ed.; MIIT Press: Cambridge, MA, USA, 1996; pp. 56–64. [Google Scholar]
  65. Pack, D.W.; Rice, C.J.; Tressel, B.J.; Lee-Wagner, C.J.; Oshika, E.M. Civilian uses of surveillance satellites. Crosslink 2000, 1, 2–8. [Google Scholar]
  66. Giglio, L.; Csiszar, I.; Justice, C.O. Global distribution and seasonality of active fires as observed with the Terra and Aqua Moderate Resolution Imaging Spectroradiometer (MODIS) sensors. J. Geophysical Res. 2006, 111, G02016. [Google Scholar] [CrossRef]
  67. Roy, P.S.; Talukdar, G.; Joshi, P.K. Landscape ecology approach for spatial biodiversity characterization. Botanica 2001, 51, 1–17. [Google Scholar]
  68. Roy, P.S. Biodiversity Characterisation at Landscape Level in Western Ghats India using Satellite Remote Sensing and Geographic Information System; Indian Institute of Remote Sensing (National Remote Sensing Agency), Department of Space, Government of India: Dehradun India, 2002.
  69. Srivastava, R.J. Forest fire and biotic interferences—a great threat to Nilgiri biosphere. Int. For. Fire News 2002, 26, 32–36. [Google Scholar]
  70. Rosenberg, N.J.; Blad, B.L.; Verma, S.B. Microclimate—The Biological Environment; John Wiley and Sons: New York, NY, USA, 1983. [Google Scholar]
  71. Maingi, J.K.; Henry, M.C. Factors influencing wildfire occurrence and distribution in eastern Kentucky, USA. Int. J. Wild. Fire 2007, 16, 23–33. [Google Scholar] [CrossRef]
  72. Choi, S.D.; Chang, Y.S.; Park, B.K. Increase in carbon emission from forest fires after intensive reforestation and forest management programs. Sci. Total Envi. 2006, 372, 225–235. [Google Scholar] [CrossRef] [PubMed]
  73. Giriraj, A. Spatial characterization and conservation prioritization of in Tropical Evergreen Forests of Western Ghats, Tamil Nadu using Geoinformatics. Ph.D. Thesis, Bharathidasan University, Thiruchirapalli, India, 2006. [Google Scholar]
  74. Ramesh, B.R. Patterns of vegetation, biodiversity and endemism in the Western Ghats. Memoir Geol. Soci. India 2001, 47, 973–981. [Google Scholar]
  75. Subramanyam, K.; Nayar, M.P. Vegetation and phytogeography of the Western Ghats. Memoir Geol. Soci. India 2001, 47, 945–959. [Google Scholar]
  76. Menon, S.; Bawa, K.S. Applications of geographic information systems, remote-sensing, and a landscape ecology approach to biodiversity conservation in the Western Ghats. Curr. Sci. 1997, 73, 134–144. [Google Scholar]
  77. Uhl, C.; Kauffman, J.B. Deforestation, fire susceptibility, and potential tree responses to fire in the Eastern Amazon. Ecology 1990, 71, 437–449. [Google Scholar] [CrossRef]
  78. Cochrane, M.A.; Schulze, M.D. Fire as a recurrent event in tropical forests of the eastern Amazon: effects on forest structure, biomass, and species composition. Biotropica 1999, 31, 2–16. [Google Scholar] [CrossRef]
  79. Slik, J.W.; Verburg, R.W.; Kebler, P.J.A. Effects of fire and selective logging on the tree species composition of lowland dipterocarp forest in East Kalimantan, Indonesia. Biod. Cons. 2002, 11, 85–98. [Google Scholar]
  80. Barlow, J.; Peres, C.A.; Lagan, B.; Haugaasen, T. Large tree mortality and decline of forest biomass following Amazon wildfires. Ecol. Letters 2003, 6, 6–8. [Google Scholar] [CrossRef]
  81. Hedge, V.; Chandran, M.D.S.; Gadgil, M. Variation in bark thickness in a tropical forest community of Western Ghats in India. Func. Ecol. 1998, 12, 313–318. [Google Scholar]
  82. World Wildlife Fund. Forest Fires in India; WWF: New Delhi, India, 2003. [Google Scholar]

