
Climate-Adaptive Potential Crops Selection in Vulnerable Agricultural Lands Adjacent to the Jamuna River Basin of Bangladesh Using Remote Sensing and a Fuzzy Expert System

Abstract
:1. Introduction
2. Materials and Methods
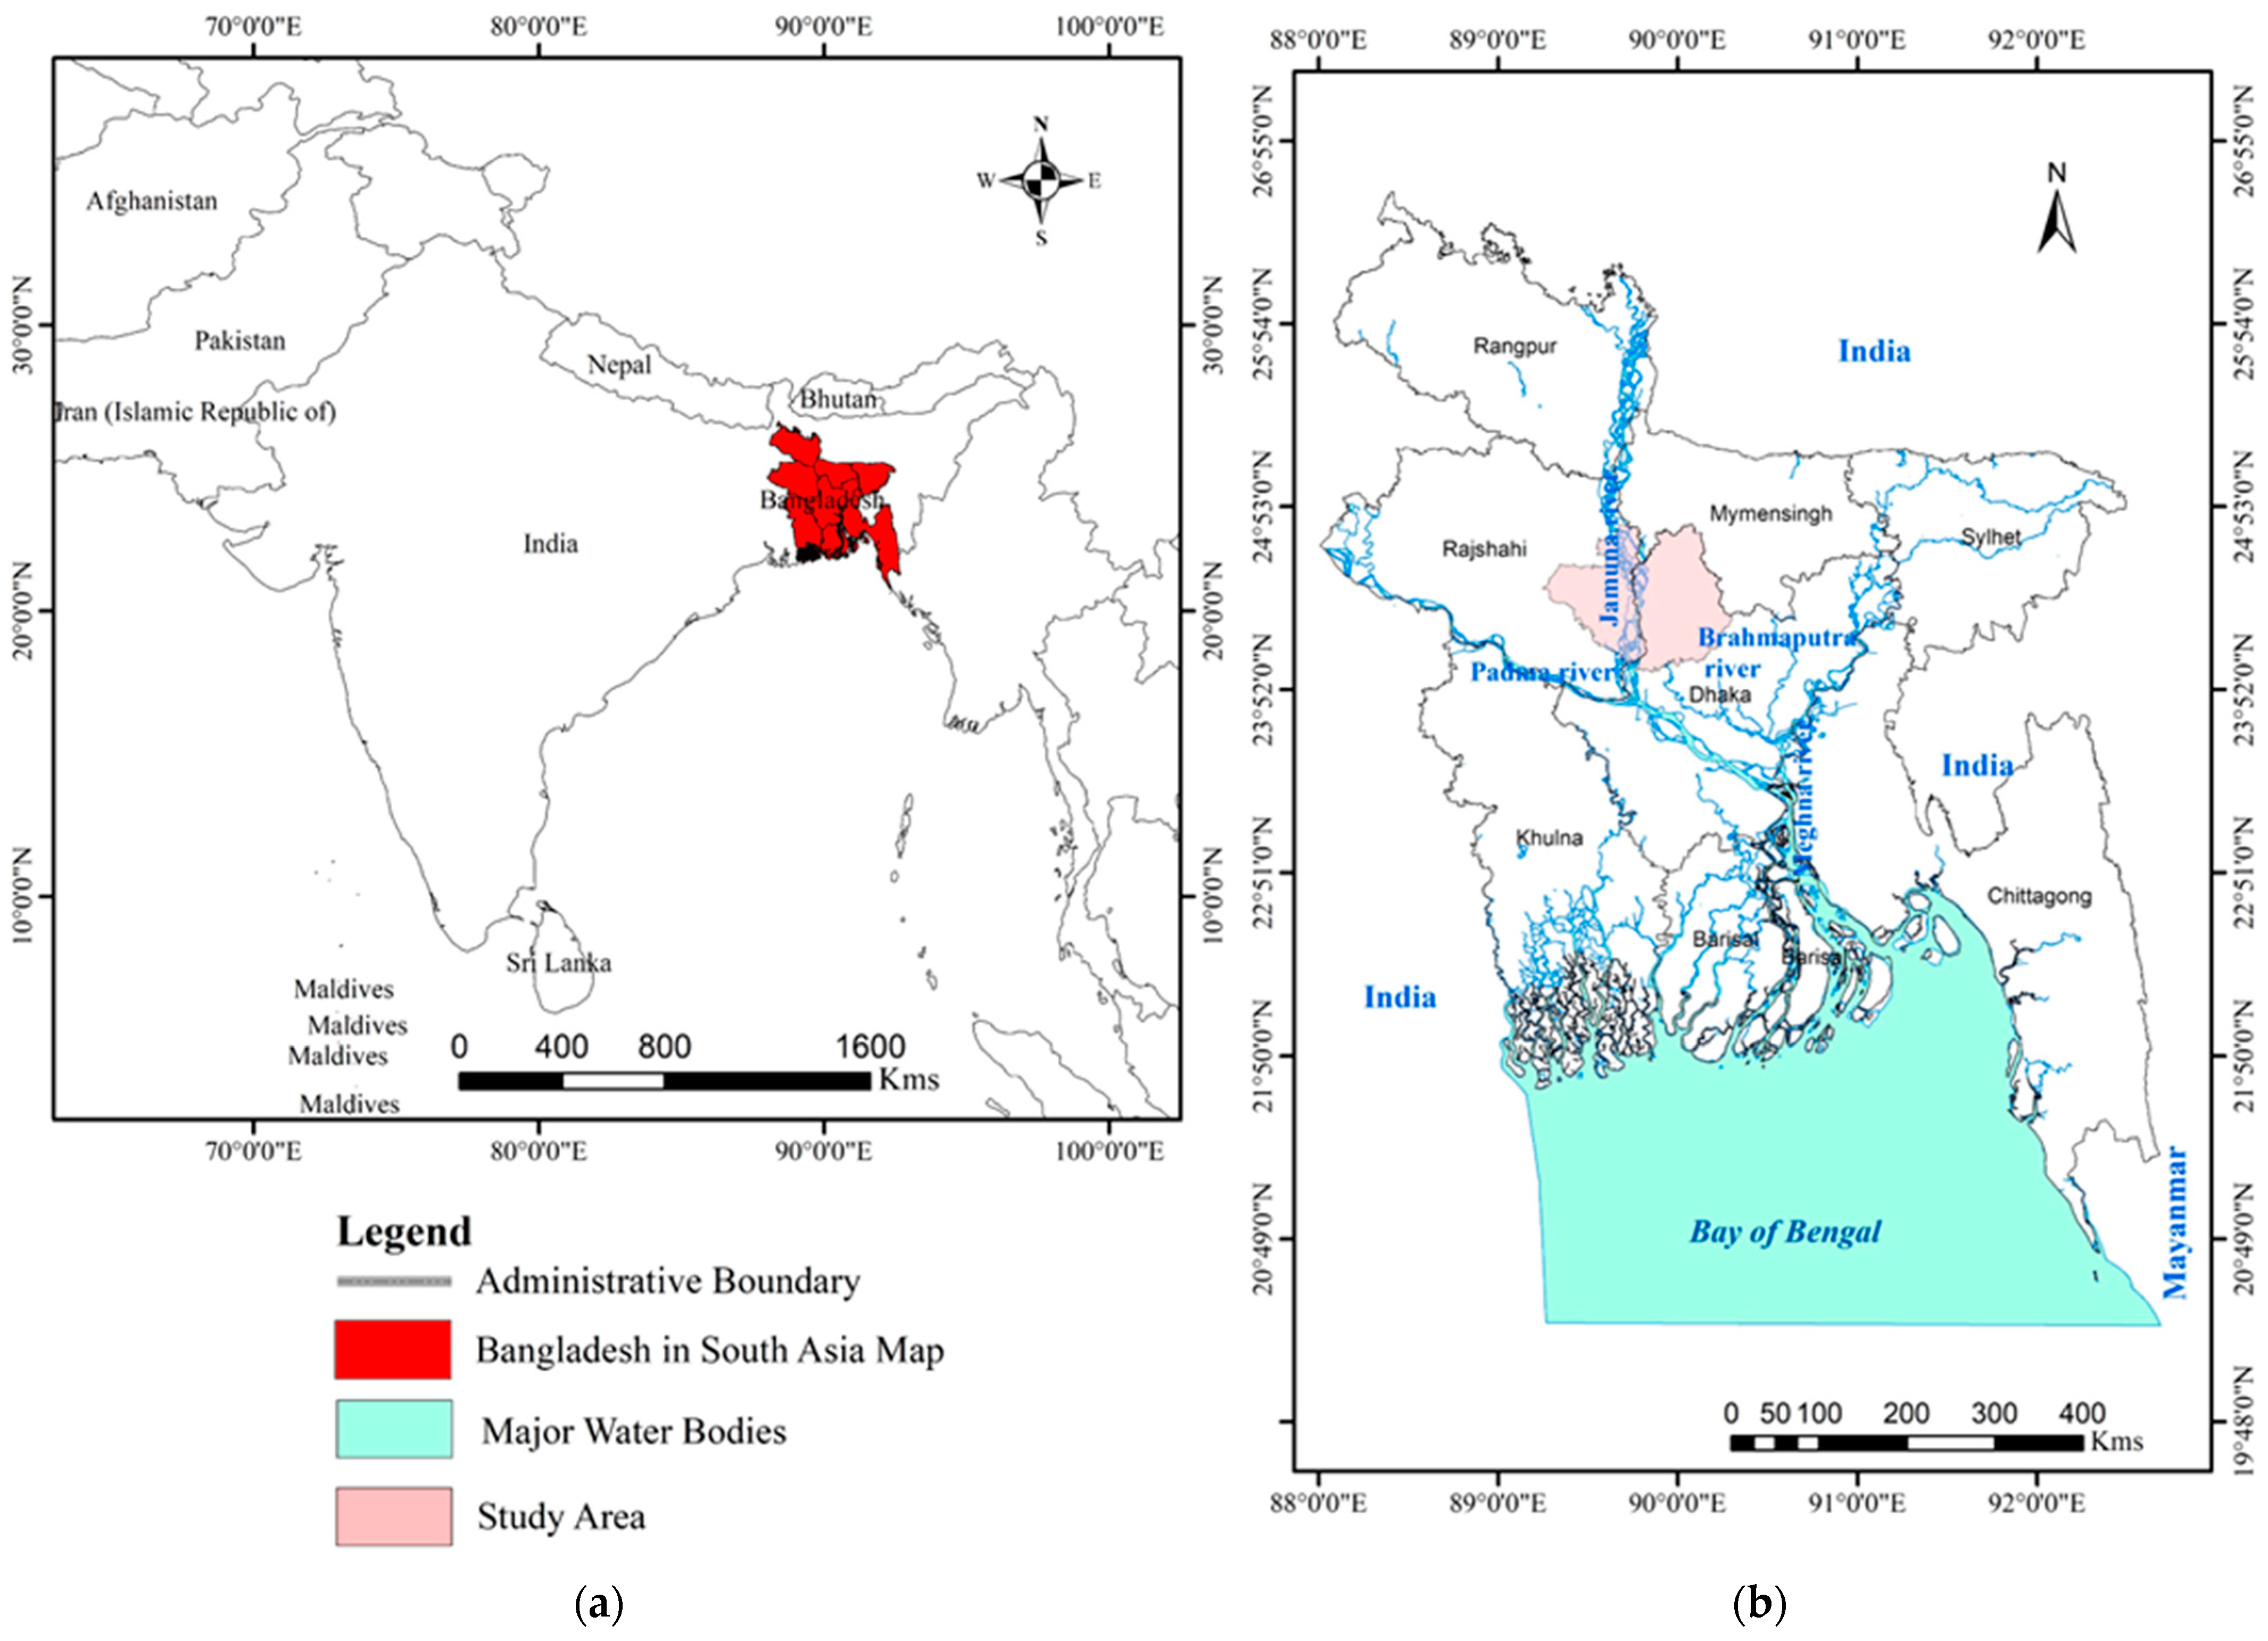
2.1. Study Area
2.2. Datasets for Spatial Analysis
2.3. Research Framework
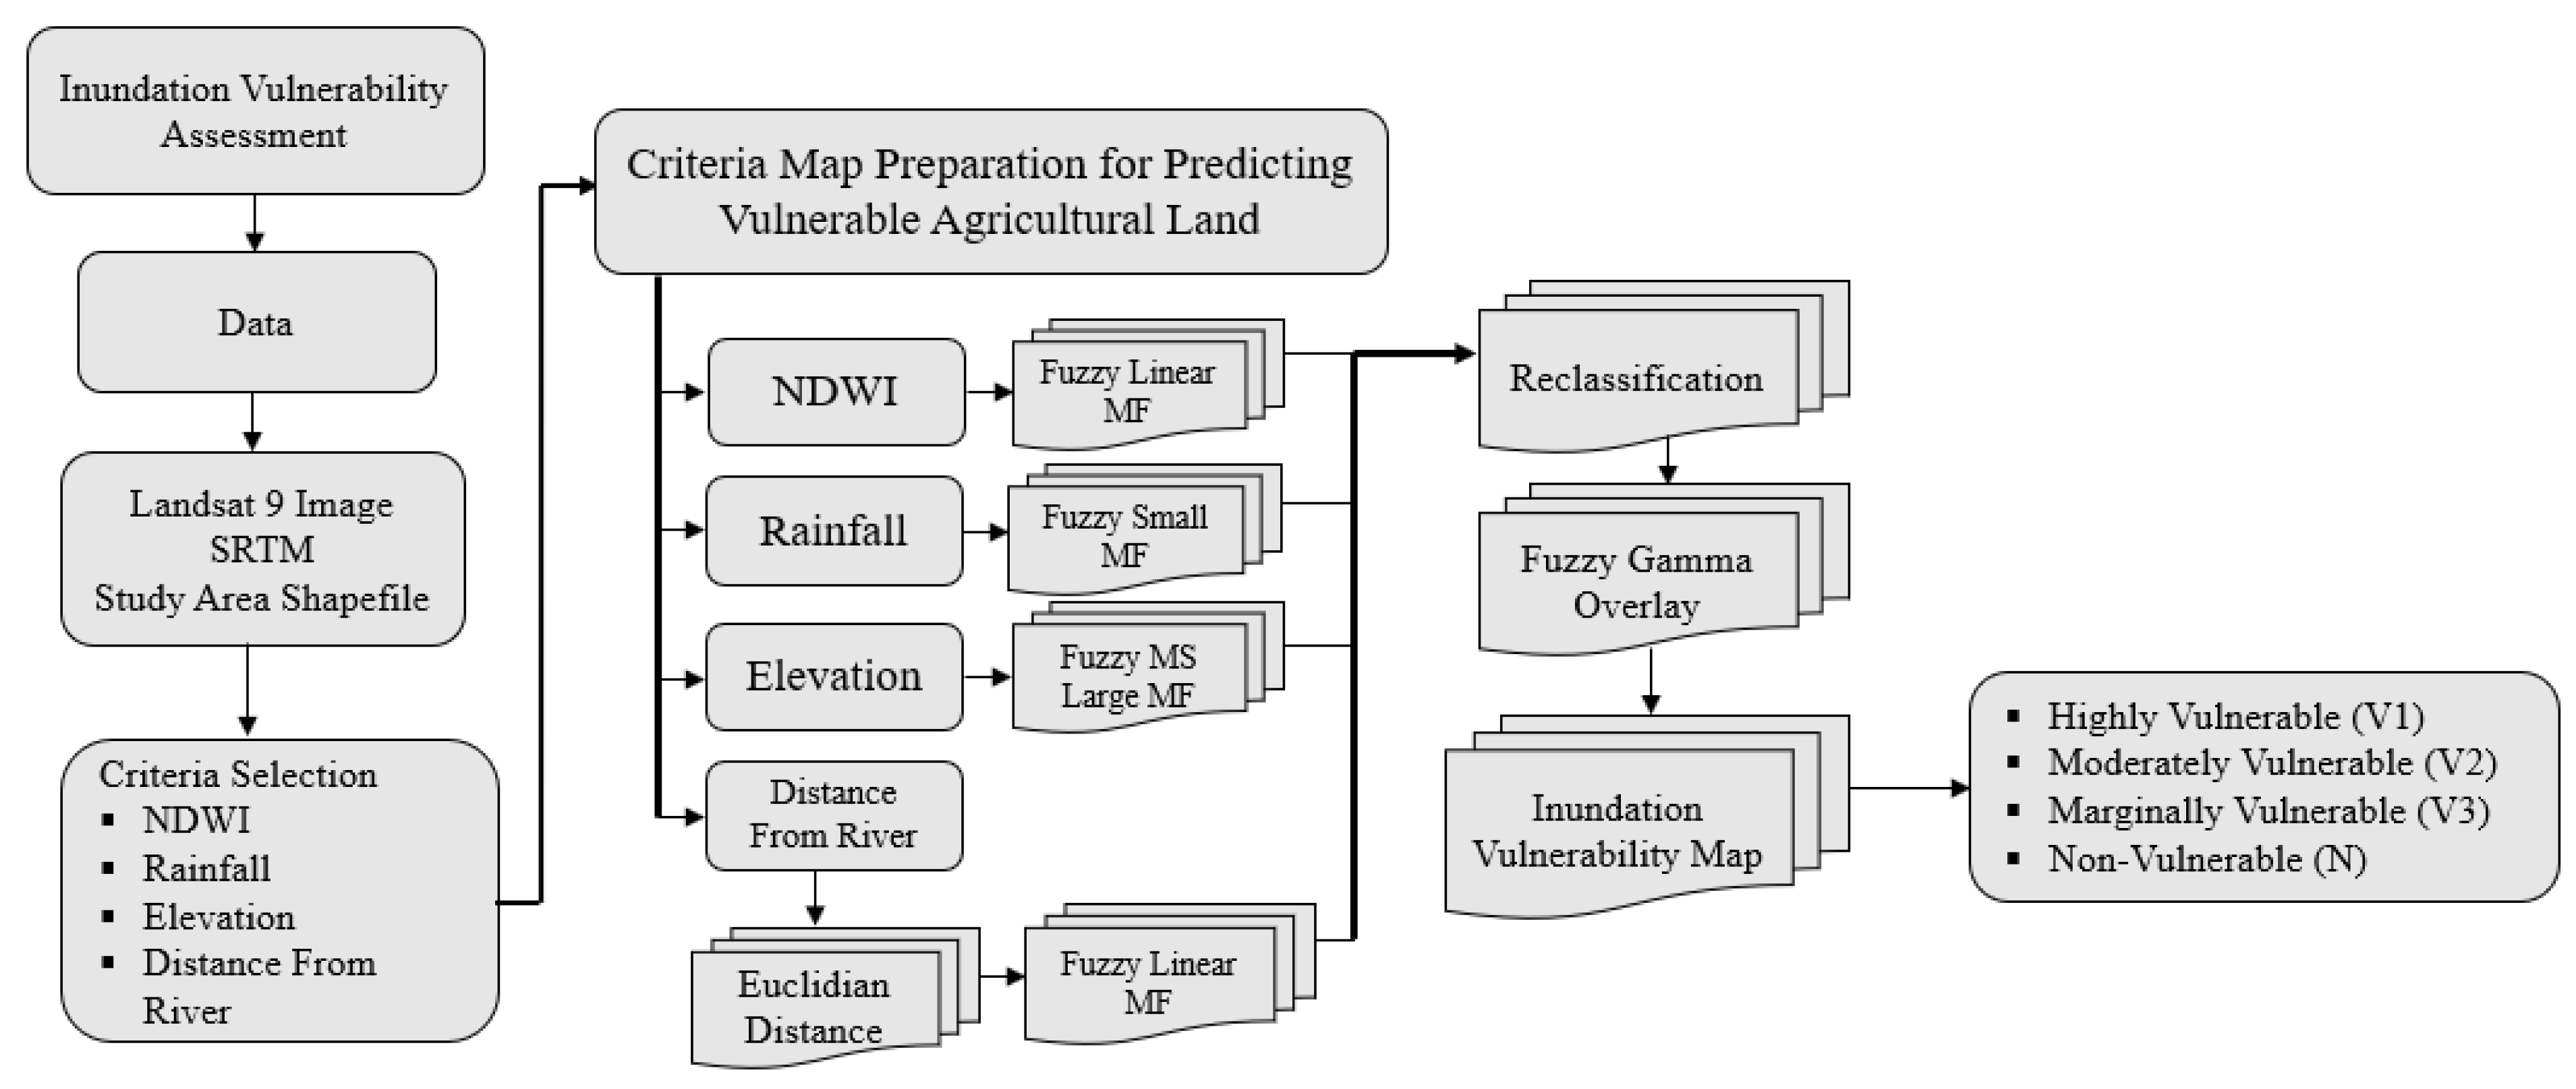
2.3.1. Inundation Vulnerability Assessment
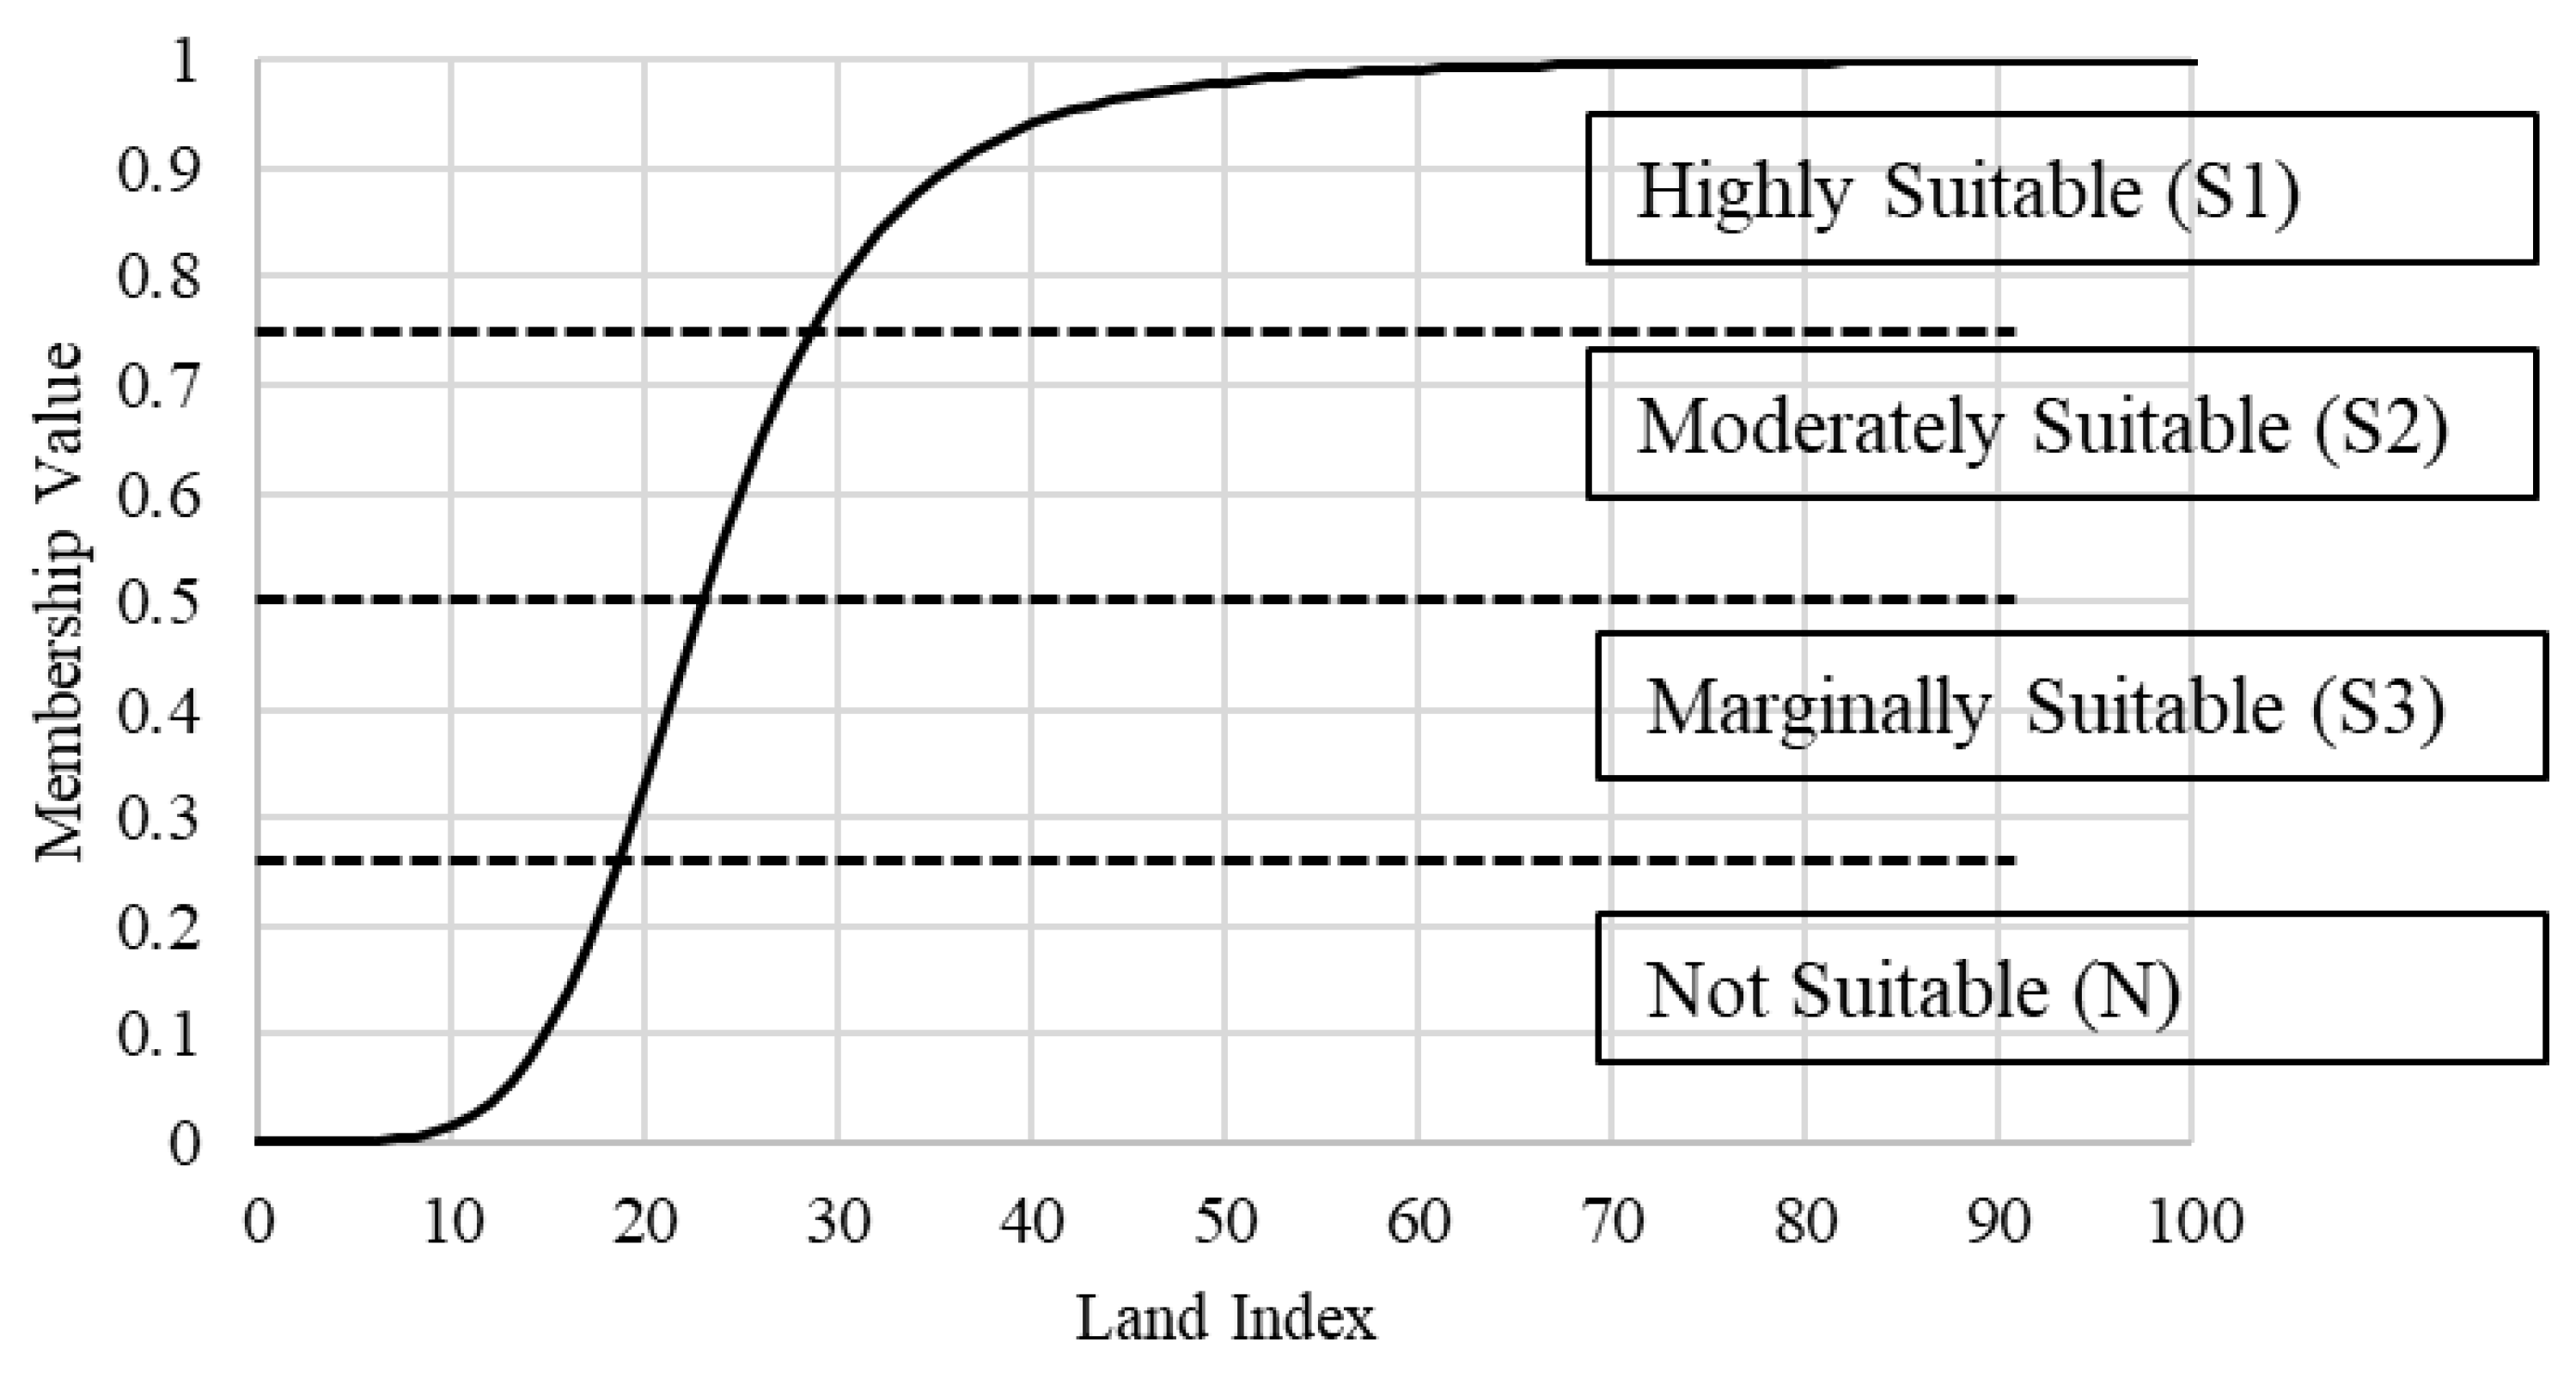
Reclassification of Fuzzy Membership Function
Criteria Selection for Inundation Vulnerability Assessment
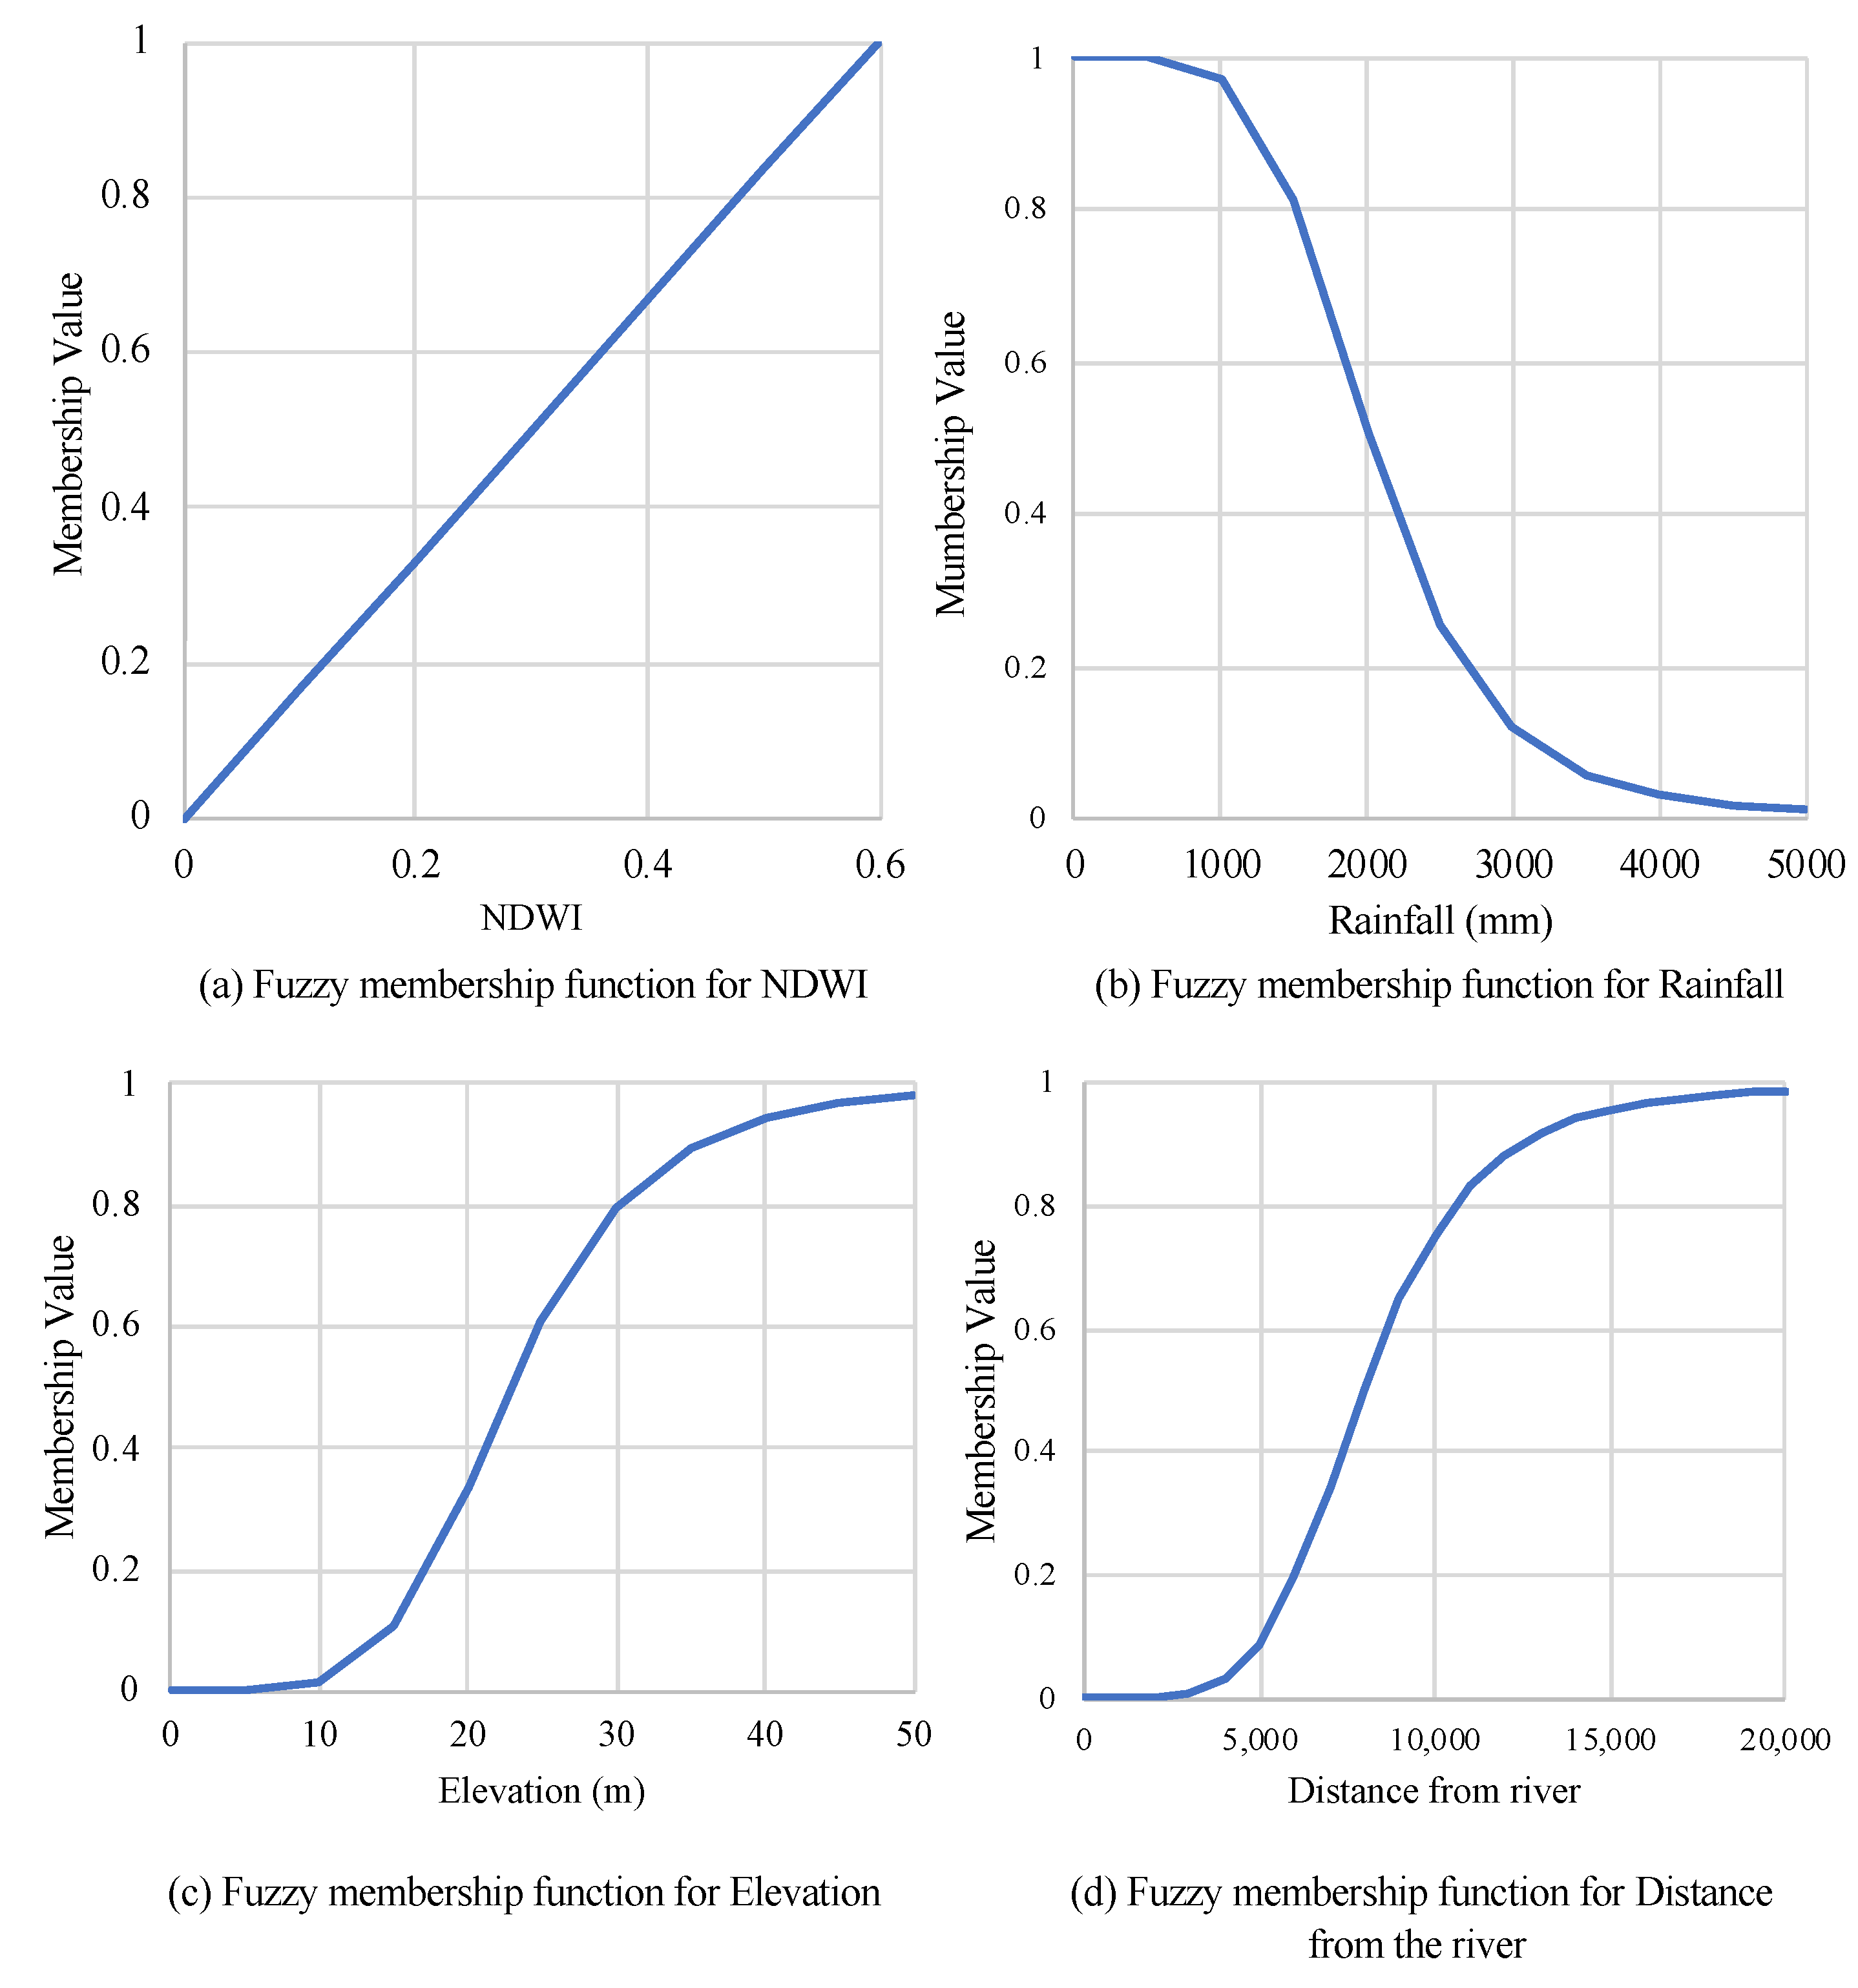
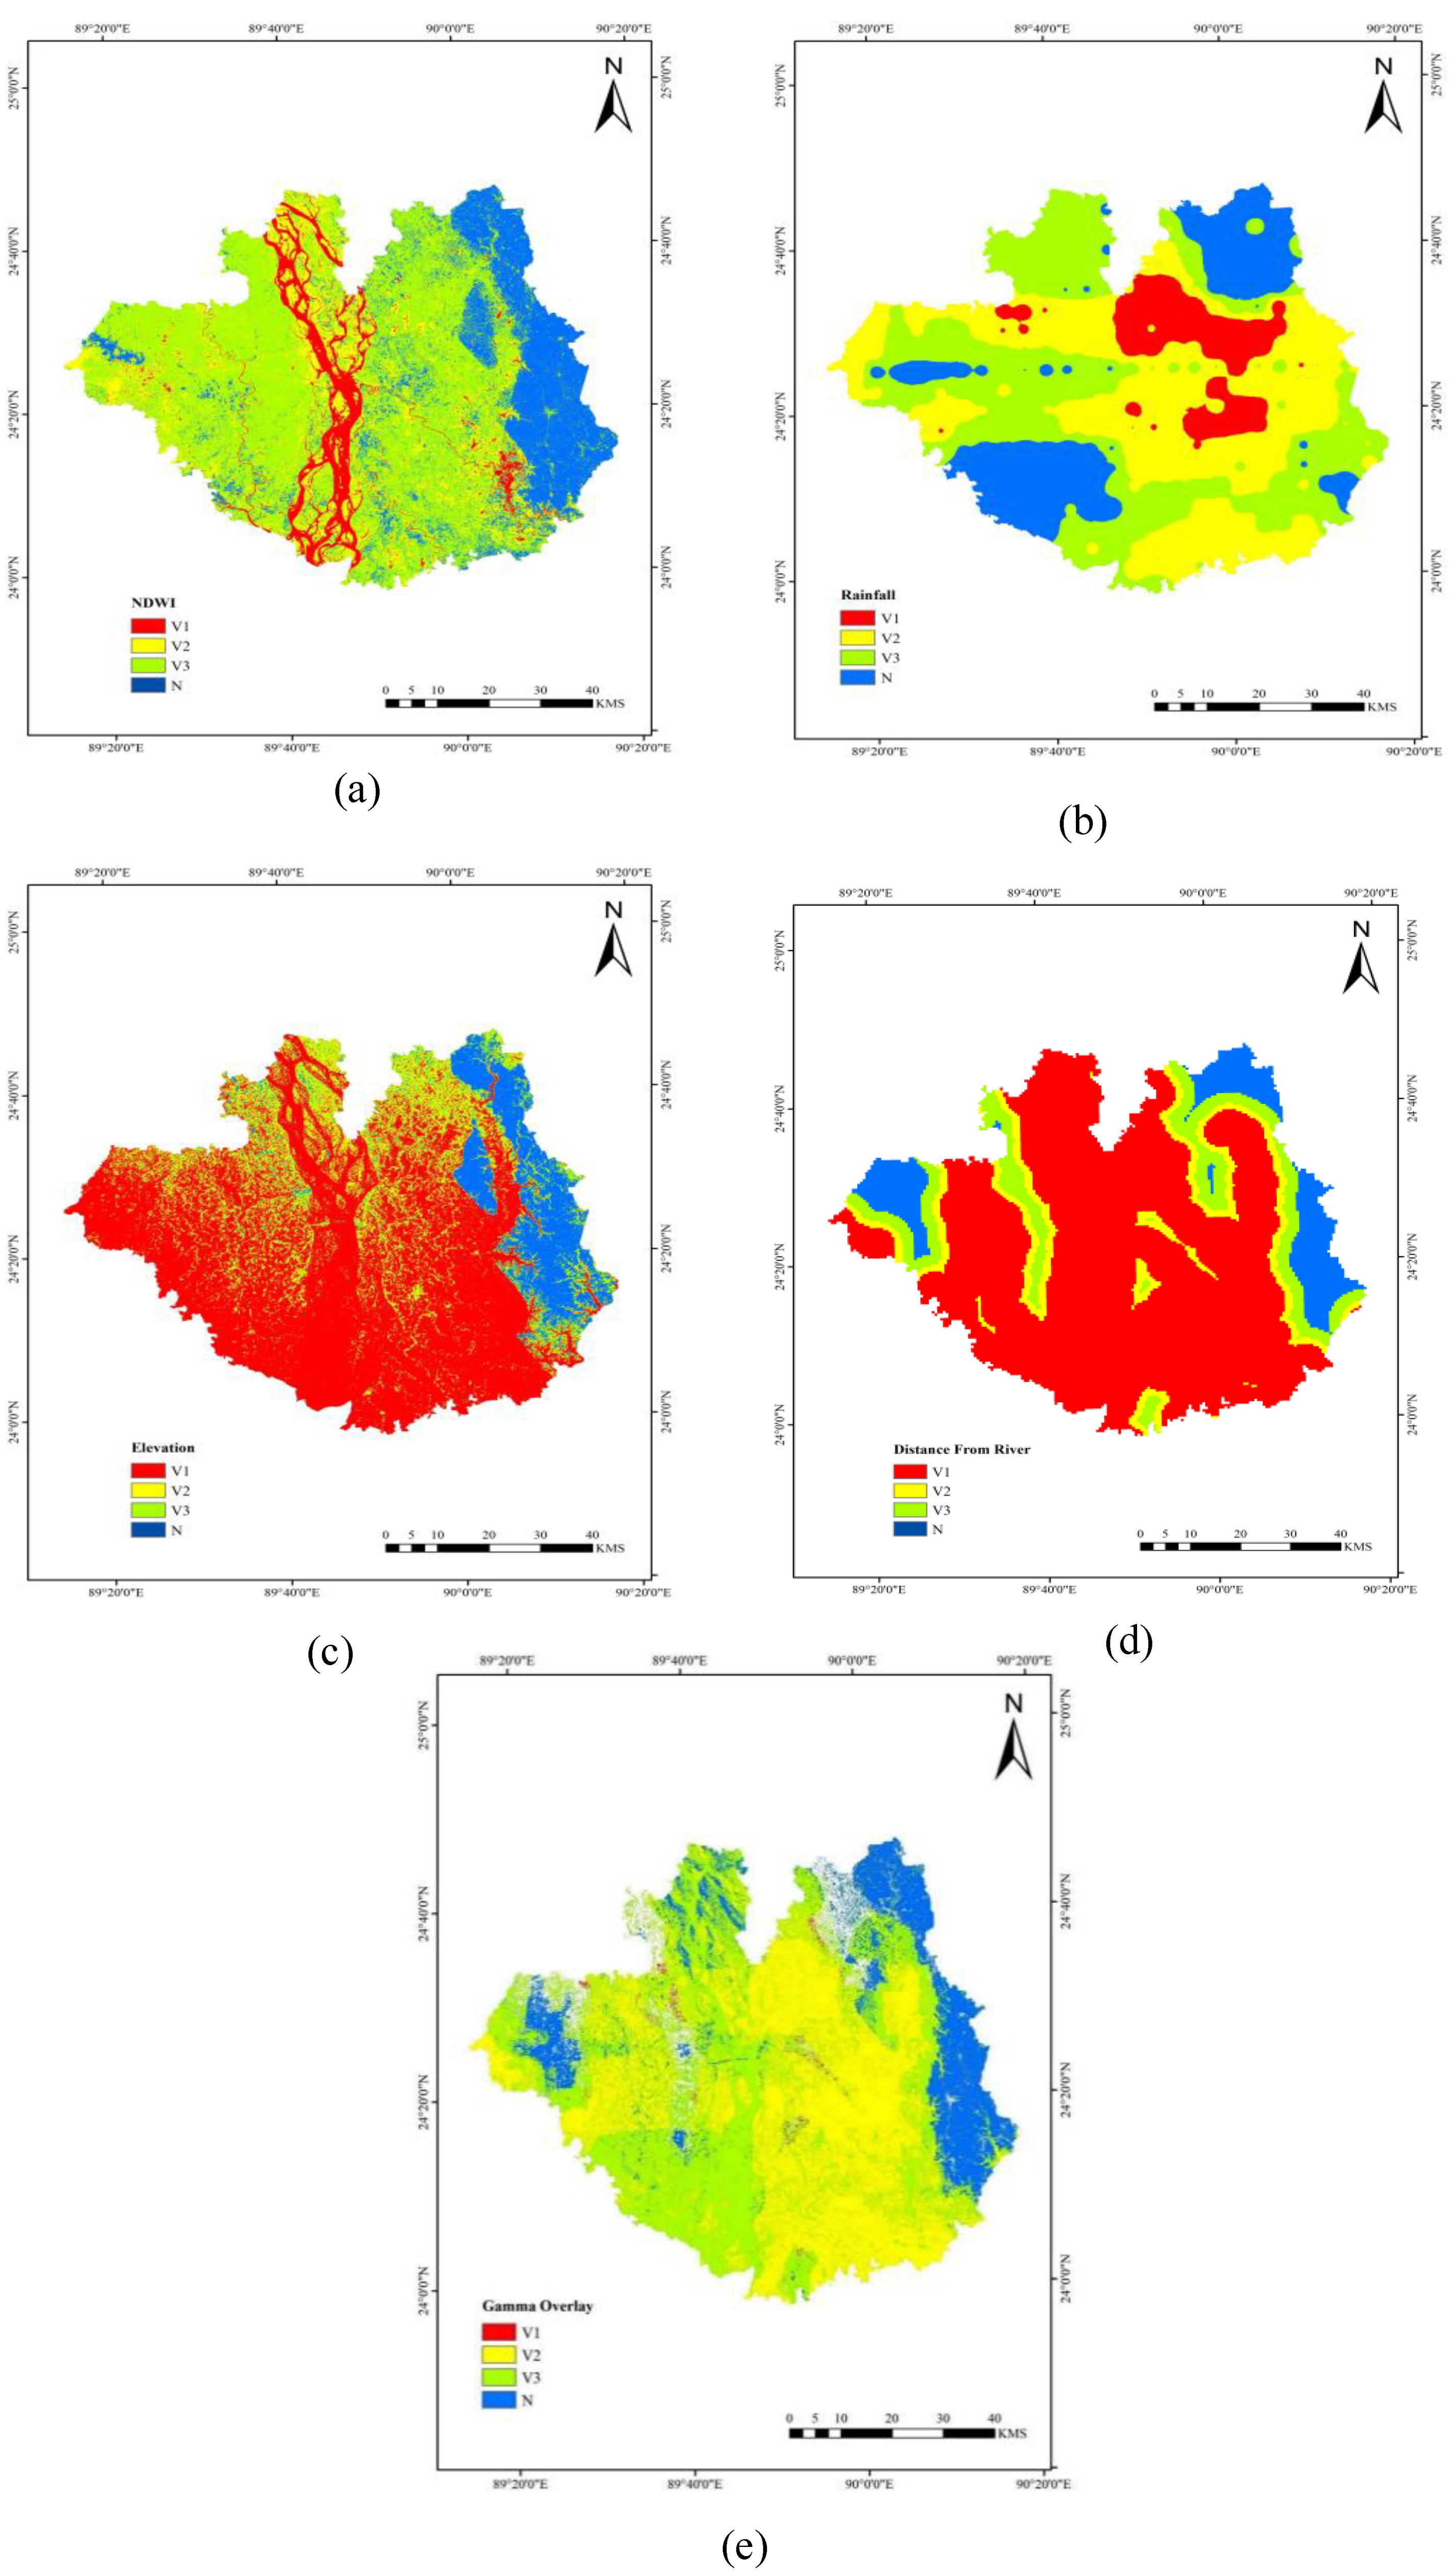
Normalized Difference Water Index (NDWI)
Rainfall
Elevation
Distance from the River
Fuzzy Overlay for Inundation Vulnerability Analysis
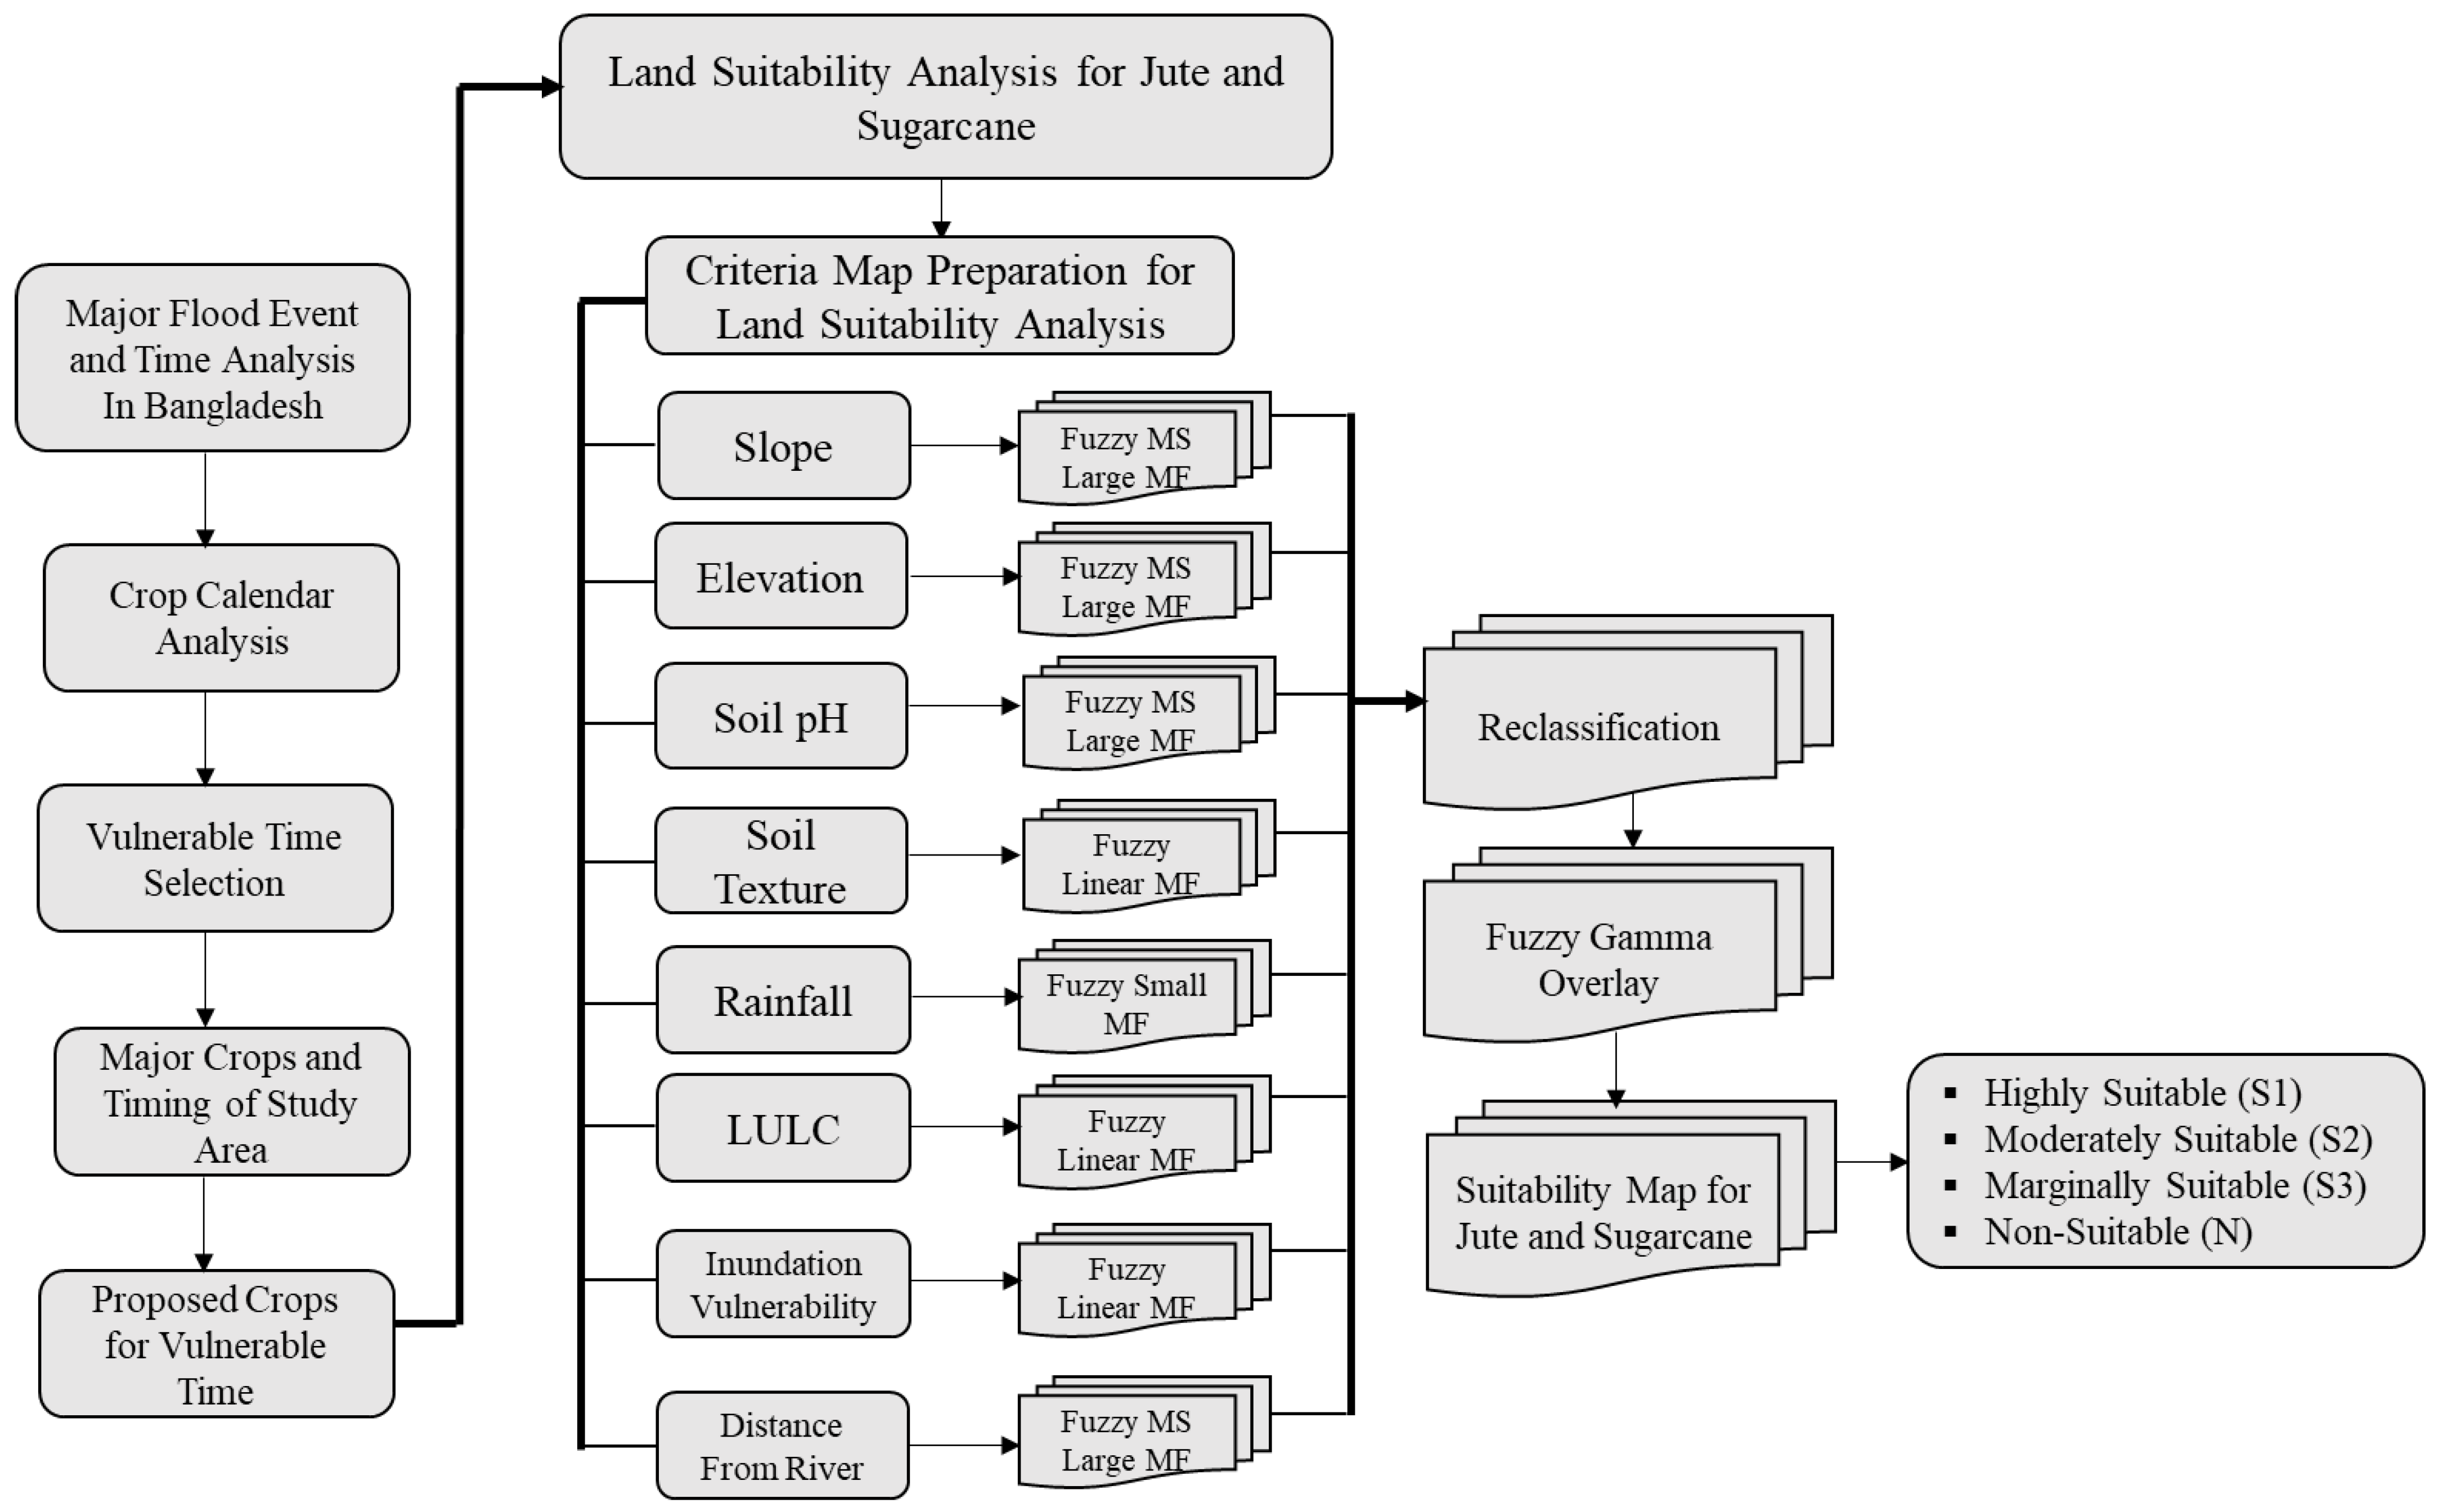
2.3.2. Crop Selection for Vulnerable Agricultural Land
2.3.3. Land Suitability Assessment for Jute and Sugarcane Production
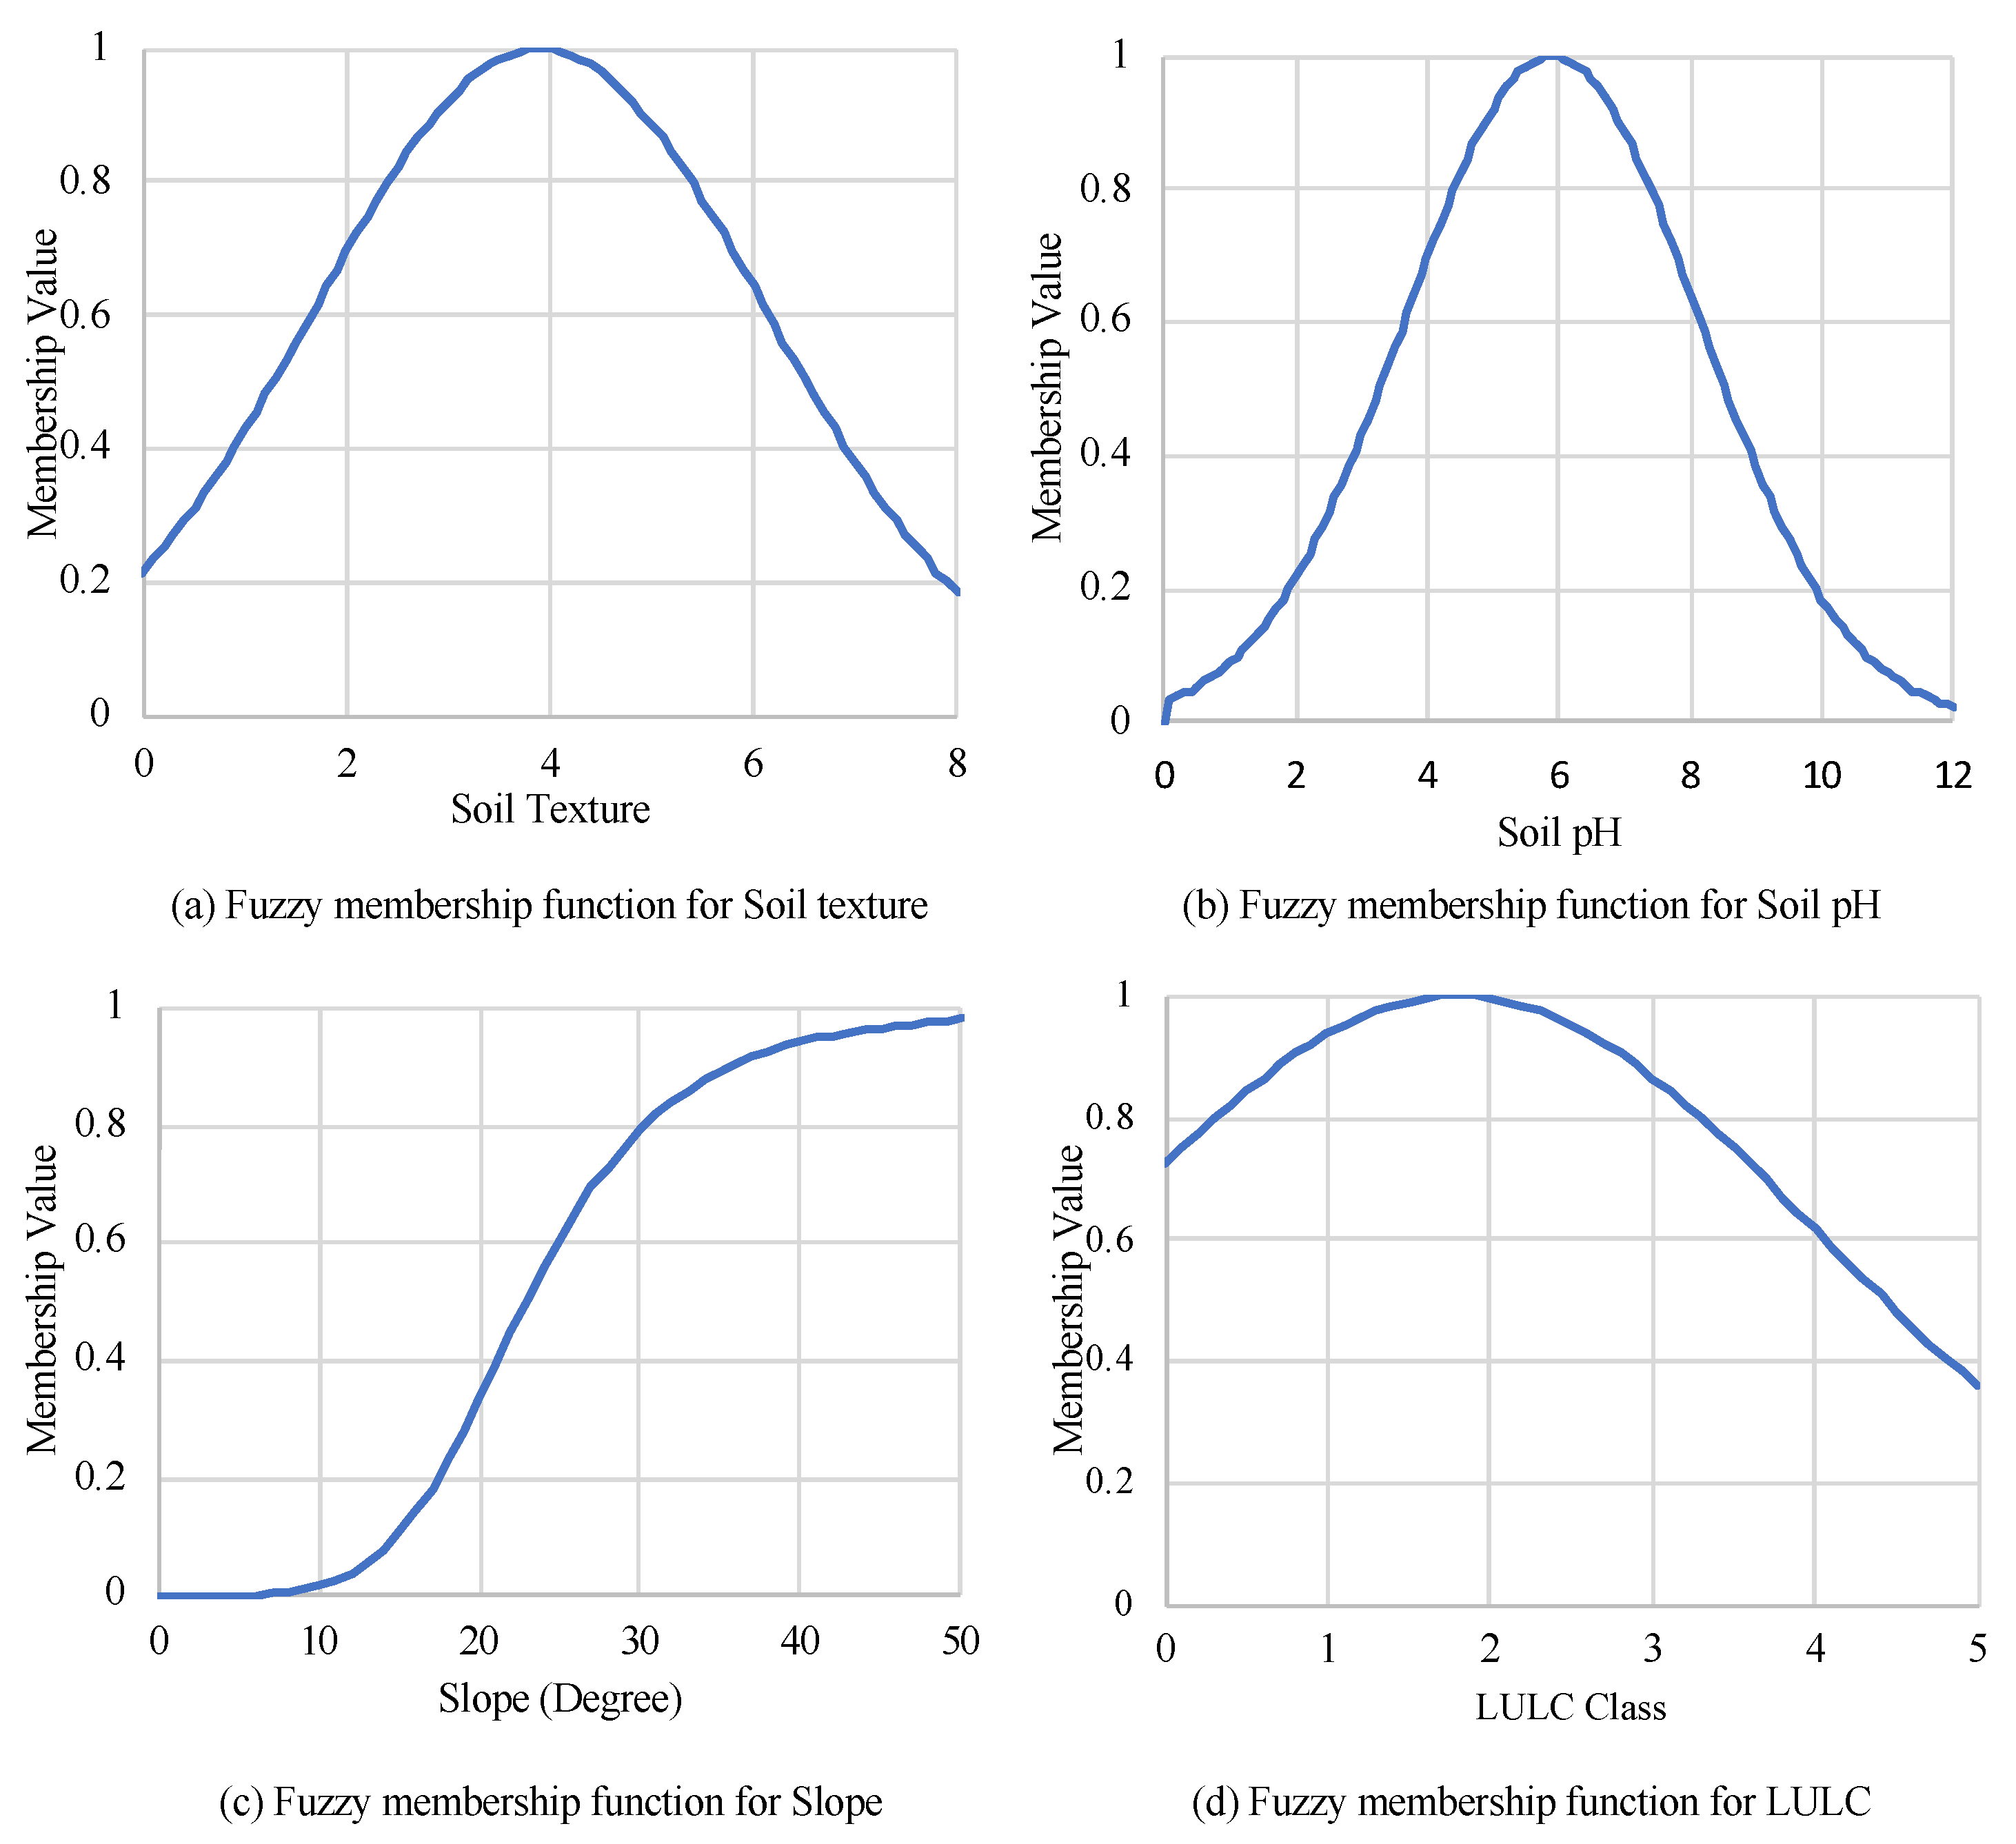
Reclassification of the Fuzzy Membership Function
Criteria Selection
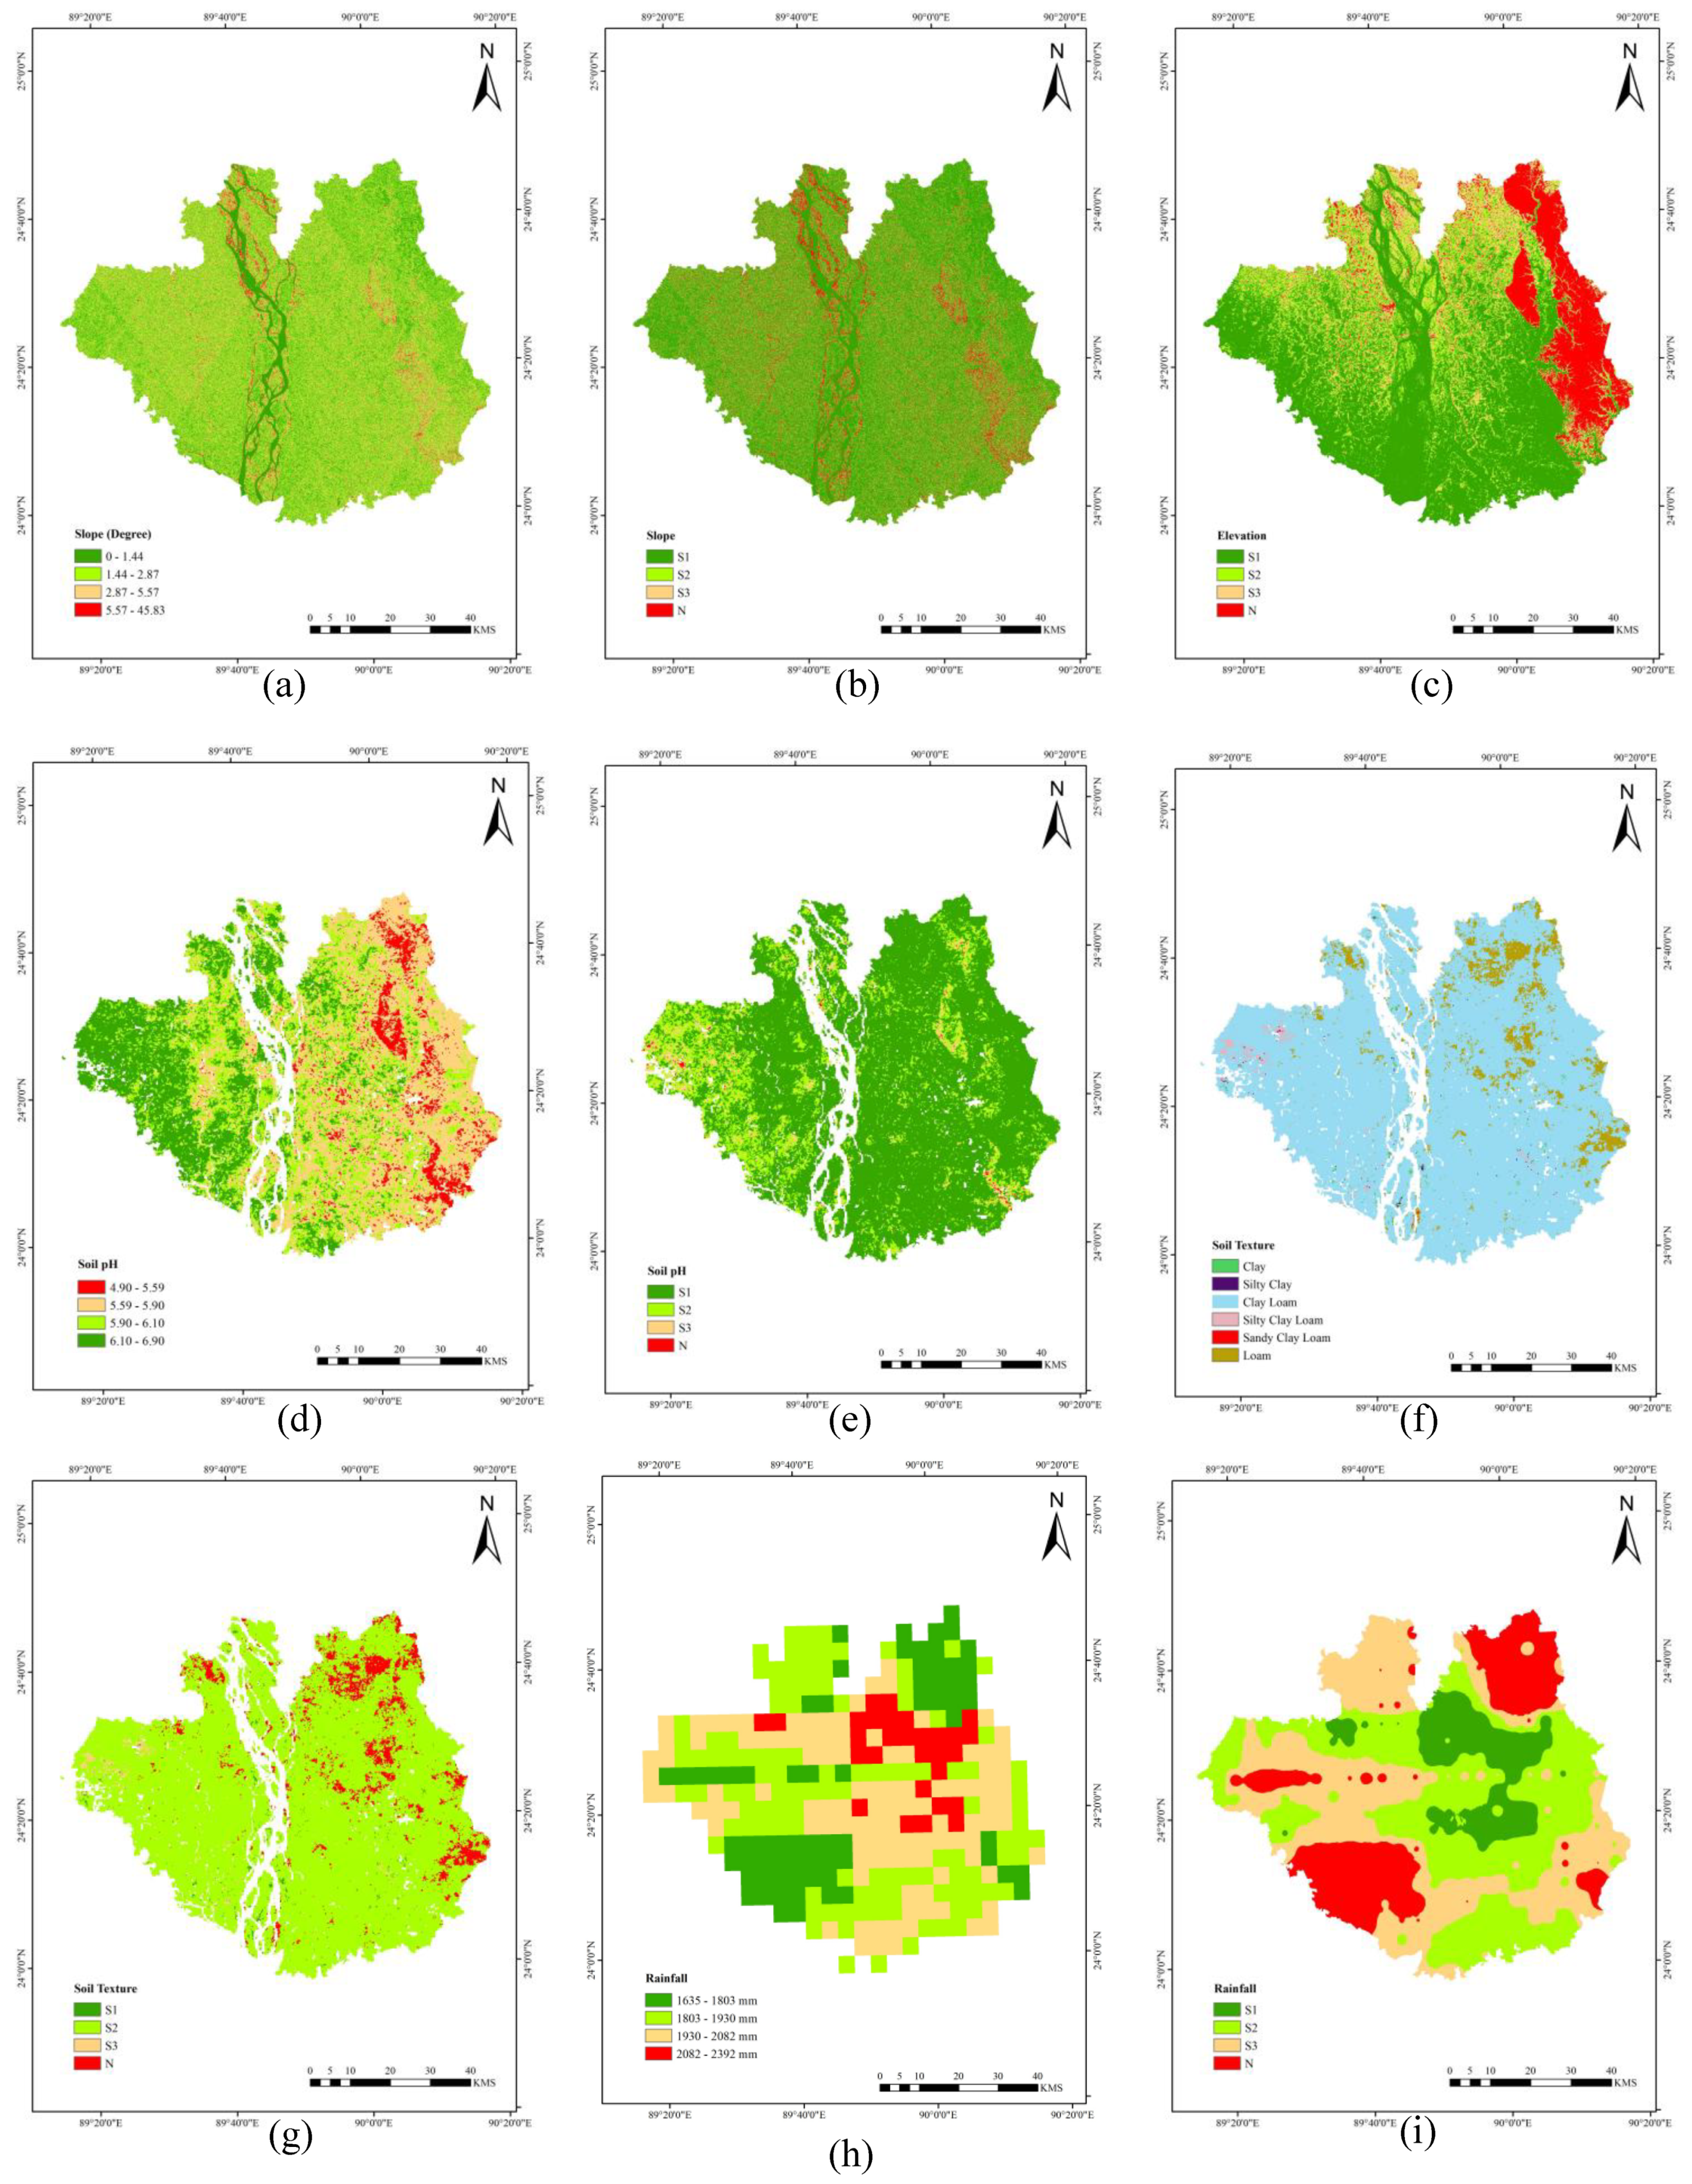
Slope
Elevation
Soil pH
Soil Texture
Rainfall
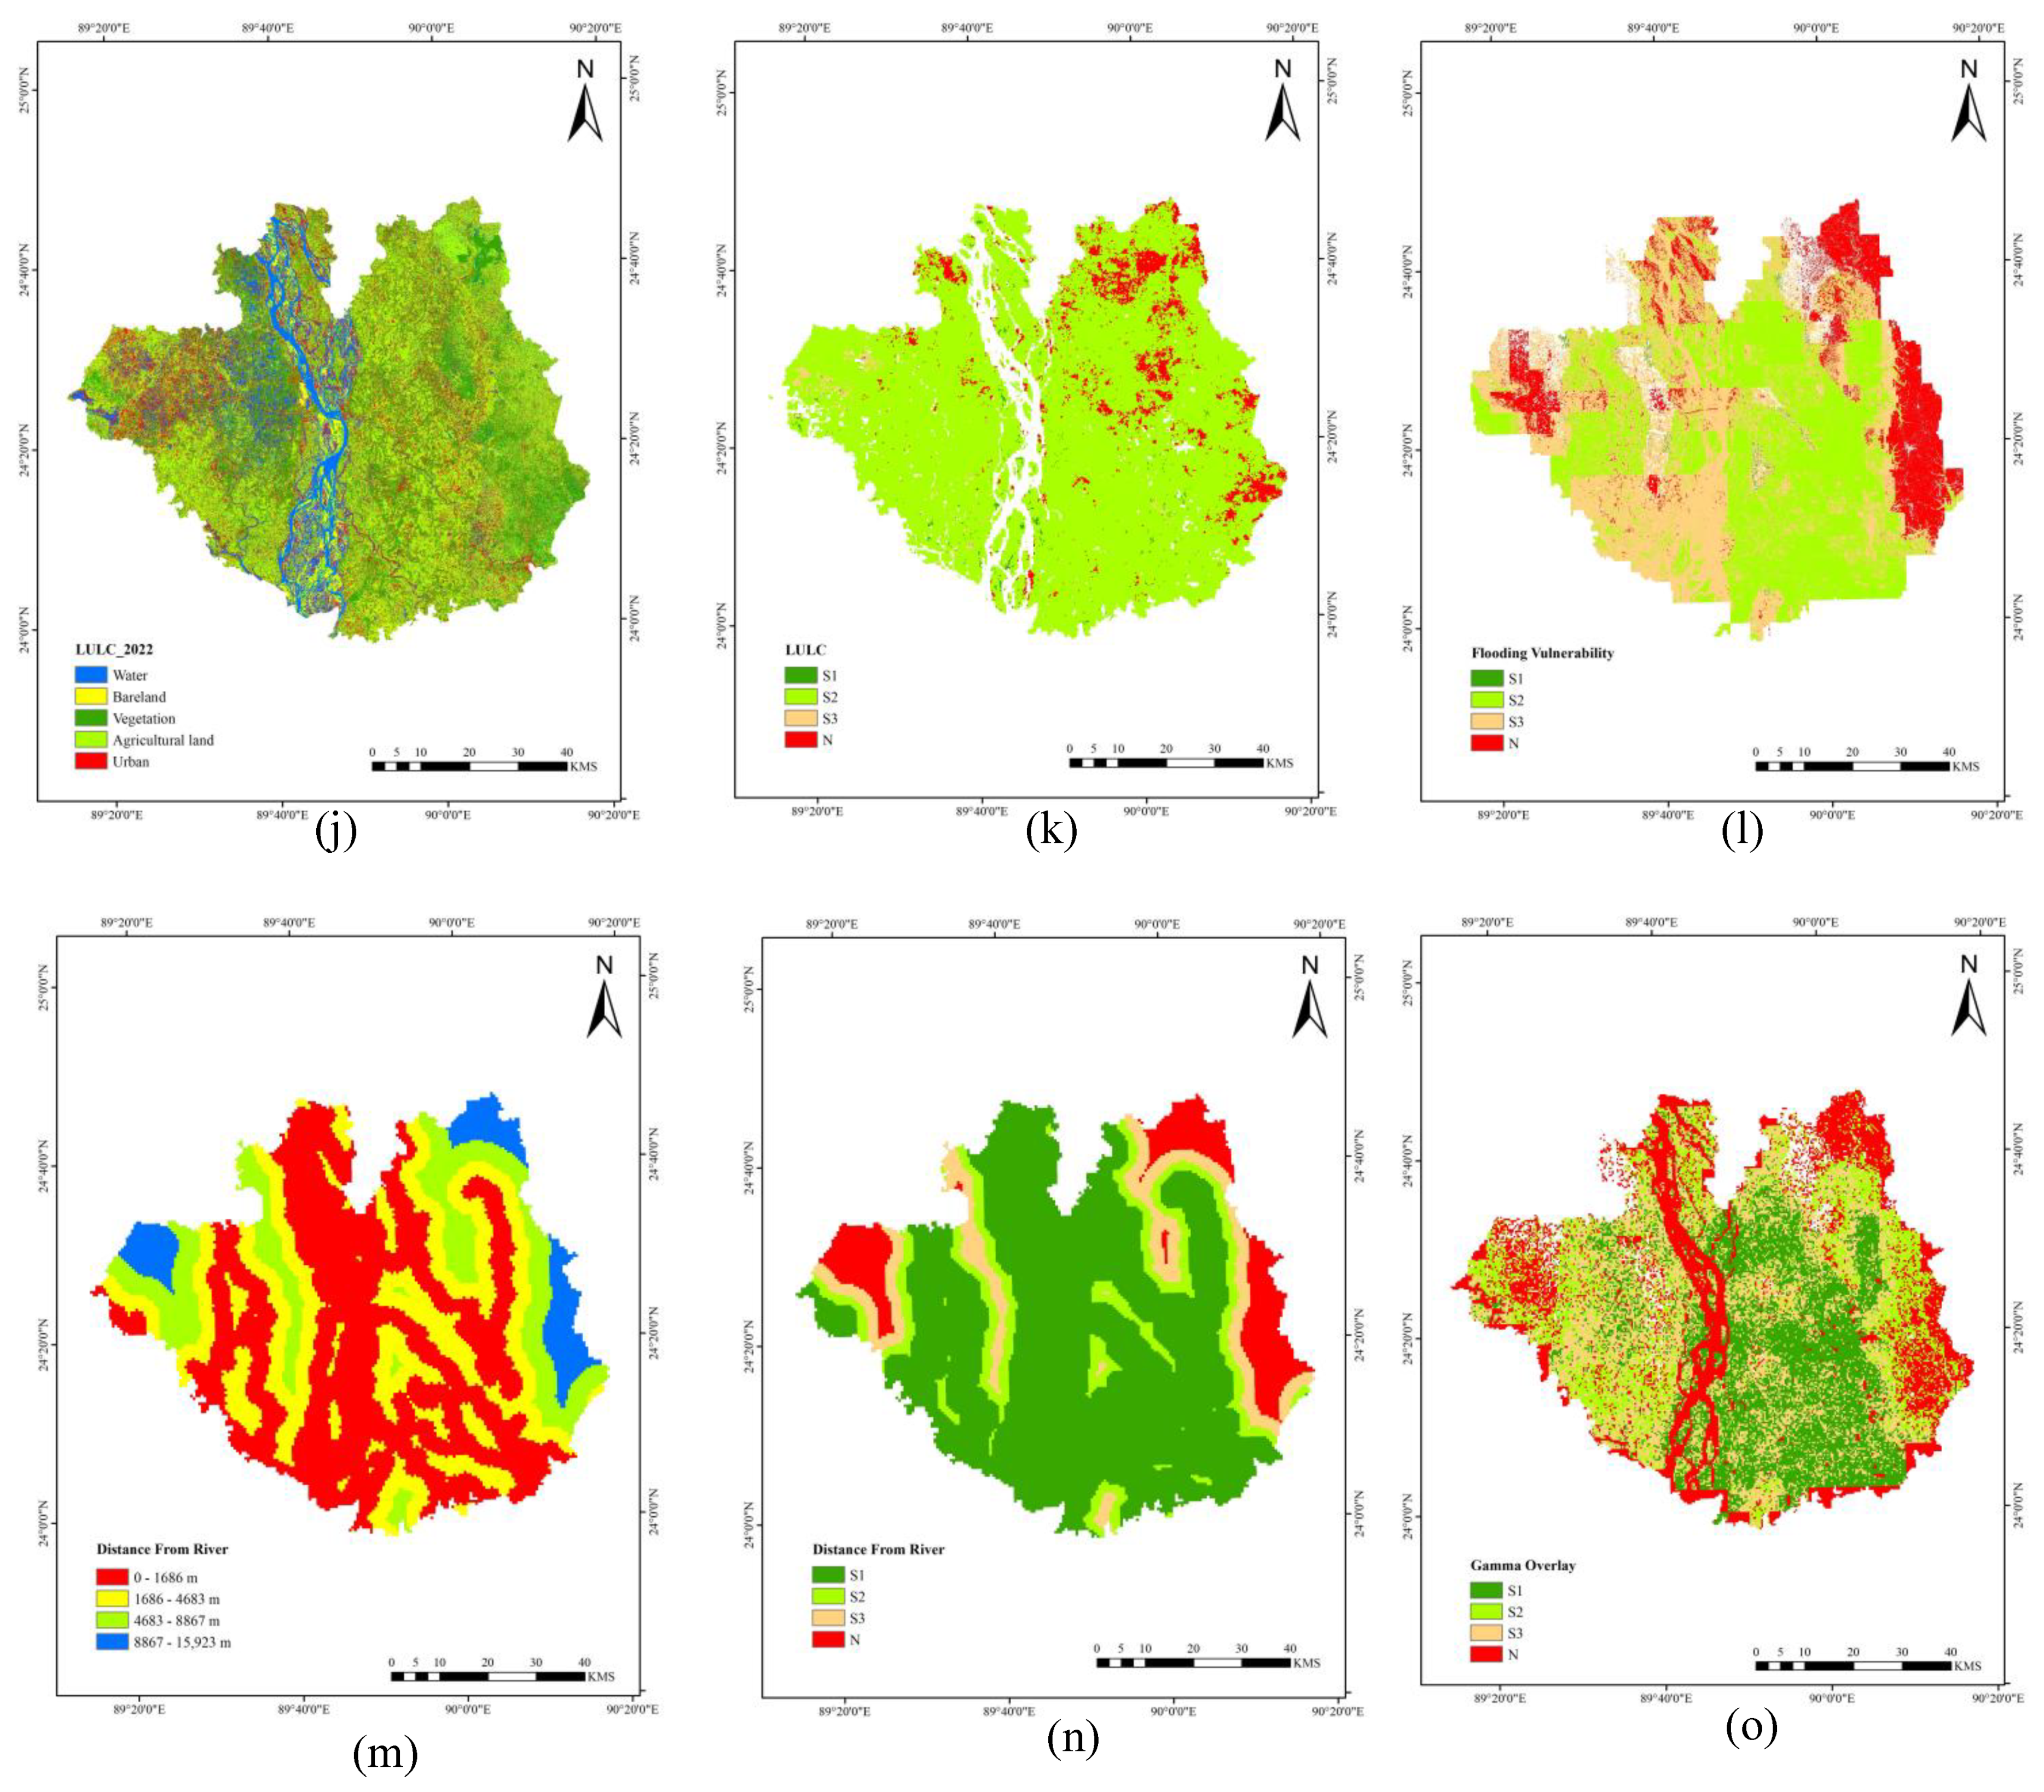
Land Use and Land Cover (LULC)
Flooding Vulnerability
Distance from the River
Fuzzy Gamma Overlay
3. Results and Discussion
3.1. Inundation Vulnerability Assessment
3.2. Land Suitability Assessment for Jute and Sugarcane Cultivation
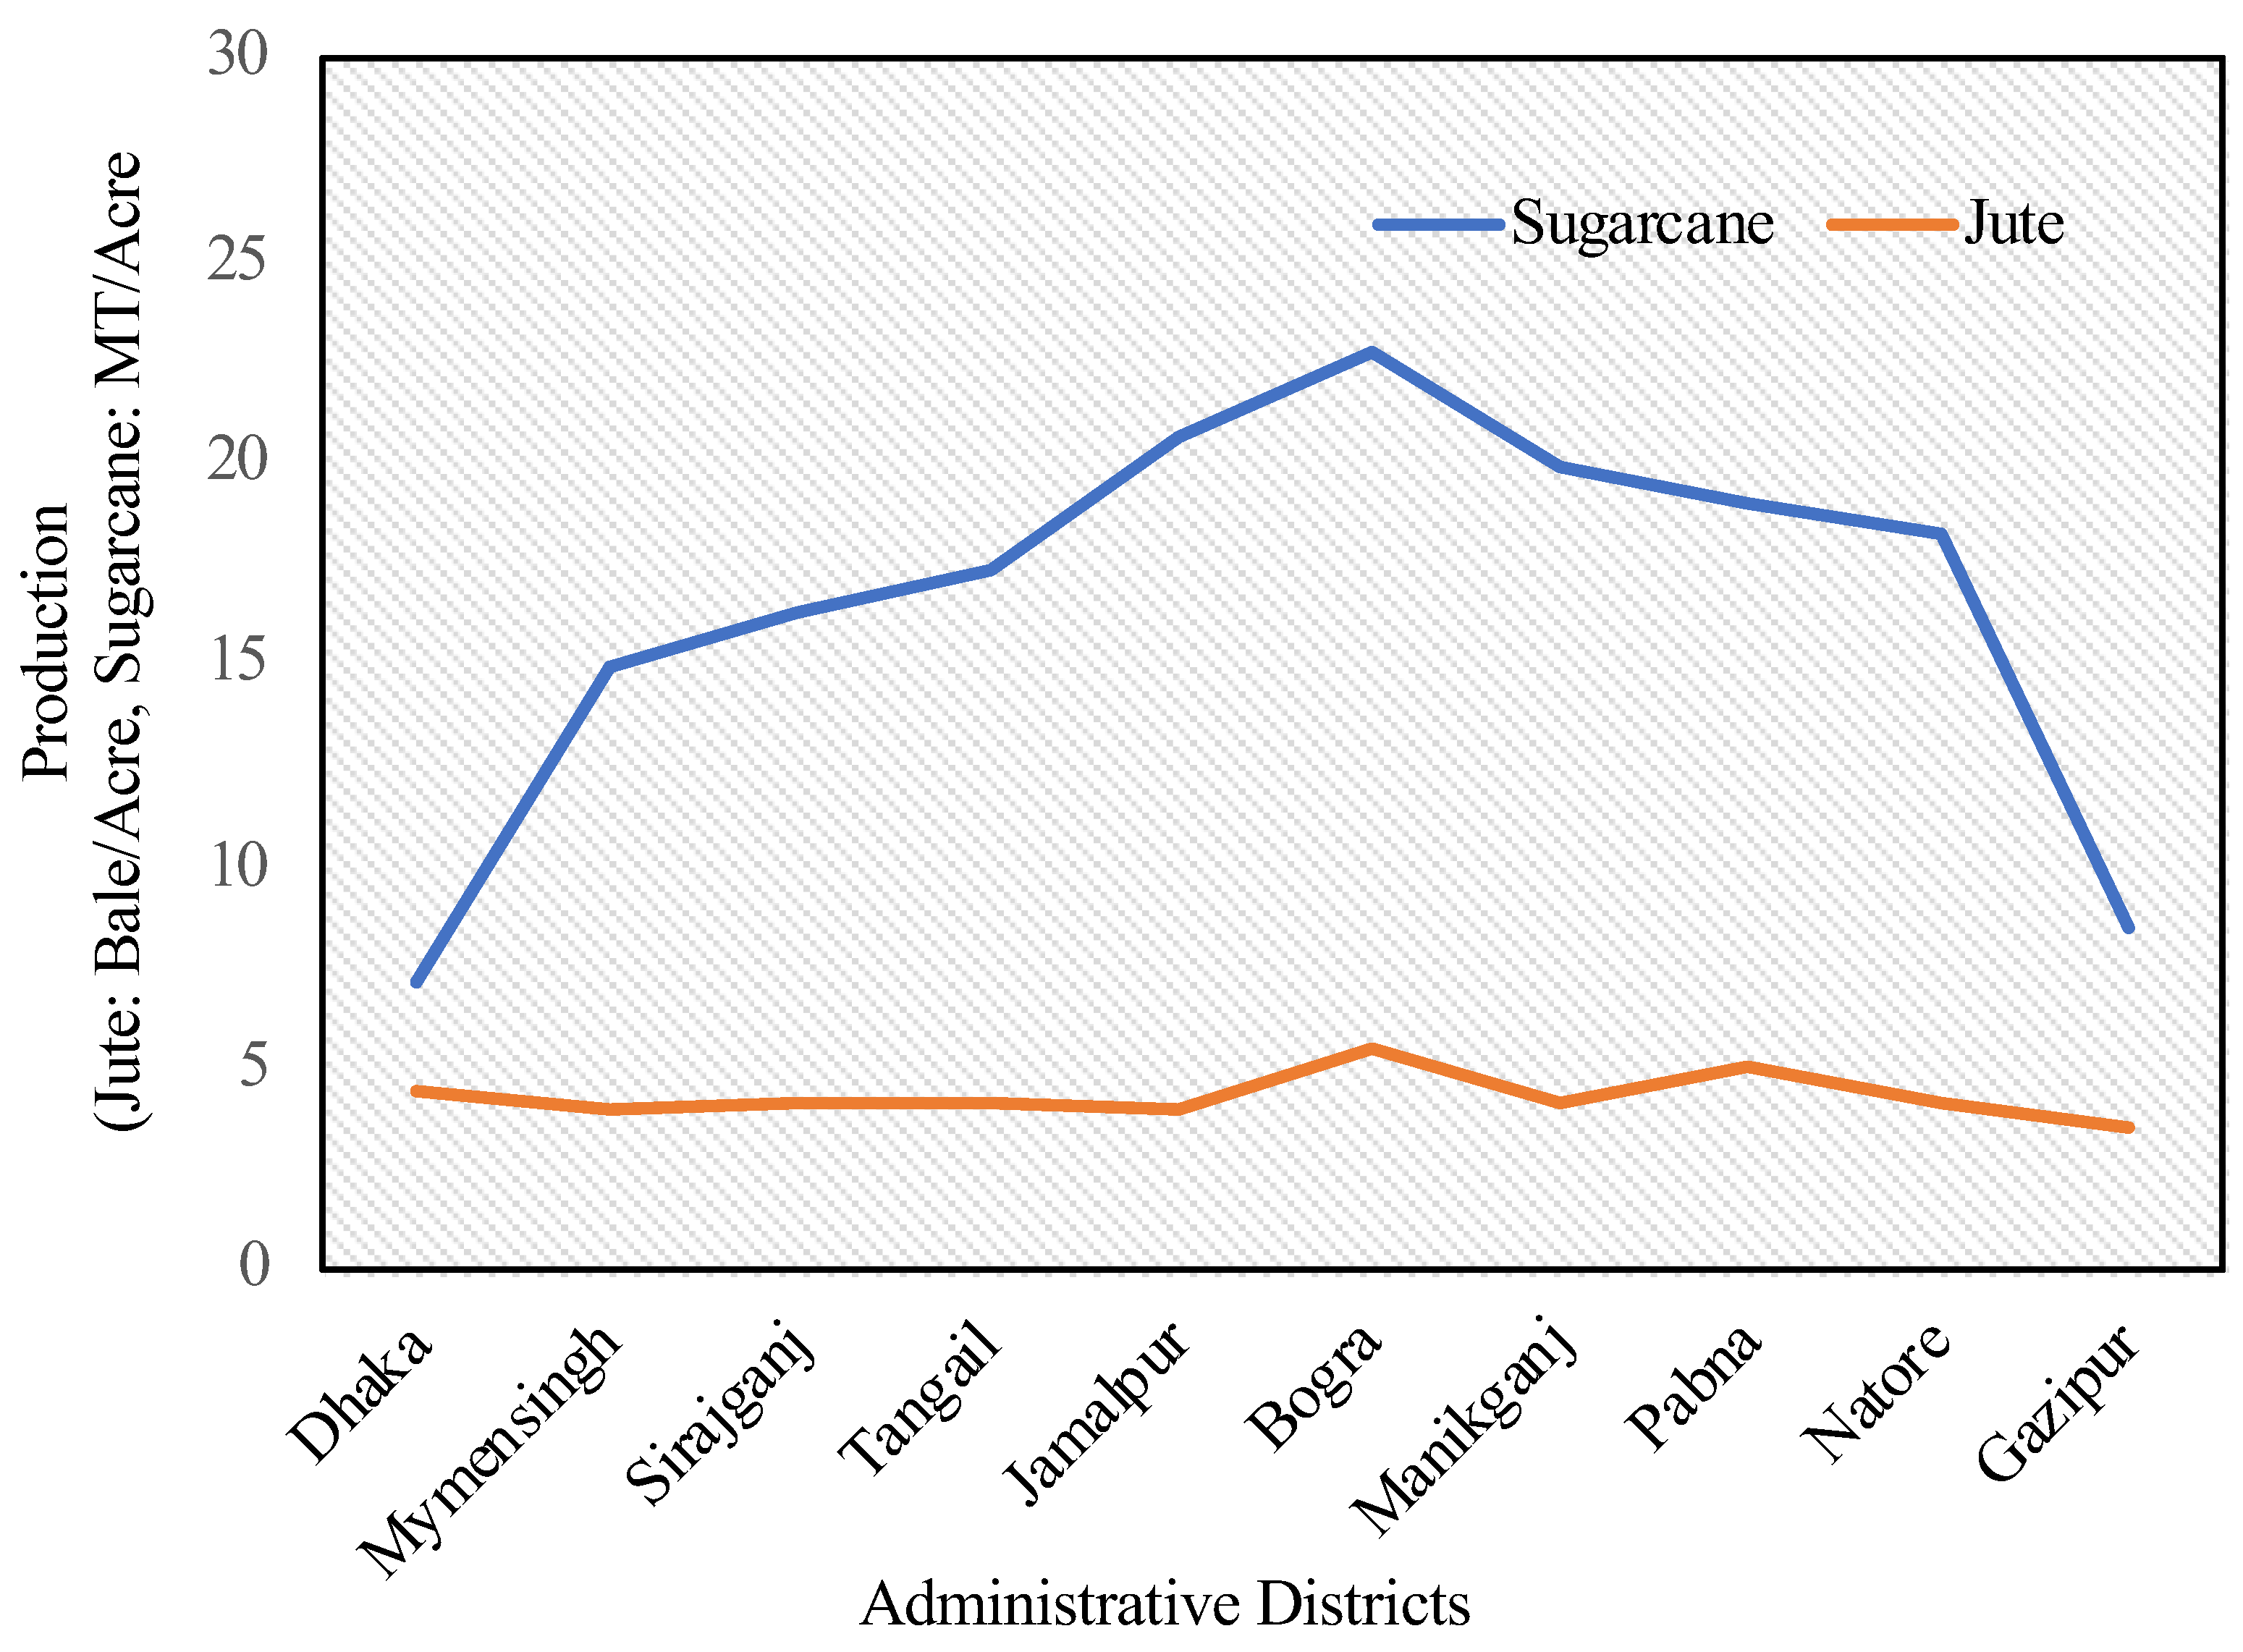
3.3. Validation of Suitability Map with Ground Reference Data
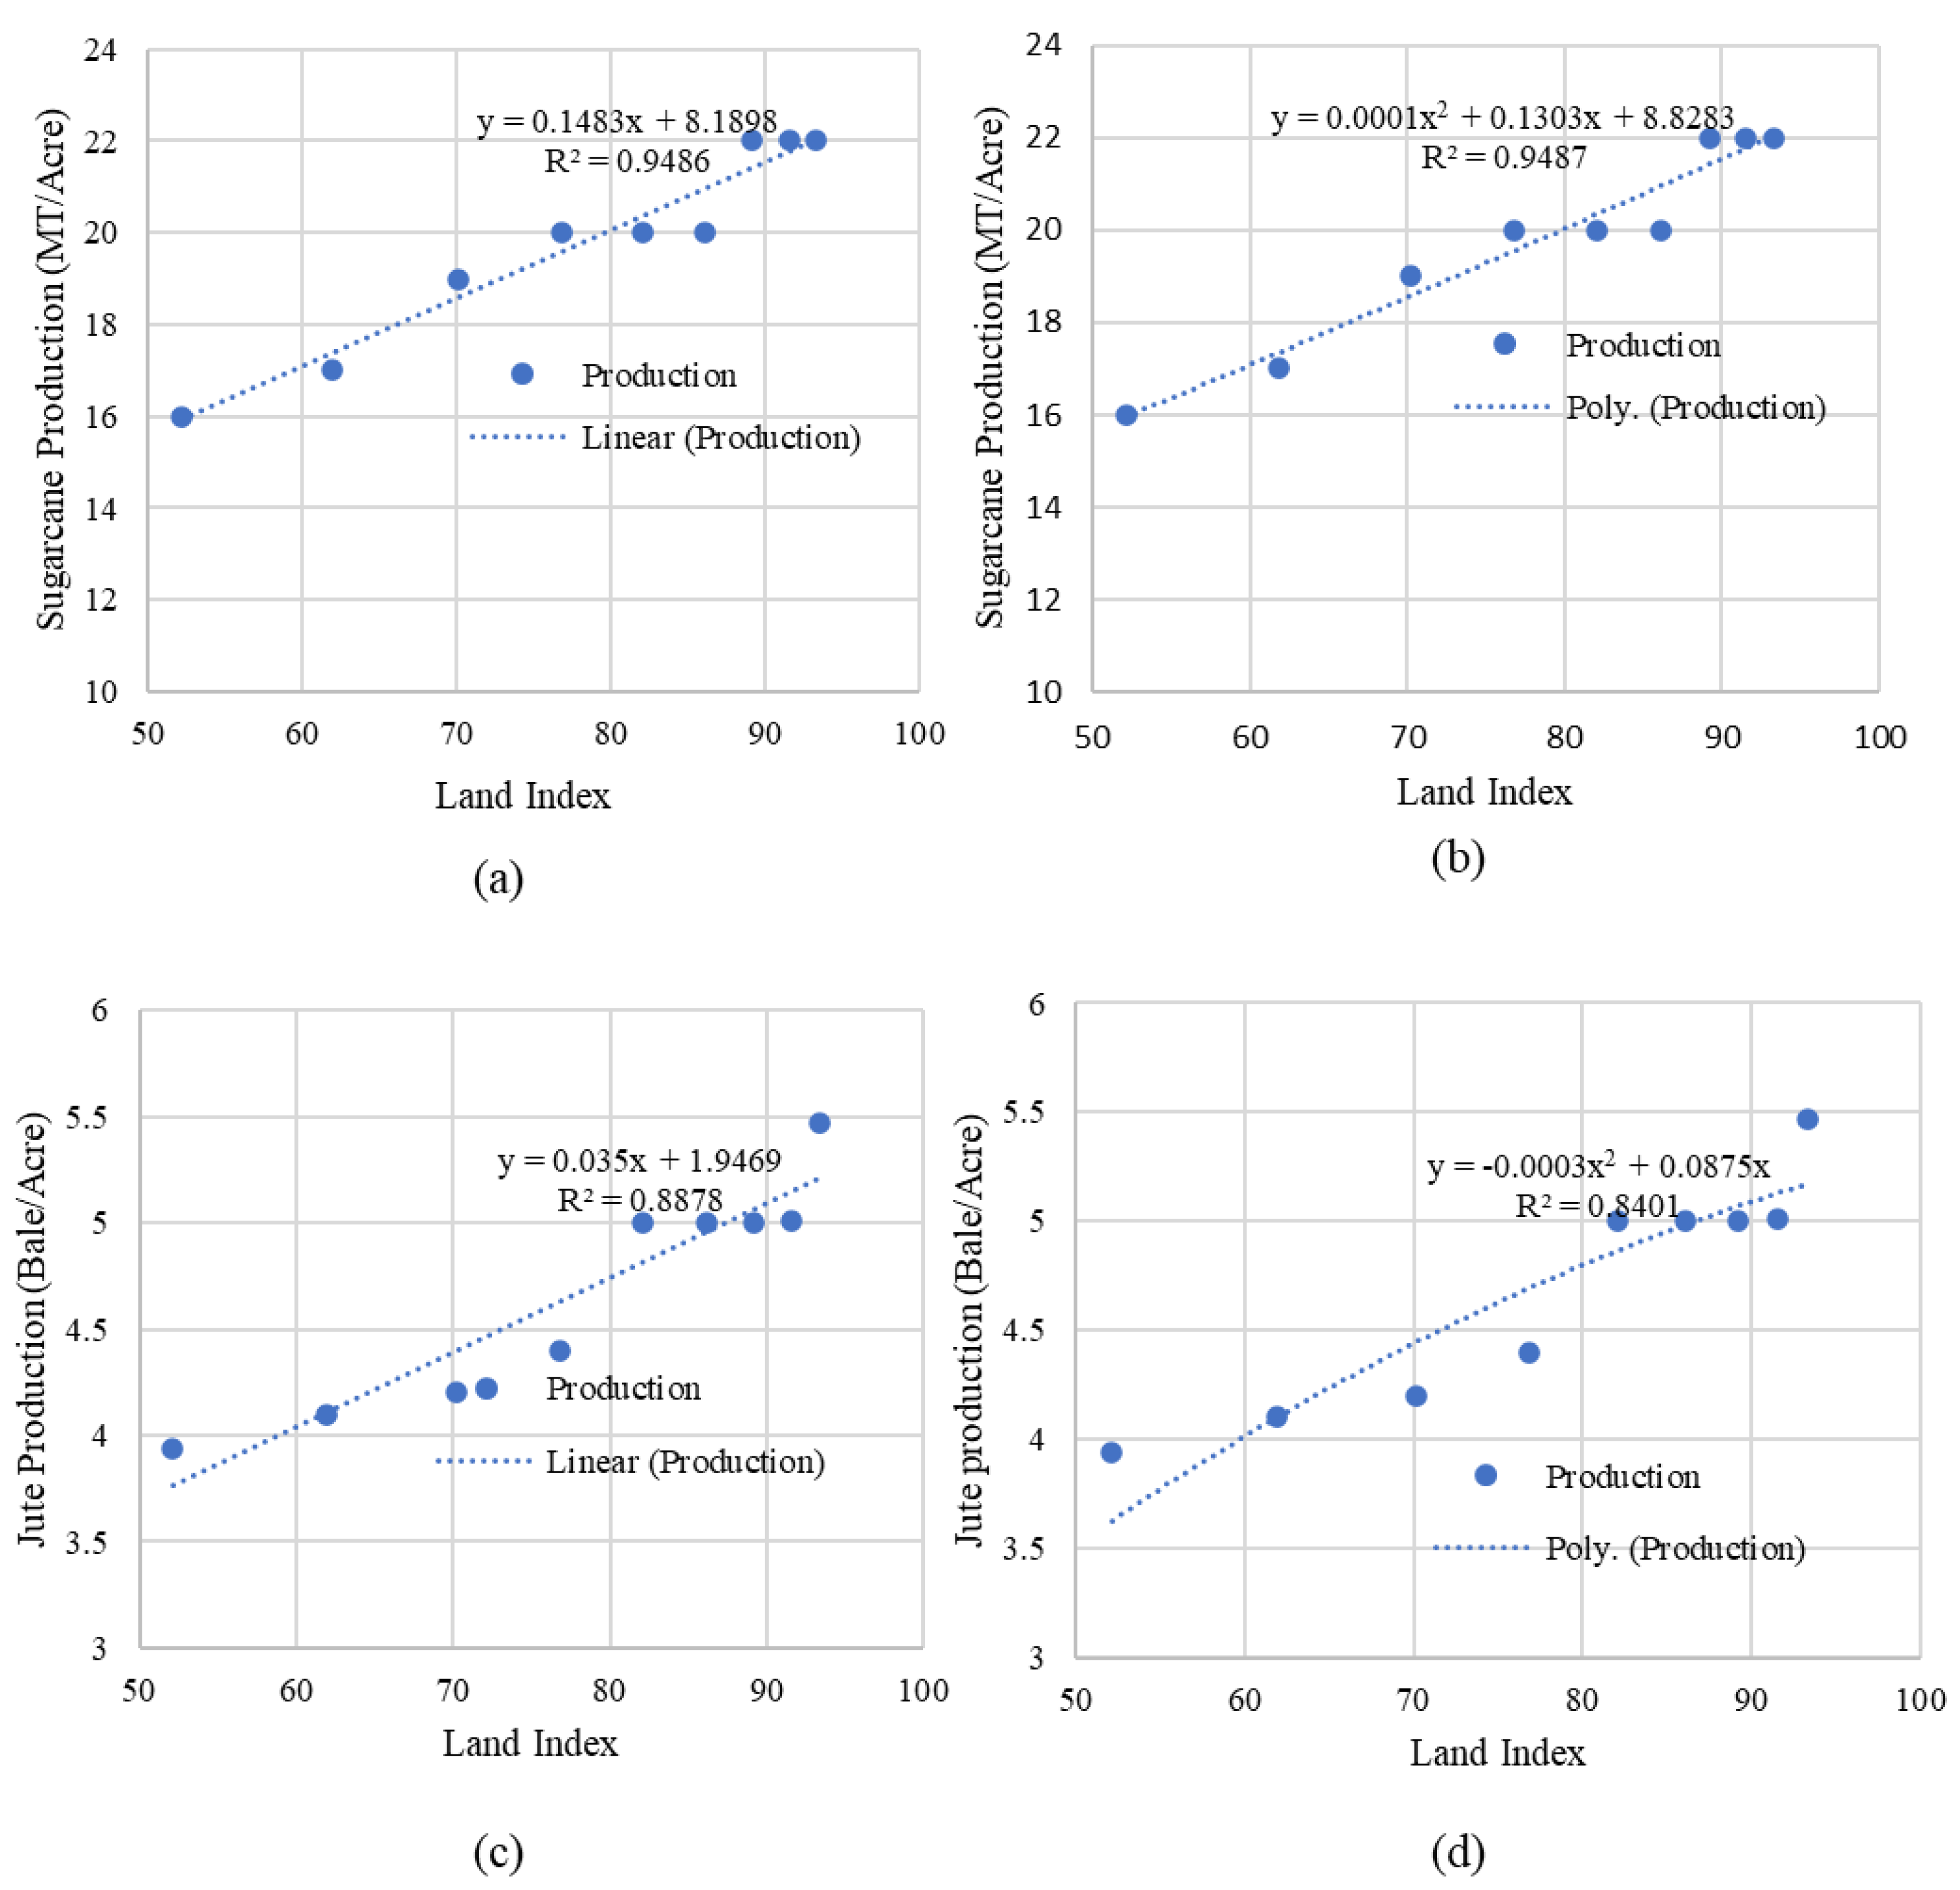
3.4. Validation of Fuzzy Suitability
4. Conclusions
Author Contributions
Funding
Data Availability Statement
Acknowledgments
Conflicts of Interest
References
- Anderson, R.; Bayer, P.E.; Edwards, D. Climate change and the need for agricultural adaptation. Curr. Opin. Plan. Biol. 2020, 56, 197–202. [Google Scholar] [CrossRef] [PubMed]
- Okolie, C.C.; Danso-Abbeam, G.; Groupson-Paul, O.; Ogundeji, A.A. Climate-Smart Agriculture Amidst Climate Change to Enhance Agricultural Production: A Bibliometric Analysis. Land 2023, 12, 50. [Google Scholar] [CrossRef]
- Shamsuzzoha, M.; Ahamed, T. Shoreline Change Assessment in the Coastal Region of Bangladesh Delta Using Tasseled Cap Transformation from Satellite Remote Sensing Dataset. Remote Sens. 2023, 15, 295. [Google Scholar] [CrossRef]
- Alam, K.F.; Ahamed, T. Assessment of Land Use Land Cover Changes for Predicting Vulnerable Agricultural Lands in River Basins of Bangladesh Using Remote Sensing and a Fuzzy Expert System. Remote Sens. 2022, 14, 5582. [Google Scholar] [CrossRef]
- Brammer, H. Floods in Bangladesh: Geographical background to the 1987 and 1988 floods. Geogr. J. 1990, 156, 12–22. [Google Scholar] [CrossRef]
- Khan, L.R. Impacts of recent floods on the rural environment of Bangladesh: A case study. Int. J. Water Resour. Dev. 1991, 7, 45–52. [Google Scholar] [CrossRef]
- Khan, I.; Ahammad, M.; Sarker, S. A study on River Bank erosion of Jamuna River using GIS and remote sensing technology. Int. J. Eng. Dev. Res. 2014, 2, 3365–3371. [Google Scholar]
- Shamsuzzoha, M.; Noguchi, R.; Ahamed, T. Damaged area assessment of cultivated agricultural lands affected by cyclone bulbul in coastal region of Bangladesh using Landsat 8 OLI and TIRS datasets. Remote Sens. Appl. Soc. Environ. 2021, 23, 100523. [Google Scholar] [CrossRef]
- Shamsuzzoha, M.; Noguchi, R.; Ahamed, T. Rice Yield Loss Area Assessment from Satellite-derived NDVI after Extreme Climatic Events Using a Fuzzy Approach. Agric. Inf. Res. 2022, 31, 32–46. [Google Scholar] [CrossRef]
- Islam, M.M.; Ujiie, K.; Noguchi, R.; Ahamed, T. Flash flood-induced vulnerability and need assessment of wetlands using remote sensing, GIS, and econometric models. Remote Sens. Appl. Soc. Environ. 2022, 25, 100692. [Google Scholar] [CrossRef]
- Ferretti, V.; Pomarico, S. An integrated approach for studying the land suitability for ecological corridors through spatial multicriteria evaluations. Environ. Dev. Sus. 2013, 15, 859–885. [Google Scholar] [CrossRef]
- Hossain, M.S.; Chowdhury, S.R.; Das, N.G.; Sharifuzzaman, S.M.; Sultana, A. Integration of GIS and multicriteria decision analysis for urban aquaculture development in Bangladesh. Landsc. Urban Plan. 2009, 90, 119–133. [Google Scholar] [CrossRef]
- Ferretti, V.; Pomarico, S. Integrated sustainability assessments: A spatial multicriteria evaluation for siting a waste incinerator plant in the Province of Torino (Italy). Environ. Dev. Sustain. 2012, 14, 843–867. [Google Scholar] [CrossRef]
- Hassan, M.M.; Nazem, M.N.I. Examination of land use/land cover changes, urban growth dynamics, and environmental sustainability in Chittagong city, Bangladesh. Environ. Dev. Sustain. 2016, 18, 697–716. [Google Scholar] [CrossRef]
- Frazier, P.S.; Page, K.J. Water body detection and delineation with Landsat TM data. Photogramm. Eng. Remote Sens. 2000, 66, 1461–1468. [Google Scholar]
- Tehrany, M.S.; Lee, M.J.; Pradhan, B.; Jebur, M.N.; Lee, S. Flood susceptibility mapping using integrated bivariate and multivariate statistical models. Environ. Earth Sci. 2014, 72, 4001–4015. [Google Scholar] [CrossRef]
- Khosravi, K.; Nohani, E.; Maroufinia, E.; Pourghasemi, H.R. A GIS-based flood susceptibility assessment and its mapping in Iran: A comparison between frequency ratio and weights-of-evidence bivariate statistical models with multi-criteria decision-making technique. Nat. Hazards 2016, 83, 947–987. [Google Scholar] [CrossRef]
- Habibie, M.I.; Noguchi, R.; Shusuke, M.; Ahamed, T. Land suitability analysis for maize production in Indonesia using satellite remote sensing and GIS-based multicriteria decision support system. GeoJournal 2021, 86, 777–807. [Google Scholar] [CrossRef]
- Das, A.C.; Noguchi, R.; Ahamed, T. Integrating an expert system, gis, and satellite remote sensing to evaluate land suitability for sustainable tea production in Bangladesh. Remote Sens. 2020, 12, 4136. [Google Scholar] [CrossRef]
- Purnamasari, R.A.; Noguchi, R.; Ahamed, T. Land suitability assessments for yield prediction of cassava using geospatial fuzzy expert systems and remote sensing. Comput. Electron. Agric. 2021, 166, 105018. [Google Scholar] [CrossRef]
- Binte Mostafiz, R.; Noguchi, R.; Ahamed, T. Calorie-based seasonal multicrop land suitability analysis for regional food nutrition security in Bangladesh. Asia-Pac. J. Reg. Sci. 2021, 5, 757–795. [Google Scholar] [CrossRef]
- Muhsin, N.; Ahamed, T.; Noguchi, R. GIS-based multi-criteria analysis modeling used to locate suitable sites for industries in suburban areas in Bangladesh to ensure the sustainability of agricultural lands. Asia-Pac. J. Reg. Sci. 2018, 2, 35–64. [Google Scholar] [CrossRef]
- Bangladesh Water Development Board (BWDB). Land Reclamation Project Report; Government of Bangladesh: Dhaka, Bangladesh, 1974. [Google Scholar]
- Khan, F.H. Geology of Bangladesh; University Press Limited: Dhaka, Bangladesh, 1991; p. 207. [Google Scholar]
- ASB. Banglapedia: National Encyclopedia of Bangladesh. Dhaka: Asiatic Society of Bangladesh (ASB). 2006. Available online: http://www.banglapedia.org/ (accessed on 10 January 2023).
- Alamgir, M. Famine in South Asia. Political Economy of Mass Starvation; Oelgeschlager, Gunn & Hain, Publishers, Inc.: Cambridge, MA, USA, 1980. [Google Scholar]
- Hossain, S.M.; Kolsteren, P. The 1998 flood in Bangladesh: Is different targeting needed during emergencies and recovery to tackle malnutrition? Disasters 2003, 27, 172–184. [Google Scholar] [CrossRef] [PubMed]
- Bangladesh, L.C.G. Post-Flood Needs Assessment Summary Report; Local Consultive Group: Dhaka, Bangladesh, 2004. [Google Scholar]
- Available online: https://reliefweb.int/disaster/fl-2016-000075-bgd (accessed on 15 January 2023).
- Available online: https://reliefweb.int/report/bangladesh/bangladesh-flood-situation-august-22-2017 (accessed on 15 January 2023).
- Sadique, M.Z.; Kamruzzaman, M. Flood Management Perspectives in Bangladesh an Assessment of Monsoon Flood in 2020; Centre for Policy Dialogue: Dhaka, Bangladesh, 2021. [Google Scholar]
- Available online: https://reliefweb.int/map/bangladesh/bangladesh-flood-2022-impact-and-loss-summary (accessed on 15 January 2023).
- Bellman, R.E.; Zadeh, L.A. Decision-making in a fuzzy environment. Manag. Sci. 1970, 17, B-141. [Google Scholar] [CrossRef]
- McFeeters, S.K. The use of the Normalized Difference Water Index (NDWI) in the delineation of open water features. Int. J. Remote Sens. 1996, 17, 1425–1432. [Google Scholar] [CrossRef]
- ESRI. Arithmetic Function. 2016. Available online: https://desktop.arcgis.com/en/arcmap/10.3/manage-data/raster-andimages/arithmetic-function.htm (accessed on 20 January 2023).
- Jenks, G.F. The data model concept in statistical mapping. Int. Yearb. Cartogr. 1967, 7, 186–190. [Google Scholar]
- Jenks, G.F.; Caspall, F.C. Error on choroplethic maps: Definition, measurement, reduction. Ann. Assoc. Am. Geogr. 1971, 61, 217–244. [Google Scholar] [CrossRef]
- Hassan, N.; Huda, N.; Ahmad, K. Seasonal patterns of food intake in rural Bangladesh: Its impact on nutritional status. Ecol. Food Nutr. 1985, 17, 175–186. [Google Scholar] [CrossRef]
- Sarker, R.A.; Talukdar, S.; Haque, A.A. Determination of optimum crop mix for crop cultivation in Bangladesh. Appl. Math. Mod. 1997, 21, 621–632. [Google Scholar] [CrossRef]
- Alam, M.S.; Quayum, M.A.; Islam, M.A. Crop production in the Haor areas of Bangladesh: Insights from farm level survey. Agriculturists 2010, 8, 88–97. [Google Scholar] [CrossRef]
- Nasim, M.; Shahidullah, S.M.; Saha, A.; Muttaleb, M.A.; Aditya, T.L.; Ali, M.A.; Kabir, M.S. Distribution of crops and cropping patterns in Bangladesh. Bangladesh Rice J. 2017, 21, 1–55. [Google Scholar] [CrossRef]
- Haque, M.N.; Fatema, K.; Joy, M.A.R. Crop suitability analysis by adopting geo-spatial algorithm: A case study of Sirajganj district (flood-prone area) in Bangladesh. Arab Gulf J. Sci. Res. 2022; ahead-of-print. [Google Scholar]
- Talukder, F.A.H.; Hossain, M.A.; Molla, A.R. Constraints to jute cultivation and choice of alternate crops in Tangail district [Bangladesh]. Bangladesh J. Ext. Edu. 1993, 5, 65–71. [Google Scholar]
- Mujeri, M.K. The Elasticity of Substitution between Jute and Synthetic Substitutes: An Econometric Estimate. Bangladesh Dev. Stud. 1980, 8, 83–94. [Google Scholar]
- Akıncı, H.; Özalp, A.Y.; Turgut, B. Agricultural land use suitability analysis using GIS and AHP technique. Comput. Electron. Agric. 2013, 97, 71–82. [Google Scholar] [CrossRef]
- Kılıc, O.M.; Ersayın, K.; Gunal, H.; Khalofah, A.; Alsubeie, M.S. Combination of fuzzy-AHP and GIS techniques in land suitability assessment for wheat (Triticum aestivum) cultivation. Saudi J. Biol. Sci. 2022, 29, 2634–2644. [Google Scholar] [CrossRef]
- Gilliams, S.; Muys, B.; Van Orshoven, J.; Heil, G.; Kros, H. AFFOREST sDSS: A Metamodel based spatial decision support for afforestation of agricultural land. New For. 2005, 30, 33–53. [Google Scholar] [CrossRef]
- Grassano, N.; Tedone, L.; Verdini, L.; De Mastro, G. Evaluation of rapeseed cultivation suitability in Apulia with GIS-multicriteria analysis. Italian J. Agron. 2011, 6, 16–101. [Google Scholar] [CrossRef]
- Worqlul, A.W.; Dile, Y.T.; Jeong, J.; Adimassu, Z.; Lefore, N.; Gerik, T.; Srinivasan, R.; Clarke, N. Effect of climate change on land suitability for surface irrigation and irrigation potential of the shallow groundwater in Ghana. Comput. Electron. Agric. 2019, 157, 110–125. [Google Scholar] [CrossRef]
- Wang, L.; Ma, Y.; Yan, J.; Chang, V.; Zomaya, A.Y. pipsCloud: High performance cloud computing for remote sensing big data management and processing. Future Gener. Comput. Syst. 2018, 78, 353–368. [Google Scholar] [CrossRef]
- Arab, S.T.; Ahamed, T. Land Suitability Analysis for Potential Vineyards Extension in Afghanistan at Regional Scale Using Remote Sensing Datasets. Remote Sens. 2022, 14, 4450. [Google Scholar] [CrossRef]
- FAO. A Framework for Land Evaluation, Soils Bulletin No. 32. Rome: UNO-FAO. 1976. Available online: http://www.fao.org/3/X5310E/x5310e00.htm (accessed on 20 January 2023).
- Zhang, J.; Su, Y.; Wu, J.; Liang, H. GIS based land suitability assessment for tobacco production using AHP and fuzzy set in Shandong province of China. Comput. Electron. Agric. 2015, 114, 202–211. [Google Scholar] [CrossRef]
- Bojorquez-Tapia, L.A.; Diaz-Mondragon, S.; Ezcurra, E. GIS-based approach for participatory decision making and land suitability assessment. Int. J. Geogr. Infor. Sci. 2001, 15, 129–151. [Google Scholar] [CrossRef]
- Jamil, M.; Ahmed, R.; Sajjad, H. Land suitability assessment for sugarcane cultivation in Bijnor district, India using geographic information system and fuzzy analytical hierarchy process. GeoJournal 2018, 83, 595–611. [Google Scholar] [CrossRef]
- Singha, C.; Swain, K.C. Soil profile-based land suitability study for jute and lentil using AHP ranking. Int. J. Bio-Res. Stress Manag. 2018, 9, 323–329. [Google Scholar] [CrossRef]
- Palada, M.C.; Chang, L.C. Suggested cultural practices for jute mallow. Int. Coop. Guide 2003, 2, 1–4. [Google Scholar]
- USDA. Agricultural Research Service, Soil Texture, Classification, Department of Biological System Engineering; Washington State University: Pullman, WA, USA, 1980. [Google Scholar]
- BBS, Yearbook of Agricultural Statistics-2021. Bangladesh Bureau of Statistics (BBS), Ministry of Planning, Government of the People’s Republic of Bangladesh, Dhaka, Bangladesh. 2021. Available online: http://www.bbs.gov.bd/site/page/3e838eb6-30a2-4709-be85-40484b0c16c6/Yearbook-of-Agricultural-Statistics (accessed on 13 April 2023).


| Year of Occurrence | Month of Occurrence | Affected Area | Damage | Reference |
|---|---|---|---|---|
| 1954 | July–August | All districts near Jamuna River. | The water height at Sirajganj city was 14.22 m, damaged all crops. Dhaka district went under water. | [25] |
| 1955 | August | All districts near Jamuna River and 30% of Dhaka city. | Crops and houses | [25] |
| 1974 | March–December | Northeastern part of Bangladesh, Mymensingh, Sylhet, Sunamjang. | Significant majority of annual rice crop, one of the major causes of 1974 famines. 30,000 people died (Official data). | [26] |
| 1987 | Late June–September | 57,000 km2, about half of the area of Bangladesh. | 3.5 M tons of rice, 2.5 million houses and 1657 lives, | [5] |
| 1988 | August–September | 35 between 64 districts. 82,000 km2 area (BWDB 1987 and MOI 1988). | 370,000 ha fully, 391,000 ha partially damaged, 2 M tons of rice. | [5] |
| 1998 | July–August | 51 of 64 districts. 75% of the country, including half of Dhaka. | 30 million people and 6 million families were affected. They lost their crops and properties. | [27] |
| 2004 | July | 39 of 64 districts were affected. | 36 million people were affected. Agriculture, infrastructure, and health sectors were affected. | [28] |
| 2014 | August–September | Nilphamari, Lalmonirhat, Kurigram, Rangpur, Gaibandha, Jamalpur, Sirajganj, Tangail, Sunamjanj and Sylhet. | 10,000 acres of crops were inundated. | [10] |
| 2016 | July–September | 19 districts since July. Jamalpur, Kurigram, Sirajganj, Tangail, Gaibanda. Together, these 5 districts account for more than 70% of the affected people. | 3.2 million people across 16 districts. | [29] |
| 2017 | July–August | 31 districts, including Sirajganj and Tangail. | 15,529 hectares of agricultural land fully and 562,594 hectares partially inundated. | [30] |
| 2020 | June–July | 21 districts of Bangladesh, including Sirajganj and Tangail. | Most of the agricultural land was affected. | [31] |
| 2022 | July | Lalmonirhat, Kurigram, Thakurgaon, Panchagarh, Gaibandha, Bogra, Sirajganj, Jamalpur, Sunamganj, Brahmanbaria, Mymensingh, Tangail, Sylhet and Sunamjanj. | Most of the agricultural crops. | [32] |
| No | Data | Explanation | Types | Source of Data |
|---|---|---|---|---|
| 1 | Land Use and Land Cover (LULC) map for 2022 | Developed from Landsat 9 images in Google Earth Engine Platform | Raster | USGS |
| 2 | Slope map | The Shuttle Radar Topography Mission (SRTM), resolution 1-ARC | Raster | DEM SRTM USGS, 2014 and 2015 |
| 3 | Elevation map | |||
| 4 | Rainfall map | CHIRPS PERSIANN-Cloud classification system, resolution of 4 km × 4 km | Raster | CHIRPS, 2020 www.chrsdata.eng.uci.edu (accessed on 15 January 2023) |
| 5 | NDWI map for 2022 | Prepared from Landsat 9 (Collection 1 Tire 1 eight-days composite) in Google Earth Engine Platform | Raster | USGS |
| 6 | Soil pH | Soil texture and pH data of 250 m resolution covering 30 cm depth | Raster | ISRIC Data Hub www.isric.org/explore/isric-soil-data-hub (accessed on 15 January 2023) |
| 7 | Soil texture | |||
| 10 | Administrative Boundary Shapefile | Vector | Bangladesh Bureau of Statistics (BBS) | |
| 11 | River Shapefile | Vector | Bangladesh Bureau of Statistics (BBS) |
| No | Criteria | Fuzzy Membership Function | Equation | Fuzzy Membership Type | |
|---|---|---|---|---|---|
| Midpoint | Spread | ||||
| 1 | Rainfall | 2013.5 | 5 | Fuzzy Small | |
| 2 | Elevation | 22.91 | 5 | Fuzzy MS Large | |
| 3 | Distance from river | 7961.91 | 5 | Fuzzy MS Large | |
| 4 | Criteria | Minimum | Maximum | ||
| NDWI | 0 | 0.20 | Fuzzy Liner | ||
| No | Criteria | Fuzzy Membership Function | Equation | Fuzzy Membership Type | |
|---|---|---|---|---|---|
| Midpoint | Spread | ||||
| 1 | Slope | 22.91 | 5 | Fuzzy MS Large | |
| 2 | Soil pH | 5.90 | 0.1 | Fuzzy Gaussian | |
| 3 | Soil Texture | 4 | 0.1 | Fuzzy Gaussian | |
| 4 | Rainfall | 2013.5 | 5 | Fuzzy Small | |
| 5 | LULC | 2 | 0.1 | Fuzzy Gaussian | |
| 6 | Elevation | 22.91 | 5 | Fuzzy MS Large | |
| 7 | Distance from river | 7961.91 | 5 | Fuzzy MS Large | |
| Criteria | Minimum | Maximum | |||
| 8 | Flooding | 1 | 4 | Fuzzy Liner |
| Vulnerability Class | Area (km2) | Area % |
|---|---|---|
| V1 (Highly vulnerable area for inundation by water) | 18.49 | 0.34 |
| V2 (Moderately vulnerable area for inundation by water) | 2304.52 | 41.99 |
| V3 (Marginally vulnerable area for inundation by water) | 2308.95 | 42.07 |
| N (Nonvulnerable area for inundation by water) | 856.70 | 15.61 |
| Total | 5488.66 | 100 |
| Suitability Class | Area (km2) | Area (%) |
|---|---|---|
| S1 (Highly suitable for jute and sugarcane cultivation) | 1573.21 | 28.66 |
| S2 (Moderately suitable for jute and sugarcane cultivation) | 1535.05 | 27.97 |
| S3 (Marginally suitable for jute and sugarcane cultivation) | 1083.89 | 19.75 |
| N (Not suitable for jute and sugarcane cultivation) | 1296.51 | 23.62 |
| Total | 5488.66 | 100 |
Disclaimer/Publisher’s Note: The statements, opinions and data contained in all publications are solely those of the individual author(s) and contributor(s) and not of MDPI and/or the editor(s). MDPI and/or the editor(s) disclaim responsibility for any injury to people or property resulting from any ideas, methods, instructions or products referred to in the content. |
© 2023 by the authors. Licensee MDPI, Basel, Switzerland. This article is an open access article distributed under the terms and conditions of the Creative Commons Attribution (CC BY) license (https://creativecommons.org/licenses/by/4.0/).
Share and Cite
Alam, K.F.; Ahamed, T. Climate-Adaptive Potential Crops Selection in Vulnerable Agricultural Lands Adjacent to the Jamuna River Basin of Bangladesh Using Remote Sensing and a Fuzzy Expert System. Remote Sens. 2023, 15, 2201. https://doi.org/10.3390/rs15082201
Alam KF, Ahamed T. Climate-Adaptive Potential Crops Selection in Vulnerable Agricultural Lands Adjacent to the Jamuna River Basin of Bangladesh Using Remote Sensing and a Fuzzy Expert System. Remote Sensing. 2023; 15(8):2201. https://doi.org/10.3390/rs15082201
Chicago/Turabian StyleAlam, Kazi Faiz, and Tofael Ahamed. 2023. "Climate-Adaptive Potential Crops Selection in Vulnerable Agricultural Lands Adjacent to the Jamuna River Basin of Bangladesh Using Remote Sensing and a Fuzzy Expert System" Remote Sensing 15, no. 8: 2201. https://doi.org/10.3390/rs15082201