Review

Big Geospatial Data or Geospatial Big Data? A Systematic Narrative Review on the Use of Spatial Data Infrastructures for Big Geospatial Sensing Data in Public Health

1
Department of Geography, Faculty of Social Sciences, The University of Hong Kong, Hong Kong 999077, China
2
Division of Environmental Health Sciences, College of Public Health, and Translational Data Analytics Institute, The Ohio State University, Columbus, OH 43210, USA
3
Division of Environmental Health Sciences, College of Public Health, The Ohio State University, Columbus, OH 43210, USA
4
Institute for Preventive Medicine and Public Health, School of Medicine (FMUL), University of Lisbon, 1649-028 Lisbon, Portugal
*
Author to whom correspondence should be addressed.
Remote Sens. 2022, 14(13), 2996; https://doi.org/10.3390/rs14132996
Submission received: 13 May 2022 / Revised: 19 June 2022 / Accepted: 21 June 2022 / Published: 23 June 2022
(This article belongs to the Special Issue Spatial Data Infrastructures for Big Geospatial Sensing Data)

Abstract

:
Background: Often combined with other traditional and non-traditional types of data, geospatial sensing data have a crucial role in public health studies. We conducted a systematic narrative review to broaden our understanding of the usage of big geospatial sensing, ancillary data, and related spatial data infrastructures in public health studies. Methods: English-written, original research articles published during the last ten years were examined using three leading bibliographic databases (i.e., PubMed, Scopus, and Web of Science) in April 2022. Study quality was assessed by following well-established practices in the literature. Results: A total of thirty-two articles were identified through the literature search. We observed the included studies used various data-driven approaches to make better use of geospatial big data focusing on a range of health and health-related topics. We found the terms ‘big’ geospatial data and geospatial ‘big data’ have been inconsistently used in the existing geospatial sensing studies focusing on public health. We also learned that the existing research made good use of spatial data infrastructures (SDIs) for geospatial sensing data but did not fully use health SDIs for research. Conclusions: This study reiterates the importance of interdisciplinary collaboration as a prerequisite to fully taking advantage of geospatial big data for future public health studies.

1. Introduction

Geospatial data, also referred as geographic data or spatial data, is a broad term widely covering all types of information having an implicit or explicit association with a location relative to objects, events, or phenomena on the surface of the Earth.
Sensing data are a set of information collected by specially designed devices to respond to, and detect, specific types of input from a data source with no or minimum physical contact or additional human effort. Sensing data are among the essential types of geospatial data. Traditionally, remote sensing, the process of capturing the level of energy reflected and emitted from a study subject at a distance using a satellite or aircraft, has been a dominant form of collecting sensing data in geography, geoscience, and related disciplines. Recently, collecting sensing data has become more diversified with innovative technologies such as the Internet of Things (IoT), sensor web technologies, and sonic geographies [1]. In addition, volunteered geographic information (VGI), participatory geographic information systems (PGIS), and citizen sensors bring social content to geospatial sensing data [2].
Remote sensing data are generally large in volume. A new generation of sensing data often requires unconventional, advanced computing techniques to ingest, store, process, analyze, model, and report. Owing to advances in computing capacity, it is common for researchers to combine data from multiple types of sensors and other types of spatial/aspatial data (e.g., census data, survey data). Therefore, it is no wonder that the use of big geospatial sensing data (BGSD) has gained ground in research and policymaking.
Even before the arrival of BGSD, public health is one of the areas where sensing data have been extensively utilized for research. For example, traditional remote sensing data such as vegetation, land surface temperature, atmospheric moisture, rainfall indices, and air pollution have been widely used for epidemiological and public health studies, on the topics of both communicable and non-communicable diseases [3,4,5,6]. Additionally, the latest studies actively embrace the use of wearable sensors and mobile devices to detect vital signs and physical activity patterns for disease prevention and health promotion [7].
The use of BGSD in public health poses both new challenges and opportunities for researchers, among which are the issues of spatial data infrastructures (SDIs). SDI can be defined as a set of networks for data exchange and sharing systems between users and stakeholders from different levels of the user community [8]. The earliest efforts for building an SDI can be traced back to automating land records management and urban/regional information systems built by the United States (U.S.) Department of Housing and Urban Development and the Tennessee Valley Authority in the early 1960s [9]. Since then, multiple national and international SDIs such as the Global Earth Observation System of Systems (GEOSS), the European Commission’s INSPIRE (Infrastructure for Spatial Information in the European Community), and the U.S. National Science Foundation EarthCube have been created. The Open Geospatial Consortium (OGC) and the ISO (International Organization for Standardization) TC (Technical Committee) 211 serve as catalysts to set international standards and to seek international collaborations for SDIs. Health SDIs become essential resources for public health interventions, research, and communication, as many government and non-government public health stakeholders have built useful health SDIs.
This review aimed to explore what types of spatial data and SDI have been utilized in public health studies using BGSD during the last decade. In addition, we intended to discuss various challenges and suggestions identified in the current body of the literature. Considering the nature of the research question, we conducted a systematic narrative review (narrative synthesis and thematic analysis) to synthesize the findings from individual research for a comprehensive understanding [10].

2. Materials and Methods

2.1. Research Questions (RQs)

The questions addressed in this literature review are the following:
  • (RQ1) What types of geospatial data are compiled for BGSD to examine public health outcomes?
  • (RQ2) How do the existing public health studies using sensing data define BGSD? Is there a clear distinction between ‘big’ geospatial data and geospatial ‘big data’ in use?
  • (RQ3) What data sources serve as an SDI of geospatial and health/health-related information for researchers to obtain relevant data?
  • (RQ4) To what extent has the concept of health SDI been discussed in practice?

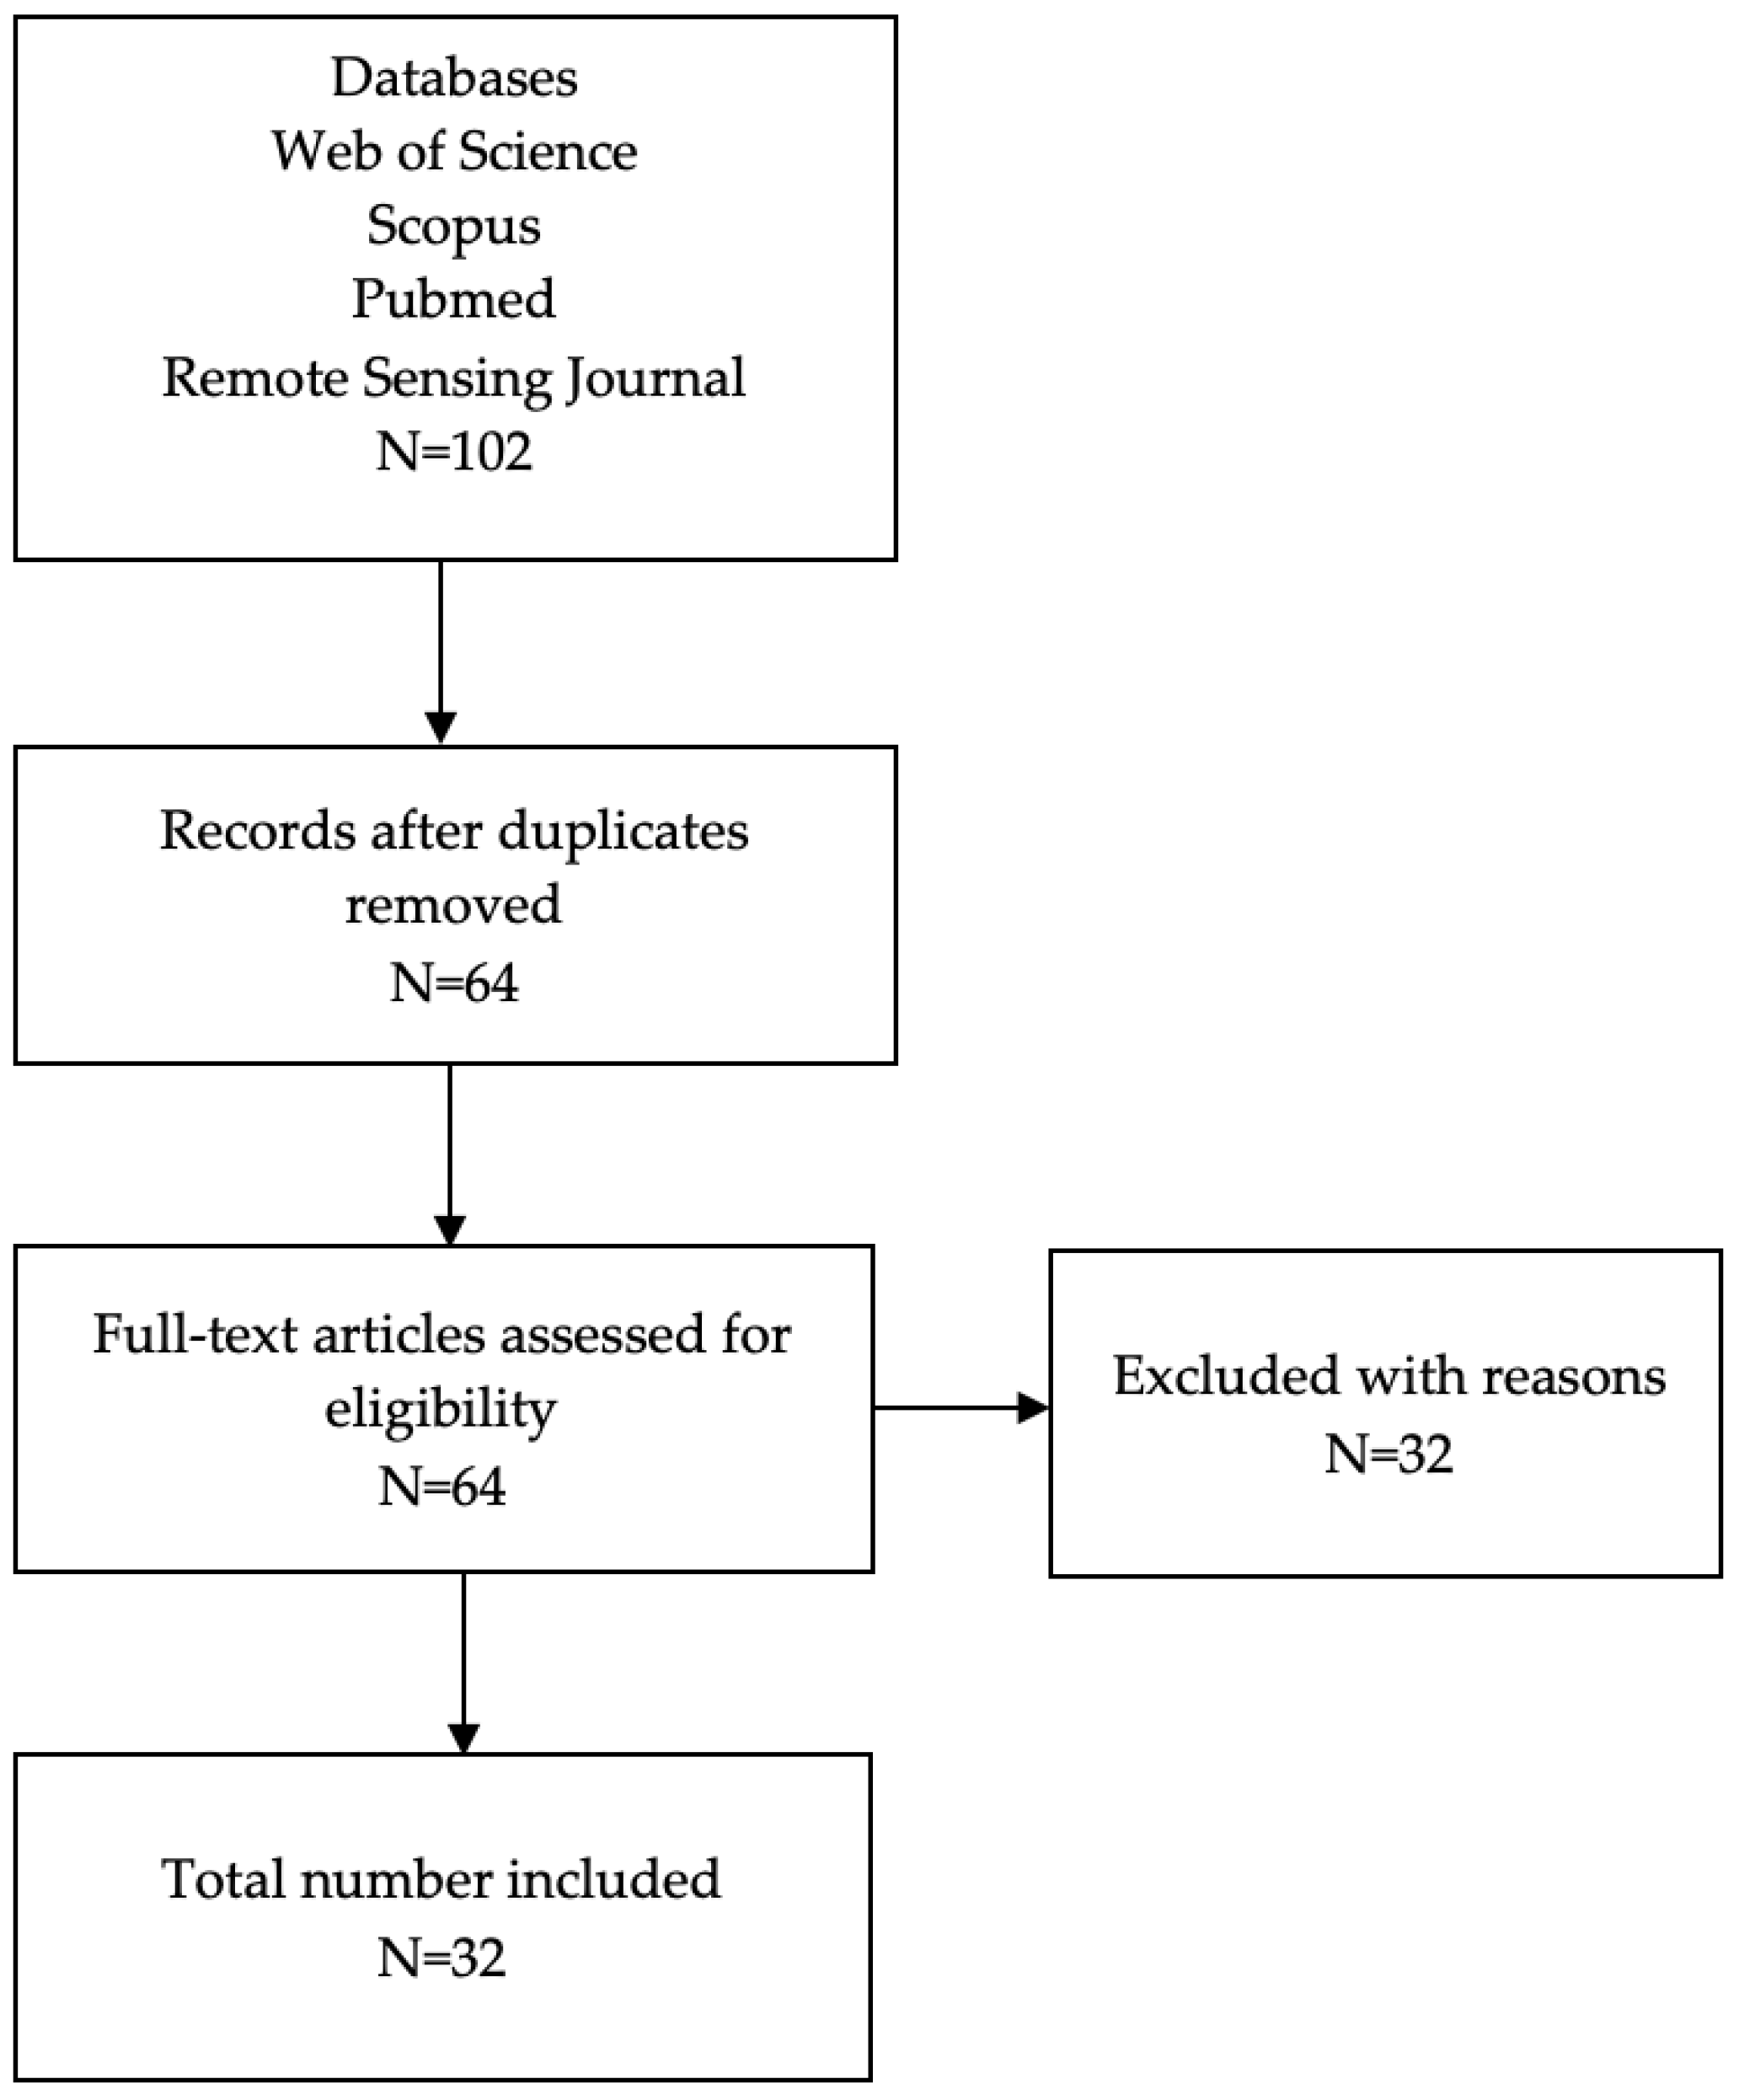
2.2. Search Strategy

We applied systematic searching techniques to identify relevant studies with the search topics and keywords by following the methodology of narrative synthesis suggested by Popay et al. [10]. Our searches were performed in April 2022 using three leading bibliographic databases: PubMed, Scopus, and Web of Science. An additional search of the articles published in Remote Sensing was conducted to complement the initial searches (see Figure 1). Since the search functionality varies between the databases, we applied various search term strings: “remote sensing” “wearable” “sensor” “VGI” “PGIS” “social media” AND “geospatial big data” “big geospatial data” AND “health” “healthcare” “health care” “public health.” Then, we applied the following inclusion and exclusion criteria and the quality assessment to retrieve the final sample of the works eligible for the literature review.

2.2.1. Inclusion and Exclusion Criteria

Articles were included if they were (a) published as an original study in peer-reviewed journals to fully evaluate the completeness of each study; (b) written in English; and (c) published from 2012 to 2022. We excluded articles if they were (a) review and editorial papers; (b) conference papers, since it is unclear if they went through peer-review process; and (c) lacking the terms ‘big data,’ ‘big geospatial data,’ or ‘geospatial big data’ in the title, abstract, keywords, or the methods (or equivalent) section of the manuscript through full-text article screening.

2.2.2. Quality Assessment

Applying the Critical Appraisal Checklist for Analytical Cross-sectional Studies suggested by the Joanna Briggs Institute [11], the following eight appraisal criteria were used to evaluate the overall quality of the selected works for this review: (1) the study sample selection criteria, (2) the study subjects and the setting, (3) the measurement of exposure, (4) the condition of measurement, (5) the identification of confounding factors, (6) the methods of addressing confounding factors, (7) the measurement of outcomes, and (8) the appropriateness of statistical analysis.

3. Results

After screening and deduplication, we retrieved a total of 32 papers in the final sample of review (Figure 1). We set the search range from 2012 to 2022 to explore the latest trends in research and technical advances. Below, we present the summaries of the article information.

3.1. Journal Categories

As shown in Table 1, about two-thirds of the included articles were published equally in number in the fields of geography and public health (n = 10, both). The remaining one-third of the works were published in an environment (n = 8) or science (n = 4) journal.

3.2. Study Areas

Half of the included studies were conducted in China. North America, especially the USA, was among the popular study areas. Notably, three studies covered multiple countries (Table 2).

3.3. Study Topics

The included studies explored various research themes. About half of the studies directly examined the association or causality between a health or health-related condition and environmental factors. Another half focused on environmental conditions potentially affecting public health (Table 3).

3.4. Patterns of Data Compilation

As summarized in Table 4, all the included studies used data from multiple sources. About a third of the studies (n = 12) used remote sensing and health-related data. Data were often compiled by merging multiple remote sensing data (n = 6), combining with mobile phone data (n = 4), and comparing with socioeconomic data (n = 3). New sources such as geotagged social media, UAVs (unmanned aerial vehicles), wearable devices, and VGI/PGIS were also utilized for the included studies.

3.5. Sources of Data

We observed that multiple open-data sources/infrastructures, both from public and private sectors, such as the NASA (National Aeronautics and Space Administration) database, Earth Engine, and governmental agencies, were utilized for analysis (Table 5). While data such as local-level air pollutant government reports and hospital patient records from public organizations such as governments and hospitals were frequently used for analysis, the details of data procurement were not clearly described in most of the studies. Data from ‘tech’ companies or the Internet were apparently available freely, but a special arrangement of data sharing or additional data process data may be required prior to analysis. Personal devices such as mobile phones, UAVs, and wearables also serve as important sources of data.

4. Discussion

Below, we highlight what has been accomplished in the existing public health studies with BGSD based on the aforementioned results, as well as areas for improvement.

4.1. Strengths

4.1.1. BGSD for Assessing the Environments

We observed that a range of environment characteristics have been objectively measured by various BGSD, among which remote sensing data play a crucial role in the assessment. Especially, air pollutant concentration levels (PM2.5, nitrogen dioxide), green space, temperature/heat emission, the density of built environments (e.g., road networks, buildings, population), and land use types are among the important remote sensing data that researchers frequently use for public health studies. The useability of remote sensing data is often further enhanced by merging multiple remote sensing data. Each local environment was often assessed by using an area-level index or parameter through data-intensive spatial interpolation/extrapolation.

4.1.2. New Types of Data for BGSD

The included studies proved that advances in technology have contributed to the enrichment of BGSD. First, many studies made use of geotagged, real-time social media data obtained from ‘tech’ companies such as Twitter and Tencent so that they could retrieve detailed information on spatial and temporal human mobility. Second, the POIs data, often available from social media platforms or the Internet, were extensively used to complement BGSD by providing real-world locational information such as traffic flow, land use patterns, and human settlement. Third, data collected by wearable devices and UAVs became more feasible for research, since technical and resource barriers have been lifted with technical advances. Finally, WorldPop, an open-data initiative to share the estimated gridded world population datasets using both remotely sensed and ancillary geospatial data through a Random Forest data-mining model, is popular in the included studies [44].

4.1.3. New Methods for BGSD

Our review captured the fact that novel and advanced approaches of data analytics have been applied in the included studies. Machine learning, data fusion, social media analytics, artificial intelligence (AI), cloud computing, and neural networks computing are among such new analysis methods to explore various types of BGSD and supplementary data in the literature [13,16,17,22,33,41]. In addition, it is notable to see that studies conducted in developing countries actively utilized crowdsourced mapping of PGIS and VGI to add missing geospatial information to open databases such as OpenStreetMap.

4.1.4. Variety of Research Topics with BGSD

Both vector-borne and non-vector-borne diseases, as well as vital health measures, were investigated in the literature across the globe, in high-, middle-, and low-income countries. Studies on vector-borne diseases cover various fatal diseases such as malaria, hemorrhagic fever with renal syndrome, and other neglected tropical diseases (e.g., soil-transmitted helminth, and human rabies) [21,25,26,27,41]. In addition, studies about air quality and related respiratory diseases, mostly performed in China, emphasize that timely governmental interventions, as well as global awareness, are required to address the public health challenges caused by rapid industrialization triggered by globalization.

4.2. Areas for Improvement and Suggestions

While there are several strengths in the included studies, we also observed areas for improvement that future studies may consider addressing.

4.2.1. ‘Big’ Geospatial Data vs. Geospatial ‘Big Data’

The first issue to discuss is the inconsistency in using the term ‘big data’. Geospatial sensing data is innately ‘big’ in volume and complex in structure due to its range of geographic coverage, the number of observations, the variety of information, and the existence of metadata [45]. As sensing and earth observation technologies advance, more high-resolution remote sensing data with multi-spatial and temporal units become available for research [46]. In addition, new types of data, such as location-based POIs from the Internet, geotagged social media data, and data from various sensing devices such as smartphones, wearables, UAVs, and IoT applications, are often combined with geospatial sensing data in research through advanced data processing and mining techniques. Therefore, it is natural to think that future studies are more likely to use a ‘big’ volume of data with high complexity. However, simply using ‘lots of data’ do not necessarily warrant the studies using such data being considered ‘big data’ analysis, since big data refers to a large collection of data sets that require revolutionary computing solutions to process and utilize due to their extraordinary conditions resulting from their volume in size, variety in information, velocity in data generation, and veracity in quality [45,46,47]. In this regard, we suggest using two different concepts in future research: ‘big’ geospatial data and geospatial ‘big data’.
Our review informed us that the following questions can serve as a set of standards to define geospatial ‘big data’: (1) Were the data acquired by a nonconventional data collection method (e.g., social media, new types of sensors such as IoT, wearable devices)? (2) In the case of using data collected from well-established sources (e.g., remote sensing data from an established institution, the open Internet database), was there any additional state-of-the-art ‘big data’ analytic approach (e.g., machine learning, AI) developed by the research team for data process and/or analysis? (3) Were multiple types of geospatial data (e.g., remote sensing and social media data) compiled for data mining and processing for the research? (4) Was any non-traditional computing device or software/tools (e.g., high-performance computing, scalable computing) used for data process and analysis? Those data that fail more than two of the above-mentioned standards may be referred to as ‘big’ geospatial data rather than geospatial ‘big data’. We recommend that future studies can clarify these standards in their manuscripts, especially in the Methods section, for reproducibility and replicability in research.

4.2.2. Limited Areas of Research

While various research topics were explored in the included studies, more than half of the studies investigated health-related environmental conditions rather than directly focusing on a health or health-related outcome. This limitation can also be observable in that only a third of the selected studies were published in a health-related journal, and the remaining two-thirds were published in non-health journals. In addition, the majority of the included studies predominantly focused on respiratory health. It is also possible that researchers may describe environmental exposure assessment methods using “big” geospatial data in one study and the application of the exposure estimates in a health effects study without mentioning “big” geospatial data. This may explain why we observed limited studies on health outcomes, since our inclusion criteria focused on “big” geospatial data and other related terms.
Considering the nature of geospatial sensing data, it may be reasonable to think that geospatial sensing data are most relevant to examining respiratory health and its related environmental measures. Since the latest remote sensing data gather multi-spatial, multi-temporal information, the areas of research can be potentially expanded to many other themes and health outcomes. Lifestyle diseases, especially physical-activity-related chronic diseases, unhealthy eating, and (re)emerging infectious diseases, can be further examined thoroughly with new types of geospatial sensing data [48].

4.2.3. Toward Overcoming Ecological Fallacy

Issues also remain around study design. Except for a few studies, the majority of articles reported on ecological studies. Despite their convenience and usefulness, epidemiologists and public health scientists often raise questions concerning ecological studies by referring to the “ecological fallacy” and recommending more rigorous studies to address aggregation bias [49]. Collecting individual-level data through various types of sensor devices and technology can be an alternative way to overcome the issues of the ecological fallacy by enabling the researchers to collect data at fine spatial and temporal scales. The use of small-area estimation to generate local disease estimates or synthetic population datasets can be another approach to making better use of geospatial sensing data [50,51]. Finally, using the concept of the ‘exposome’—the cumulative measure of all the exposures of an individual related to their health during their whole lifetime—can provide a holistic approach to examining one’s health using BGSD [52].

4.2.4. Suggestions for Future SDIs

Data openness and shareability are critical to conducting a successful research project. We observed that researchers could secure various open geospatial sensing data obtainable through the existing open SDIs such as the U.S. NASA’s Earth Science Data Systems or the European Space Agency’s Copernicus Open Access Hub [53]. In contrast, we saw that there is a discrepancy in the practice of data shareability across regions. While several Chinese institutions (e.g., the China Meteorological Data Sharing Service Centre, the Ministry of Ecology and Environment of the People’s Republic of China, and the China National Environmental Monitoring Center) were listed in several studies as important data sources, the details were less available and accessible due to the language barrier or connection issues on the Internet [54,55,56]. Several government reports and public hospitals in China were also mentioned as data sources, but the details of availability were not clearly stated.
Recently, many national governments have launched online open-data portals to make public data freely available in a transparent, responsible way. Figure 2 illustrates several examples of government open-data portals. The 2019 Organisation for Economic Co-operation and Development (OECD) OURdata (Open-Useful-Reusable data) Index on Open Government Data listed South Korea, France, Columbia, Ireland, and Japan as the top five countries among its 38 member countries with the highest government efforts for open data using three categories—data availability, data accessibility, and reusability of government data [57]. More efforts and initiatives among various stakeholders for open SDIs may contribute to public health studies with geospatial data. A potential way to facilitate such efforts may be using common terms/themes for data categorization/classification. For example, the U.S.’s Data.gov uses seven data topics, including agriculture, climate, energy, local government, maritime, ocean, and older adults’ health. In contrast, South Korea’s public data portal classifies data into 16 categories: education, data map, administration, finance, industry, social services, food, culture, health care, disaster recovery, transportation (logistics), weather, technology, agriculture, unification, and law. Since such different strategies in data categorization may undermine data shareability, it may be recommended to set a universal standard for data categorization.
When it comes to health SDIs, there are many governments operating various health SDIs. Figure 3 illustrates several examples of SDIs available online. “Interactive Web Apps & Data” assessable through the geography and geospatial science working group (GeoSWG) at the U.S. Centers for Disease Control and Prevention provides a range of health and health-related online maps and datasets at various geographical units (Figure 3a). The United Kingdom’s Office for Health Improvement and Disparities’ Public Health Dashboard is an important outlet for health and health behaviors information at the county/unitary-authority level in the U.K. (Figure 3b). The Korea National Health Insurance Service-ATLAS, operating only in Korean to date, provides about 100 clinical health/health-related information resources and interactive maps based on its national health insurance database at the second smallest administrative unit (Figure 3c). Finally, the University of Washington’s Institute for Health Metrics and Evaluation operates various online data visualization and sharing tools to provide a range of public health data at both domestic and international scales (Figure 3d). Further such health SDI initiatives are expected to come, as there are more demands and collaborations for open data among various stakeholders. A notable example is a call from the Open Geospatial Consortium (OGC), an international not-for-profit consortium for making geospatial (location) information and services FAIR (i.e., Findable, Accessible, Interoperable, and Reusable), for expressions of interest to convene a health SDI initiative to seek community-driven, evidence-based solutions for various public health challenges during the COVID-19 pandemic [61].
Interestingly, none of the included studies for this review use these well-established health SDIs for their research. This may imply that more interdisciplinary and cross-disciplinary collaborations across the globe are required for future studies. An immediate task for interdisciplinary collaboration may be enhancing the mutual understanding between geospatial sensing scientists and health scholars. Building common ground on technical concepts between different domain experts can enhance mutual understanding and communication [66].
In addition, it may be worth noting that researchers may adopt and endorse new data citation standards for future studies. The practice of data sharing can be promoted more only after researchers and users value it as much as authorship of publications [67]. Under the Joint Declaration of Data Citation Principles (JDDCP), researchers proposed multiple roadmaps to initiate data citations for scientific publishers and data repositories [68,69]. Therefore, future health SDIs can contribute more to promoting data sharing and the open-data movement by applying the new data citation standards such as using digital object identifiers (DOIs), reporting data availability statements, and providing metadata to landing pages [67,68,69].

4.3. Strengths and Limitations of This Review

This review has several strengths and limitations. This review examined how various geospatial sensing data can be combined with multiple data from various sources in data-driven ways. We also observed the inconsistent practices in using the term ‘big data’ in research and suggested an alternative way to separate geospatial ‘big data’ and ‘big’ geospatial data. Finally, by examining various sources of SDIs and health SDIs, collaborations among different domain experts should be required for future research.
Several limitations were also exposed in this review. First, since the concept of geospatial sensing big data for public health is still in the nascent stage, a relatively small number of scholarly works were identified for this review. Second, this review limited its searches to major sections of research, including titles, abstracts, and keywords. Therefore, not all the parts of the manuscripts were examined for review, which may not provide a full overview of the existing studies. Finally, we may overlook the newly emerging field of big data analytics with geospatial sensing big data in public health studies, as the research area is fast growing and extensively wide in range [70].

5. Conclusions

It is evident that there will be growing opportunities for researchers to utilize various types of geospatial big data that combine high-resolution geospatial sensing data and other types of traditional and non-traditional data in the field of public health. The existing literature has presented various novel data-driven approaches to make better use of geospatial big data focusing on a range of health and health-related topics. However, this review also found several areas to improve in future studies. Especially, we noticed that the existing research made good use of the SDIs for geospatial sensing data but did not fully use health SDIs for research. This study reiterates the importance of collaboration as a prerequisite to fully taking advantage of geospatial big data for future public health studies by presenting several recommendations.

Author Contributions

Conceptualization, K.K. and M.N.K.B.; methodology, K.K.; validation, K.K.; writing—original draft preparation, K.K.; writing—review and editing, K.K., A.H., Y.K. and M.N.K.B.; visualization, K.K.; supervision, M.N.K.B. All authors have read and agreed to the published version of the manuscript.

Funding

MNKB’s research is funded by the European Union’s Horizon 2020 Research and Innovation programme under grant agreement No. 952377.

Data Availability Statement

Not applicable.

Conflicts of Interest

The authors declare no conflict of interest.

References

  1. Gallagher, M.; Prior, J. Sonic geographies: Exploring phonographic methods. Prog. Hum. Geogr. 2014, 38, 267–284. [Google Scholar] [CrossRef]
  2. Kamel Boulos, M.N.; Resch, B.; Crowley, D.N.; Breslin, J.G.; Sohn, G.; Burtner, R.; Pike, W.A.; Jezierski, E.; Chuang, K.Y. Crowdsourcing, citizen sensing and sensor web technologies for public and environmental health surveillance and crisis management: Trends, OGC standards and application examples. Int. J. Health Geogr. 2011, 10, 67. [Google Scholar] [CrossRef] [PubMed] [Green Version]
  3. Hay, S. An overview of remote sensing and geodesy for epidemiology and public health application. Adv. Parasitol. 2000, 47, 1–35. [Google Scholar] [CrossRef] [PubMed] [Green Version]
  4. Tatem, A.J.; Hay, S.I. Measuring urbanization pattern and extent for malaria research: A review of remote sensing approaches. J. Urban Health 2004, 81, 363–376. [Google Scholar] [CrossRef]
  5. Baker, M.; Mathieu, E.; Fleming, F.; Deming, M.; King, J.; Garba, A.; Koroma, J.; Bockarie, M.; Kabore, A.; Sankara, D.; et al. Mapping, monitoring, and surveillance of neglected tropical diseases: Towards a policy framework. Lancet 2010, 375, 231–238. [Google Scholar] [CrossRef]
  6. Hamm, N.A.; Soares Magalhães, R.J.; Clements, A.C. Earth observation, spatial data quality, and neglected tropical diseases. PLoS Negl. Trop. Dis. 2015, 9, e0004164. [Google Scholar] [CrossRef]
  7. Wu, M.; Luo, J. Wearable technology applications in healthcare: A literature review. Online J. Nurs. Inform. 2019, 23. [Google Scholar]
  8. Hjelmager, J.; Moellering, H.; Cooper, A.; Delgado, T.; Rajabifard, A.; Rapant, P.; Danko, D.; Huet, M.; Laurent, D.; Aalders, H.; et al. An initial formal model for spatial data infrastructures. Int. J. Geogr. Inf. Sci. 2008, 22, 1295–1309. [Google Scholar] [CrossRef]
  9. McLaughlin, J.; Nichols, S. Developing a national spatial data infrastructure. J. Surv. Eng. 1994, 120, 62–76. [Google Scholar] [CrossRef]
  10. Popay, J.; Roberts, H.; Sowden, A.; Petticrew, M.; Arai, L.; Rodgers, M.; Britten, N.; Roen, K.; Duffy, S. Guidance on the conduct of narrative synthesis in systematic reviews. A product from the ESRC methods programme. Version 2006, 1, b92. [Google Scholar]
  11. Moola, S.; Munn, Z.; Tufanaru, C.; Aromataris, E.; Sears, K.; Sfetcu, R.; Currie, M.; Lisy, K.; Qureshi, R.; Mattis, P.; et al. Chapter 7: Systematic reviews of etiology and risk. In Joanna Briggs Institute (JBI) Manual for Evidence Synthesis; Aromataris, E., Munn, Z., Eds.; JBI: Adelaide, Australia, 2020; Available online: https://synthesismanual.jbi.global (accessed on 18 June 2022). [CrossRef]
  12. Van den Homberg, M.; Crince, A.; Wilbrink, J.; Kersbergen, D.; Gumbi, G.; Tembo, S.; Lemmens, R. Combining UAV Imagery, Volunteered Geographic Information, and Field Survey Data to Improve Characterization of Rural Water Points in Malawi. ISPRS Int. J. Geo-Inf. 2020, 9, 592. [Google Scholar] [CrossRef]
  13. Chen, Y.; Weng, Q.; Tang, L.; Liu, Q.; Zhang, X.; Bilal, M. Automatic mapping of urban green spaces using a geospatial neural network. GISci. Remote Sens. 2021, 58, 624–642. [Google Scholar] [CrossRef]
  14. Liu, Q.; Ullah, H.; Wan, W.; Peng, Z.; Hou, L.; Qu, T.; Haidery, S.A. Analysis of Green Spaces by Utilizing Big Data to Support Smart Cities and Environment: A Case Study About the City Center of Shanghai. ISPRS Int. J. Geo-Inf. 2020, 9, 360. [Google Scholar] [CrossRef]
  15. Zhu, L.; Guo, Y.; Zhang, C.; Meng, J.; Ju, L.; Zhang, Y.; Tang, W. Assessing Community-Level Livability Using Combined Remote Sensing and Internet-Based Big Geospatial Data. Remote Sens. 2020, 12, 4026. [Google Scholar] [CrossRef]
  16. Chen, B.; Tu, Y.; Song, Y.; Theobald, D.M.; Zhang, T.; Ren, Z.; Li, X.; Yang, J.; Wang, J.; Wang, X.; et al. Mapping essential urban land use categories with open big data: Results for five metropolitan areas in the United States of America. ISPRS J. Photogramm. Remote Sens. 2021, 178, 203–218. [Google Scholar] [CrossRef]
  17. Lary, D.J.; Woolf, S.; Faruque, F.; Lepage, J.P. Holistics 3.0 for Health. ISPRS Int. J. Geo-Inf. 2014, 3, 1023–1038. [Google Scholar] [CrossRef] [Green Version]
  18. Yang, C.; Sha, D.; Liu, Q.; Li, Y.; Lan, H.; Guan, W.W.; Hu, T.; Li, Z.; Zhang, Z.; Thompson, J.H.; et al. Taking the pulse of COVID-19: A spatiotemporal perspective. Int. J. Digit. Earth 2020, 13, 1186–1211. [Google Scholar] [CrossRef]
  19. Zhao, N.; Cao, G.; Zhang, W.; Samson, E.; Chen, Y. Remote sensing and social sensing for socioeconomic systems: A comparison study between nighttime lights and location-based social media at the 500 m spatial resolution. Int. J. Appl. Earth Obs. Geoinf. 2020, 87, 102058. [Google Scholar] [CrossRef]
  20. Fuentes, M.; Millard, K.; Laurin, E. Big geospatial data analysis for Canada’s Air Pollutant Emissions Inventory (APEI): Using Google Earth engine to estimate particulate matter from exposed mine disturbance areas. GIScience Remote Sens. 2020, 57, 245–257. [Google Scholar] [CrossRef]
  21. Solís, P.; McCusker, B.; Menkiti, N.; Cowan, N.; Blevins, C. Engaging global youth in participatory spatial data creation for the UN sustainable development goals: The case of open mapping for malaria prevention. Appl. Geogr. 2018, 98, 143–155. [Google Scholar] [CrossRef]
  22. Scavuzzo, C.; Scavuzzo, J.; Campero, M.; Anegagrie, M.; Aramendia, A.A.; Benito, A.; Periago, V. Feature importance: Opening a soil-transmitted helminth machine learning model via SHAP. Infect. Dis. Model. 2022, 7, 262–276. [Google Scholar] [CrossRef] [PubMed]
  23. Xia, X.; Yao, L. Spatio-Temporal Differences in Health Effect of Ambient PM2.5 Pollution on Acute Respiratory Infection Between Children and Adults. IEEE Access 2019, 7, 25718–25726. [Google Scholar] [CrossRef]
  24. Xia, X.; Yao, L.; Lu, J.; Liu, Y.; Jing, W.; Li, Y. A Comparison Analysis of Causative Impact of PM2.5 on Acute Exacerbation of Chronic Obstructive Pulmonary Disease (COPD) in Two Typical Cities in China. Atmosphere 2021, 12, 970. [Google Scholar] [CrossRef]
  25. Chen, Z.; Liu, F.; Li, B.; Peng, X.; Fan, L.; Luo, A. Prediction of hot spot areas of hemorrhagic fever with renal syndrome in Hunan Province based on an information quantity model and logistical regression model. PLoS Negl. Trop. Dis. 2020, 14, e0008939. [Google Scholar] [CrossRef]
  26. Xiao, H.; Tong, X.; Gao, L.; Hu, S.; Tan, H.; Huang, Z.Y.X.; Zhang, G.; Yang, Q.; Li, X.; Huang, R.; et al. Spatial heterogeneity of hemorrhagic fever with renal syndrome is driven by environmental factors and rodent community composition. PLoS Negl. Trop. Dis. 2018, 12, e0006881. [Google Scholar] [CrossRef]
  27. Xiao, H.; Tong, X.; Huang, R.; Gao, L.; Hu, S.; Lidong, G.; Gao, H.; Zheng, P.; Yang, H.; Huang, Z.Y.X.; et al. Landscape and rodent community composition are associated with risk of hemorrhagic fever with renal syndrome in two cities in China, 2006–2013. BMC Infect. Dis. 2018, 18, 37. [Google Scholar] [CrossRef] [Green Version]
  28. Yang, X.; Yao, C.; Chen, Q.; Ye, T.; Jin, C. Improved Estimates of Population Exposure in Low-Elevation Coastal Zones of China. Int. J. Environ. Res. Public Health 2019, 16, 4012. [Google Scholar] [CrossRef] [Green Version]
  29. Yao, L.; Huang, C.; Jing, W.; Yue, X.; Xu, Y. Quantitative Assessment of Relationship between Population Exposure to PM2.5 and Socio-Economic Factors at Multiple Spatial Scales over Mainland China. Int. J. Environ. Res. Public Health 2018, 15, 2058. [Google Scholar] [CrossRef] [Green Version]
  30. Yu, J.; Xiao, H.; Yang, W.; Dellicour, S.; Kraemer, M.U.G.; Liu, Y.; Cai, J.; Huang, Z.X.Y.; Zhang, Y.; Feng, Y.; et al. The impact of anthropogenic and environmental factors on human rabies cases in China. Transbound. Emerg. Dis. 2020, 67, 2544–2553. [Google Scholar] [CrossRef]
  31. Hasyim, H.; Nursafingi, A.; Haque, U.; Montag, D.; Groneberg, D.A.; Dhimal, M.; Kuch, U.; Müller, R. Spatial modelling of malaria cases associated with environmental factors in South Sumatra, Indonesia. Malar. J. 2018, 17, 87. [Google Scholar] [CrossRef] [Green Version]
  32. Bian, J.; Li, A.; Nan, X.; Lei, G.; Zhang, Z. Dataset of the mountain green cover index (SDG15.4.2) over the economic corridors of the Belt and Road Initiative for 2010–2019. Big Earth Data 2022, 6, 77–89. [Google Scholar] [CrossRef]
  33. Guo, H.; Li, W.; Yao, F.; Wu, J.; Zhou, X.; Yue, Y.; Yeh, A.G. Who are more exposed to PM2.5 pollution: A mobile phone data approach. Environ. Int. 2020, 143, 105821. [Google Scholar] [CrossRef] [PubMed]
  34. He, C.; Zhou, L.; Yao, Y.; Ma, W.; Kinney, P. Estimating spatial effects of anthropogenic heat emissions upon the urban thermal environment in an urban agglomeration area in East China. Sustain. Cities Soc. 2020, 57, 102046. [Google Scholar] [CrossRef]
  35. Lu, J.; Bu, P.; Xia, X.; Lu, N.; Yao, L.; Jiang, H. Feasibility of machine learning methods for predicting hospital emergency room visits for respiratory diseases. Environ. Sci. Pollut. Res. 2021, 28, 29701–29709. [Google Scholar] [CrossRef] [PubMed]
  36. Song, Y.; Huang, B.; He, Q.; Chen, B.; Wei, J.; Mahmood, R. Dynamic assessment of PM2.5 exposure and health risk using remote sensing and geo-spatial big data. Environ. Pollut. 2019, 253, 288–296. [Google Scholar] [CrossRef]
  37. Xia, X.; Yao, L.; Lu, J.; Liu, Y.; Jing, W.; Li, Y. Observed causative impact of fine particulate matter on acute upper respiratory disease: A comparative study in two typical cities in China. Environ. Sci. Pollut. Res. 2022, 29, 11185–11195. [Google Scholar] [CrossRef] [PubMed]
  38. Samuelsson, K.; Chen, T.; Antonsen, S.; Brandt, S.; Sabel, C.; Barthel, S. Residential environments across Denmark have become both denser and greener over 20 years. Environ. Res. Lett. 2021, 16, 014022. [Google Scholar] [CrossRef]
  39. Soares, A.; Catita, C.; Silva, C. Exploratory Research of CO2, Noise and Metabolic Energy Expenditure in Lisbon Commuting. Energies 2020, 13, 861. [Google Scholar] [CrossRef] [Green Version]
  40. Kraft, R.; Birk, F.; Reichert, M.; Deshpande, A.; Schlee, W.; Langguth, B.; Baumeister, H.; Probst, T.; Spiliopoulou, M.; Pryss, R. Efficient Processing of Geospatial mHealth Data Using a Scalable Crowdsensing Platform. Sensors 2020, 20, 3456. [Google Scholar] [CrossRef]
  41. Barik, R.; Dubey, H.; Mankodiya, K.; Sasane, S.; Misra, C. GeoFog4Health: A fog-based SDI framework for geospatial health big data analysis. J. Ambient Intell. Humaniz. Comput. 2019, 10, 551–567. [Google Scholar] [CrossRef] [Green Version]
  42. Maddison, R.; Gemming, L.; Monedero, J.; Bolger, L.; Belton, S.; Issartel, J.; Marsh, S.; Direito, A.; Solenhill, M.; Zhao, J.; et al. Quantifying Human Movement Using the Movn Smartphone App: Validation and Field Study. JMIR mHealth uHealth 2017, 5, e122. [Google Scholar] [CrossRef] [PubMed]
  43. Robbins, R.; Affouf, M.; Seixas, A.; Beaugris, L.; Avirappattu, G.; Jean-Louis, G.; Bin, Y.S.; Nakao, M.; Carvalho, D. Four-Year Trends in Sleep Duration and Quality: A Longitudinal Study Using Data from a Commercially Available Sleep Tracker. J. Med. Internet Res. 2020, 22, e14735. [Google Scholar] [CrossRef] [PubMed]
  44. Stevens, F.R.; Gaughan, A.E.; Linard, C.; Tatem, A.J. Disaggregating Census Data for Population Mapping Using Random Forests with Remotely-Sensed and Ancillary Data. PLoS ONE 2015, 10, e0107042. [Google Scholar] [CrossRef] [PubMed] [Green Version]
  45. Lee, J.G.; Kang, M. Geospatial Big Data: Challenges and Opportunities. Big Data Res. 2015, 2, 74–81. [Google Scholar] [CrossRef]
  46. Ma, Y.; Wu, H.; Wang, L.; Huang, B.; Ranjan, R.; Zomaya, A.; Jie, W. Remote sensing big data computing: Challenges and opportunities. Futur. Gener. Comput. Syst. 2015, 51, 47–60. [Google Scholar] [CrossRef] [Green Version]
  47. Li, S.; Dragicevic, S.; Castro, F.A.; Sester, M.; Winter, S.; Çöltekin, A.; Pettit, C.; Jiang, B.; Haworth, J.; Stein, A.; et al. Geospatial big data handling theory and methods: A review and research challenges. ISPRS J. Photogramm. Remote Sens. 2016, 115, 119–133. [Google Scholar] [CrossRef] [Green Version]
  48. Kamel Boulos, M.N.; Koh, K. Smart city lifestyle sensing, big data, geo-analytics and intelligence for smarter public health decision-making in overweight, obesity and type 2 diabetes prevention: The research we should be doing. Int. J. Health Geogr. 2021, 20, 12. [Google Scholar] [CrossRef]
  49. Pearce, N. The ecological fallacy strikes back. J. Epidemiol. Community Health 2000, 54, 326–327. [Google Scholar] [CrossRef] [Green Version]
  50. Koh, K.; Grady, S.C.; Darden, J.T.; Vojnovic, I. Adult obesity prevalence at the county level in the United States, 2000–2010: Downscaling public health survey data using a spatial microsimulation approach. Spat. Spatio-Temporal Epidemiol. 2018, 26, 153–164. [Google Scholar] [CrossRef]
  51. Ng, K.Y.; Ho, C.L.; Koh, K. Spatial-Temporal Accessibility and Inequality of Veterinary Service in Hong Kong: A Geographic Information System-Based Study. Front. Vet. Sci. 2022, 9, 857914. [Google Scholar] [CrossRef]
  52. Vrijheid, M. The exposome: A new paradigm to study the impact of environment on health. Thorax 2014, 69, 876–878. [Google Scholar] [CrossRef] [PubMed] [Green Version]
  53. The Spatial Decision Support Consortium. Spatial Decision Support Knowledge Portal. Available online: http://sdsportal.sdsconsortium.org/about/ (accessed on 13 May 2022).
  54. China Meteorological Data Sharing Service Centre. Available online: https://data.cma.cn/en (accessed on 13 May 2022).
  55. Ministry of Ecology and Environment of the People’s Republic of China. Available online: https://english.mee.gov.cn/ (accessed on 13 May 2022).
  56. China National Environmental Monitoring Center. Available online: http://www.cnemc.cn/en/ (accessed on 13 May 2022).
  57. Organisation for Economic Co-operation and Development. OECD Open, Useful and Re-usable data (OURdata) Index: 2019. Available online: https://www.oecd.org/governance/digital-government/ourdata-index-policy-paper-2020.pdf (accessed on 13 May 2022).
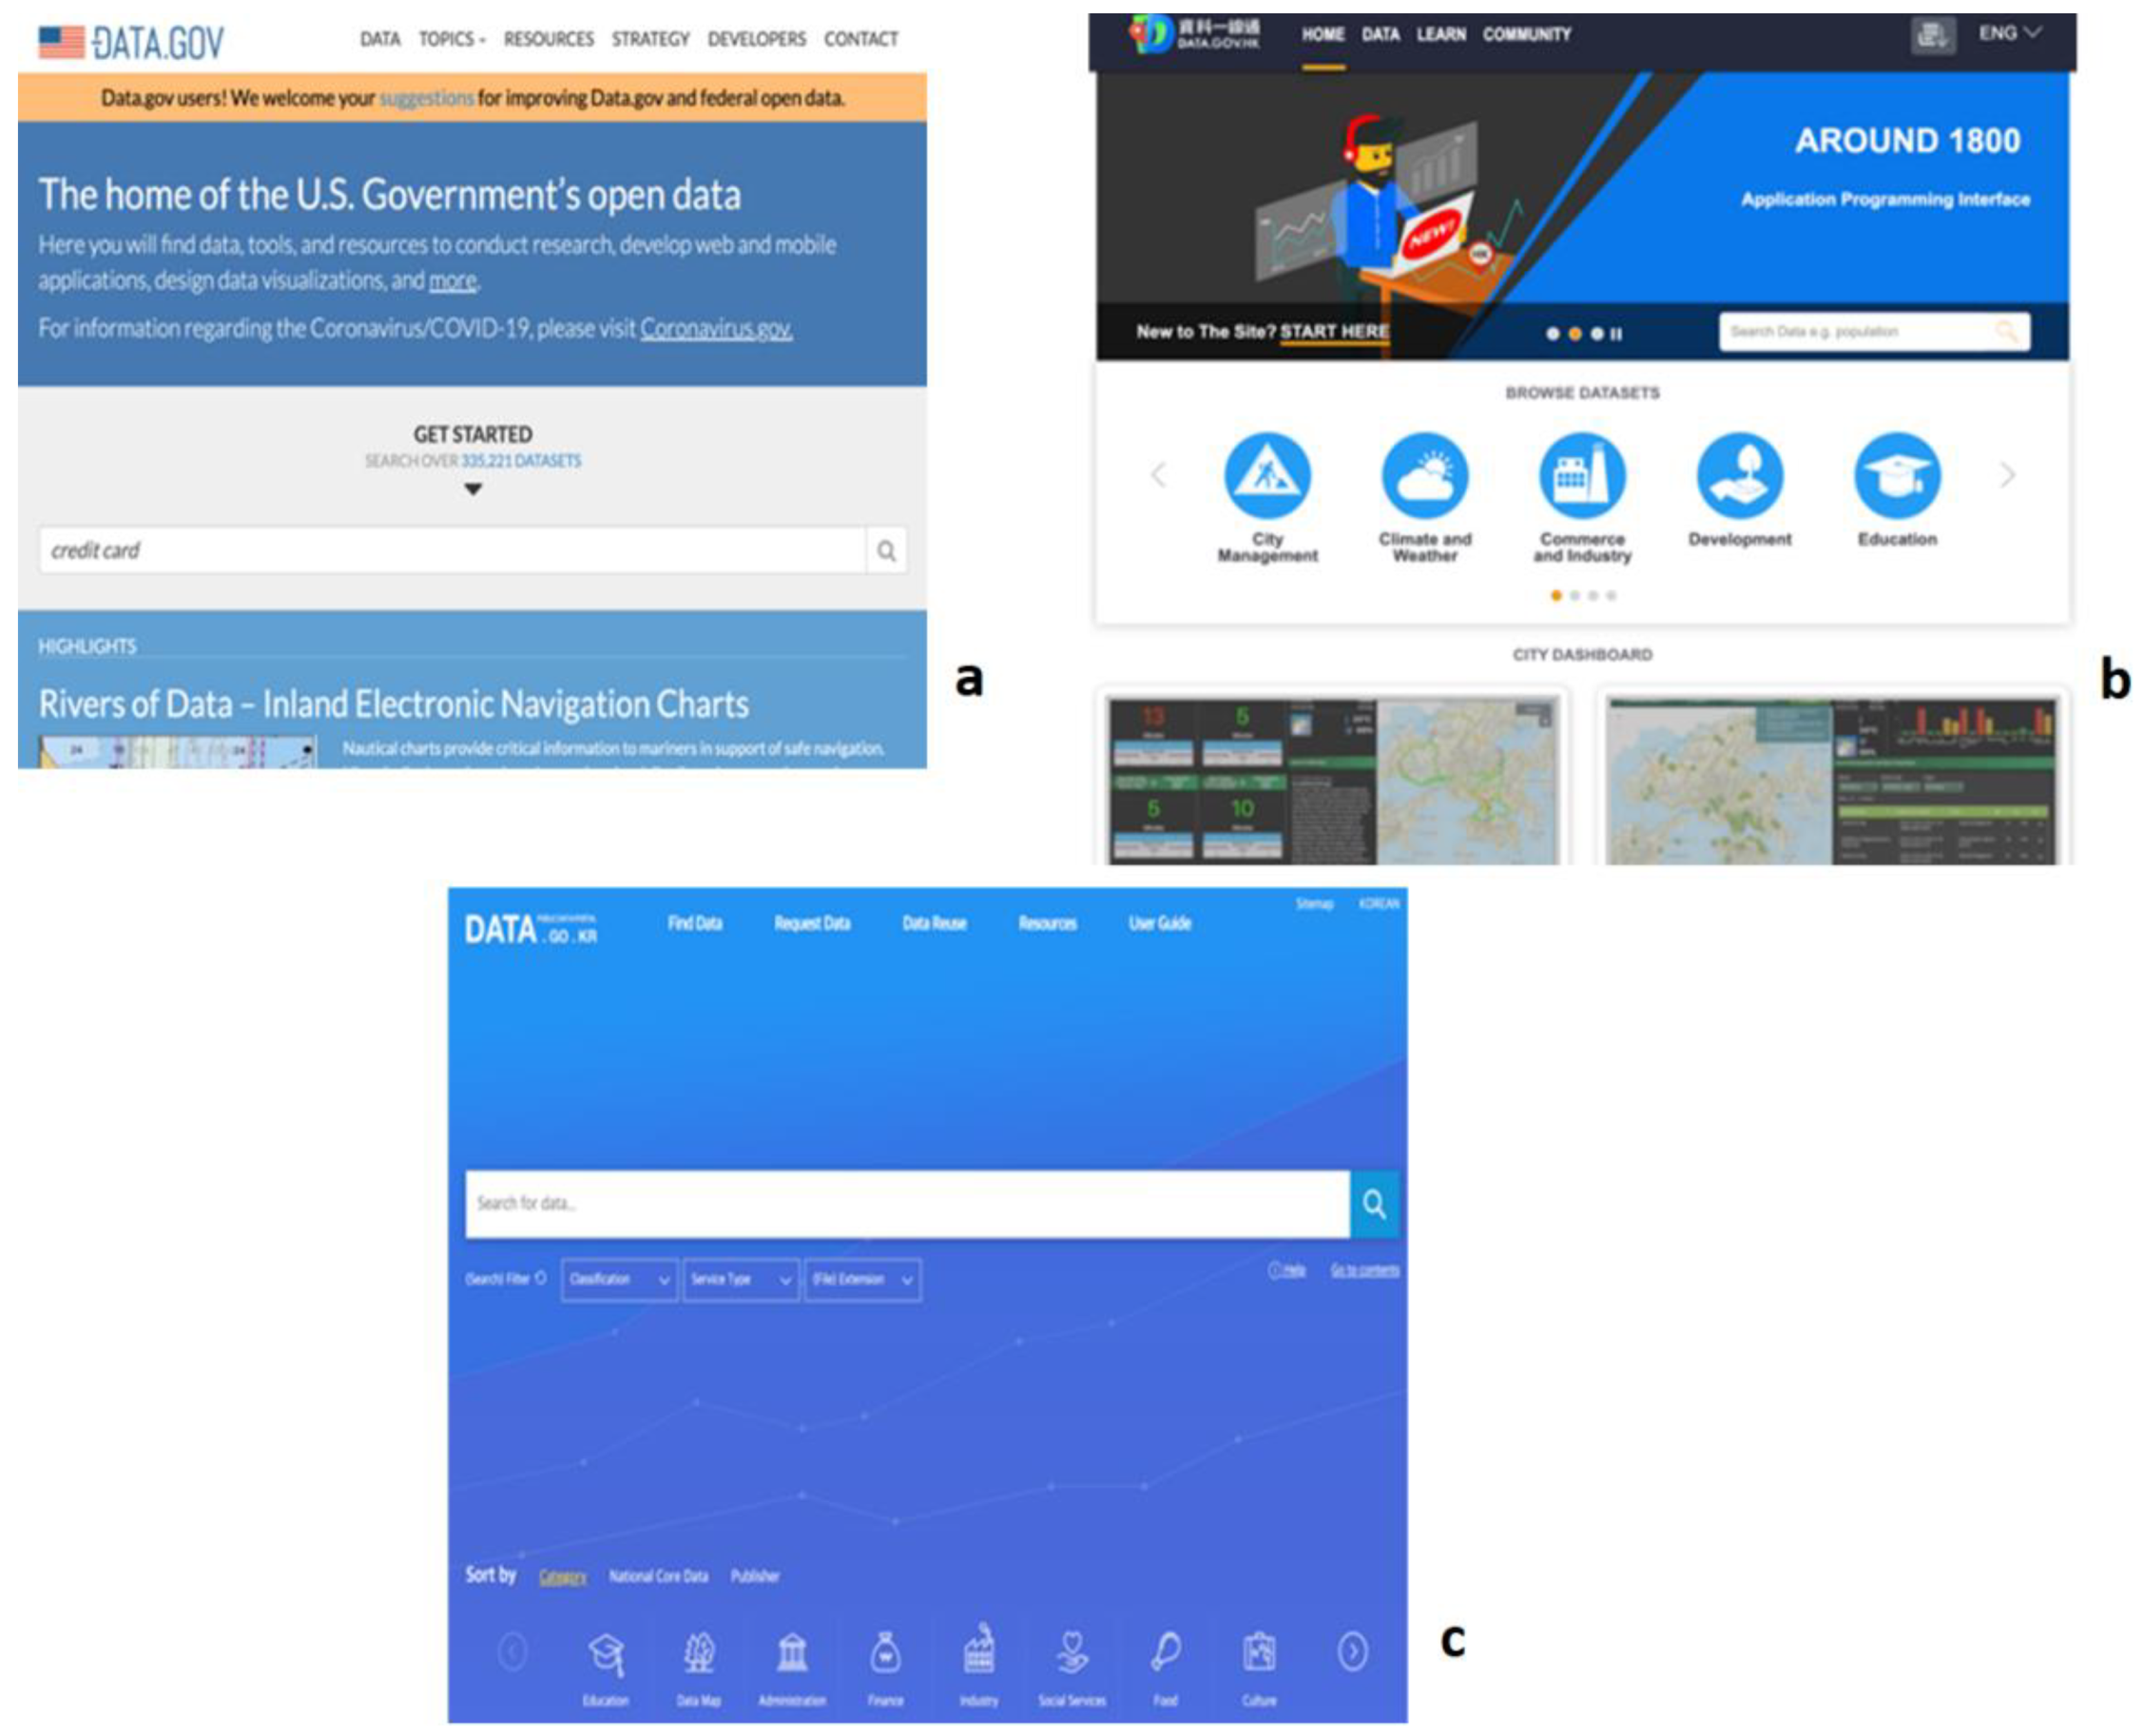
  58. Data.gov. Available online: https://data.gov (accessed on 13 May 2022).
  59. Data.gov.hk. Available online: https://data.gov.hk/en/ (accessed on 13 May 2022).
  60. Data.go.kr. Available online: https://www.data.go.kr/en/index.do (accessed on 13 May 2022).
  61. Open Geospatial Consortium. Health SDI. Available online: https://www.ogc.org/projects/initiatives/healthsdi (accessed on 13 May 2022).
  62. U.S. Centers for Disease Control and Prevention. GIS and Public Health at CDC. Available online: https://www.cdc.gov/gis/index.htm (accessed on 13 May 2022).
  63. Public Health England. Public Health Dashboard. Available online: https://fingertips.phe.org.uk/topic/public-health-dashboard/map-with-data (accessed on 13 May 2022).
  64. Korea National Health Insurance Service. KNHIS-ATLAS. Available online: http://nhiss.nhis.or.kr:8087/intro/index.do (accessed on 13 May 2022).
  65. The University of Washington Institute for Health Metrics and Evaluation. Global Health Data Exchange. Available online: https://ghdx.healthdata.org/ (accessed on 13 May 2022).
  66. Bromme, R.; Jucks, R. Discourse and expertise: The challenge of mutual understanding between experts and laypeople. In The Routledge Handbook of Discourse Processes; Schober, M.F., Rapp, D.N., Britt, M.A., Eds.; Routledge: Abingdon-on-Thames, UK; Taylor & Francis Group: Abingdon-on-Thames, UK, 2018; pp. 222–246. [Google Scholar]
  67. Bethlehem, R.; Seidlitz, J. Time to recognize authorship of open data. Nature 2022, 604, 8. [Google Scholar]
  68. Cousijn, H.; Kenall, A.; Ganley, E.; Harrison, M.; Kernohan, D.; Lemberger, T.; Murphy, F.; Polischuk, P.; Taylor, S.; Martone, M.; et al. A data citation roadmap for scientific publishers. Sci. Data 2018, 5, 180259. [Google Scholar] [CrossRef] [PubMed] [Green Version]
  69. Fenner, M.; Crosas, M.; Grethe, J.S.; Kennedy, D.; Hermjakob, H.; Rocca-Serra, P.; Durand, G.; Berjon, R.; Karcher, S.; Martone, M.; et al. A data citation roadmap for scholarly data repositories. Sci. Data 2019, 6, 28. [Google Scholar] [CrossRef] [Green Version]
  70. Waller, L.A. Building the analytic toolbox: From spatial analytics to spatial statistical inference with geospatial data. In Geospatial Technology for Human Well-Being and Health; Faruque, F.S., Ed.; Springer: Cham, Switzerland, 2022; pp. 29–35. [Google Scholar] [CrossRef]
Figure 1. Flow chart on study selection process.
Remotesensing 14 02996 g001
Figure 2. Examples of government open-data portals: (a) the U.S. government data portal; (b) Hong Kong’s Public Sector Information portal; (c) South Korea’s public data portal [58,59,60].
Remotesensing 14 02996 g002
Figure 3. Examples of health SDIs: (a) the Geography and geospatial science working group (GeoSWG) at the U.S. Centers for Disease Control and Prevention; (b) Public Health England’s Public Health Dashboard; (c) Korea National Health Insurance Service-ATLAS; (d) the University of Washington’s Institute for Health Metrics and Evaluation [62,63,64,65]. Another noteworthy example not shown in this figure is the ‘World Health Organization (WHO) GIS Centre for Health’ portal, which is publicly accessible online.
Remotesensing 14 02996 g003
Table 1. Journal categories *.
Journal CategoriesNumber of Works
Geography (general, remote sensing, geoscience) [12,13,14,15,16,17,18,19,20,21]10
Public health [22,23,24,25,26,27,28,29,30,31]10
Environment (physical, built environment) [32,33,34,35,36,37,38,39]8
Science (computer, engineering, multidisciplinary) [40,41,42,43]4
Total32
* The authors’ own categorization by referring to the classification in the aforementioned three bibliographic databases.
Table 2. Study areas by global regions.
RegionsCountriesNumber of Works
AfricaEthiopia [22]1
Malawi [12]1
AsiaChina [13,14,15,23,24,25,26,27,28,29,30,33,34,35,36,37]16
India [41]1
Indonesia [31]1
EuropeDenmark [38]1
Germany [40]1
Portugal [39]1
North AmericaUSA [16,18,19,42,43]5
Canada [20]1
GlobalMultiple countries [17,21,32]3
Total32
Table 3. Study topics.
TopicsSub-TopicsNumber of Works
EnvironmentsLivability [15], green space [13,14], night lights [19], noise exposure [39,40], land use [16], park visits [14], water points [12], indoor/outdoor air pollutants [17,20,23,24,29,33,36,39], energy expenditure [39], NDVI [38], mountain green cover [32], low-elevation coastal zones [28], anthropogenic heat emissions [34], socioeconomic factors [29]23
Vector-borne
diseases
Malaria [21,31,41], hemorrhagic fever with renal syndrome [25,26,27], soil-transmitted helminth [22], human rabies [30]8
Non-vector-borne
diseases
COVID-19 [18], Acute respiratory infection [23,24] chronic obstructive pulmonary disease [24], hospital emergency room visits for respiratory diseases [35], upper respiratory tract infection [37], physical activity [42], sleep duration and quality [43], life expectancy [17]9
Total40 *
* Several studies examined multiple topics.
Table 4. Data types.
Data Type 1Data Type 2Number of Works
Remote sensing+ Other remote sensing data [13,16,20,28,32,34,38]7
+ Socioeconomic data [19,29,33]3
+ Clinical records (individual-level) [21,22,23,24,25,26,27,29,30,31,35,36,37,41]13
+ Health statistics (aggregated at a local area) [17]1
+ Points of interest (POIs) [15]1
+ Social media [14,18,19,33,36]5
+ Mobile phone (sensor, location) [39,40]2
+ VGI/PGIS [21]1
+ UAV [12]1
Mobile phone app-based sensing+ GPS data [42]1
Wearable devices+ Mobile phone (sensor, location) [43]1
Total36 *
* Several studies used multiple types of data.
Table 5. Data sources *.
CategoryTypesSource ExamplesPublic Accessibility
GeospatialFully open data
[13,15,16,17,20,21,22,28,32]
NASA, OpenStreetMap, Earth Engine, VGI/PGISYes
Public data
[33,34]
National and/or municipal governmentsSpecial permission may be required.
Data collected by ‘tech’ companies or from the Internet
[14,15,18,19]
Geotagged social media data, POIsAdditional data processing using API or special permission may be required.
Data collected from personal devices
[12,21]
Personal location data, UAV imagesNo
Health/
health-related
Fully open data
[17]
Area-level vital statisticsYes
Public data
[21,22,23,24,25,26,27,29,30,31,35,36,37,41]
Clinical dataSpecial permission may be required.
Data collected from personal devices
[39,40,42,43]
Health-related behaviors (e.g., sleep quality, physical activity)No
Population or socioeconomicFully open data
[19,29,33]
Census data, public survey, WorldPopYes
* Several studies used multiple types of data.
Publisher’s Note: MDPI stays neutral with regard to jurisdictional claims in published maps and institutional affiliations.

