
Quantifying Water Consumption through the Satellite Estimation of Land Use/Land Cover and Groundwater Storage Changes in a Hyper-Arid Region of Egypt


Abstract
:
1. Introduction
2. Materials and Methods
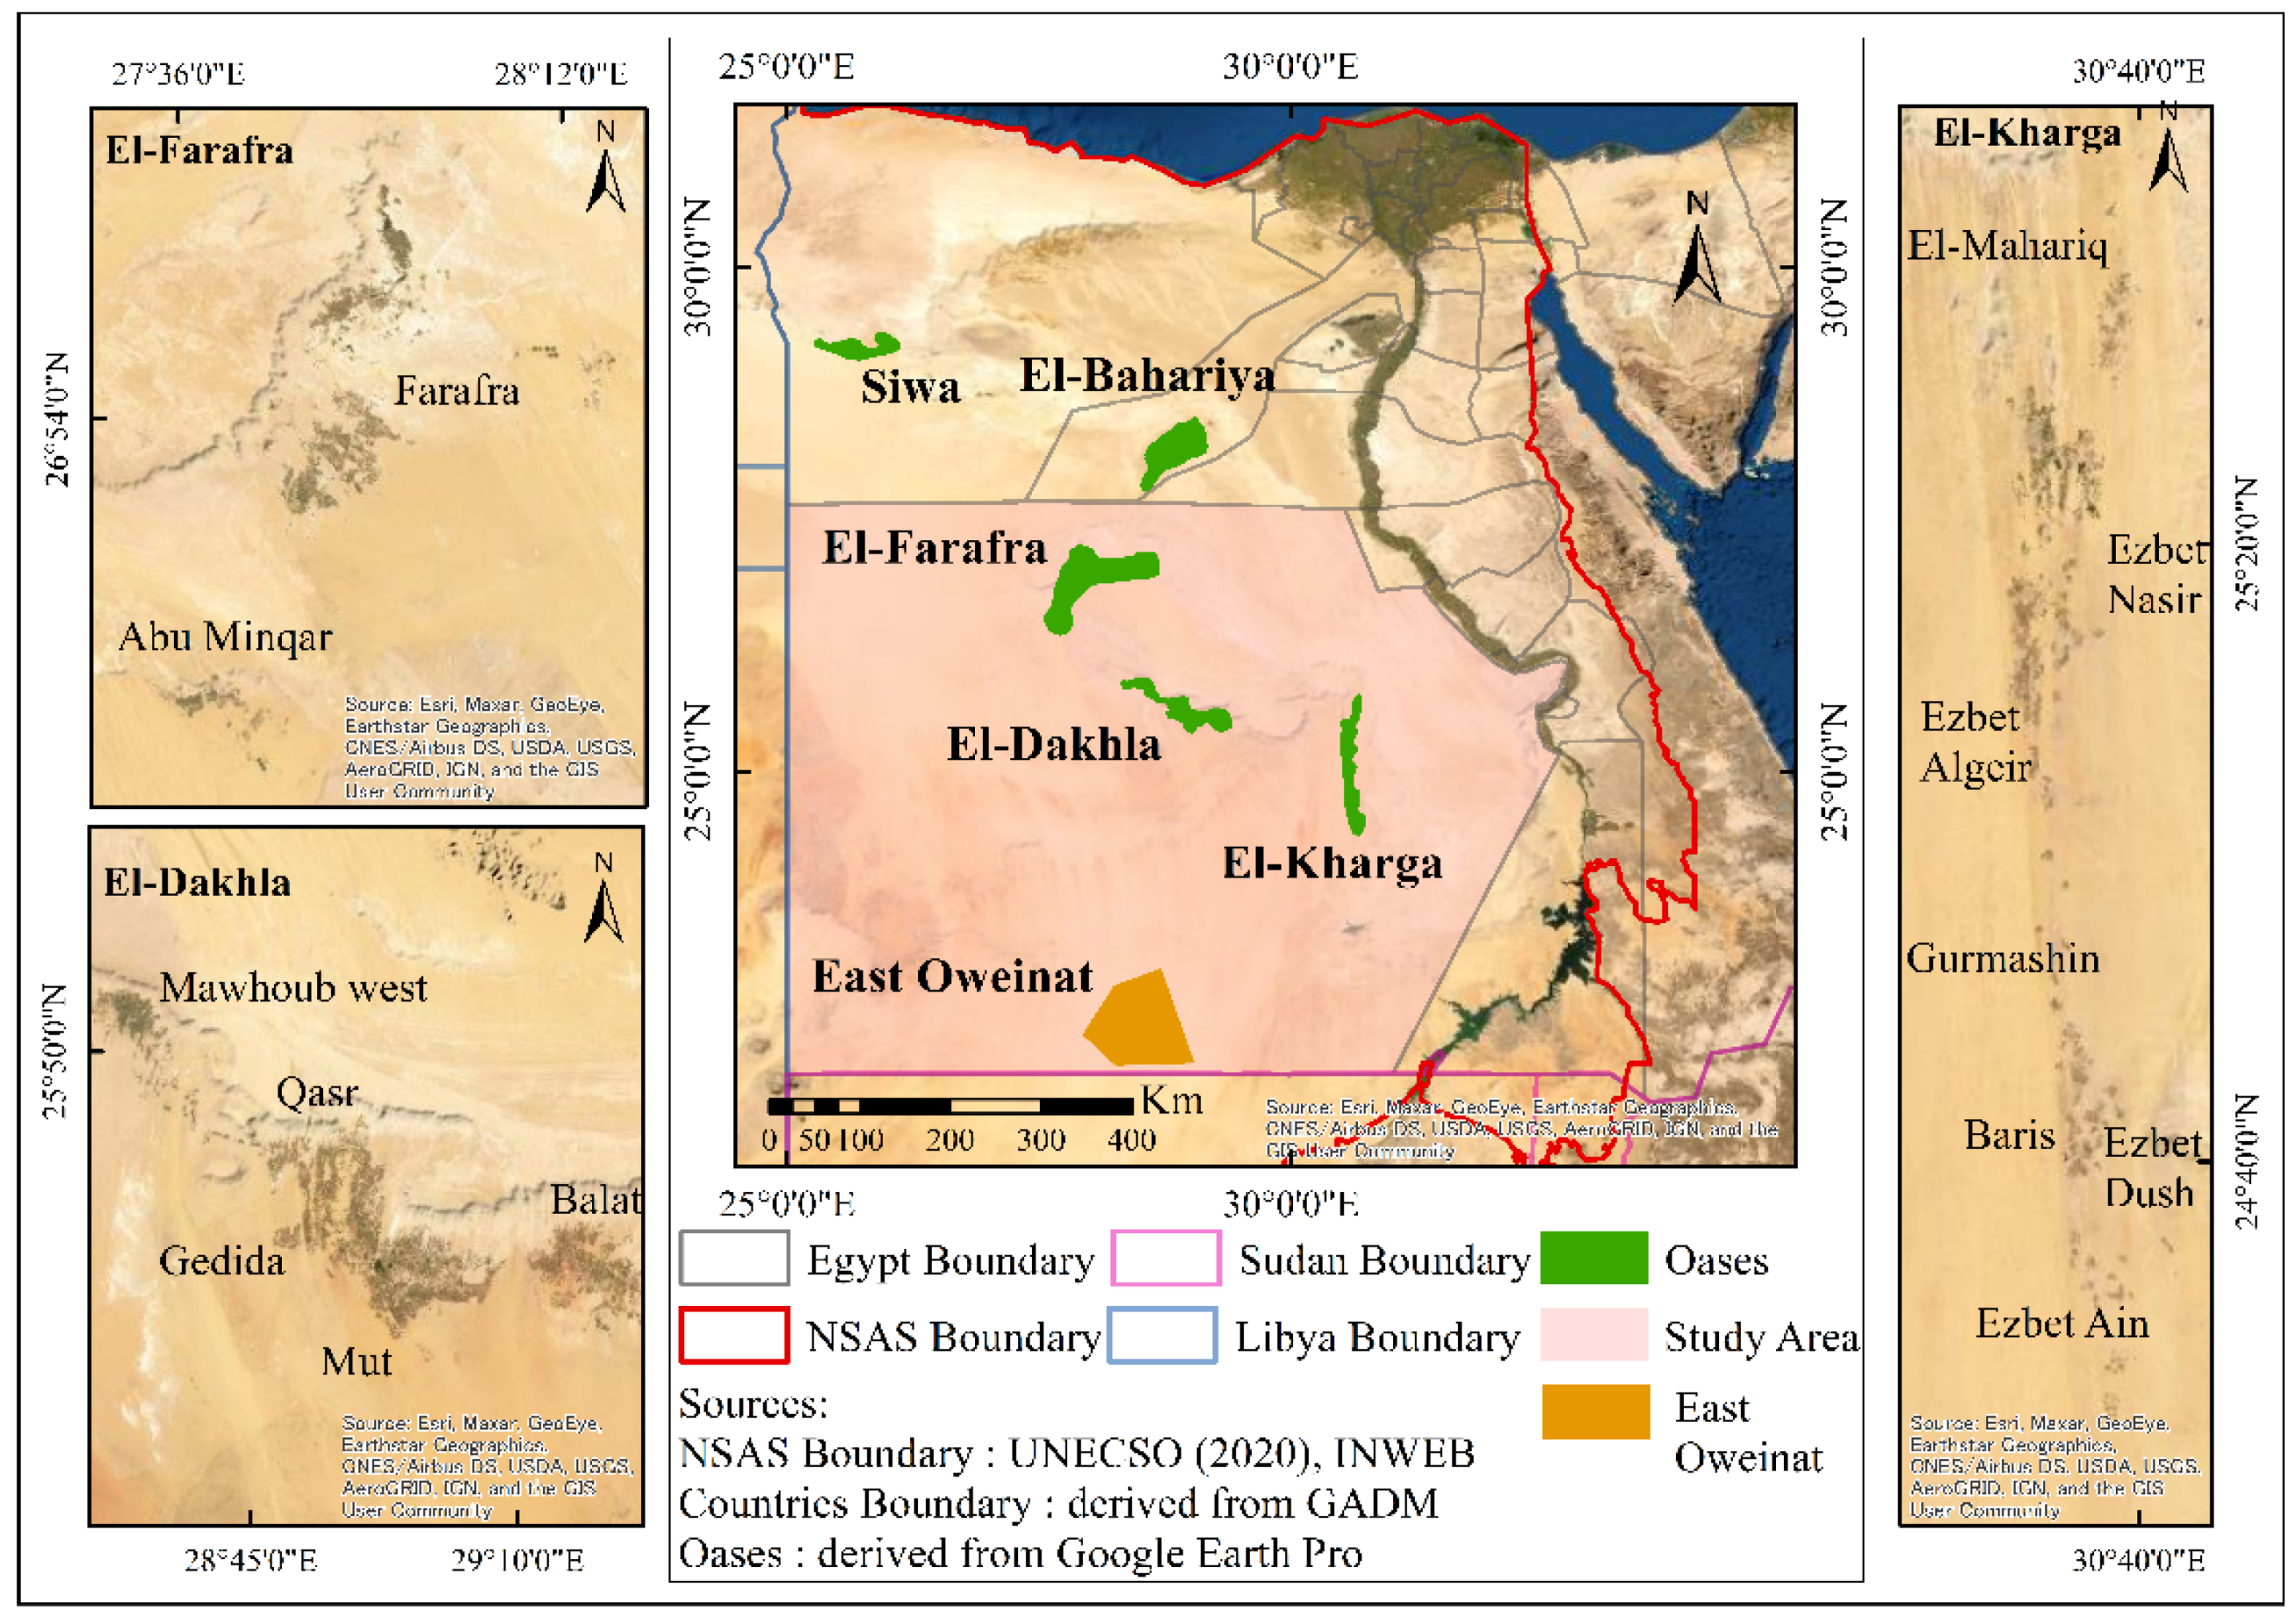
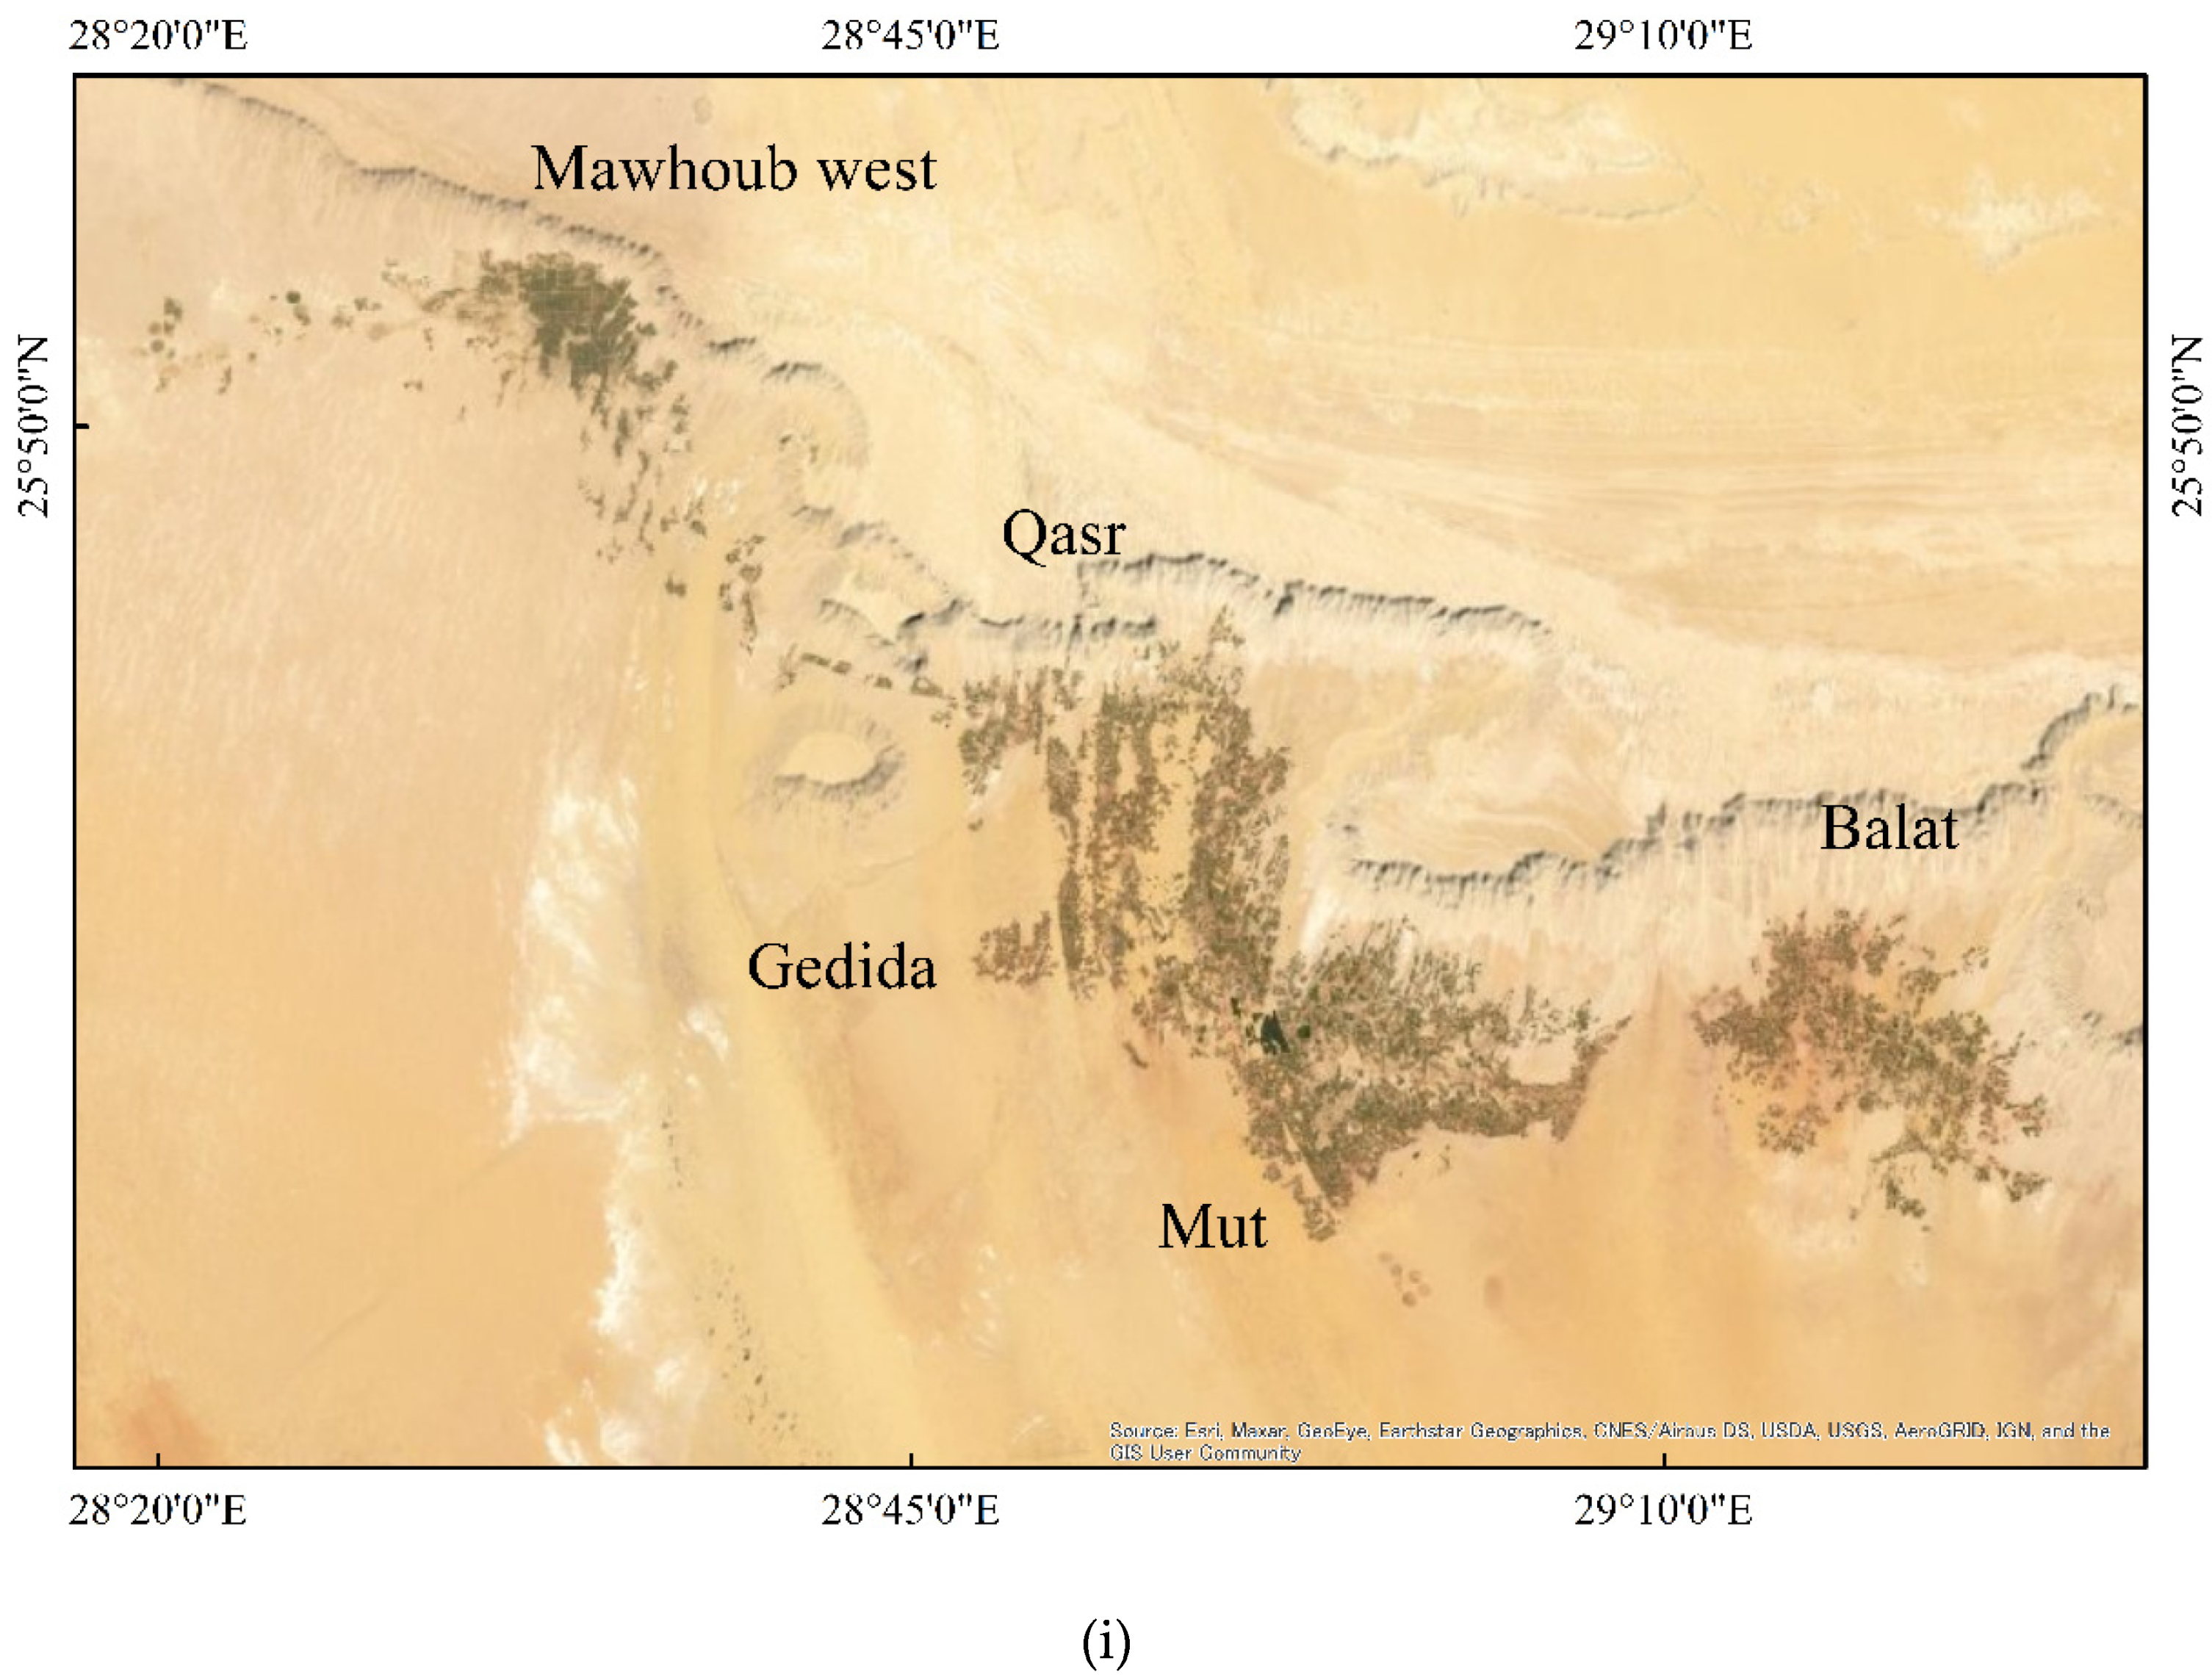
2.1. Study Area
2.2. Dataset
2.2.1. Optical Remote Sensing Data
2.2.2. Landsat 7 Collection 1 Tier 1 8-Day NDVI Composite
2.2.3. GRACE and GRACE-FO Mascon Data
2.2.4. Other
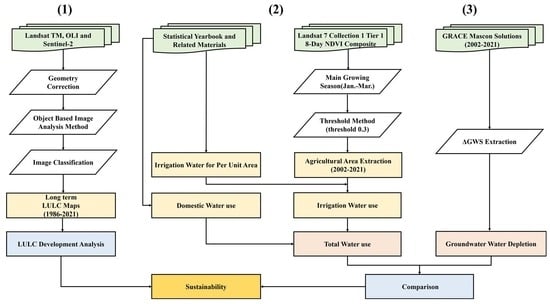
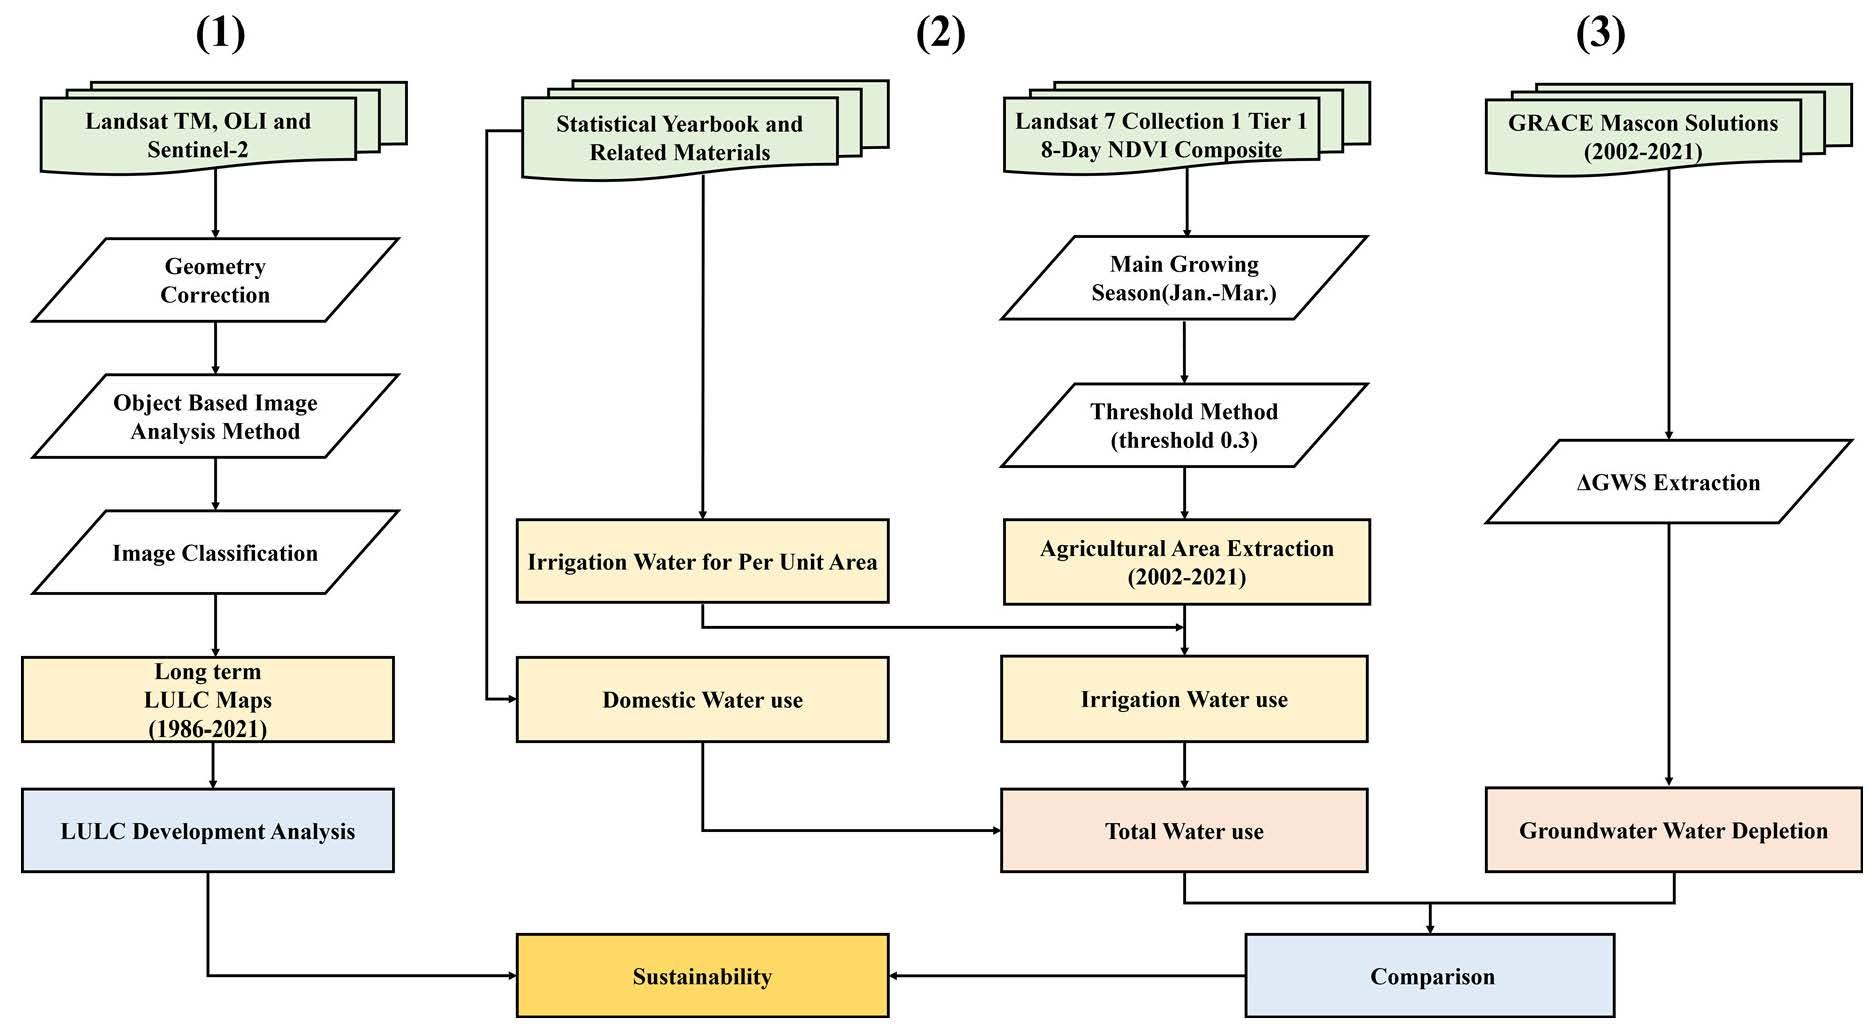
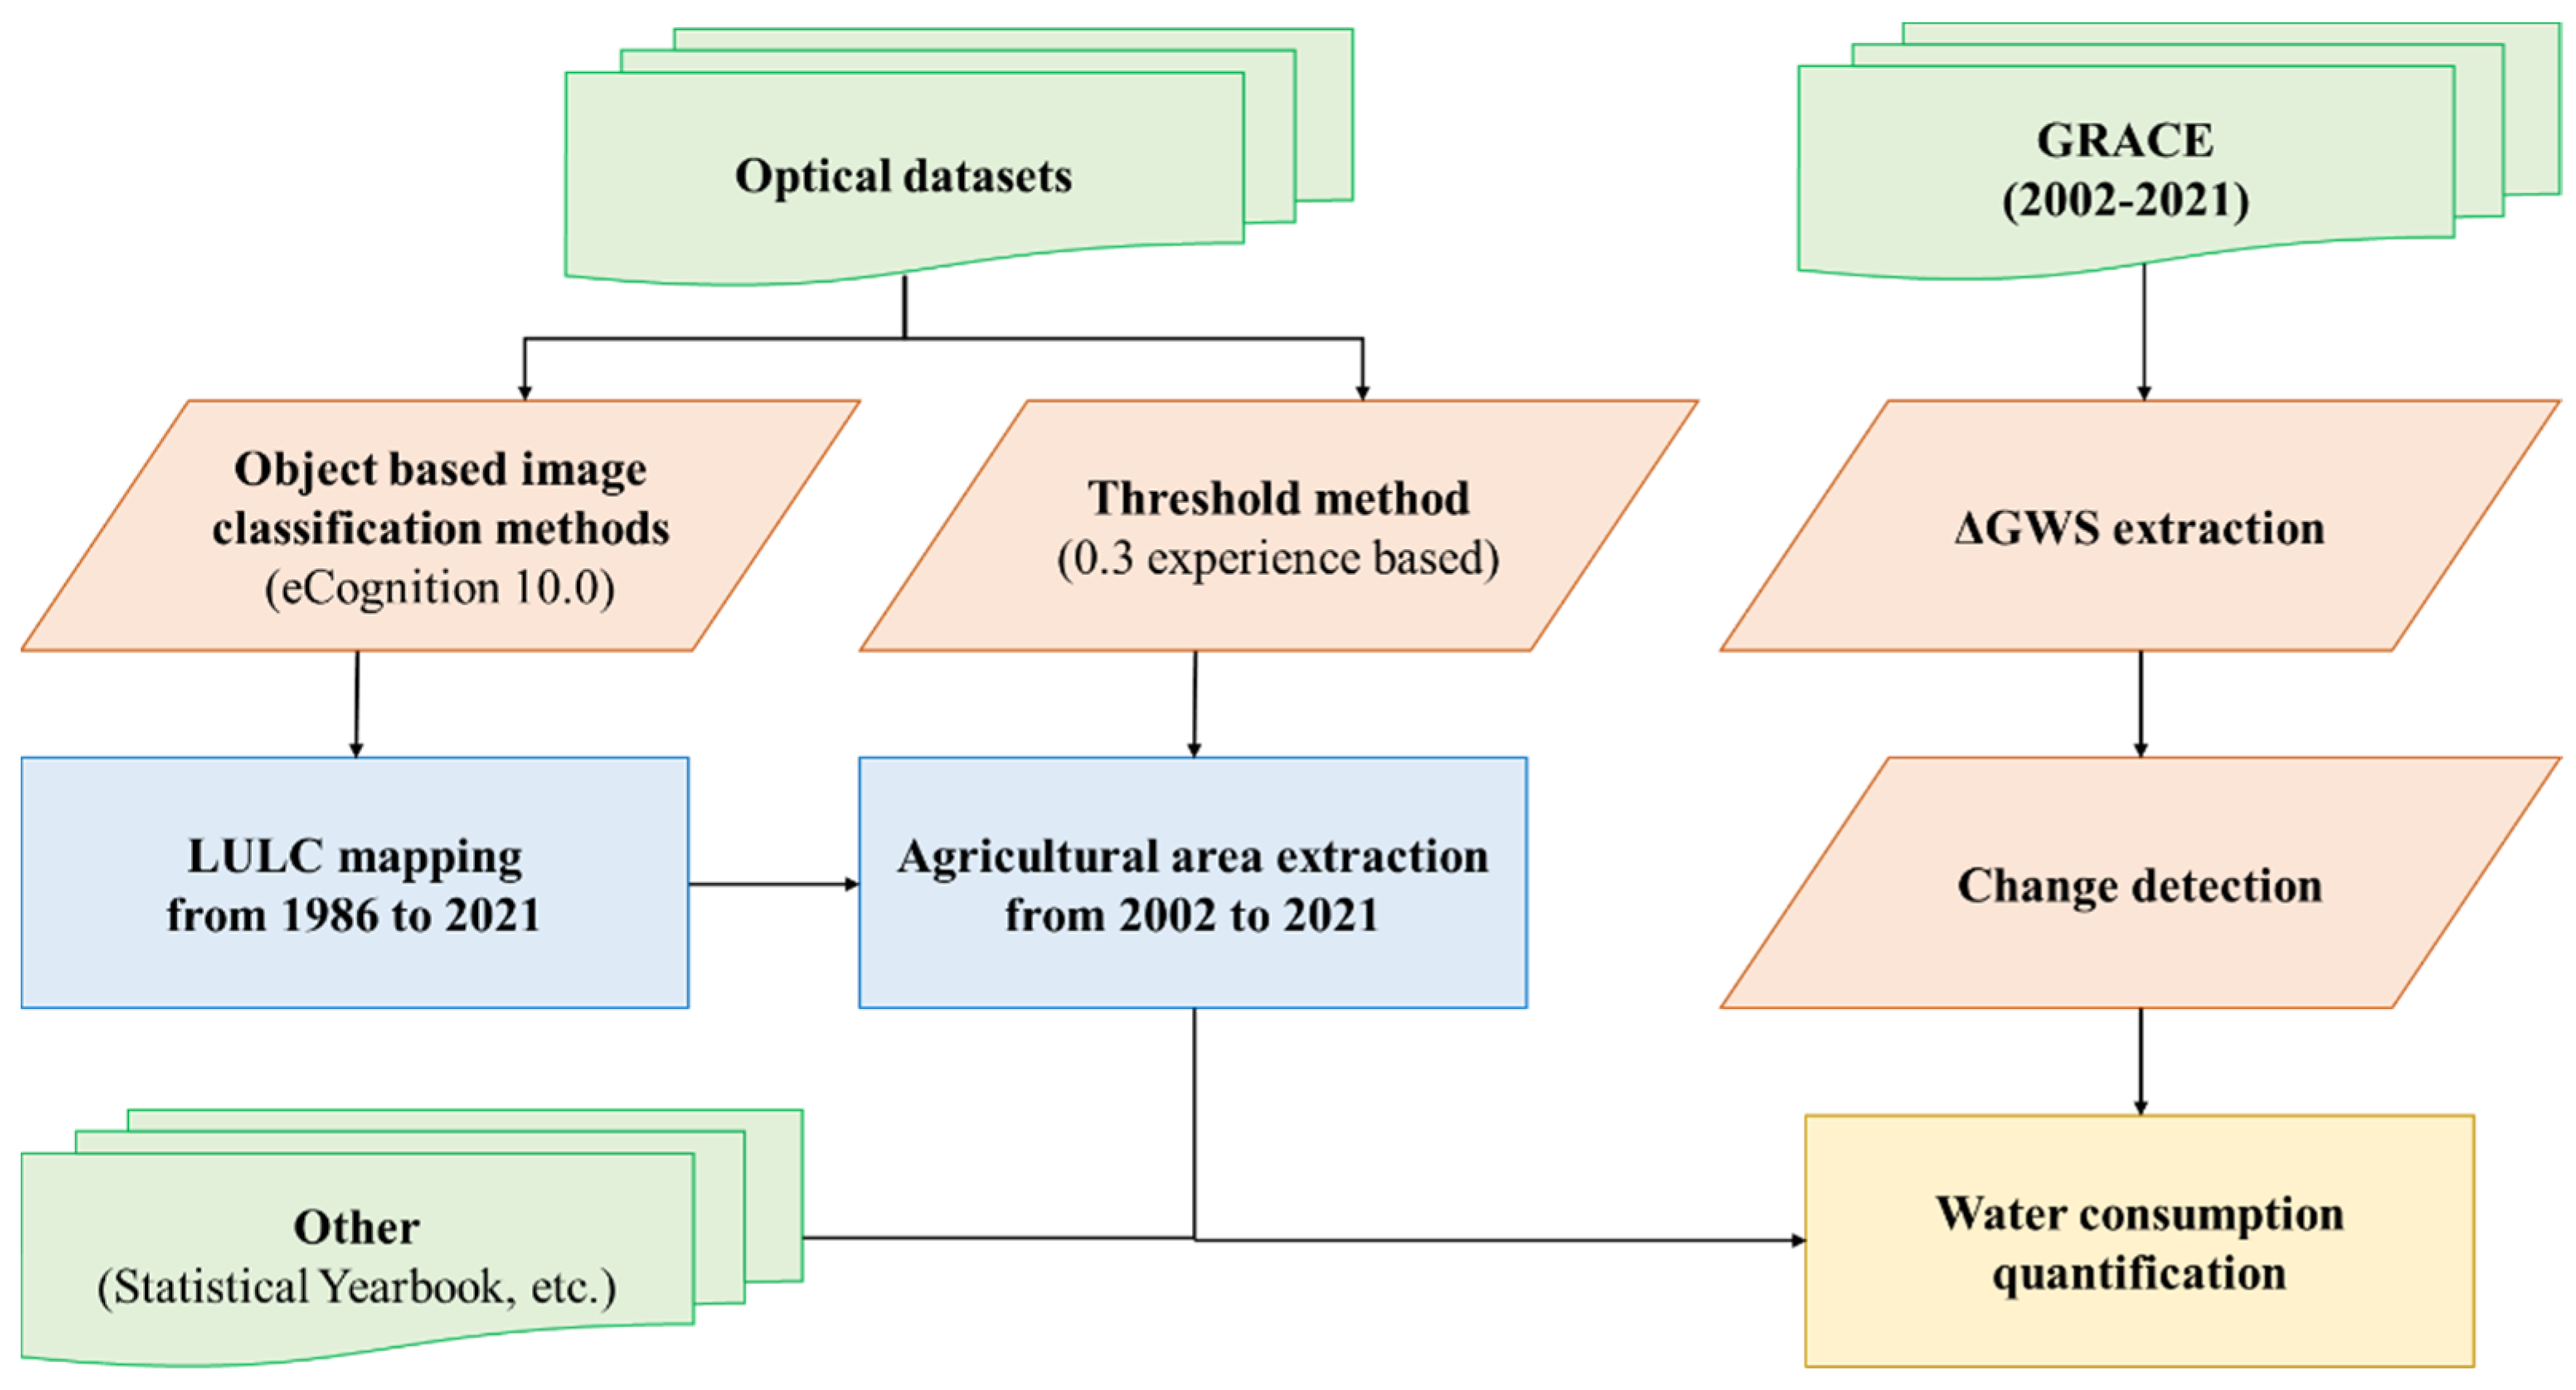
2.3. Methodology
2.3.1. Land Cover Mapping
Pre-Processing
LUCC Classification Method
2.3.2. Water Usage Quantification
2.3.3. Extraction of Groundwater Storage Changes
3. Results
3.1. LULC Classification Accuracy Assessment
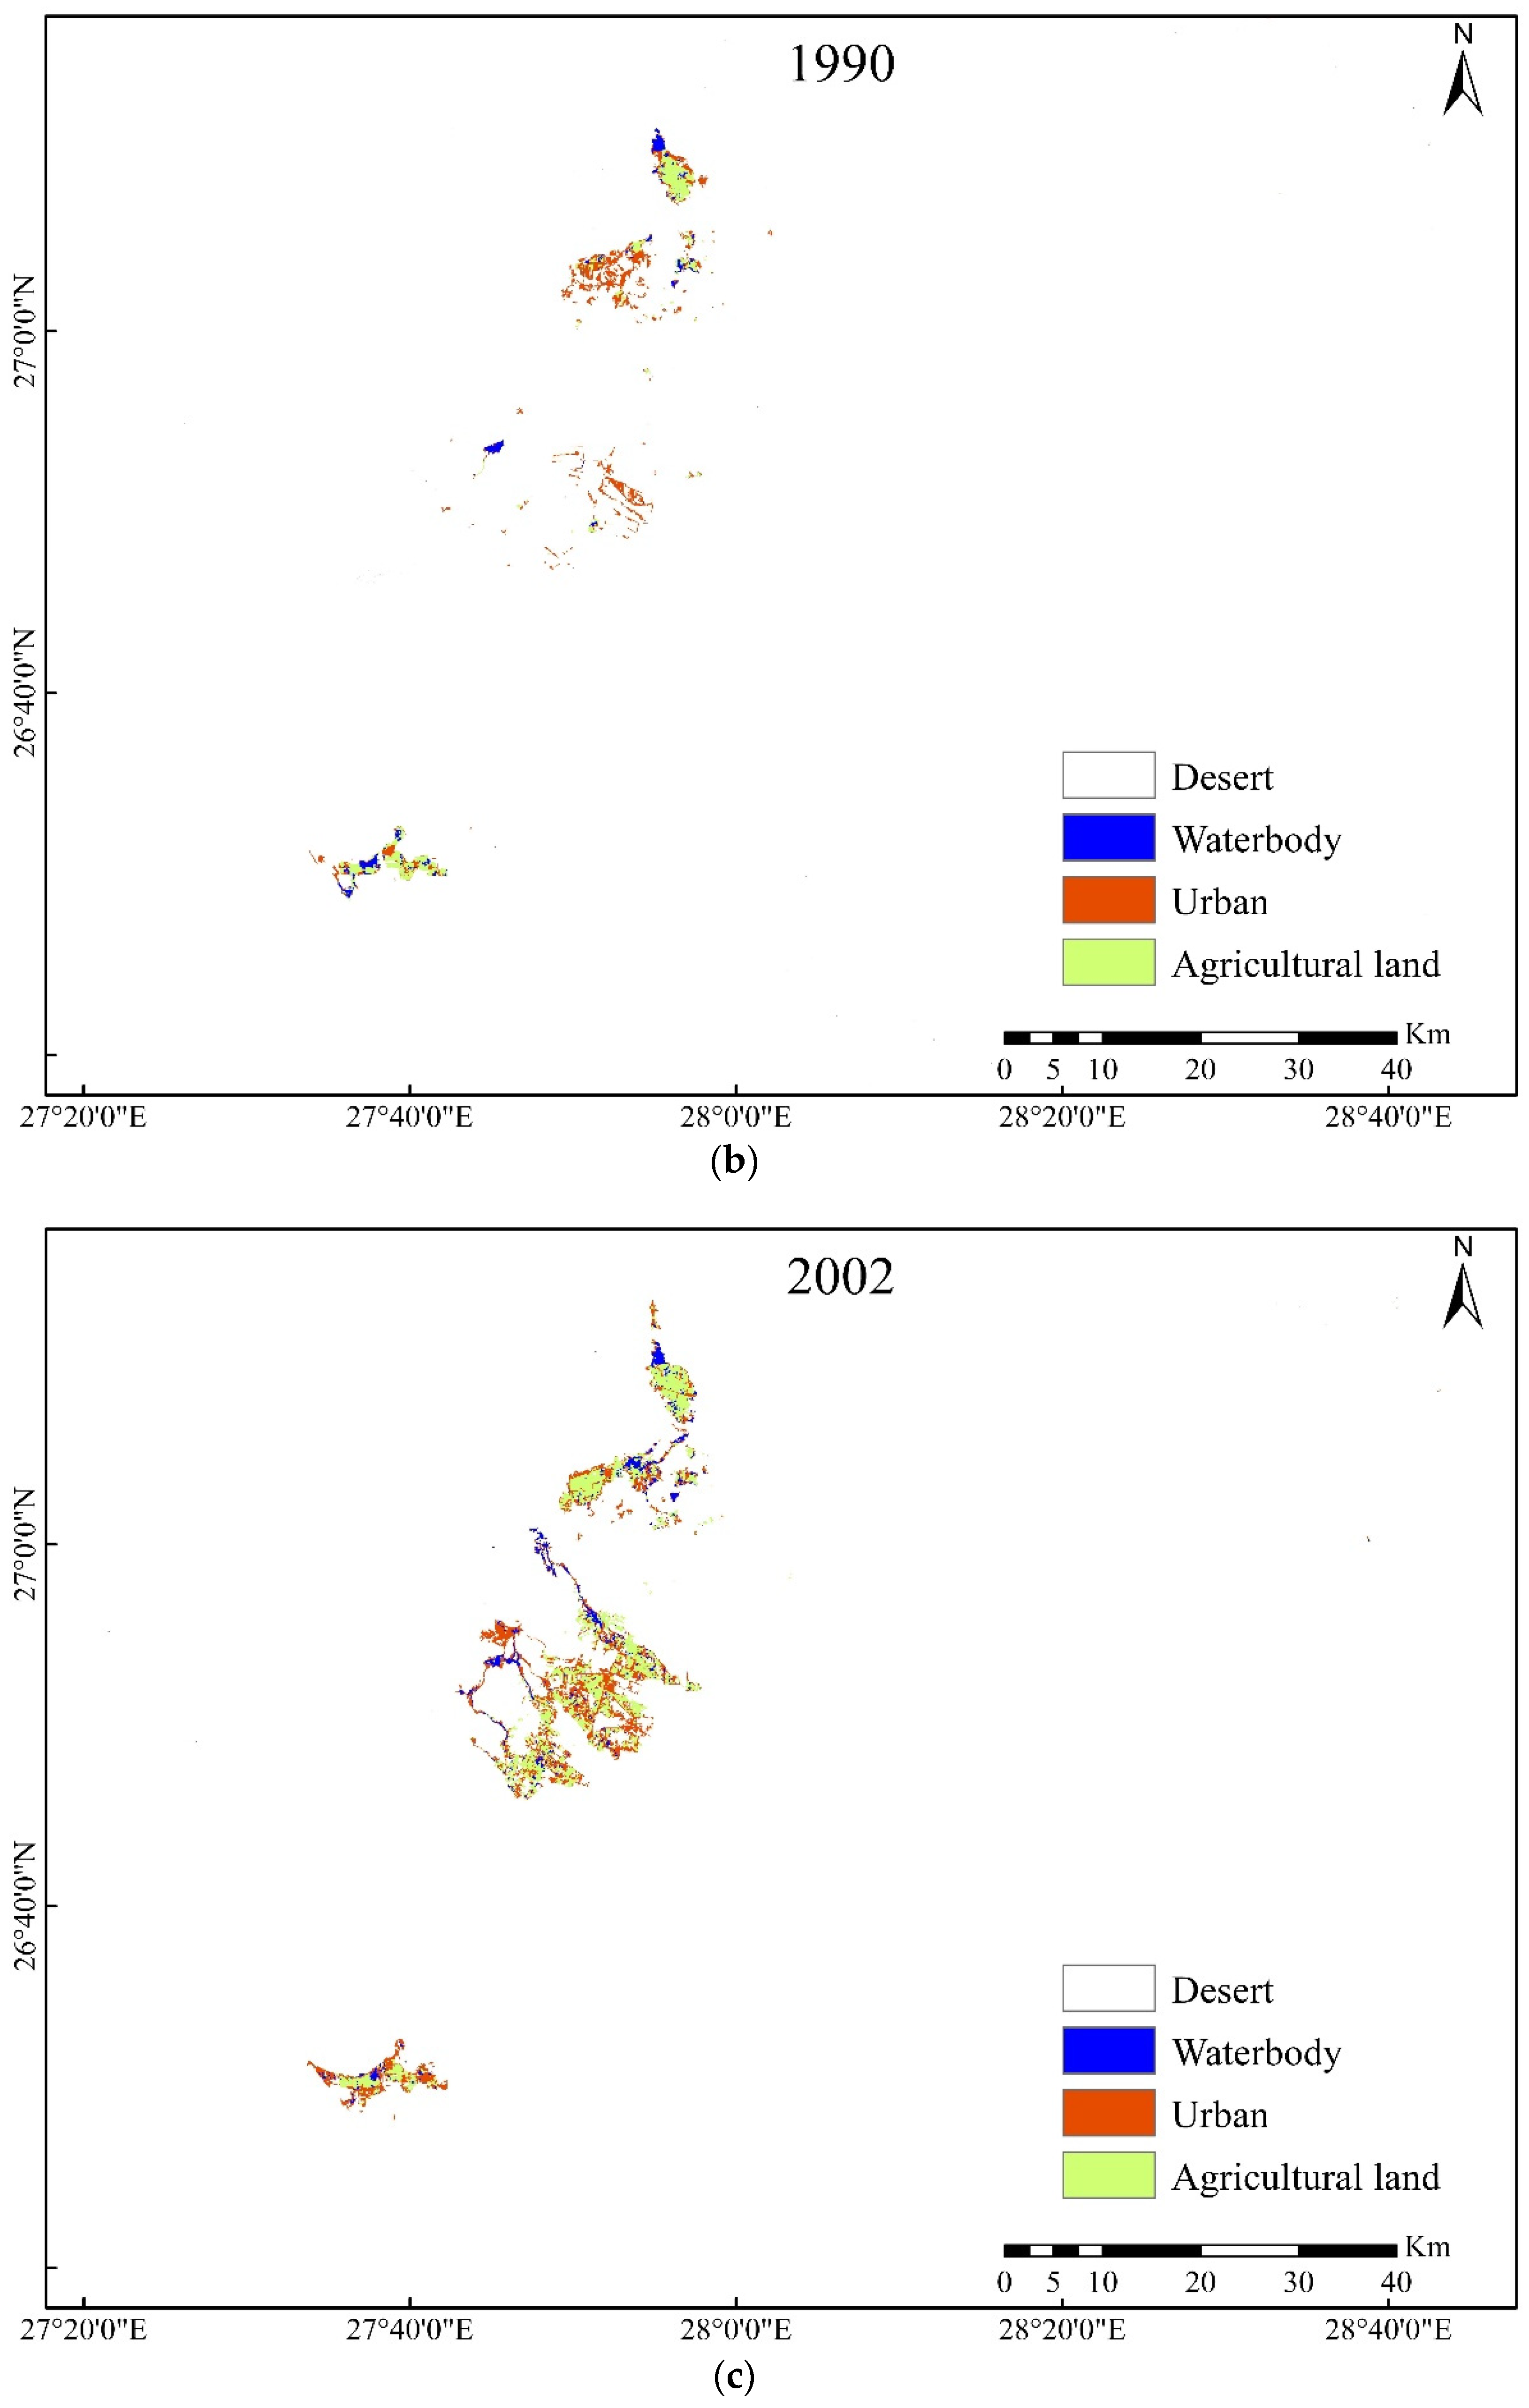
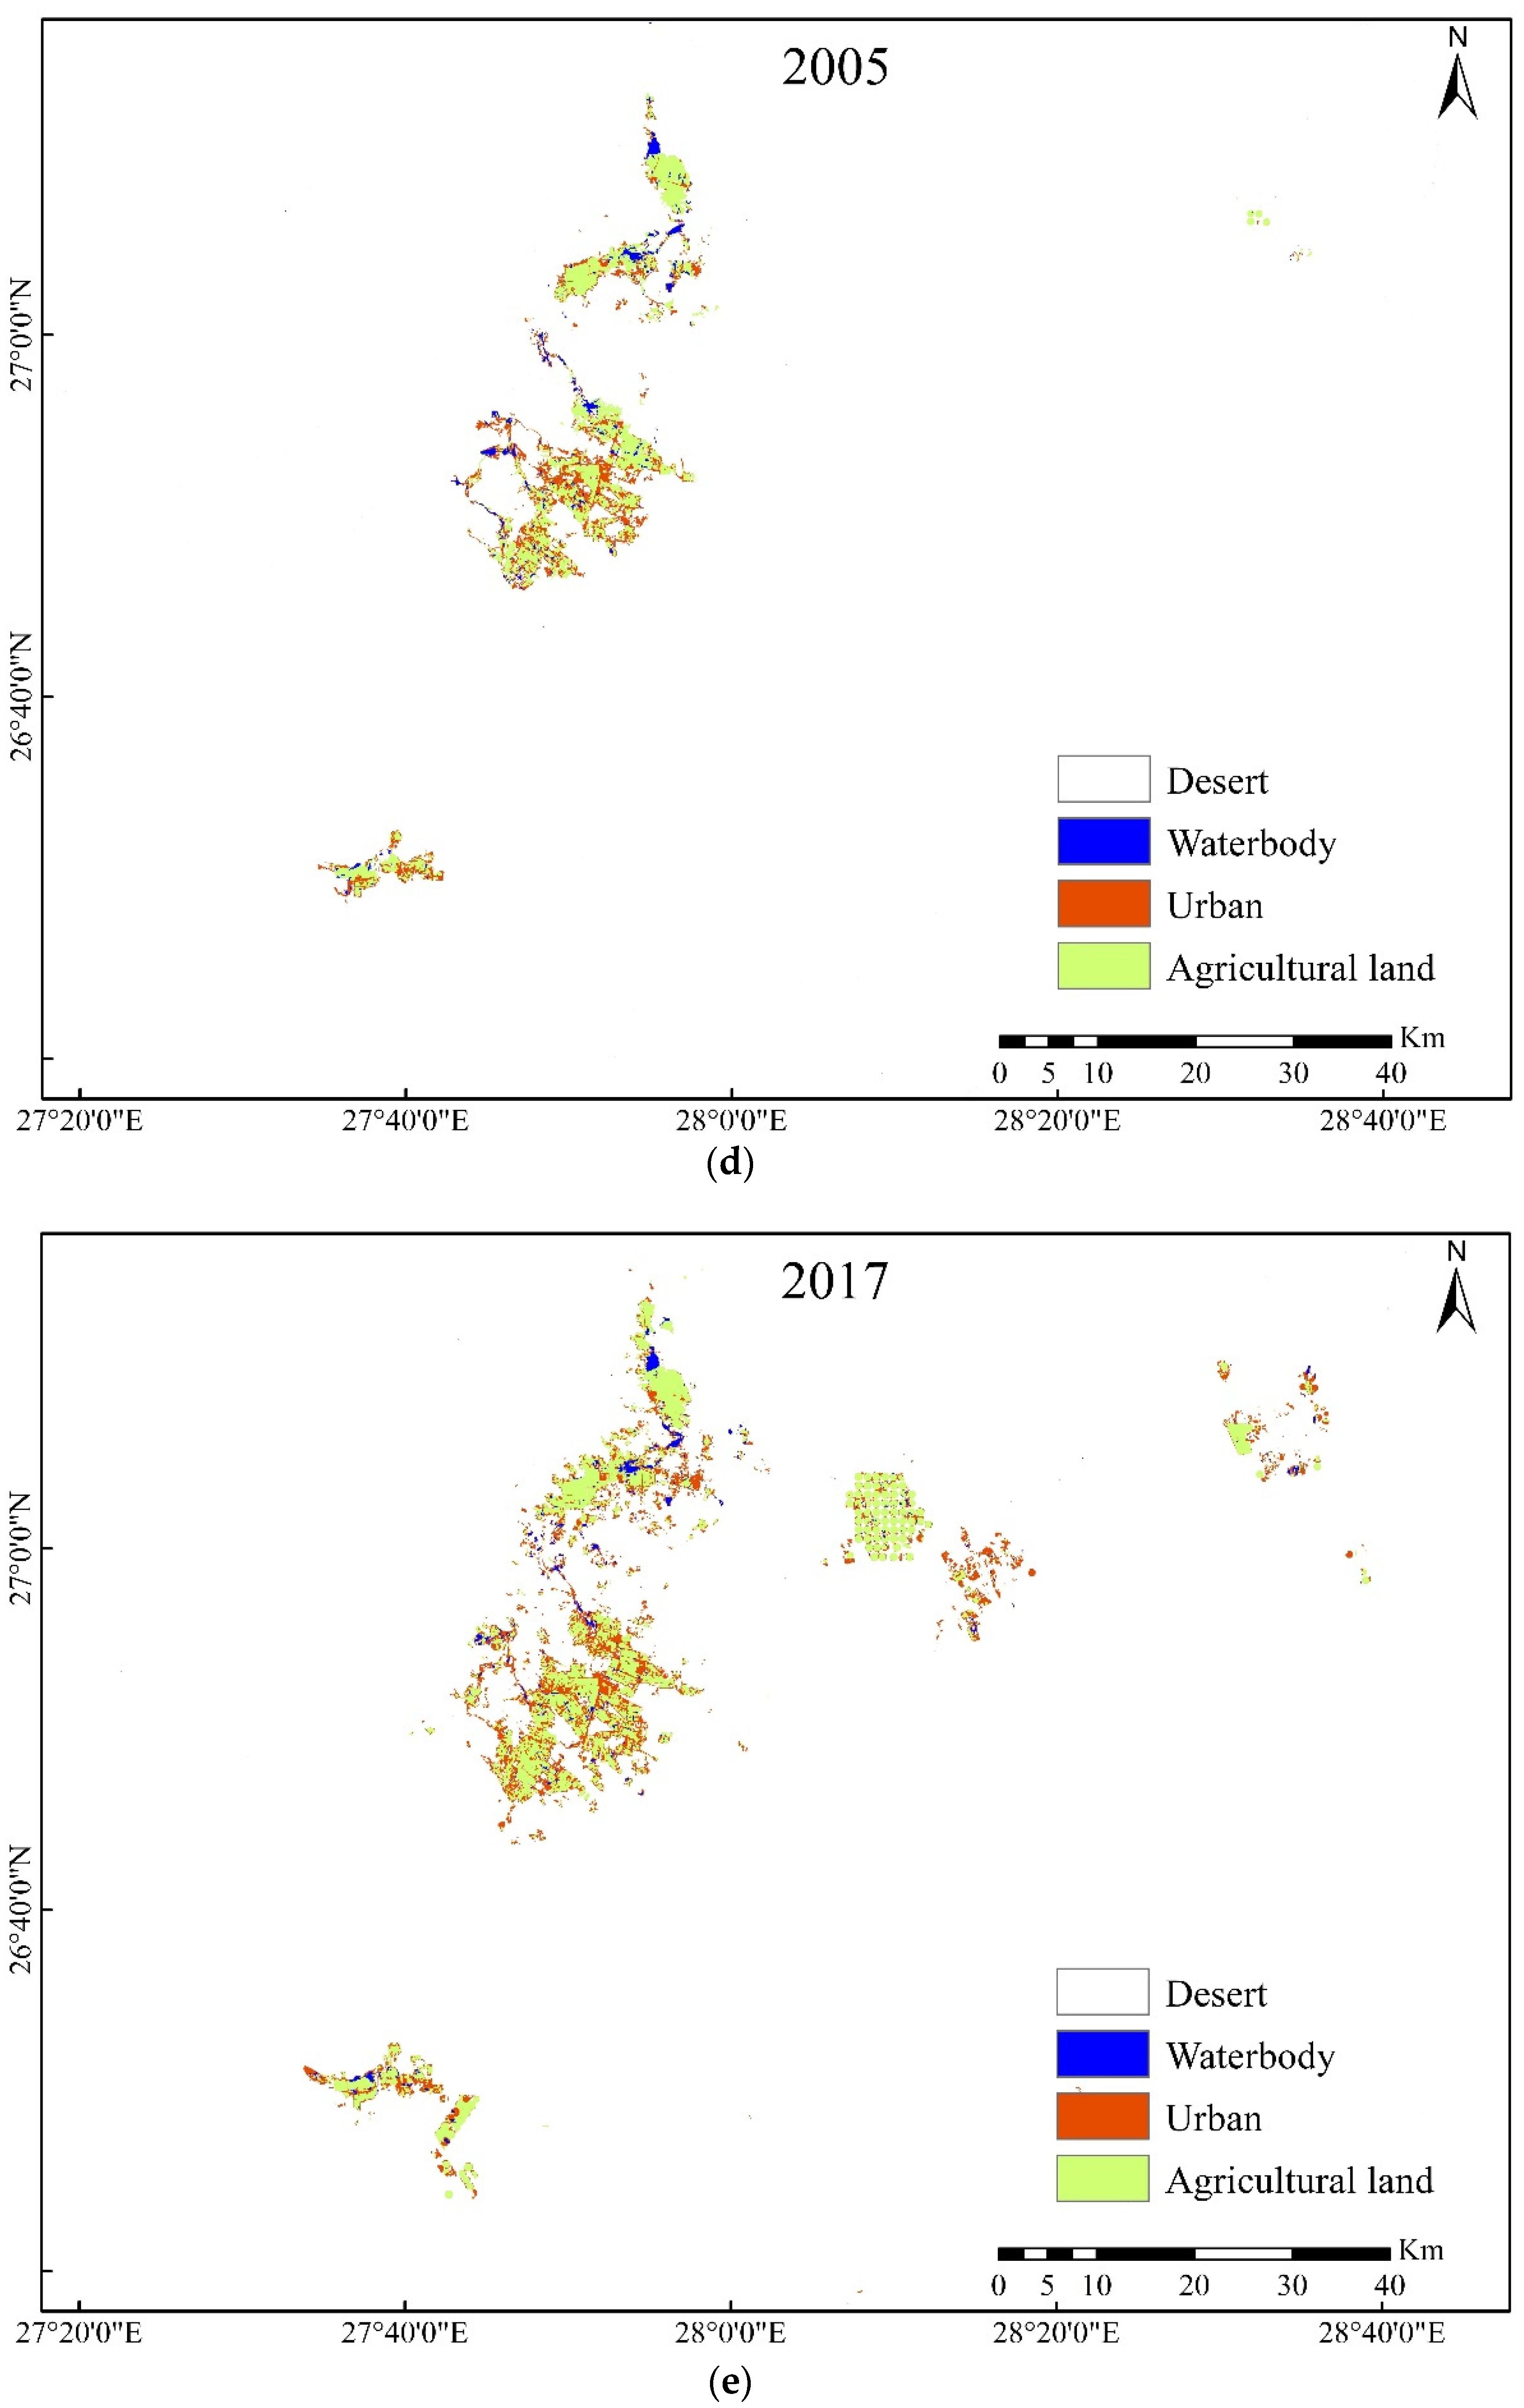
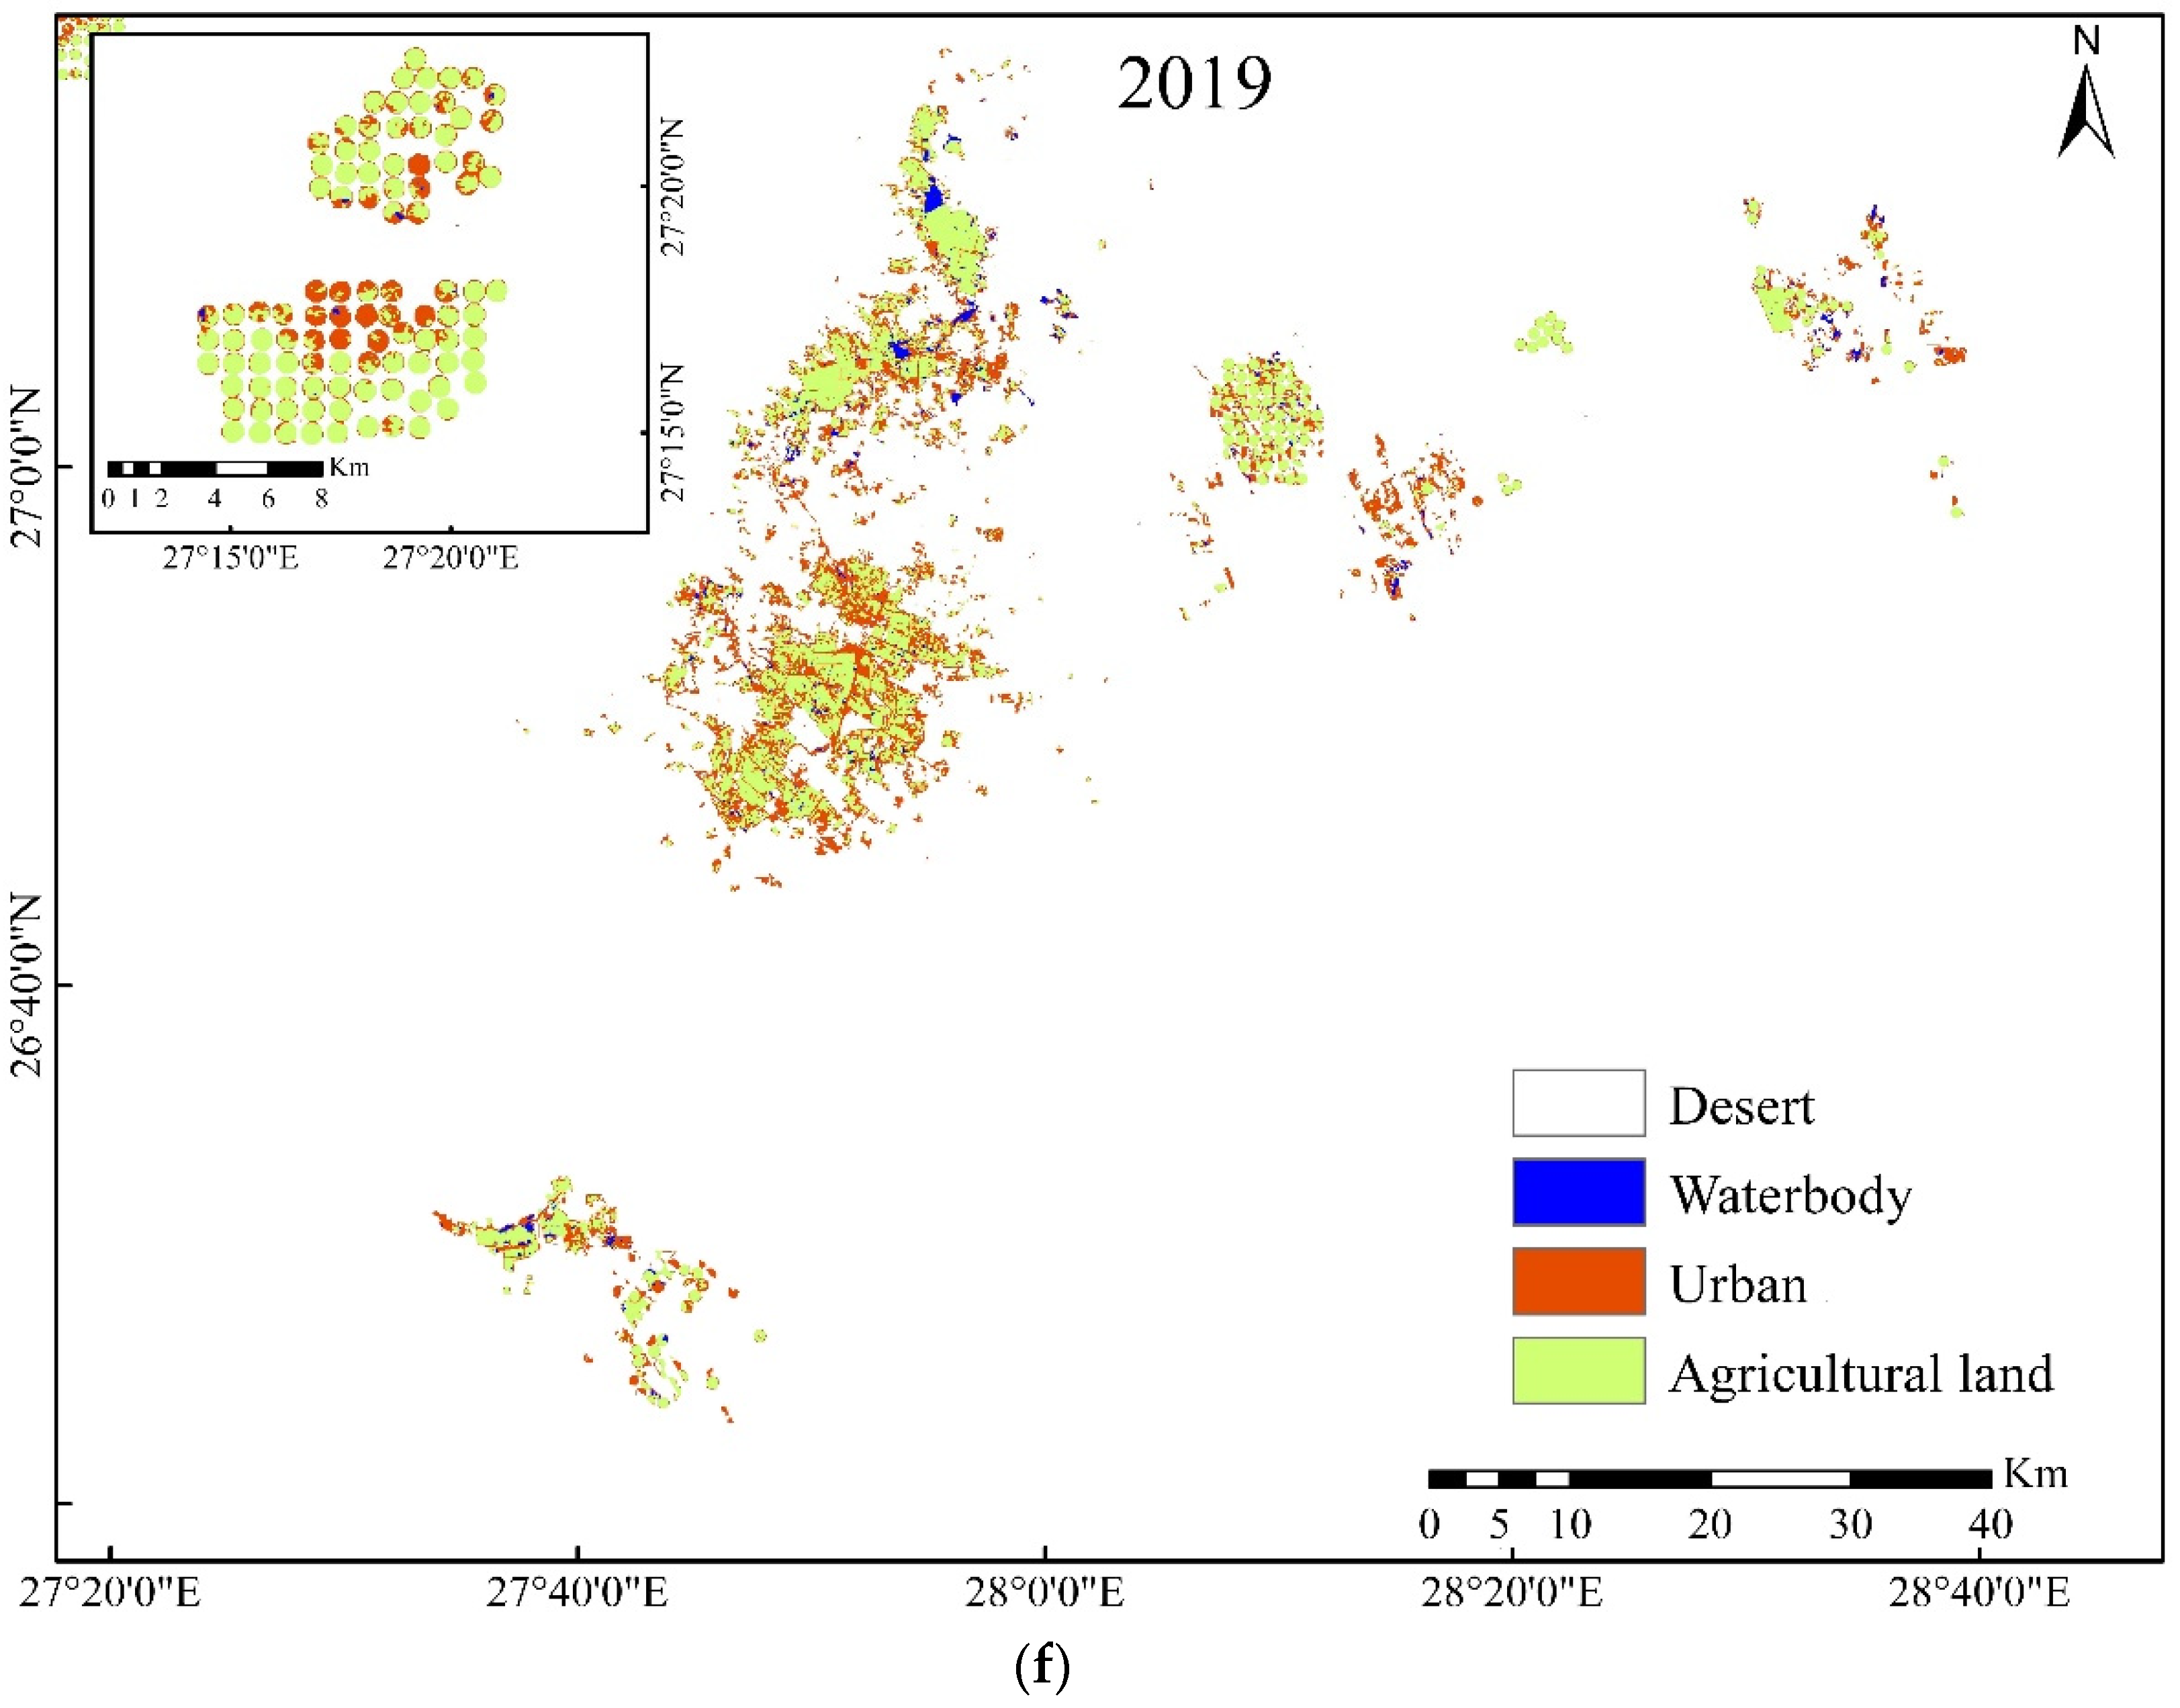
3.2. LULC Classification Results of the Three Oases in New Valley
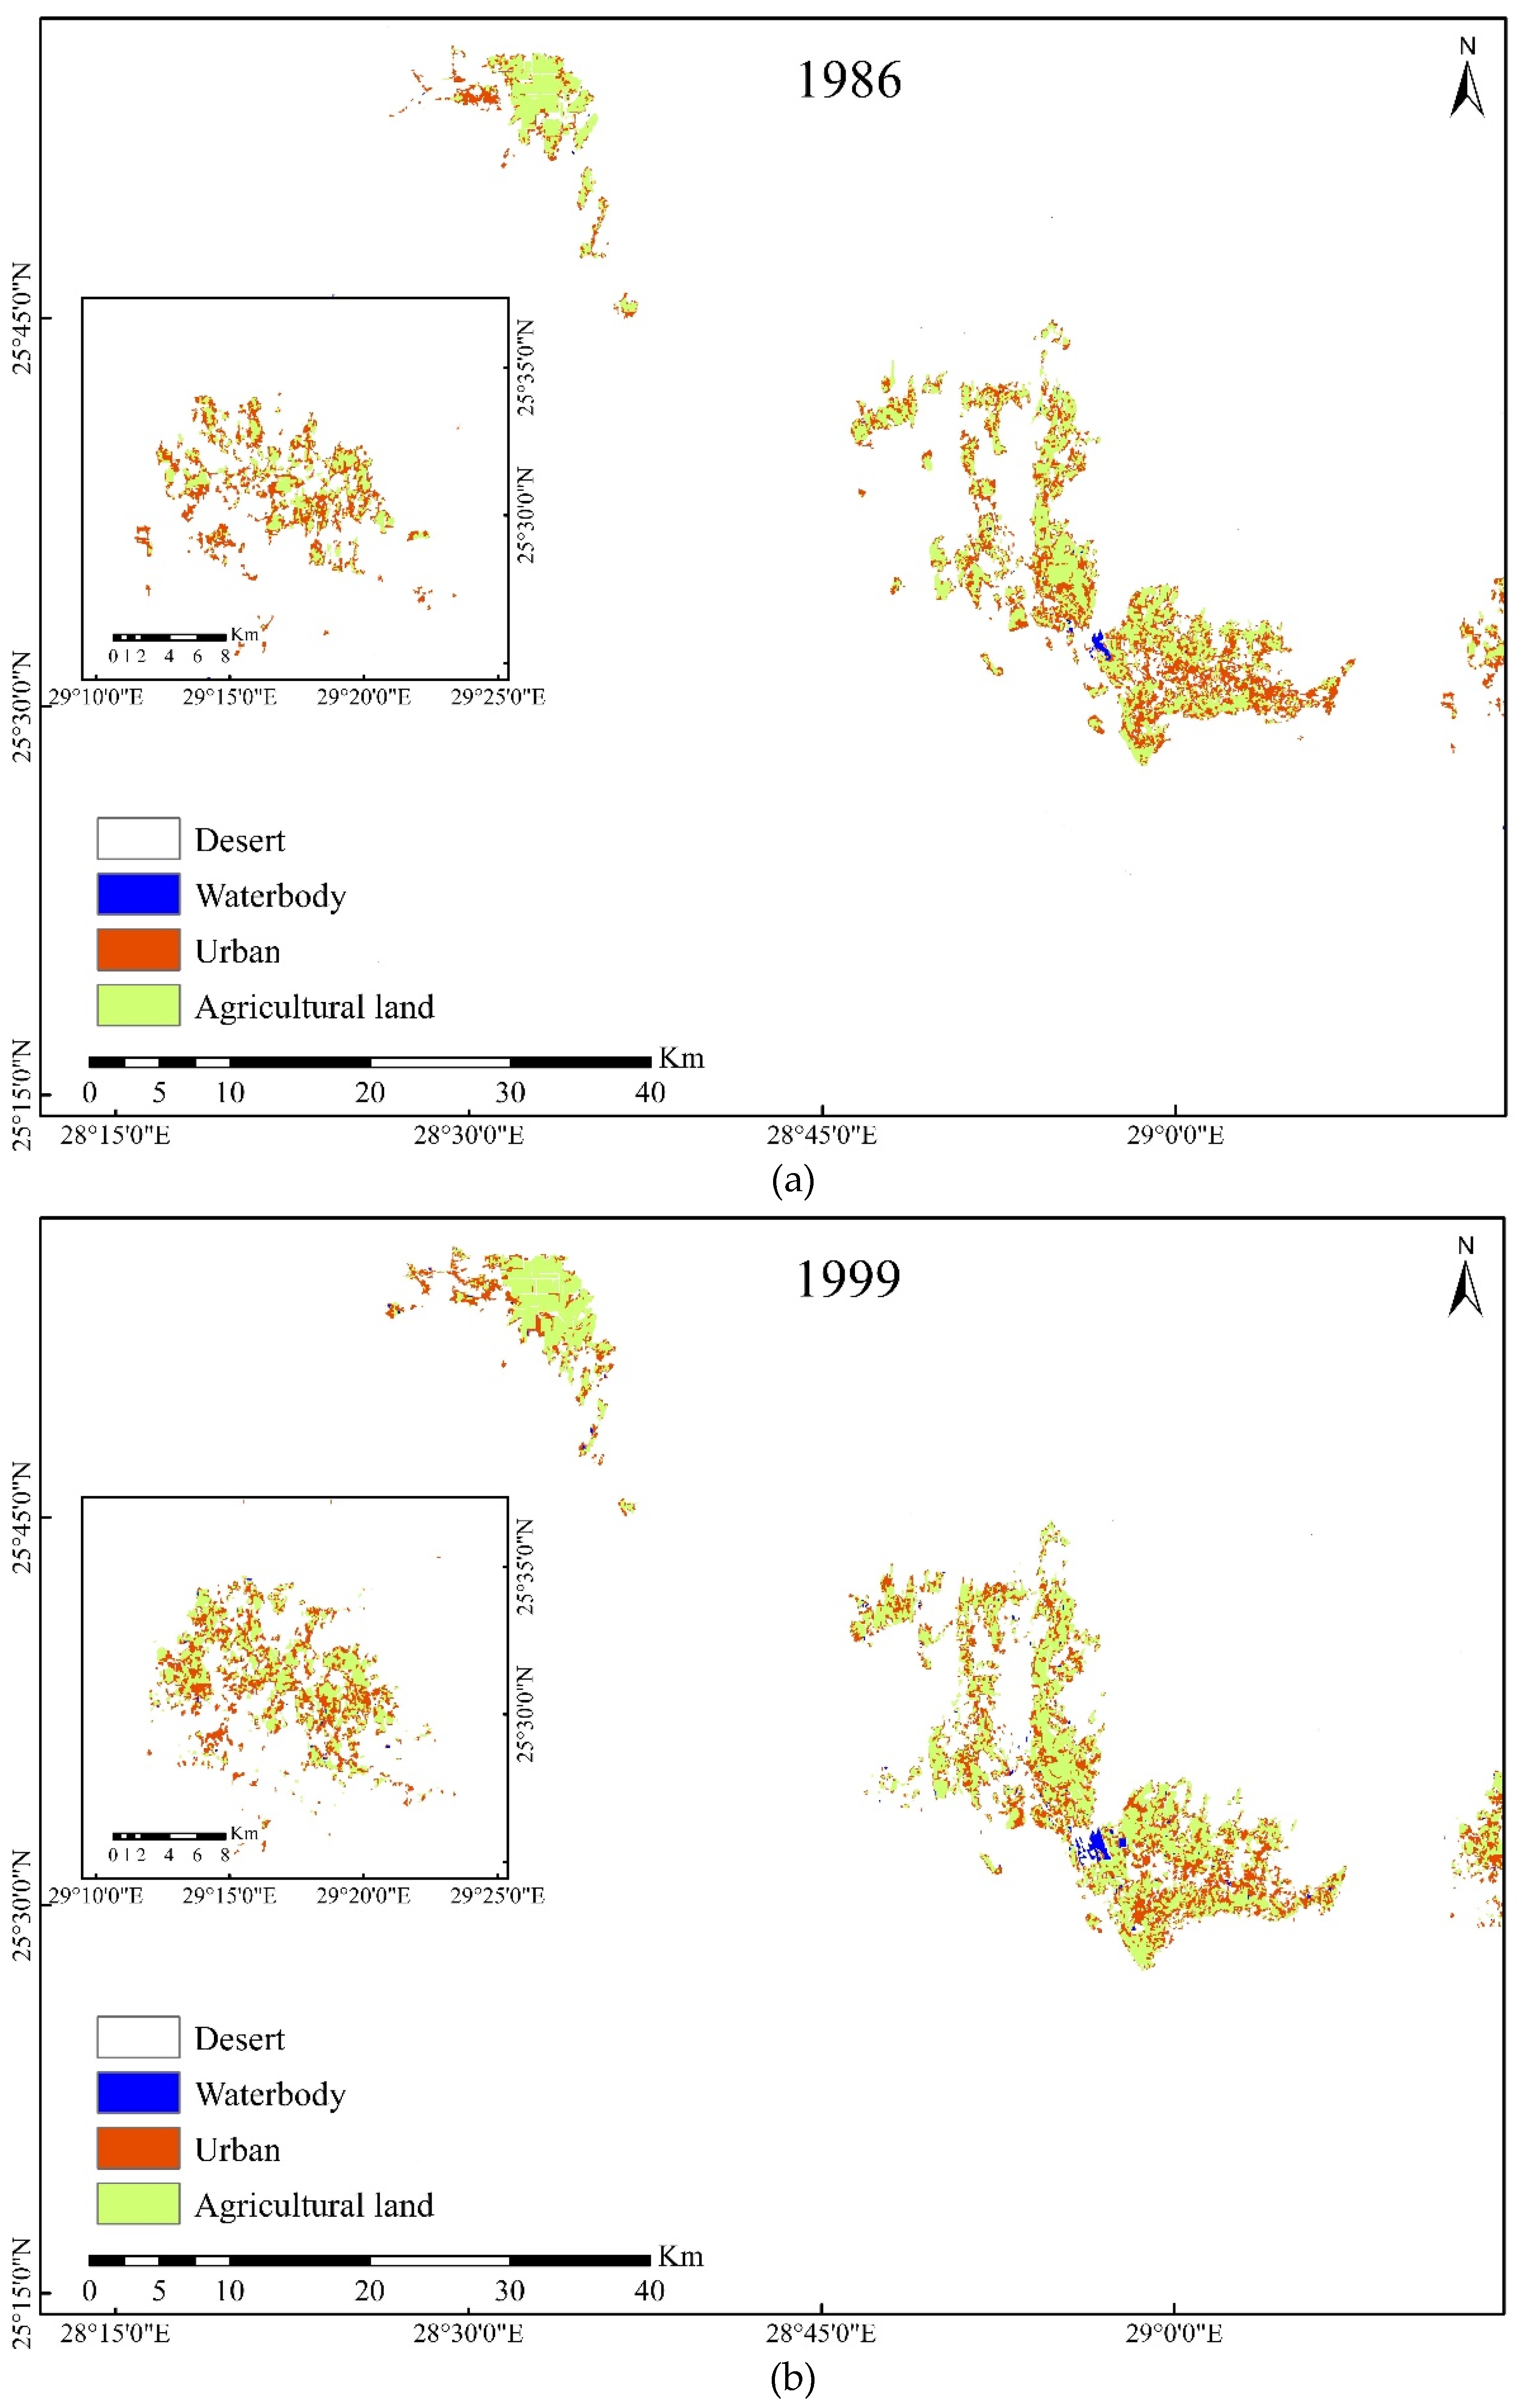
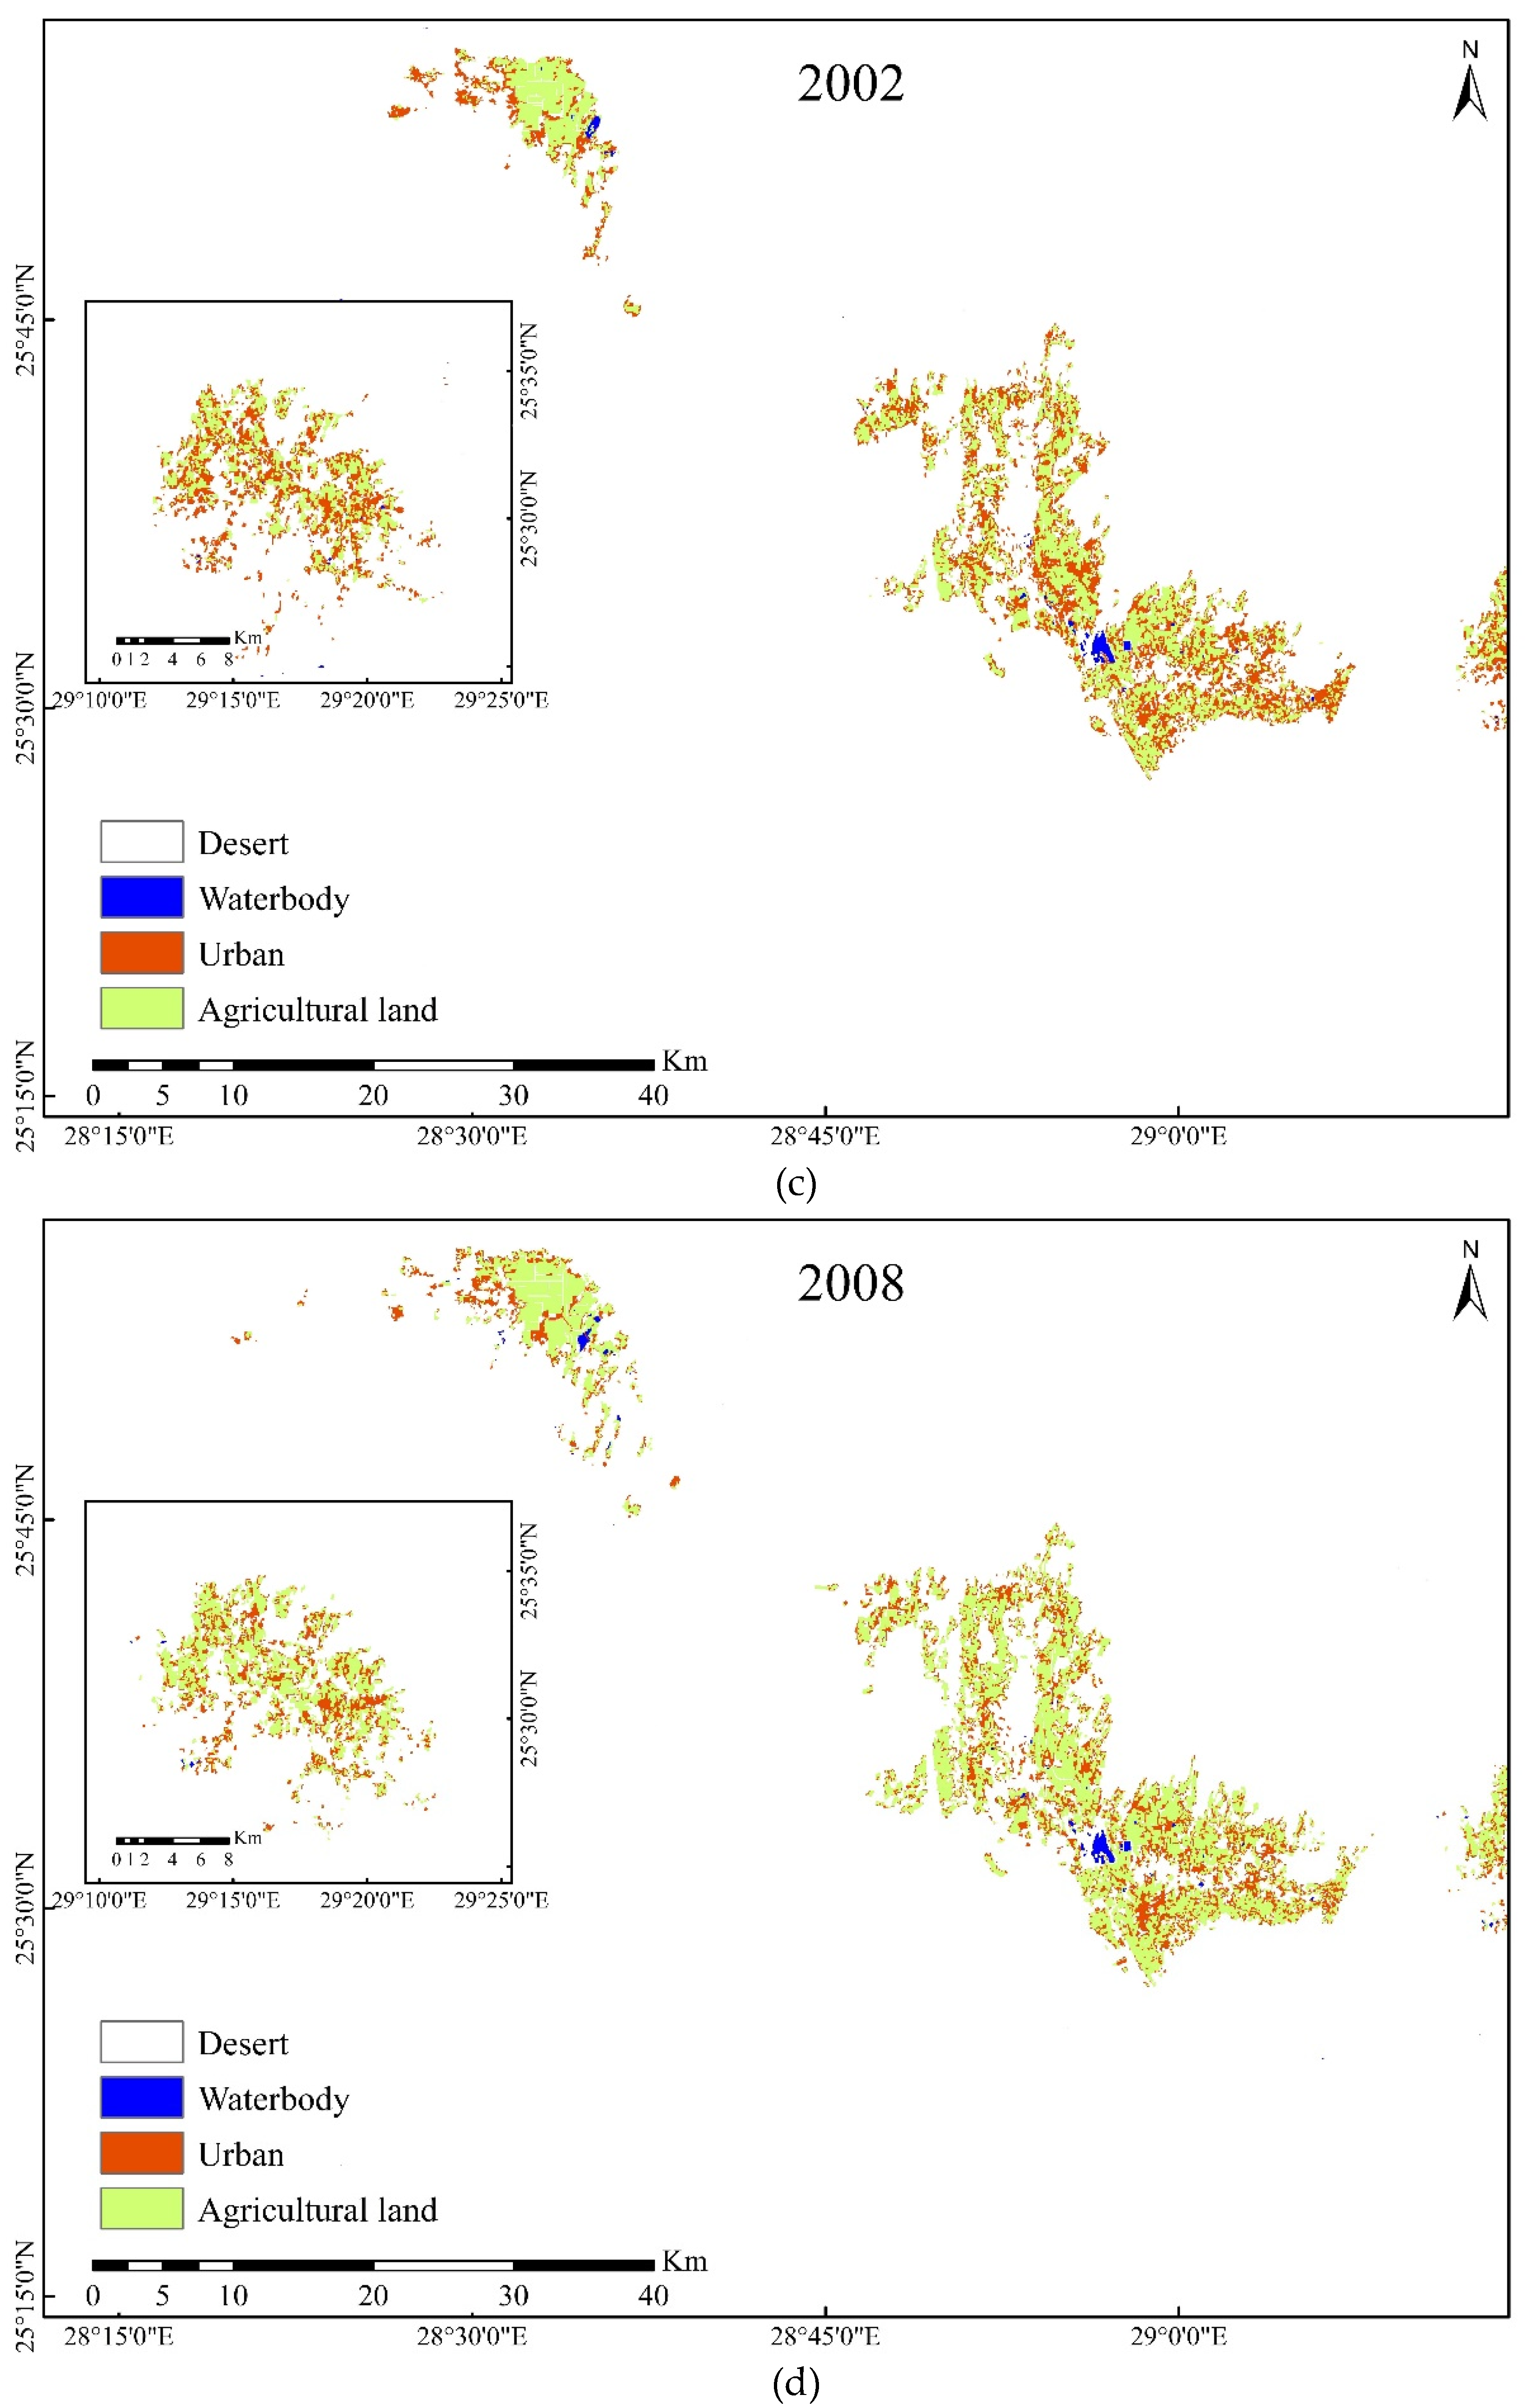
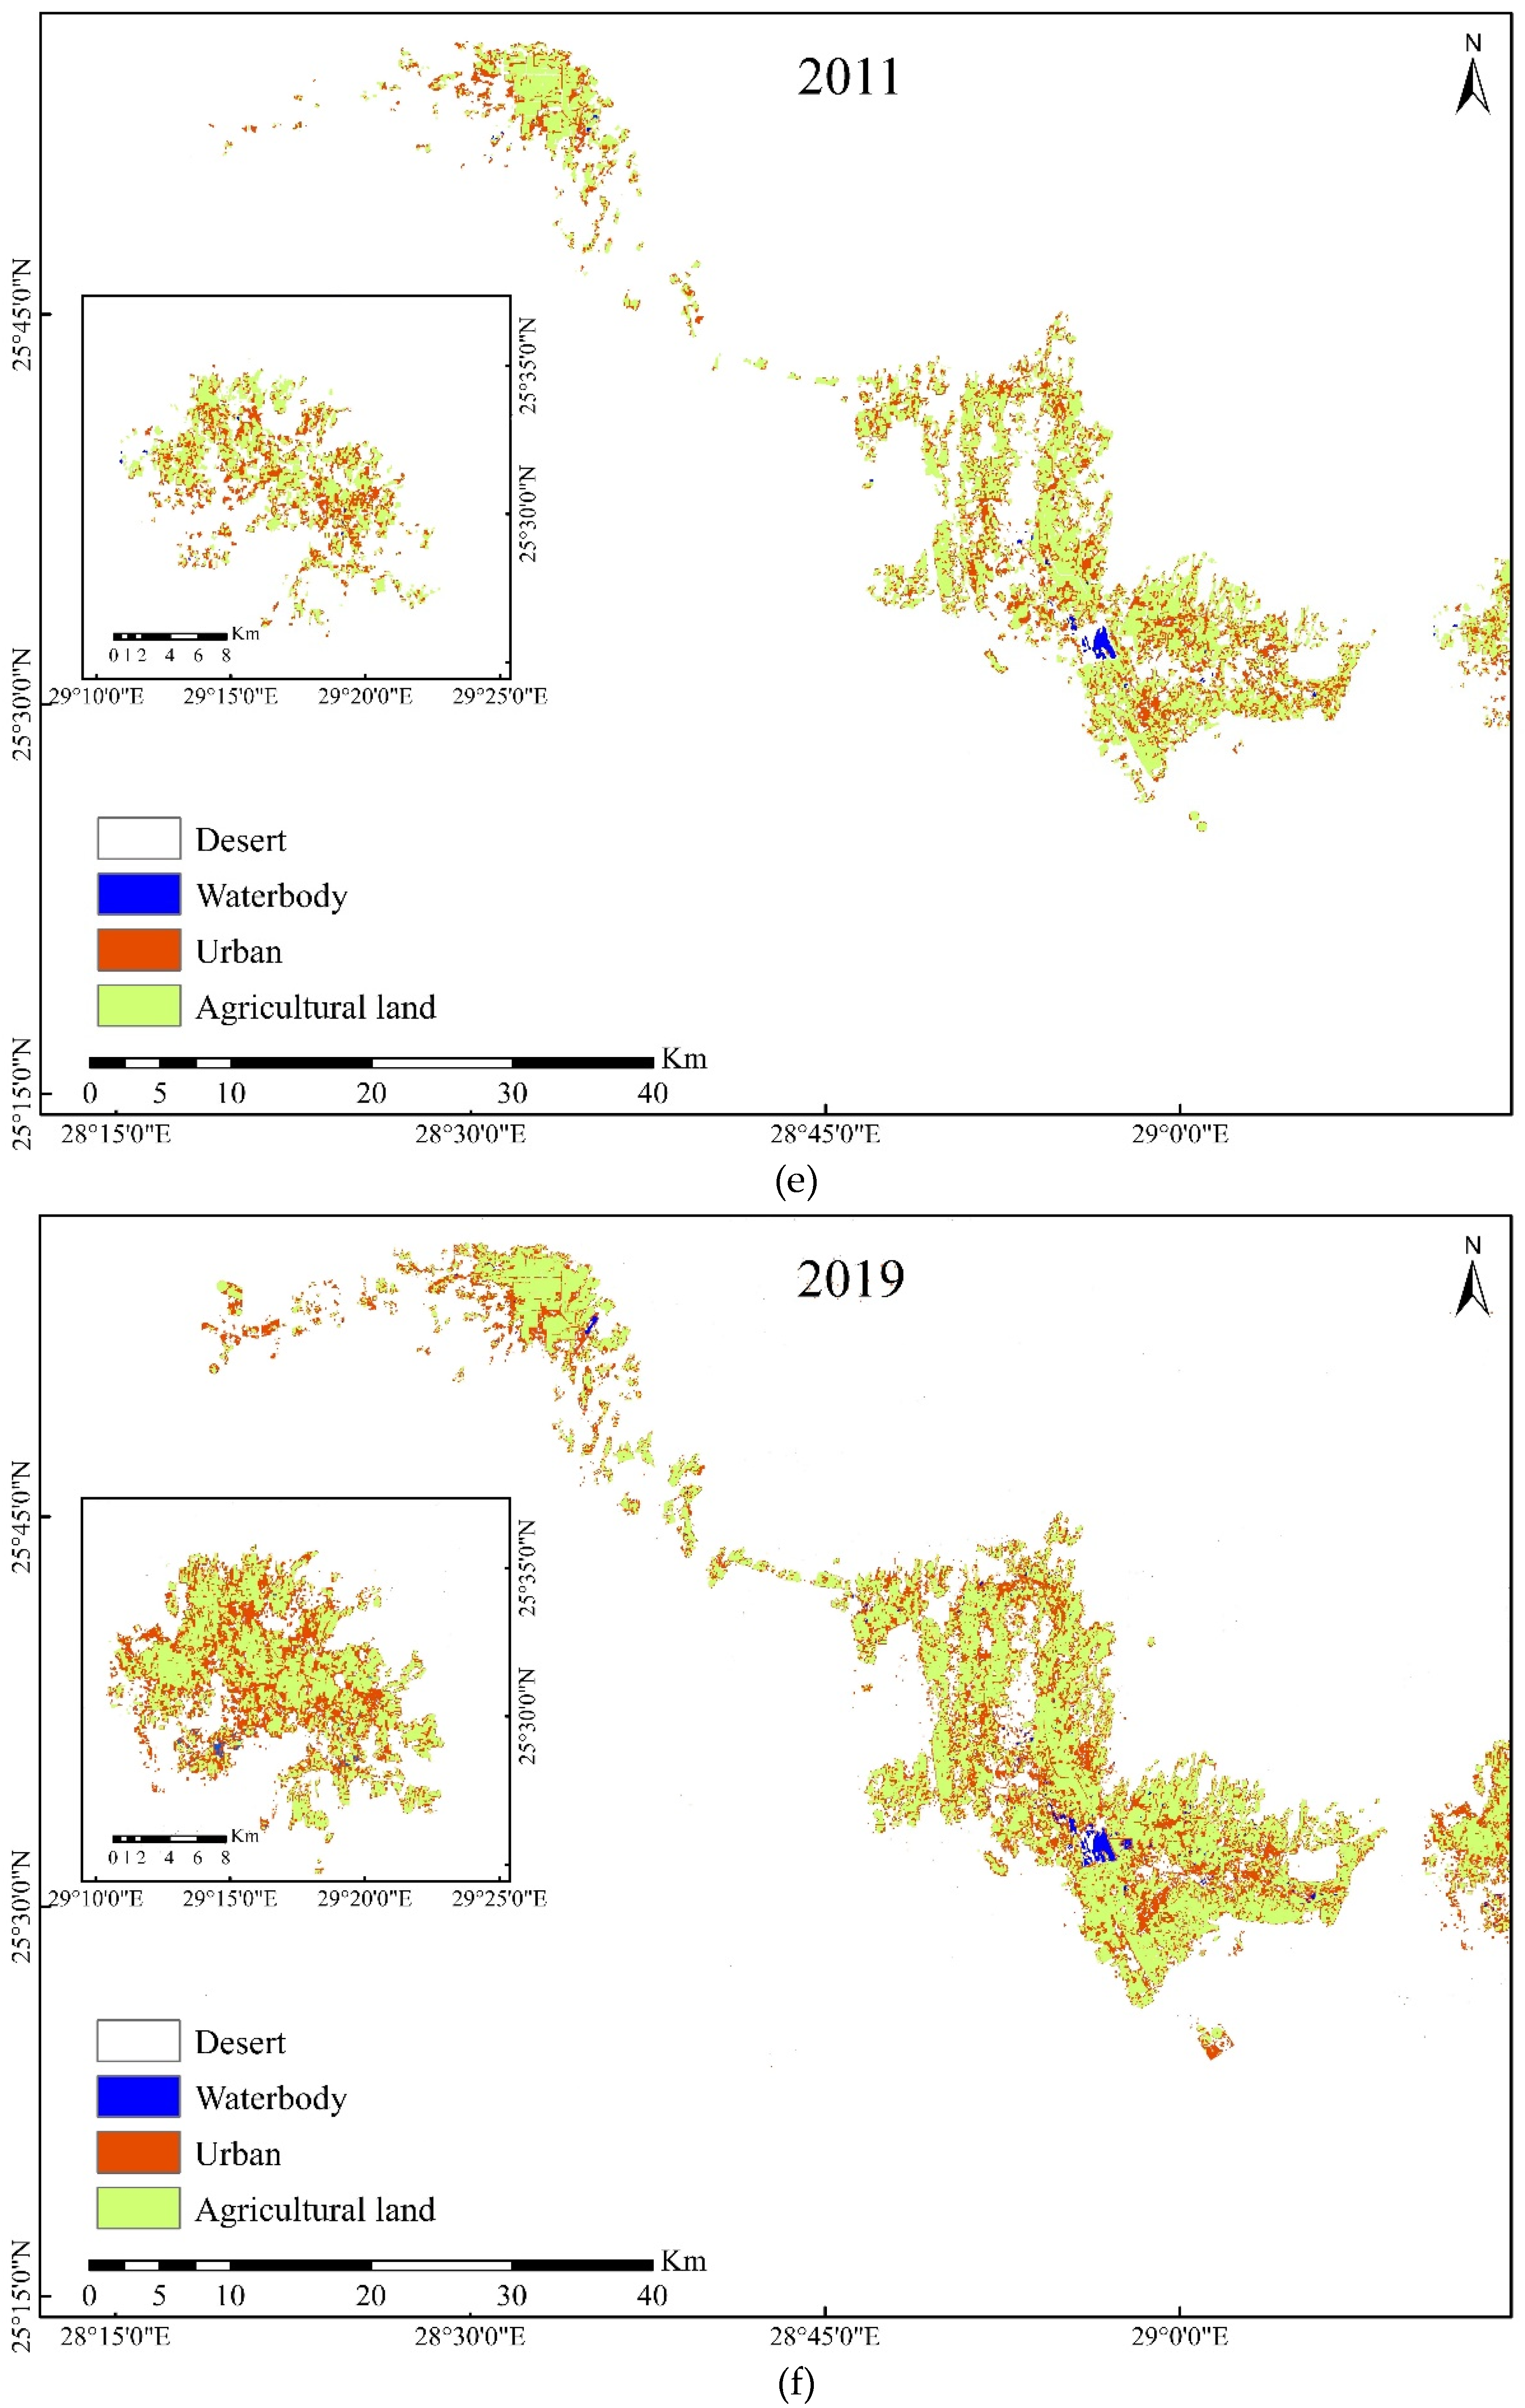
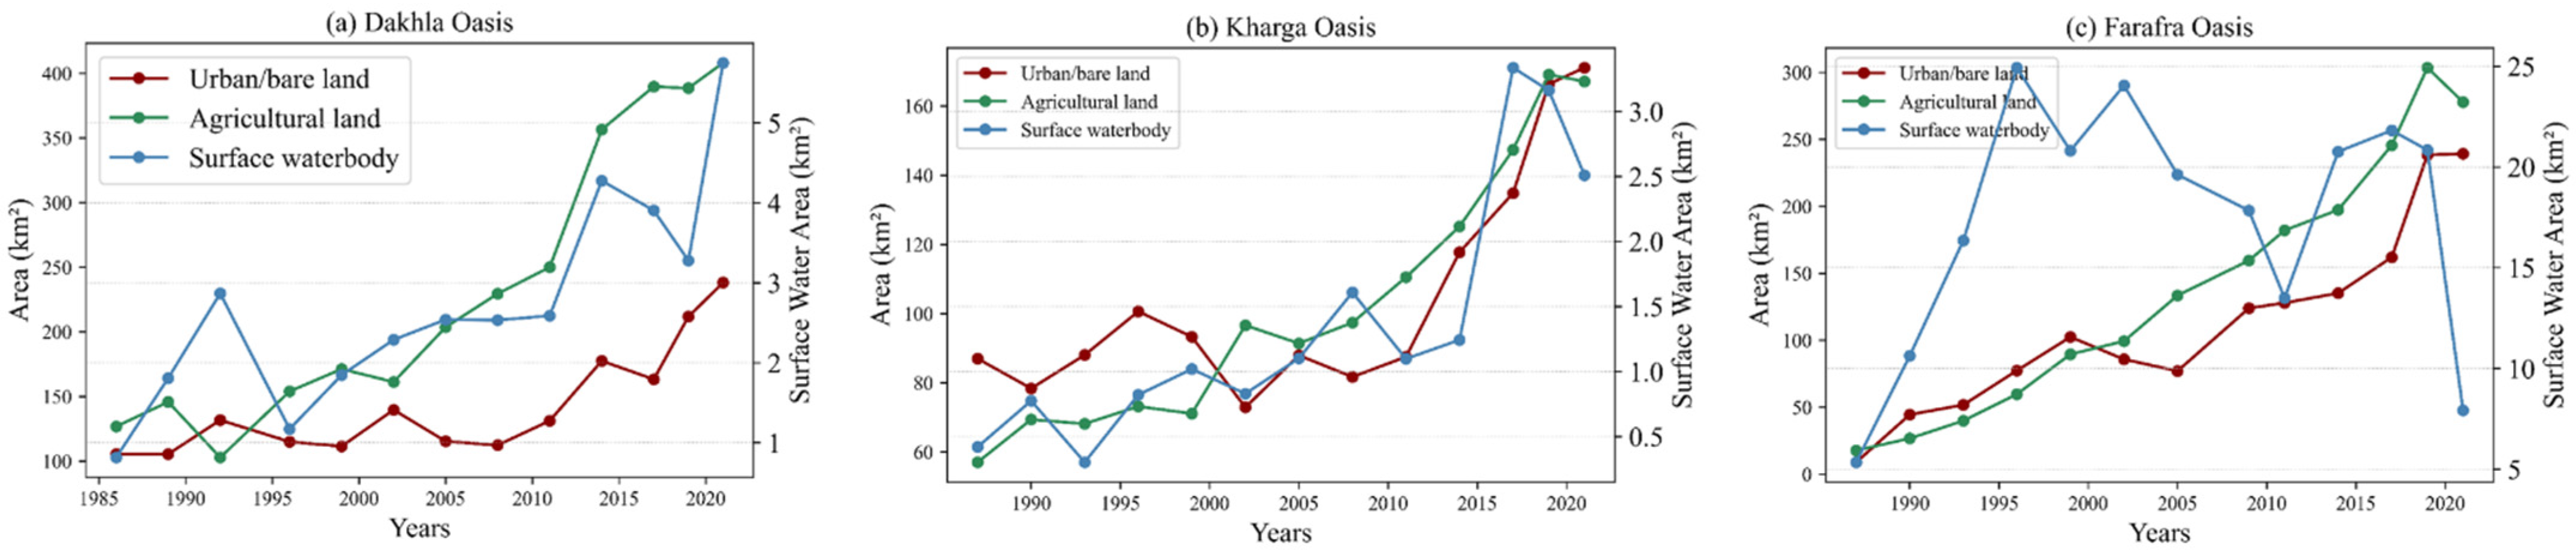
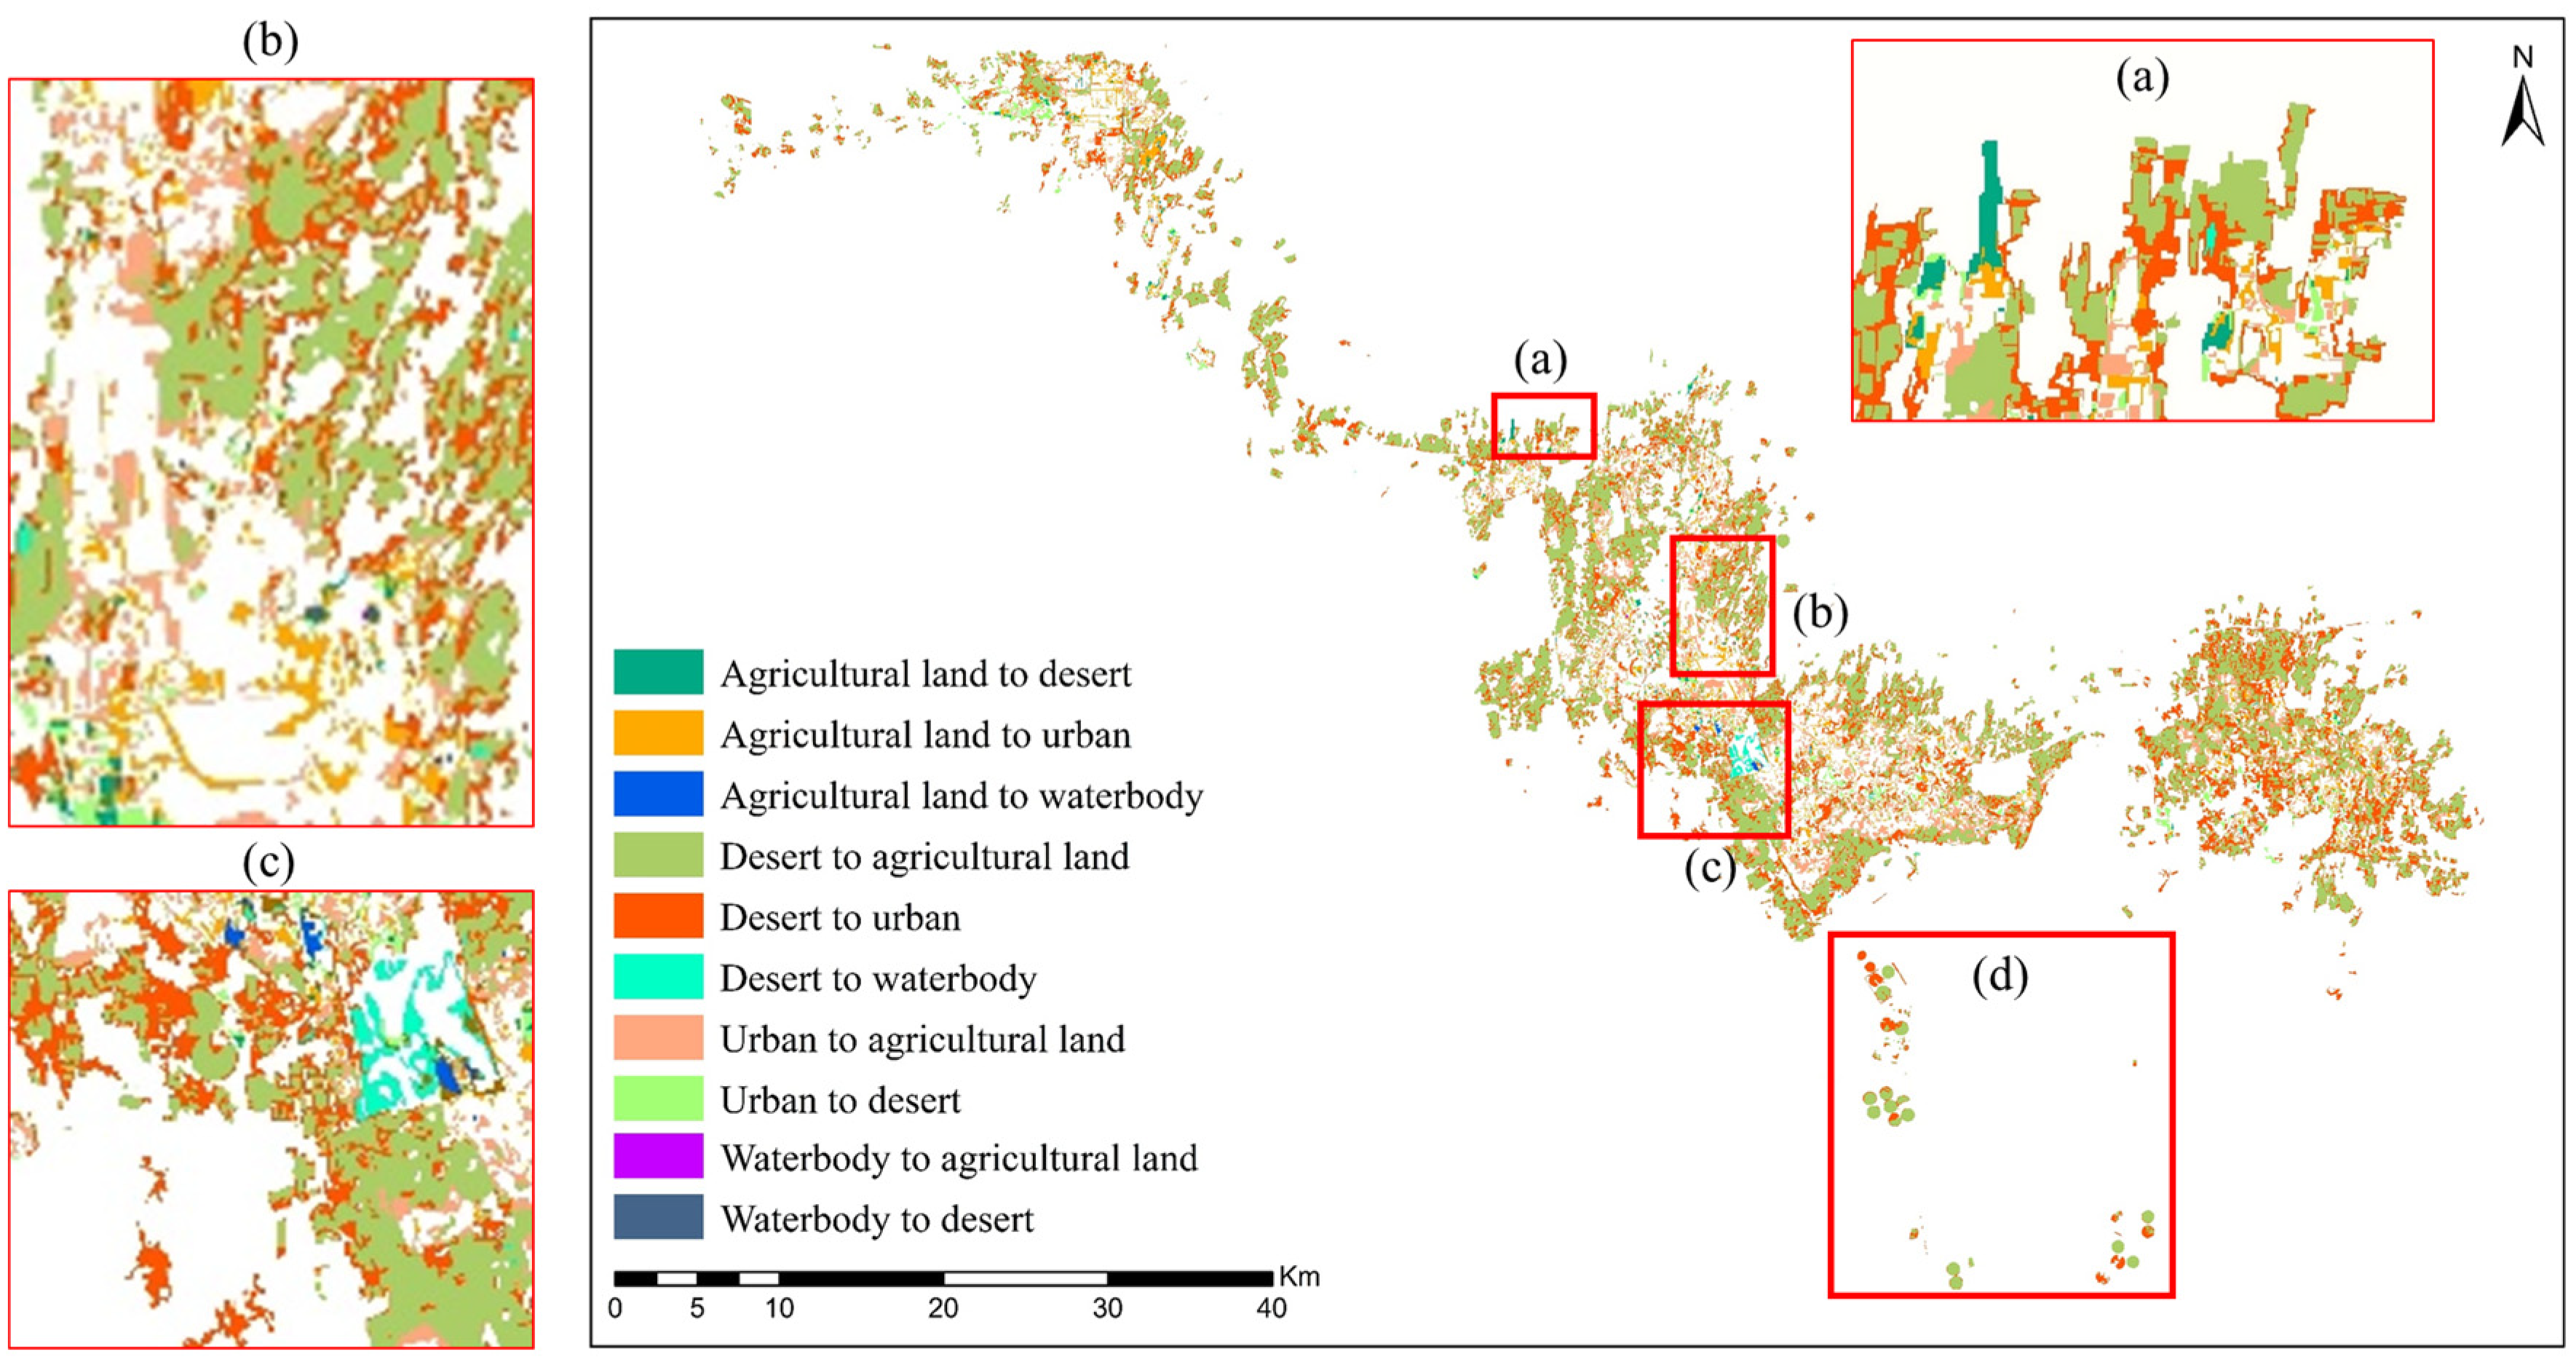
3.2.1. Dakhla Oasis
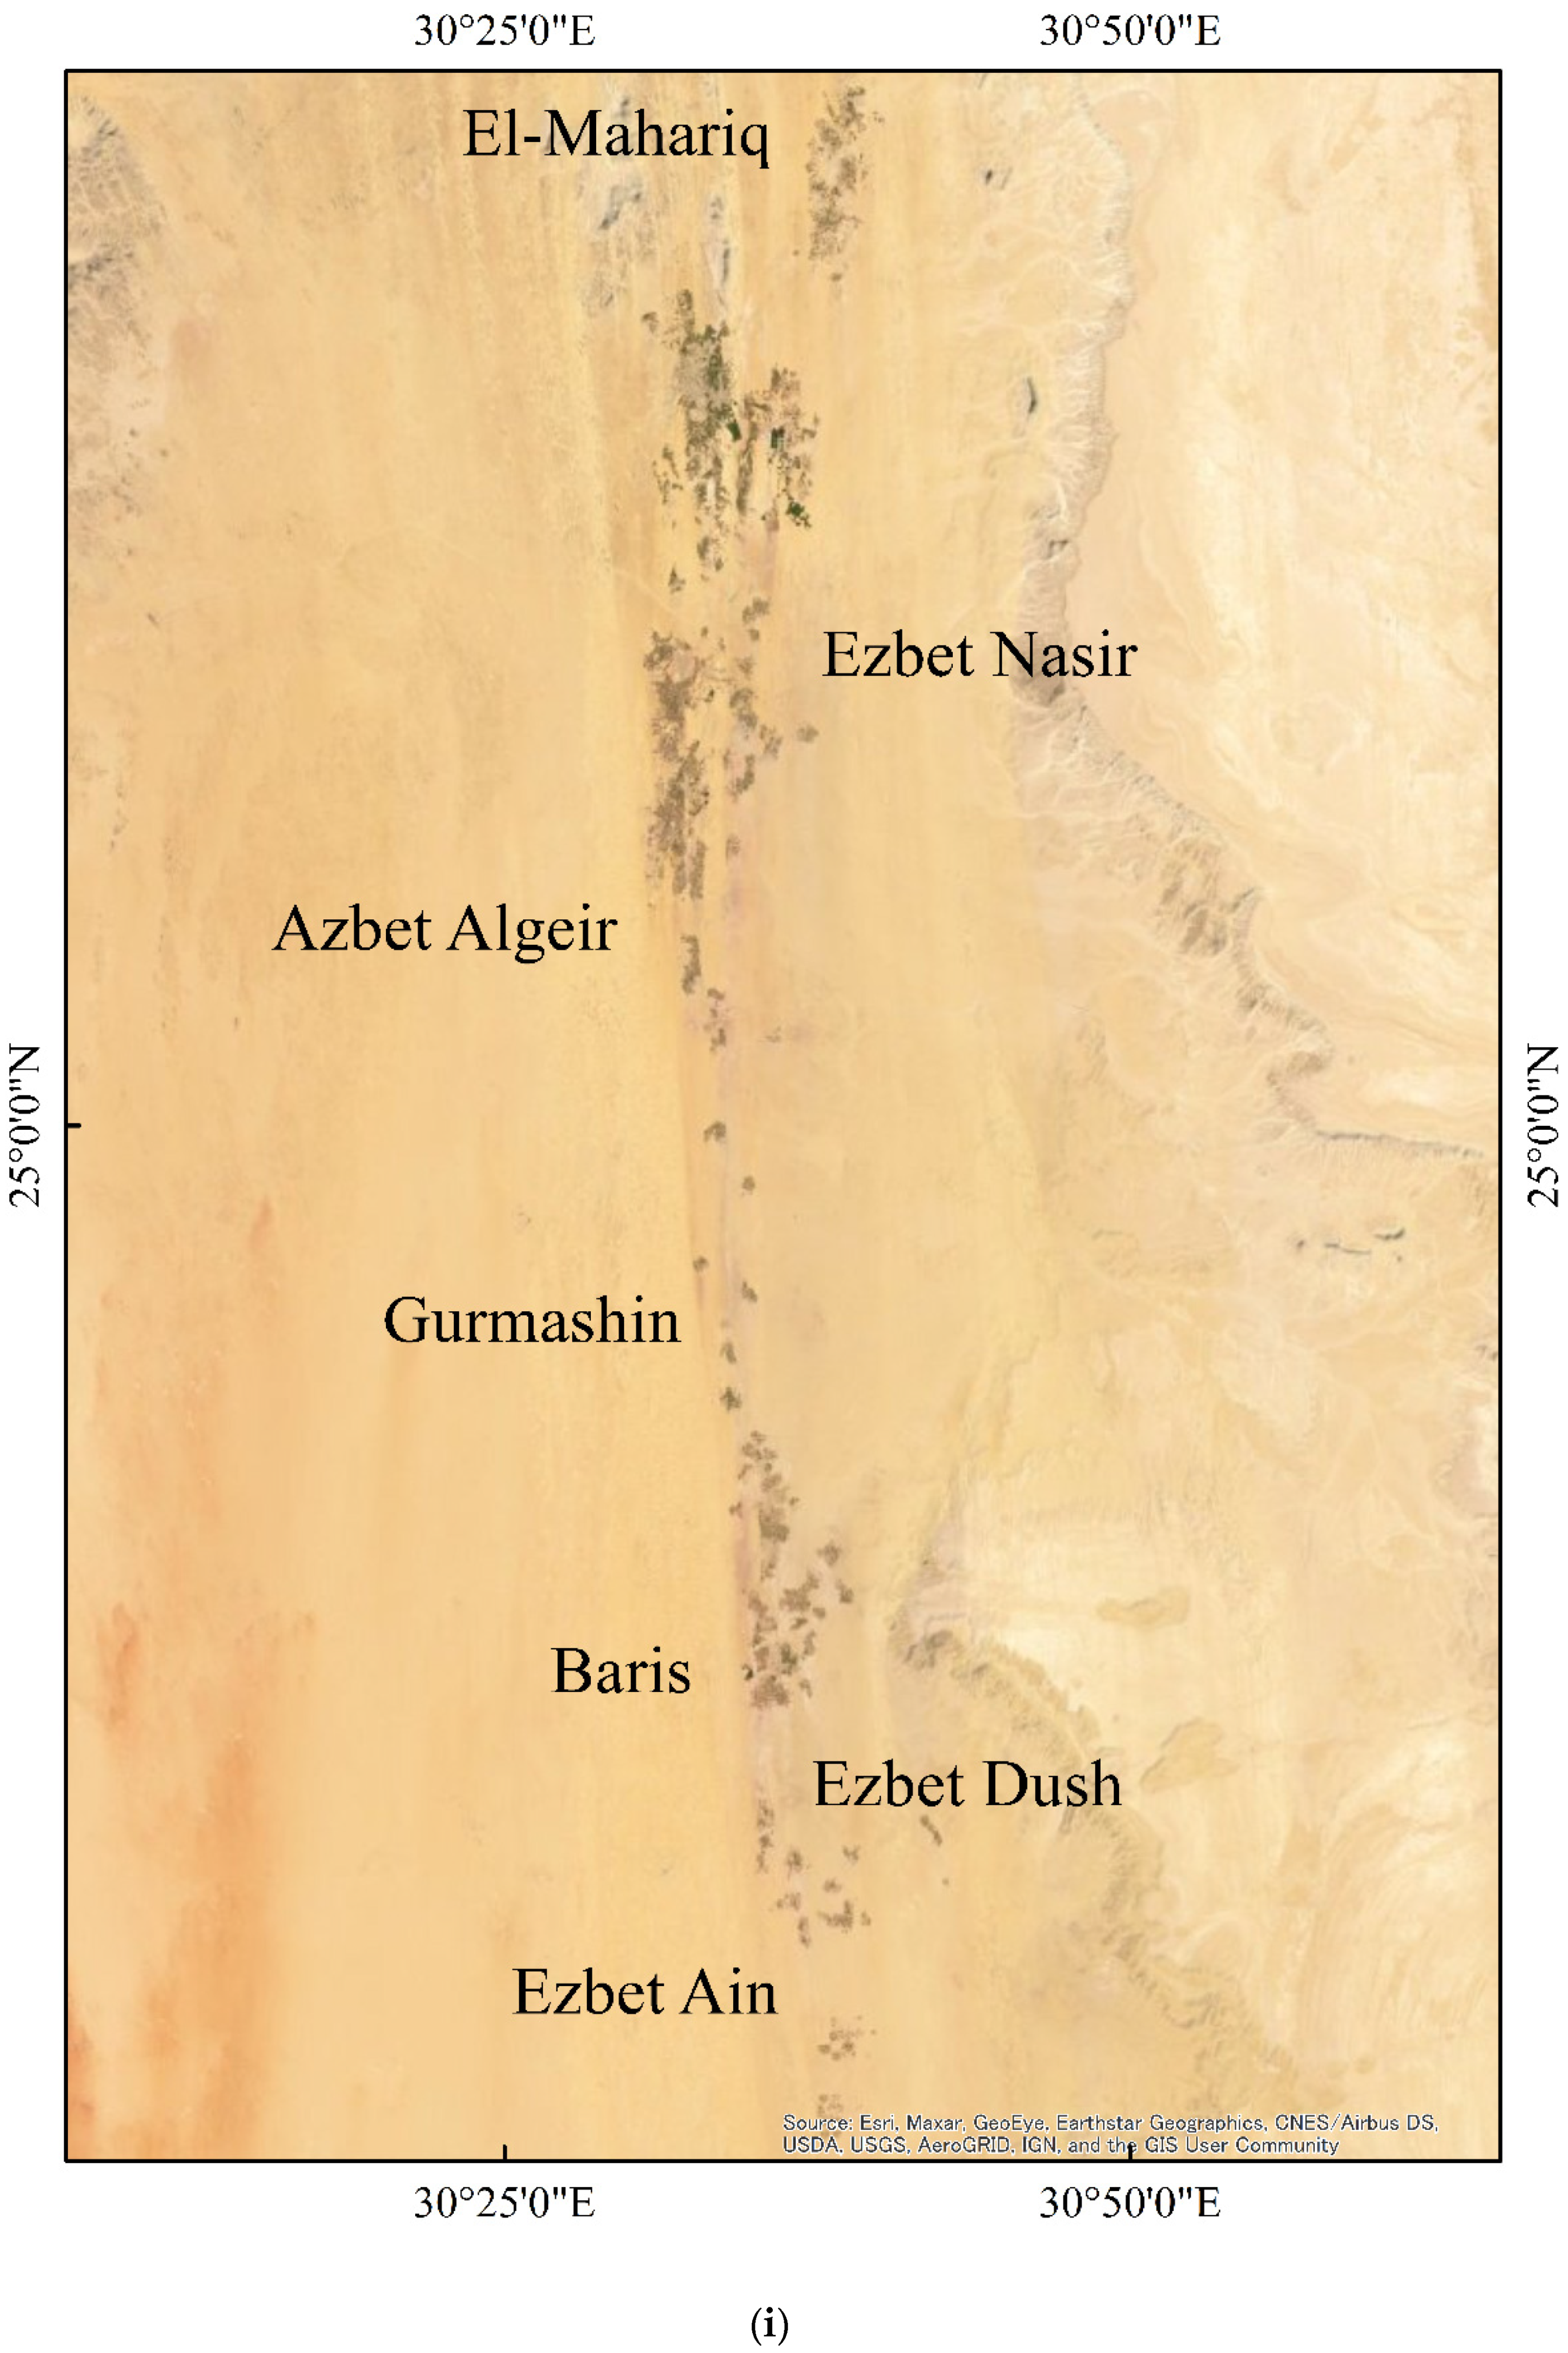
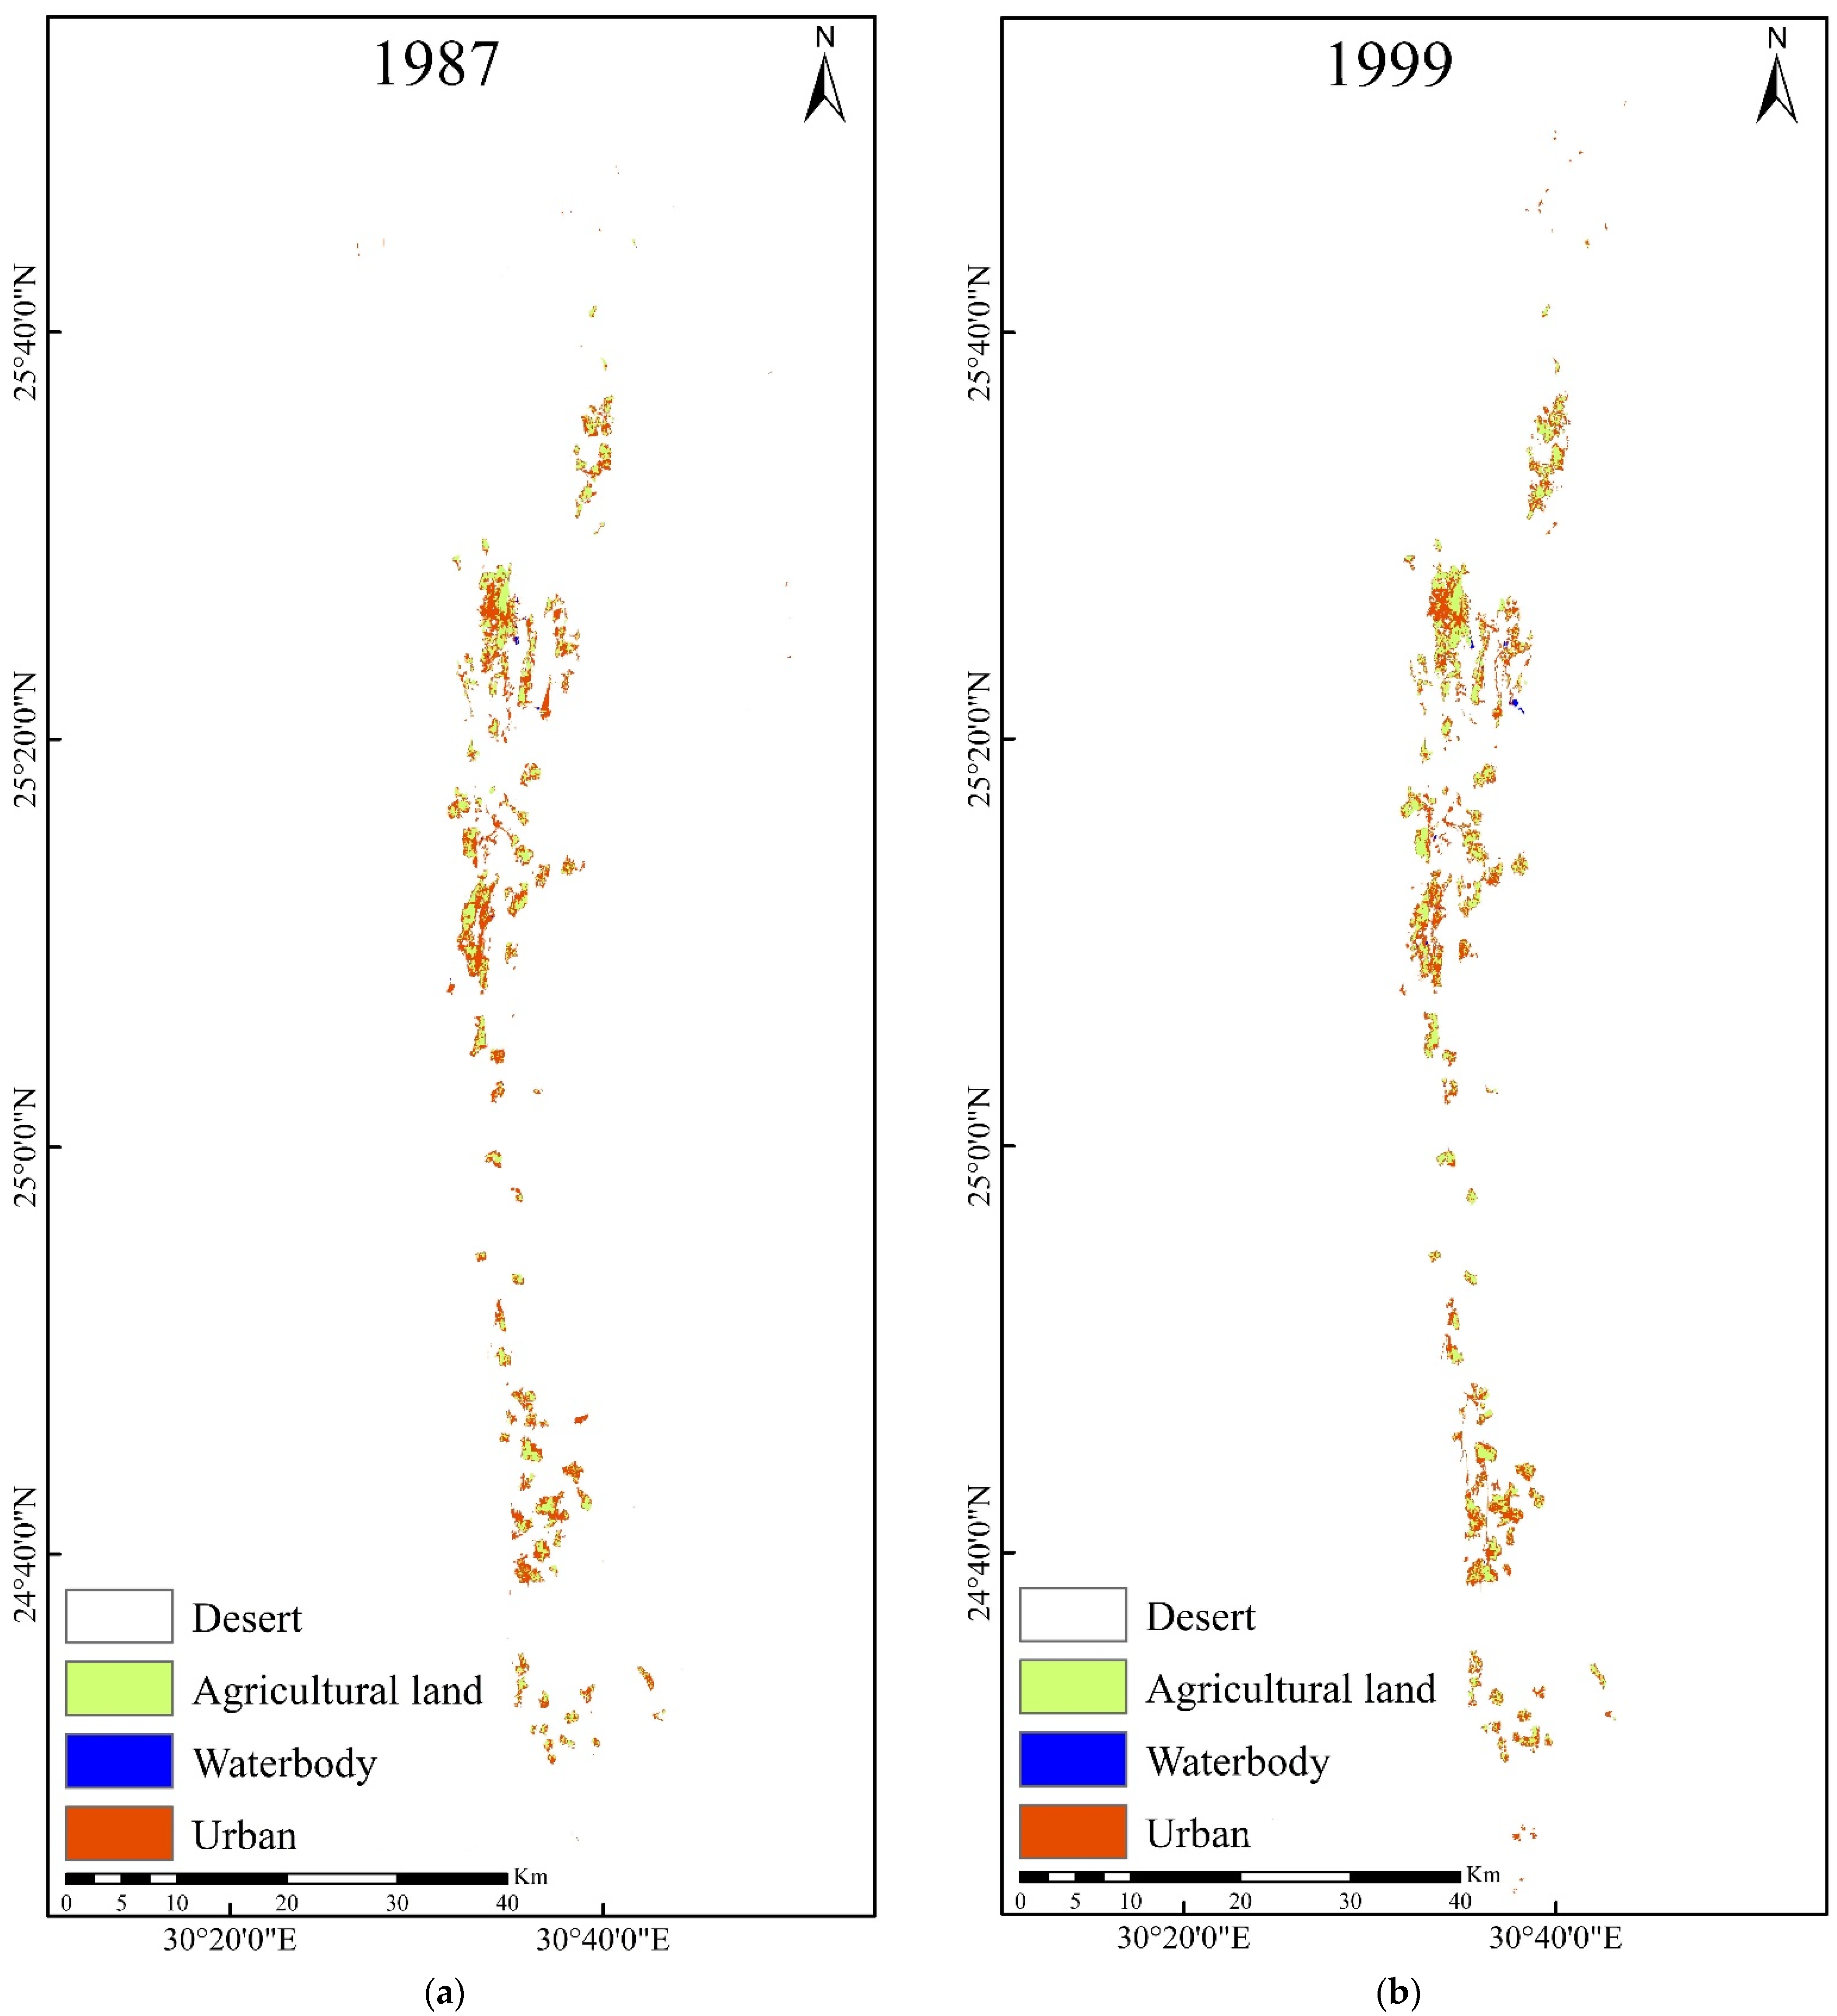
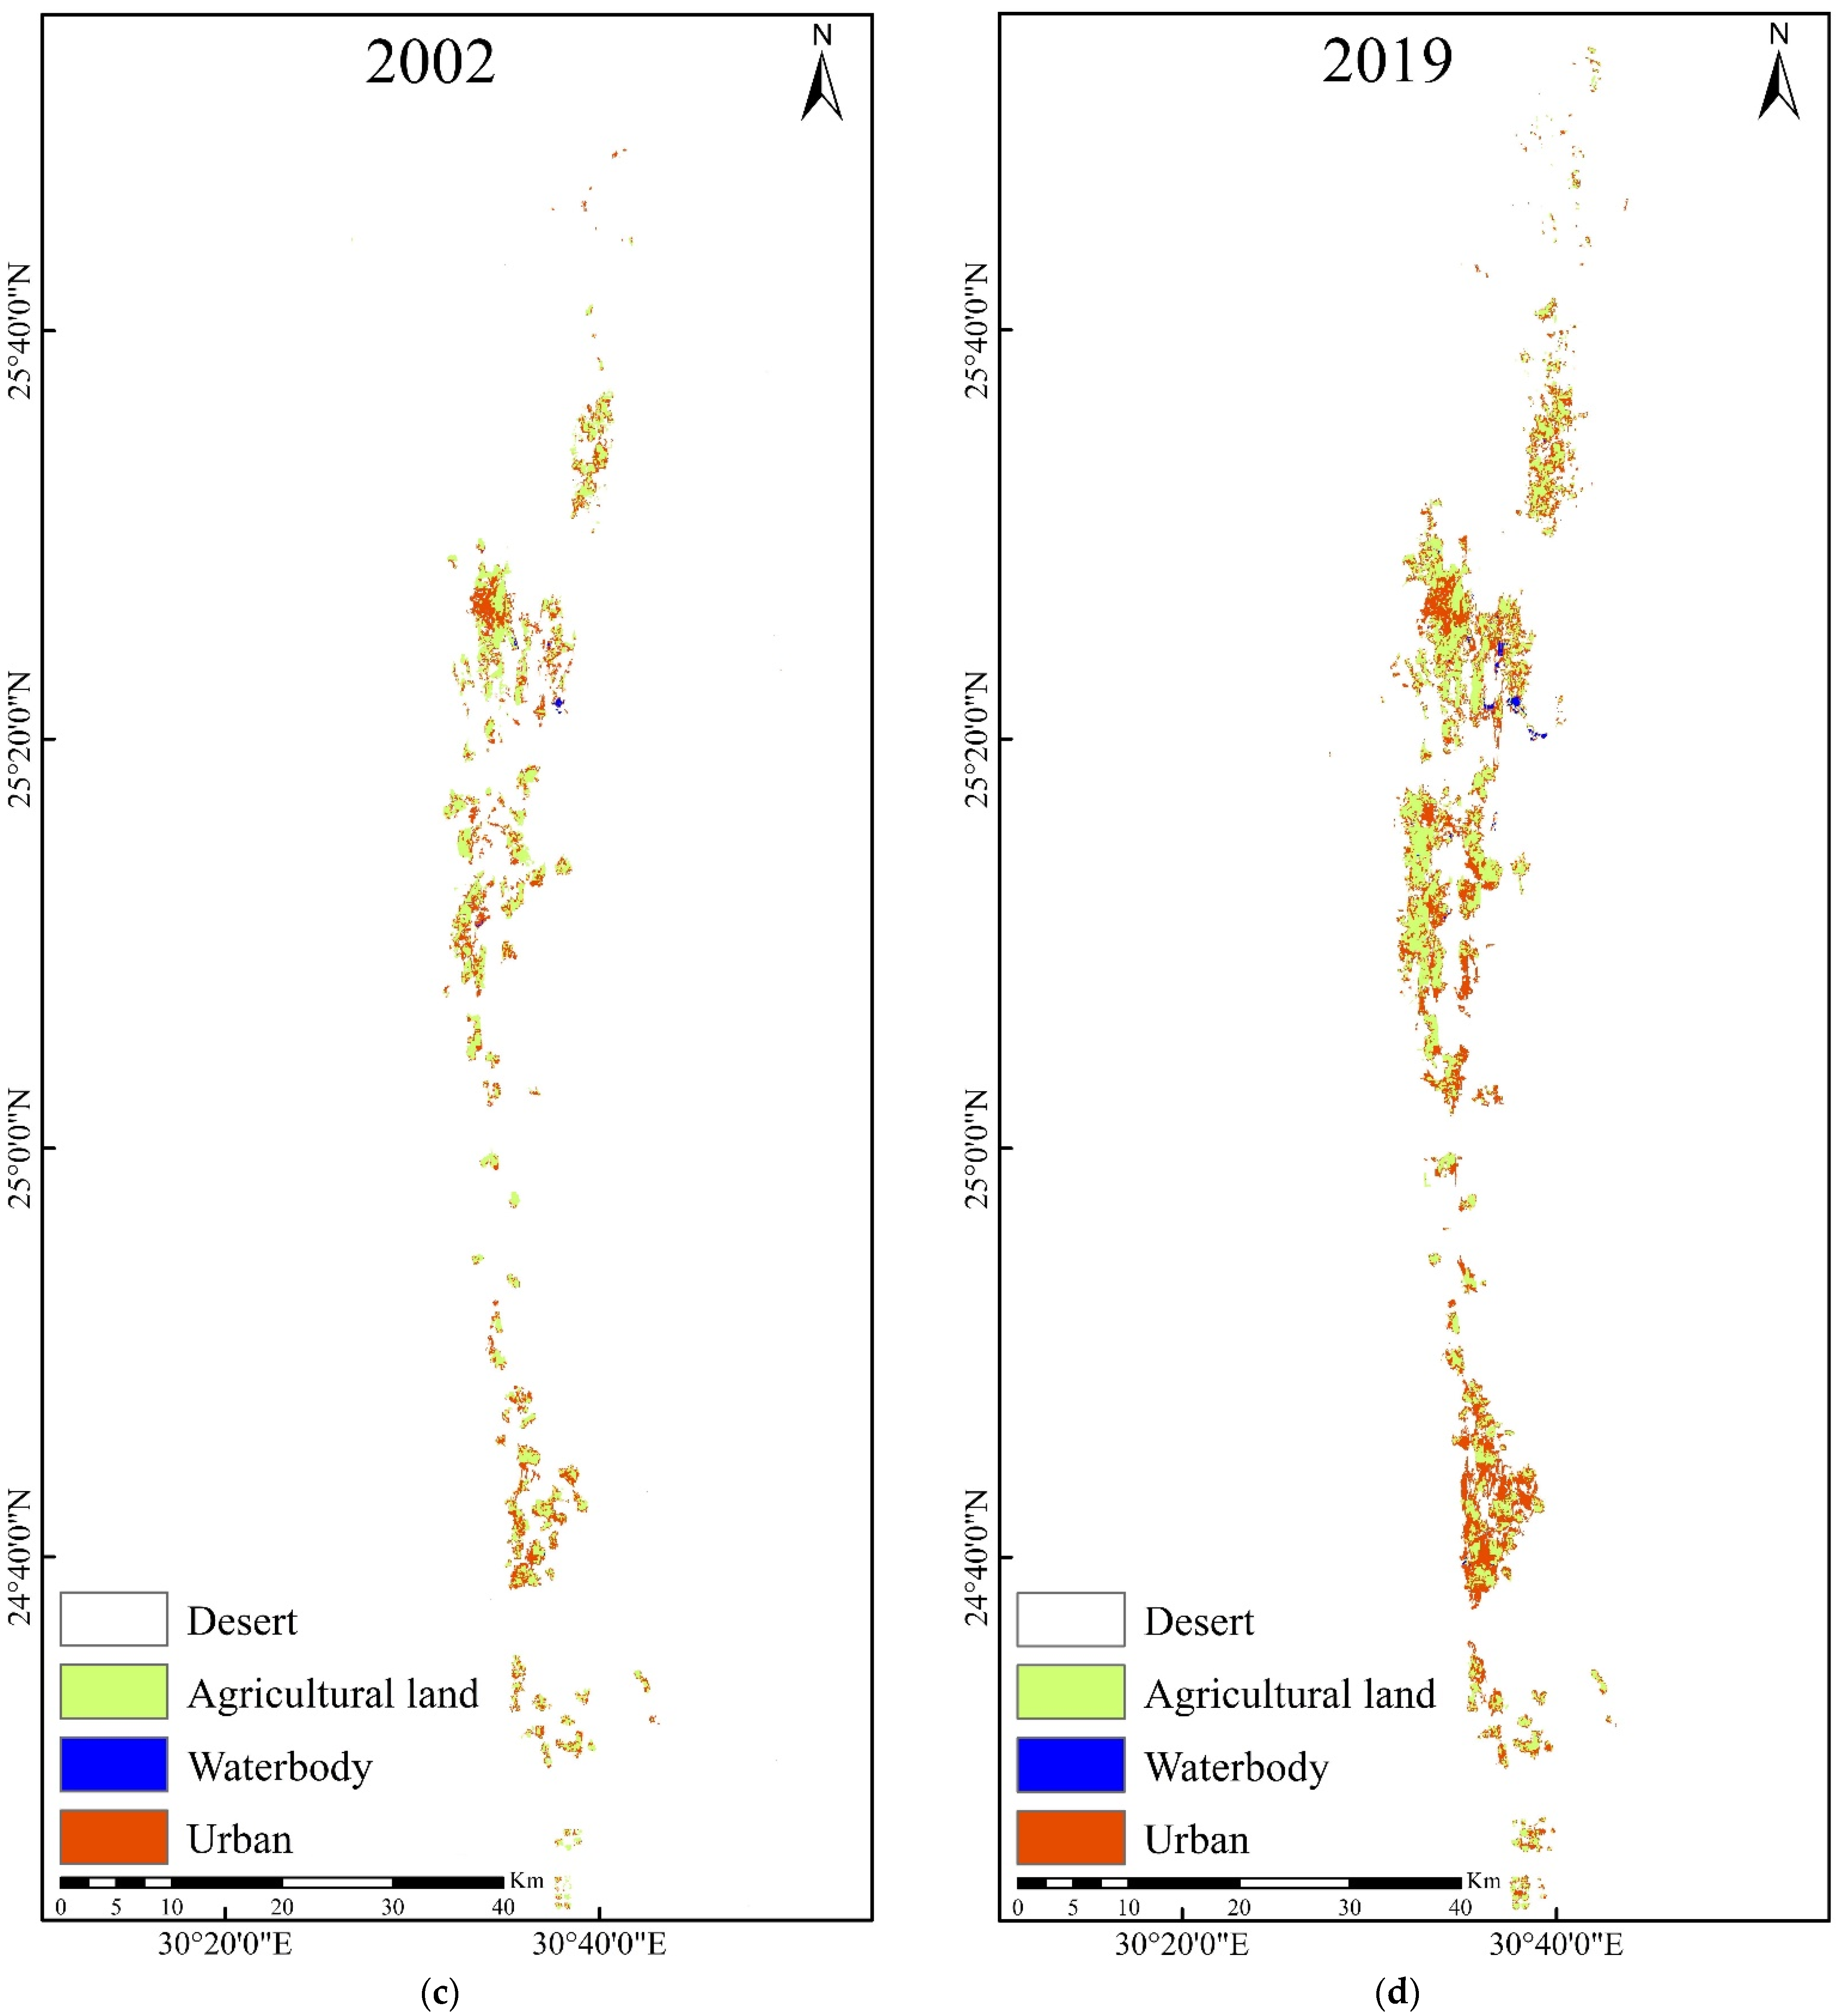
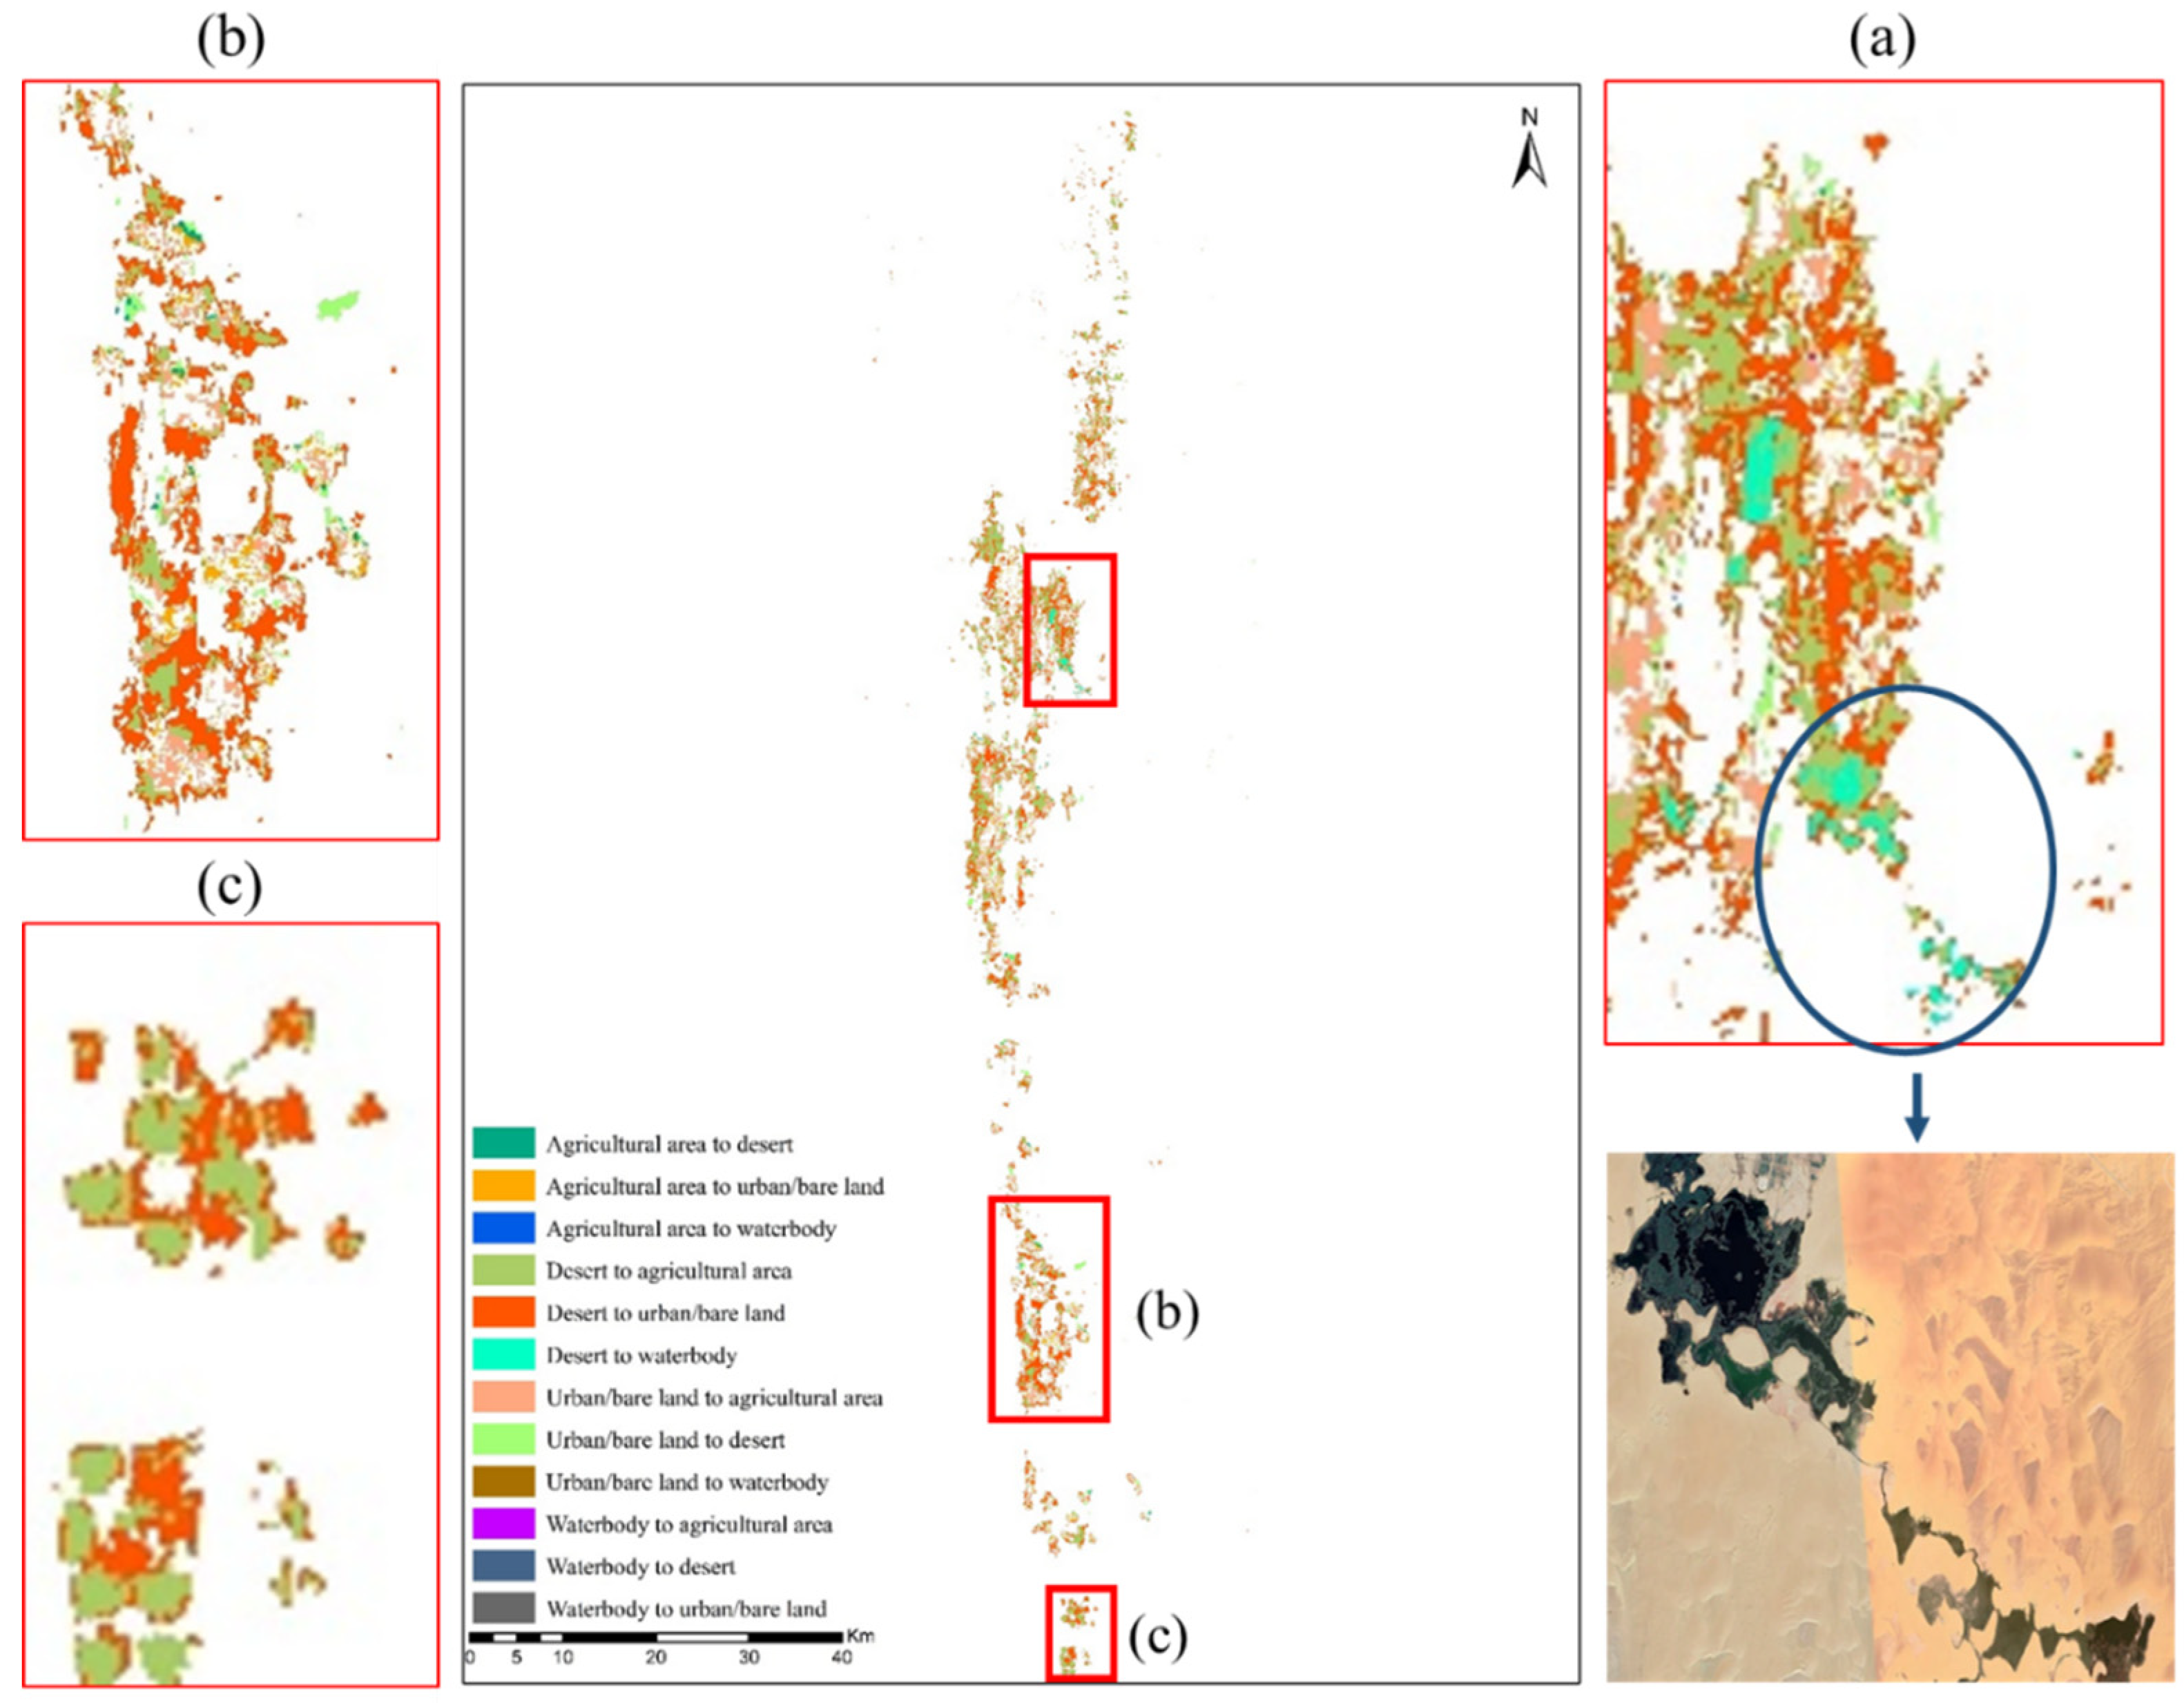
3.2.2. Kharga Oasis
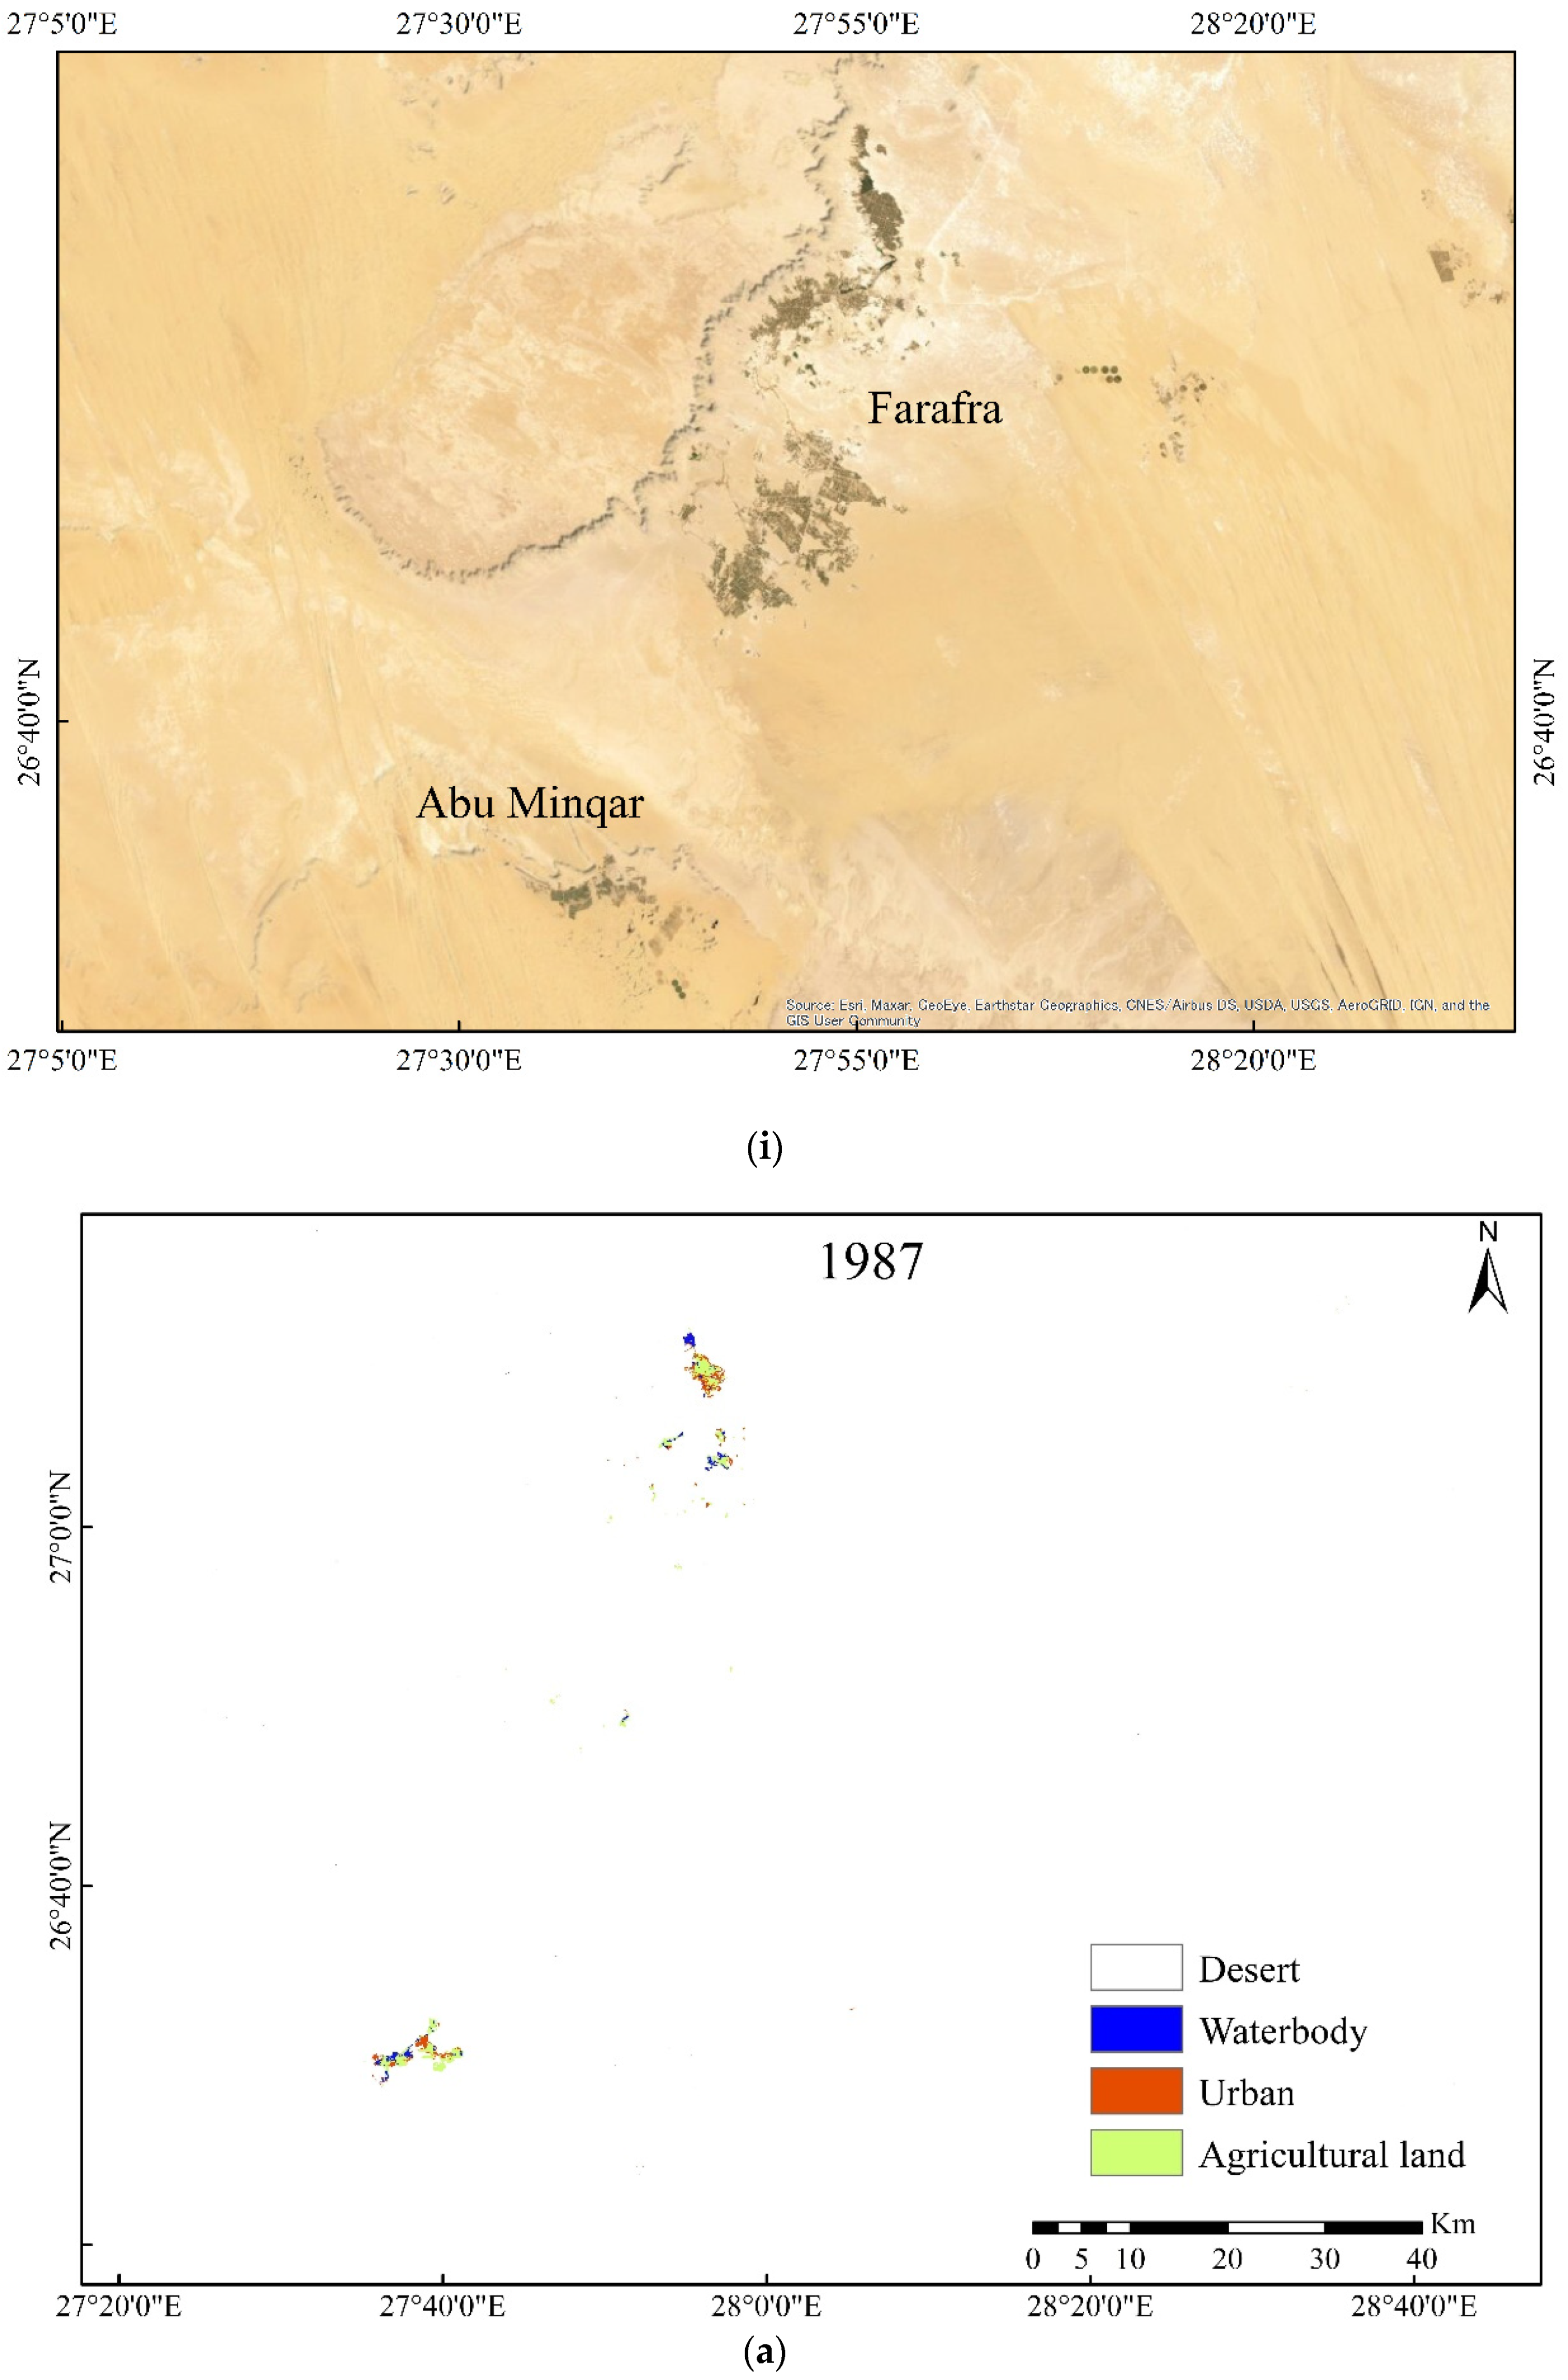
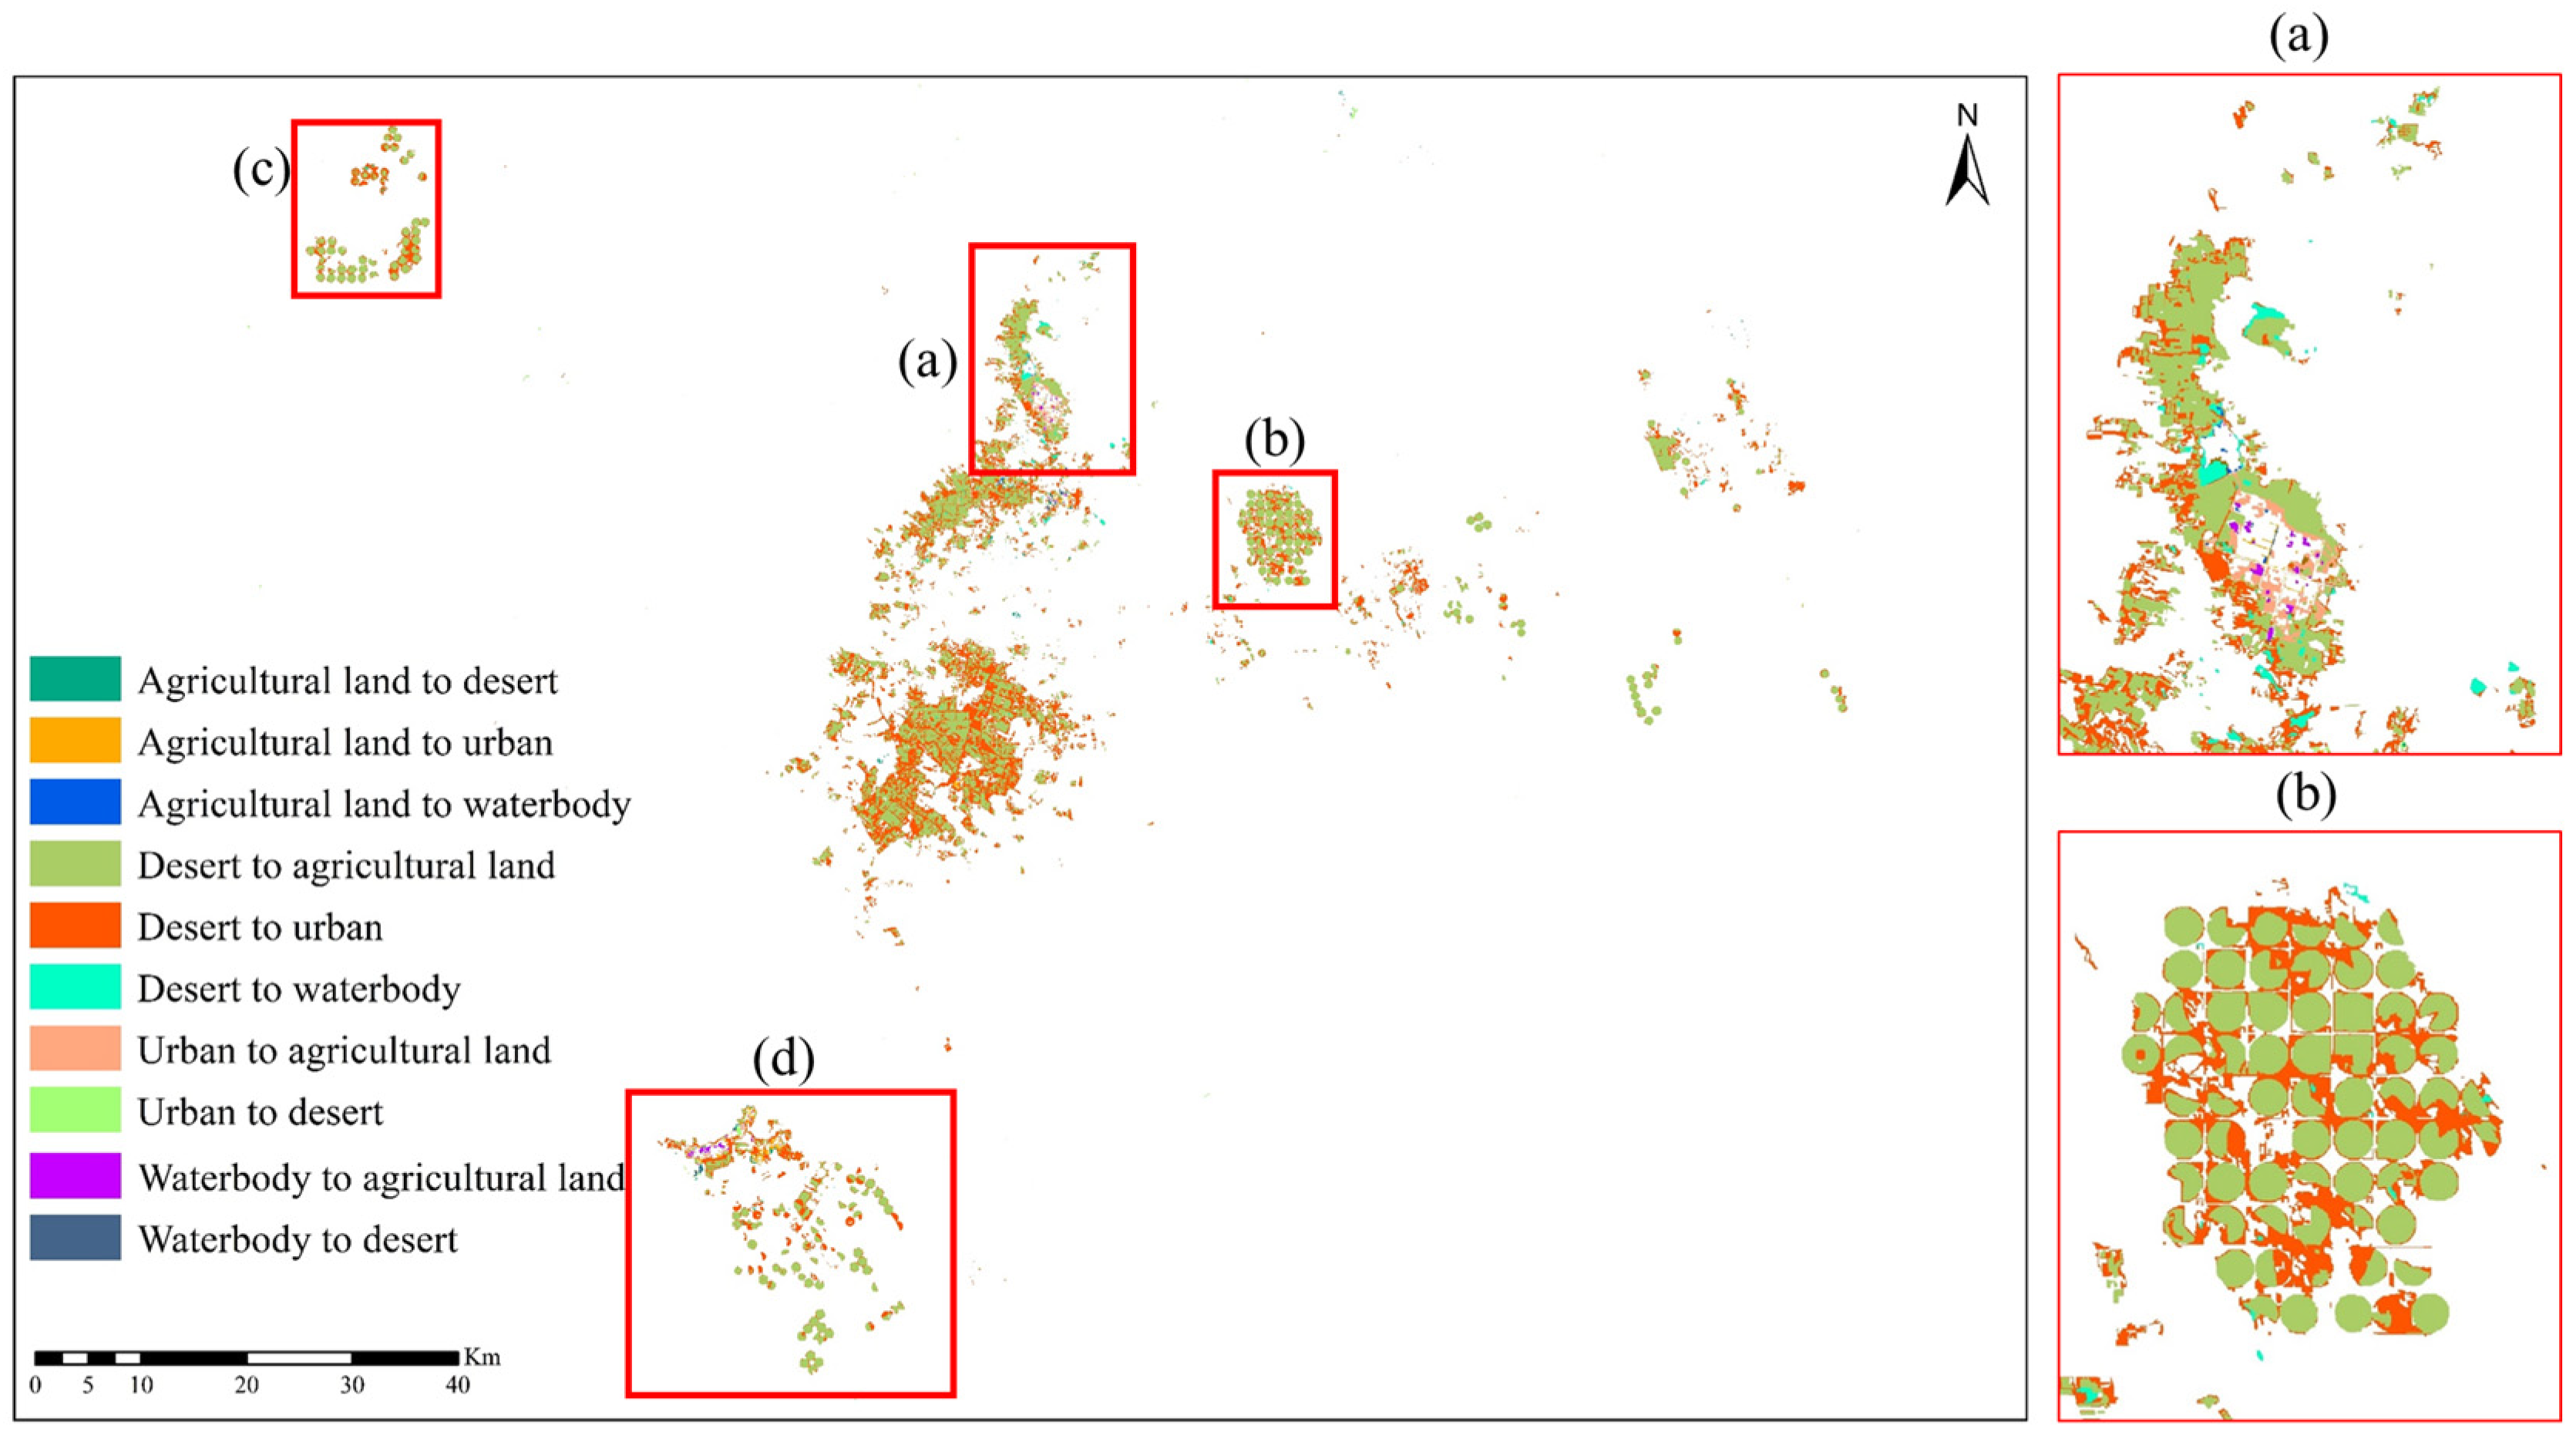
3.2.3. Farafra Oasis
3.3. Spatial Pattern Changes in LULC
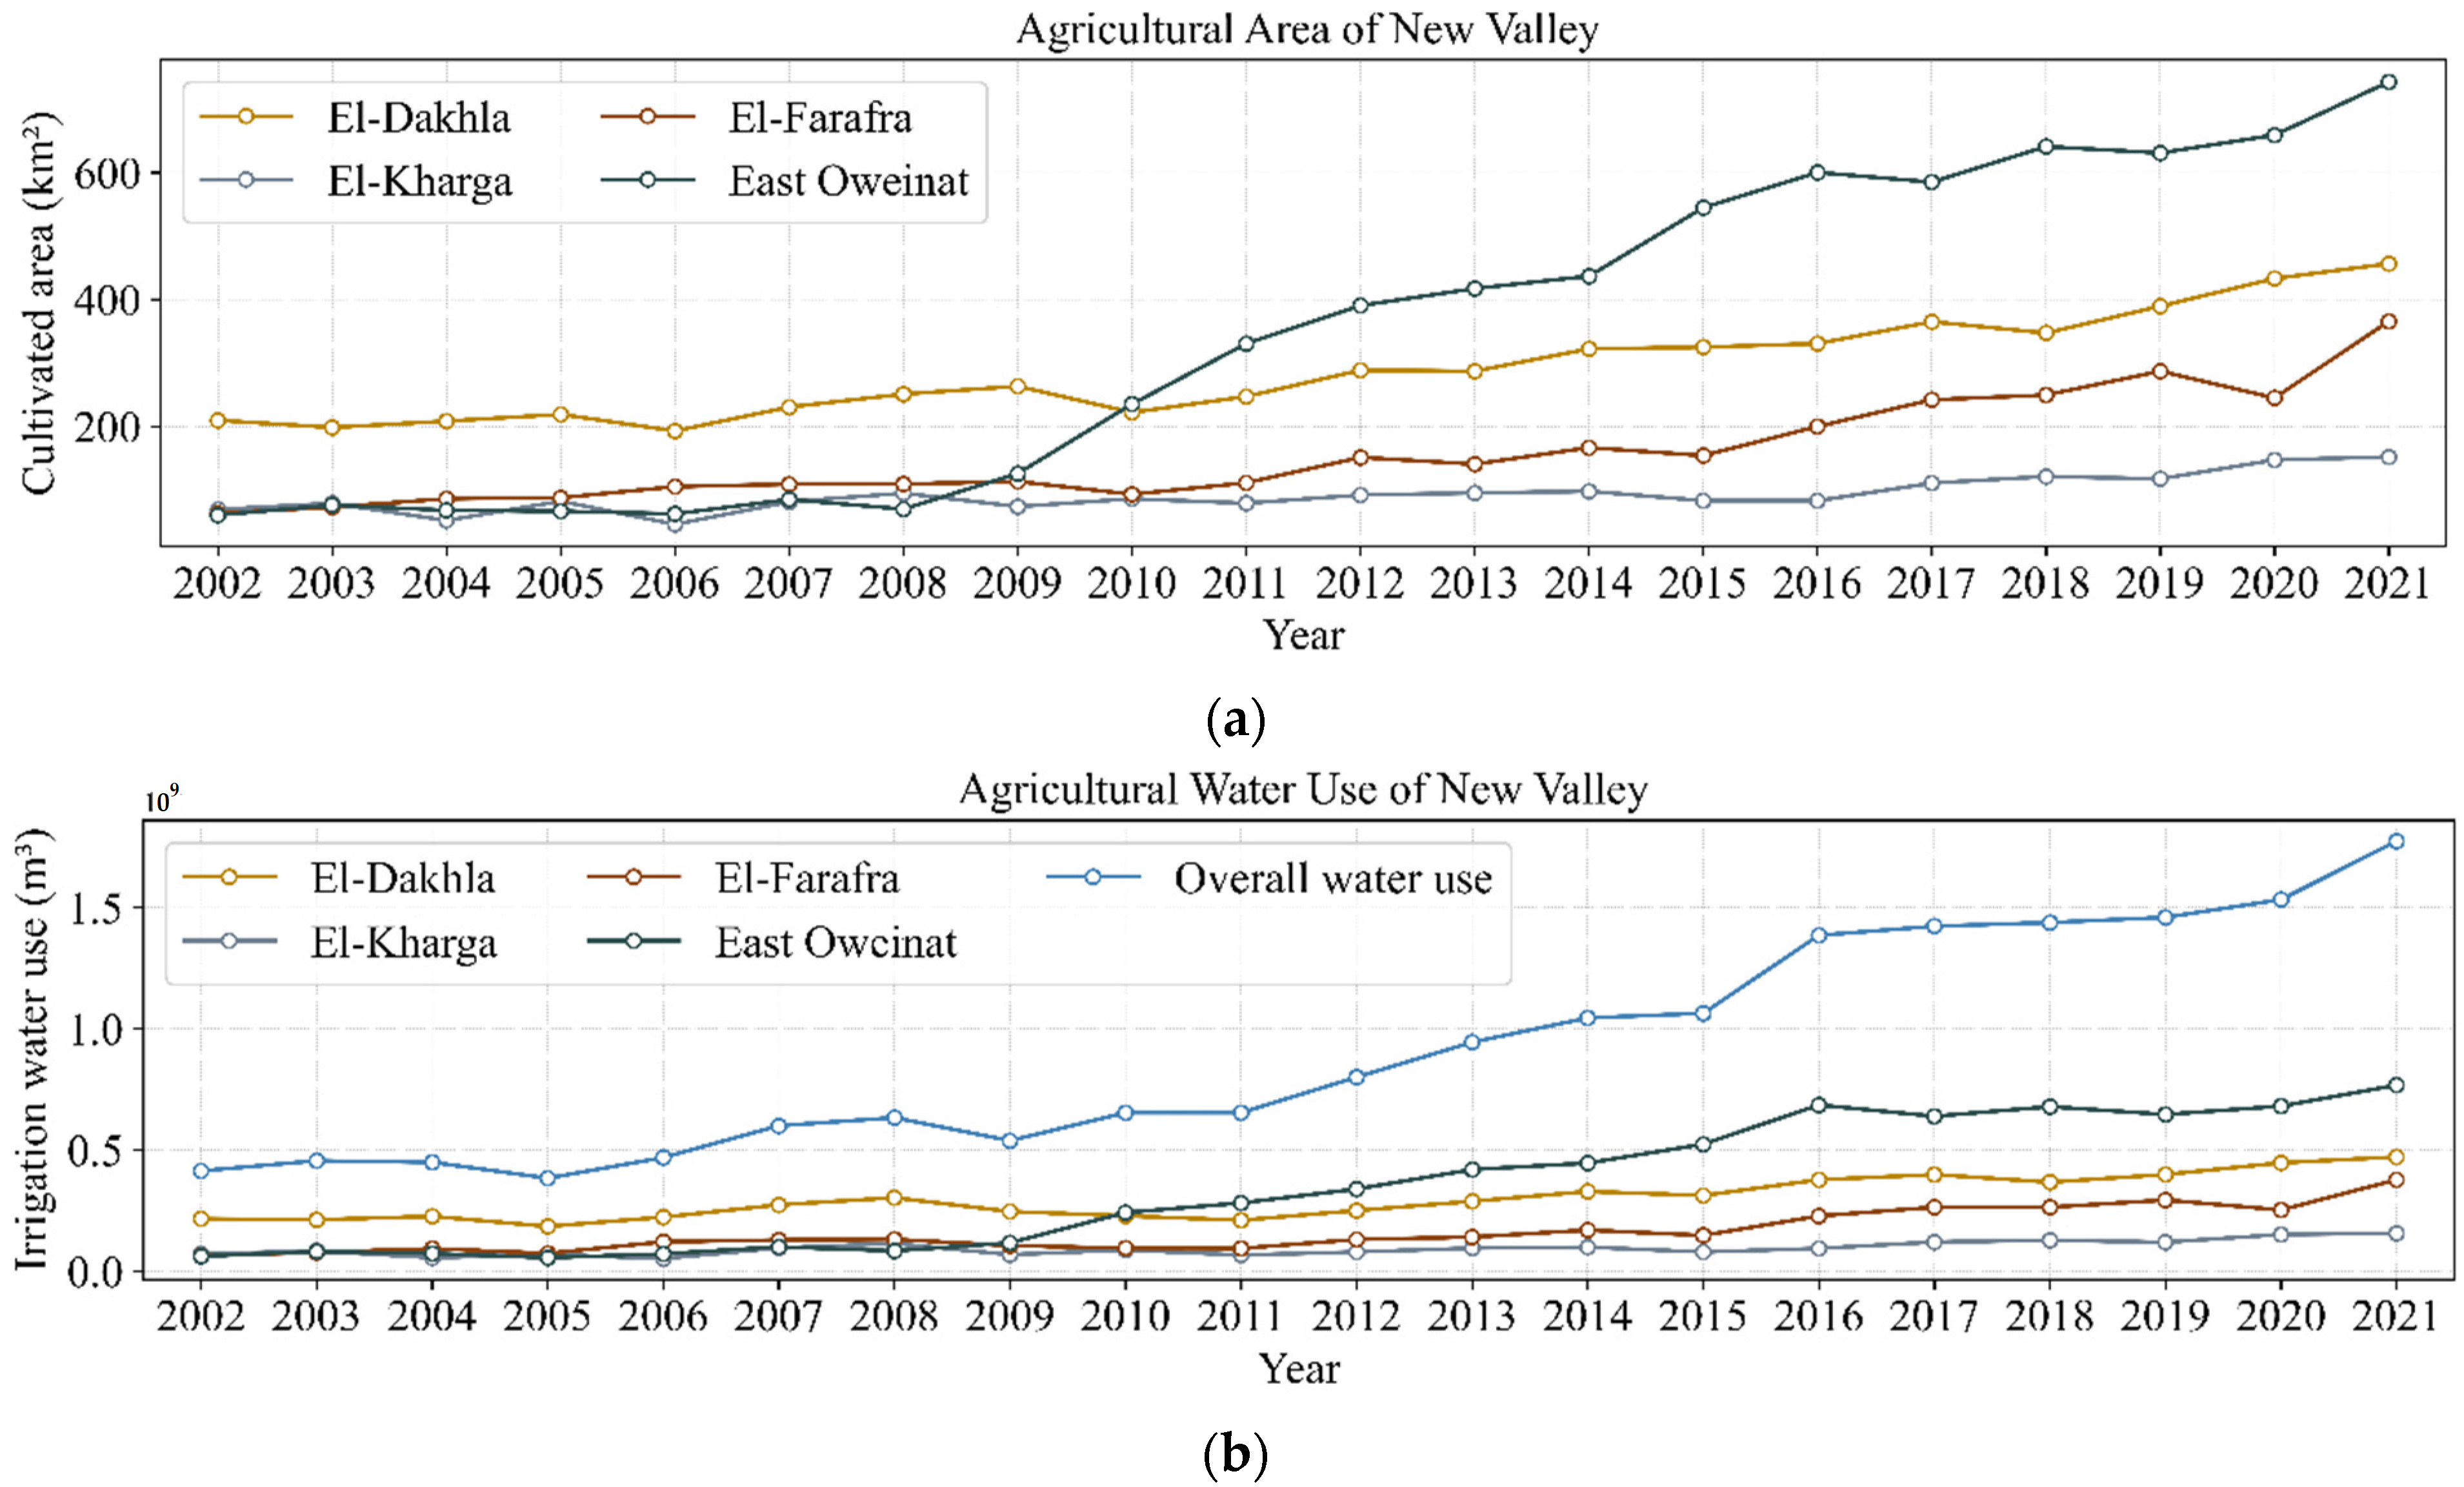
3.4. Water Usage Estimation of New Valley
3.4.1. Irrigation Water Usage Estimation
3.4.2. Domestic Water Usage Estimation
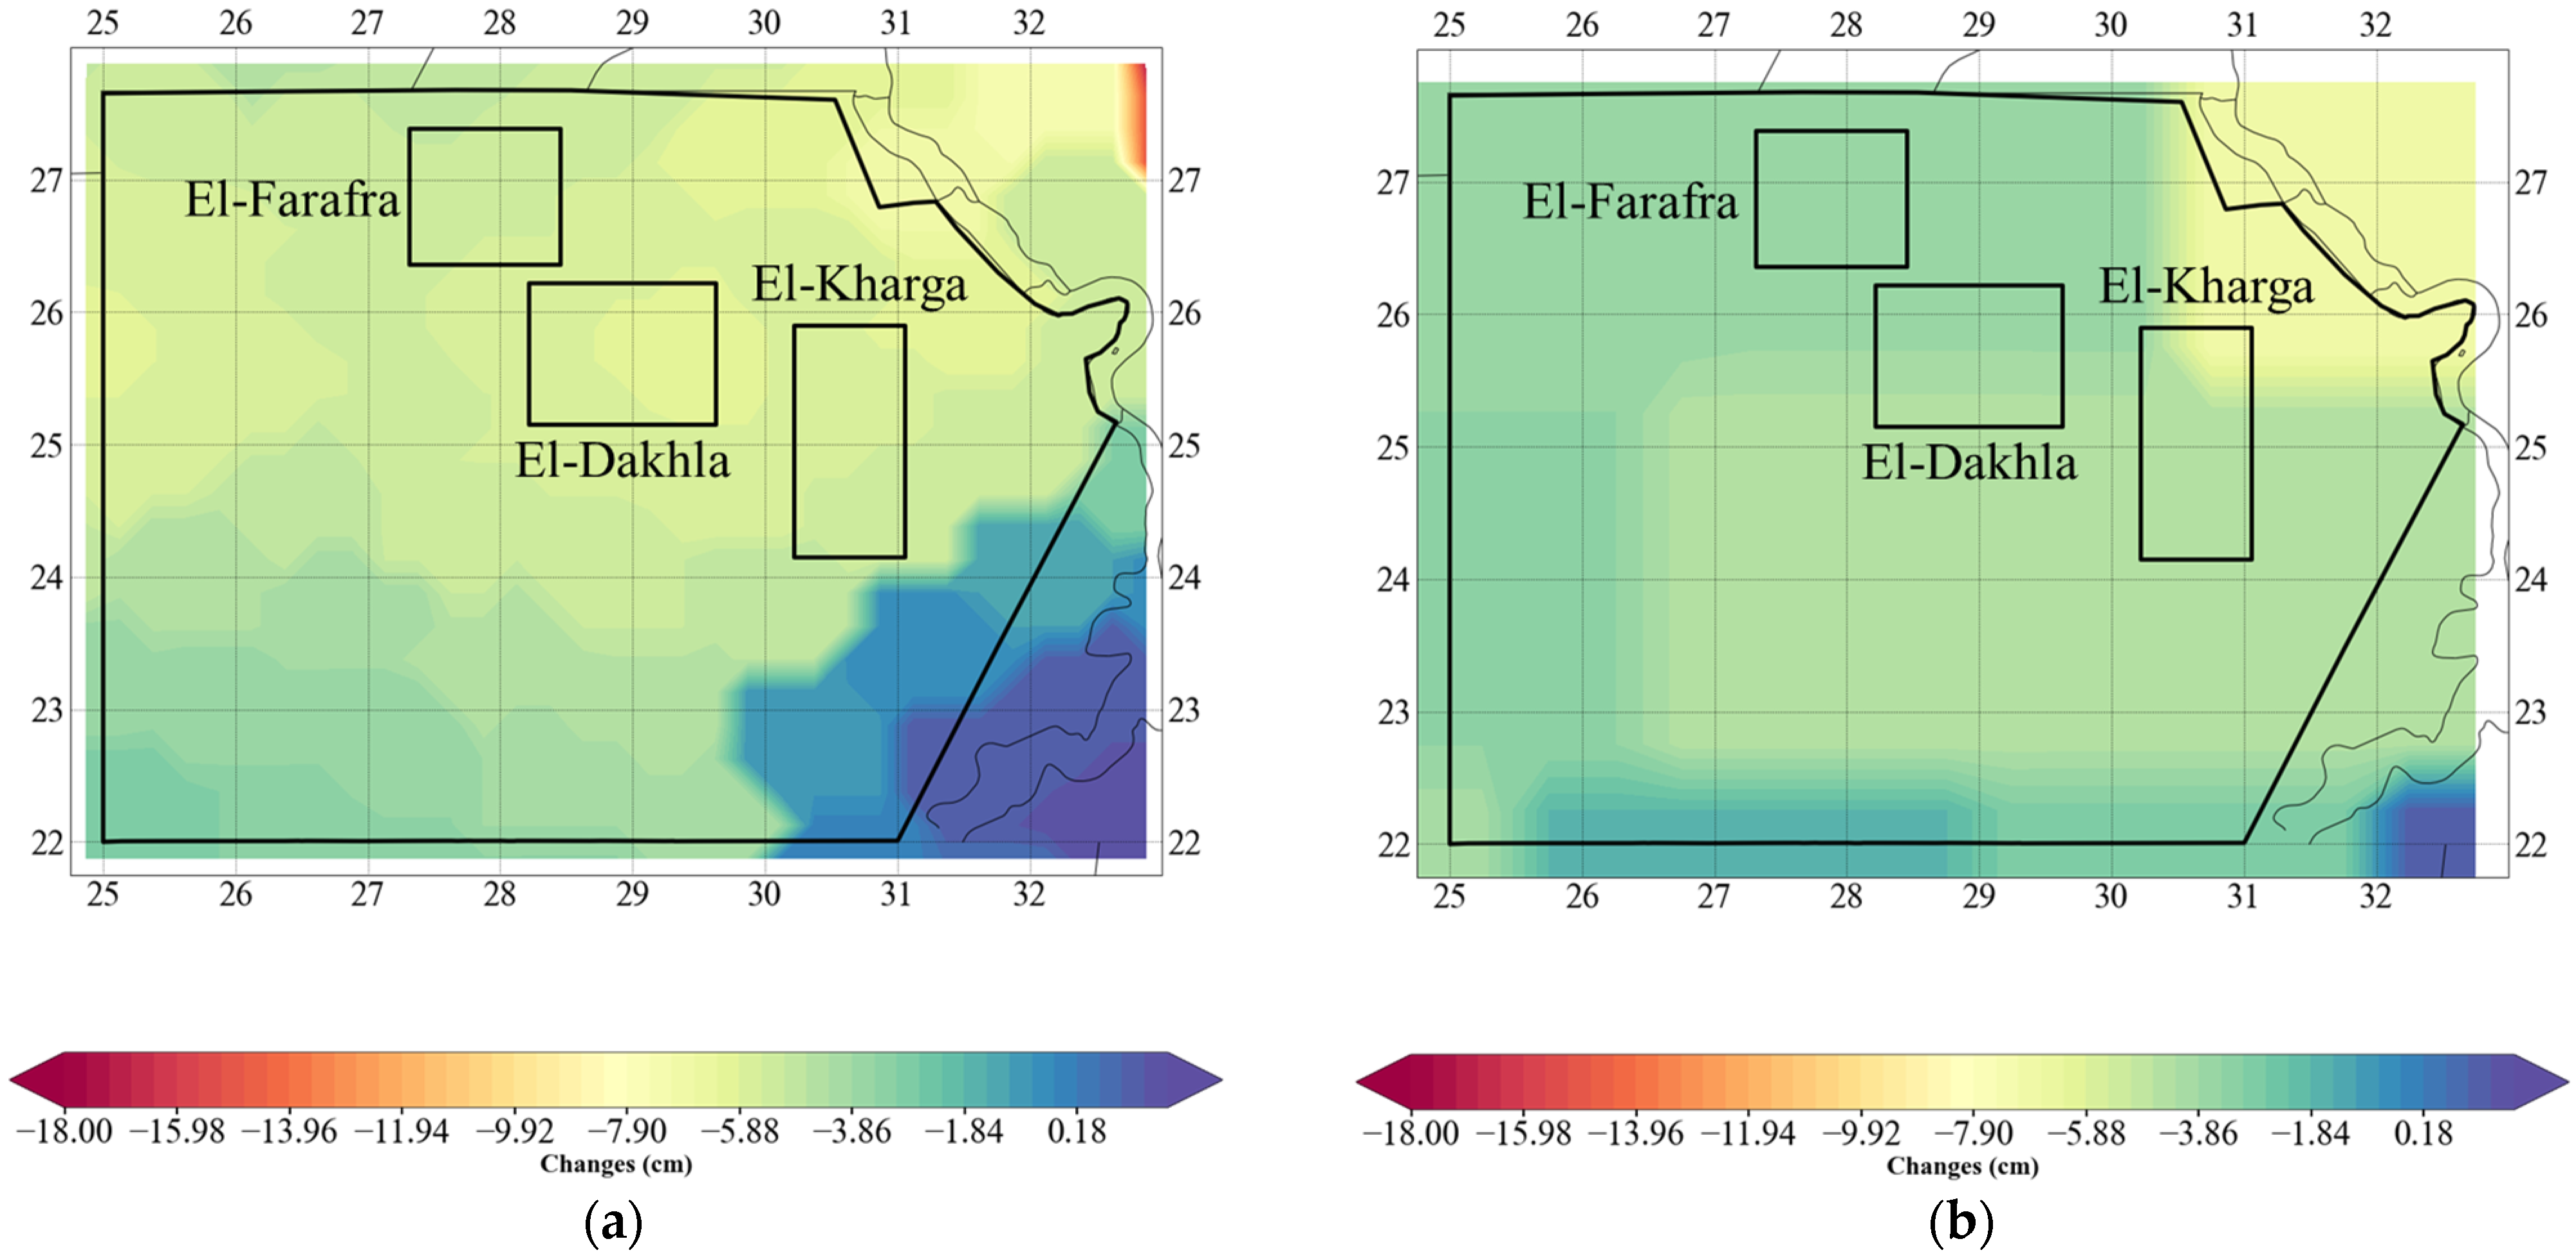
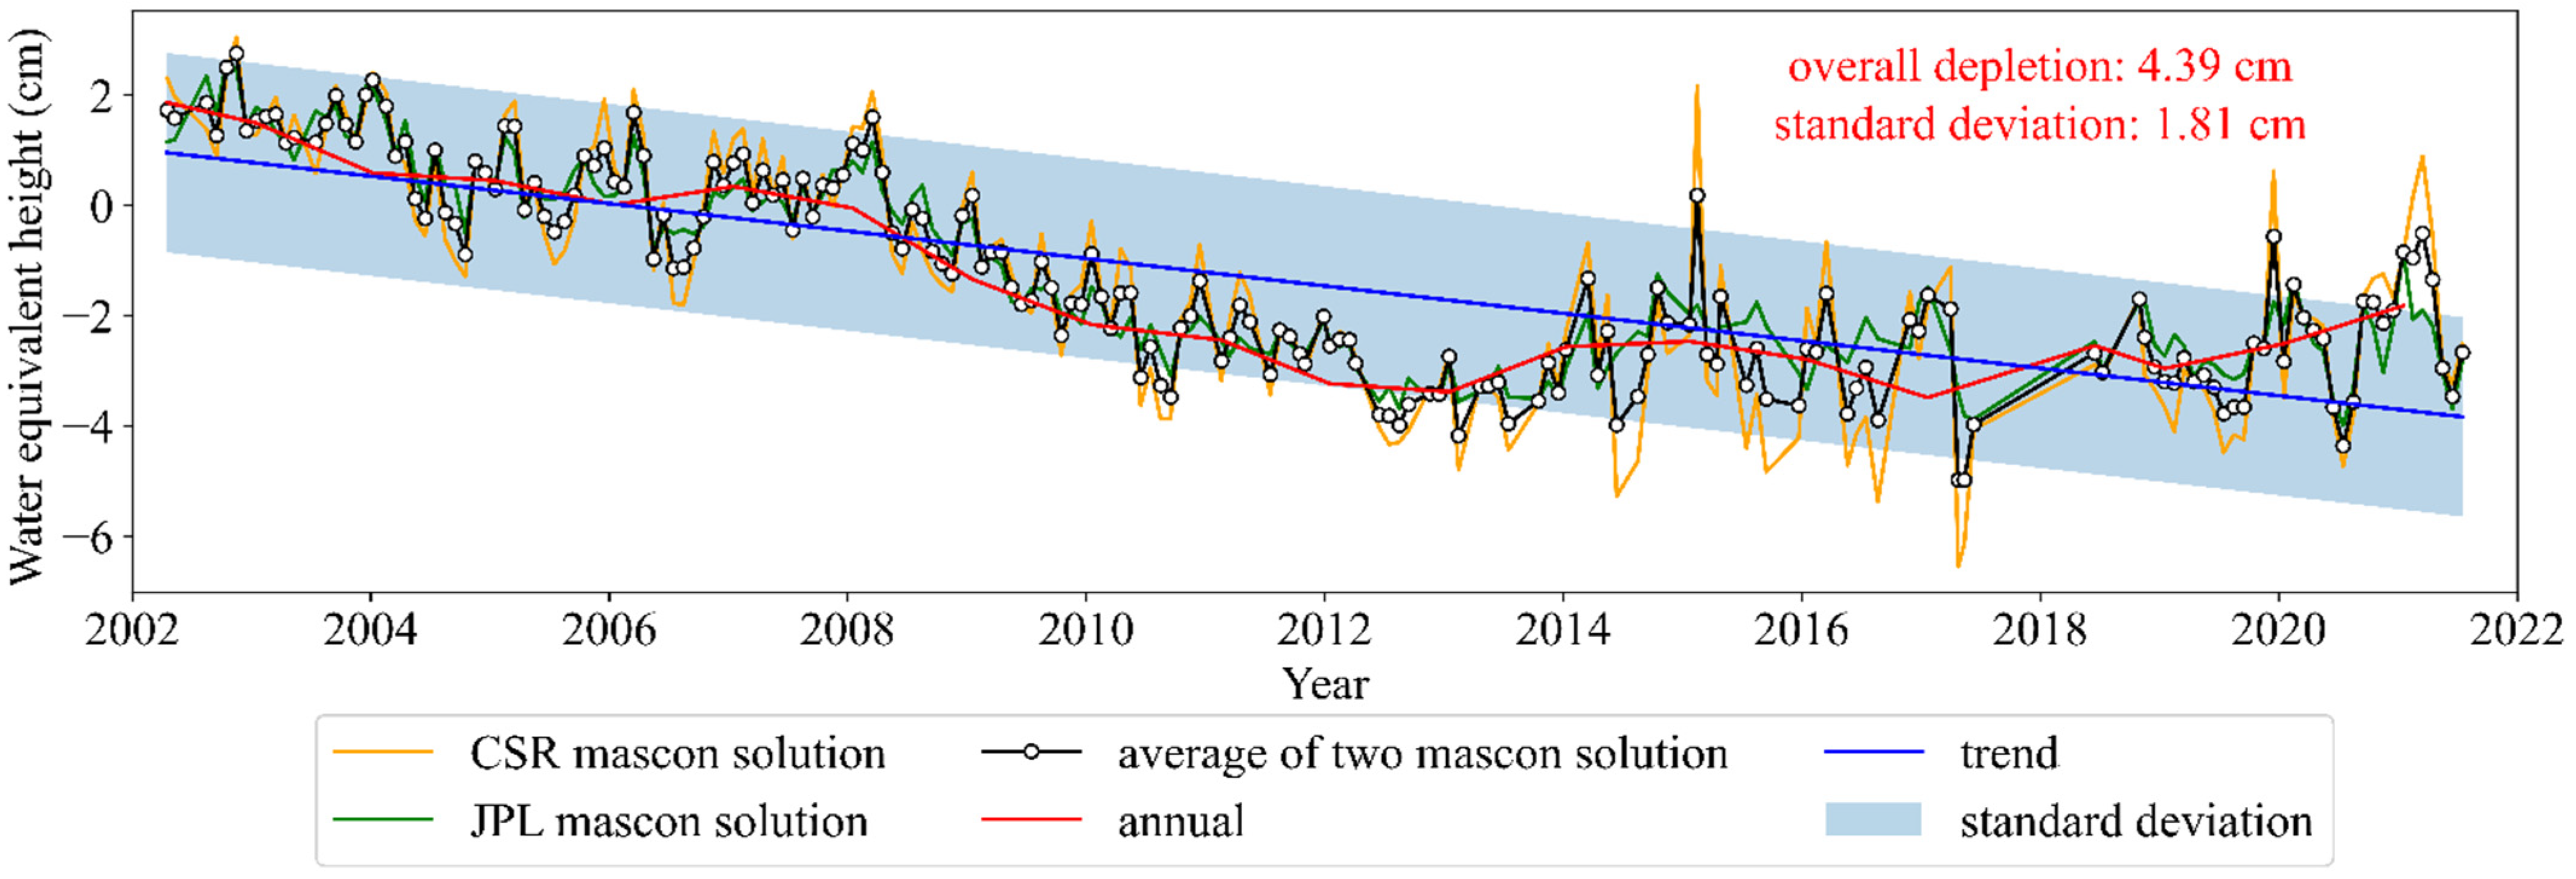
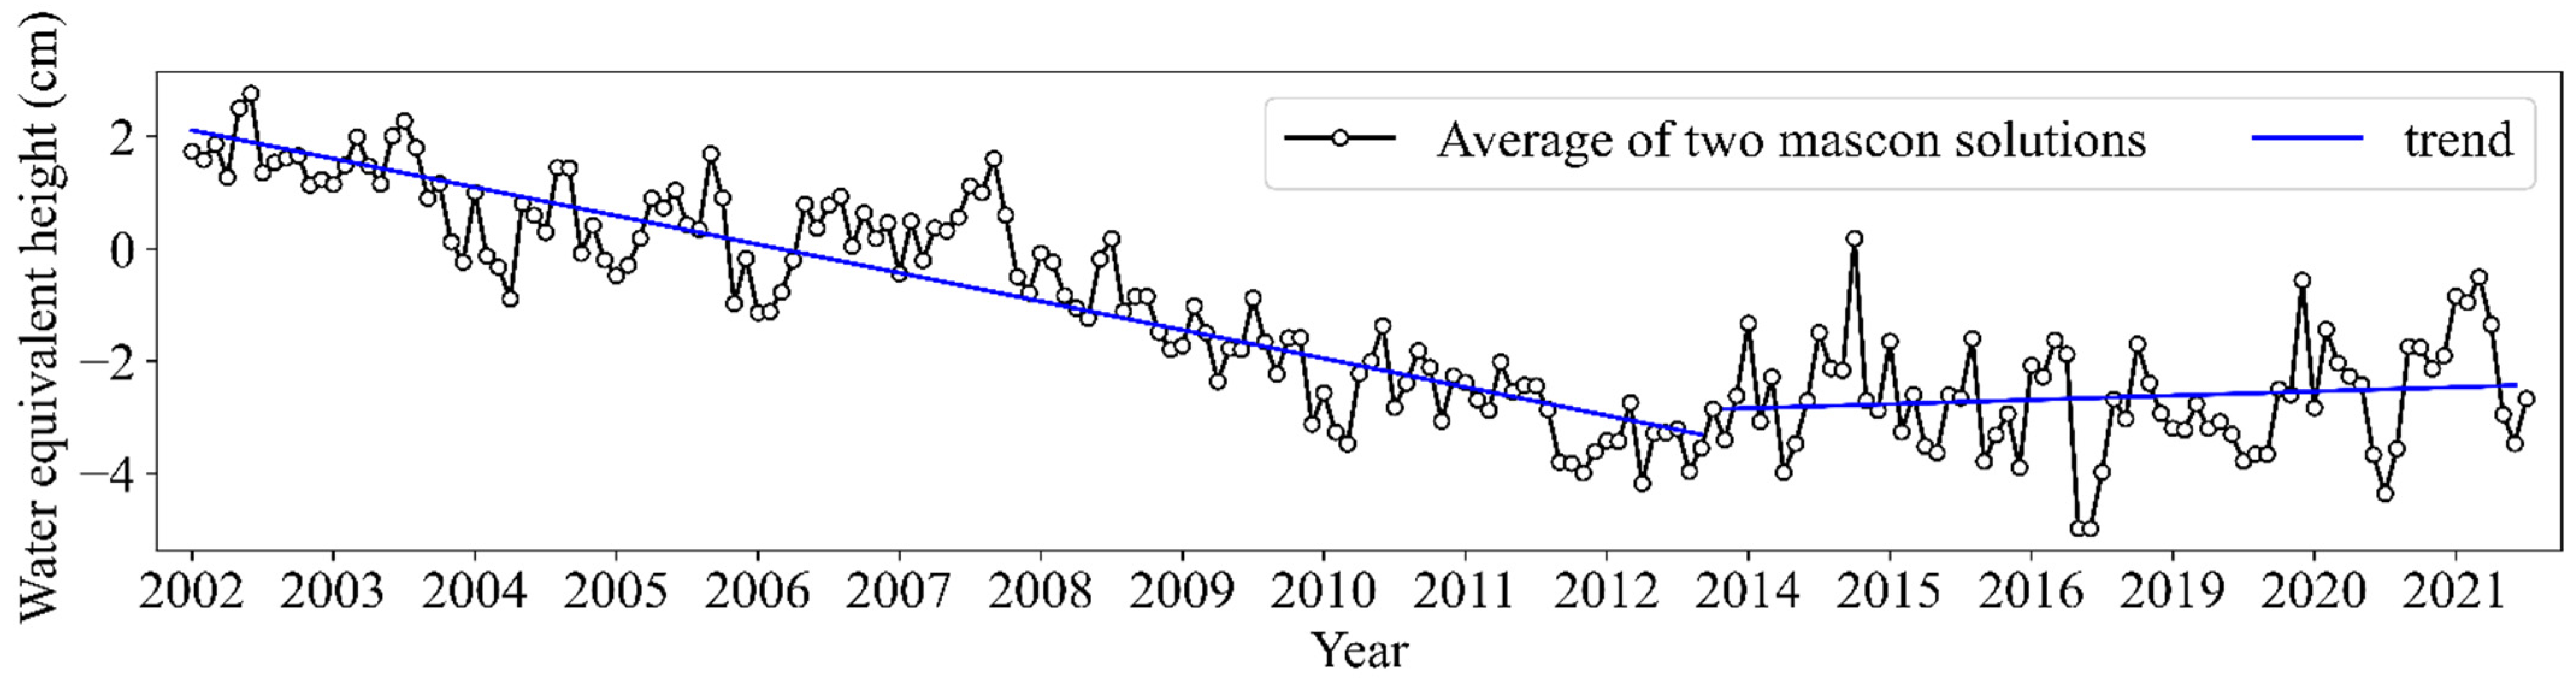
3.5. Extraction of Groundwater Changes
4. Discussion
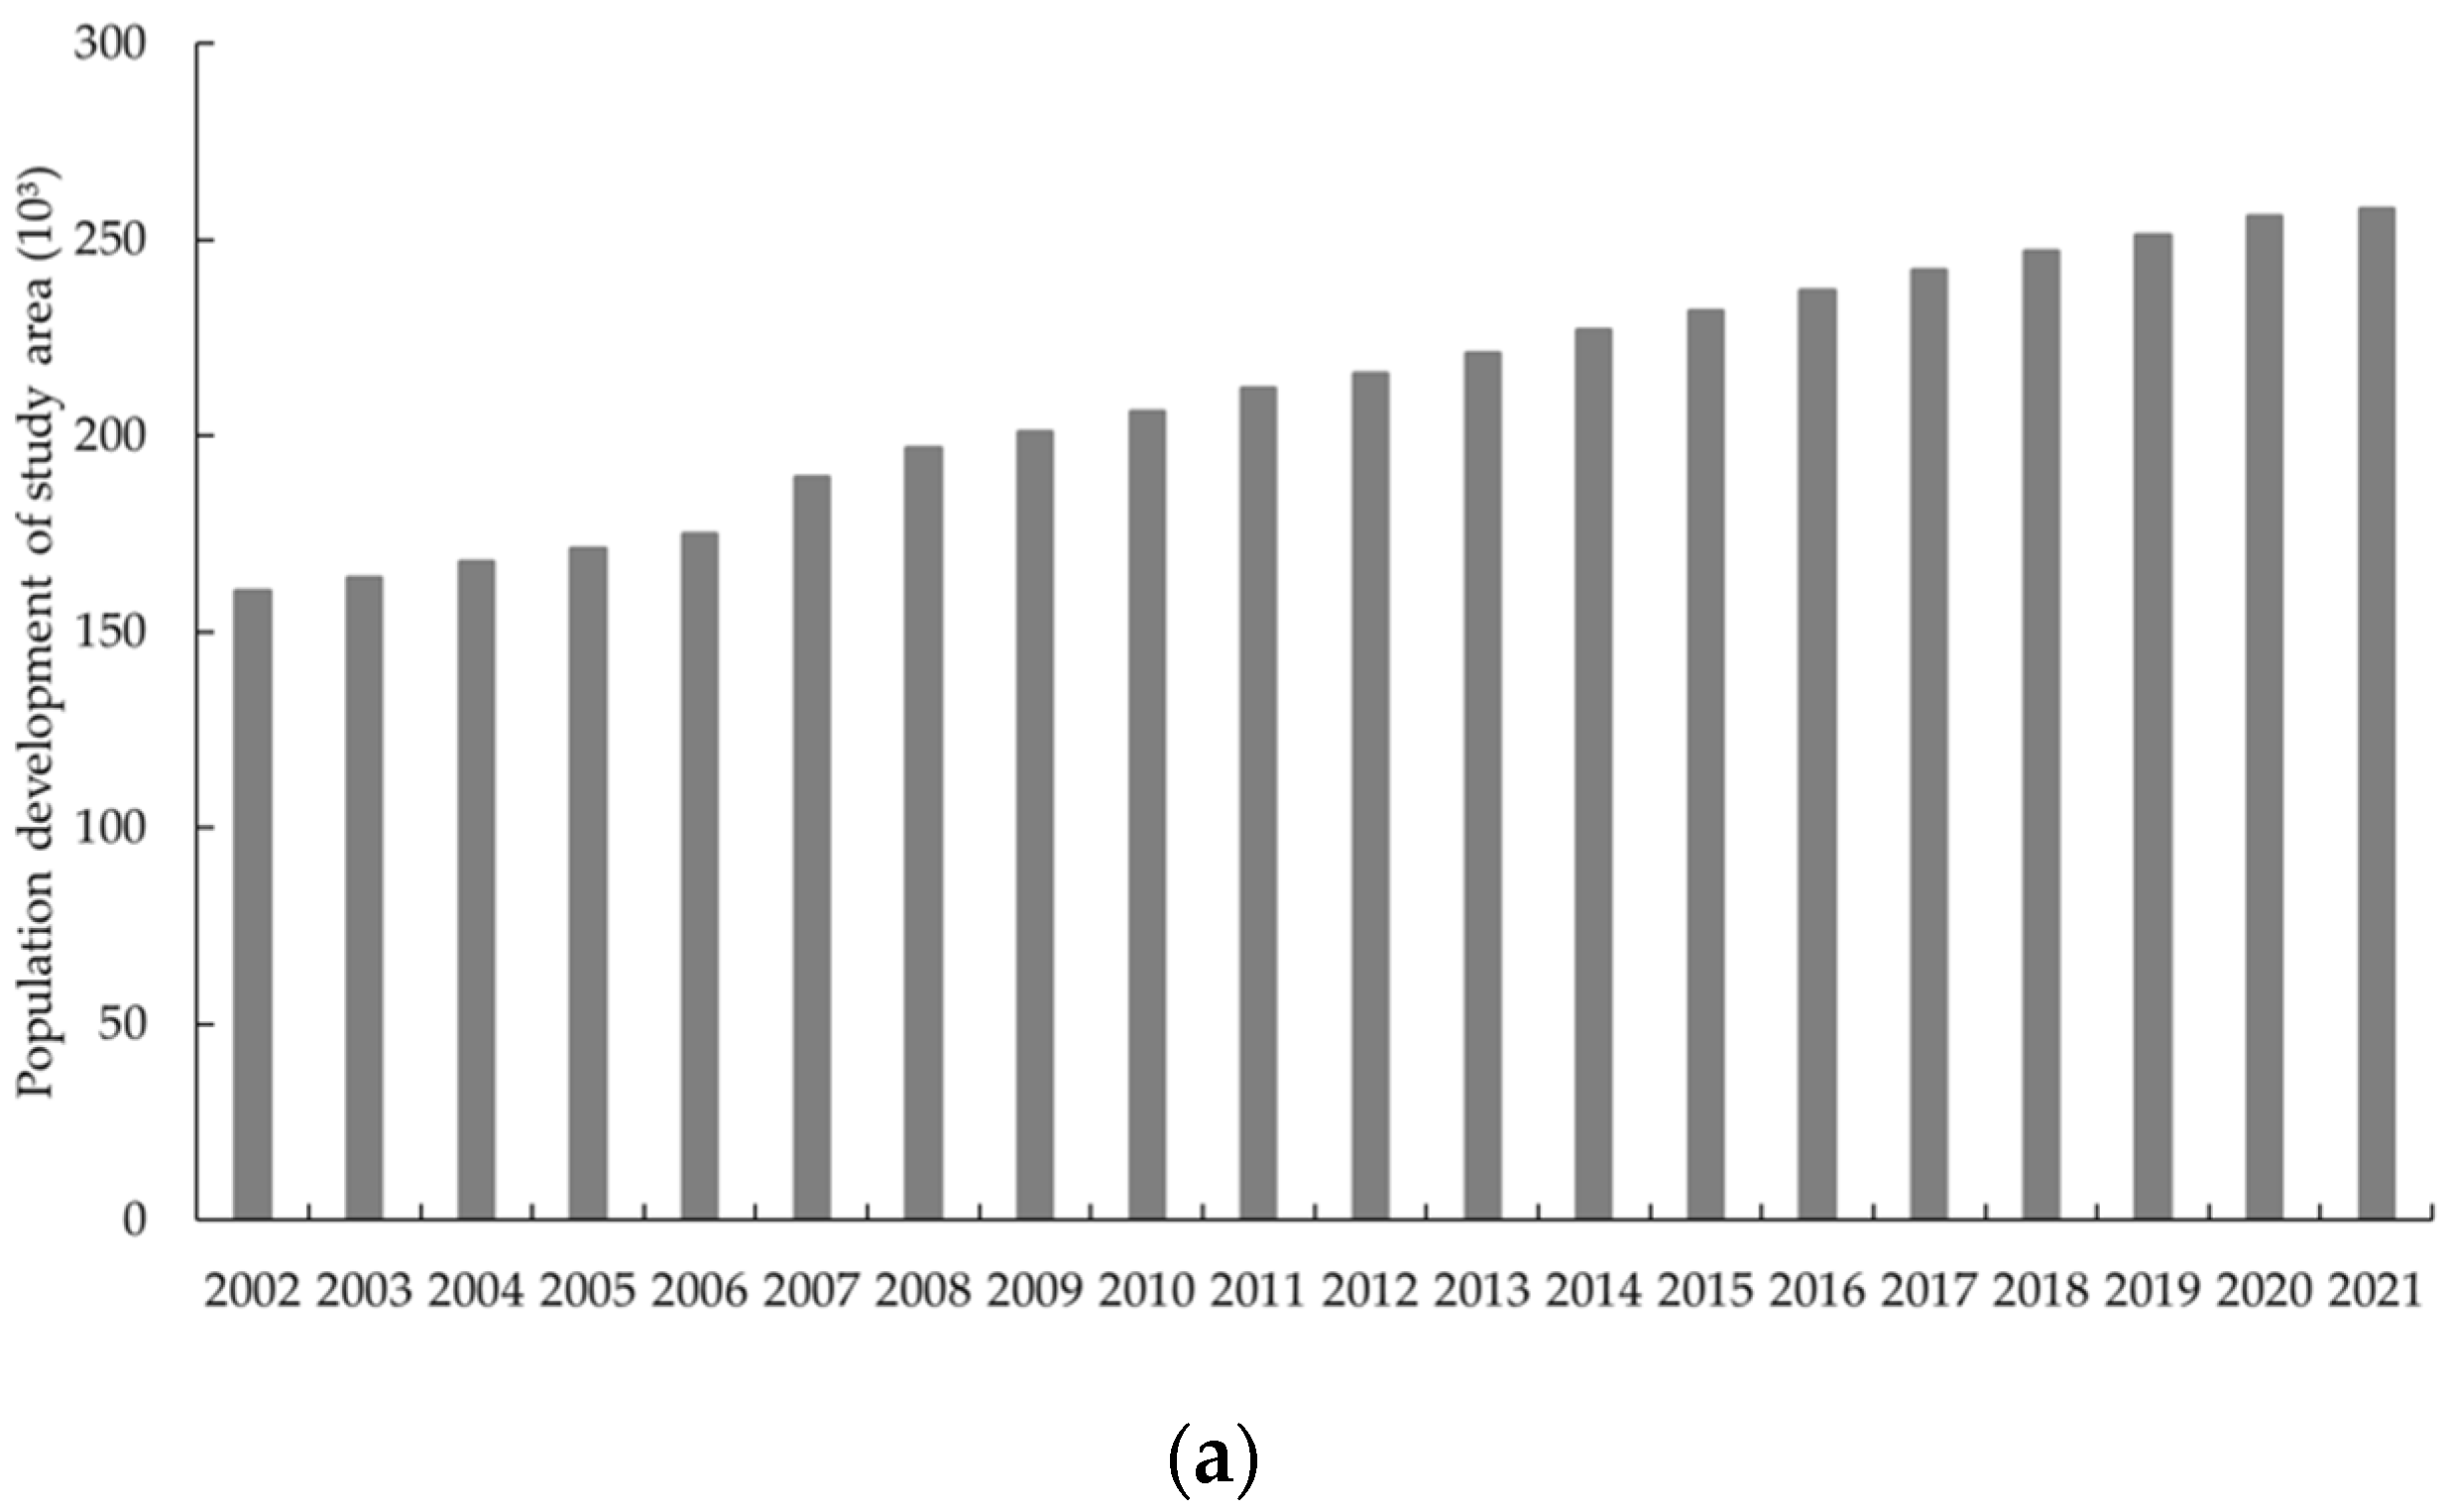
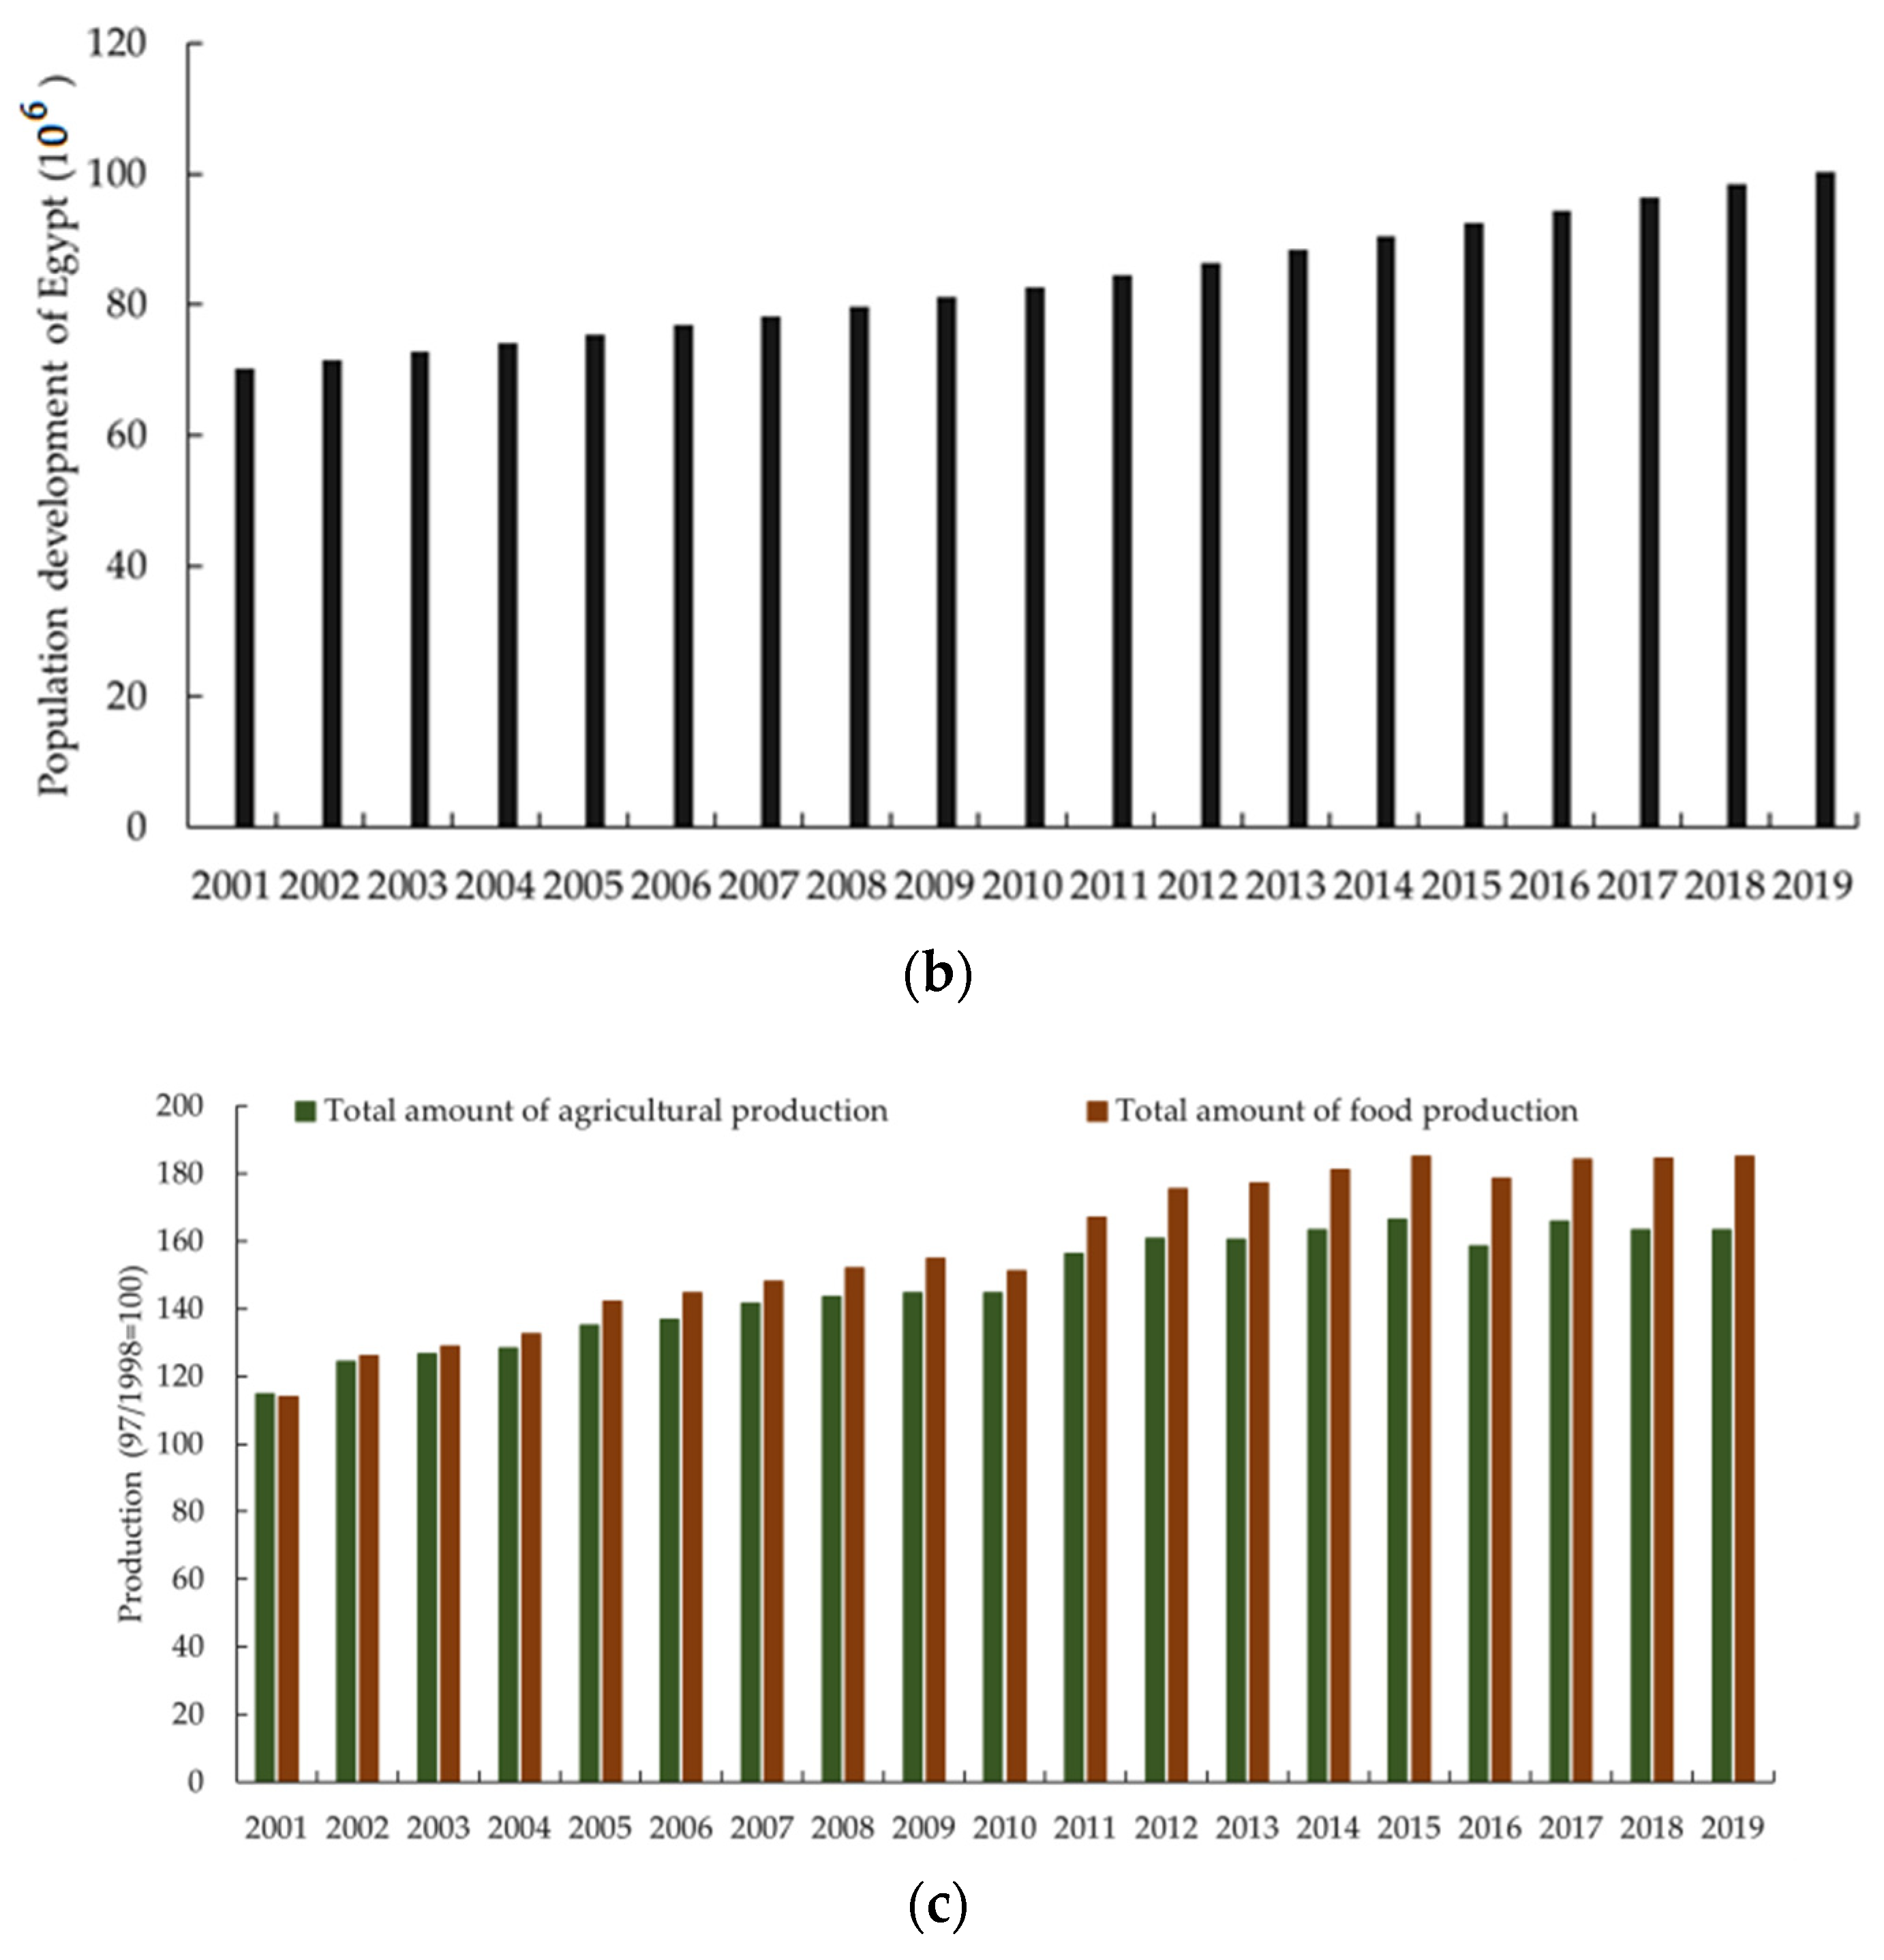
4.1. Population Growth and Production Changes
4.2. LULC Changes Analysis
4.3. Water Usage Analysis
5. Conclusions
Supplementary Materials
Author Contributions
Funding
Data Availability Statement
Conflicts of Interest
References
- Kato, H.; Iwasaki, E. Rashda: The Birth and Growth of an Egyptian Oasis Village; BRILL: Leiden, The Netherlands, 2016; ISBN 978-90-04-31739-0. [Google Scholar]
- Egypt Statistical Yearbook. 2004. Available online: https://www.capmas.gov.eg/Pages/Publications.aspx?page_id=5104&YearID=23543&Year=23567 (accessed on 1 March 2022).
- Egypt Statistical Yearbook. 2021. Available online: https://www.capmas.gov.eg/Pages/StaticPages.aspx?page_id=5034 (accessed on 1 March 2022).
- Population Growth (Annual %)|Data. Available online: https://data.worldbank.org/indicator/SP.POP.GROW (accessed on 1 March 2022).
- AbouKorin, A. Sustainability Requirements of Desert Development in Egypt: The Case of New Valley Region. Minia J. Eng. Technol. (MJET) 2002, 1, 1–12. [Google Scholar]
- New Valley: Profile; IDSC Information and Decision Support Centre: Cairo, Egypt, 1997.
- Nour, S.E. Grabbing from below: A Study of Land Reclamation in Egypt. Rev. Afr. Political Econ. 2019, 46, 549–566. [Google Scholar] [CrossRef]
- Ozdogan, M.; Yang, Y.; Allez, G.; Cervantes, C. Remote Sensing of Irrigated Agriculture: Opportunities and Challenges. Remote Sens. 2010, 2, 2274–2304. [Google Scholar] [CrossRef] [Green Version]
- Transboundary Aquifers of the World. 2015. Available online: http://ihp-wins.unesco.org/layers/tba_map2015:geonode:tba_map2015 (accessed on 4 February 2022).
- Watanabe, M.; Sugimura, T.; Kamei, H. Interpretation of Characteristics of the Land Use Change Based on Chronological Satellite Imageries of Kharga Oasis, Western Desert, Egypt. J. Remote Sens. Soc. Jpn. 2014, 34, 356–366. [Google Scholar] [CrossRef]
- Ahmed, M.; Abdelmohsen, K. Quantifying Modern Recharge and Depletion Rates of the Nubian Aquifer in Egypt. Surv. Geophys. 2018, 39, 729–751. [Google Scholar] [CrossRef]
- KATO, H.; Elbeih, S.; Iwasaki, E.; Sefelnasr, A.; Shalaby, A.; Zaghloul, E. The Relationship between Groundwater, Landuse, and Demography in Dakhla Oasis, Egypt. E-J. Asian Netw. GIS-Based Hist. Stud. 2014, 2, 3–10. [Google Scholar]
- Shalaby, A.; Khedr, H.S. Remote Sensing and GIS for Land Use/Land Cover Change Detection in Dakhla Oasis. In Sustainable Water Solutions in the Western Desert, Egypt: Dakhla Oasis; Iwasaki, E., Negm, A.M., Elbeih, S.F., Eds.; Earth and Environmental Sciences Library; Springer International Publishing: Cham, Switzerland, 2021; pp. 145–159. ISBN 978-3-030-64005-7. [Google Scholar]
- Iwasaki, E.; Shalaby, A.; Elbeih, S.F.; Khedr, H.S. Development of Land Use and Groundwater in Rashda Village (Dakhla Oasis), 1960s–2018. In Sustainable Water Solutions in the Western Desert, Egypt: Dakhla Oasis; Iwasaki, E., Negm, A.M., Elbeih, S.F., Eds.; Earth and Environmental Sciences Library; Springer International Publishing: Cham, Switzerland, 2021; pp. 219–240. ISBN 978-3-030-64005-7. [Google Scholar]
- Kato, H.; Kimura, R.; Elbeih, S.F.; Iwasaki, E.; Zaghloul, E.A. Land Use Change and Crop Rotation Analysis of a Government Well District in Rashda Village – Dakhla Oasis, Egypt Based on Satellite Data. Egypt. J. Remote Sens. Space Sci. 2012, 15, 185–195. [Google Scholar] [CrossRef] [Green Version]
- Abdel Kawy, W.A.M.; Abou El-Magd, I.H. Use of Satellite Data and GIS for Assessing the Agricultural Potentiality of the Soils South Farafra Oasis, Western Desert, Egypt. Arab. J. Geosci. 2013, 6, 2299–2311. [Google Scholar] [CrossRef]
- Global Water Resources: Vulnerability from Climate Change and Population Growth. Available online: https://www.science.org/doi/full/10.1126/science.289.5477.284 (accessed on 1 April 2022).
- Jalilvand, E.; Tajrishy, M.; Ghazi Zadeh Hashemi, S.A.; Brocca, L. Quantification of Irrigation Water Using Remote Sensing of Soil Moisture in a Semi-Arid Region. Remote Sens. Environ. 2019, 231, 111226. [Google Scholar] [CrossRef]
- Serra, P.; Salvati, L.; Queralt, E.; Pin, C.; Gonzalez, O.; Pons, X. Estimating Water Consumption and Irrigation Requirements in a Long-Established Mediterranean Rural Community by Remote Sensing and Field Data. Irrig. Drain. 2016, 65, 578–588. [Google Scholar] [CrossRef]
- Zhao, W.; Chang, X.; Chang, X.; Zhang, D.; Liu, B.; Du, J.; Lin, P. Estimating Water Consumption Based on Meta-Analysis and MODIS Data for an Oasis Region in Northwestern China. Agric. Water Manag. 2018, 208, 478–489. [Google Scholar] [CrossRef]
- Rozenstein, O.; Haymann, N.; Kaplan, G.; Tanny, J. Estimating Cotton Water Consumption Using a Time Series of Sentinel-2 Imagery. Agric. Water Manag. 2018, 207, 44–52. [Google Scholar] [CrossRef]
- Fleming, K.; Martinec, Z.; Hagedoorn, J. Geoid Displacement about Greenland Resulting from Past and Present-Day Mass Changes in the Greenland Ice Sheet. Geophys. Res. Lett. 2004, 31, L06617. [Google Scholar] [CrossRef] [Green Version]
- Flury, J. Ice Mass Balance and Ice Dynamics from Satellite Gravity Missions. Earth Moon Planet 2004, 94, 83–91. [Google Scholar] [CrossRef]
- Wünsch, J. Oceanic and Soil Moisture Contributions to Seasonal Polar Motion. J. Geodyn. 2002, 33, 269–280. [Google Scholar] [CrossRef]
- Swenson, S.C.; Milly, P.C.D. Climate Model Biases in Seasonality of Continental Water Storage Revealed by Satellite Gravimetry. Water Resour. Res. 2006, 42, W03201. [Google Scholar] [CrossRef]
- The Potential for Satellite-Based Monitoring of Groundwater Storage Changes Using GRACE: The High Plains Aquifer, Central US—ScienceDirect. Available online: https://www.sciencedirect.com/science/article/pii/S0022169402000604 (accessed on 6 February 2022).
- Frappart, F.; Ramillien, G. Monitoring Groundwater Storage Changes Using the Gravity Recovery and Climate Experiment (GRACE) Satellite Mission: A Review. Remote Sens. 2018, 10, 829. [Google Scholar] [CrossRef] [Green Version]
- Liu, X.; Hu, L.; Sun, K.; Yang, Z.; Sun, J.; Yin, W. Improved Understanding of Groundwater Storage Changes under the Influence of River Basin Governance in Northwestern China Using GRACE Data. Remote Sens. 2021, 13, 2672. [Google Scholar] [CrossRef]
- Scanlon, B.R.; Longuevergne, L.; Long, D. Ground Referencing GRACE Satellite Estimates of Groundwater Storage Changes in the California Central Valley, USA. Water Resour. Res. 2012, 48, W04520. [Google Scholar] [CrossRef] [Green Version]
- Wu, Q.; Si, B.; He, H.; Wu, P. Determining Regional-Scale Groundwater Recharge with GRACE and GLDAS. Remote Sens. 2019, 11, 154. [Google Scholar] [CrossRef] [Green Version]
- Thomas, B.F.; Famiglietti, J.S. Identifying Climate-Induced Groundwater Depletion in GRACE Observations. Sci. Rep. 2019, 9, 4124. [Google Scholar] [CrossRef] [PubMed] [Green Version]
- Melati, M.D.; Fleischmann, A.S.; Fan, F.M.; Paiva, R.C.; Athayde, G.B. Estimates of Groundwater Depletion under Extreme Drought in the Brazilian Semi-Arid Region Using GRACE Satellite Data: Application for a Small-Scale Aquifer. Hydrogeol. J. 2019, 27, 2789–2802. [Google Scholar] [CrossRef]
- Munier, S.; Becker, M.; Maisongrande, P.; Cazenave, A. Using GRACE to Detect Groundwater Storage Variations: The Cases of Canning Basin and Guarani Aquifer System. Int. Water Technol. J. 2012, 2, 2–13. [Google Scholar]
- Vasco, D.W.; Farr, T.G.; Jeanne, P.; Doughty, C.; Nico, P. Satellite-Based Monitoring of Groundwater Depletion in California’s Central Valley. Sci. Rep. 2019, 9, 16053. [Google Scholar] [CrossRef] [Green Version]
- Singh, L.; Saravanan, S. Satellite-Derived GRACE Groundwater Storage Variation in Complex Aquifer System in India. Sustain. Water Resour. Manag. 2020, 6, 1–15. [Google Scholar] [CrossRef]
- Shukla, M.; Maurya, V.; Dwivedi, R. Groundwater Monitoring Using GRACE Mission. Int. Arch. Photogramm. Remote Sens. Spat. Inf. Sci. 2021, 43, B3-2021. [Google Scholar] [CrossRef]
- Singh, A.K.; Jasrotia, A.S.; Taloor, A.K.; Kotlia, B.S.; Kumar, V.; Roy, S.; Ray, P.K.C.; Singh, K.K.; Singh, A.K.; Sharma, A.K. Estimation of Quantitative Measures of Total Water Storage Variation from GRACE and GLDAS-NOAH Satellites Using Geospatial Technology. Quat. Int. 2017, 444, 191–200. [Google Scholar] [CrossRef]
- Zhong, Y.; Zhong, M.; Feng, W.; Zhang, Z.; Shen, Y.; Wu, D. Groundwater Depletion in the West Liaohe River Basin, China and Its Implications Revealed by GRACE and in Situ Measurements. Remote Sens. 2018, 10, 493. [Google Scholar] [CrossRef] [Green Version]
- Neves, M.C.; Nunes, L.M.; Monteiro, J.P. Evaluation of GRACE Data for Water Resource Management in Iberia: A Case Study of Groundwater Storage Monitoring in the Algarve Region. J. Hydrol. Reg. Stud. 2020, 32, 100734. [Google Scholar] [CrossRef]
- Bhanja, S.N.; Zhang, X.; Wang, J. Estimating Long-Term Groundwater Storage and Its Controlling Factors in Alberta, Canada. Hydrol. Earth Syst. Sci. 2018, 22, 6241–6255. [Google Scholar] [CrossRef] [Green Version]
- Saber, M.; Alhinai, S.; Al Barwani, A.; AL-Saidi, A.; Kantoush, S.A.; Habib, E.; Borrok, D.M. Satellite-Based Estimates of Groundwater Storage Changes at the Najd Aquifers in Oman. In Water Resources in Arid Areas: The Way Forward; Springer: Berlin/Heidelberg, Germany, 2017; pp. 155–169. [Google Scholar]
- Ouma, Y.O.; Aballa, D.O.; Marinda, D.O.; Tateishi, R.; Hahn, M. Use of GRACE Time-Variable Data and GLDAS-LSM for Estimating Groundwater Storage Variability at Small Basin Scales: A Case Study of the Nzoia River Basin. Int. J. Remote Sens. 2015, 36, 5707–5736. [Google Scholar] [CrossRef]
- Feng, W.; Shum, C.K.; Zhong, M.; Pan, Y. Groundwater Storage Changes in China from Satellite Gravity: An Overview. Remote Sens. 2018, 10, 674. [Google Scholar] [CrossRef] [Green Version]
- Liesch, T.; Ohmer, M. Comparison of GRACE Data and Groundwater Levels for the Assessment of Groundwater Depletion in Jordan. Hydrogeol. J. 2016, 24, 1547–1563. [Google Scholar] [CrossRef]
- Lo, M.-H.; Famiglietti, J.S.; Reager, J.T.; Rodell, M.; Swenson, S.; Wu, W.-Y. GRACE-Based Estimates of Global Groundwater Depletion. Terr. Water Cycle Clim. Change Nat. Hum.-Induc. Impacts 2016, 221, 137. [Google Scholar]
- Rodell, M.; Chen, J.; Kato, H.; Famiglietti, J.S.; Nigro, J.; Wilson, C.R. Estimating Groundwater Storage Changes in the Mississippi River Basin (USA) Using GRACE. Hydrogeol. J. 2007, 15, 159–166. [Google Scholar] [CrossRef] [Green Version]
- Humphrey, V.; Gudmundsson, L.; Seneviratne, S.I. Assessing Global Water Storage Variability from GRACE: Trends, Seasonal Cycle, Subseasonal Anomalies and Extremes. Surv. Geophys. 2016, 37, 357–395. [Google Scholar] [CrossRef] [Green Version]
- Mohamed, A.; Sultan, M.; Ahmed, M.; Yan, E.; Ahmed, E. Aquifer Recharge, Depletion, and Connectivity: Inferences from GRACE, Land Surface Models, and Geochemical and Geophysical Data. GSA Bull. 2017, 129, 534–546. [Google Scholar] [CrossRef] [Green Version]
- Frappart, F. Groundwater Storage Changes in the Major North African Transboundary Aquifer Systems during the GRACE Era (2003–2016). Water 2020, 12, 2669. [Google Scholar] [CrossRef]
- Robinson, C.A.; Werwer, A.; El-Baz, F.; El-Shazly, M.; Fritch, T.; Kusky, T. The Nubian Aquifer in Southwest Egypt. Hydrogeol. J. 2007, 15, 33–45. [Google Scholar] [CrossRef]
- Dabous, A.A.; Osmond, J.K. Uranium Isotopic Study of Artesian and Pluvial Contributions to the Nubian Aquifer, Western Desert, Egypt. J. Hydrol. 2001, 243, 242–253. [Google Scholar] [CrossRef]
- Kimura, R.; Kato, H.; Iwasaki, E. Cultivation Features Using Meteorological and Satellite Data from 2001 to 2010 in Dakhla Oasis, Egypt. J. Water Resour. Prot. 2015, 07, 209–218. [Google Scholar] [CrossRef] [Green Version]
- Nada, A.A. Evaluation of Environmental Isotopic and Salinar Composition of Groundwater in Oases of the Western Desert, Egypt. Isot. Environ. Health Stud. 1995, 31, 117–124. [Google Scholar] [CrossRef]
- The Nubian Aquifer in Southwest Egypt | SpringerLink. Available online: https://link.springer.com/article/10.1007/s10040-006-0091-7 (accessed on 16 March 2022).
- Kimura, R.; Iwasaki, E.; Matsuoka, N. Analysis of the Recent Agricultural Situation of Dakhla Oasis, Egypt, Using Meteorological and Satellite Data. Remote Sens. 2020, 12, 1264. [Google Scholar] [CrossRef] [Green Version]
- Summary of Current Radiometric Calibration Coefficients for Landsat MSS, TM, ETM+, and EO-1 ALI Sensors—ScienceDirect. Available online: https://www.sciencedirect.com/science/article/pii/S0034425709000169 (accessed on 29 March 2022).
- Kriegler, F.J.; Malila, W.A.; Nalepka, R.F.; Richardson, W. Preprocessing Transformations and Their Effects on Multispectral Recognition. Remote Sens. Environ. 1969, VI, 97. [Google Scholar]
- Greicius, T. Grace Mission. Available online: http://www.nasa.gov/mission_pages/Grace/index.html (accessed on 6 February 2022).
- Tapley, B.; Bettadpur, S.; Watkins, M.; Reigber, C. The Gravity Recovery and Climate Experiment: Mission Overview and Early Results. Geophys. Res. Lett. 2004, 31, 4. [Google Scholar] [CrossRef] [Green Version]
- Kim, J. Simulation Study of a Low-Low Satellite-to-Satellite Tracking Mission; The University of Texas at Austin: Austin, TX, USA, 2000; p. 291. [Google Scholar]
- Kornfeld, R.P.; Arnold, B.W.; Gross, M.A.; Dahya, N.T.; Klipstein, W.M.; Gath, P.F.; Bettadpur, S. GRACE-FO: The Gravity Recovery and Climate Experiment Follow-On Mission. J. Spacecr. Rocket. 2019, 56, 931–951. [Google Scholar] [CrossRef]
- Landerer, F.W.; Flechtner, F.M.; Save, H.; Webb, F.H.; Bandikova, T.; Bertiger, W.I.; Bettadpur, S.V.; Byun, S.H.; Dahle, C.; Dobslaw, H.; et al. Extending the Global Mass Change Data Record: GRACE Follow-On Instrument and Science Data Performance. Geophys. Res. Lett. 2020, 47, e2020GL088306. [Google Scholar] [CrossRef]
- Hasan, E.; Tarhule, A. Comparison of Decadal Water Storage Trends from Common GRACE Releases (RL05, RL06) Using Spatial Diagnostics and a Modified Triple Collocation Approach. J. Hydrol. X 2021, 13, 100108. [Google Scholar] [CrossRef]
- Save, H.; Bettadpur, S.; Tapley, B.D. High Resolution CSR GRACE RL05 Mascons. J. Geophys. Res. Solid Earth 2016, 121, 7547–7569. [Google Scholar] [CrossRef]
- Save, H. CSR GRACE and GRACE-FO RL06 Mascon Solutions V02. Mascon Solut. 2020, 12, 24. [Google Scholar] [CrossRef]
- Watkins, M.M.; Wiese, D.N.; Yuan, D.-N.; Boening, C.; Landerer, F.W. Improved Methods for Observing Earth’s Time Variable Mass Distribution with GRACE Using Spherical Cap Mascons. J. Geophys. Res. Solid Earth 2015, 120, 2648–2671. [Google Scholar] [CrossRef]
- Wiese, D.N.; Landerer, F.W.; Watkins, M.M. Quantifying and Reducing Leakage Errors in the JPL RL05M GRACE Mascon Solution. Water Resour. Res. 2016, 52, 7490–7502. [Google Scholar] [CrossRef]
- Wiese, D.N.; Yuan, D.-N.; Boening, C.; Landerer, F.W.; Watkins, M.M. JPL GRACE Mascon Ocean, Ice, and Hydrology Equivalent Water Height Release 06 Coastal Resolution Improvement (CRI) Filtered Version 1.0. Ver. 1.0.; PO.DAAC: Pasadena, CA, USA, 2018.
- Egypt Statistical Yearbook. 2012. Available online: https://www.capmas.gov.eg/Pages/Publications.aspx?page_id=5104&YearID=23543&Year=23563 (accessed on 1 March 2022).
- Egypt Statistical Yearbook. GHDx. 2017. Available online: http://ghdx.healthdata.org/record/egypt-statistical-yearbook-2017 (accessed on 24 February 2022).
- Baatz, M.; Schäpe, A. Multiresolution Segmentation: An Optimization Approach for High Quality Multi-Scale Image Segmentation. Comput. Sci. 2000, 38, 12–23. [Google Scholar]
- Flanders, D.; Hall-Beyer, M.; Pereverzoff, J. Preliminary Evaluation of ECognition Object-Based Software for Cut Block Delineation and Feature Extraction. Can. J. Remote Sens. 2003, 29, 441–452. [Google Scholar] [CrossRef]
- Abhir, H.; Bhalerao, B.S. Multiresolution Image Segmentation; The University of Warwick: Coventry, UK, 1991. [Google Scholar]
- Seidl, T. Nearest Neighbor Classification. In Encyclopedia of Database Systems; LIU, L., ÖZSU, M.T., Eds.; Springer: Boston, MA, USA, 2009; pp. 1885–1890. ISBN 978-0-387-39940-9. [Google Scholar]
- Platt, R.V.; Rapoza, L. An Evaluation of an Object-Oriented Paradigm for Land Use/Land Cover Classification. Prof. Geogr. 2008, 60, 87–100. [Google Scholar] [CrossRef]
- Willhauck, G. Comparison of Object Oriented Classification Techniques and Standard Image Analysis for the Use of Change Detection between SPOT Multispectral Satellite Images and Aerial Photos; IAPRS: Amsterdam, The Netherlands, 2000; Volume 33, pp. 35–42. [Google Scholar]
- Hossain, M.D.; Chen, D. Segmentation for Object-Based Image Analysis (OBIA): A Review of Algorithms and Challenges from Remote Sensing Perspective. ISPRS J. Photogramm. Remote Sens. 2019, 150, 115–134. [Google Scholar] [CrossRef]
- Goodchild, M.F. GIScience, Geography, Form, and Process. Ann. Assoc. Am. Geogr. 2004, 94, 709–714. [Google Scholar] [CrossRef]
- Goodchild, M.F. Geographical Information Science. Int. J. Geogr. Inf. Syst. 1992, 6, 31–45. [Google Scholar] [CrossRef]
- Yu, Q.; Gong, P.; Clinton, N.; Biging, G.; Kelly, M.; Schirokauer, D. Object-Based Detailed Vegetation Classification with Airborne High Spatial Resolution Remote Sensing Imagery. Photogramm. Eng. Remote Sens. 2006, 72, 799–811. [Google Scholar] [CrossRef] [Green Version]
- Câmara, G.; Souza, R.C.M.; Freitas, U.M.; Garrido, J. Spring: Integrating Remote Sensing and Gis by Object-Oriented Data Modelling. Comput. Graph. 1996, 20, 395–403. [Google Scholar] [CrossRef]
- Wu, J. Hierarchy and Scaling: Extrapolating Information along a Scaling Ladder. Can. J. Remote Sens. 1999, 25, 367–380. [Google Scholar] [CrossRef] [Green Version]
- Hay, G.J.; Marceau, D.J.; Dubé, P.; Bouchard, A. A Multiscale Framework for Landscape Analysis: Object-Specific Analysis and Upscaling. Landsc. Ecol. 2001, 16, 471–490. [Google Scholar] [CrossRef]
- Burnett, C.; Blaschke, T. A Multi-Scale Segmentation/Object Relationship Modelling Methodology for Landscape Analysis. Ecol. Model. 2003, 168, 233–249. [Google Scholar] [CrossRef]
- Alqurashi, A.F.; Kumar, L.; Sinha, P. Urban Land Cover Change Modelling Using Time-Series Satellite Images: A Case Study of Urban Growth in Five Cities of Saudi Arabia. Remote Sens. 2016, 8, 838. [Google Scholar] [CrossRef] [Green Version]
- A New Approach for Land Cover Classification and Change Analysis: Integrating Backdating and an Object-Based Method—ScienceDirect. Available online: https://www.sciencedirect.com/science/article/pii/S003442571630058X?via%3Dihub (accessed on 14 February 2022).
- Rodell, M.; Velicogna, I.; Famiglietti, J.S. Satellite-Based Estimates of Groundwater Depletion in India. Nature 2009, 460, 999–1002. [Google Scholar] [CrossRef] [PubMed] [Green Version]
- Famiglietti, J.S.; Lo, M.; Ho, S.L.; Bethune, J.; Anderson, K.J.; Syed, T.H.; Swenson, S.C.; de Linage, C.R.; Rodell, M. Satellites Measure Recent Rates of Groundwater Depletion in California’s Central Valley. Geophys. Res. Lett. 2011, 38. [Google Scholar] [CrossRef] [Green Version]
- Quantifying Renewable Groundwater Stress with GRACE—Richey—2015—Water Resources Research—Wiley Online Library. Available online: https://agupubs.onlinelibrary.wiley.com/doi/full/10.1002/2015WR017349 (accessed on 7 February 2022).
- Thomas, B.F.; Caineta, J.; Nanteza, J. Global Assessment of Groundwater Sustainability Based On Storage Anomalies. Geophys. Res. Lett. 2017, 44, 11445. [Google Scholar] [CrossRef] [Green Version]
- Shamsudduha, M.; Taylor, R.G.; Longuevergne, L. Monitoring Groundwater Storage Changes in the Highly Seasonal Humid Tropics: Validation of GRACE Measurements in the Bengal Basin. Water Resour. Res. 2012, 48, W02508. [Google Scholar] [CrossRef] [Green Version]
- Shao, Y.; Fraedrich, K.; Ishizuka, M. Modelling Soil Moisture in Hyper-Arid Conditions. Bound.-Layer Meteorol. 2021, 179, 169–186. [Google Scholar] [CrossRef]
- Sakumura, C.; Bettadpur, S.; Bruinsma, S. Ensemble Prediction and Intercomparison Analysis of GRACE Time-Variable Gravity Field Models. Geophys. Res. Lett. 2014, 41, 1389–1397. [Google Scholar] [CrossRef]
- Galal, W.F.; Darwish, M. Geoenvironmental Assessment of the Mut Wastewater Ponds in the Dakhla Oasis, Egypt. Geocarto Int. 2020, 1–13. [Google Scholar] [CrossRef]
- Darwish, M.; Galal, W. Spatiotemporal Effects of Wastewater Ponds from a Geoenvironmental Perspective in the Kharga Region, Egypt. Prog. Phys. Geogr. 2019, 44, 376–397. [Google Scholar] [CrossRef]
- Wolowski, K.; Saber, A.; Cantonati, M. Euglenoids from the El Farafra Oasis (Western Desert, Egypt). Pol. Bot. J. 2017, 62. [Google Scholar] [CrossRef] [Green Version]
- Texas Crop Circles from Space. Available online: https://climate.nasa.gov/news/729/texas-crop-circles-from-space (accessed on 20 February 2022).
- Ministry of the Environment. Available online: https://www.env.go.jp/earth/coop/coop/document/c_report/egypt_h16/english/pdf/000.pdf (accessed on 2 March 2022).
- DARWISH Hosam Water Scarcity in the Middle East and North Africa: A Focus on Egypt. Middle East Rev. 2020, 7, 6–13. [CrossRef]
- Degens, E.T. Project New Valley. Eng. Sci. 1961, 25, 20–23. [Google Scholar]
- Dale, V.H. The Relationship Between Land-Use Change and Climate Change. Ecol. Appl. 1997, 7, 753–769. [Google Scholar] [CrossRef]
- Kurukulasuriya, P.; Rosenthal, S. Climate Change and Agriculture: A Review of Impacts and Adaptations; World Bank: Washington, DC, USA, 2013. [Google Scholar]
- Sharp, J.M. Egypt: The January 25 Revolution and Implications for US Foreign Policy; Diane Publishing: Collingdale, PA, USA, 2011; pp. 45–89. [Google Scholar]
- Abdou, D. The Egyptian Revolution and Post Socio-Economic IMPACT. Top. Middle East. Afr. Econ. 2013, 15, 92. [Google Scholar]


| Oasis | Population | |||
|---|---|---|---|---|
| Urban | Rural | Total | ||
| Kharga | Kharga | 71,936 | 18,078 | 90,014 |
| Baris | 5568 | 7991 | 13,559 | |
| Dakhla | Balat | 3457 | 8776 | 12,233 |
| Dakhla | 23,216 | 66,405 | 89,621 | |
| Farafra | Farafra | 6817 | 29,003 | 35,820 |
| Dataset Category | Study Area | Sensor | Date | Resolution | Path/Row | Source | ||
|---|---|---|---|---|---|---|---|---|
| Remote sensing data | Dakhla Oasis | Landsat TM | 1986 | 30 m | P177/R42 | USGS | ||
| ~ | ||||||||
| 2011 | ||||||||
| Landsat OLI | 2014 | |||||||
| ~ | ||||||||
| 2019 | ||||||||
| Sentinel-2 | 2021 | |||||||
| Kharga Oasis | Landsat TM | 1987 | 30 m | P176/R42-P176/R43 | ||||
| ~ | ||||||||
| 2011 | ||||||||
| Landsat OLI | 2014 | |||||||
| ~ | ||||||||
| 2019 | ||||||||
| Sentinel-2 | 2021 | |||||||
| Farafra Oasis | Landsat TM | 1987 | 30 m | P178/R41-P178/R42 | ||||
| ~ | ||||||||
| 2011 | ||||||||
| Landsat OLI | 2014 | |||||||
| ~ | ||||||||
| 2019 | ||||||||
| Sentinel-2 | 2021 | |||||||
| Three oases and East Oweinat | Landsat 7 Collection 1 Tier 1 8-Day NDVI Composite | 2002~2021 | 30 m | Three oases and East Oweinat | Google Earth Engine Platform | |||
| GRACE | New Valley | GRACE | 2002~2021 | 0.25°/0.5° | - | CSR/JPL | ||
| Statistical data | Egyptian Statistical Yearbook [2,3,69,70] | |||||||
| Reference data | Google Earth Pro | P176/R42-P178/R42 | ||||||
| Level 1 | Level 2 | Definition |
|---|---|---|
| Agricultural land | - | Area cultivated for crops |
| Water body | - | Includes lake-covered land, agricultural drainage, and artificial water tanks |
| Urban | Man-made | Human inhabited areas such as cities and countryside |
| Bare land | Land with spectral characteristics close to fallow farmland, abandoned cultivated land, and residential areas | |
| Desert | - | Barren areas with completely sandy ground, little vegetation, low levels of rain, dry air |
| Dakhla | Kappa Coefficient | Overall Accuracy (%) | Kharga | Kappa Coefficient | Overall Accuracy (%) | Farafra | Kappa Coefficient | Overall Accuracy (%) |
|---|---|---|---|---|---|---|---|---|
| 1986/03 | 0.93 | 95 | 1987/02 | 0.96 | 97 | 1987/01 | 0.95 | 97 |
| 1989/03 | 0.92 | 95 | 1990/03 | 0.93 | 96 | 1990/03 | 0.87 | 94 |
| 1992/03 | 0.94 | 96 | 1993/03 | 0.91 | 94 | 1993/03 | 0.91 | 95 |
| 1996/03 | 0.92 | 95 | 1996/02 | 0.97 | 98 | 1996/03 | 0.94 | 97 |
| 1999/03 | 0.87 | 92 | 1999/03 | 0.97 | 98 | 1999/03 | 0.93 | 96 |
| 2002/03 | 0.86 | 89 | 2002/01 | 0.94 | 97 | 2002/01 | 0.92 | 95 |
| 2005/03 | 0.84 | 88 | 2005/03 | 0.95 | 97 | 2005/03 | 0.90 | 93 |
| 2008/03 | 0.80 | 86 | 2008/03 | 0.95 | 97 | 2009/03 | 0.93 | 95 |
| 2011/03 | 0.81 | 87 | 2011/03 | 0.97 | 98 | 2011/03 | 0.93 | 96 |
| 2014/03 | 0.78 | 84 | 2014/03 | 0.97 | 98 | 2014/02 | 0.95 | 97 |
| 2017/03 | 0.91 | 94 | 2017/03 | 0.98 | 99 | 2017/03 | 0.93 | 96 |
| 2019/03 | 0.94 | 95 | 2019/02 | 0.96 | 98 | 2019/03 | 0.94 | 96 |
| 2021/03 | 0.86 | 91 | 2021/03 | 0.97 | 98 | 2021/03 | 0.94 | 96 |
| Dakhla Oasis_(km2) | ||||
| 1986–2021 | Agricultural | Water | Urban | Desert |
| Agricultural | 111.20 | 0.67 | 27.47 | 4.21 |
| Water | 0.05 | 0.94 | 0.10 | 0.08 |
| Urban | 48.70 | 0.84 | 46.18 | 13.90 |
| Desert | 246.87 | 2.86 | 161.90 | - |
| Kharga Oasis_(km2) | ||||
| 1987–2021 | Agricultural | Water | Urban | Desert |
| Agricultural | 43.77 | 0.01 | 11.15 | 2.10 |
| Water | 0.17 | 0.11 | 0.10 | 0.05 |
| Urban | 36.71 | 0.08 | 38.90 | 11.28 |
| Desert | 86.41 | 2.31 | 120.90 | - |
| Farafra Oasis_(km2) | ||||
| 1987–2021 | Agricultural | Water | Urban | Desert |
| Agricultural | 10.46 | 0.40 | 4.96 | 1.90 |
| Water | 1.71 | 1.466 | 1.42 | 0.75 |
| Urban | 4.10 | 0.26 | 2.62 | 1.90 |
| Desert | 261.60 | 5.80 | 230.30 | - |
| Year | 2002 | 2003 | 2004 | 2005 | 2006 | 2007 | 2008 | 2009 | 2010 |
| Water (m3/m2) | 1.03 | 1.07 | 1.09 | 0.85 | 1.16 | 1.19 | 1.21 | 0.94 | 1.03 |
| Year | 2011 | 2012 | 2013 | 2014 | 2015 | 2016 | 2017 | 2018 | 2019 |
| Water (m3/m2) | 0.85 | 0.87 | 1.01 | 1.02 | 0.96 | 1.14 | 1.09 | 1.06 | 1.02 |
Publisher’s Note: MDPI stays neutral with regard to jurisdictional claims in published maps and institutional affiliations. |
© 2022 by the authors. Licensee MDPI, Basel, Switzerland. This article is an open access article distributed under the terms and conditions of the Creative Commons Attribution (CC BY) license (https://creativecommons.org/licenses/by/4.0/).
Share and Cite
Halipu, A.; Wang, X.; Iwasaki, E.; Yang, W.; Kondoh, A. Quantifying Water Consumption through the Satellite Estimation of Land Use/Land Cover and Groundwater Storage Changes in a Hyper-Arid Region of Egypt. Remote Sens. 2022, 14, 2608. https://doi.org/10.3390/rs14112608
Halipu A, Wang X, Iwasaki E, Yang W, Kondoh A. Quantifying Water Consumption through the Satellite Estimation of Land Use/Land Cover and Groundwater Storage Changes in a Hyper-Arid Region of Egypt. Remote Sensing. 2022; 14(11):2608. https://doi.org/10.3390/rs14112608
Chicago/Turabian StyleHalipu, Ayihumaier, Xuechen Wang, Erina Iwasaki, Wei Yang, and Akihiko Kondoh. 2022. "Quantifying Water Consumption through the Satellite Estimation of Land Use/Land Cover and Groundwater Storage Changes in a Hyper-Arid Region of Egypt" Remote Sensing 14, no. 11: 2608. https://doi.org/10.3390/rs14112608