1. Introduction
Satellite remote sensing (RS) systems provide regular and long-term observations of vast territories and are increasingly becoming one of the most popular sources of information for studying and monitoring the natural environment. The increase in the quality of data received from remote sensing systems and the development of processing methods has significantly expanded the field of their application and resulted in the fact that satellite data became practically irreplaceable for solving many scientific and applied tasks. For example, according to the World Meteorological Organization (WMO) [
1], approximately 80% of weather forecasting data are produced today based on satellite imagery.
Continuous growth of data volumes from remote sensing satellites and the constantly increasing complexity of data processing methods no longer allow for using traditional approach, which assumes that for each task one had to collect, store, and process data sets on local resources. Therefore, new approaches are required to enable the use of centralized resources to organize data processing [
2,
3,
4]. The main directions of developments in this case are:
- -
Maintaining and supporting ultra-large distributed archives of satellite data and processing results;
- -
Fully automatic processing of satellite data;
- -
Creation of tools for satellite data processing and analysis based on the use of centralized resources of data access centers.
In recent years, activities in these directions has been actively carried out all over the world. For example, Google, in 2013, created the Earth Engine [
5,
6,
7,
8] to provide users with access to satellite data archives and a set of features for their analysis. Using a synchronized distributed computing model, Earth Engine can process large volumes of geospatial data on Google’s computing resources. The Google Earth Engine can currently be considered the leader among information systems that provide both access and analysis of satellite information. Other examples of open-access or partially open-access systems evolving in this direction include:
- -
Earth Explorer [
9] and related dynamic data provisioning services (e.g., LandsatLook, [
10]);
- -
ESA Copernicus Open Access Hub (Sentinel missions) [
11] and related cloud services (ONDA-DIAS [
12], MUNDI Web services [
13], and CREODIAS [
14], EO Browser [
15]);
- -
EOS Landviewer analytical and processing service [
16];
- -
NASA Wordview service [
17].
Commercial satellite operators and technological companies also actively develop similar solutions for data access and analysis, the most interesting of which include but are not limited to:
- -
Planet Labs Planet Platform [
18] for Planet constellation data access and analysis;
- -
Maxar Geospatial Services [
19].
The Space Research Institute of the Russian Academy of Sciences (IKI) has been actively working on the creation of information systems for access to satellite RS data for over 20 years, with special attention paid to the abovementioned directions. In 2012, on the basis of the satellite data handling technologies created in IKI, the Center for Collective Use of Systems for Archiving, Processing, and Analysis of Satellite Observations Data of IKI was established to solve the tasks of environmental studies and monitoring—CCU “IKI-Monitoring” [
20,
21]. The VEGA-Science specialized system [
22,
23,
24] was implemented to provide scientific teams and projects with access to satellite data and its analysis. Currently, this system has no counterparts in Russia and is comparable with the best foreign analogues in terms of its capabilities of interactive distributed processing and analysis of satellite data, and even exceeds them with a number of features. In 2012, the VEGA-Science system was registered as a unique scientific installation (USI VS IKI-Monitoring). To date, more than 100 different scientific and educational organizations use the capabilities of the VEGA-Science service and information systems based on it.
This article describes the VEGA-Science information system. The first section of the paper is devoted to the main capabilities of the implemented system. It provides general information about the data archives of the IKI-Monitoring Center and then briefly describes the functionality of the VEGA-Science system for working with different types of information that has been implemented so far. The next section is devoted to the software implementation of the system and includes a brief description of the main technologies used for its creation. The third section describes the experience of using the VEGA-Science system for various scientific and applied tasks. Next, the article discusses the prospects of VEGA-Science development and summarizes the actual results of its use over the past 10 years.
2. Materials and Methods
2.1. Main Purposes of the VEGA-Science System
With the explosive growth in the volume and quality of Earth RS data, their effective use can only be provided by systems that will not only provide access to data archives (for search and retrieval) but also data analysis and processing including providing the necessary computing resources and tools for working with them. The VEGA-Science system was created to solve this problem.
It should be noted that there are two main directions of solving this problem:
- -
Providing users with a virtual hosting service, letting them create and perform procedures for processing of satellite data provided by the service;
- -
Providing users with desktop application replacement tools for analysis of spatial, primarily satellite data, which provide the possibility of distributed work both with data archives of large centers and with computing resources provided by them.
The first approach is to provide virtual hosting services. Users are offered to rent virtual servers with the required performance, where they can install their own processing and analysis software or use the preinstalled one. This approach is implemented, for example, in Mundi Web Services [
13], ONDA-DIAS [
12], or Google Earth Engine [
5]. This approach is quite flexible but requires researchers to have related competencies in administering computational nodes and writing program code. The second approach is to provide users with powerful interfaces to the data—the so-called web geoinformation systems (GIS). It involves active development of data access, processing and analysis tools based on modern web technologies, and increasingly approaching desktop GIS applications in their capabilities. This approach is offered, for example, by the EO Browser service [
15]. Although this approach limits the ability of users to create non-standard, new methods of data processing, it allows a fairly wide range of users to use “standard” procedures of data processing, while having the ability to use the very large, constantly replenishing archives of satellite data and computing resources of large data processing and archiving centers.
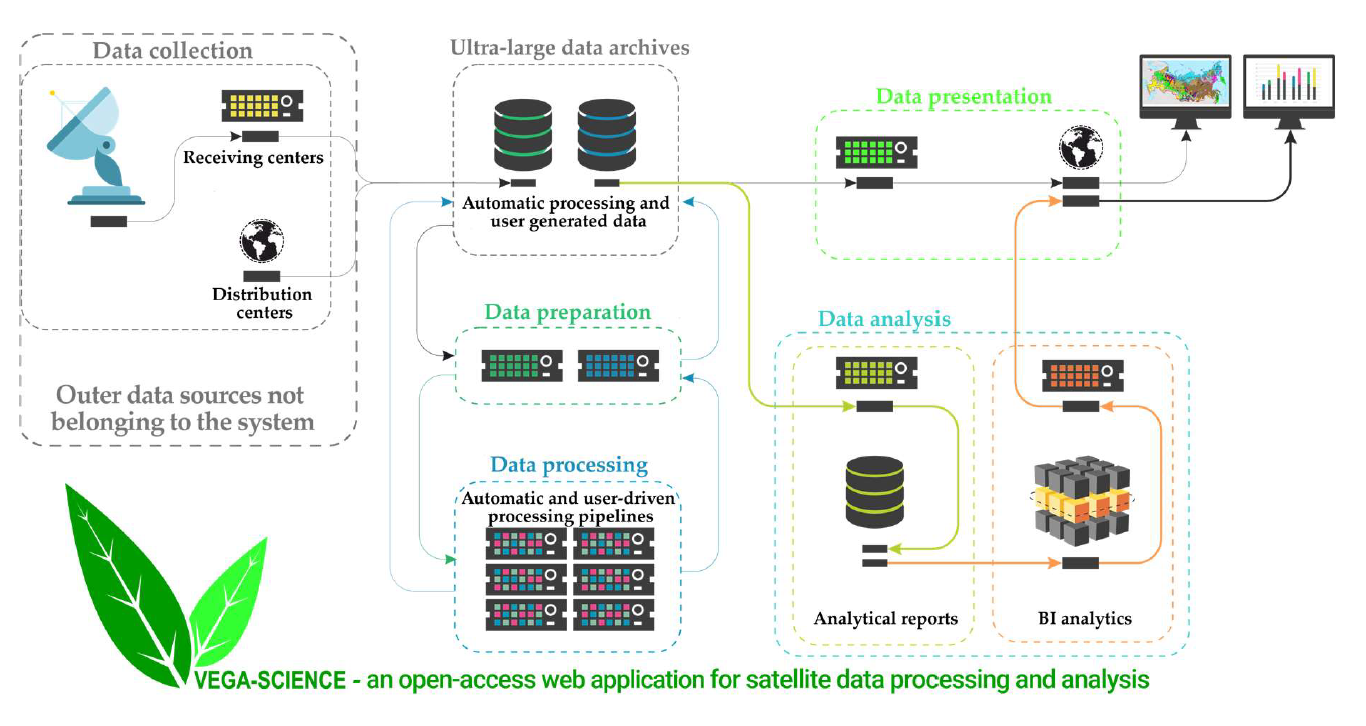
A major task, for the solution of which the VEGA-Science system was created and is being further developed, is the realization of the second approach. The system provides interactive work with the ultra-large archives of “IKI-Monitoring” CCU [
21] and provides users with a large set of cartographic and analytical web interfaces and tools that allow for the performance of complex processing and analytical operations on large volumes of data using the computing resources of “IKI-Monitoring”. Thus, VEGA-Science makes it possible to expand the capabilities of accessing and analyzing remote observation data and to avoid the need to create a special high-performance data processing infrastructure for individual scientific projects. The system makes it possible to fully use all the capabilities of the infrastructure of the “IKI-Monitoring” CCU and the super-large archives of satellite data and the results of their processing for solving various scientific and applied tasks.
2.2. Main Capabilities of the VEGA-Science System
The VEGA-Science system is a web GIS, i.e., a web application providing desktop GIS functionality combined with direct access to ultra-large remote sensing data archives. Within the system, a set of multifunctional web interfaces is a working tool for the users, through which they can access, process, and analyze the data. The main tool is the cartographic interface that provides search, viewing, analysis, and interactive processing of selected data instances. Its structure and organization are similar to desktop application interfaces, and it includes a basic data display area, map navigation elements, and a set of data management tabs and controls. Each tab is responsible for searching and displaying a particular type of data or for individual processing and analysis operations. Such similarity greatly facilitates the user to adapt to work in the system. In addition, the system provides interfaces for building graphs of different indicators’ dynamics for the analysis of time series data, interfaces of building reporting forms for providing information, integrated on different objects of observation as well as interfaces for analysis of big volumes of multidimensional data on the basis of online analytical processing (OLAP) cubes and business intelligence (BI) technologies. Examples of system interfaces are shown in
Figure 1 and further.
2.3. Archives of the CCU “IKI-Monitoring”
At present, the archives of the CCU “IKI-Monitoring” contain data from over 40 different sensors installed on more than 50 Russian and foreign Earth RS satellites. The total volume of data available to the users exceeds 5 petabytes, whereas the archives receive over 3 terabytes of new data daily.
Thanks to cooperation between IKI and the Scientific Research Center (SRC) “Planeta” [
25], users of the center are able to work with global data coverages from Russian observing systems. In particular, users have access to data from Russian remote sensing satellites of the Kanopus-V, Resurs-P, Meteor-M, Electro-L, and Arktika-M series. The archives mainly contain data for the territory of Russia and the neighboring countries, but the coverage areas for some data types, for example, the Landsat [
26] and Sentinel [
27] series satellites, make up to 30% of the total area of the Earth’s surface. It is essential that rather long series of data are accumulated in the Center’s archives. For example, the Landsat data archives go back to March 1984. Up-to-date information regarding data availability in the archives of the CCU “IKI-Monitoring” and the joint system of work with the data of SRC “Planeta” is available on the information server of the Center in the “Data Archives” section [
28].
In addition to satellite data and derived products, the archives of the CCU “IKI-Monitoring” also contain other types of information used for environmental monitoring. The main types of such data are listed below.
Information about natural fires and their consequences play an important role in studying the conditions of vegetation cover. The archives of CCU “IKI-Monitoring” contain data on thermal anomalies detected using information from a number of different satellite instruments. The most reliable and complete data set was obtained from MODIS (Terra and Aqua satellites) and VIIRS (Suomi NPP and NOAA20 satellites) sensors. After special processing [
29], this information is spatially and temporally clustered and used for further processing and analysis. Higher-resolution data obtained from Landsat and Sentinel series satellites are also used.
The CCU also maintains archives of meteorological data in NCEP format from the US National Center for Atmospheric Research (NCAR) [
30]. The archive currently contains reanalysis data on a regular grid with a 0.5 degree step and forecast data on a regular grid with a 0.25 degree step from 2000 to the present time around the globe.
The CCU archives also contain a large number of cartographic layers with boundaries of various territorial divisions, settlements, water body boundaries, roads, and other reference information. The most detailed information is available for the territory of Russia, but there are also data for the whole world.
2.4. Data Handling Capabilities
At present, the VEGA-Science system implements a wide range of capabilities for working with satellite data and other types of information. A detailed description of these capabilities is given in [
21]; thus, only a brief listing of the main ones is given below:
Multi-criterial search and selection of heterogeneous data;
Viewing and obtaining various characteristics of images and objects on them;
Plotting graphs to analyze temporal, spatial, and spectral data series, including computable indices for selected objects, vertical profiles of weather data, and profiles along arbitrarily defined paths;
Analysis, processing, and derivation of data in synchronous and asynchronous modes, including:
- ○
Color correction and synthesis of selected spectral bands, including multi-temporal ones;
- ○
Calculation of spectral indices and image algebra;
- ○
Segmentation and classification of Earth RS data, including those using different learning algorithms;
- ○
Topographic data correction;
- ○
Joint analysis of heterogeneous and multi-temporal data;
- ○
Structural analysis of images based on LESSA (lineament extraction and stripe statistical analysis) technology [
31].
Monitoring of various objects, phenomena, and processes including:
- ○
Analysis of agricultural fields’ conditions and control of crop development dynamics [
24];
- ○
Identification of forest logging and estimation of forest projective cover based on time series data [
32];
- ○
Monitoring the state of natural and natural–anthropogenic sites and their environmental impact [
33];
- ○
Obtaining vegetation cover fire damage contours using high spatial resolution data [
34].
- -
Modeling various processes such as fire dynamics and propagation [
35];
- -
Preparation of presentation web interfaces to illustrate various phenomena and processes, allowing to present a limited set of necessary data from the system in a convenient form for the general public;
- -
Analysis of large volumes of multidimensional data as dynamic reporting forms, histograms, graphs, and maps [
36] based on BI technologies.
3. Results
3.1. General Architecture
As mentioned above, the VEGA-Science system is a part of the IKI-Monitoring CCU [
20,
21,
37,
38] and serves as the main tool for working with data from the super large distributed archives of the center.
The system provides usage of data from various sources collected into the distributed archives of the center. The program gateways implemented within the CCU provide full access to data from external sources including Russian satellite systems data from the Roscosmos geoportal archives [
39] and Landsat satellites data from Google Cloud Storage archives. Data usage in the VEGA-Science system is built with the service-based model. The main implemented services include services for metadata requests, providing all the necessary information about the data available in the archives; services for obtaining the required data from the archives; services for interactive processing of satellite data providing data handling options described above. In addition, based on the capabilities provided by the “IKI-Monitoring” CCU and software solutions developed during creation of the “VEGA-Science” system, a number of specialized information systems designed to solve various scientific and applied tasks has now been implemented.
Same as the CCU “IKI-Monitoring”, the “VEGA-Science” system is based on technologies and software developed at the “Satellite Monitoring Technologies” department of IKI [
40]. The system is based on the following basic technologies:
The UNISAT technology for maintaining ultra-large distributed archives of satellite data;
GeoSMIS technology for multipurpose cartographic web interfaces development and design;
GeoProcSMIS technology for satellite data analysis and processing interactive tools implementation;
Let us consider them in more detail.
3.1.1. UNISAT Technology
The UNISAT technology developed at IKI [
37] is used for maintaining super-large distributed archives of heterogeneous satellite data at the “IKI-Monitoring” Center. It provides uniform handling of various satellite data, which differs both in spatial resolution and data storage organization scheme. One of the main advantages of the technology used is the implementation of “virtual information products”, i.e., products dynamically generated in real time from the information available in the archive on user request. The use of “virtual” information products makes it possible to radically reduce the volume of data stored in the archives and promptly provide access to new information products without carrying out resource-intensive processing of large volumes of initial data. An equally important advantage of the abovementioned technology is the support of tools for remote analysis and data processing, both in real-time and asynchronous modes. The data storage scheme includes maintenance of specialized file databases, which store specific metadata and references to file storages in distributed repositories, as well as a universal reference database with descriptions of data types, rules of their visualization, and “virtual” derivative products building.
3.1.2. GeoSMIS Technology
The interfaces and services of the VEGA-Science system were developed on the basis of the GeoSMIS technology [
41] (GeoSMIS is a proper name, but it, same as GeoProcSMIS, originates from the abbreviation of the initial name of the developers laboratory—Satellite Monitoring Information Support or SMIS lab). The technology is intended for creating complex solutions providing users with a unique combination of capabilities for analyzing vast volumes of information from extra-large archives of satellite data and derived products.
Works on the GeoSMIS technology were started at the IKI in 2010 for the implementation of a uniform way of creating satellite monitoring services on the basis of the service data handling model [
2]. Basic program modules of the GeoSMIS technology implement both general standard functionalities required for satellite monitoring and tools for implementation and integration of particular thematic tasks and algorithms. The key advantage of using GeoSMIS is high speed and low labor costs for creation and deployment of new information services. Moreover, GeoSMIS’ integration with the UNISAT, the GeoProcSMIS (see below), and several other technologies provides the new services with virtually unlimited sets of data and analysis tools without reprocessing of archive data and allocation of separate capacities for their storage.
The GeoSMIS technology has two main architectural levels and corresponding software blocks [
41]—the basic cartographic web interface, providing a wide range of tools for working with data; and the extensible “smiswms” cartographic web service working directly with data and providing the necessary information products and services to web interfaces.
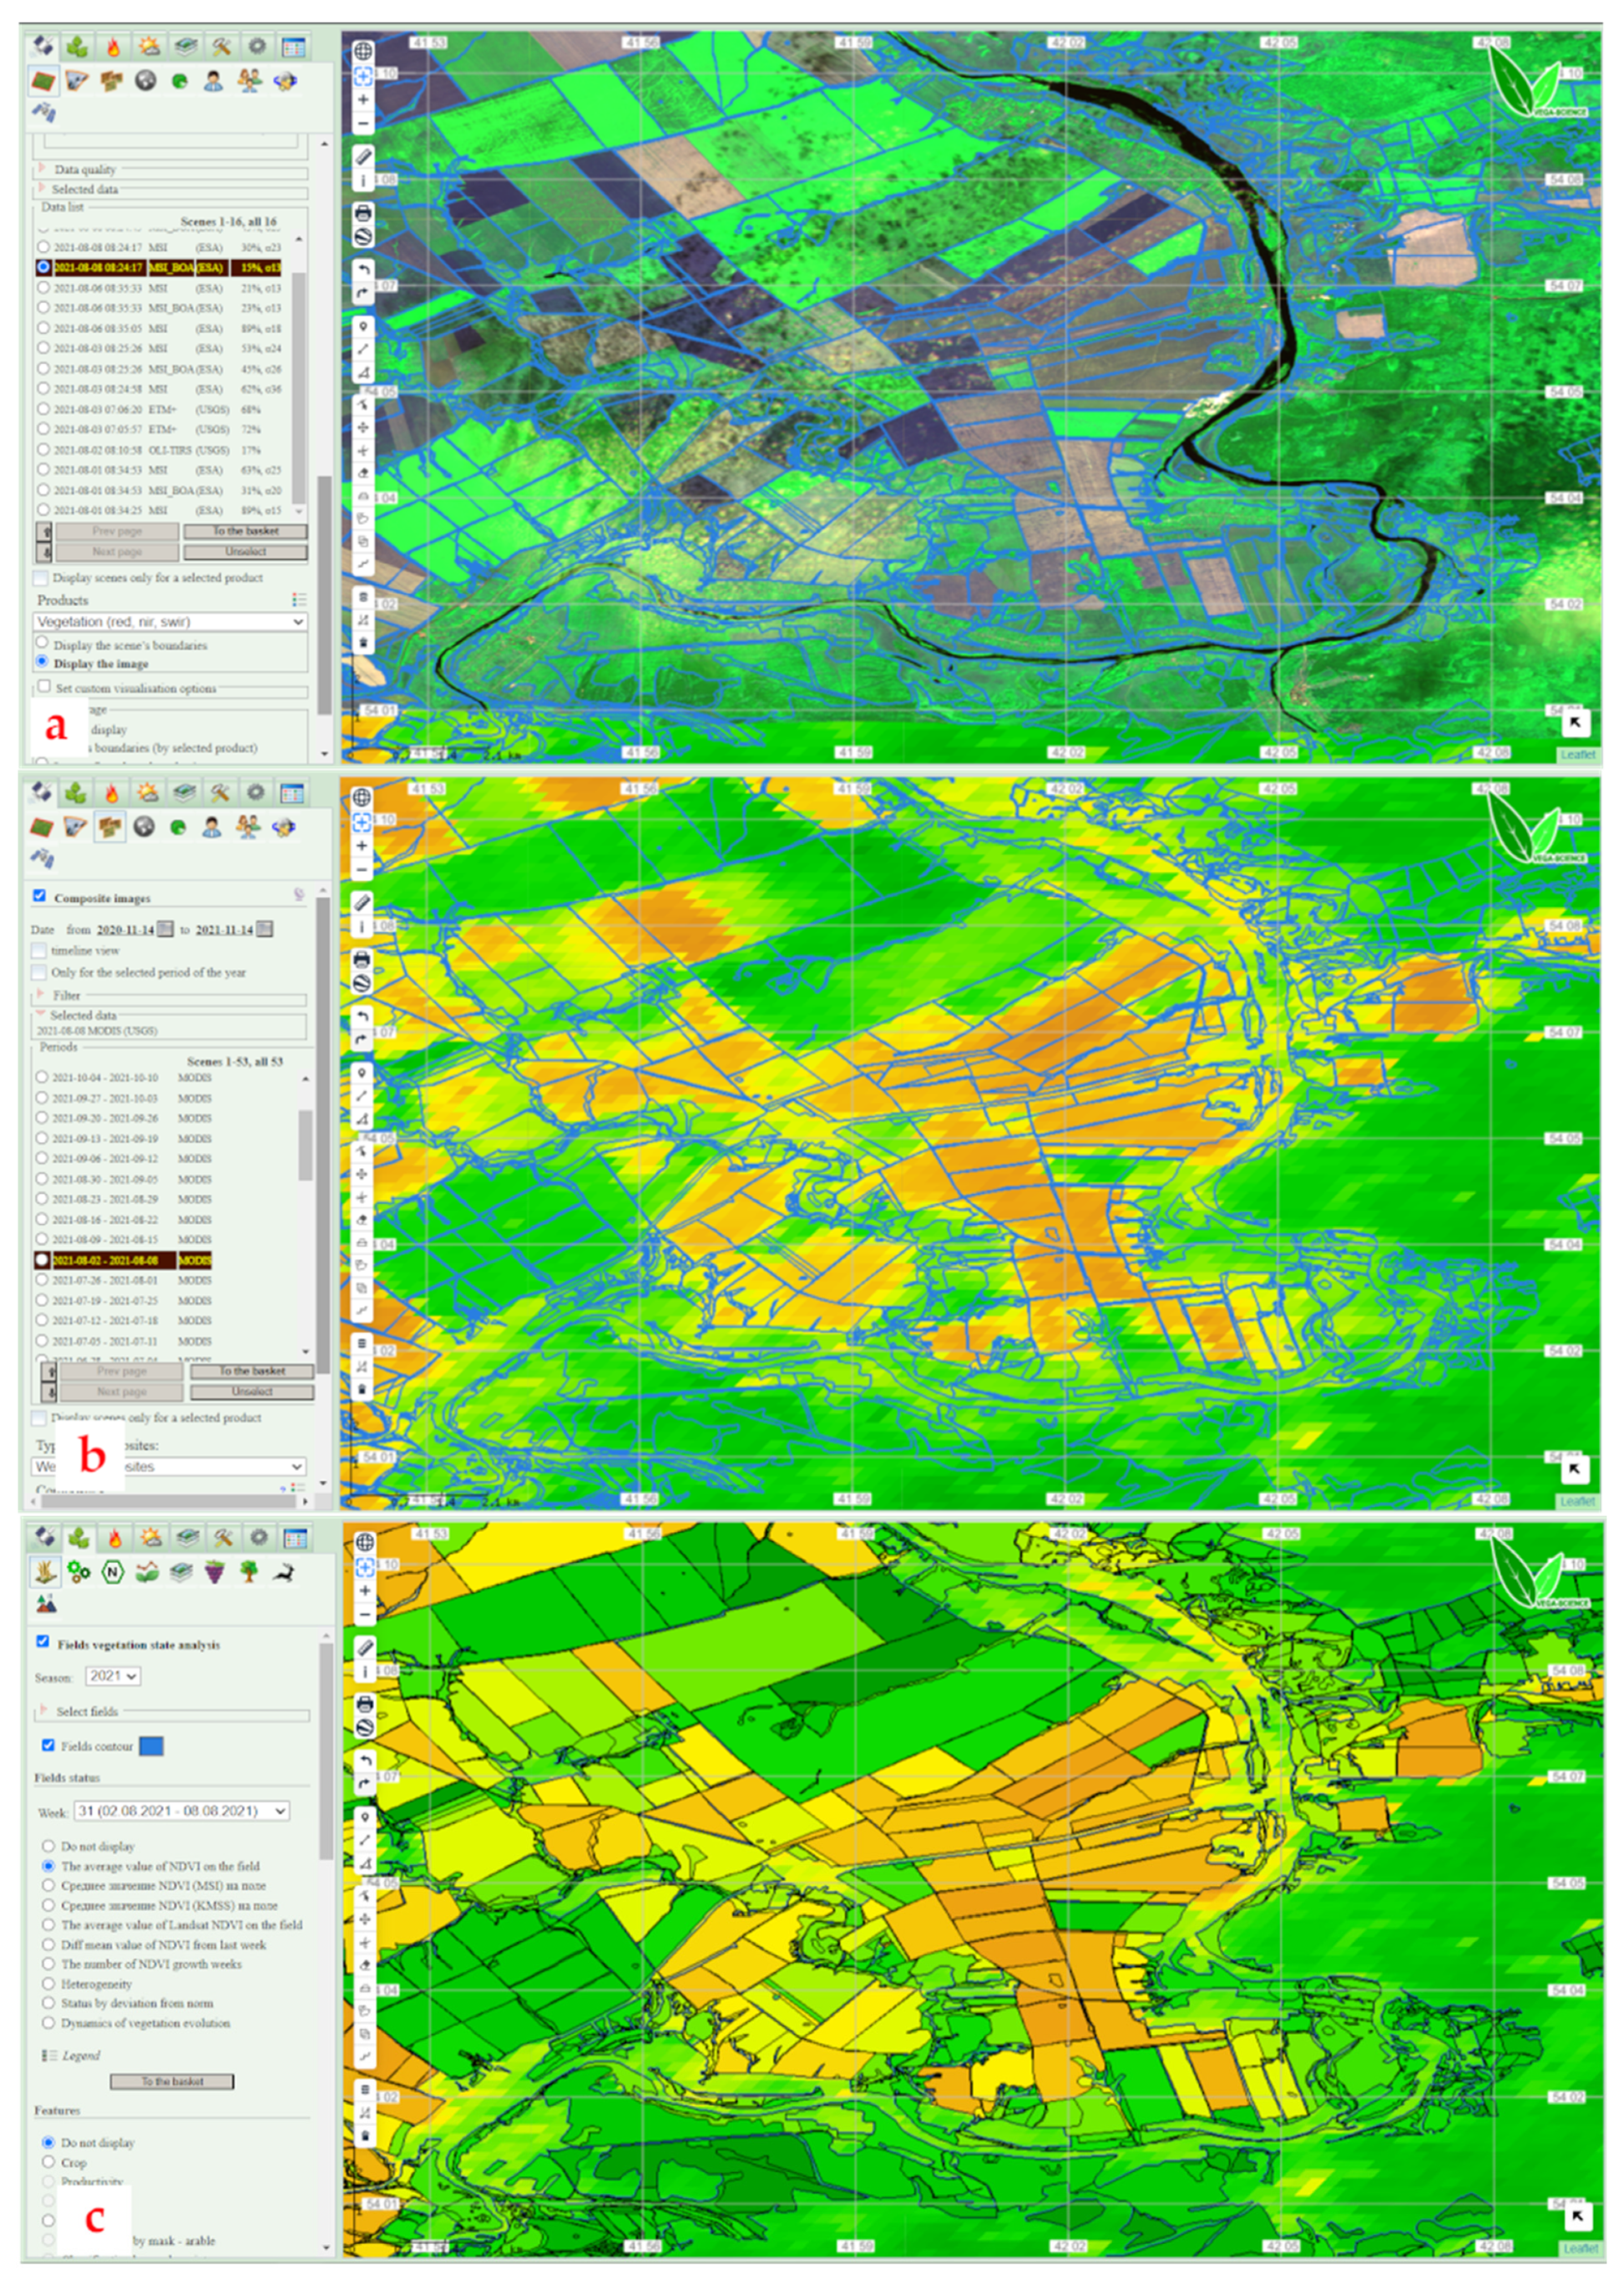
Since the creation of GeoSMIS technology, users’ ideas about comfortably working with cartographic data have changed significantly. In addition, the requirements for the maximum number of users simultaneously working with the analytical capabilities of the system have increased. To support such requirements without detriment to the functionality and capabilities of the systems, the GeoSMIS technology software modules have been upgraded at all levels of the architecture. In particular, the cartographic interface was redesigned to adopt the tile-based map handling technology based on the Leaflet open library. The use of tile-based technology ensured implementation and effective application of map data caching both at the interface and at the application server levels within the “smiswms” service. The use of data cache enabled the users to work quickly and dynamically enough with maps and satellite data processing products generated “on the fly” on any area of interest. As a result, the data caching allowed processing a sufficiently large number of simultaneous requests without a significant increase in the computing power requirements of the center. The modern look of the VEGA-Science cartographic interface was shown earlier in
Figure 1.
3.1.3. ProcGeoSMIS Technology for Interactive Satellite Data Analysis and Processing Tools Implementation
The ProcGeoSMIS technology is designed to implement a wide range of different tools for satellite data analysis and processing in both synchronous and asynchronous modes. A detailed description of this technology can be found in [
42]; thus, only a brief description is given below.
The technology has a modular architecture and includes blocks for data preparation, prepared data sets processing, task control, and storage of results as well as user interface blocks to control processing. Virtually all blocks represent a set of specialized plug-ins built on a single architecture. This approach allows you to quickly and universally expand the set of possible data processing operations, including the use of external computing facilities and software.
3.2. Examples of Data Processing Procedures Implementation in the VEGA-Science System for Various Tasks
The combination of direct access to extra-large distributed archives and of powerful tools for interactive work with data based on modern web technologies allows for the use of the VEGA-Science system for solving a wide range of tasks requiring complex thematic data processing and analysis of long term time series. The tools available to them in the system include a large number of different processing types and algorithms, both general purpose (supervised and unsupervised classification, segmentation, collecting statistics on user-defined objects, histogram analysis, cross-calibration, etc.) and specific ones such as detection of clear-cuts in forests. With these tools, the user can implement quite complex data processing and analysis sequences, including multi-stage ones with storing of intermediate and final results directly in the system. Here, general purpose tools can act as configurable, tunable building blocks for a desired processing sequence. If the actual toolset is sufficient for that, new processing algorithms can be implemented and used directly by users. In some cases, nevertheless, the system lacks something necessary for processing implementation, e.g., results databases of specific structure or some processing blocks, and then the users must cooperate with the system developers to add those features. The modular structure of the system allows for easy enough integration of new specific or general purpose tools that usually appear for a specific task or project. Unfortunately, at the current stage of the system’s evolution, the user has no possibility of adding new tools to it, but the introduction of such a possibility is one of the main directions of further modernization of the system. Below, examples of the implementation of such complex processing procedures and specific tools for specific application tasks are described.
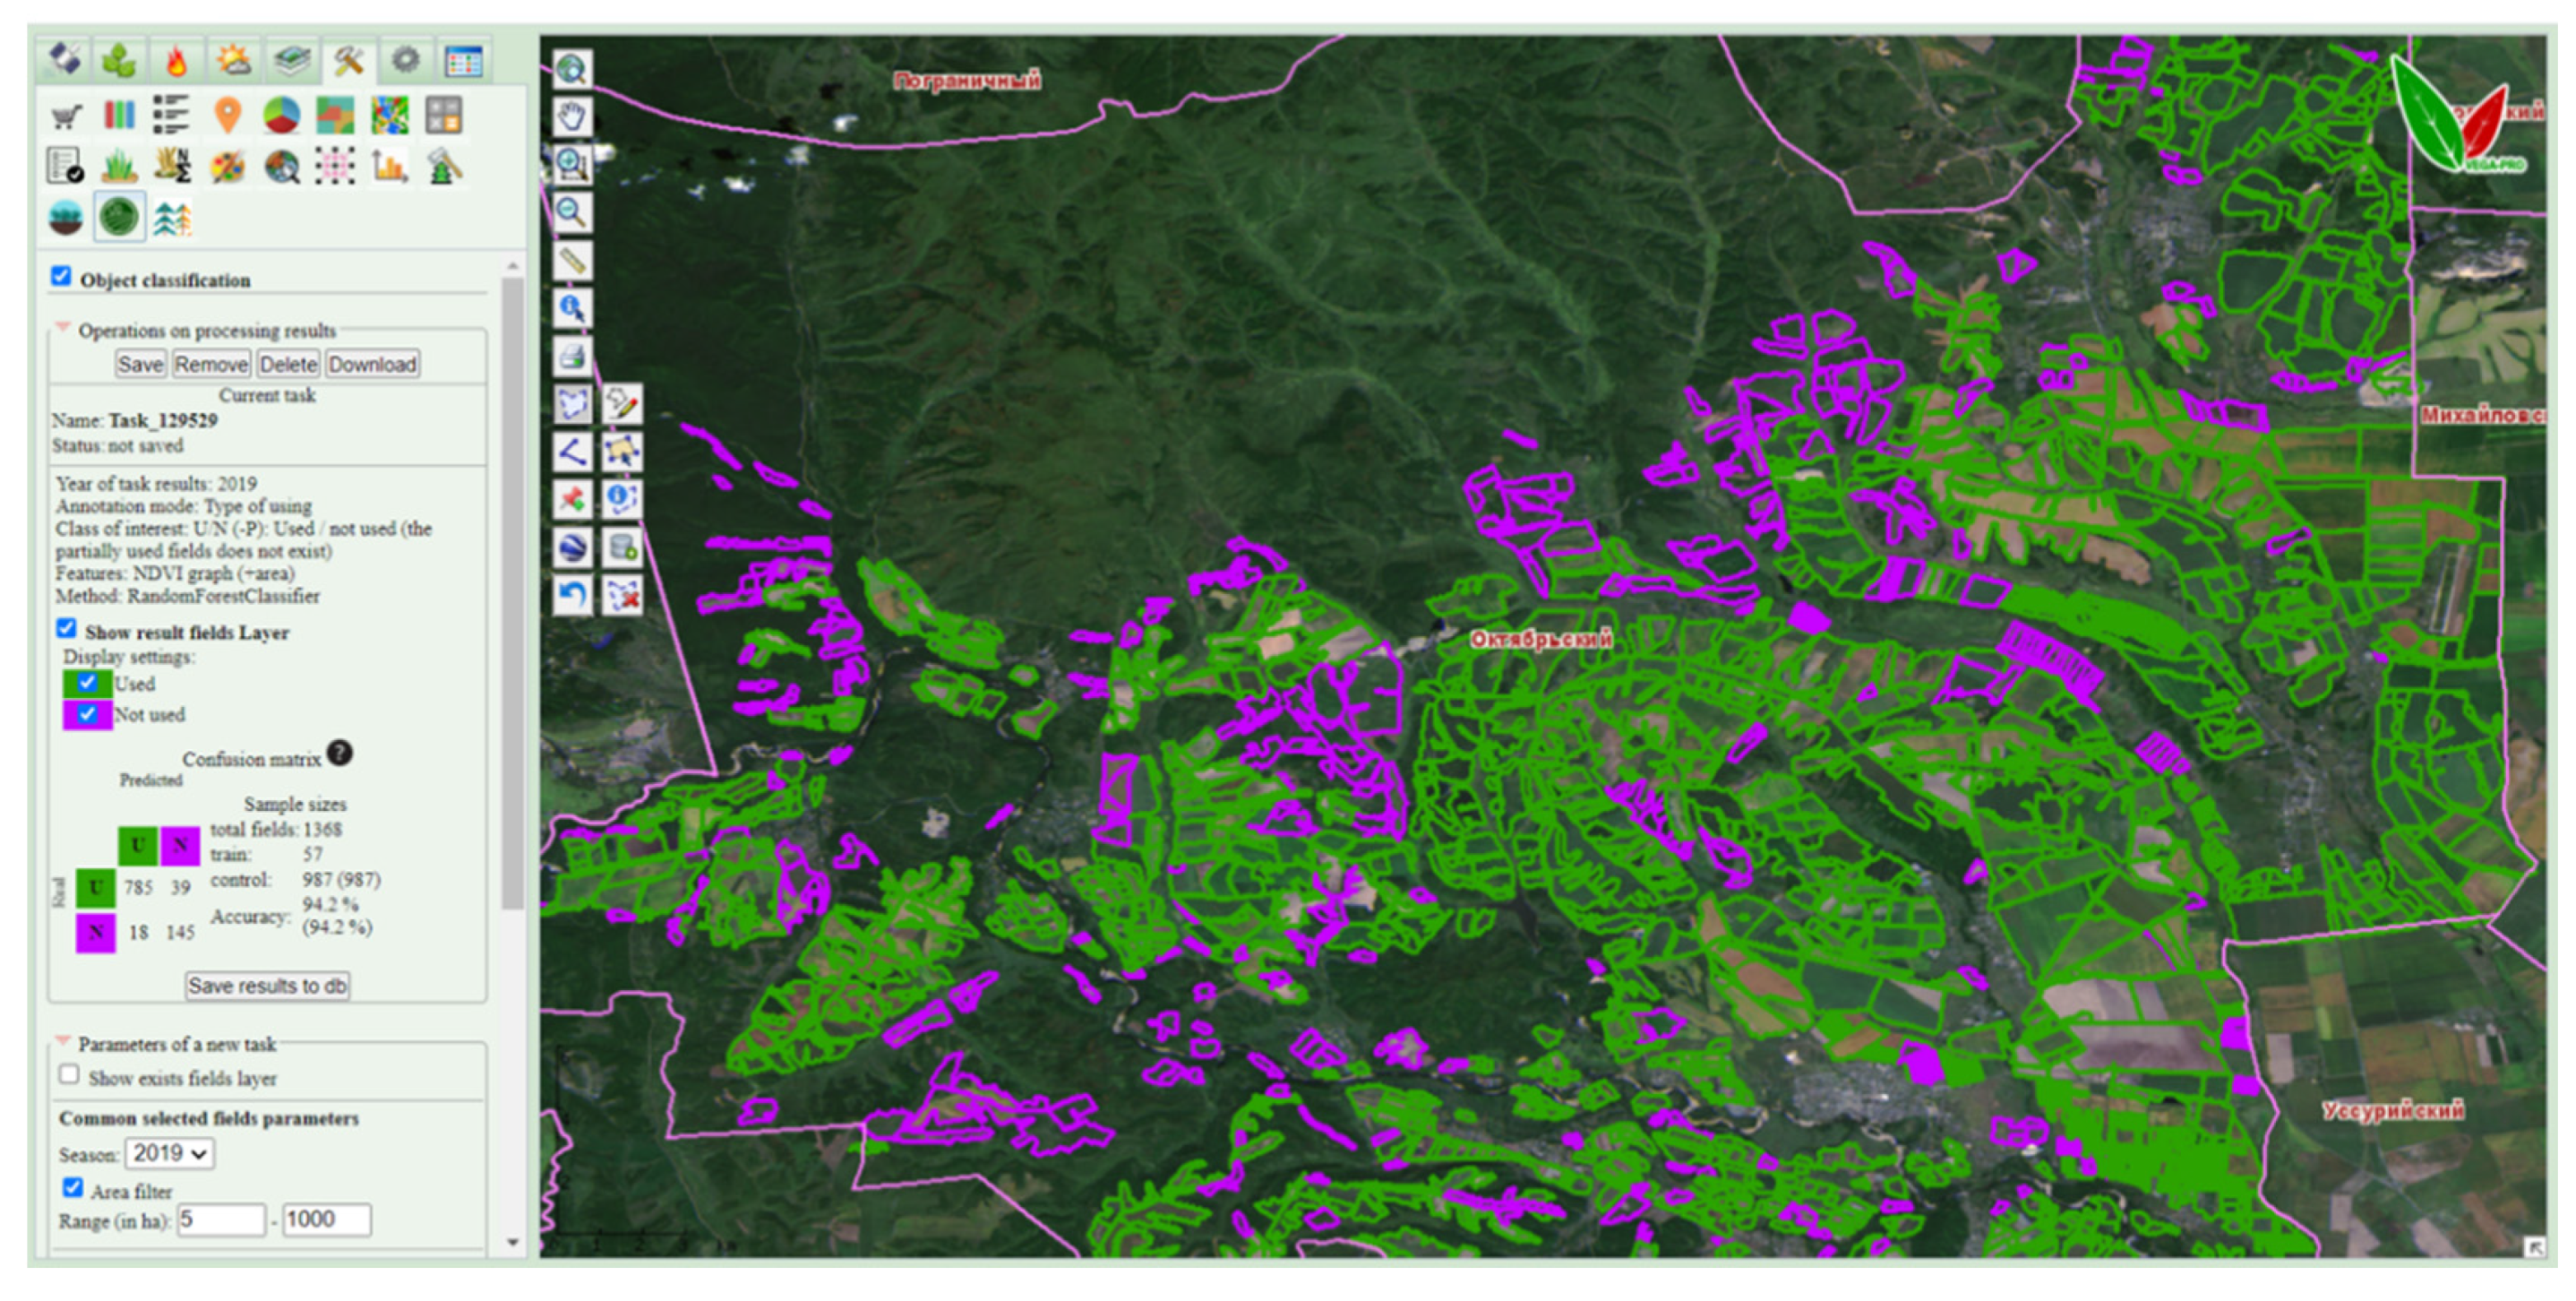
3.2.1. Assessment of Agricultural Land Usage
One of the most urgent and regular tasks in agriculture, requiring the use of remote sensing data, is to obtain information on the real state of agricultural land, on whether and how it is used for its intended purpose. Solution of this complex task requires a large amount of input data and their complex, multi-step processing. It is required to determine which areas in the area of interest are arable lands, collect multi-year series of homogeneous data for these areas, obtain the boundaries of specific agricultural fields and average the collected data on the obtained fields. Only after that does it becomes possible to determine how certain lands are used.
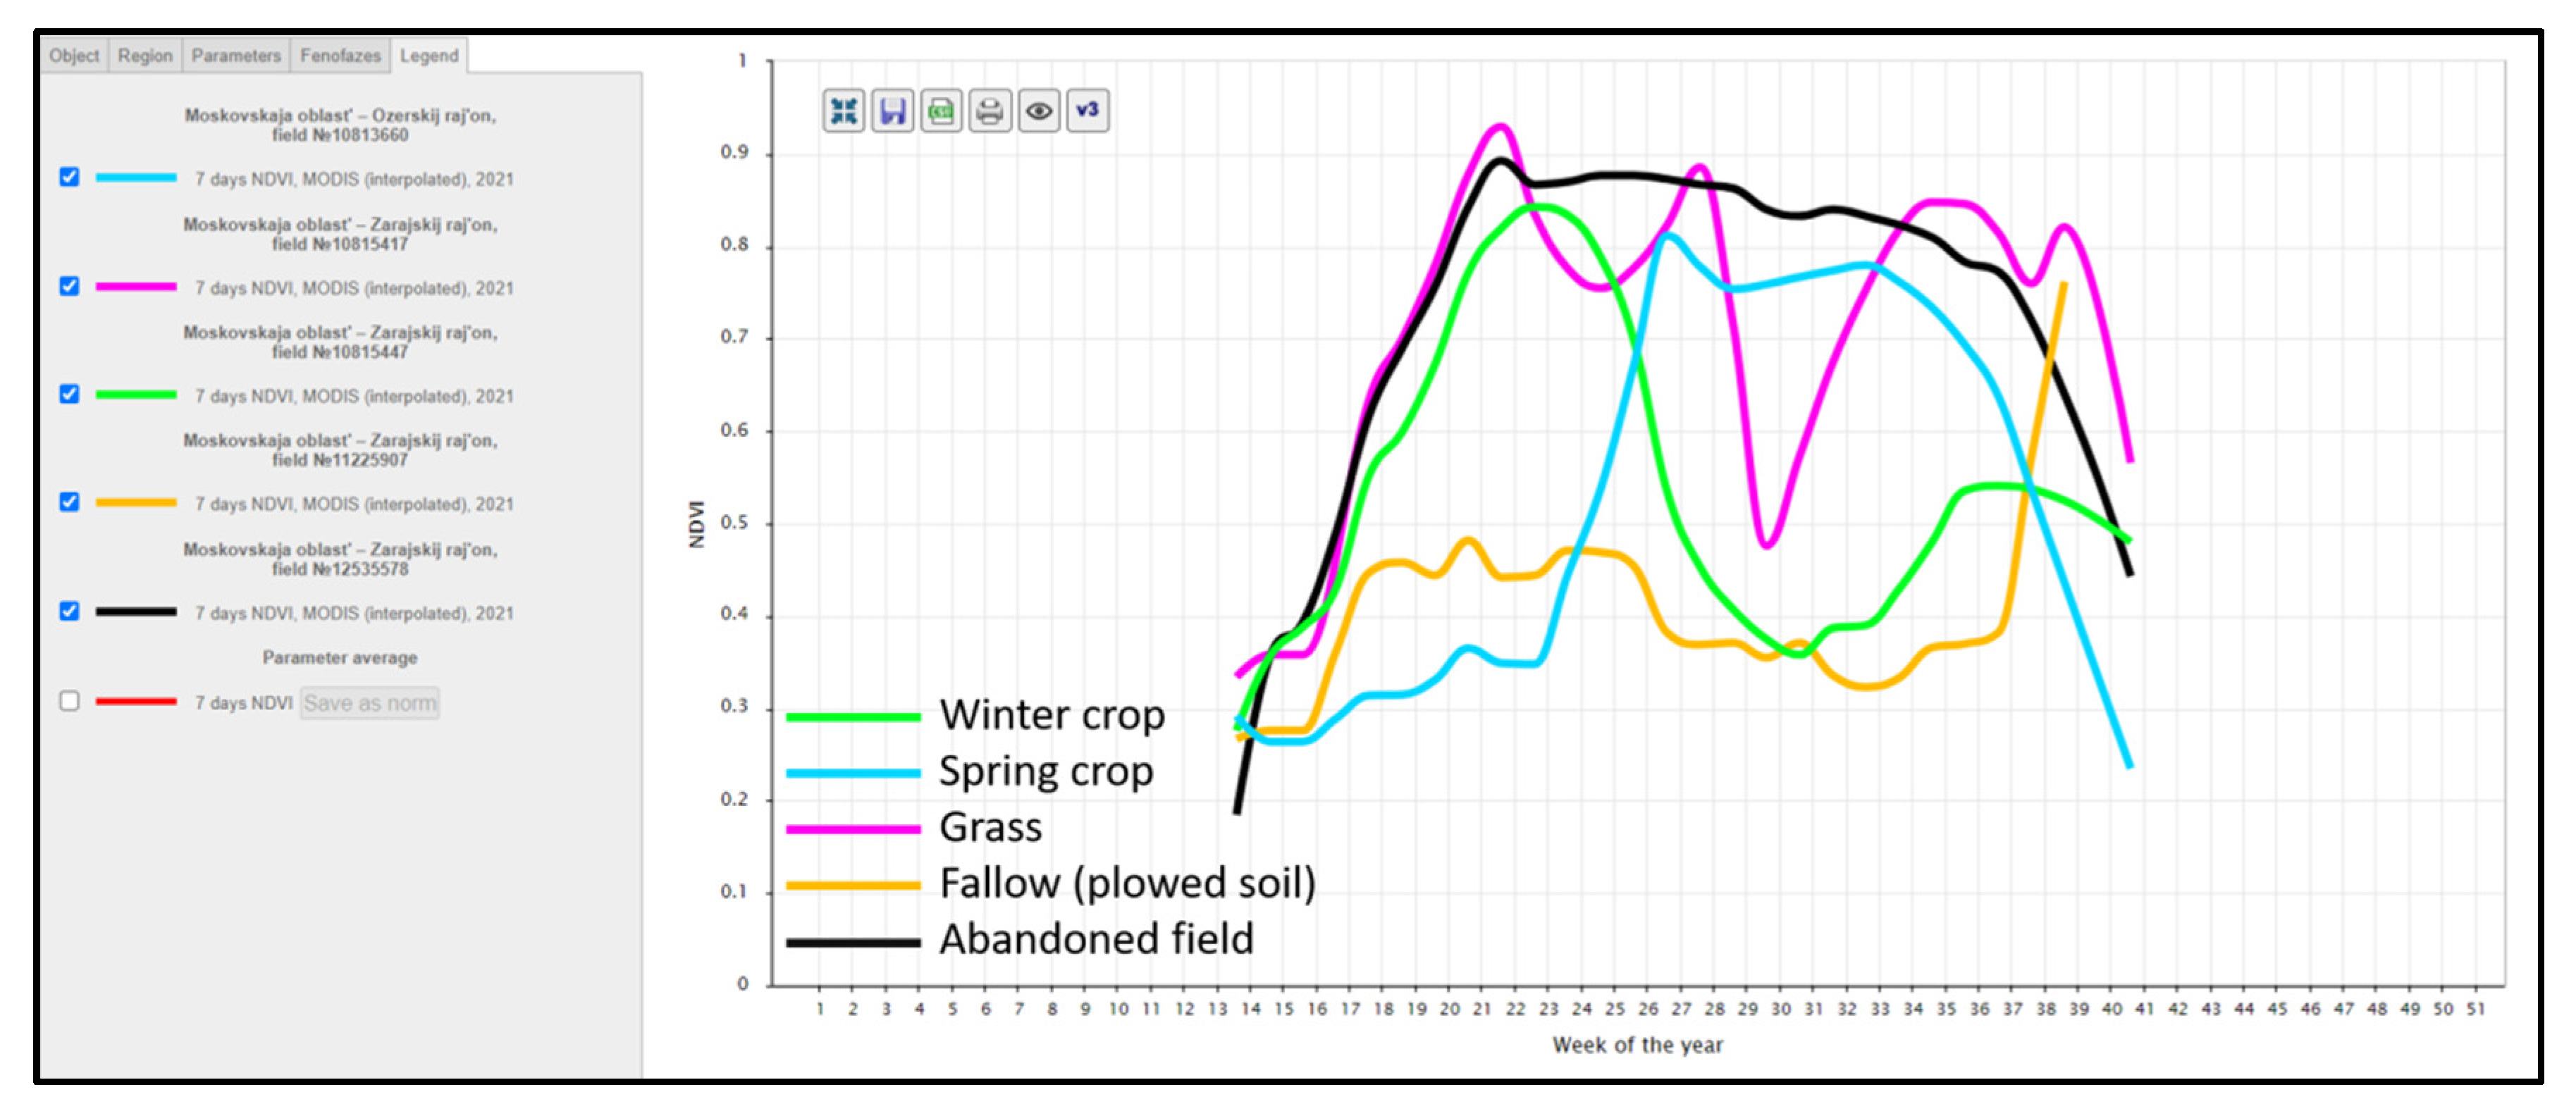
The most effective approach, which allows to carry out the assessment of arable land use with high reliability over large areas, is the use of object-oriented classification of vegetation indices
dynamics data time series averaged within the boundaries of fields. In this case, as practice shows, it is possible to achieve up to 90% reliability of results [
43]. The effectiveness of the object-oriented classification is due to the significant difference in the dynamics of vegetation indices typical for used and unused arable land (
Figure 2).
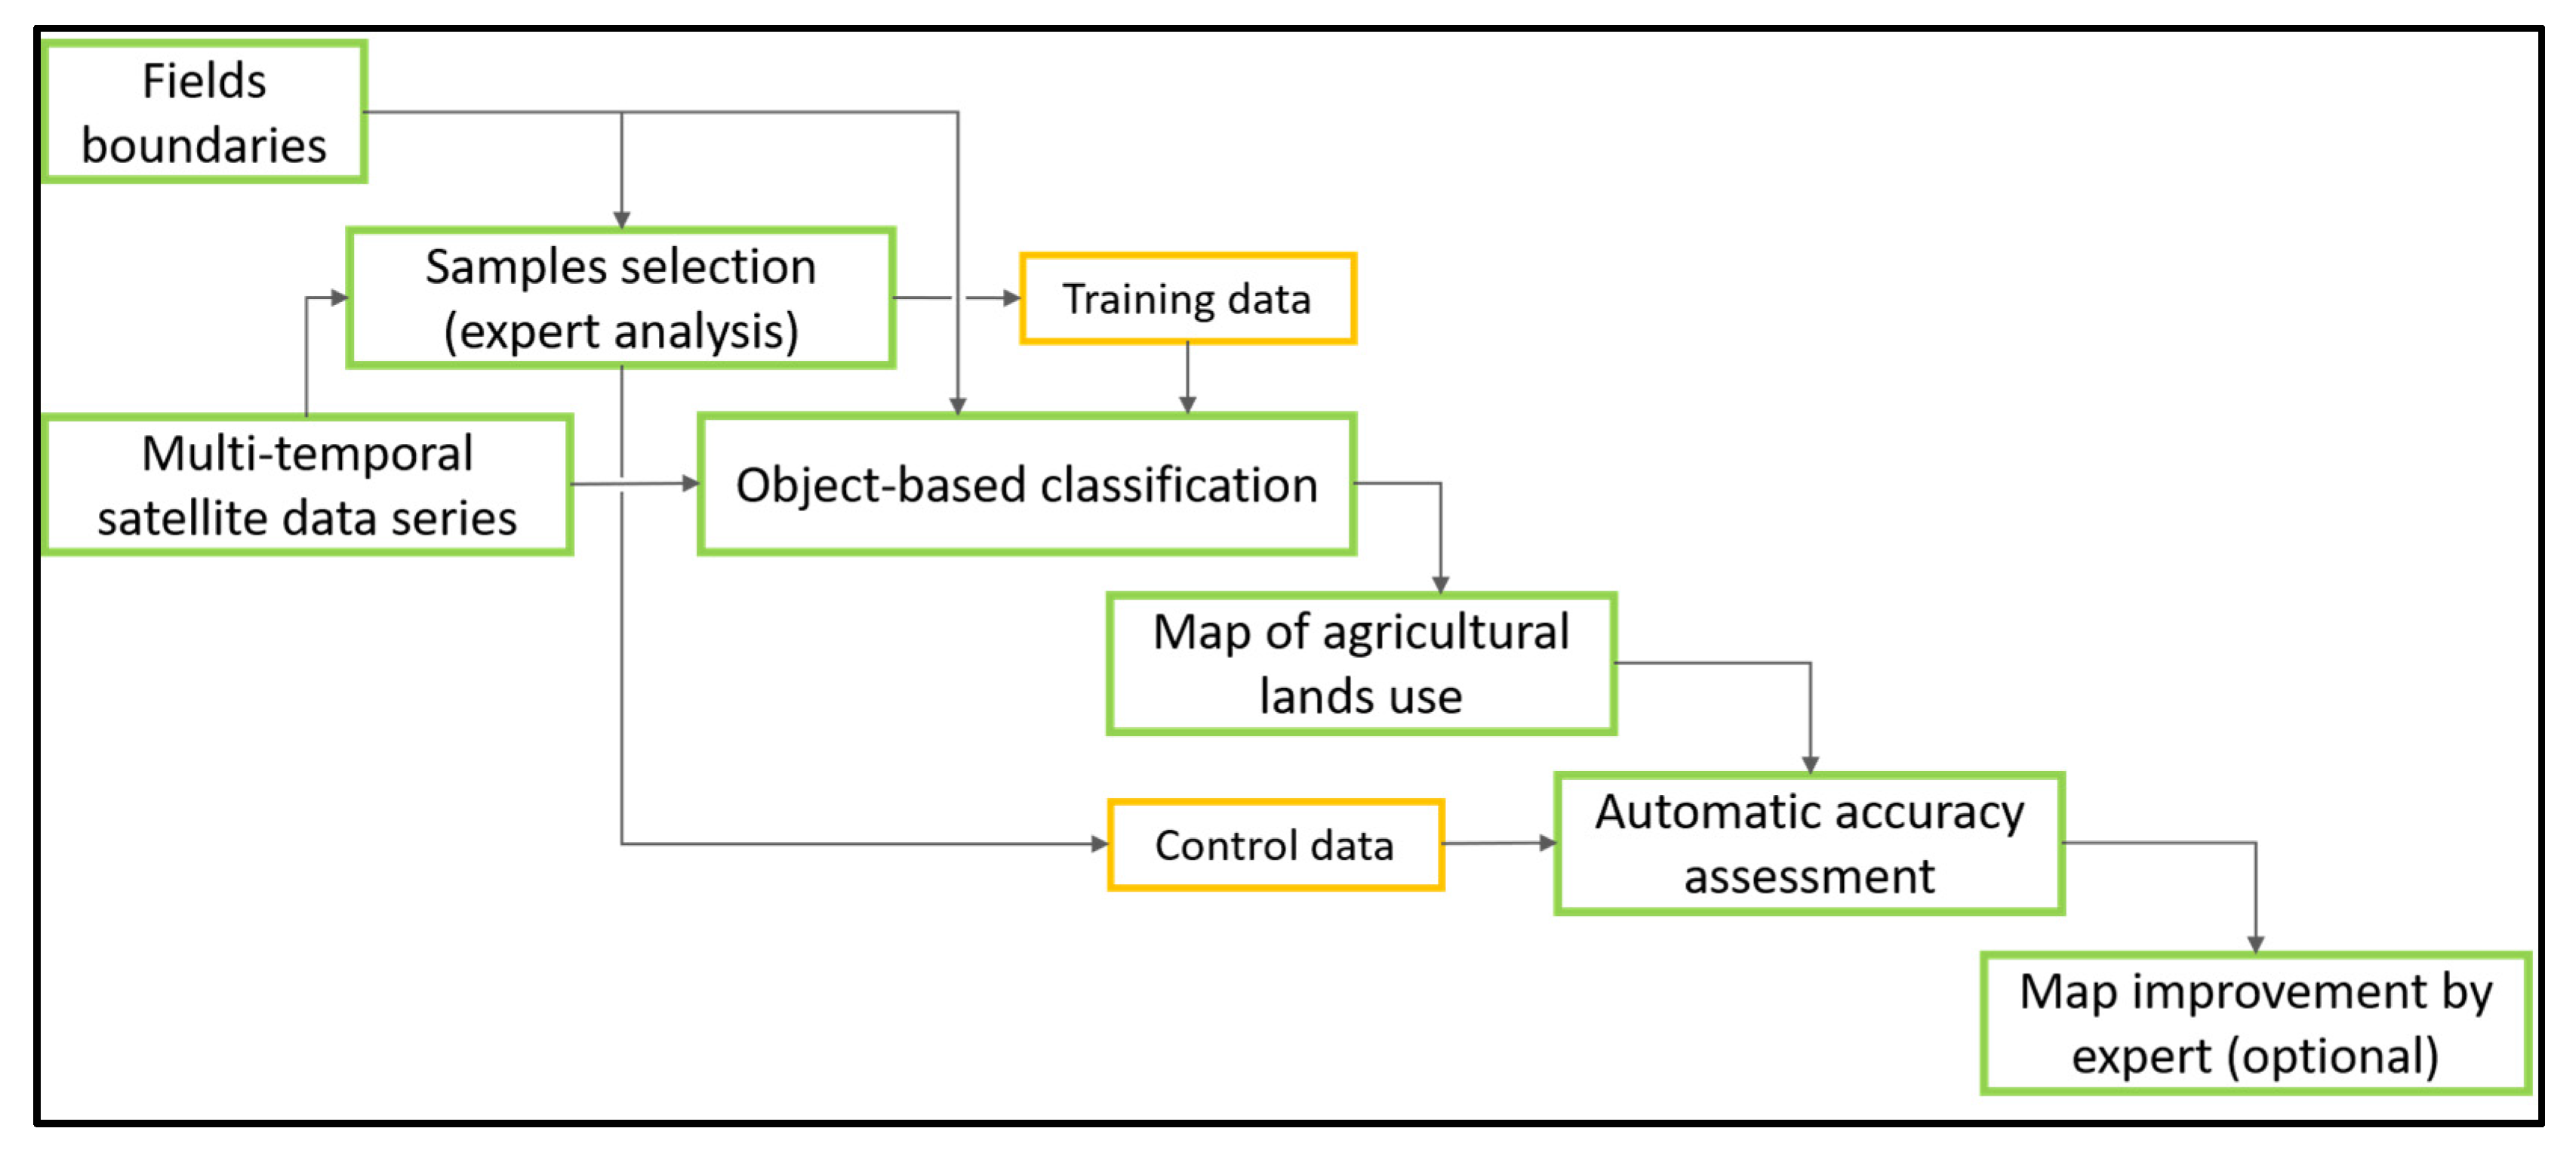
A generalized block diagram of the arable land use automated assessment specialized tool implemented in the “VEGA-Science” service is shown in
Figure 3, and an example of its operation is shown in
Figure 4.
In general, we can say that the combined use of NDVI time series and an object-oriented approach allows us to determine arable land use in an automated mode reliably. The service-based approach can significantly reduce the time costs of creating and updating maps of land use at the district and subject levels for a wide range of users.
The use of such tools makes it possible to regularly obtain up-to-date information on the state of agricultural lands on different scales, which has both scientific and applied importance for agricultural producers, insurers, credit organizations, and controlling bodies. In particular, on the basis of the shown tools and approach, the Federal State Statistics Service (Rosstat) carries out the 2021 agricultural microcensus.
3.2.2. Accurate Mapping of Burnt Areas
Algorithms for mapping the burnt areas with medium-resolution data, in particular, MODIS data [
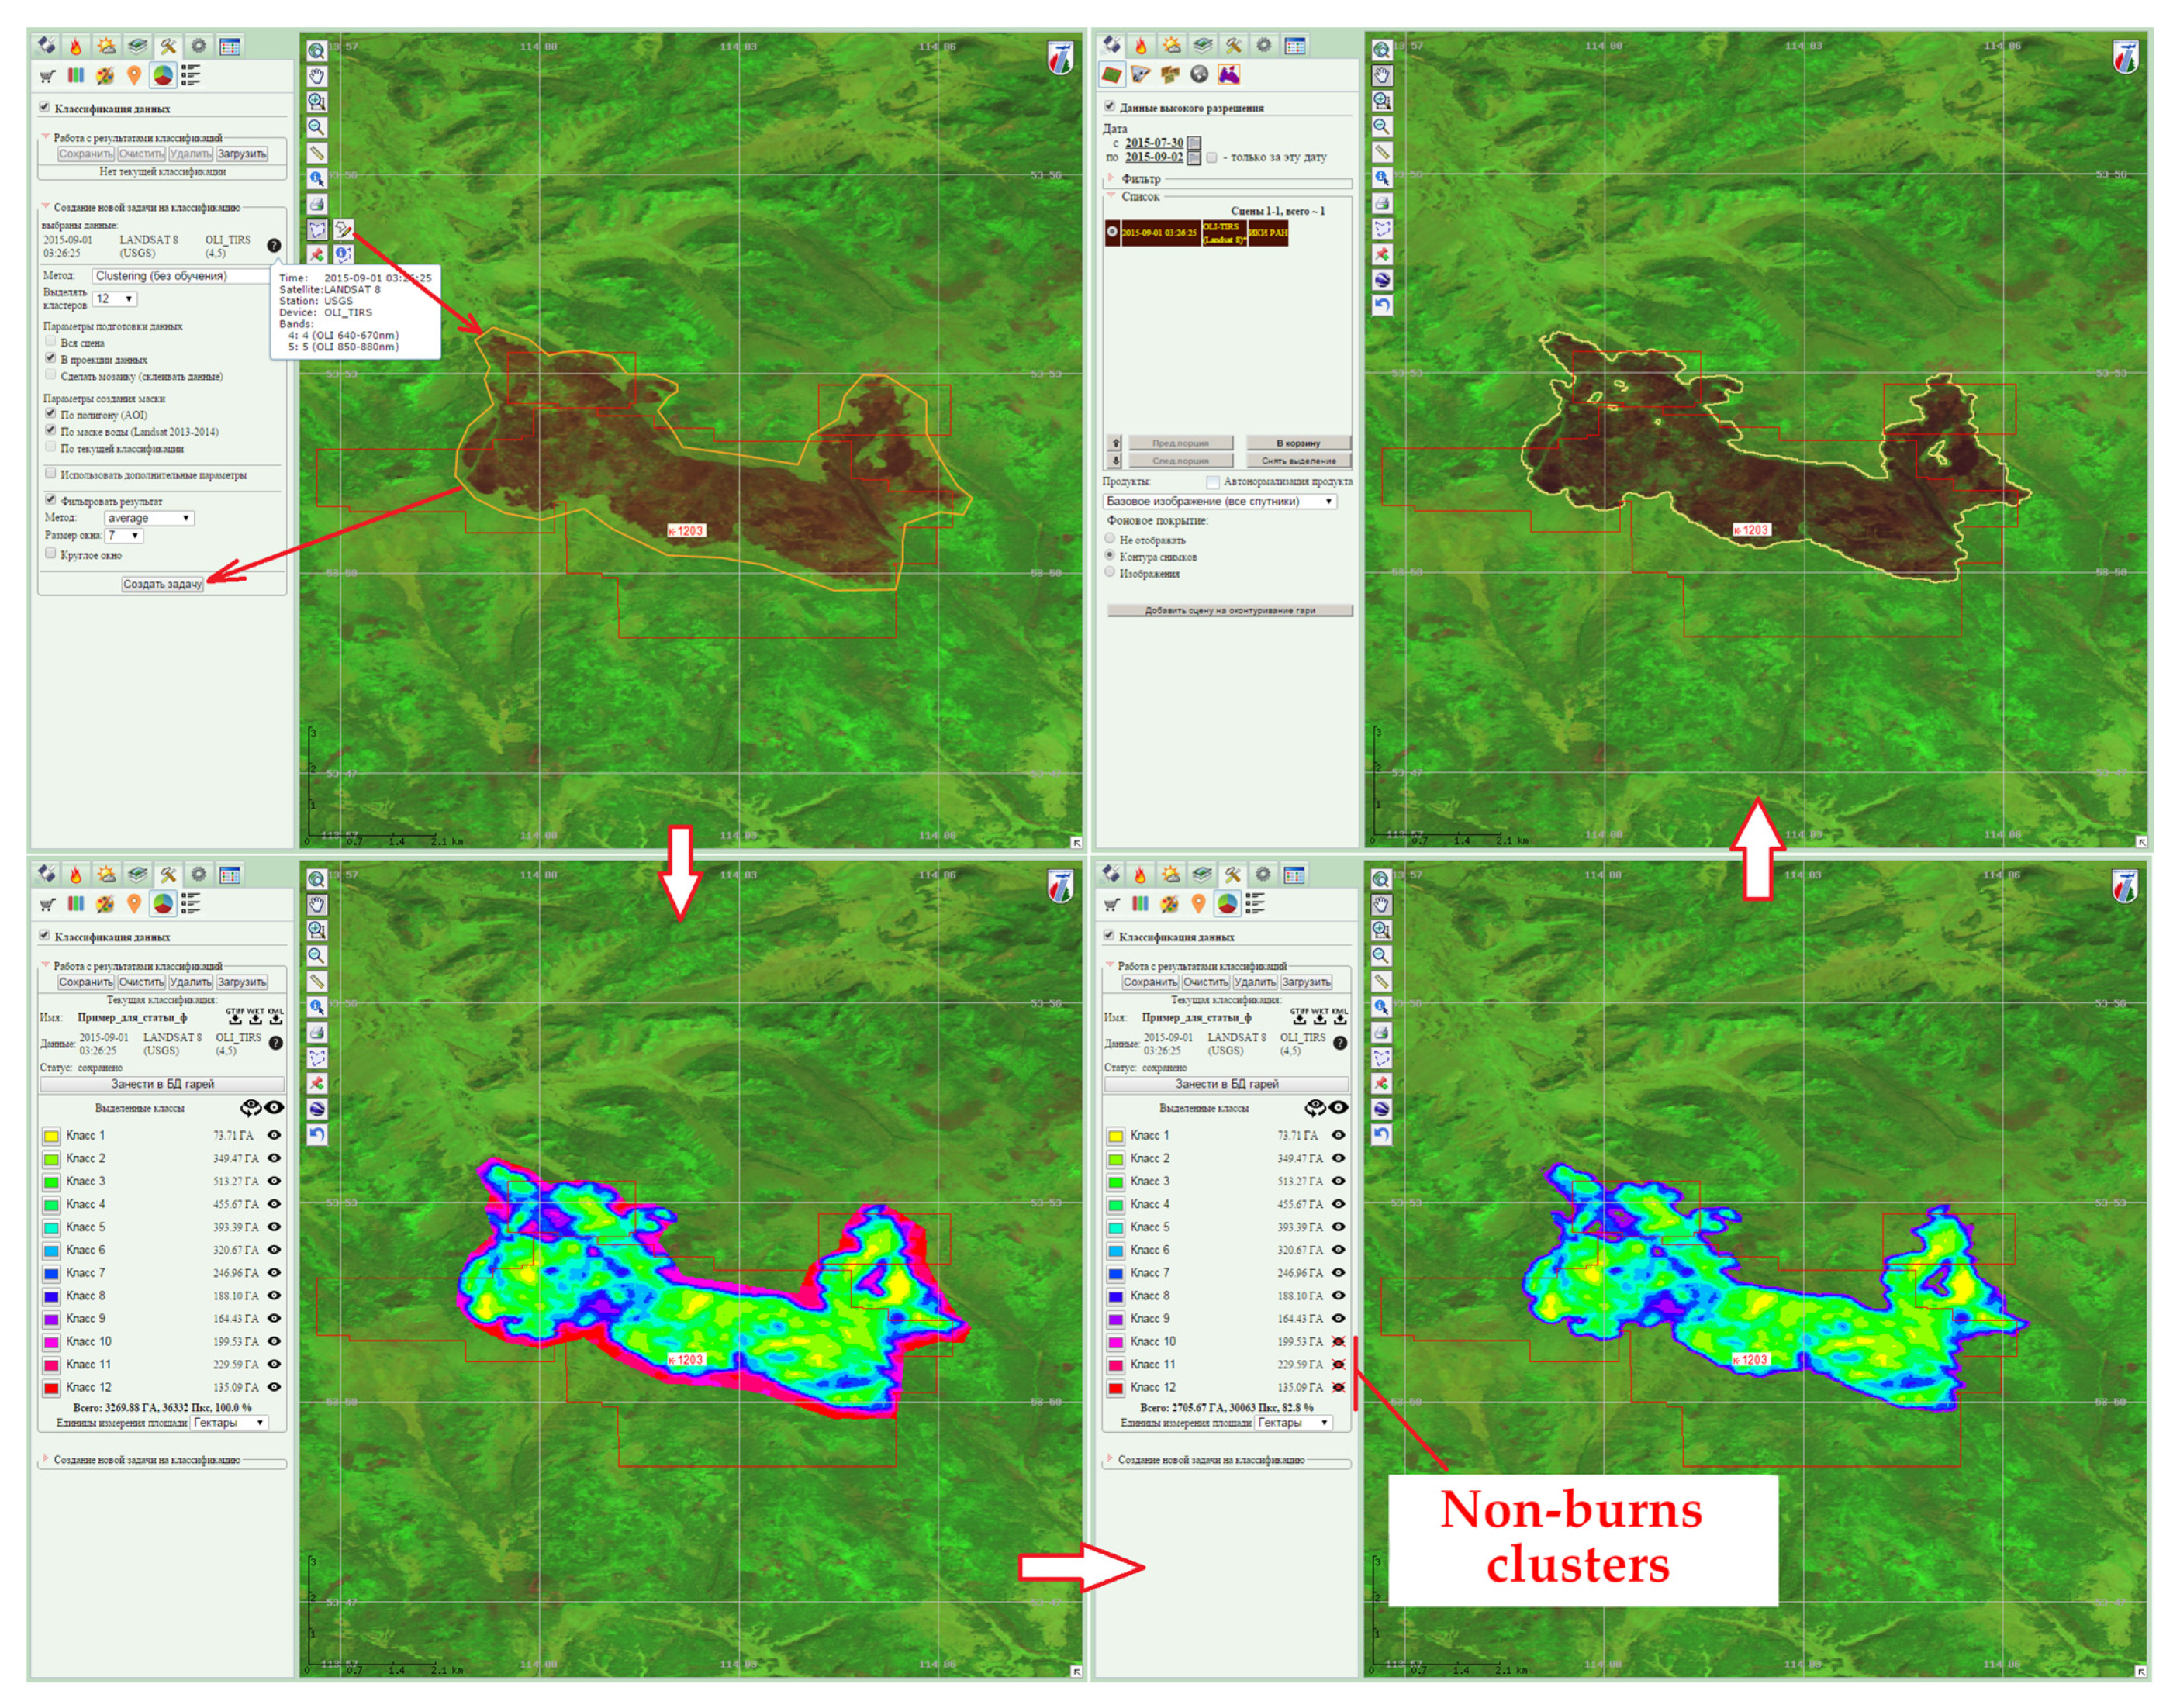
29], working in the fully automatic mode, have been successfully used for the past years. The resulting area estimates are not always accurate, especially for small fires, which necessitates the use of higher spatial resolution data. Since there are still no reliable, fully automatic procedures for mapping large burnt areas with such information, various approaches requiring interactive analysis have been used to solve this problem. The key requirement for the burnt area contouring procedure is to reduce its labor intensity, since these areas must be evaluated throughout the entire Russian territory and throughout the entire fire season, which requires contouring the burnt areas for a huge number of fires.
The mapping method presented here is based on the use of satellite data unsupervised classification in the fire area of interest (AOI) [
34]. The main idea behind this method is to replace the visual precise contouring of a fire with a procedure for unsupervised classification results analysis, which ultimately boils down to selecting from a fairly limited number of classes related to the fire.
Input data for the method are fire contours obtained by aggregation of detected hotspots from MODIS (AQUA, TERRA satellites) and VIIRS (NPP satellite) instruments data. The output information is the contours of burnt areas refined from high resolution data. The general scheme of the developed mapping algorithm is shown in
Figure 5.
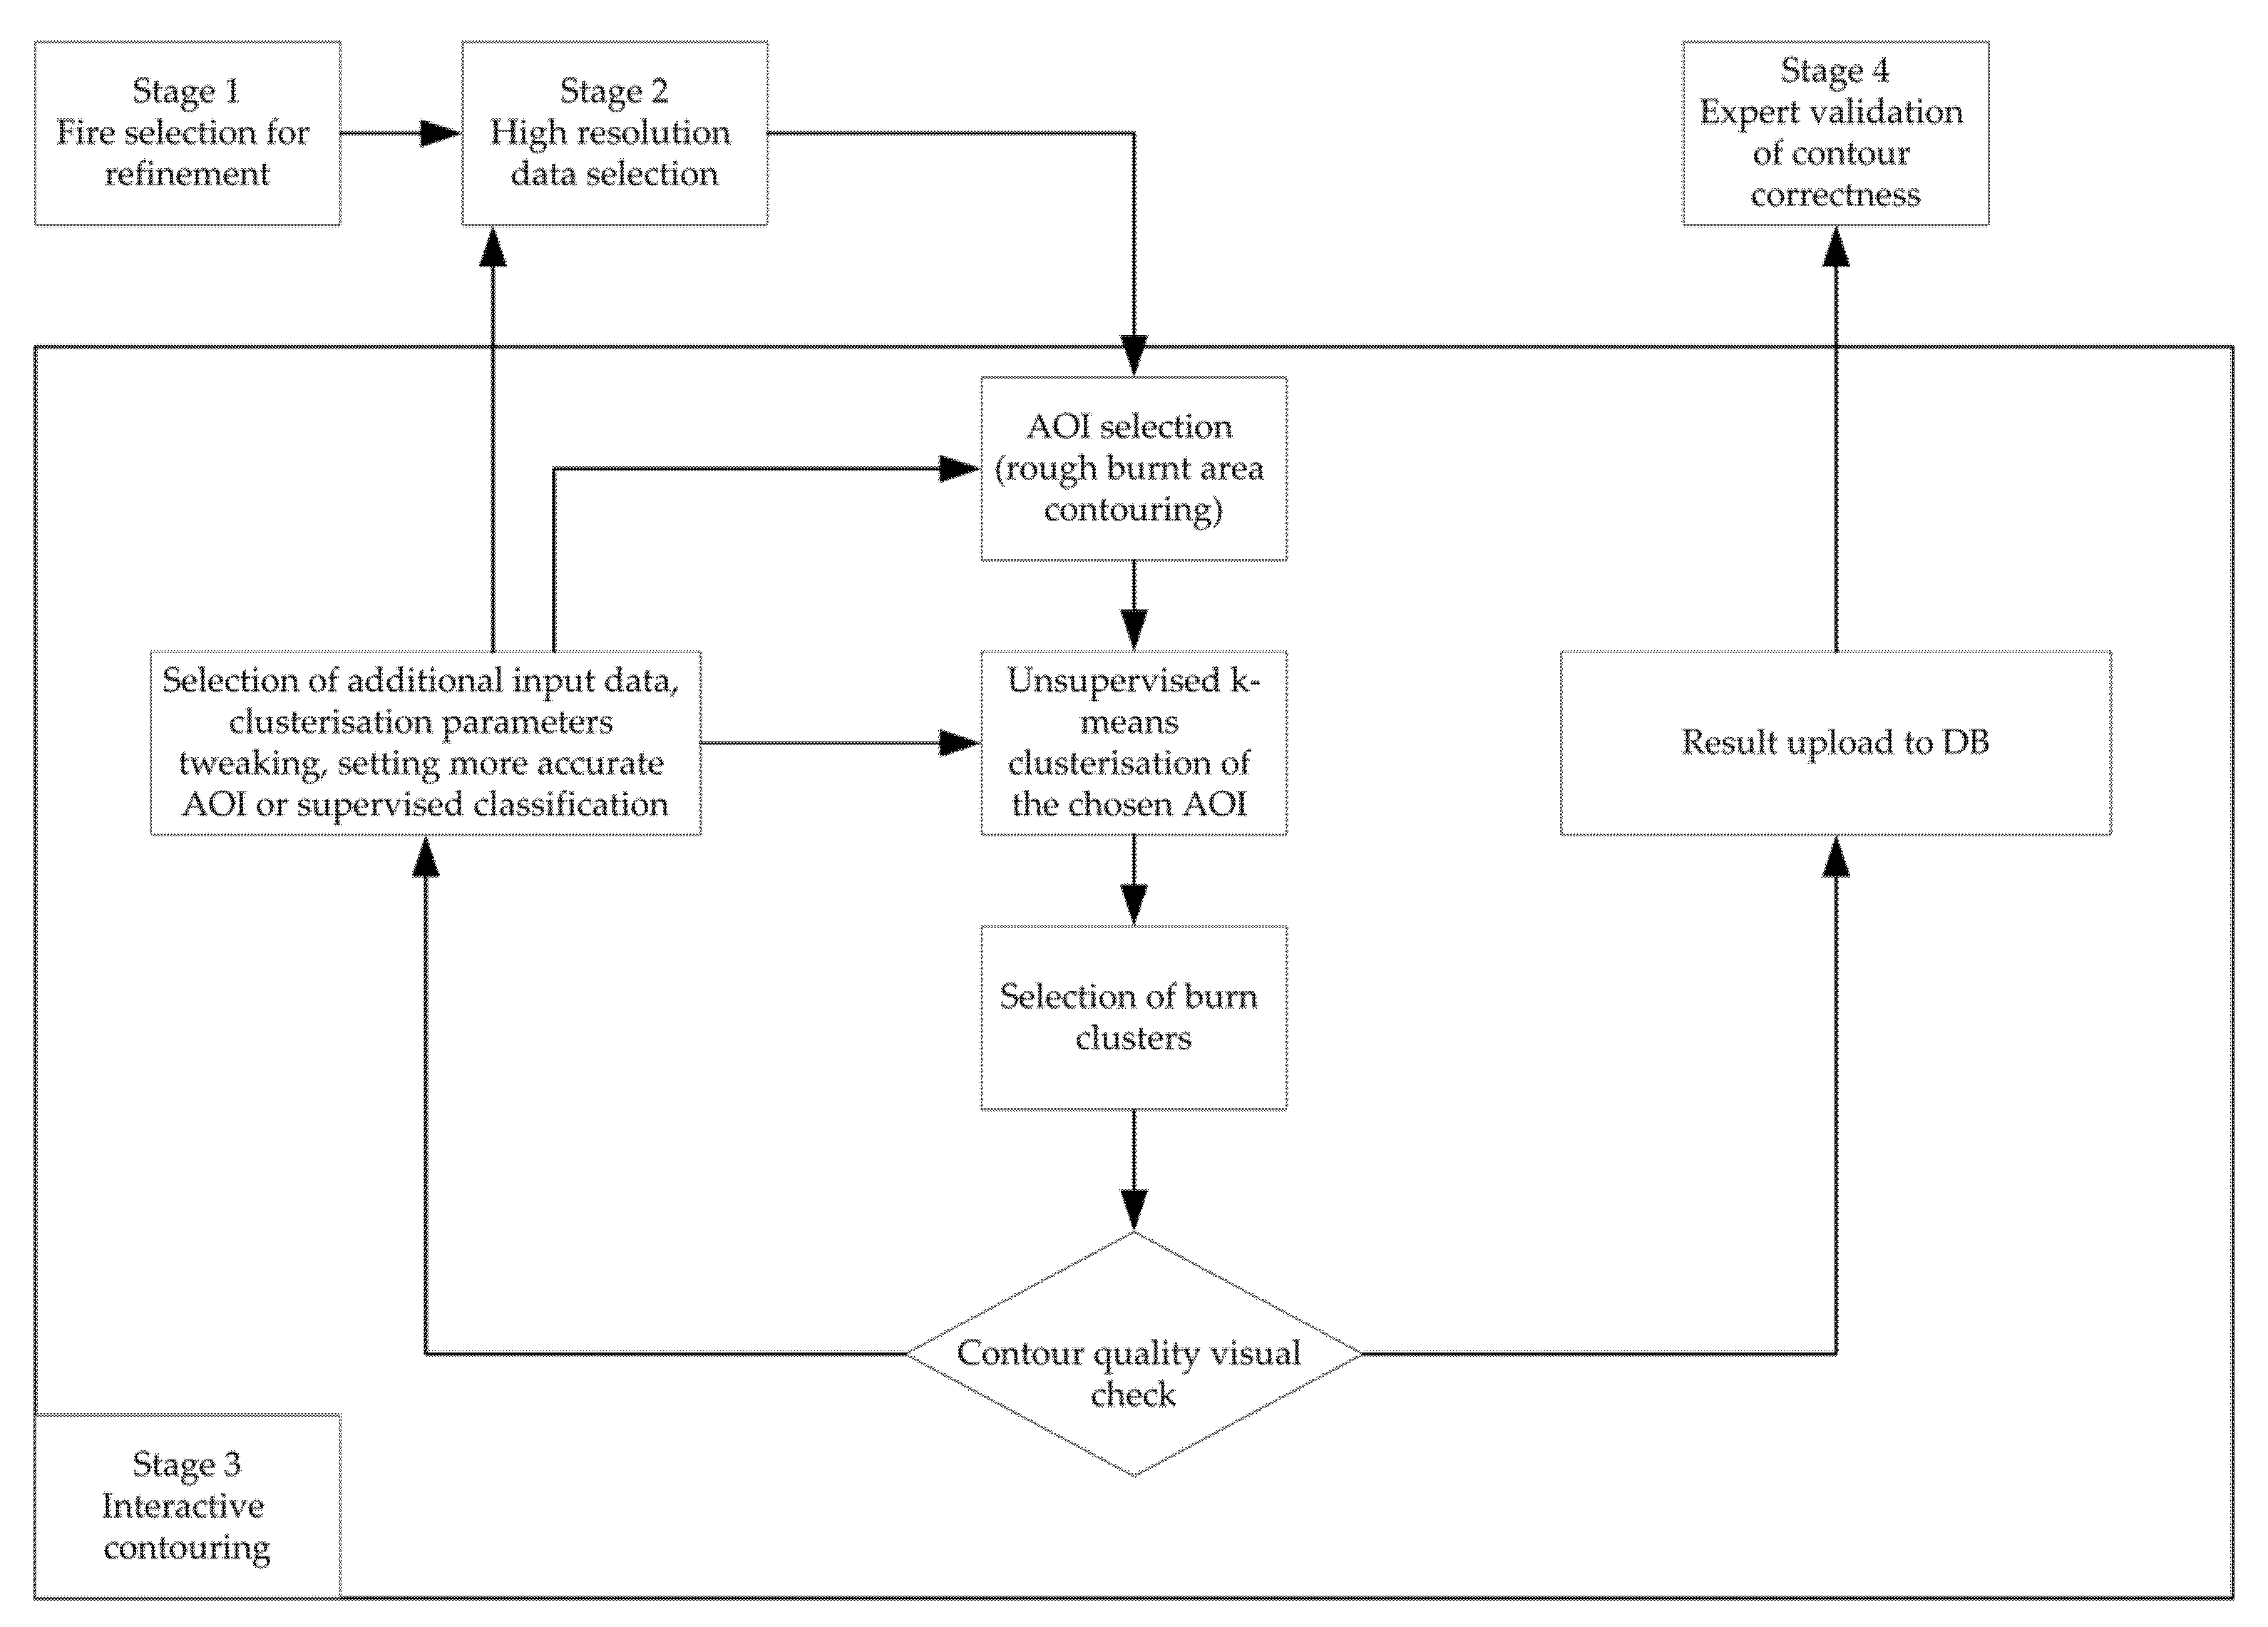
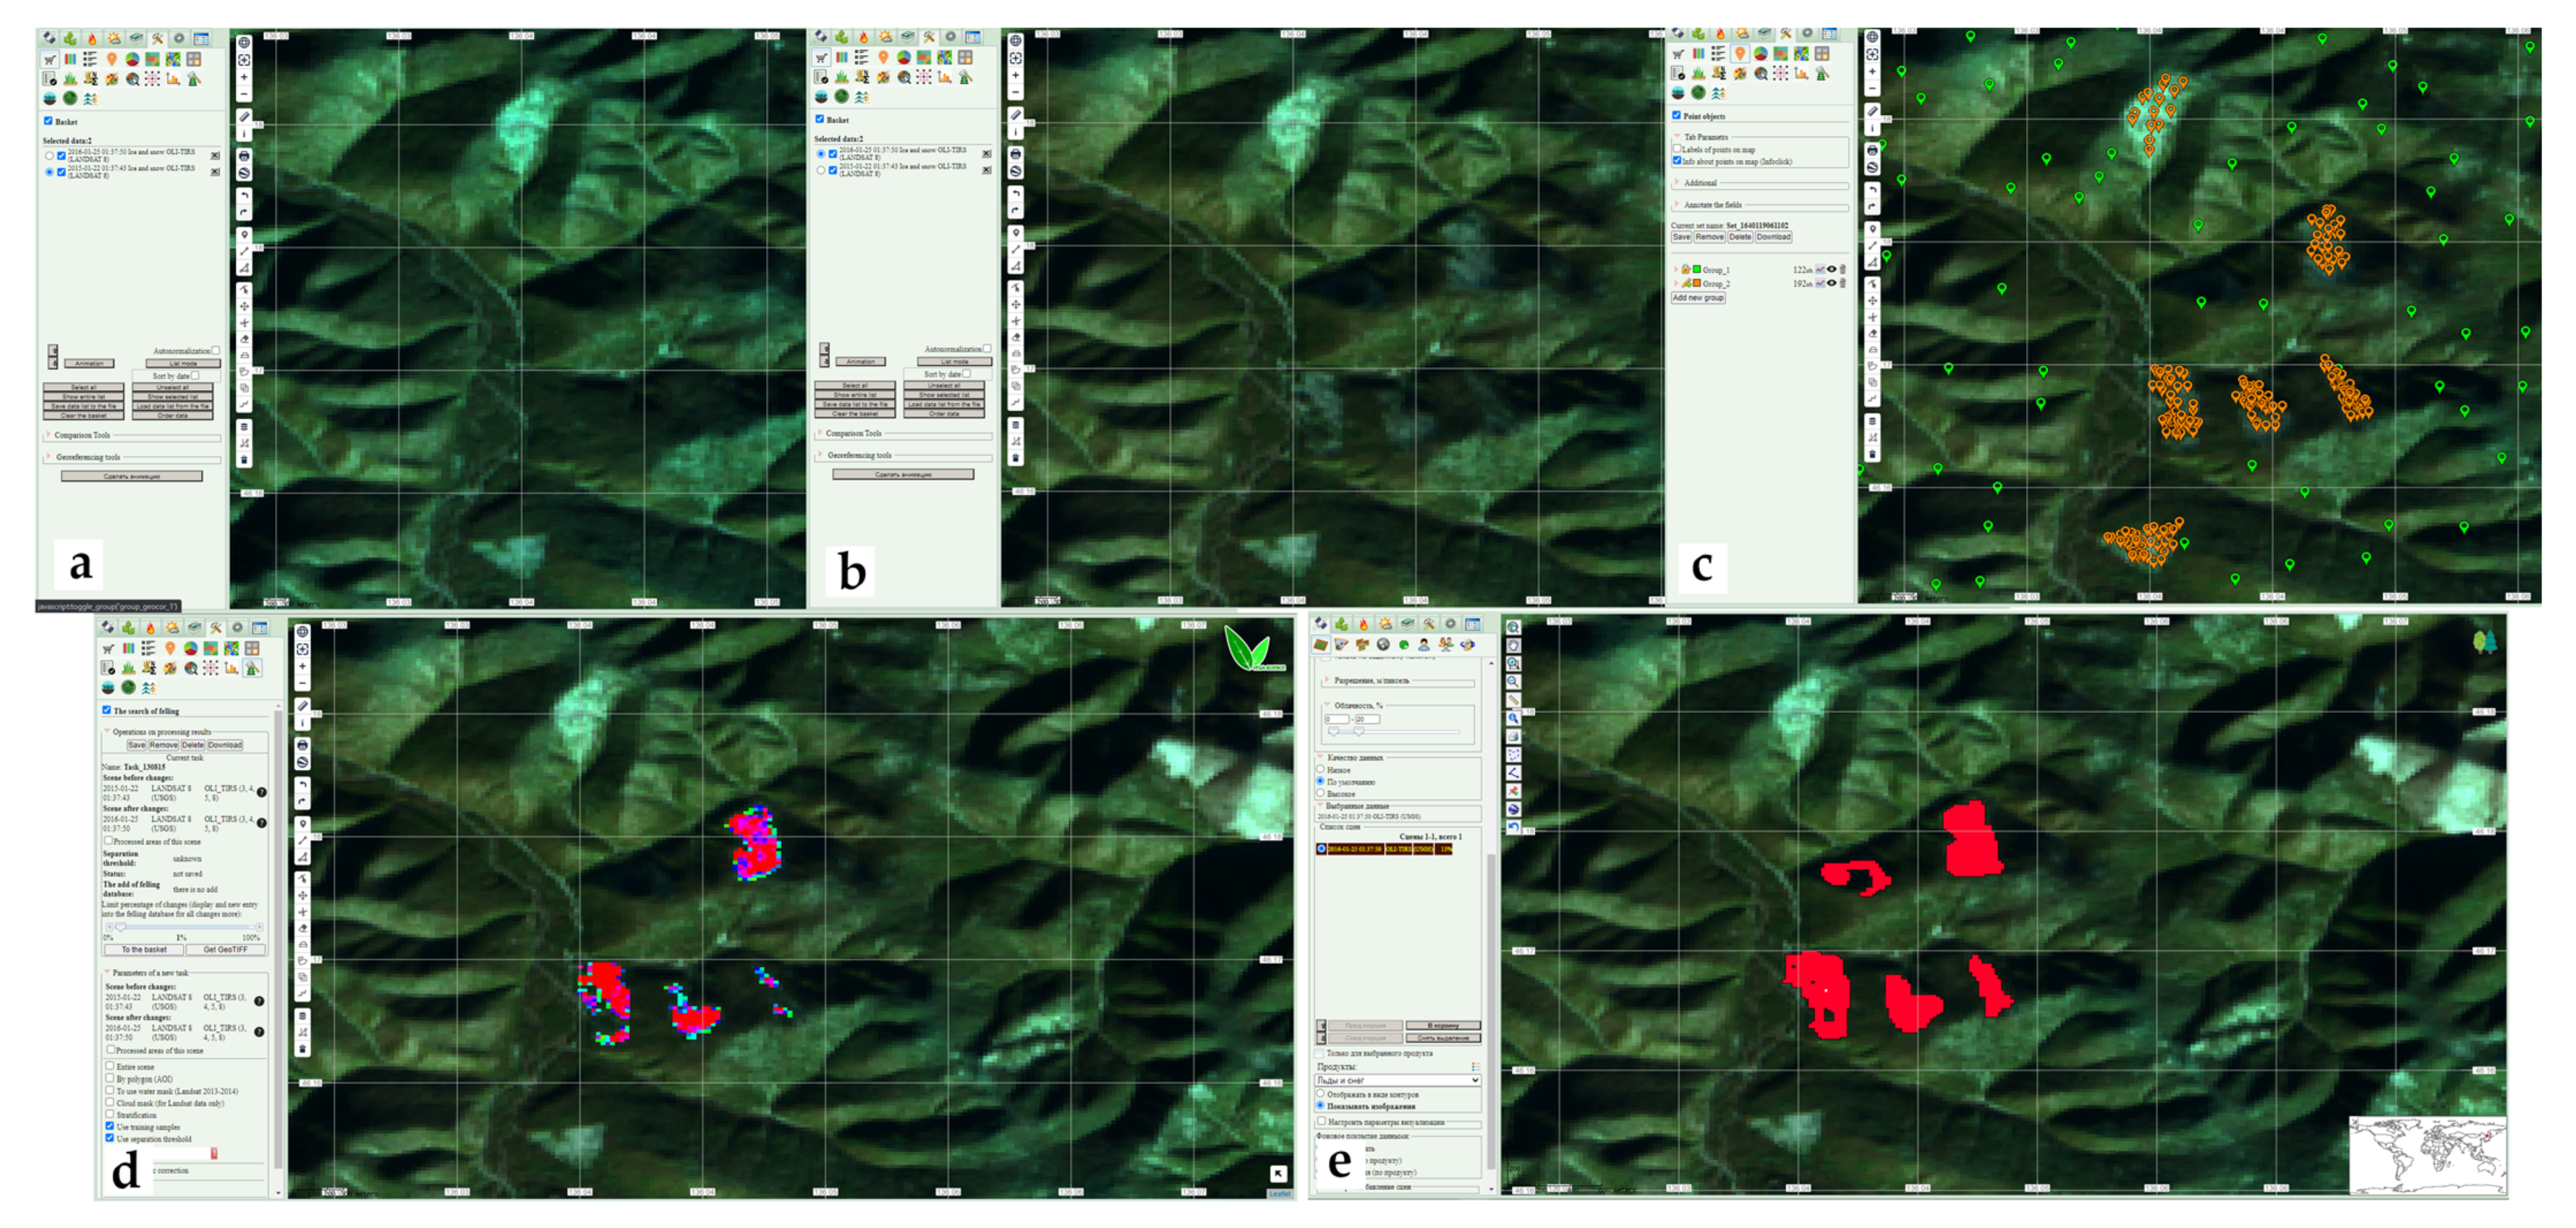
The procedure for burnt areas contouring includes the following basic steps, illustrated in
Figure 6:
Selecting a fire to refine;
Selecting high-resolution data for refinement;
Interactive contouring using the classification procedure;
Interactive verification of the contour correctness.
The presented algorithm is successfully used for clarification of fire-affected areas in the information system for remote monitoring of the Federal Forestry Agency ISDM-Rosleskhoz [
44].
3.2.3. Logging Mapping
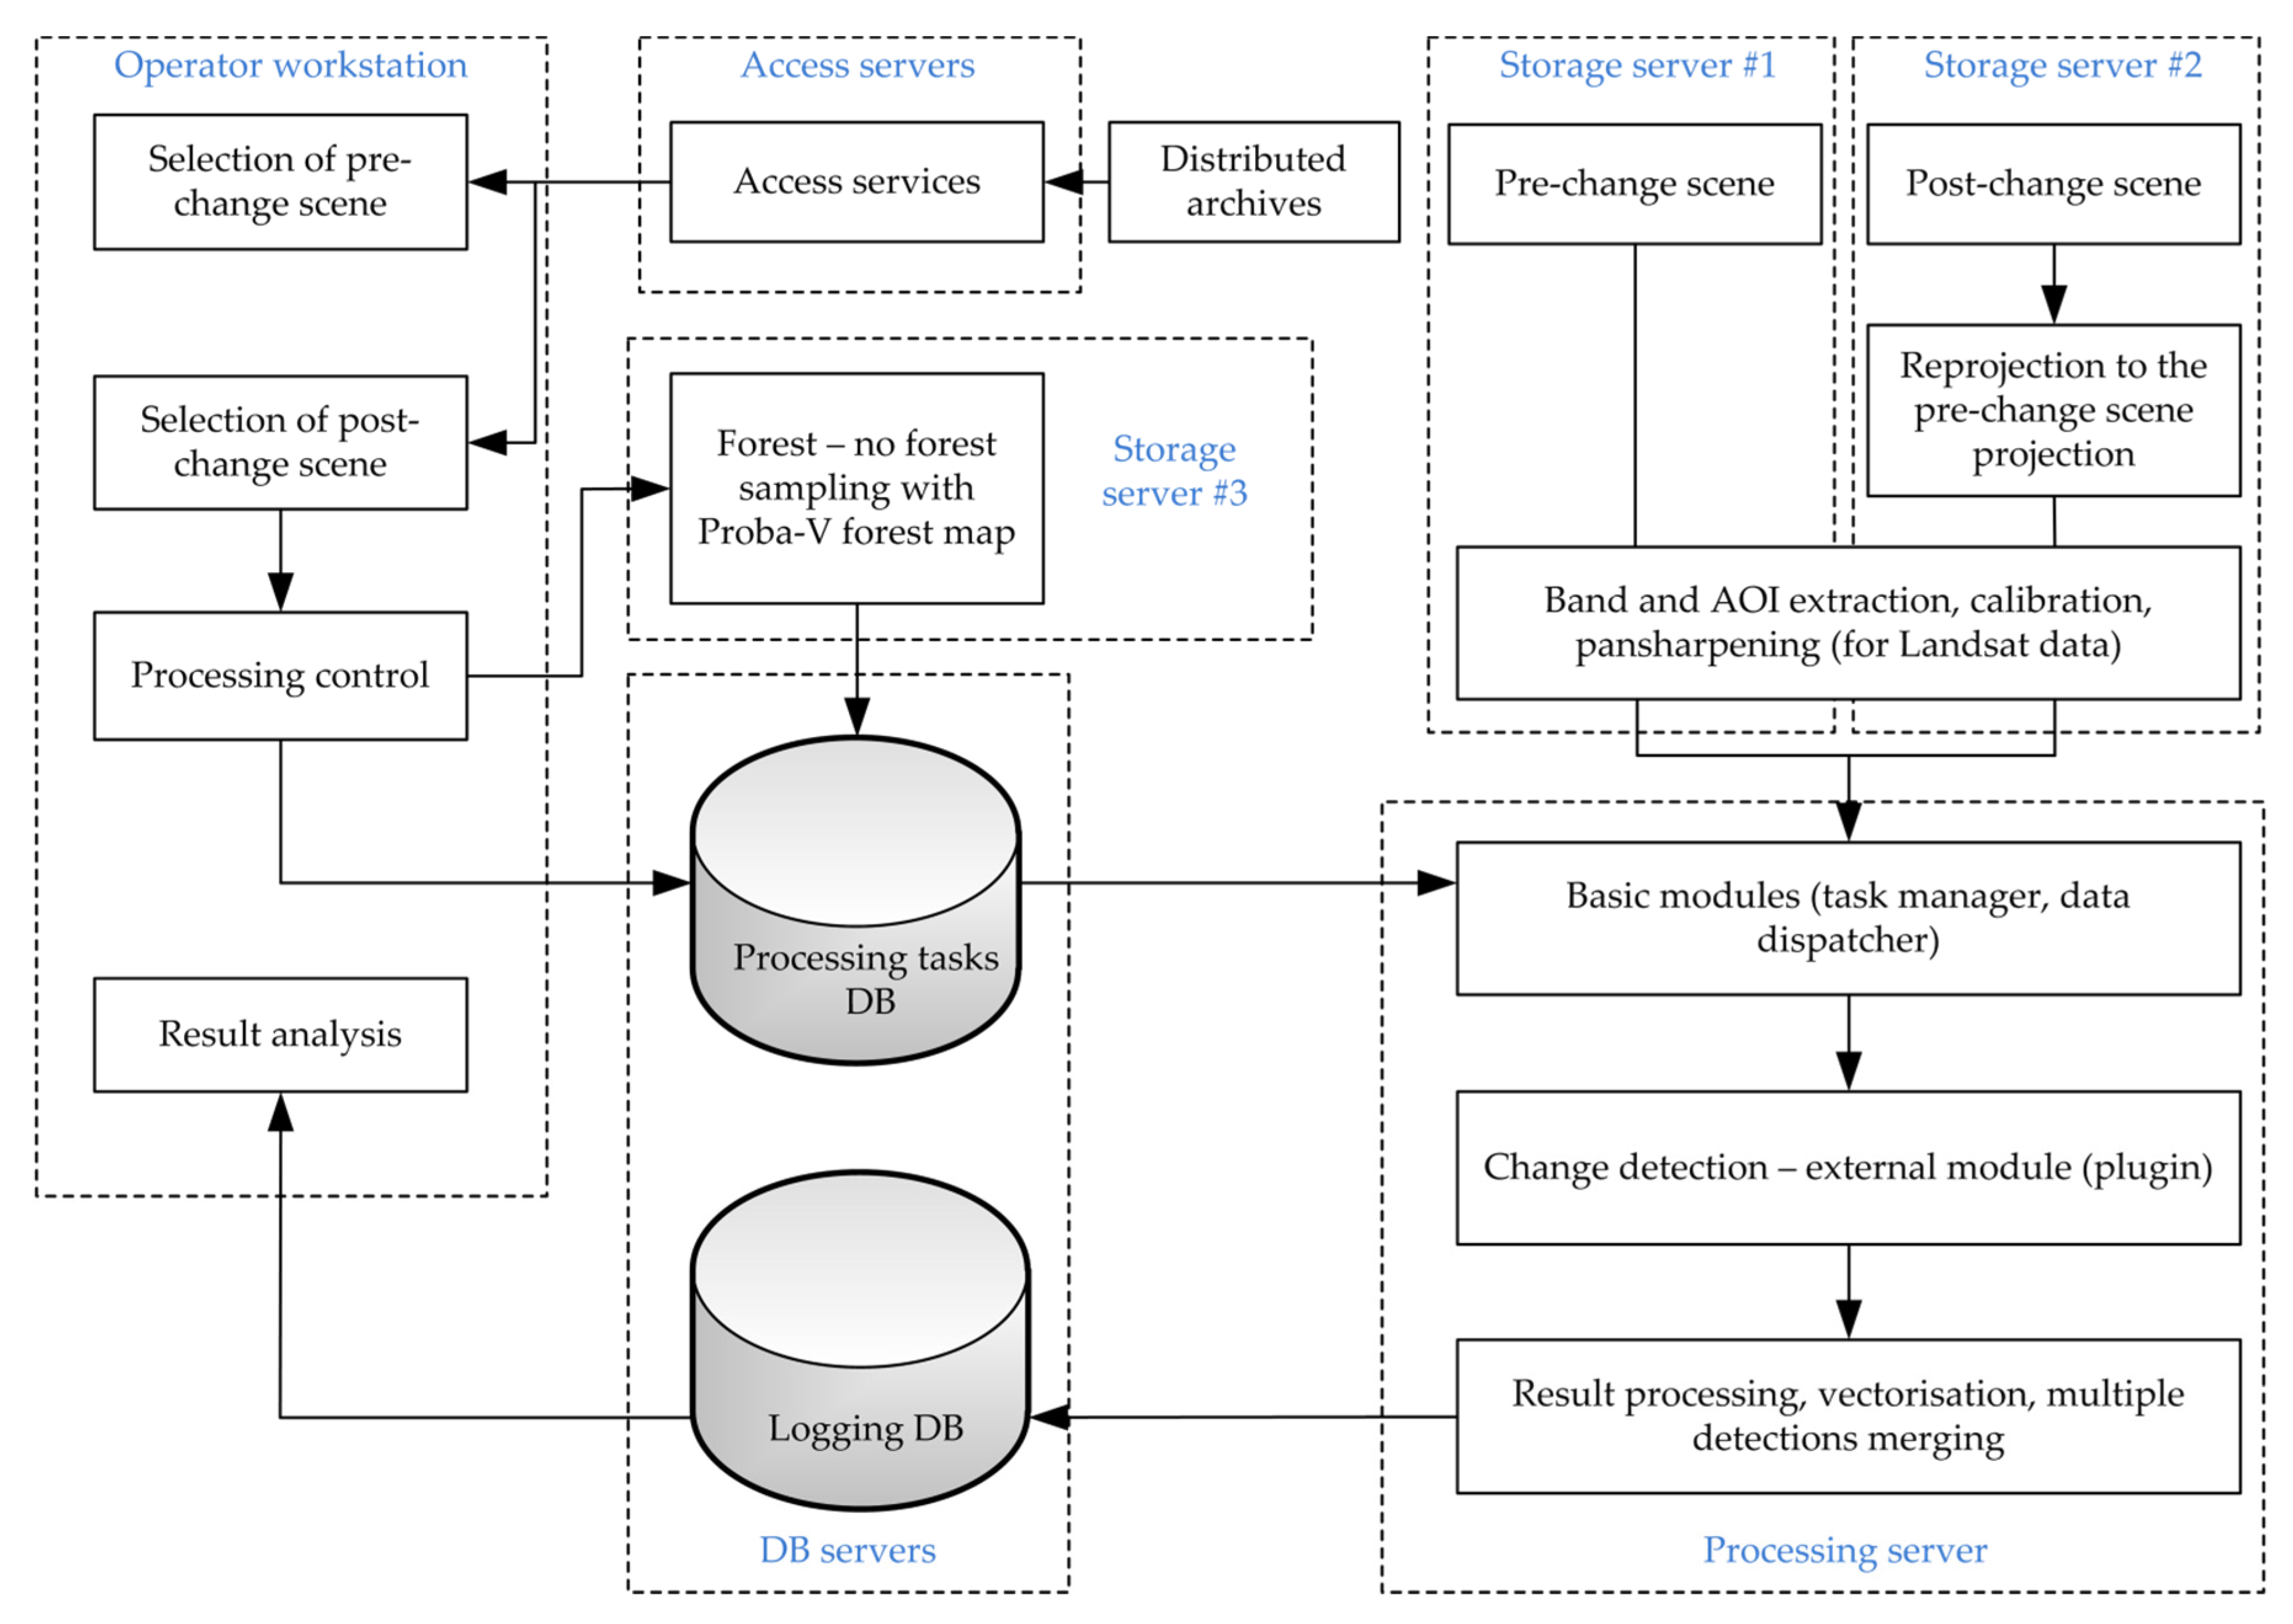
An interactive tool for detecting changes in the forest was created and implemented in the system for forest management control. The tool implements an algorithm developed at IKI [
32], which is based on the analysis of a time series of high-resolution satellite data obtained from the Landsat and Sentinel-2 series satellites. The algorithm also uses information on forest-covered areas derived from Proba-V satellite data. On the basis of this tool, the mass processing and analysis of the potential harvesting areas are now possible. The scheme of the distributed data processing for detecting changes in the forest (logging) is shown in
Figure 7. The main stages of the algorithm for detection and mapping of detected changes are shown in
Figure 8.
The tool implements the following analysis procedure steps:
Selection of images and area of interest by the operator;
Creation of “forest-not forest” training sample;
Running the task and checking the correctness of the results;
Storing the results in the database.
3.3. Experience of Using the VEGA-Science System for Scientific Problems and Research Projects
At present, the VEGA-Science system is widely used for various scientific and applied tasks. As of today (November 2021), more than 100 scientific and educational organizations are using the system within the framework of the “IKI-Monitoring” CCU. The system was used to implement approximately 80 Russian and international projects with more than 500 papers published. It should be particularly noted that the system provided the possibility of working with very large archives of satellite data not only for large scientific and educational organizations but also for small, sometimes distributed teams of researchers. At the same time, the system is used for the implementation of projects in various fields related to the study of the ocean and water surfaces, atmosphere, terrestrial ecosystems, dangerous natural phenomena, study and control of environmental situations, etc.
To demonstrate the variety of tasks that the VEGA-Science system is currently used for, this section presents several examples of various scientific areas and projects that actively use its capabilities. A more comprehensive list of projects can be found at the CCU Home Page, Projects Section [
46].
3.3.1. Monitoring Project
The complex project “Development of Satellite Monitoring Methods and Technologies for Scientific Research of Global Changes and Safety” is carried out by IKI with the support of the Ministry of Education and Science of the Russian Federation (“Monitoring” project, state registration number: 01.20.0.2.00164). The project is devoted to the development of scientific basics, approaches and technologies of satellite monitoring with modern remote sensing methods for Earth, as well as the study of various processes occurring on our planet. In terms of the project, research is being carried out on:
- -
Creation and development of methods, technologies, and systems for working with remote (satellite) Earth observation data to solve scientific and applied problems;
- -
Developing and improving remote monitoring methods of terrestrial ecosystems and their use in the study of various biosphere processes;
- -
Developing and improving remote monitoring methods for studying and monitoring various climatic processes and natural hazards;
- -
Development and improvement of remote monitoring methods to study and monitor natural and anthropogenic processes in the ocean and various water bodies including their ecological state.
- -
Development and improvement of remote monitoring methods for studying and monitoring the atmosphere, its interaction with the ocean, ionosphere, and magnetosphere of the Earth.
One of the main tasks of the project is to create new approaches and infrastructure to work with satellite data for the benefit of various scientific projects. In the framework of the project, the “IKI-Monitoring” CCU and the unique scientific installation (system) VEGA-Science were created and operate. Today the VEGA-Science system is one of the basic tools of the project that allow for the solving of project tasks in various fields.
3.3.2. Seas Monitoring
A series of projects focused on the study of various processes occurring in the boundary seas of Russia is being carried out by Shirshov Institute of Oceanology of the Russian Academy of Sciences (IO RAS) [
47], IKI, Marchuk Institute of Numerical Mathematics of the Russian Academy of Sciences (INM RAS) [
48] along with several other research institutions. These projects were and are being carried out with the support of the Ministry of Education and Science of the Russian Federation, Russian Science Foundation and Russian Foundation for Basic Research. Based on the VEGA-Science, The “See The Sea” (STS) [
49,
50] specialized information system was created for research in this area. This system is oriented to work with satellite observation data to solve interdisciplinary tasks of the World Ocean research, and special attention in the system is paid to the features and tools of working with satellite radar data as one of the main sources of information about oceans. Same as VEGA-Science, the system provides the possibility of simultaneous work with different kinds of satellite information with a convenient toolkit for its integrated analysis. The joint use of different satellite data provides opportunities for in-depth and high-quality interpretation of satellite information and constructing an objective picture of complex interactions of hydrodynamic, meteorological, and biological factors. The system provides an increasing number of various services that focus on the ability to identify and describe various processes and phenomena in the ocean and the atmosphere above it (vortex processes, surface manifestations of internal waves, currents, surface pollution, processes related to the interaction between the ocean and the atmosphere, etc.), as well as services to maintain long-term databases of such descriptions. The system also implements and develops possibilities of working with numerical modeling data and their integrated analysis together with the satellite-data-derived information.
3.3.3. Volcanoes Monitoring
A series of projects focused on scientific monitoring of volcanic activity in Kamchatka and the Kuril Islands is being conducted by the Institute of Volcanology and Seismology of the Far Eastern Branch of the Russian Academy of Sciences (FEB RAS) [
51] with the support of IKI, the FEB RAS Computing Center [
52], and SRC “Planeta” [
53]. The projects were and are being carried out with the support of the Ministry of Education and Science of the Russian Federation, the Russian Science Foundation, and the Russian Foundation for Basic Research. The specialized information system VolSatView [
54,
55] was created on the basis of “VEGA-Science”. The main purpose of the system is to provide the expert volcanologists with satellite data and various information products derived from their processing. The system also provides various tools for data processing implemented in the VEGA-Science, not only for satellite data acquisition but also for their processing and analysis for research and scientific monitoring of volcanic activity in Kamchatka and the Kuril Islands. The system can also work with information obtained on the basis of modeling of ash plume distribution processes and complex analysis of their dynamics using ground and satellite observation data.
3.3.4. Agricultural Monitoring
A series of projects for the development of methods and technologies for remote monitoring of agricultural land and crops has been carried out for many years by a significant number of Russian and foreign organizations. [
56]. The largest international project in this field that used the capabilities of the VEGA-Science system is undoubtedly the SIGMA project implemented with the support of the European Commission Framework Program FP7. The project was aimed at creation of methods and technologies of agricultural lands and crops global monitoring for the GEOGLAM project [
57]. These works were also supported by the Ministry of Education and Science of the Russian Federation. The VEGA-GEOGLAM [
58,
59] specialized service was created on the basis of the VEGA-Science system. Its main purpose was to provide the tools for analysis of the remote sensing data and results of their processing for the SIGMA-JECAM [
60] network test sites, designated for research and development in the field of remote agricultural monitoring. Currently, projects in this direction are carried out both in the interests of federal agencies (e.g., Rosstat) and individual regions.
3.3.5. Forest Monitoring
A series of projects supported by the Ministry of Education and Science of the Russian Federation to create new methods and software complexes for automated processing of remote sensing satellite data for monitoring forest resources in Russia was carried out since 2015 to 2021. The main executors of the projects were IKI and the Center for Ecology and Productivity of Forests of the Russian Academy of Sciences (CEPF RAS) [
61]. The main purpose of the project series was to create methods that provided objective and up-to-date information on the state of Russian forests. The approaches developed during these projects and the accumulated databases on the state of the forests resulted in the creation of a VEGA-Les specialized information system [
45] based on the capabilities of “VEGA-Science” [
62]. Today the system provides online access to continuously updated multi-year archives of remote sensing data from space, thematic information products as well as tools for the automated processing, analysis, and synthesis of various information for solving tasks related to complex monitoring of Russia’s forests, including:
Obtaining annually updated information on the qualitative and quantitative characteristics of forests (area, timber stock, predominant species, completeness, bonitet, age, and other characteristics);
Obtaining information about fire damage to forests (area covered by fire, extent of forest damage, and the amount of post-fire fallout);
Obtaining information about the area and extent of forest damage caused by biotic, meteorological and other natural factors (insects, diseases, droughts, etc.);
Obtaining information on the volume of industrial logging (area, stock, and species of harvested wood).
3.3.6. Carbon Budget Monitoring
The “Development of Methods and Technologies for the Integrated Use of Earth Remote Sensing Data from Space for the Development of the Russian Forest Carbon Budget National Monitoring System under Conditions of Global Climate Change” project [
63] is ongoing from 2019 to 2022. The main objective of this project is to create a new methodology for forest carbon assessment using a multi-sensor concept of remote sensing from space. It involves the development of new and modification of existing models based on the integration of ground-based and remote sensing information. The project provides for the creation of new dynamic geoinformation databases on the characteristics and carbon budget of Russian forests as well as the technology for its continuous monitoring and the specialized information system for continuous remote sensing monitoring of carbon budgets in Russian forests. The project is carried out by specialists from CEPF RAS, IKI, Siberian Federal University (SFU) [
64], and several other institutions. The project is supported by the Russian Science Foundation (project RSF 019-77-30015).
3.3.7. Various Projects
A variety of other projects supported by the Ministry of Science of the Russian Federation, the Russian Academy of Sciences, and various other Russian and foreign foundations also illustrate the versatility of the VEGA-Science system. For example, they cover:
- -
Creation of methodology for the analysis and prognosis of the climatic and ecological factors’ influence on the spread of naturally focused infections based on remote sensing technologies (implemented by Central Research Institute of Epidemiology of Federal Service for Surveillance on Consumer Rights Protection and Human Welfare);
- -
Developing scientific basics for recording and assessing the ecological condition, climatogenic role and fire danger of anthropogenically modified peatlands based on satellite and ground data (carried out by the Institute of Forestry, Russian Academy of Sciences);
- -
Remote sensing studies of spatial and temporal characteristics of the heat field of urbanized territories in the arid zone (implemented by the Federal Research Center of Agroecology, Integrated Reclamation and Protective Afforestation of the Russian Academy of Sciences);
- -
Studies of natural and climatic trends in the Baikal region (Baikal Institute of Nature Management, Siberian Branch of RAS).
A fairly large list of projects using the “VEGA-Science” system can be found on the website of “IKI-Monitoring” CCU in [
45].
4. Discussion
The VEGA-Science system has been undergoing continuous development since its inception and has evolved from a specialized system for vegetation analysis into a universal system for solving a growing number of diverse problems. This is due both to the constant increase in the number of data types available in the system and to the expansion of the set of analysis and processing tools for this data. In addition to the usual visible and infrared optical data, data from radars, hyperspectrometers, microwave atmospheric sounders, and other instruments have gradually been added to the system. For example, work is under way to integrate satellite altimetry and lidar data into VEGA-Science and to develop methods and tools on their basis for analysis of conditions and dynamics of inland water bodies. In addition, the basic technological components of the system are periodically updated, taking into account the capabilities of modern software libraries and frameworks. At the same time, it should be taken into account that the most difficult in the chosen logic of development is to maintain a balance between the variety of available features and the complexity of using the system for the user, as well as its performance and speed of operation, which is seriously considered during the development and support.
Such versatility and relevance allow VEGA-Science to act not only as a tool for research and applied work. The task of teaching students to use remote sensing data in various fields of science and practice is becoming increasingly urgent, and here VEGA-Science appears as a distributed educational environment, enabling to conduct the whole course of training from familiarization with basic concepts to mastering complex technological processes (including improvement of the system itself) and to implement projects of various complexity and practical value on real, maximum actual data. Today, VEGA-Science is successfully used to conduct specialized educational programs at the Lomonosov Moscow State University, the Higher School of Economics, and a number of other universities.
5. Conclusions
In conclusion, we would like to emphasize that the problem of providing the RS experts and data users with fast and easy access to ultra-large data archives combined with processing and analysis tools and resources becomes increasingly actual because of the rapidly growing amounts of data available and their increasing quality. One of the possible solutions is development of web-based systems providing close to desktop applications data-handling functionality. The VEGA-Science system developed by the Space Research Institute of the Russian Academy of Sciences is an operational example of such a system widely used for a large variety of monitoring and research tasks including carbon budget monitoring, forests and croplands monitoring, and disaster impact assessment. It provides both common geoinformation systems features for data search, view and processing, and powerful analytics capabilities. The ever-growing number and variety of users and projects using the VEGA-Science system shows that the approach we have chosen turned out to be correct and has successfully stood the test of time. Moreover, the chosen vector of system development, in our opinion, will only increase its relevance and, along with the growth of the user community, discover new research possibilities.
Author Contributions
Conceptualization, E.L. and S.B.; methodology, E.L.; software, M.B. and A.P., A.K. (Alexander Kashnitskiy), I.B., A.K. (Anna Konstantinova), D.K., V.T. and I.U.; resources, M.B. and M.R.; data curation, A.P. and V.T.; writing—original draft preparation, A.P., M.B., I.B. and A.K. (Alexander Kashnitskiy); writing—review and editing, E.L. and M.B.; visualization, M.B. and A.K. (Alexander Kashnitskiy); supervision, E.L.; project administration, E.L.; funding acquisition, E.L. All authors have read and agreed to the published version of the manuscript.
Funding
This research was funded by Ministry of Education and Science of the Russian Federation, projects “Monitoring” (reg. no. 01.20.0.2.00164) and “Big Data in Space Research: Astrophysics, Solar System, Geosphere” (reg. no. 0024-2019-0014).
Data Availability Statement
The system can be accessed at
http://sci-vega.ru (accessed on 15 December 2021). A demo user for a system evaluation with “demo:demo” credentials are available. Full access to the system is free for research and educational purposes but requires a formal agreement signed with IKI.
Acknowledgments
The Space Research Institute of the Russian Academy of Sciences (IKI) is providing the required infrasctructure and support for the VEGA-Science system operation and further development, which the authors gratefully acknowledge. The authors are grateful to all the data providers, including ESA, NASA, USGS, Roshydromet and many others. The authors would also like to thank the reviewers for providing useful suggestions that enhance the manuscript’s quality.
Conflicts of Interest
The authors declare no conflict of interest. The funders had no role in the design of the study; in the collection, analyses, or interpretation of data; in the writing of the manuscript, or in the decision to publish the results.
References
- World Meteorological Organization Home Page. Available online: https://public.wmo.int/en (accessed on 14 December 2021).
- Loupian, E.A.; Savorsky, V.P.; Shokin, Y.I.; Aleksanin, A.I.; Nazipov, R.R.; Nedoluzhko, I.B.; Panova, O.Y. Up-to-date Approaches and Technology Arrangement of Earth Observation Data Applications Aimed to Solve Scientific Tasks. Curr. Probl. Remote Sens. Earth Space 2012, 9, 21–44. [Google Scholar]
- Loupian, E.A.; Balashov, I.V.; Bourtsev, M.A.; Efremov, V.Y.; Kashnitskiy, A.V.; Kobets, D.A.; Krasheninnikova, Y.S.; Mazurov, A.A.; Nazirov, R.R.; Proshin, A.A.; et al. Development of information systems design technologies. Sovrem. Probl. Distantsionnogo Zondirovaniya Zemli Iz Kosm. 2015, 12, 53–75. [Google Scholar]
- Loupian, E.A.; Bourtsev, M.A.; Proshin, A.A.; Kobets, D.A. Evolution of remote monitoring information systems development concepts. Sovrem. Probl. Distantsionnogo Zondirovaniya Zemli Iz Kosm. 2018, 15, 53–66. [Google Scholar] [CrossRef]
- Google Earth Engine Home Page. Available online: https://earthengine.google.com (accessed on 14 December 2021).
- Gorelick, N. Google Earth Engine. Geophysical Research Abstracts. In EGU General Assembly Conference Abstracts; American Geophysical Union: Vienna, Austria, 2019; Volume 15, p. 11997. [Google Scholar]
- Moore, R.T.; Hansen, M.C. Google Earth Engine: A new cloud-computing platform for global-scale earth observation data and analysis. In AGU Fall Meeting Abstracts; American Geophysical Union: San Francisco, CA, USA, 2011; Volume 2011, p. IN43C-02. [Google Scholar]
- Gorelick, N.; Hancher, M.; Dixon, M.; Ilyushchenko, S.; Thau, D.; Moore, R. Google Earth Engine: Planetary-scale geospatial analysis for everyone. Remote Sens. Environ. 2017, 202, 18–27. [Google Scholar] [CrossRef]
- USGS EarthExplorer Home Page. Available online: https://earthexplorer.usgs.gov/ (accessed on 14 December 2021).
- USGS LandsatLook Home Page. Available online: https://landsatlook.usgs.gov/ (accessed on 14 December 2021).
- Copernicus Open Access Hub Home Page. Available online: https://scihub.copernicus.eu/ (accessed on 14 December 2021).
- ONDA DIAS Home Page. Available online: https://www.onda-dias.eu/cms (accessed on 14 December 2021).
- Mundi Web Services Home Page. Available online: https://mundiwebservices.com/ (accessed on 14 December 2021).
- CREODIAS Home Page. Available online: https://creodias.eu/ (accessed on 14 December 2021).
- Sentinel Hub EO Browser Home Page. Available online: https://www.sentinel-hub.com/explore/eobrowser/ (accessed on 14 December 2021).
- EOS Landviewer Home Page. Available online: https://eos.com/landviewer/ (accessed on 15 December 2021).
- NASA Wordview Service Home Page. Available online: https://worldview.earthdata.nasa.gov/ (accessed on 15 December 2021).
- Planet Labs Planet Platform Home Page. Available online: https://www.planet.com/products/platform/ (accessed on 15 December 2021).
- Maxar Geospatial Services Home Page. Available online: https://www.maxar.com/products/geospatial-services (accessed on 15 December 2021).
- Loupian, E.A.; Proshin, A.A.; Bourtsev, M.A.; Balashov, I.V.; Bartalev, S.A.; Efremov, V.Y.; Kashnitskiy, A.V.; Mazurov, A.A.; Matveev, A.M.; Sudneva, O.A.; et al. IKI center for collective use of satellite data archiving, processing and analysis systems aimed at solving the problems of environmental study and monitoring. Sovrem. Probl. Distantsionnogo Zondirovaniya Zemli Iz Kosm. 2015, 12, 263–284. [Google Scholar]
- Loupian, E.A.; Proshin, A.A.; Balashov, I.V.; Bourtsev, M.A.; Kashnitskiy, A.V.; Tolpin, V.A.; Mazurov, A.A.; Matveev, A.M.; Uvarov, I.A. Center for Collective Usage “IKI-Monitoring” (Organization of Distributed Work with Extra Large Archives of Satellite Data for Solving Scientific and Applied Tasks). Inf. Technol. Remote Sens. Earth-RORSE 2018 2019, 380–387. [Google Scholar] [CrossRef]
- VEGA-Science Home Page. Available online: http://sci-vega.ru/eng/ (accessed on 14 December 2021).
- Bartalev, S.A.; Ershov, D.V.; Loupian, E.A.; Tolpin, V.A. Possibilities of Satellite Service VEGA Using for Different Tasks of Land Ecosystems Monitoring. Sovrem. Probl. Distantsionnogo Zondirovaniya Zemli Iz Kosm. 2012, 9, 49–56. [Google Scholar]
- Tolpin, V.A.; Loupian, E.A.; Bartalev, S.A.; Plotnikov, D.E.; Matveev, A.M. Possibilities of agricultural vegetation condition analysis with the “VEGA” satellite service. Atmos. Ocean. Opt. 2014, 27, 581–586. [Google Scholar]
- Bourtsev, M.A.; Milekhin, O.E.; Kramareva, L.S.; Antonov, V.N.; Balashov, I.V.; Kashnitskiy, A.V.; Loupian, E.A.; Matveev, A.M.; Proshin, A.A.; Uspensky, S.A. SRC “Planeta” United System for Distributed Data Handling: Actual Features and Future Evolution. Inf. Technol. Remote Sens. Earth-RORSE 2018 2019, 374–379. [Google Scholar] [CrossRef]
- USGS Landsat Missions Home Page. Available online: https://www.usgs.gov/core-science-systems/nli/landsat (accessed on 14 December 2021).
- ESA Sentinel Online Home Page. Available online: https://sentinels.copernicus.eu/web/sentinel/home (accessed on 14 December 2021).
- CCU “IKI-Monitoring” Archives Page. Available online: http://ckp.geosmis.ru/default.aspx?page=6 (accessed on 14 December 2021).
- Flitman, E.V.; Balashov, I.V.; Bourtsev, M.A.; Galeev, A.A.; Egorov, V.A.; Kotelnikov, R.V.; Loupian, E.A.; Mazurov, A.A.; Matveev, A.M.; Proshin, A.A. Organization of the MODIS Instrument Data Processing System for the Tasks of Monitoring Forest Fires and Their Aftereffects. Actual Probl. Remote Sens. Earth Space 2011, 8, 127–138. [Google Scholar]
- National Center for Atmospheric Research Home Page. Available online: https://ncar.ucar.edu (accessed on 14 December 2021).
- Zlatopolsky, A.A.; Kashnitskiy, A.V. The Image and Lineament Analysis Tool in the “VEGA-Constellation” Information Systems Family. Inf. Technol. Remote Sens. Earth-RORSE 2018 2019, 287–294. [Google Scholar] [CrossRef]
- Khovratovich, T.S.; Ivanova, A.A.; Bartalev, S.A. Evaluation of the Algorithm for Forest Logging Detection based on Earth Observation Data. Inf. Technol. Remote Sens. Earth-RORSE 2018 2019, 108–115. [Google Scholar] [CrossRef]
- Loupian, E.A.; Konstantinova, A.M.; Balashov, I.V.; Kashnitskiy, A.V.; Savorsky, V.P.; Panova, O.Y. Development of a system for analyzing the state of environment in areas of large industrial facilities, tailings and dumps. Sovrem. Probl. Distantsionnogo Zondirovaniya Zemli Iz Kosm. 2020, 17, 243–261. [Google Scholar] [CrossRef]
- Kashnitskiy, A.V.; Loupian, E.A.; Bartalev, S.A.; Bartalev, S.S.; Balashov, I.V.; Efremov, V.Y.; Stytsenko, F.V. Optimization of burn mapping interactive procedures in remote fire monitoring information systems. Sovrem. Probl. Distantsionnogo Zondirovaniya Zemli Iz Kosm. 2015, 12, 7–16. [Google Scholar]
- Khvostikov, S.A.; Bartalev, S.A. Methods for Wildfire Spread Prediction and Their Integration with Remote Sensing Data. Inf. Technol. Remote Sens. Earth-RORSE 2018 2019, 42–47. [Google Scholar] [CrossRef]
- Kobets, D.A.; Balashov, I.V.; Sychugov, I.G.; Tolpin, V.A. Organization of control and performance analysis of systems for automated processing of satellite data. Sovrem. Probl. Distantsionnogo Zondirovaniya Zemli Iz Kosm. 2017, 14, 92–103. [Google Scholar] [CrossRef]
- Proshin, A.A.; Loupian, E.A.; Balashov, I.V.; Kashnitskiy, A.V.; Bourtsev, M.A. Unified satellite data archive management platform for remote monitoring systems development. Sovrem. Probl. Distantsionnogo Zondirovaniya Zemli Iz Kosm. 2016, 13, 9–27. [Google Scholar] [CrossRef]
- Tolpin, V.A.; Balashov, I.V.; Loupian, E.A.; Savin, I.Y. “VEGA” satellite service. Earth Space 2011, 9, 32–37. [Google Scholar]
- Roscosmos Geoportal Home Page. Available online: https://gptl.ru/ (accessed on 14 December 2021).
- “Satellite Monitoring Technologies” Department of IKI RAS Home Page. Available online: http://smiswww.iki.rssi.ru (accessed on 14 December 2021).
- Tolpin, V.A.; Balashov, I.V.; Efremov, V.Y.; Loupian, E.A.; Proshin, A.A.; Uvarov, I.A.; Flitman, E.V. The GEOSMIS System: Developing Interfaces to Operate Data in Modern Remote Monitoring Systems. Sovrem. Probl. Distantsionnogo Zondirovaniya Zemli Iz Kosm. 2011, 8, 93–108. [Google Scholar]
- Kashnitskiy, A.V.; Loupian, E.A.; Balashov, I.V.; Konstantinova, A.M. Technology for Designing Tools for the Process and Analysis of Data from Very Large Scale Distributed Satellite Archives. Atmos. Ocean. Opt. 2016, 30, 84–88. [Google Scholar] [CrossRef]
- Denisov, P.V.; Kashnitskiy, A.V.; Loupian, E.A.; Sereda, I.I.; Tolpin, V.A.; Troshko, K.A. Possibilities of vega satellite monitoring services for arable land use assessment on the example of Smolensk region, Russia. IOP Conf. Ser. Earth Environ. Sci. 2021, 723, 032072. [Google Scholar] [CrossRef]
- Balashov, I.V.; Loupian, E.A.; Bartalev, S.A.; Bourtsev, M.A.; Mazurov, A.A. ISDM-Rosleskhoz operation and evolution experience. IOP Conf. Ser. Earth Environ. Sci. 2021, 806, 012007. [Google Scholar] [CrossRef]
- VEGA-Les System Home Page. Available online: http://forest.geosmis.ru (accessed on 14 December 2021).
- CCU “IKI-Monitoring” Home Page Projects Section. Available online: http://ckp.geosmis.ru/default.aspx?page=5 (accessed on 14 December 2021).
- Shirshov Institute of Oceanology of the Russian Academy of Sciences Home Page. Available online: https://ocean.ru/en/ (accessed on 14 December 2021).
- Marchuk Institute of Numerical Mathematics of the Russian Academy of Sciences Home Page. Available online: https://www.inm.ras.ru/en/ (accessed on 14 December 2021).
- See the Sea Web Service Home Page. Available online: http://ocean.smislab.ru (accessed on 14 December 2021).
- Lavrova, O.Y.; Loupian, E.A.; Mityagina, M.I.; Uvarov, I.A. “See the Sea” Information System. Current Capabilities and Prospects of Development. Inf. Technol. Remote Sens. Earth-RORSE 2018 2019, 367–373. [Google Scholar] [CrossRef]
- Institute of Volcanology and Seismology Home Page. Available online: http://www.kscnet.ru/ivs/eng/index.php (accessed on 14 December 2021).
- FEB RAS Computing Center Home Page. Available online: http://www.ccfebras.ru/ (accessed on 14 December 2021).
- SRC “Planeta” Home Page. Available online: http://planet.iitp.ru/index.php?lang=en&page_type=main&page=about (accessed on 14 December 2021).
- VolSatView System Home Page. Available online: http://volcanoes.smislab.ru (accessed on 14 December 2021).
- Girina, O.A.; Loupian, E.A.; Kramareva, L.S.; Melnikov, D.V.; Manevich, A.G.; Corokin, A.A.; Gordeev, E.I.; Uvarov, I.A.; Kashnitskiy, A.V.; Bourtsev, M.A.; et al. The Information System “Remote Monitoring of Kamchatka and Kuril Islands Volcanic Activity” (VolSatView): Capabilities and Experience. Inf. Technol. Remote Sens. Earth-RORSE 2018 2019, 359–366. [Google Scholar] [CrossRef]
- CCU “IKI-Monitoring” Home Page Users Section. Available online: http://ckp.geosmis.ru/default.aspx?page=7 (accessed on 14 December 2021).
- GEOGLAM Initiative Home Page. Available online: http://geoglam.org (accessed on 14 December 2021).
- VEGA-Geoglam System Home Page. Available online: http://vega.geoglam.ru (accessed on 14 December 2021).
- Tolpin, V.A.; Bartalev, S.A.; Elkina, E.S.; Kashnitskiy, A.V.; Konstantinova, A.M.; Loupian, E.A.; Marchenkov, V.V.; Plotnikov, D.E.; Patil, V.K.; Sunil, J.K. The VEGA-GEOGLAM information system: A tool for the development of methods and approaches to using satellite remote sensing data in problem-solving tasks of global agricultural monitoring. Sovrem. Probl. Distantsionnogo Zondirovaniya Zemli Iz Kosm. 2019, 16, 183–197. [Google Scholar] [CrossRef]
- JECAM Experiment Home Page. Available online: http://jecam.org/ (accessed on 14 December 2021).
- Center for Forest Ecology and Productivity of the RAS Home Page. Available online: http://cepl.rssi.ru/en (accessed on 14 December 2021).
- Balashov, I.V.; Bartalev, S.A.; Bartalev, S.S.; Bourtsev, M.A.; Vorushilov, I.I.; Egorov, V.A.; Kashnitskiy, A.V.; Khovratovich, T.S.; Khvostikov, S.A.; Kobets, D.A.; et al. Vega-Les Information System. Actual Features and Future Evolution. IOP Conf. Ser.: Earth Environ. Sci. 2020, 507, 012002. [Google Scholar] [CrossRef]
- Schepaschenko, D.; Moltchanova, E.; Fedorov, S.; Karminov, V.; Ontikov, P.; Santoro, M.; See, L.; Kositsyn, V.; Shvidenko, A.; Romanovskaya, A.; et al. Russian forest sequesters substantially more carbon than previously reported. Sci. Rep. 2021, 11, 12825. [Google Scholar] [CrossRef] [PubMed]
- Siberian Federal University Home Page. Available online: http://www.sfu-kras.ru/en (accessed on 14 December 2021).
| Publisher’s Note: MDPI stays neutral with regard to jurisdictional claims in published maps and institutional affiliations. |
© 2021 by the authors. Licensee MDPI, Basel, Switzerland. This article is an open access article distributed under the terms and conditions of the Creative Commons Attribution (CC BY) license (https://creativecommons.org/licenses/by/4.0/).


