Technical Note

Comparison of Absorbed and Intercepted Fractions of PAR for Individual Trees Based on Radiative Transfer Model Simulations

1
Department of Analytical Chemistry, Faculty of Chemistry, Gdańsk University of Technology, 11/12 Narutowicza Street, 80-233 Gdańsk, Poland
2
CENSAM, Singapore-MIT Alliance for Research and Technology, 1 CREATE Way, Singapore S138602, Singapore
3
INRAE, Avignon Université, UMR EMMAH, 84000 Avignon, France
4
Earth System Science Interdisciplinary Center, University of Maryland, College Park, MD 20740, USA
5
Southern Marine Science and Engineering Guangdong Laboratory, School of Atmospheric Sciences, Sun Yat-sen University, Zhuhai 519082, China
6
Centre for Urban Greenery and Ecology (CUGE Research), National Parks Board, Singapore Botanic Gardens, 1 Cluny Road, Singapore 259569, Singapore
7
Department of Civil and Environmental Engineering, Massachusetts Institute of Technology, 77 Massachusetts Avenue, Cambridge, MA 02139, USA
*
Author to whom correspondence should be addressed.
Remote Sens. 2021, 13(6), 1069; https://doi.org/10.3390/rs13061069
Submission received: 16 January 2021 / Revised: 28 February 2021 / Accepted: 5 March 2021 / Published: 11 March 2021
(This article belongs to the Special Issue Leaf and Canopy Biochemical and Biophysical Variables Retrieval)

Abstract

:
The fraction of absorbed photosynthetically active radiation (fAPAR) is a key parameter for estimating the gross primary production (GPP) of trees. For continuous, dense forest canopies, fAPAR, is often equated with the intercepted fraction, fIPAR. This assumption is not valid for individual trees in urban environments or parkland settings where the canopy is sparse and there are well-defined tree crown boundaries. Here, the distinction between fAPAR and fIPAR can be strongly influenced by the background and large illumination variations due to multi-scattering and shadows of buildings. This study investigates the radiative budget of PAR bands using a coupled leaf-canopy radiative transfer model (PROSPECT-DART), considering a suite of tropical tree species over a wide range of assumed leaf chlorophyll contents. The analyses simulate hyperspectral images (5 nm bandwidth) of individual tree crowns for the selected background (concrete vs. grass) and illumination conditions. We then use an artificial neural network-based method to partition sunlit vs. shaded leaves within each crown, as the latter have lower fAPAR and fIPAR values. Our results show fAPAR of sunlit leaves decreases with the ratio of diffuse to direct scene irradiance (SKYL), while SKYL has minimal influence for shaded leaves. Both fAPAR and fIPAR decrease at more oblique solar zenith angles (SZA). Higher values of fAPAR and fIPAR occur with concrete backgrounds and the influence of the background is larger at higher diffuse ratio and solar zenith angles. The results show that fIPAR is typically 6–9% higher than fAPAR, and up to 14% higher for sunlit leaves with a concrete background at SKYL = 0. The differences between the fIPAR and fAPAR also depend on the health condition of the leaves, such as chlorophyll content. This study can improve the understanding of urban individual trees fAPAR/fIPAR and facilitate the development of protocols for fAPAR field measurements.

Graphical Abstract

1. Introduction

Trees play an important role in the urban ecosystem by reducing noise and air pollution, promoting urban biodiversity, and supporting storm water management [1,2]. Furthermore, urban green spaces improve the physical and mental well-being of citizens and ameliorate urban climate issues resulting from climate change [3]. They play a crucial role in the sustainable development of cities and cooling effect in dense, tropical cities [3,4]. An important input variable for urban climate, especially in the context of urban green spaces, is the amount of photosynthetically active radiation (PAR), and its fraction absorbed by green elements of healthy vegetation (fAPAR) [5]. It is an important factor in the estimation of vegetation health and plays an essential role in assessing the primary productivity of canopies, the associated fixation of atmospheric CO2 and the energy balance of the surface [6], and hence fAPAR is recognized as an essential variable that affects climate [7]. It is used in remote sensing techniques to assess gross primary productivity (GPP). An accurate estimation of photosynthetically active radiation is important for improving the design of urban green spaces [3] and is crucial for the effective implementation of ecophysiological models [8]. However, some of the methods and models used to measure fAPAR, are best suited for large, uniform canopies such as crops or forests, and might be less reliable when implemented in urban ecosystems.
A vast majority of existing fAPAR research concerns crops and forests and relatively few studies focus on urban trees. Urban trees are usually either free-standing or distributed discontinuously (roadside and parkland scenes, potentially in proximity to buildings) with a relatively open, complex canopy structure. In such a setting, the characteristic of fAPAR of individual trees can differ significantly from that of vegetation which forms more uniform, continuous canopies due to the different environment. Urban trees often grow with a concrete background which exhibits much stronger reflectance than grass and soil. In addition, the illumination in urban areas is much more volatile and complex because of the built environment. It was demonstrated that shade cast by high-density high-rise build environment in Singapore might reduce daily PAR by nearly 50% [9]. Previous study demonstrate the effect of background and illumination conditions can introduce significant influence in the estimation of fAPAR for crops and forest [10,11,12]. However, how these factors influence urban individual tree fAPAR is still unknow.
The distribution of sunlit and shaded leaves also influences the fAPAR of individual trees. At the leaf scale, the biochemistry of the photosynthetic response to solar radiation is well-understood and can be reliably modelled [13] or even measured in real-time [14,15]. However, at the scale of vegetation canopies the effect of solar radiation on photosynthesis is more complex due to the differences in irradiance between direct and diffused solar radiation [16], and between sunlit and shaded regions across the entire canopy [17]. In addition, the illumination conditions can affect the distribution of sunlit and shaded leaves within individual trees, making its estimation particularly difficult [18]. In general, leaves in the shade suffer from lower exposure to incoming radiation, while those in direct sunlight are often saturated and can have relatively low light use efficiency. Under scattered light conditions the irradiance of the canopy is more uniform, resulting in higher light-use efficiency compared to direct sunlight [19]. Results of several studies have indicated that photosynthesis is more efficient under diffused radiation conditions [16,20,21]. The amount and type of solar radiation incident on a canopy or individual crown are important factors in the assessment of fAPAR since an overabundance of light might trigger a photo-protective reaction of the plant, reducing its gross primary production [22]. In scenarios with high vegetation heterogeneity, the effect of illumination conditions on sunlit and shaded parts of an individual tree is no longer negligible and should be considered when assessing the applicability of a particular model.
The fraction of intercepted photosynthetically active radiation (fIPAR) has been taken as a good approximation of fAPAR [23,24]. Due to the difficulty of accurately measuring the flux in different directions for fAPAR estimation, fIPAR has been regularly acquired at many flux tower sites and long-term validation sites for remote sensing of fAPAR products, e.g., [25,26]. The fIPAR measured by the optical field instruments, such as digital hemispherical photography (DHP), tracking radiation and architecture of canopies (TRAC) [27], and LAI-2200 (LI-COR Inc., Lincoln, Nebraska, USA) has been widely used in fAPAR studies as ground truth. However, the above methods are based on the assumption that fIPAR and fAPAR are equivalent. This assumption has been shown to hold for crops using field measurements [28] and forests using simulations [23]. Unlike continuous (or closed), homogeneous crop or forest canopies, urban individual trees have distribution patterns of low plant cover and bright backgrounds. Whether the fIPAR can be used to approximate fAPAR for the urban individual trees remains unknown. Considering the growing awareness of the significance of trees in urban ecosystems, in situ fAPAR measurements will be increasingly needed. Thus, it is important to carefully examine the uncertainty of using the above efficient approach in fIPAR measurement to approximates fAPAR for trees in complex urban environments.
Considering the difficulty of acquiring true values of fAPAR of trees, simulation methods are a good approach for its evaluation. Goel and Qin [29] were among the first to demonstrate that fPAR of inhomogeneous canopies can be reliably assessed using computer-generated 3D models of vegetation to evaluate the effect of factors such as background reflectance, optical properties of canopy elements, or solar view geometries. In 1996, Gastellu-Etchegorry et al. developed the discrete anisotropic radiative transfer (DART) model which enables detailed simulations of radiative transfer in heterogeneous 3d scenes which comprise features such as leaves, grass, trunks, etc. [30]. DART is aimed at high accuracy, and so the radiative budget is simulated with high accuracy for all sun directions and atmospheric conditions [31]. It has been validated against results of field measurements and compared with other radiation transfer models, performing favorably in heterogeneous scenes [32,33]. The capability of the DART model to accurately assess the radiative budget of vegetation can be further enhanced by combining it with the PROSPECT radiative transfer model which accounts for the optical properties of plant leaves such as spectral refractive index [34]. Absorption is modelled using, among other input variables, the concentration of chlorophyll a and b and carotenoids. The coupling of both models (PROSPECT-DART) enables a comprehensive assessment of the radiative budget considering the health of vegetation. It was successfully used, e.g., to simulate the leaf pigment content in heterogeneous conifer forests [35], to retrieve spruce chlorophyll content from airborne images [36], and to simulate reflectance spectra and LiDAR data for tree canopies [37,38,39]. In addition, radiative budget (absorbed, scattered, and intercepted radiation) produced using the PROSPECT-DART model which has been demonstrated to be well-suited to simulating urban landscapes [40].
The two main goals of this study were 1) to explore the influences of background and illumination conditions on fAPAR and fIPAR for individual trees in the context of urban greenery, and 2) to evaluate the differences between fAPAR and fIPAR and corresponding factors that influence such scenarios. For this purpose, we used radiative budget products of PAR bands coupled with the PROSPECT-DART leaf-canopy radiative transfer model for individual tree fAPAR/fIPAR analysis. To identify fAPAR and fIPAR on sunlit and shaded leaves, machine learning, and pattern recognition algorithms were applied to the simulated individual trees.

2. Materials and Methods

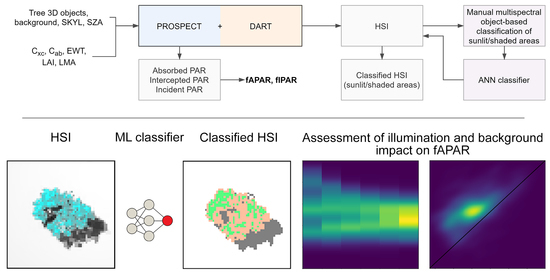
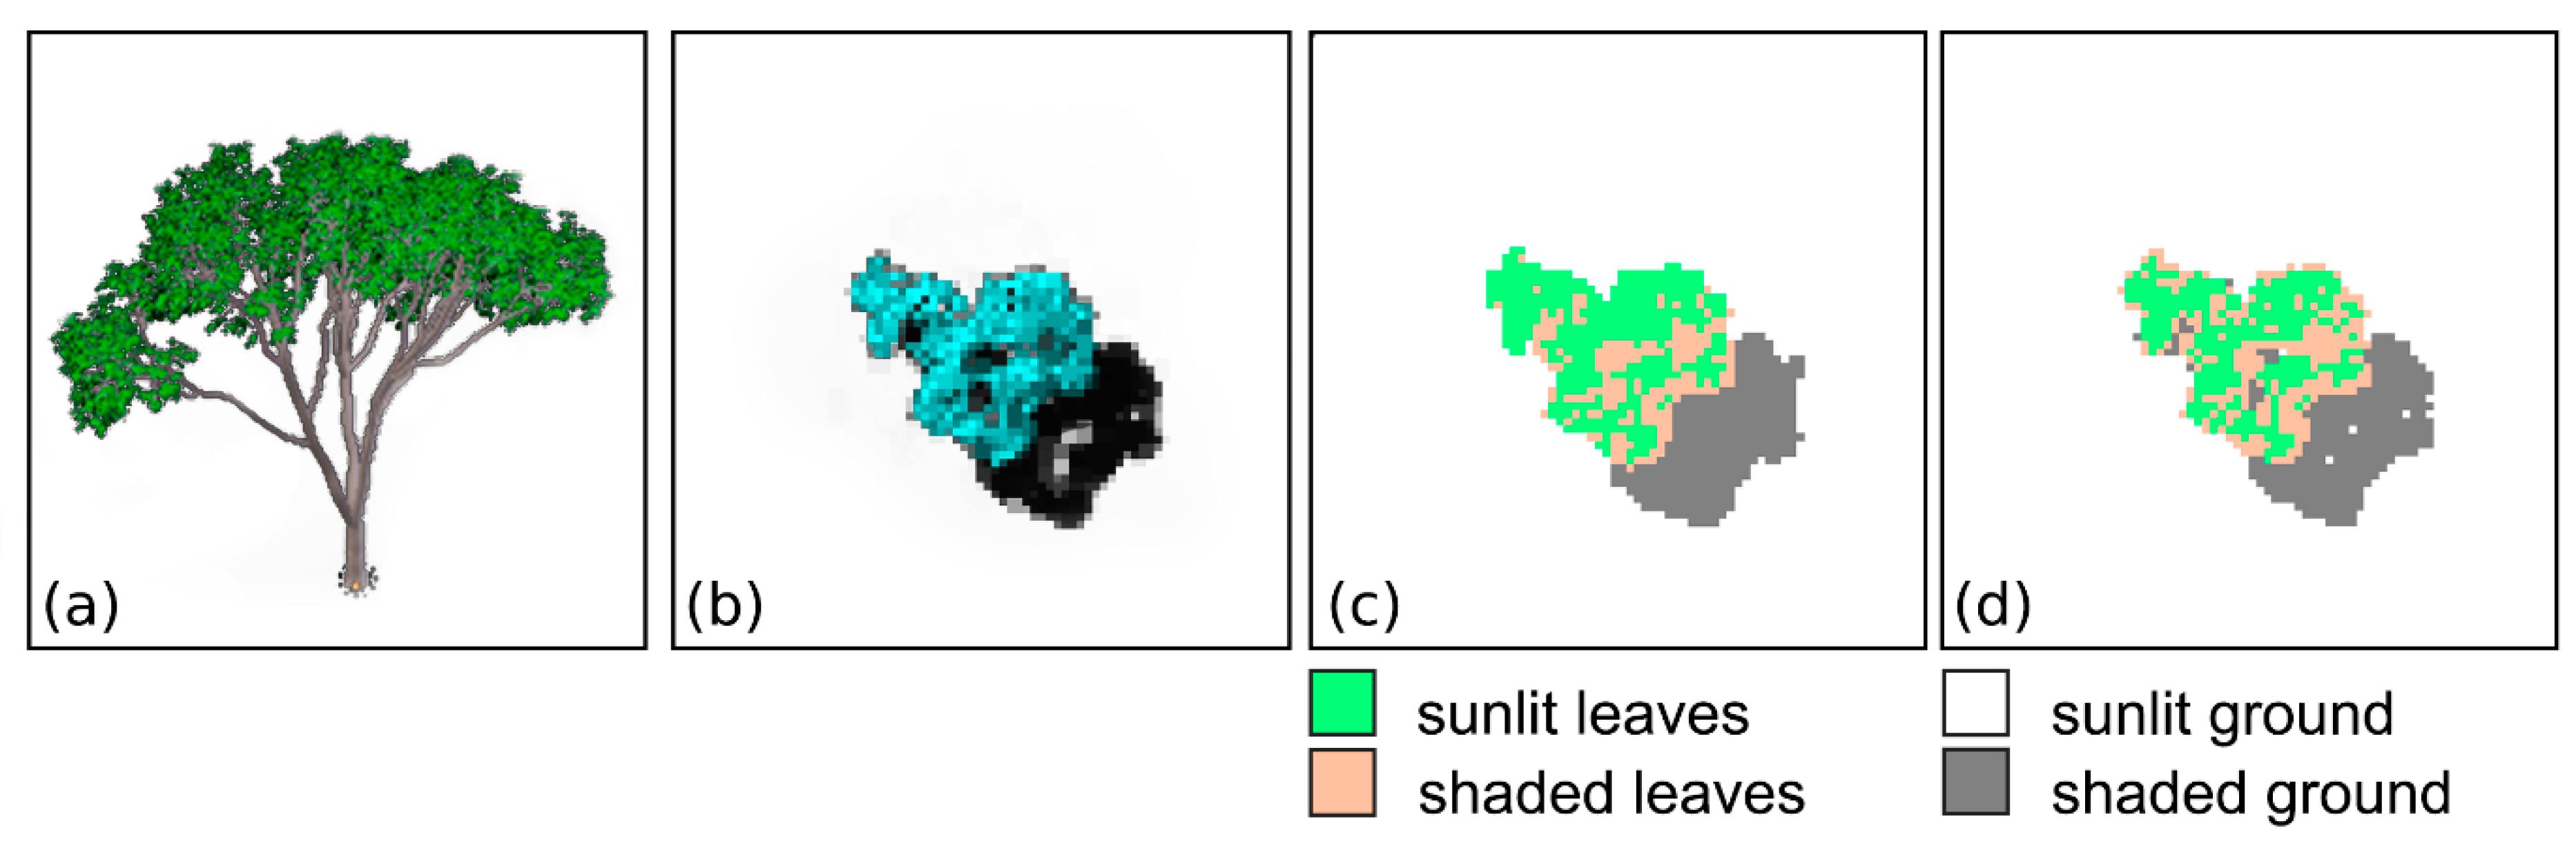
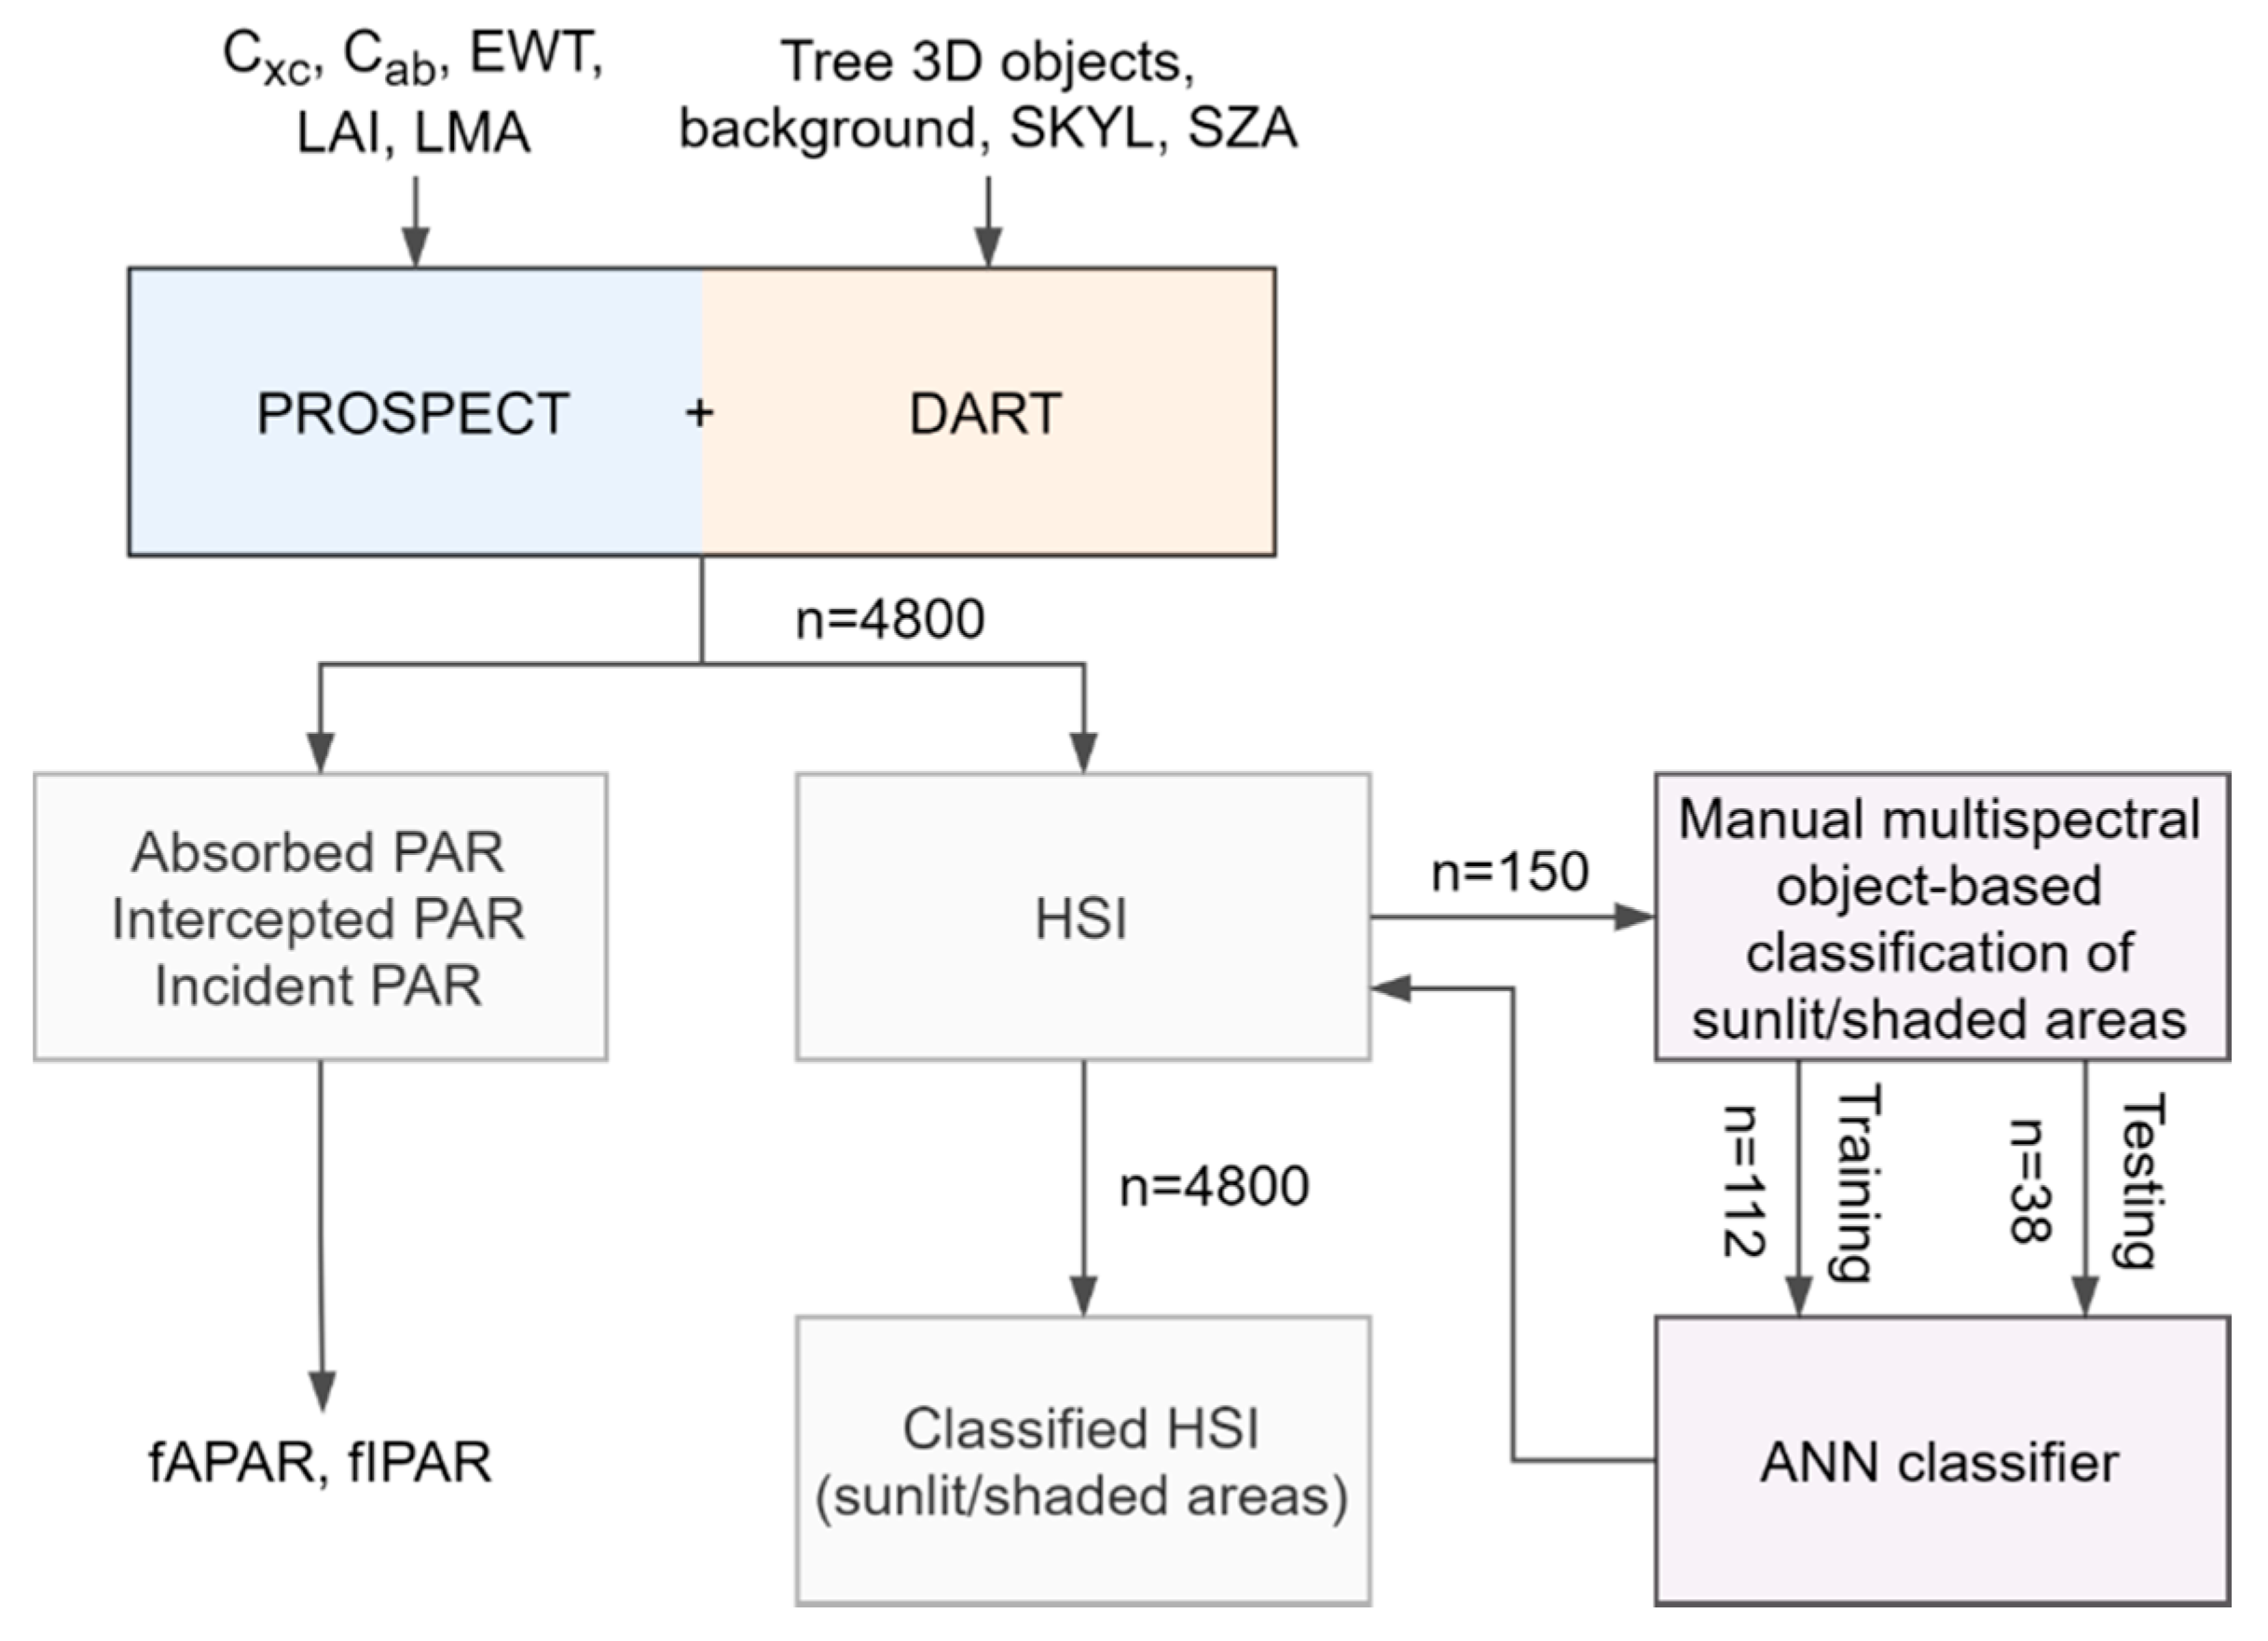
2.1. Simulation of Hyperspectral Images and Radiative Budget Products of Individual Trees

We used ensemble-based simulations of hyperspectral images (HSI) and radiative budget products for model trees using the coupled PROSPECT-DART leaf-canopy radiative transfer model [40]. Here the DART scenes were generated with a single, centered three-dimension (3D) tree model. The current simulations were conducted for ten species of trees, Table 1, that are common in tropical urban environments and represent a wide range of canopy structures. We consider illumination conditions corresponding to 6 diffuse ratios (SKYL) and two solar zenith angles (SZA = 0, 45°). In order to explore the effect of the background, the DART scenes were composed with two contrasting backgrounds, grass, and concrete. The grass leaf scale spectral and the concrete spectral were randomly selected from the DART database (Figure A1), and the corresponding spectral data were downloaded from the Ecological Spectral Information System [41,42]. The leaf area index (LAI = 0–2) was randomly assigned to the grass background for the reflectance of grass background simulation in DART. No grass was distributed on the concrete background (LAI = 0). The resulting average PAR band albedo was approximately 0.08 for the grass background and approx. 0.24 for concrete.
The optical properties of leaves were simulated using the PROSPECT model [34,43], Table 1. We vary the assumed chlorophyll contents from Cab = 10 μg/cm² to 100 μg/cm², while carotenoids were set to Cxc = 0.25Cab with random white noise (pers. comm. J-B Féret). The resulting reflectance of healthy leaves and the trunk was approximately 0.06 and 0.1, respectively.
A total of 4800 HSI images and radiative budget products with 0.5 m spatial resolution and 40 m×40 m size were generated (10 tree species with 2 leaves densities, 2 different backgrounds, at 2 SZA, 6 SKYL values and 10 chlorophyll (Cab) content levels). Each simulated HSI is comprised of 50 spectral bands (spanning wavelengths between 0.4 µm and 1.0 µm) with 5 nm bandwidth. In order to more closely emulate the real conditions, the radiative budget products, namely the intercepted PAR, absorbed PAR and incident PAR, were based here on fluxes from all directions, rather than only on vertical fluxes. In addition, intercepted and absorbed PAR simulated here includes both direct and diffuse light. During the DART simulation, the direct illumination and interception and scattering of previously scattered radiation are simulated iteratively. Considering that multi-scattering radiation contributes to both the absorption and interception process by the trees, 5th iteration PAR radiation scattering was used for absorbed PAR and intercepted PAR simulation. In each iteration, every time a radiation interception occurs, scattering within each of the cells constituting the scene is computed and accounted for in subsequent iterations [40].

2.2. Automatic Classification of Hyperspectral Images

In order to investigate the differences in FPAR of sunlit and shaded leaves, 150 HSI were manually classified based on composite images (wavelengths 0.605 µm, 0.850 µm, and 0.860 µm assigned to R, G, and B, respectively, for visual identification). The manual multispectral object-based classification was performed using the ECognition v. 9.0.1 software [44]. The composite images were used to visually classify sunlit and shaded leaf areas which were then used as target variables when training the machine learning model, using the entire 50-band spectrum as inputs.
The manually classified HSI were converted into 2D arrays, with each band treated as a separate variable in the subsequent steps. For the purpose of validation, 75% of the HSI chosen randomly were used for training, and the remaining 25% were used for testing the classification algorithm. The HSI in the training dataset were then appended with the target classes from the corresponding manually classified images based on the SKYL value. Since the Cab value has no impact on whether a given area of the tree is sunlit or shaded, the same target classes were assigned to HSI differing in Cab, thus increasing the training dataset and reducing the risk of overfitting of the model. Since the variables are hyperspectral bands, with values within the same order of magnitude, it was not necessary to perform data normalization. The ReliefF algorithm [45] and an ensemble of decision trees (Random Forest [46]) were used to assess the feature importance in regard to data classification [47], and principal component analysis (PCA) was used to assess the possibility to reduce the dimensionality of the dataset. Machine learning was based on an artificial neural network (ANN) model from the SciKit Learn Python package (the Multi-layer Perceptron classifier v. 0.18 [48]). Rectified linear unit function (ReLu) was used for activation, and the weights were optimized using the stochastic gradient-based optimizer (Adam) [49]. The regularization term was set to 0.001. The network consisted of an input layer with 50 nodes, three hidden layers each with 32 nodes, and an output layer with a single node. The overall performance of the model was assessed based on 10-fold stratified cross-validation. In order to tentatively evaluate the classification algorithm and to check for methodological errors the entire procedure was tested on the Indian Pine HSI dataset acquired by the AVIRIS sensor in Indiana in June 1992 [50]. This dataset contains a multiband hyperspectral image of an area with each pixel classified into one of several categories (type of crop/vegetation) which makes it a good test case for the application described herein. When the Indian Pines dataset was used as input, the model produced an overall classification accuracy of 96% based on 10-fold stratified cross-validation which is consistent with the results of earlier studies in which ANNs were used to classify hyperspectral images [51,52].
The pixel-wise approach to spectral information in this particular classification task is valid due to the limited number of discrete categories and the use of ANNs, as outlined by Li et al. [51]. The trained model was then used to automatically classify the HSI from the testing dataset and to generate corresponding images.

2.3. Estimation of fAPAR/fIPAR

In this study estimation of fAPAR and fIPAR is based on the radiative budget (absorbed, scattered and intercepted radiation) produced by the PROSPECT-DART simulation. Values of fAPAR and fIPAR are defined by
fAPAR =   absorbed   PAR incident   PAR
fIPAR =   intercepted   PAR incident   PAR
The fAPAR / FIPAR calculated here account not only for the single scattering radiation of the leaves but also for radiation scattered and reflected by the background, leaves, tree trunks, and other elements of the scene over multiple iterations. This is also consistent with the field-measured fAPAR/fIPAR from the above-mentioned optical instruments which measure the total absorbed/intercepted radiation and account for the contribution of multiple scattering.
The radiative budget product was simulated along with the hyperspectral images for each scene (tree) using the amount of incident, intercepted and absorbed radiation with respect to the leaves in a three-dimensional grid. Five iterations were performed for each scene. The wavelength range of PAR is 0.4–0.7 µm. Three band intervals (0.4–0.5 µm, 0.5–0.6 µm, and 0.6–0.7 µm) were simulated separately to increase the simulation accuracy and were subsequently integrated into a single PAR band. The results of simulations performed using the DART model were averaged for each scene, except when the effect of the SZA on the proportion of sunlit and shaded leaves was investigated, in which case the pixel-wise average of the entire dataset comprised of all the scenes was considered. In the case of the diffuse ratio, the results were binned into discrete categories corresponding to each of six input SKYL values in the DART model. Figure 1 illustrates a typical HSI image converted to an RGB image for classification and the corresponding outputs of the ANN-based classification sunlit vs. shaded leaves and ground. The flowchart of the simulation and data processing in this study is illustrated in Figure 2.

2.4. The Analysis of Differences between fAPAR and fIPAR

The differences between fAPAR and fIPAR were investigated by juxtaposing the results obtained at the different background and illumination conditions. The values were compared both on the pixel-wise and tree-wise basis. The effects of background, SKYL, SZA, and chlorophyll content (Cab) were investigated separately for fAPAR and fIPAR. Additionally, the overall effect of the sunlit and shaded areas of the individual tree HSI were also evaluated. The pixel-wise distribution was illustrated in the form of density distribution biplots, with color gradients indicating the density.

3. Results

3.1. Automatic Classification of Hyperspectral Images Using Artificial Neural Networks

The overall classification accuracy of the HSI of trees was 92.2% based on 10-fold stratified cross-validation, and 90.0% when the model was tested on the test dataset which was not used for training. The classification accuracy of the model decreased with more diffuse illumination conditions ranging from 96.1% at SKYL = 0%, to 88.0% at SKYL = 100%. There is a similar trend in classification accuracy for the shaded leaves (85.2% to 76.2% for SKYL = 1%, 100%, respectively) while the classification accuracy for the “sunlit leaves” increased from 70.1% to 81.0% in the same range of diffuse ratio. This result is likely due to the sharper differences between sunlit and shaded areas under less diffuse illumination conditions, making it easier to partition these regions during manual classification.
Examples of low classification accuracy of the “sunlit” and “shaded” leaf classes are shown in Figure 3a,b, respectively. It should be noted that these do not necessarily reflect the discrepancies between the manually and automatically classified images. Firstly, the manual classification was based on three bands (605 nm, 850 nm, and 860 nm) of the hyperspectral image, while the automatic classification is based on a much broader range of data (i.e., all 50 bands) and the associated detailed texture and structure information, especially in the case of individual trees [53]. Furthermore, since the manual classification is based on the subjective decision of the operator, there is some room for human error and inconsistency. These errors might be inherited by the model since the manually classified images were used as targets in the training. However, due to the number of individual HSI used (n = 150), it is likely that the inconsistencies caused by human error were mostly averaged out. Therefore, upon visual inspection, many of the automatically classified images bear a closer resemblance to the original HSI than their manually classified counterparts, as shown in Figure 3c.
In a few instances, especially at higher SKYL values, the model misclassified the “shaded ground” as “sunlit ground” as shown in Figure 3d. In other rare cases, also at higher SKYL values, areas belonging to the sunlit ground class were classified as shaded ground producing artefacts (see Figure 3e). However, since only shaded and sunlit leaves areas are considered in comparing fAPAR and fIPAR in this work, these artefacts did not affect the overall outcome.

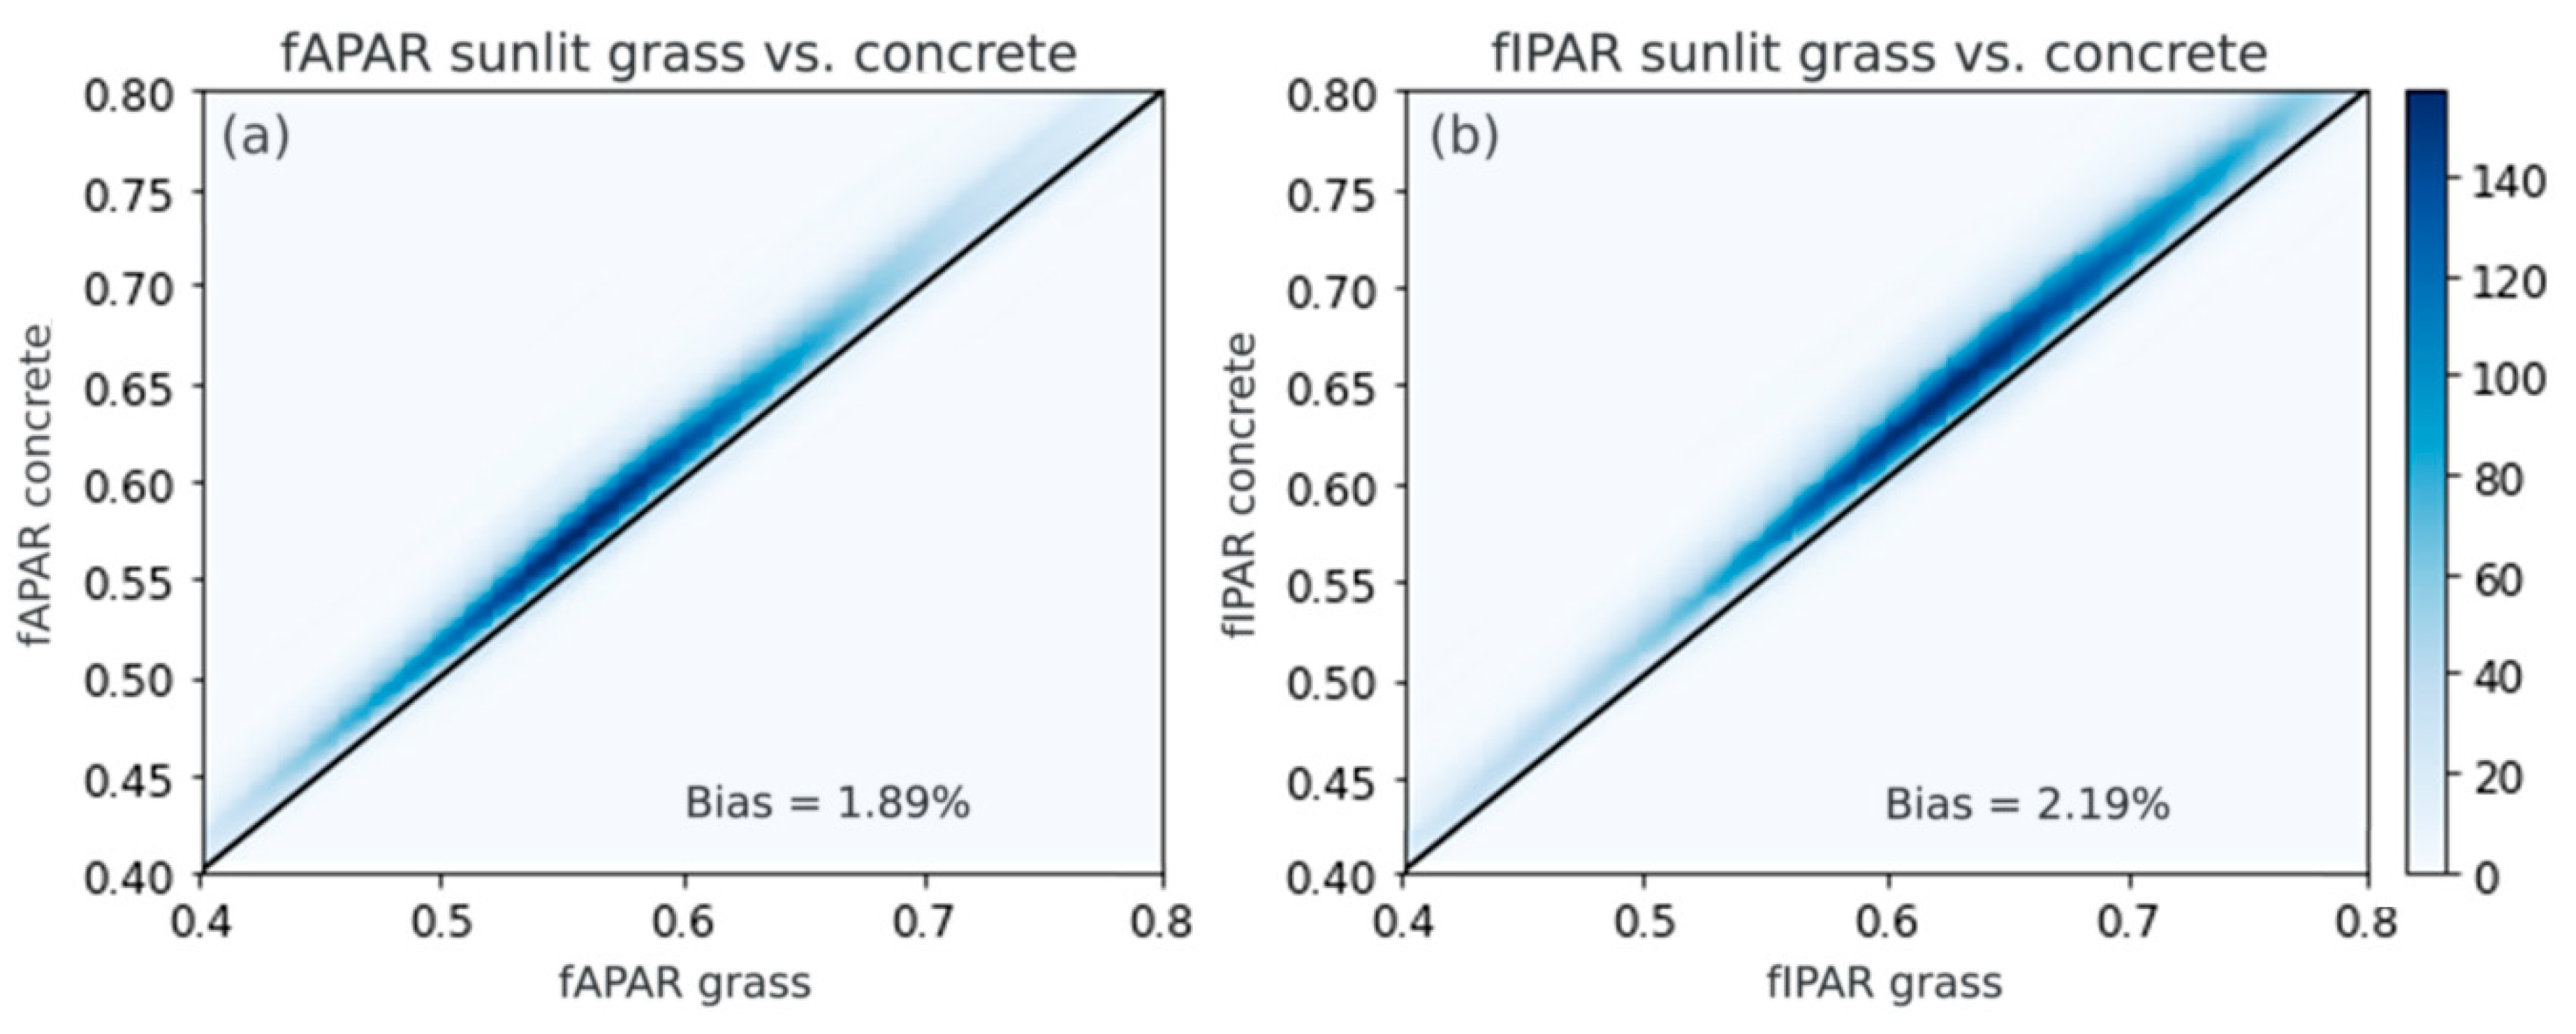
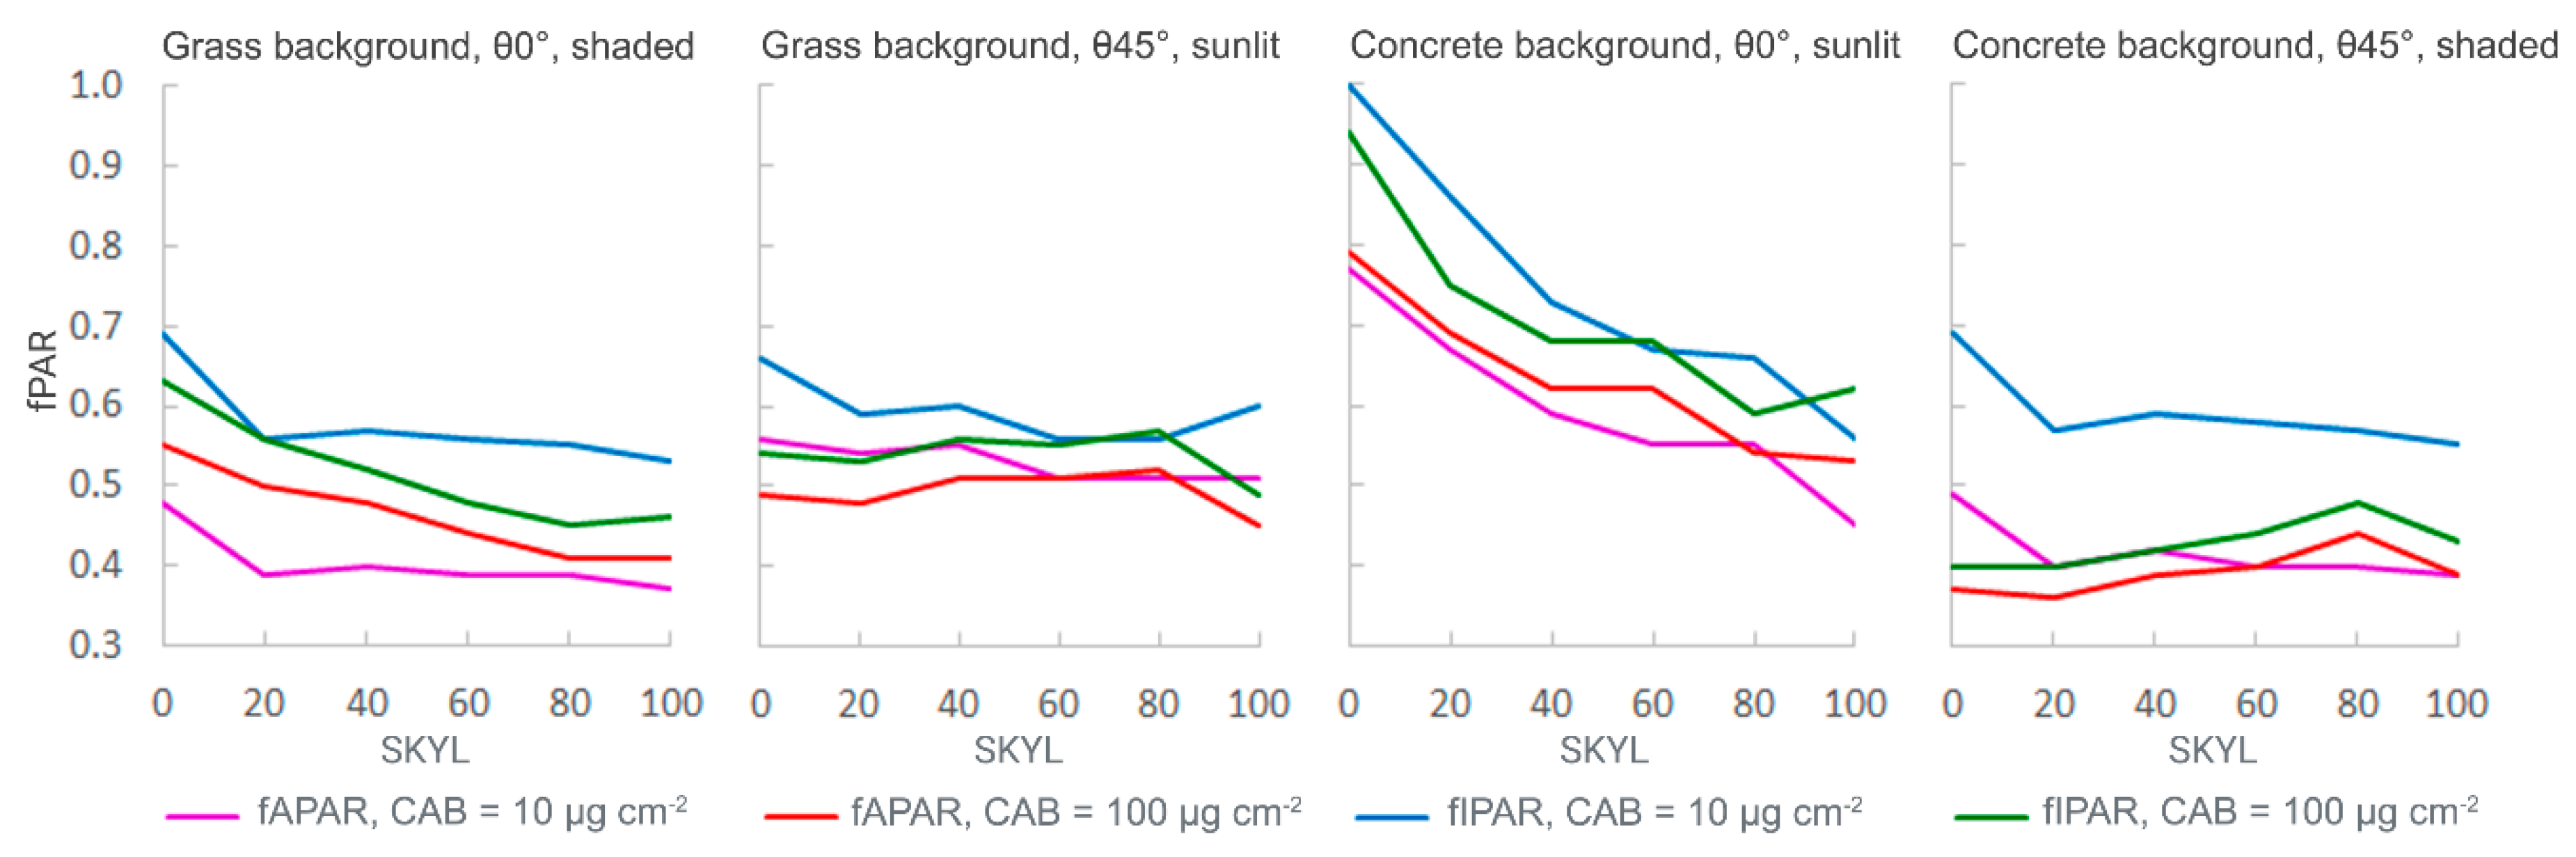
3.2. Impact of Illumination and Background on Individual Tree fAPAR/fIPAR

Both fIPAR and fAPAR are affected by illumination conditions and sunlit/shaded leaves distributions, as shown in Figure 4. Sunlit leaves show higher levels of fAPAR and fIPAR than shaded leaves. Both fAPAR and fIPAR are more dispersed at lower SKYL, likely due to radiance heterogeneity at direct illumination. Conversely, they are less dispersed at higher SKYL, as PAR tends to be more homogenous with the increase of SKYL (as shown in Figure 4b,d). Similar results were observed for the concrete background (not shown here for the sake of brevity).
Table 2 summarizes the effects of illumination and background conditions on tree-wise average fractions of absorbed and intercepted PAR for sunlit and shaded leaf partitions. The values of fAPAR and fIPAR for sunlit leaves decreased with the level of diffuse illumination (SKYL) for both grass and concrete backgrounds but remain relatively stable for shaded leaves for all illumination conditions. The degree to which the sunlit/shaded leaves distribution affected both fAPAR and fIPAR was influenced by both SZA and SKYL.
Figure 5a,b compare the impacts of the background (concrete vs. grass) on estimations of fAPAR and fIPAR for sunlit leaves, respectively. Higher values of both parameters for the concrete background were probably due to the stronger multiple scattering compared to grass (Figure 5). The background had a larger impact on fIPAR, with an overall relative difference between the grass and concrete background of approximately 2%. The effect of background on fAPAR/fIPAR increased with the increase of SKYL (Table 2).

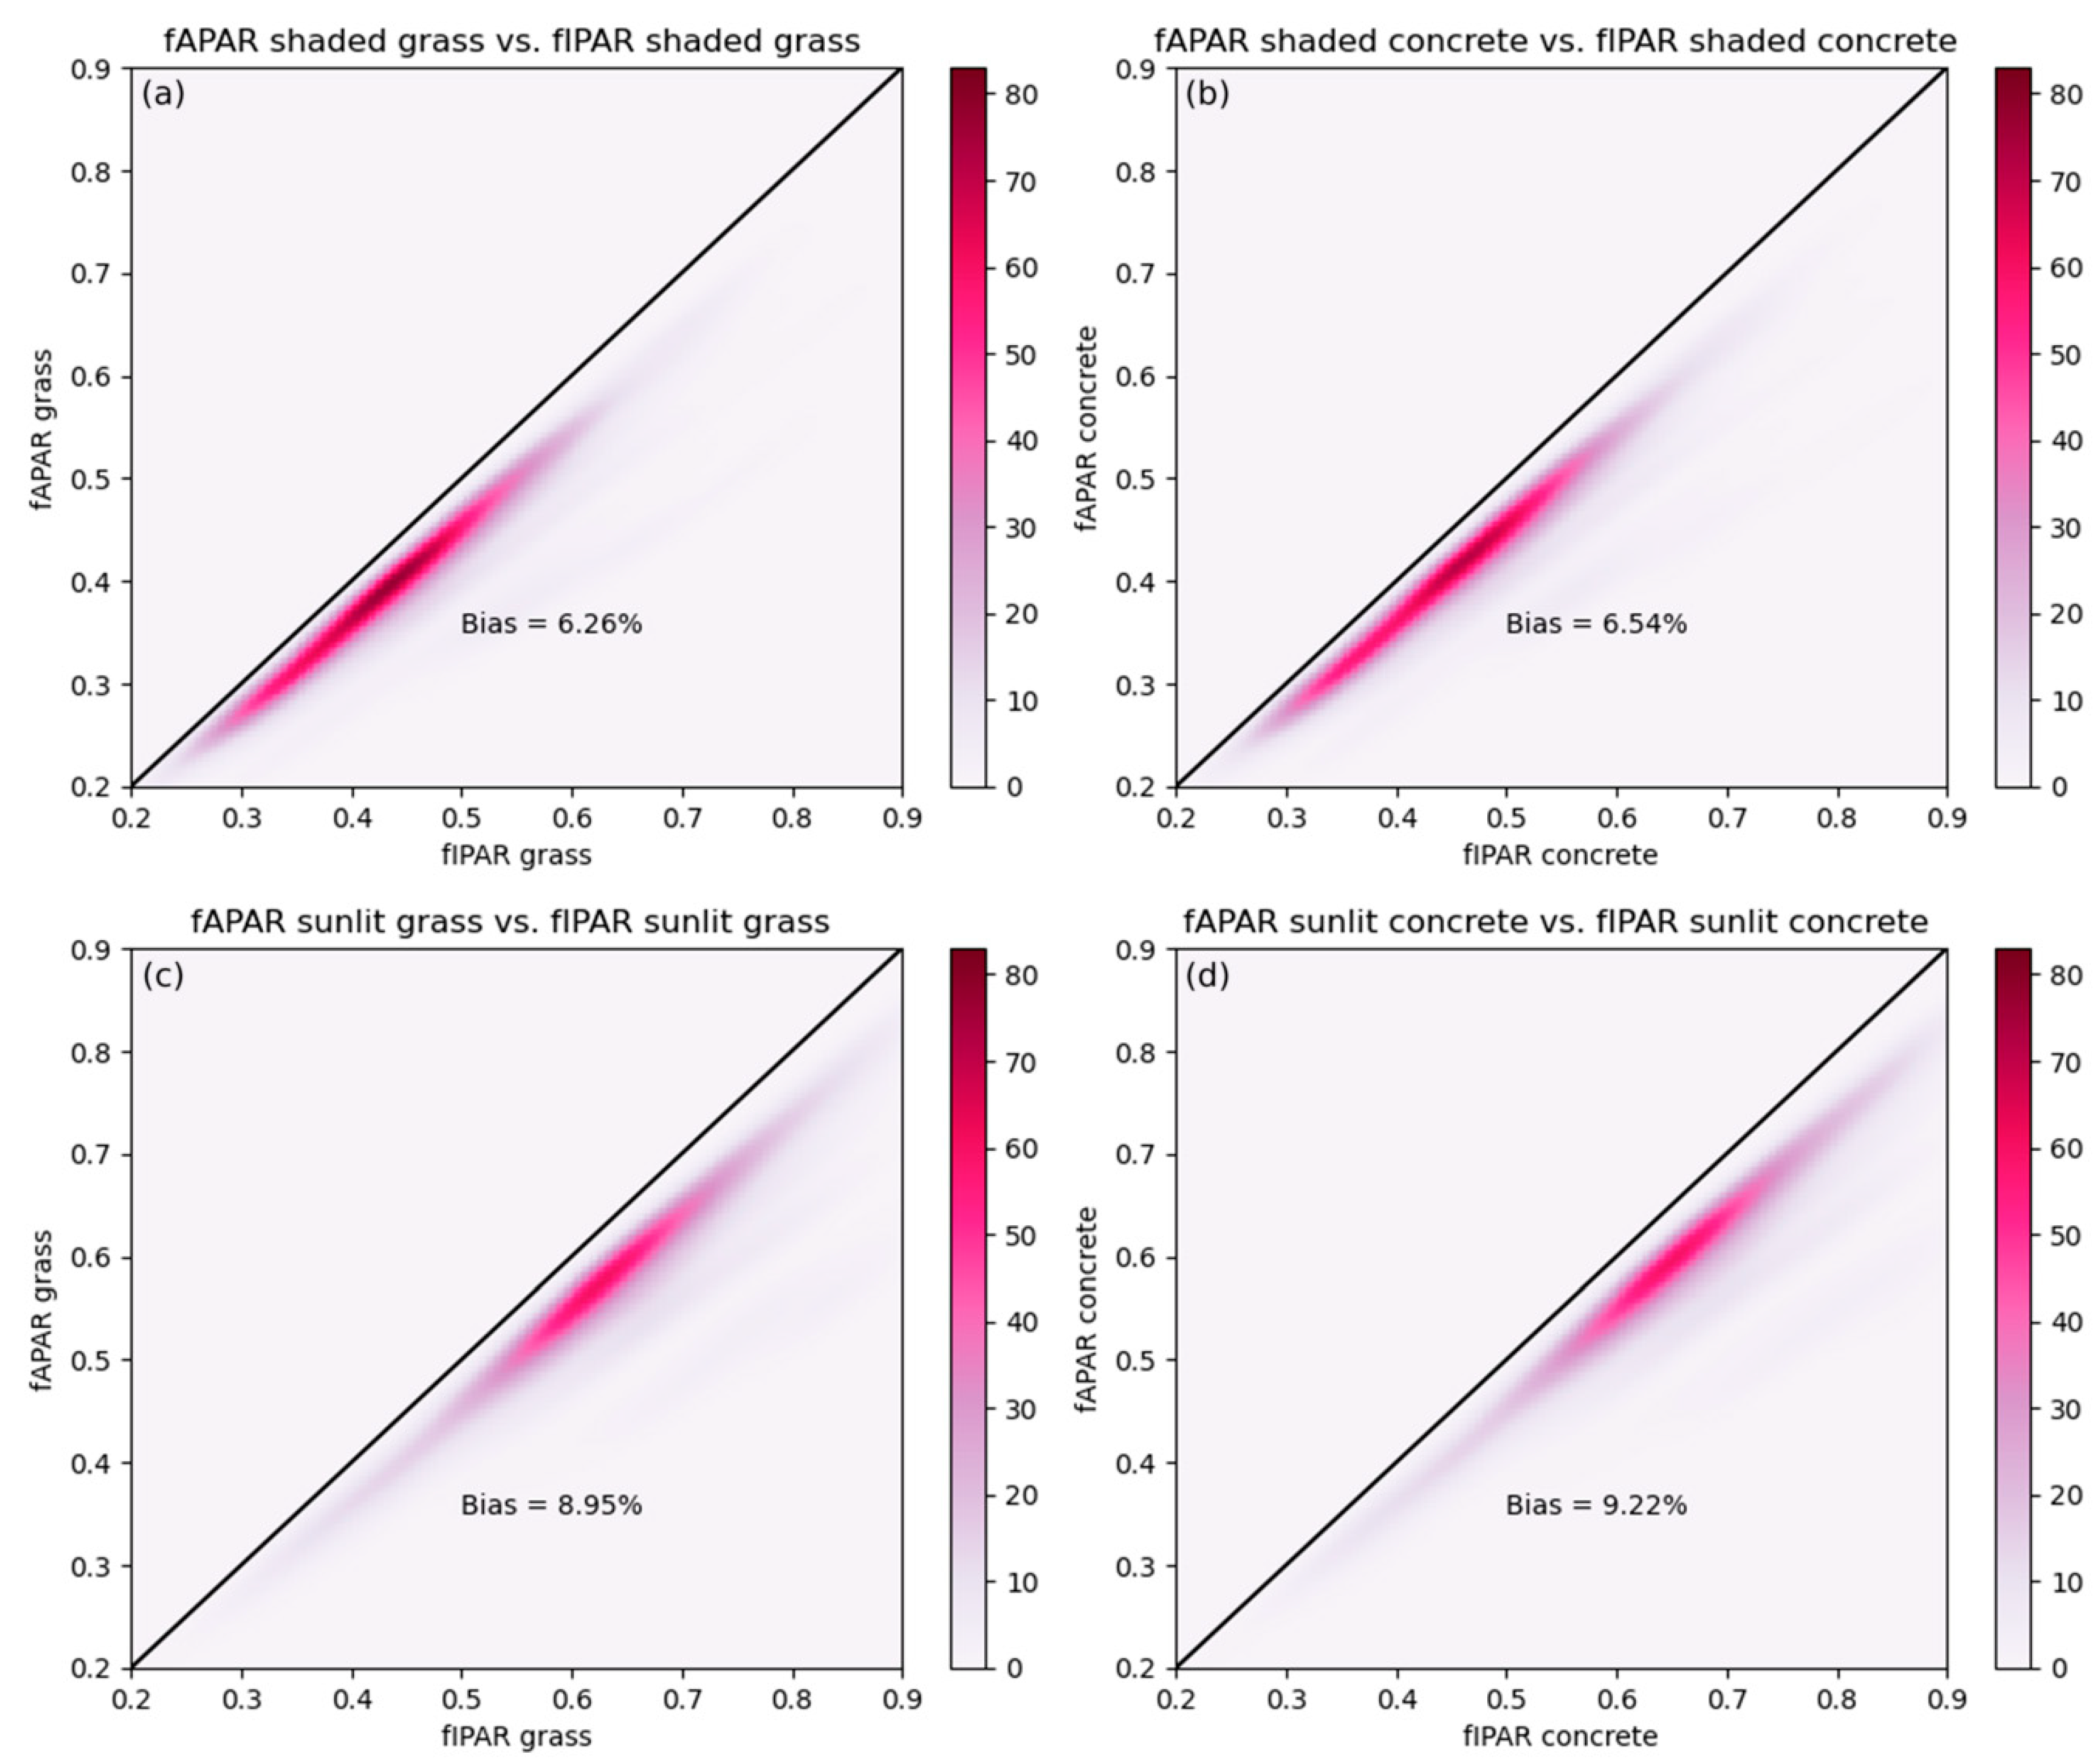
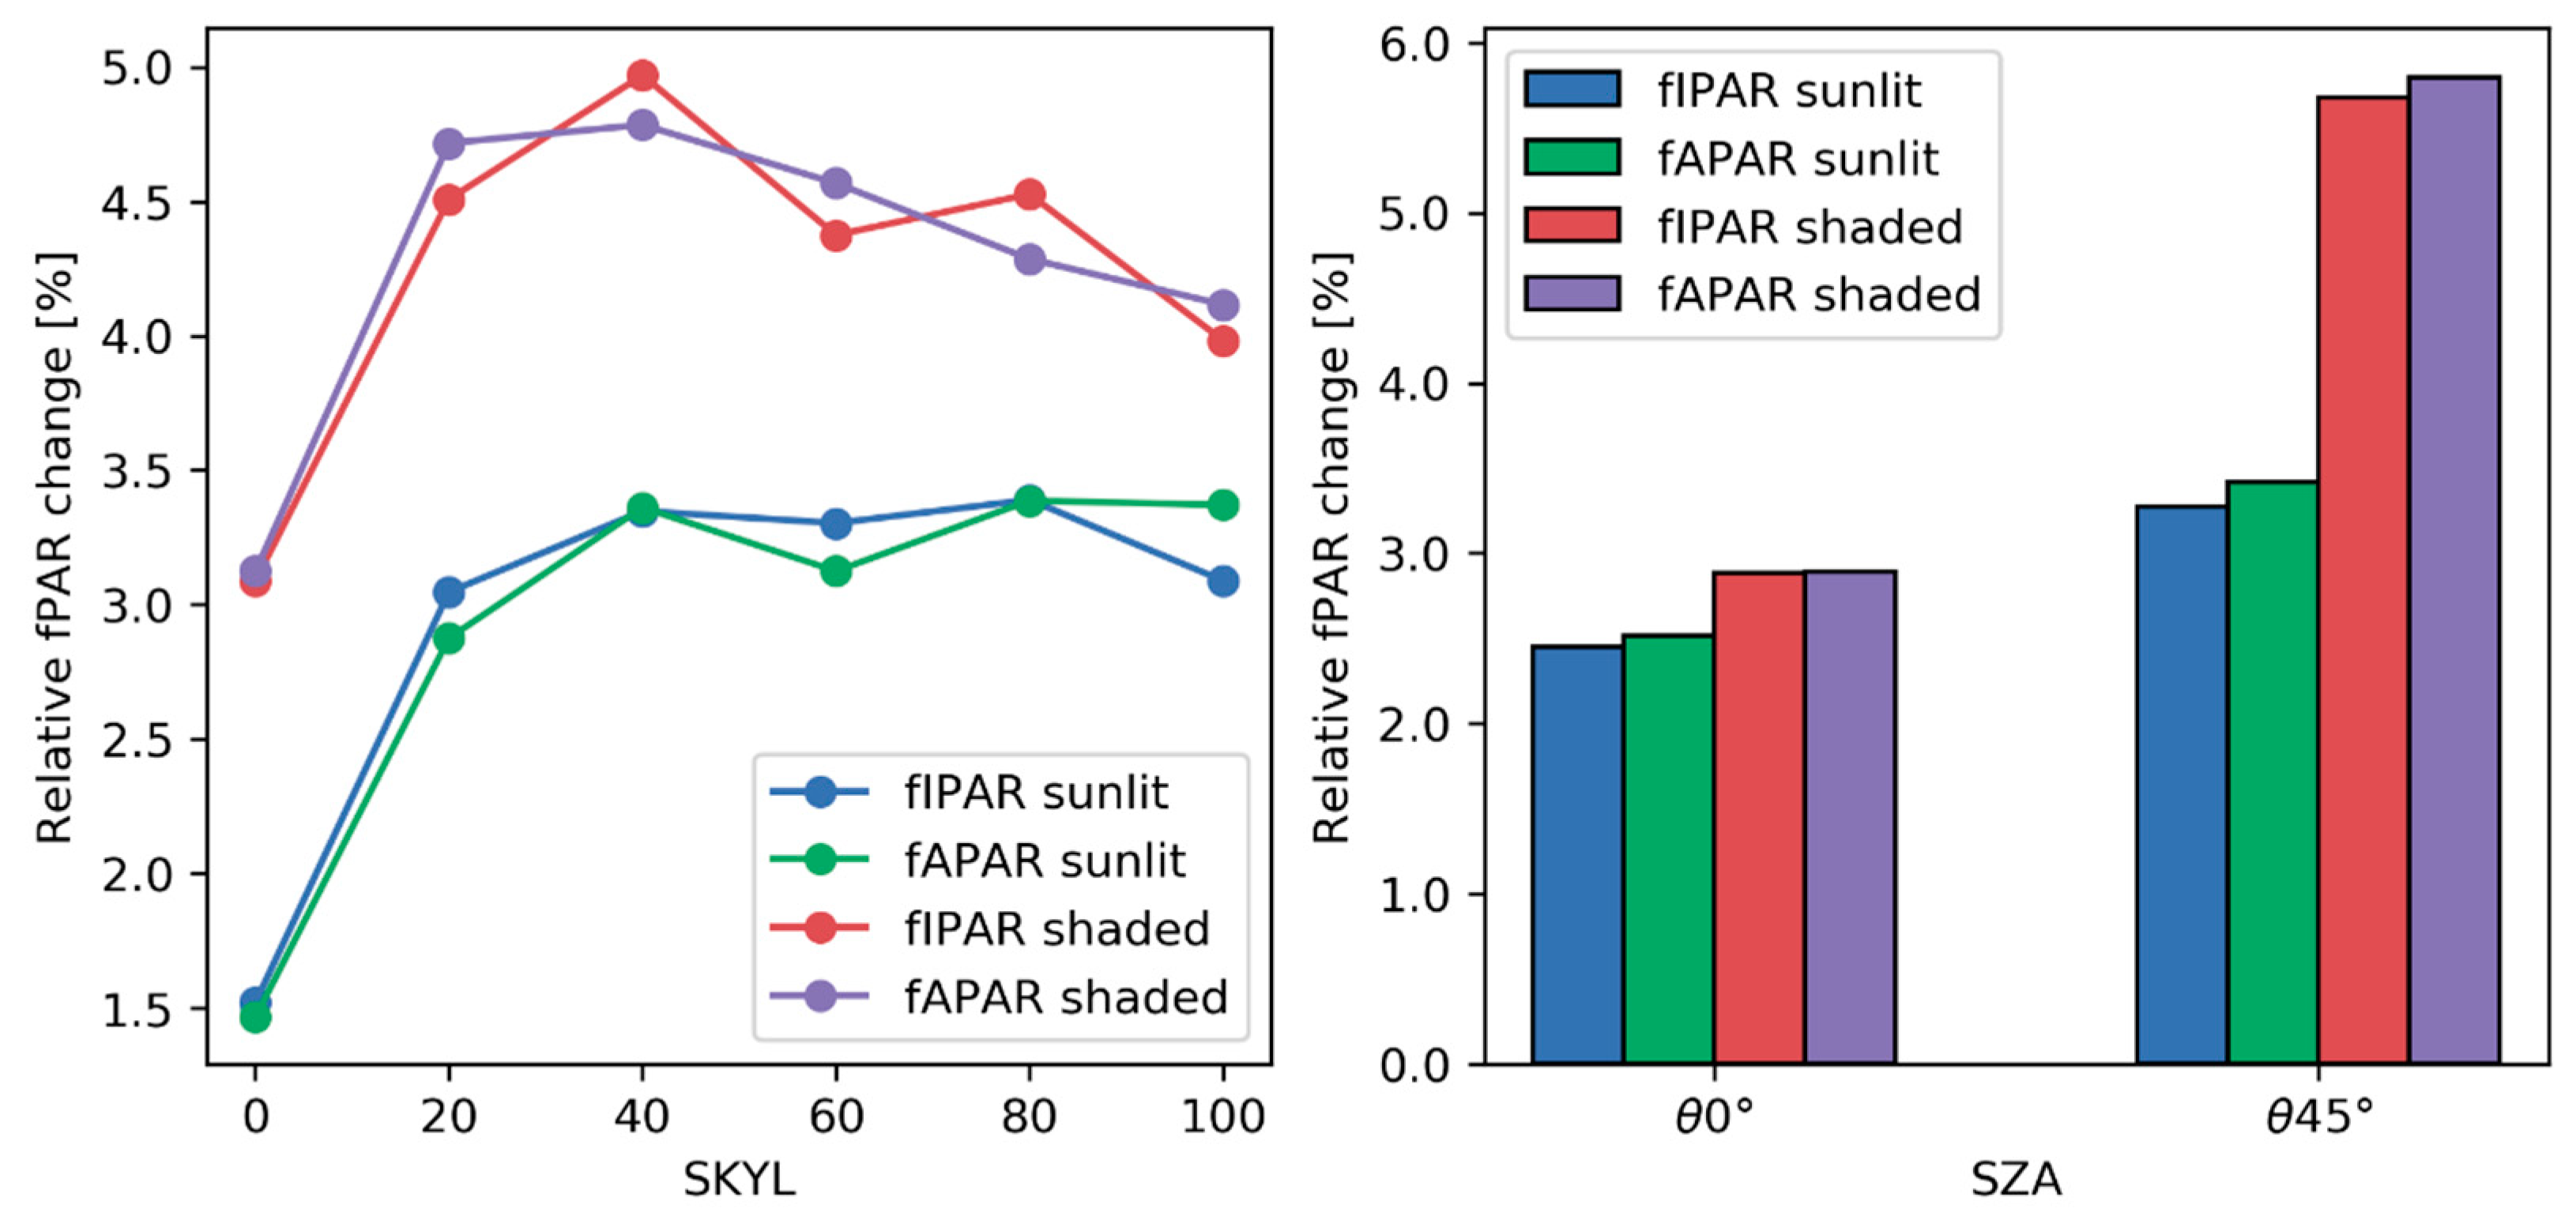
3.3. The Impact of Illumination and Background on Differences between fAPAR and fIPAR

By comparing the fAPAR and fIPAR values obtained with different backgrounds and at different illumination conditions, Figure 6, it can be observed that while the two fractions are closely correlated, they are far from equivalent. The fIPAR values are noticeably higher than fAPAR values. The average overall relative difference between fAPAR and fIPAR exceeded 9%, and it was around 14% in certain cases, e.g., when considering sunlit leaves with a concrete background and at SKYL = 0% (Table 2).
The differences between fAPAR and fIPAR were further studied for different leaf chlorophyll contents. Figure 7 compares results for very low and high leaf chlorophyll contents (Cab = 10 vs. 100 μg/cm2, respectively) for sunlit and shaded leaves. At high chlorophyll levels, there are small differences between fIPAR and fAPAR (typically less than 5–10%) for all background and illumination conditions considered, due to the high amount of foliar absorption. In comparison, fIPAR can be up to 20–25% higher than fAPAR for leaves with low chlorophyll content. The results also show that the highest fractions of absorbed and intercepted PAR occur during direct illumination (SKYL = 0%, SZA = 0°) of sunlit leaves, Figure 7c.
Finally, differences between the effect of grass and concrete backgrounds on fAPAR and fIPAR are greatly influenced by the distributions of sunlit and shaded leaves, SKYL, and SZA. Figure 8 shows that the relative difference in absorbed and intercepted PAR fractions between the grass and concrete backgrounds is most pronounced for shaded leaves, especially for SKYL ≥ 20%, at the higher solar zenith angle, SZA = 45°. It follows that the background influence on both fAPAR and fIPAR will be enhanced by the diffuse illumination and oblique SZA.

4. Discussion

4.1. Individual Tree fAPAR/fIPAR and Influencing Factors

Most previous fAPAR/fIPAR studies were focused on continuous vegetation such as crops and forests [11]. To our best knowledge, this is the first study focused on the urban individual trees. Individual trees have a more complex apparent structure and external environment including illumination and background. This study shows all the above factors would influence the fAPAR/fIPAR. As to the background influence on fAPAR/fIPAR, a previous study shows it is stronger for a clear day (small SKYL) than for a cloudy day (large SKYL) [11]. Similarly, the current study shows that the difference between grass background fAPAR/fIPAR and concrete background fAPAR /fIPAR is smaller with the increase of SKYL (Figure 6). However, this effect can only be clearly observed for nadir solar angle (SZA = 0°) while it is not obvious for oblique solar angle (SZA = 45°).
Considering the influence of illumination, both fAPAR and fIPAR tend to be more stable with the increase of the diffuse ratio (Figure 3), which is consistent with the results of a previous study which indicated that total diffusion shall reduce sample error in open forests [54]. In addition, this current study shows the fAPAR/fIPAR decrease with the diffuse ratio for both sunlit leaves and shaded leaves for the urban trees (Figure 3 and Table 2). This finding is different from the measurements in rice [28] which indicated that fAPAR and fIPAR under white sky conditions (SKYL=1) are higher than under black sky (SKYL = 0). The differences might be caused by the condition of the leaves and the multi-scattering of the trunk and branches. Previous study shows that low chlorophyll content leads to a higher fAPAR under direct sunlight conditions and conversely higher chlorophyll content leads to a higher fAPAR under diffuse conditions [12]. This current study finds that the oblique solar illuminations can increase both fAPAR and fIPAR, especially for the shaded leaves (Figure 7). That is probably because the oblique illumination can increase the length of the path to penetrate the canopy which shall increase the chance of the PAR to be intercepted and absorbed.
As to the tree structure influence, the distribution of trunk and branches, which are usually characterized by strong reflectance, can decrease fAPAR. At the same time, the multi-scattering caused by the trunk and branch will increase fIPAR. The current study also explores the chlorophyll content influence on the fAPAR and fIPAR (Figure 6). The senescent leaves (Cab = 10) with small chlorophyll content demonstrate lower fAPAR and higher fIPAR. The complexity of the structure shall also determine the sunlit and shaded leaves distribution, which makes the illumination influence even more complex. Thanks to the high resolution of the studied scenes, it was possible to show that the distribution of sunlit and shaded leaves within the crown of the tree has a significant impact on both PAR indices. In the investigated scenarios with free-standing trees, sunlit leaves intercept and absorb more PAR than shaded leaves (Figure 3). Consequently, even though sunlit leaves have lower light use efficiency, they may produce more GPP with larger fPAR [55]. Furthermore, the effect of background reflectance is more pronounced in the case of shaded leaves. This is perhaps less significant in scenarios with dense, continuous canopies, but might contribute to accurate estimation of PAR availability in the built environment, where sections of the crown might be predictably shaded by the surrounding structures at different times of the day. While in the present study the shade was cast by elements of the crown, the proposed approach to identifying sunlit and shaded areas with the aid of a machine learning model can be easily implemented in simulations of PAR availability in high-density urban areas at the spatial resolution of clumps of leaves within the crown of a single tree. In this case, the advantage of machine learning-based classification models is that once the model is trained, its implementation does not incur a high computational cost.

4.2. The Uncertainty of Using fIPAR as a Proxy for fAPAR

In order to simplify the measurement requirements in terms of hardware, cost, and time, fIPAR has been used as a proxy for fAPAR. Widlowski compared five different fAPAR estimation schemes in open-canopy forest in order to assess the uncertainty which such approximation entails [54]. All these schemes are essentially reduced forms of the energy conservation equation. He concluded that out of the assessed approaches the 2-flux fAPAR (fIPAR) estimator performs best which suggests that fIPAR is a good approximation of fAPAR for open forests. However, in the case of urban individual trees, fIPAR overestimates fAPAR by approximately 10% (Figure 5). In addition, the overall relative differences between fAPAR and fIPAR obtained in this study were almost twice as high as the ones reported in earlier studies in the case of full plant cover, which were generally no greater than 5% [56,57]. Such a difference would be non-negligible when considering, e.g., the GPP of urban greenery.
Similar to the previous study [54], the current study shows that the differences between fIPAR and fAPAR also depend on the illumination condition, foliage colour and background (Figure 5 and Figure 6). While the increase in the simulated difference between the two indices resulting from increased background reflectance (in this case grass and concrete backgrounds, with background reflectance of approximately 0.06 and 0.25, respectively) is consistent with the results of fAPAR estimations for sparse vegetation based on remote sensing data [23], in our case the fIPAR value is higher than fAPAR. This is likely due to the fact, that in the present study the leaves are not assumed to be completely absorbing. Instead, the leaves are assigned Cab values ranging from 10 to 100, which includes green and brown leaves. Previous study as well as the optical field instrument DHP and LAI2200 would assume the leaves complete black when they take fIPAR as a proxy of fAPAR. The assumption is true for green, healthy leaves, while in reality, the concentration of pigments varies depending on the health of the tree and the season. Newly-grown leaves, mature leaves, and senescent leaves have different absorption ability in the PAR band. Previous study show that the presence of yellow leaves leads to an overestimation when using fIPAR to approximate fAPAR because yellow leaves are characterized by a higher brightness than green leaves [54,58,59].
Furthermore, the high spatial resolution of the simulated images makes the scattering effect of the non-photosynthetically active material such as the trunk or the branches non-negligible. Thus, although the background reflected radiance can increase the fAPAR, the radiance scattered from the trunk and leaves which is intercepted, but not absorbed is the main reason for the bias towards fIPAR. This supports the results of field measurements using DHP, AccuPAR and LAI-2200 reported by Li et al. [28]. Another factor that might influence the differences between fIPAR and fAPAR is plant leaf density. Nouvellon found fAPAR to be significantly higher than fIPAR for low LAI, while lower than fIPAR for high LAI [11]. Urban trees tend to have a denser distribution of leaves than grass in the referenced study which might result in fIPAR being larger than fAPAR.
3D radiative transferer models play an important role in assessing the uncertainty of field measurement methods [60] and were even believed to be the only means to find the proper measurement strategy for field-based validation campaigns [54]. The five fAPAR estimation schemes explored by Widlowski using the 3D radiative transfer model were only based on vertical flux [54]. Gobron et al. compared the differences between fAPAR and fIPAR using 3D radiative transfer simulation [23]. However, their comparison was based on a single scattering regime under direct illumination. They concluded that the differences between the two indices were minute for forests with vegetation understory. In order to more closely approximate the results of field measurements which are mostly conducted under the blue sky with both direct and diffuse illumination and are influenced by multi-scattering, the simulations in the current study account for the direct and diffuse radiation and multi-scattering. The multi-scattering effect explains why fIPAR would be influenced by the background as the radiance reflected from the background can be intercepted again by the canopy. The brighter concrete background will produce a stronger multi-scatter and increase the intercepted and absorbed PAR, leading to larger fIPAR and fAPAR (Figure 5).

5. Conclusions

The fraction of absorbed photosynthetically active radiation (fAPAR) is an important parameter in analysing the gross primary productivity of plants at the canopy level and is often equated with the fraction of intercepted PAR, fIPAR. In the case of individual trees found in urban scenes, factors such as the illumination conditions, distributions of sunlit and shaded leaves, and background have a pronounced impact on estimations of fAPAR and fIPAR. In this study, the effect of the above factors on the fAPAR and fIPAR of individual trees were investigated. fAPAR and fIPAR were estimated separately for sunlit and shaded leaves. The sunlit and shaded leaves were automatically classified using an artificial neural network-based model.
The results indicate that the illumination conditions and background have a strong effect on the urban individual tree fAPAR, especially when considering the differences between sunlit and shaded leaves separately. The shaded fAPAR was relatively stable with varying diffuse ratio, while sunlit fAPAR decreased with the increase of the proportion of diffuse radiation. fAPAR was also affected by the solar zenith angle, with lower values obtained at an oblique angle. The results also indicate that fAPAR and fIPAR produce different results in an urban setting with individual trees; although, they were considered equivalent when applied to homogenous vegetation and continuous canopies. The differences can be greater than 14% in certain scenarios. Furthermore, both fAPAR and fIPAR are affected by different backgrounds by between 1.5% and 5%, depending on illumination conditions. The differences between these two parameters were influenced by the condition of the leaves (Cab content) as well as by the urban setting. The reported results can deepen the understanding of fAPAR/fIPAR of urban individual trees. They also might facilitate the formulation of guidelines for the estimation of fAPAR during field measurement using traditional portable instruments in an urban setting. In addition, the approach to assessing the radiative budget of individual trees proposed in this work can be a benchmark for evaluating in situ fAPAR measurement techniques.

Author Contributions

Conceptualization, S.W. and W.W.; methodology, S.W., W.W. and W.L.; software, T.Y.; investigation, S.W. and W.W.; resources, A.J.W. and T.Y.; data curation, W.W.; writing—original draft preparation, W.W.; writing—review and editing, A.J.W., X.-X.L., G.L.F.O. and M.L.M.Y.; visualization, W.W.; supervision, S.W. and W.L.; project administration, A.J.W.; funding acquisition, A.J.W. All authors have read and agreed to the published version of the manuscript.

Funding

The project “Computerised Management of Urban Trees: Tree Inspection Using Satellite Data” is funded by the Ministry of National Development Research Fund awarded to the National Parks Board, Singapore.

Data Availability Statement

Data available on request.

Acknowledgments

The authors would like to thank the NParks staff Ang Wenyang, Damien Qiu, Yvonne Chee, and Nanthini Elamgovan for their support and contributed to reviewing this work.

Conflicts of Interest

The authors declare no conflict of interest.

Appendix A. Background Spectral Data Used during the Simulation.

Figure A1. Spectral database of grass and concrete background.
Remotesensing 13 01069 g0a1

References

  1. Badach, J.; Dymnicka, M.; Baranowski, A. Urban Vegetation in Air Quality Management: A Review and Policy Framework. Sustainability 2020, 12, 1258. [Google Scholar] [CrossRef] [Green Version]
  2. Suppakittpaisarn, P.; Jiang, X.; Sullivan, W.C. Green Infrastructure, Green Stormwater Infrastructure, and Human Health: A Review. Curr. Landsc. Ecol. Rep. 2017, 2, 96–110. [Google Scholar] [CrossRef] [Green Version]
  3. Tan, P.Y.; Ismail, M.R. Bin The effects of urban forms on photosynthetically active radiation and urban greenery in a compact city. Urban Ecosyst. 2015, 18, 937–961. [Google Scholar] [CrossRef]
  4. Jim, C.Y.; Tsang, S.W. Ecological energetics of tropical intensive green roof. Energy Build. 2011, 43, 2696–2704. [Google Scholar] [CrossRef]
  5. Liang, S.; Li, X.; Wang, J. Fraction of absorbed photosynthetically active radiation by green vegetation. In Advanced Remote Sensing; Academic Press: Cambridge, MA, USA, 2012. [Google Scholar]
  6. Liu, Z.; Shao, Q.; Liu, J. The Performances of MODIS-GPP and -ET Products in China and Their Sensitivity to Input Data (FPAR/LAI). Remote Sens. 2014, 7, 135–152. [Google Scholar] [CrossRef]
  7. Report of the Sixteenth Session of the WMO-IOC-UNEP-ICSU Steering Committee for GCOS; WMO/TD; WMO: Geneva, Switzerland, 2008.
  8. Tan, P.Y.; Ismail, M.R. Bin Photosynthetically active radiation and comparison of methods for its estimation in equatorial Singapore. Theor. Appl. Climatol. 2016, 123, 873–883. [Google Scholar] [CrossRef]
  9. Tan, P.Y.; Ismail, M.R. Bin Building shade affects light environment and urban greenery in high-density residential estates in Singapore. Urban For. Urban Green. 2014, 13, 771–784. [Google Scholar] [CrossRef]
  10. Li, W.; Fang, H. Estimation of direct, diffuse, and total FPARs from Landsat surface reflectance data and ground-based estimates over six FLUXNET sites. J. Geophys. Res. Biogeosci. 2015, 120, 96–112. [Google Scholar] [CrossRef]
  11. Nouvellon, Y.; Bégué, A.; Susan Moran, M.; Seen, D.L.; Rambal, S.; Luquet, D.; Chehbouni, G.; Inoue, Y. PAR extinction in shortgrass ecosystems: Effects of clumping, sky conditions and soil albedo. Agric. For. Meteorol. 2000, 105, 21–41. [Google Scholar] [CrossRef] [Green Version]
  12. Thomas, V.; Finch, D.A.; McCaughey, J.H.; Noland, T.; Rich, L.; Treitz, P. Spatial modelling of the fraction of photosynthetically active radiation absorbed by a boreal mixedwood forest using a lidar-hyperspectral approach. Agric. For. Meteorol. 2006, 140, 287–307. [Google Scholar] [CrossRef]
  13. Stuart Chapin, F.; Matson, P.A.; Vitousek, P.M. Principles of Terrestrial Ecosystem Ecology; Springer: New York, NY, USA, 2012; ISBN 9781441995049. [Google Scholar]
  14. Majchrzak, T.; Wojnowski, W.; Rutkowska, M.; Wasik, A. Real-Time Volatilomics: A Novel Approach for Analyzing Biological Samples. Trends Plant Sci. 2020, 25, 302–312. [Google Scholar] [CrossRef]
  15. Majchrzak, T.; Wojnowski, W.; Wasik, A. Proton Transfer Reaction Mass Spectrometry for Plant Metabolomics. Trends Plant Sci. 2020, 25, 313–314. [Google Scholar] [CrossRef]
  16. Williams, M.; Rastetter, E.B.; Van Der Pol, L.; Shaver, G.R. Arctic canopy photosynthetic efficiency enhanced under diffuse light, linked to a reduction in the fraction of the canopy in deep shade. New Phytol. 2014, 202, 1266–1276. [Google Scholar] [CrossRef]
  17. Dai, Y.; Dickinson, R.E.; Wang, Y.P. A two-big-leaf model for canopy temperature, photosynthesis, and stomatal conductance. J. Clim. 2004, 17, 2281–2299. [Google Scholar] [CrossRef]
  18. Liu, R.; Ren, H.; Liu, S.; Liu, Q.; Li, X. Modelling of fraction of absorbed photosynthetically active radiation in vegetation canopy and its validation. Biosyst. Eng. 2015, 133, 81–94. [Google Scholar] [CrossRef]
  19. Mercado, L.M.; Bellouin, N.; Sitch, S.; Boucher, O.; Huntingford, C.; Wild, M.; Cox, P.M. Impact of changes in diffuse radiation on the global land carbon sink. Nature 2009, 458, 1014–1017. [Google Scholar] [CrossRef] [PubMed] [Green Version]
  20. Yamasoe, M.A.; von Randow, C.; Manzi, A.O.; Schafer, J.S.; Eck, T.F.; Holben, B.N. Effect of smoke and clouds on the transmissivity of photosynthetically active radiation inside the canopy. Atmos. Chem. Phys. 2006, 6, 1645–1656. [Google Scholar] [CrossRef] [Green Version]
  21. Roderick, M.L.; Farquhar, G.D.; Berry, S.L.; Noble, I.R. On the direct effect of clouds and atmospheric particles on the productivity and structure of vegetation. Oecologia 2001, 129, 21–30. [Google Scholar] [CrossRef] [PubMed]
  22. Hilker, T.; Coops, N.C.; Schwalm, C.R.; Jassal, R.S.; Black, T.A.; Krishnan, P. Effects of mutual shading of tree crowns on prediction of photosynthetic light-use efficiency in a coastal Douglas-fir forest. Tree Physiol. 2008, 28, 825–834. [Google Scholar] [CrossRef]
  23. Gobron, N.; Pinty, B.; Aussedat, O.; Chen, J.M.; Cohen, W.B.; Fensholt, R.; Gond, V.; Huemmrich, K.F.; Lavergne, T.; Mélin, F.; et al. Evaluation of fraction of absorbed photosynthetically active radiation products for different canopy radiation transfer regimes: Methodology and results using Joint Research Center products derived from SeaWiFS against ground-based estimations. J. Geophys. Res. Atmos. 2006, 111, 1–15. [Google Scholar] [CrossRef]
  24. Gobron, N.; Pinty, B.; Aussedat, O.; Taberner, M.; Faber, O.; Mélin, F.; Lavergne, T.; Robustelli, M.; Snoeij, P. Uncertainty estimates for the FAPAR operational products derived from MERIS—Impact of top-of-atmosphere radiance uncertainties and validation with field data. Remote Sens. Environ. 2008, 112, 1871–1883. [Google Scholar] [CrossRef]
  25. Morisette, J.T.; Privette, J.L.; Justice, C.O. A framework for the validation of MODIS Land products. Remote Sens. Environ. 2002, 83, 77–96. [Google Scholar] [CrossRef]
  26. Chen, J.M.; Govind, A.; Sonnentag, O.; Zhang, Y.; Barr, A.; Amiro, B. Leaf area index measurements at Fluxnet-Canada forest sites. Agric. For. Meteorol. 2006, 140, 257–268. [Google Scholar] [CrossRef]
  27. Chen, J.M.; Cihlar, J. Plant canopy gap-size analysis theory for improving optical measurements of leaf-area index. Appl. Opt. 1995, 34, 6211. [Google Scholar] [CrossRef] [PubMed] [Green Version]
  28. Li, W.; Fang, H.; Wei, S.; Weiss, M.; Baret, F. Critical analysis of methods to estimate the fraction of absorbed or intercepted photosynthetically active radiation from ground measurements: Application to rice crops. Agric. For. Meteorol. 2021, 297, 108273. [Google Scholar] [CrossRef]
  29. Goel, N.S.; Qin, W. Influences of canopy architecture on relationships between various vegetation indices and LAI and FPAR: A computer simulation. Remote Sens. Rev. 1994, 10, 309–347. [Google Scholar] [CrossRef]
  30. Gastellu-Etchegorry, J.-P.; Demarez, V.; Pinel, V.; Zagolski, F. Modeling Radiative Transfer in Heterogeneous 3-D Vegetation Canopies Modeling Radiative Transfer in Heterogeneous 3-D Vegetation Canopies. Remote Sens. Environ. 1996, 58, 131–156. [Google Scholar] [CrossRef] [Green Version]
  31. Malenovský, Z.; Martin, E.; Homolová, L.; Gastellu-Etchegorry, J.P.; Zurita-Milla, R.; Schaepman, M.E.; Pokorný, R.; Clevers, J.G.P.W.; Cudlín, P. Influence of woody elements of a Norway spruce canopy on nadir reflectance simulated by the DART model at very high spatial resolution. Remote Sens. Environ. 2008, 112, 1–18. [Google Scholar] [CrossRef] [Green Version]
  32. Pinty, B.; Gobron, N.; Widlowski, J.-L.; Gerstl, S.A.W.; Verstraete, M.M.; Antunes, M.; Bacour, C.; Gascon, F.; Gastellu, J.-P.; Goel, N.; et al. Radiation transfer model intercomparison (RAMI) exercise. J. Geophys. Res. Atmos. 2001, 106, 11937–11956. [Google Scholar] [CrossRef]
  33. Pinty, B.; Widlowski, J.-L.; Taberner, M.; Gobron, N.; Verstraete, M.M.; Disney, M.; Gascon, F.; Gastellu, J.-P.; Jiang, L.; Kuusk, A.; et al. Radiation Transfer Model Intercomparison (RAMI) exercise: Results from the second phase. J. Geophys. Res. Atmos. 2004, 109, 523–538. [Google Scholar] [CrossRef] [Green Version]
  34. Jacquemoud, S.; Baret, F. PROSPECT: A model of leaf optical properties spectra. Remote Sens. Environ. 1990, 34, 75–91. [Google Scholar] [CrossRef]
  35. Hernández-Clemente, R.; Navarro-Cerrillo, R.M.; Zarco-Tejada, P.J. Carotenoid content estimation in a heterogeneous conifer forest using narrow-band indices and PROSPECT+DART simulations. Remote Sens. Environ. 2012, 127, 298–315. [Google Scholar] [CrossRef]
  36. Malenovský, Z.; Homolová, L.; Zurita-Milla, R.; Lukeš, P.; Kaplan, V.; Hanuš, J.; Gastellu-Etchegorry, J.P.; Schaepman, M.E. Retrieval of spruce leaf chlorophyll content from airborne image data using continuum removal and radiative transfer. Remote Sens. Environ. 2013, 131, 85–102. [Google Scholar] [CrossRef] [Green Version]
  37. Gastellu-Etchegorry, J.P.; Yin, T.; Lauret, N.; Grau, E.; Rubio, J.; Cook, B.D.; Morton, D.C.; Sun, G. Simulation of satellite, airborne and terrestrial LiDAR with DART (I): Waveform simulation with quasi-Monte Carlo ray tracing. Remote Sens. Environ. 2016. [Google Scholar] [CrossRef]
  38. Schneider, F.D.; Leiterer, R.; Morsdorf, F.; Gastellu-Etchegorry, J.P.; Lauret, N.; Pfeifer, N.; Schaepman, M.E. Simulating imaging spectrometer data: 3D forest modeling based on LiDAR and in situ data. Remote Sens. Environ. 2014, 152, 235–250. [Google Scholar] [CrossRef]
  39. Yin, T.; Gastellu-Etchegorry, J.P.; Grau, E.; Lauret, N.; Rubio, J. Simulating satellite waveform Lidar with DART model. In Proceedings of the International Geoscience and Remote Sensing Symposium (IGARSS), Melbourne, VIC, Australia, 21–26 July 2013. [Google Scholar]
  40. Gastellu-Etchegorry, J.P.; Martin, E.; Gascon, F. DART: A 3D model for simulating satellite images and studying surface radiation budget. Int. J. Remote Sens. 2004, 25, 73–96. [Google Scholar] [CrossRef]
  41. University of Wisconsin Environmental Spectroscopy Laboratory 2014 Cedar Creek ESR Grassland Biodiversity Experiment: Leaf-level Contact Data: Trait Predictions. Available online: https://ecosis.org/package/2014-cedar-creek-esr-grassland-biodiversity-experiment--leaf-level-contact-data--trait-predictions (accessed on 26 February 2021).
  42. Wright State University Department of Biological Sciences Urban Materials Spectral Library. Available online: https://ecosis.org/package/6dc358cd-ce2d-4e97-920a-82a3b04c8bc2 (accessed on 26 February 2021).
  43. Féret, J.-B.; Gitelson, A.A.; Noble, S.D.; Jacquemoud, S. PROSPECT-D: Towards modeling leaf optical properties through a complete lifecycle. Remote Sens. Environ. 2017, 193, 204–215. [Google Scholar] [CrossRef] [Green Version]
  44. eCognition | Trimble Geospatial. Available online: https://geospatial.trimble.com/products-and-solutions/ecognition (accessed on 25 November 2020).
  45. Todorov, A. An Overview of the RELIEF Algorithm and Advancements. In Statistical Approaches to Gene X Environment Interactions for Complex Phenotypes; Windle, M., Ed.; MIT Press: Cambridge, MA, USA, 2016; ISBN 0262034689. [Google Scholar]
  46. Pal, M. Random forest classifier for remote sensing classification. Int. J. Remote Sens. 2005, 26, 217–222. [Google Scholar] [CrossRef]
  47. Li, X.; Zhang, Y.; Bao, Y.; Luo, J.; Jin, X.; Xu, X.; Song, X.; Yang, G. Exploring the best hyperspectral features for LAI estimation using partial least squares regression. Remote Sens. 2014, 6, 6221–6241. [Google Scholar] [CrossRef] [Green Version]
  48. Pedregosa, F.; Varoquaux, G.; Gramfort, A.; Michel, V.; Thirion, B.; Grisel, O.; Blondel, M.; Prettenhofer, P.; Weiss, R.; Dubourg, V.; et al. Scikit-learn: Machine Learning in Python. J. Mach. Learn. Res. 2011, 12, 2825–2830. [Google Scholar]
  49. Kingma, D.P.; Ba, J. Adam: A Method for Stochastic Optimization. arXiv 2014, arXiv:1412.6980. [Google Scholar]
  50. Baumgardner, M.F.; Biehl, L.L.; Landgrebe, D.A. 220 Band AVIRIS Hyperspectral Image Data Set: June 12, 1992 Indian Pine Test Site 3. Purdue Univ. Res. Repos. 2015. [Google Scholar] [CrossRef]
  51. Li, Y.; Zhang, H.; Xue, X.; Jiang, Y.; Shen, Q. Deep learning for remote sensing image classification: A survey. Wiley Interdiscip. Rev. Data Min. Knowl. Discov. 2018, 8, e1264. [Google Scholar] [CrossRef] [Green Version]
  52. Maxwell, A.E.; Warner, T.A.; Fang, F. Implementation of machine-learning classification in remote sensing: An applied review. Int. J. Remote Sens. 2018, 39, 2784–2817. [Google Scholar] [CrossRef] [Green Version]
  53. Dalponte, M.; Bruzzone, L.; Gianelle, D. Tree species classification in the Southern Alps based on the fusion of very high geometrical resolution multispectral/hyperspectral images and LiDAR data. Remote Sens. Environ. 2012, 123, 258–270. [Google Scholar] [CrossRef]
  54. Widlowski, J.L. On the bias of instantaneous FAPAR estimates in open-canopy forests. Agric. For. Meteorol. 2010, 150, 1501–1522. [Google Scholar] [CrossRef]
  55. He, M.; Ju, W.; Zhou, Y.; Chen, J.; He, H.; Wang, S.; Wang, H.; Guan, D.; Yan, J.; Li, Y.; et al. Development of a two-leaf light use efficiency model for improving the calculation of terrestrial gross primary productivity. Agric. For. Meteorol. 2013, 173, 28–39. [Google Scholar] [CrossRef]
  56. Gallo, K.P.; Daughtry, C.S.T. Techniques for Measuring Intercepted and Absorbed Photosynthetically Active Radiation in Corn Canopies. Agron. J. 1986, 78, 752–756. [Google Scholar] [CrossRef]
  57. Ridao, E.; Conde, J.R.; Mínguez, M.I. Estimating fAPAR from nine vegetation indices for irrigated and nonirrigated faba bean and semileafless pea canopies. Remote Sens. Environ. 1998, 66, 87–100. [Google Scholar] [CrossRef]
  58. Putzenlechner, B.; Marzahn, P.; Sanchez-Azofeifa, A. Accuracy assessment on the number of flux terms needed to estimate in situ fAPAR. Int. J. Appl. Earth Obs. Geoinf. 2020, 88, 102061. [Google Scholar] [CrossRef]
  59. Putzenlechner, B.; Marzahn, P.; Kiese, R.; Ludwig, R.; Sanchez-Azofeifa, A. Assessing the variability and uncertainty of two-flux FAPAR measurements in a conifer-dominated forest. Agric. For. Meteorol. 2019, 264, 149–163. [Google Scholar] [CrossRef]
  60. Wei, S.; Yin, T.; Dissegna, M.A.; Whittle, A.J.; Ow, G.L.F.; Yusof, M.L.M.; Lauret, N.; Gastellu-Etchegorry, J.P. An assessment study of three indirect methods for estimating leaf area density and leaf area index of individual trees. Agric. For. Meteorol. 2020, 292–293, 108101. [Google Scholar] [CrossRef]
Figure 1. (a) Side view of the 3D model of Albizia saman; (b) corresponding zenithal hyperspectral image converted to an RGB image for visual classification; (c) manually classified image; (d) output of the artificial neural network (ANN)-based classifier.
Remotesensing 13 01069 g001
Figure 2. Flowchart of the methodological approach; Cxc=carotenoids content, Cab=chlorophyll content, EWT=equivalent water thickness, LAI=leaf area index, LMA=leaf mass per area, SKYL=ratio of diffuse to direct irradiance, SZA=solar zenith angle, HSI=hyperspectral image, ANN=artificial neural network.
Remotesensing 13 01069 g002
Figure 3. Examples of discrepancies between manual and automatic classification results: nadir HSI (R, G, B channels assigned to 605 nm, 850 nm, and 860 nm, respectively, for visual classification) and the corresponding manual and ANN classifications, together with normalized confusion matrices. The tick labels in the confusion matrices correspond to the categories and the numbers within fields indicate the ratio of manually classified pixels to model outputs within each category for the particular scene containing discrepancies.
Remotesensing 13 01069 g003
Figure 4. Fraction of absorbed photosynthetically active radiation (fAPAR) and fraction of intercepted photosynthetically active radiation (fIPAR) density distribution based on illumination conditions: sunlit/shaded leaves (subfigures a and c), and diffuse ratio (subfigures b and d).
Remotesensing 13 01069 g004
Figure 5. Density biplots of fAPAR (a) and fIPAR (b) of sunlit leaves modelled with grass and concrete backgrounds (pixel-wise data).
Remotesensing 13 01069 g005
Figure 6. The juxtaposition of the fAPAR and fIPAR values at different backgrounds (grass (a,c) and concrete (b,d)) and illumination conditions (sunlit and shaded leaves). The legend represents the density of points.
Remotesensing 13 01069 g006
Figure 7. Sample plots of average fAPAR and fIPAR based on a different background, illumination conditions, and Cab levels.
Remotesensing 13 01069 g007
Figure 8. Relative differences between fAPAR and fIPAR of single trees with grass and concrete backgrounds at different illumination conditions.
Remotesensing 13 01069 g008
Table 1. List of parameters used in PROSPECT-DART simulations.
ParameterRange
Tree SpeciesAdenanthera pavonina L., Khaya senegalensis A.Juss., Tabebuia rosea DC., Albizia saman (Jacq.) Merr, Peltophorum pterocarpum (DC.) K.Heyne, Terminalia catappa L., Bauhinia x blakeana Dunn.,
Schefflera actinophylla (Endl.) Harms, Delonix regia (Boj. ex Hook.) Raf., Syzygium grande (Wight) Walp
Leaf pigmentsChlorophyll, Cab = 10–100 μg/cm2 in 10 μg/cm2 increments
Carpotenoid, Cxc = 0.25Cab μg/cm2
Anthocyanin, Canth = 0 μg/cm2
Brown pigment = 0 μg/cm2
Leaf propertiesEquivalent water thickness, EWT = 0.015 cm
Leaf mass per area, LMA = 0.01 g/cm2
Mesophyll leaf structure parameter, N = 1.9
Leaf Area Index, LAI = 0.0–2.0
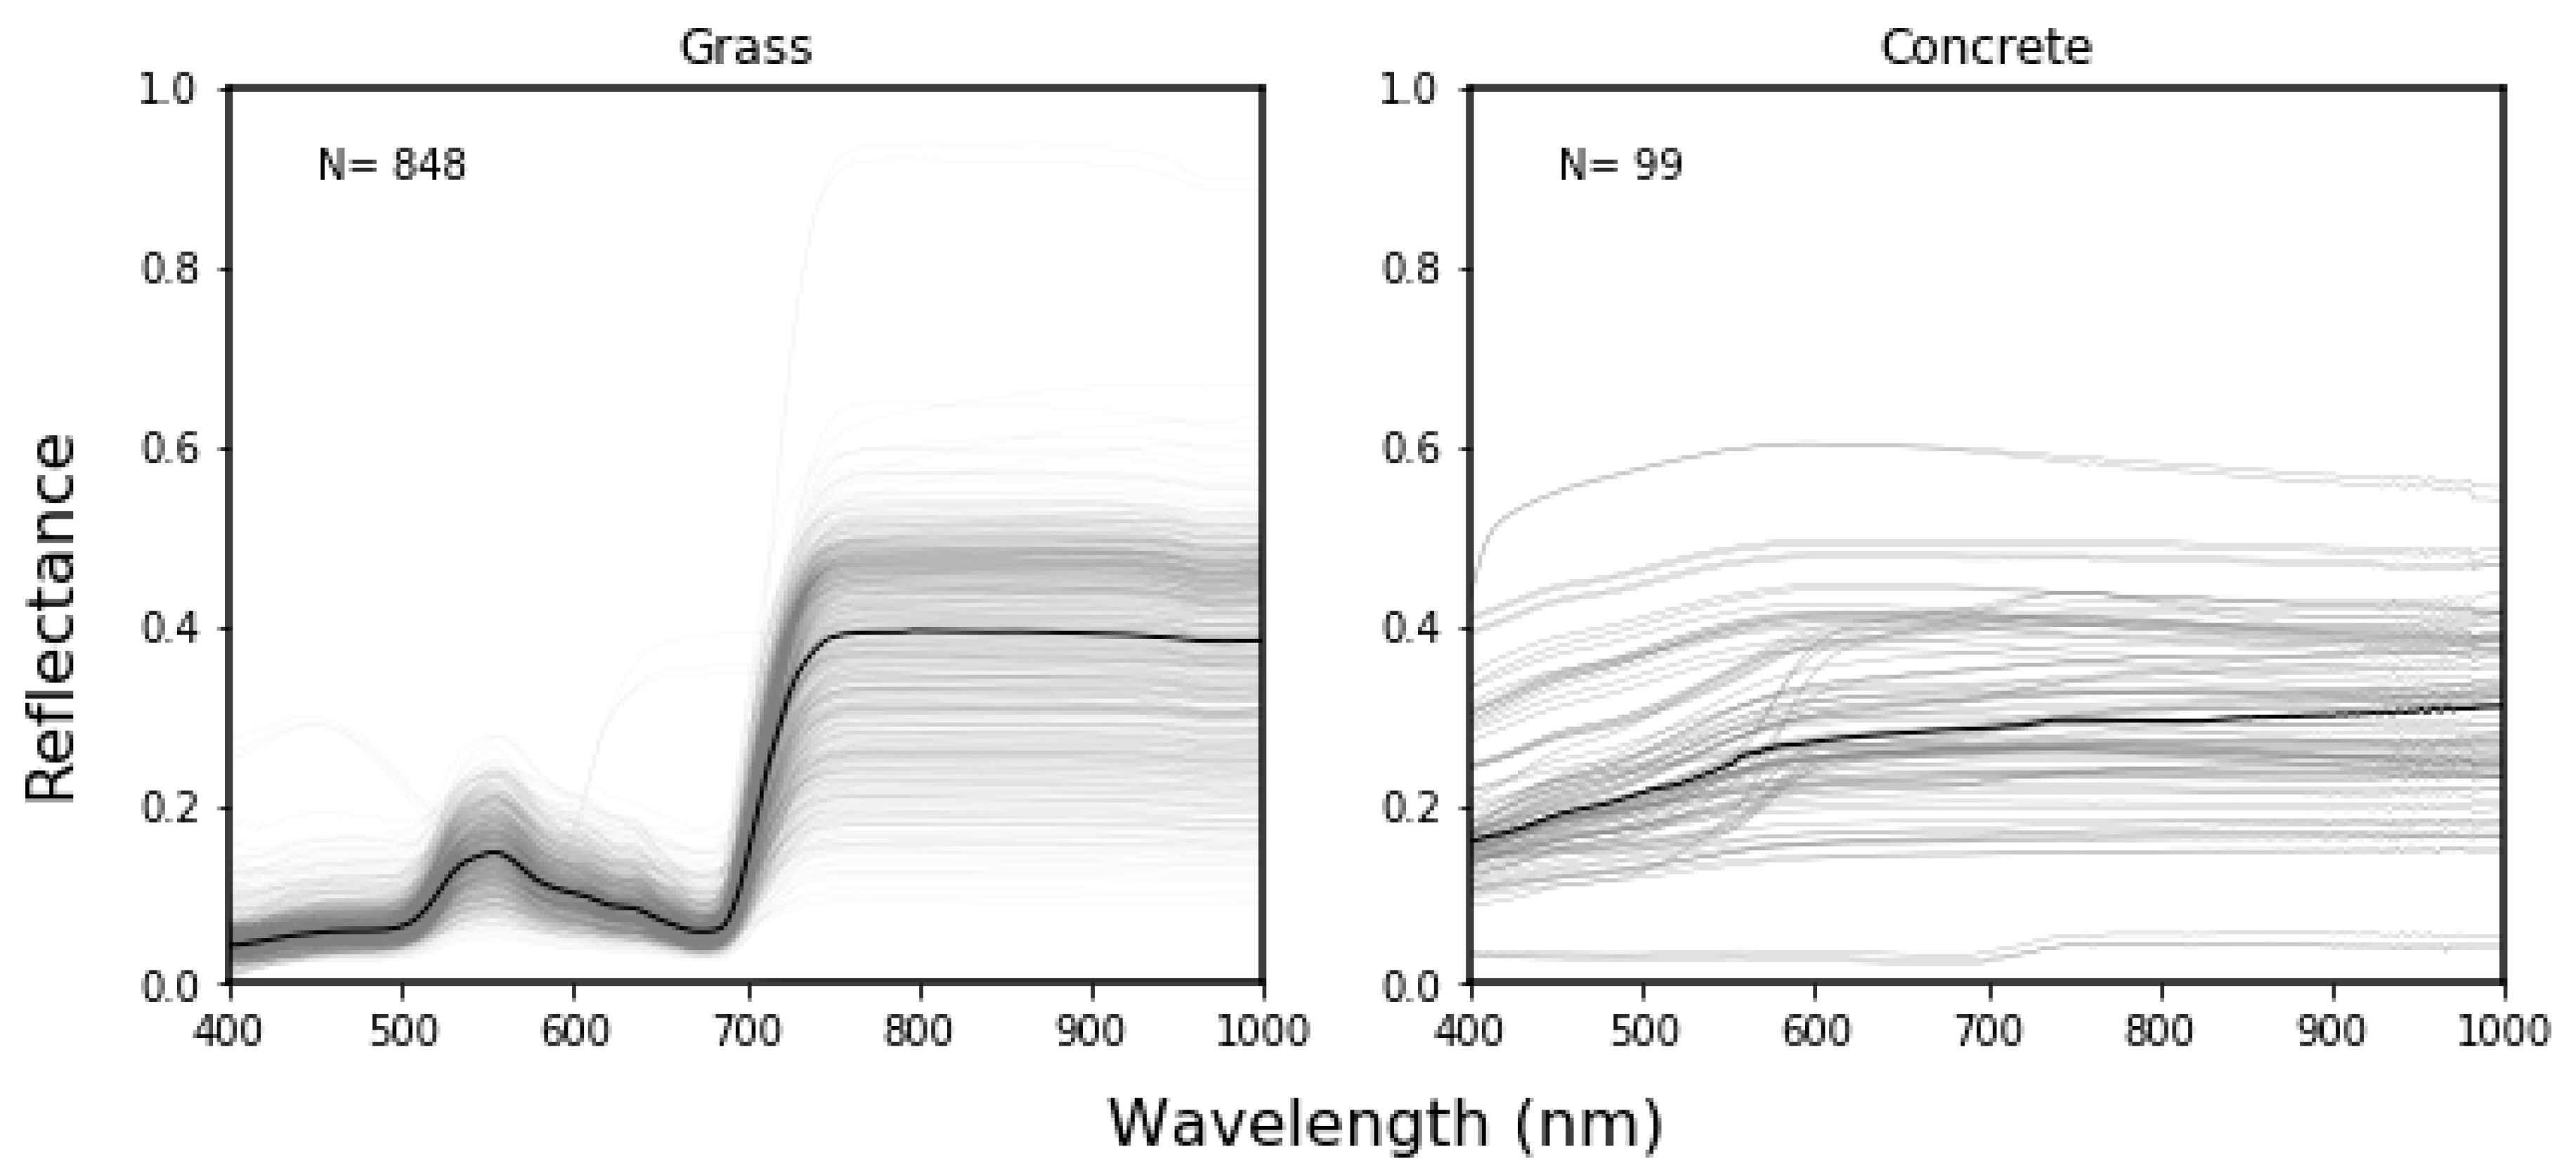
BackgroundGrass, Concrete
IlluminationRatio of direct to diffuse scene irradiance, SKYL = 0%, 20%, 40%, 60%, 80%, 100%
Solar zenith angle, SZA = 0°, 45°
Table 2. Averages of fAPAR and fIPAR depending on the background and illumination conditions.
SKYLGrassConcrete
fAPARfIPARfAPARfIPAR
sunlitshadedsunlitshadedsunlitshadedsunlitshaded
0%0.6720.4340.7770.5020.6820.4480.7890.518
20%0.6080.4040.7000.4660.6260.4240.7220.488
40%0.5750.3980.6640.4590.5950.4180.6870.483
60%0.5580.3970.6440.4590.5760.4160.6660.480
80%0.5420.4020.6270.4640.5610.4200.6490.486
100%0.5160.3960.5960.4580.5340.4130.6150.477
SZAsunlitshadedsunlitshadedsunlitshadedsunlitshaded
0.6200.4370.7170.5050.6360.4500.7350.520
45°0.5370.3740.6200.4320.5560.3970.6410.458
Publisher’s Note: MDPI stays neutral with regard to jurisdictional claims in published maps and institutional affiliations.

