Article

Spectral Unmixing for Thermal Infrared Multi-Spectral Airborne Imagery over Urban Environments: Day and Night Synergy

by
Carlos Granero-Belinchon
*,
Aurelie Michel
,
Veronique Achard
and
Xavier Briottet
ONERA-DOTA, University of Toulouse, FR-31055 Toulouse, France
*
Author to whom correspondence should be addressed.
Remote Sens. 2020, 12(11), 1871; https://doi.org/10.3390/rs12111871
Submission received: 29 April 2020 / Revised: 4 June 2020 / Accepted: 5 June 2020 / Published: 9 June 2020
(This article belongs to the Section Urban Remote Sensing)

Abstract

:
TRUST (Thermal Remote sensing Unmixing for Subpixel Temperature) is a spectral unmixing method developed to provide subpixel abundances and temperatures from radiance images in the thermal domain. By now, this method has been studied in simple study cases, with a low number of endmembers, high spatial resolutions (1 m) and more than 30 spectral bands in the thermal domain. Thus, this article aims to show the applicability of TRUST on a highly challenging study case: the analysis of a heterogeneous urban environment with airborne multispectral (eight thermal bands) images at 8-m resolution. Thus, this study is necessary to generalize the use of TRUST in the analysis of urban thermography. Since TRUST allows linking intrapixel temperatures to specific materials, it appears as a very useful tool to characterize Surface Urban Heat Islands and its dynamics at high spatial resolutions. Moreover, this article presents an improved version of TRUST, called TRUST-DNS (Day and Night Synergy), which takes advantage of daytime and nighttime acquisitions to improve the unmixing performances. In this study, both TRUST and TRUST-DNS were applied on daytime and nighttime airborne thermal images acquired over the center of Madrid during the DESIREX (Dual-use European Security IR Experiment) campaign in 2008. The processed images were obtained with the Aircraft Hyperspectral Scanner (AHS) sensor at 4-m spatial resolution on 4 July. TRUST-DNS appears to be more stable and slightly outperforms TRUST on both day and night images. In addition, TRUST applied on daytime outperforms TRUST on nighttime, illustrating the importance of the temperature contrasts during day for thermal unmixing.

Graphical Abstract

1. Introduction

Global warming influences every region of the world. Its effects have been visible for a long time: ice loss in the poles with a consequent increase of the sea level, extreme meteorological events with an increase in rainfalls, more frequent droughts, increase in the frequency and intensity of heat waves [1], etc. For example, in the center and the south of Europe, heat waves, forest fires, and droughts appear more frequently than in the past. Furthermore, the European urban regions, where 80% of Europeans live, are exposed to extremely strong heat waves which occur more and more frequently [1]. In addition, it has been well documented that urban environments suffer sharper increases of their temperatures than rural areas [2]. This is known as Urban Heat Island (UHI) effect [2]. Multiple agents causing UHI have been detected: human activity, population growth, land cover modification, and, of course, global warming [2]. Moreover, UHI leads to air pollution increases, population health issues, and alterations in the energy consumption needs. For instance, during the summer of 2019, the heat waves in France reached up to 45 C, corresponding to 4.5 C higher than the heat waves of 2003, which have been estimated to have killed around 70,000 people in Europe [3]. Solutions to stop this increase of heat wave frequencies and intensities are required. For the solutions to be adapted to deal with the problem, a good understanding of the sources, causes, and dynamics of urban warming is necessary.
Traditionally, UHI makes reference to the air temperature difference between rural and urban areas [4]. However, air temperature data are not able to continuously cover large urban extents [5,6]. On the other hand, aerial remote sensing, covering large areas that may include both urban and rural environments, allows studying the Surface Urban Heat Island (SUHI) effect, defined as the Land Surface Temperature (LST) difference between urban and rural areas [7]. Although SUHI is dominated by different physics than UHI, both have been shown to be correlated, especially during night [7,8]. However, even if airborne remote sensing provides high spatial resolution images (a few meters), higher resolutions are sometimes needed to analyze the correlation between LST and urban materials, allowing to identify sources and wells of SUHI. Thermal unmixing methods [9,10,11] provide intrapixel abundance and temperature maps, for a given number of scene materials (previously defined) and from a given thermal radiance image. These methods can be effective to analyze the link between LST and materials (or endmembers), and then to identify which materials lead to the development of SUHI. Thus, they allow studying how the temperature of different materials varies according to their sun exposure, their location, or the time of day (if several images at different acquisition times are available), among other factors [9,10,11].
Initially, reflective-thermal approaches were developed [9]. These methodologies were based on two steps: (1) the estimation of intrapixel material abundances by using radiances from the reflective domain together with classical reflective unmixing methods [9,12]; and (2) the estimation of intrapixel temperatures by using thermal radiances and these previously obtained intrapixel abundances. However, the need of bands in the reflective domain avoids nighttime application, when SUHI and UHI are more correlated, but also when reflective radiances are not available. In addition, to perform future high spatial resolution studies in cities, Unmanned Aerial Vehicles (UAVs) appear as ideal [13], and having only thermal bands allows reducing UAV mission costs. Currently, different thermal unmixing approaches using only Thermal InfraRed (TIR) bands exist. Thus, among the first developed methodologies, the Temperature and Emissivity Separation using Spectral Mixture Analysis (TESSMA) supposes homogeneous intrapixel temperatures [14] and is hence not perfectly adapted to thermal unmixing [15]. On the other hand, classical spectral unmixing methods, such as Fully Constrained Linear Square Unmixing (FCLSU) [12], can be applied on the thermal domain by considering that the couple of temperature and emissivity spectrum defines a given material [16]. However, this approach considers the temperature of a given material to be constant across the image. Another option is the emissivity-based unmixing method, which is based on the application of classical spectral linear unmixing methods to the emissivity spectra to obtain the intrapixel abundances, and then estimating the intrapixel temperatures by considering the black body law of a composed flat surface [
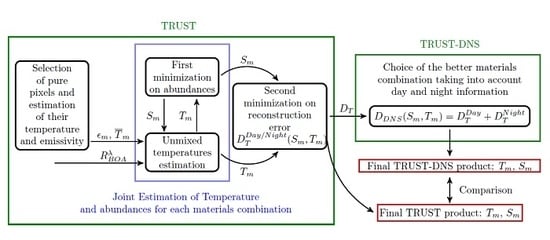
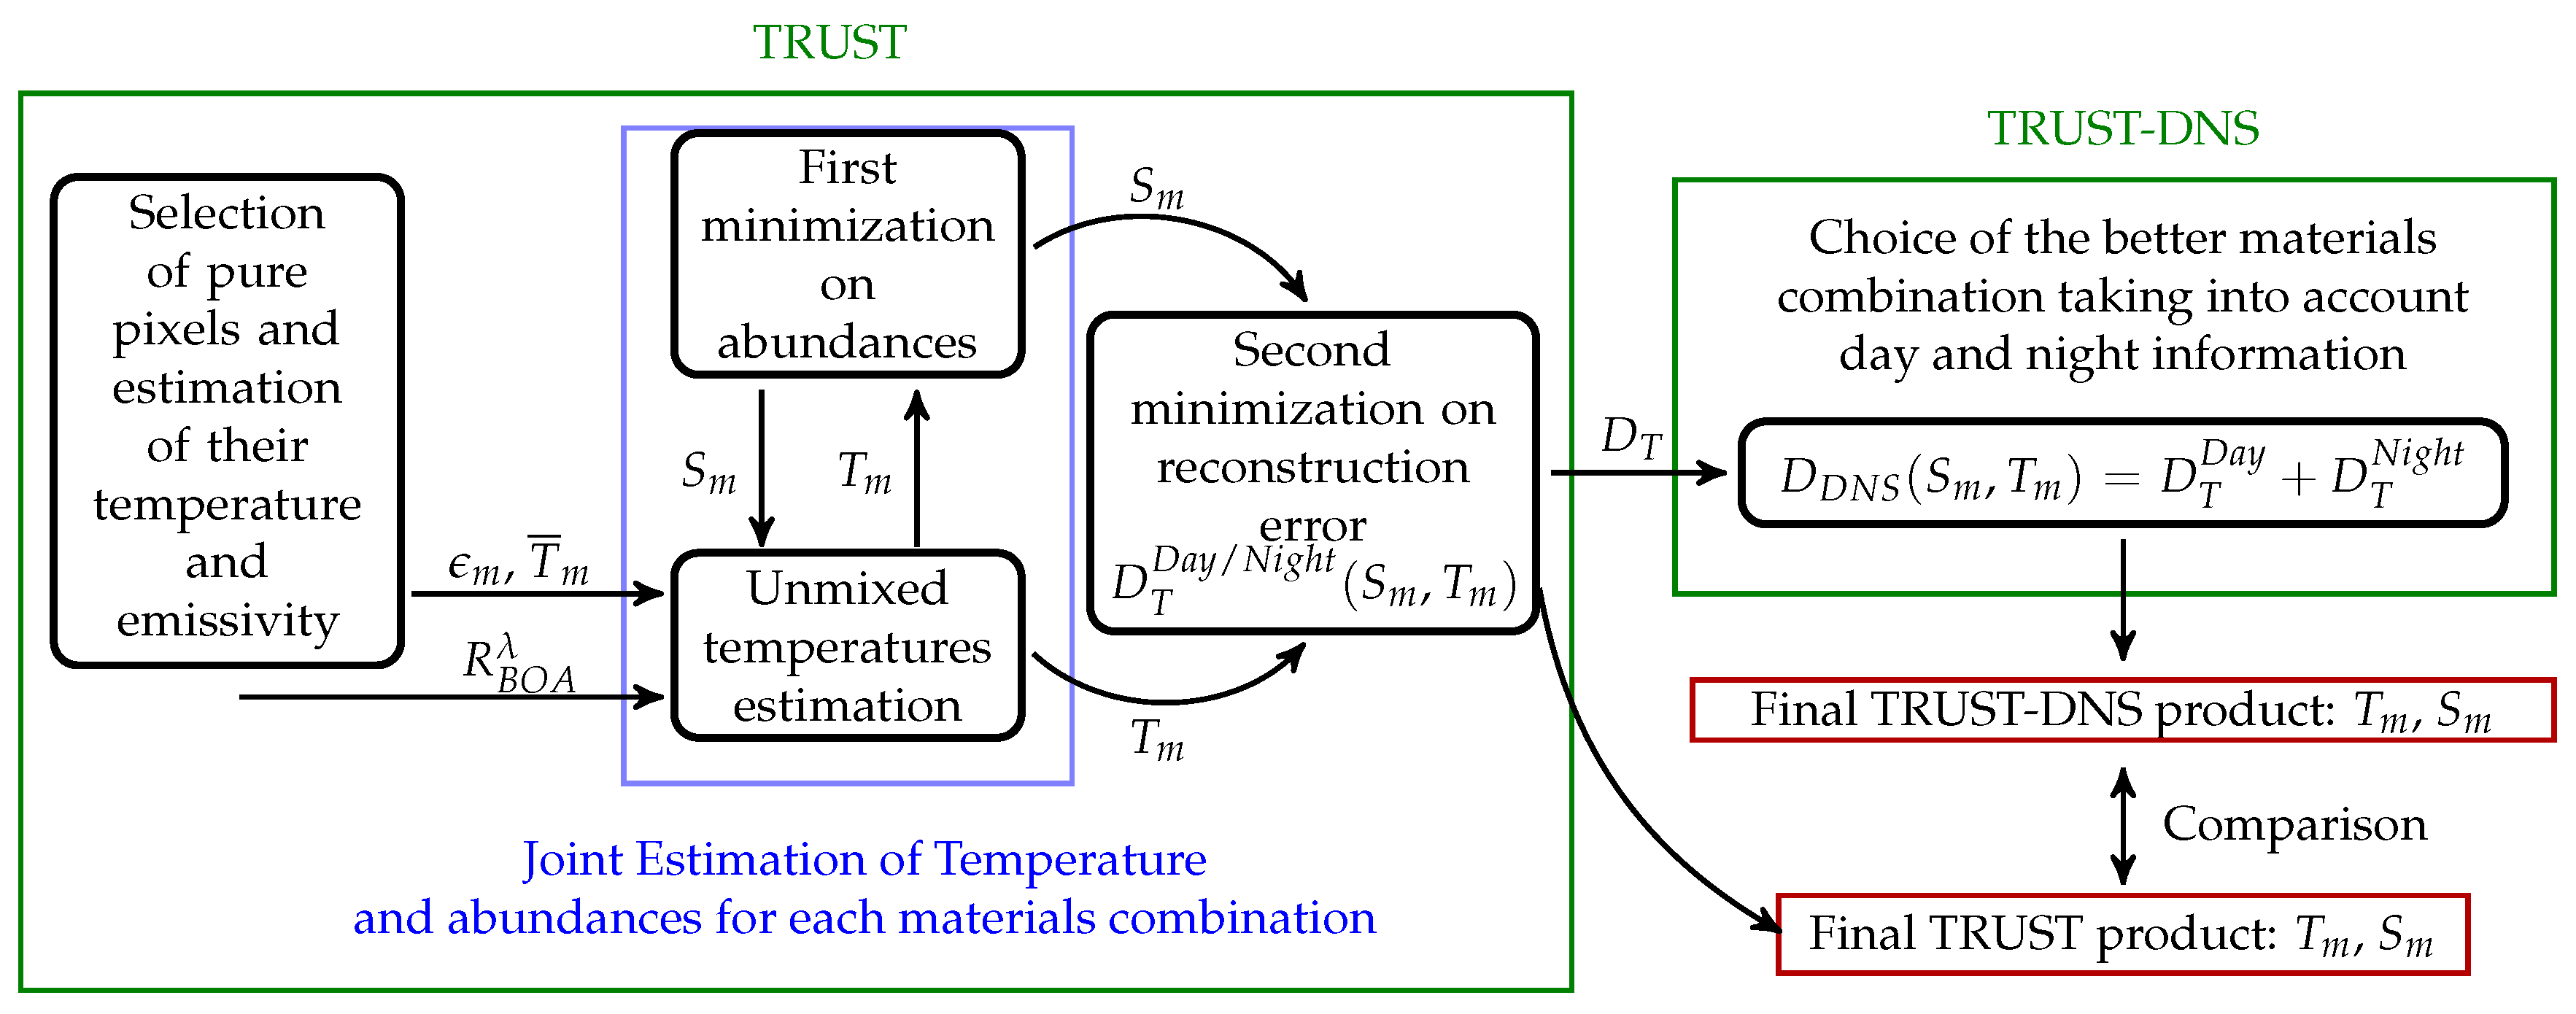
10]. The main issue of this method is that it does not consider material temperature differences when estimating the abundances, and thus it lacks a principal source of TIR information during unmixing. Finally, among the most advanced methods, Thermal Remote sensing Unmixing for Subpixel Temperature (TRUST) allows jointly estimating the intrapixel abundances and temperatures by minimizing the radiance reconstructed error [11]. This method also allows intrapixel temperature variations and variations in the material temperatures across the image. The better performances of TRUST over other thermal unmixing methods have been already shown when it is applied on hyperspectral imagery with more than 30 thermal bands and at high spatial resolutions of about 1 m over simple scenarios such as roofs composed of three materials [11,16].
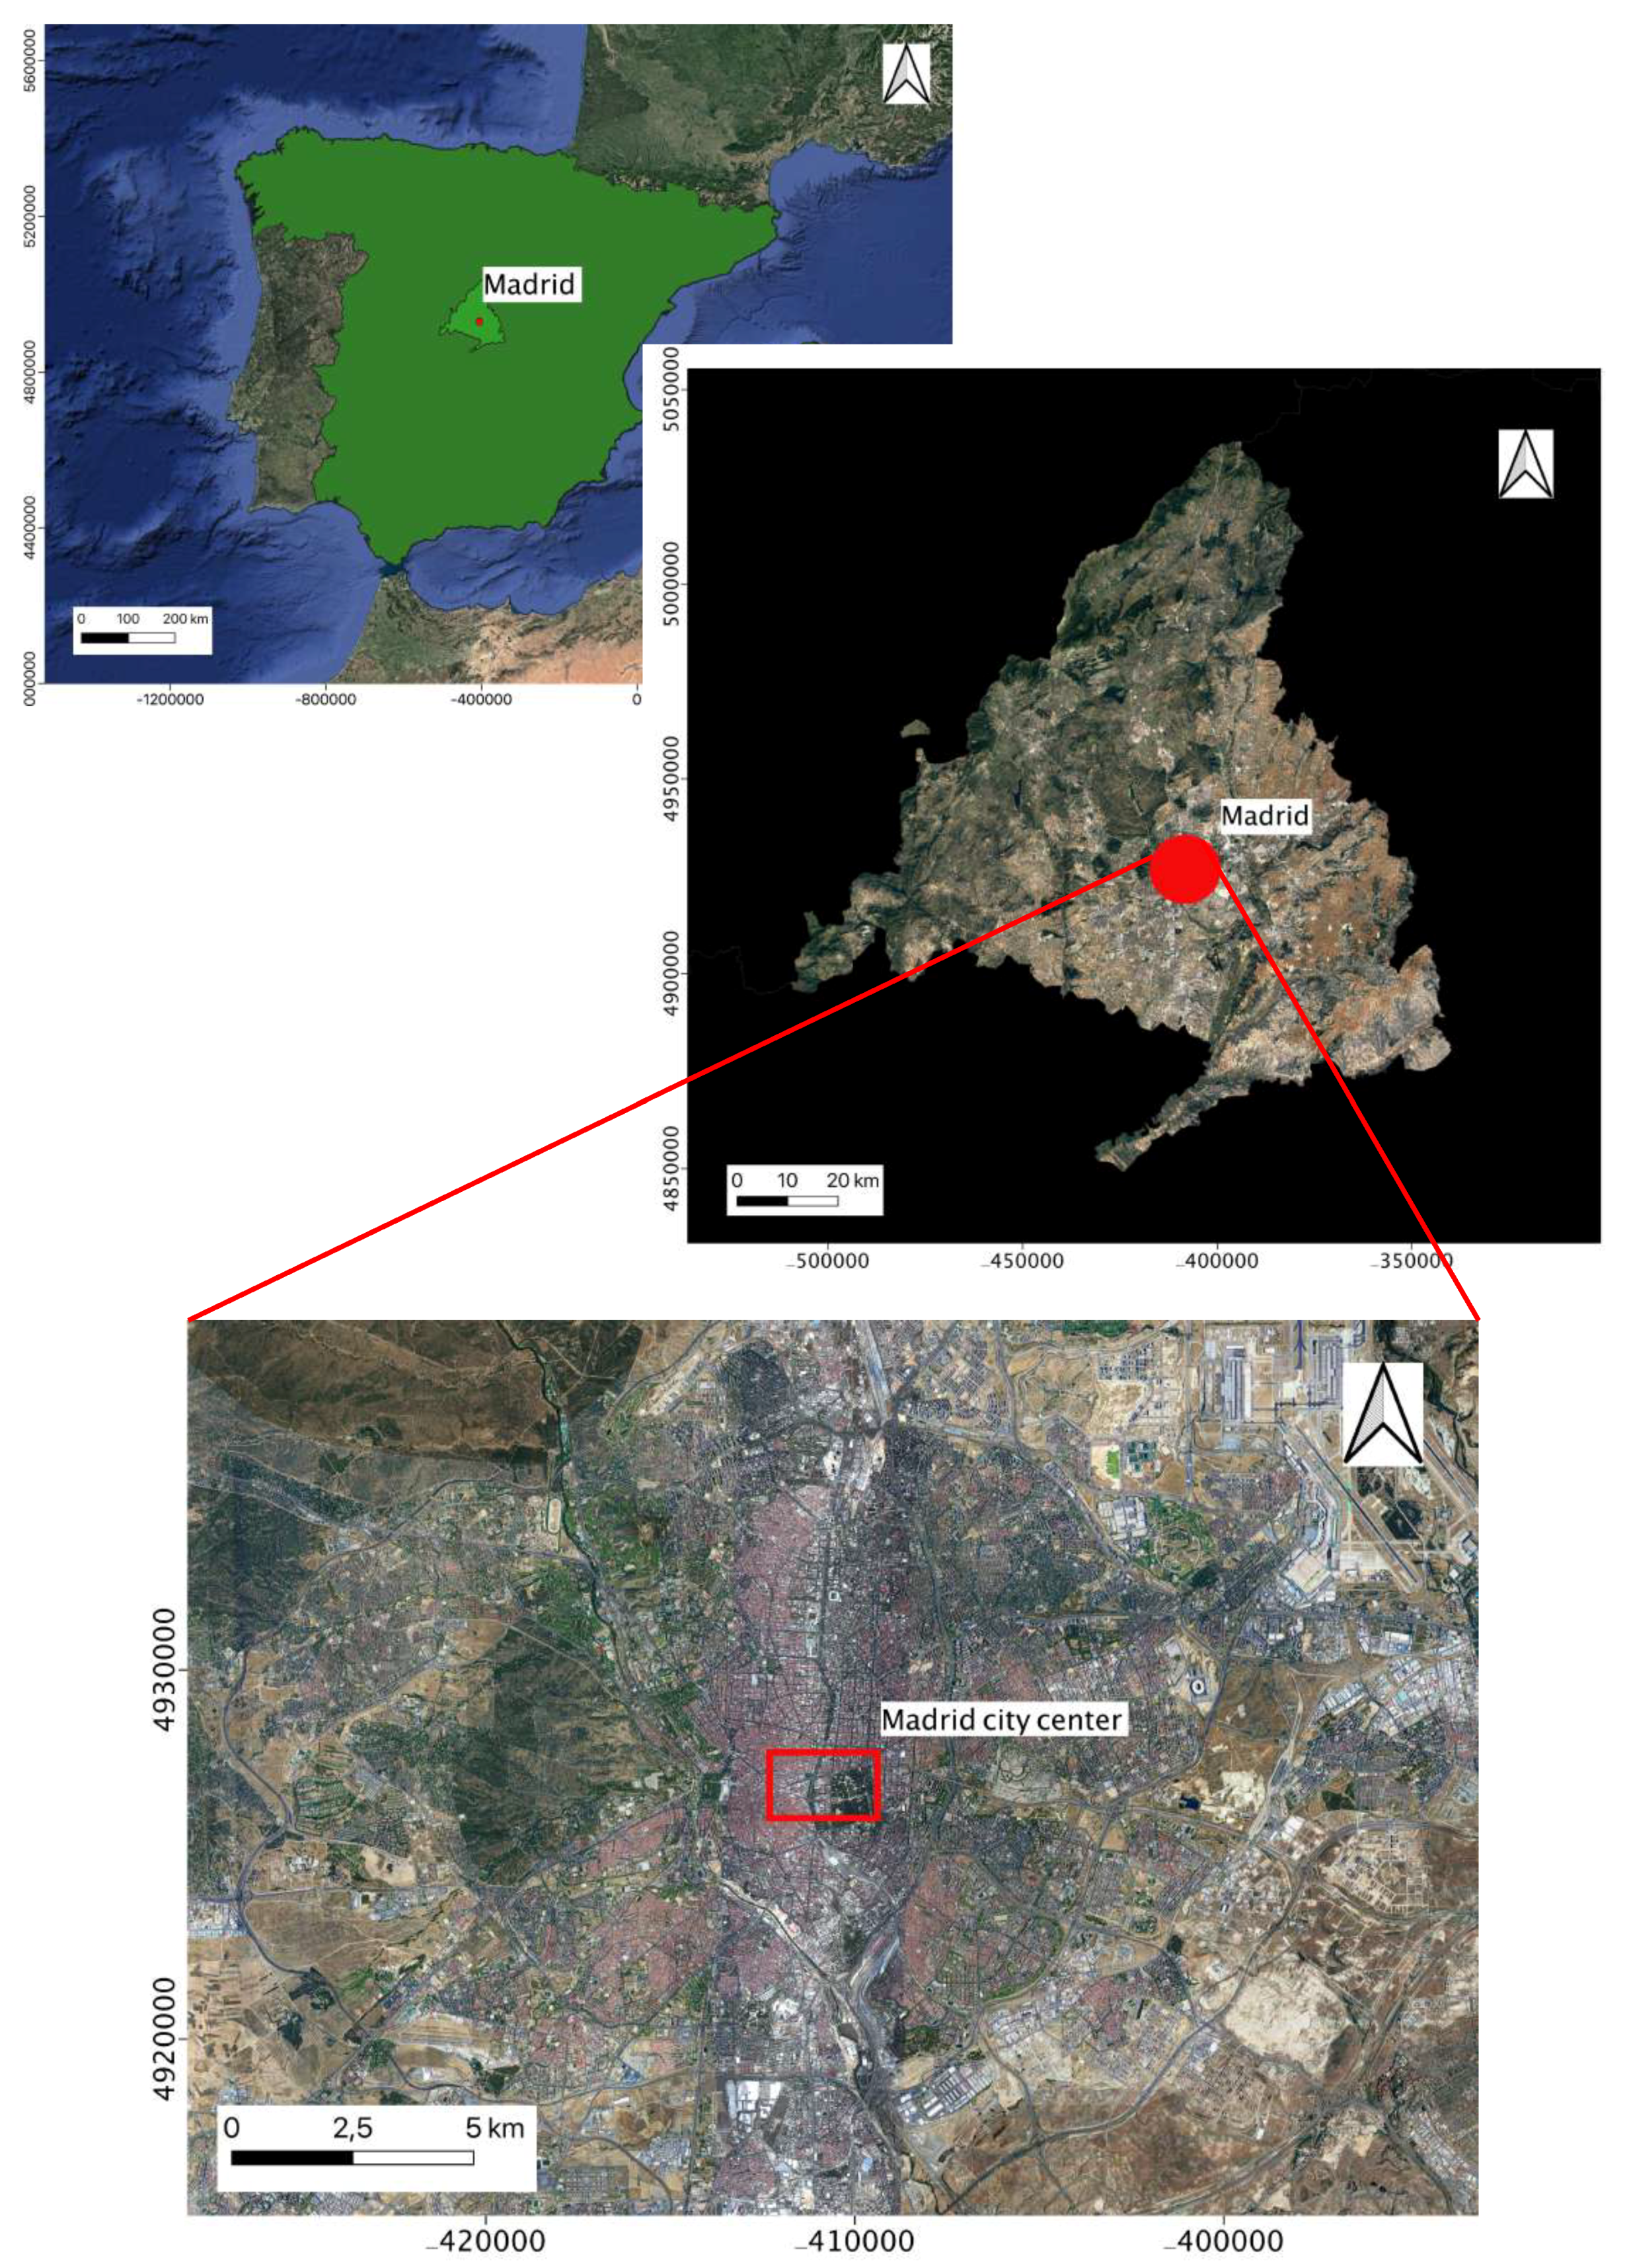
This work aims at illustrating the applicability of TRUST on multispectral (eight bands and 8-m resolution) images of a highly heterogenous urban environment. With this purpose, Airborne Hyperspectral Scanner (AHS) imagery from Madrid city center acquired during the DESIREX 2008 campaign [7] is used. Thus, for the first time, this article shows the relatively high performance of TRUST on an extremely challenging case where the spatial resolution and the number of bands are degraded, and where the studied scene is highly heterogeneous. In addition, TRUST performance is studied on both daytime and nighttime images of Madrid city center. Due to all these advances, many new applications can be imagined for TRUST. Finally, a new method, called TRUST Day and Night Synergy (TRUST-DNS), based on TRUST, is developed to take advantage of the combination of daytime and nighttime images. This work shows that TRUST-DNS outperforms TRUST, thus illustrating the advantage of multitemporal data fusion for unmixing enhancement.
This article is structured into six sections. In Section 2, the DESIREX data used in this study are described. Then, in Section 3, TRUST and its improved version TRUST-DNS are presented. In Section 4, first, the pure material emissivity spectra and temperatures are defined; second, a calibration of TRUST and TRUST-DNS is performed before applying these methods on Madrid city center AHS images; and, third, the abundances and temperature retrieval performances of TRUST-DNS and TRUST on day and night images are compared. These results are discussed in Section 5. Finally, Section 6 presents some conclusions and perspectives.

2. DESIREX 2008 Dataset

2.1. Data Description

During the DESIREX 2008 experiment campaign over the city of Madrid, airborne hyperspectral scanner (AHS) data were acquired with a 4-m spatial resolution over 80 spectral channels (0.443–13.4 μ m) at several dates from 25 June to 4 July (summer) [7,8,17] (see Figure 1 and Figure 2). From these 80 spectral channels, 10 are in the thermal domain (8.2–13.4 μ m) (see Table 1). Together with these airborne hyperspectral images, atmospheric characterizations were performed every day. On the one hand, temperature profiles from ground level to 25 km altitude and atmospheric water vapor content were measured with soundings several times a day at three different locations. On the other hand, relative humidity and air temperature evolution were measured in six fixed masts located in rural, urban-medium, and urban-dense spots. These atmospheric characterizations are used to correct the aircraft images from atmospheric effects.
In addition, spectral reflectivity and emissivity of 12 urban surfaces were also measured during this campaign. These measures were used to perform a supervised land cover classification on the daytime aircraft image from 4 July, where the maximum likelihood was used as a decision rule and 13 different training classes were defined (12 materials, see Table 2, plus shadows). The classification was performed using at-sensor radiance measures from the 80 spectral bands of the AHS sensor at 4 m resolution [18]. The global classification accuracy is characterized by a Kappa coefficient of 0.7 [18] and the classes’ accuracies as defined by Fawcett [19] are shown in Table 2. However, even if in urban environments 4-m pixels are frequently composed of several materials, no mixed pixel class was considered in this classification. In this study, we focused on two images acquired during 4 July, one daytime (11:32) and one nighttime (22:14). A complete description of the dataset can be found in the DESIREX 2008 final report [7].
Finally, due to water absorption bands above 12 μ m [20], AHS bands 79 and 80 were not considered. In addition, the emissivity spectra of many materials exhibit similar signatures at these wavelengths, rendering bands 79 and 80 not adapted for material discrimination. Although Oltra-Carrió [20] suggested to not use band 71 because of water absorption band below 8 μ m, due to the low performances when applying the method without band 71, it was kept in this study. The importance of band 71 when discriminating emissivity spectra of different materials is explained by the stronger signatures of these spectra at 8 μ m.

2.2. Scene Description

Figure 3a,b shows, respectively, the zoomed RGB image of the studied area (day radiance image on 4 July) and the corresponding classification map, both at 4-m resolution. The scene contains a part of the “Retiro” park, mainly composed of vegetation and water (artificial lake), and the very heterogeneous urban fabric located at the northwest of the park. In addition, some bare soil areas, a building with a “roof made of red bricks” and the lake docks are found in the park; a very particular building with a concrete roof is at the west of the park and a water fountain (“Cibeles”) can be found in the west end of the image (see Figure 2). In the scene, six classes of impervious materials are found and classified as: “roads made of asphalt”, “other roads”, “roofs made of red bricks”, “roofs made of asphalt”, “roofs made of concrete”, and “roofs made of metal”. In addition, two types of vegetation appear in the “Retiro” park, and also two types of water are discriminated (“lakes” and “swimming pools”). Since no mixed pixel class was allowed in the DESIREX classification, it is expected to have mixed pixels considered as pure ones, even at 4-m resolution.
In the following, for the TRUST unmixing, we considered only one type of “vegetation” and one type of “water” since the emissivity spectra of both couples of vegetation and water are indistinguishable. Furthermore, since TES does not provide good descriptions of metallic surface temperatures and emissivities, only five impervious materials were considered: “roads made of asphalt”, “roofs made of asphalt”, “other roads”, “roofs made of concrete”, and “roofs made of red bricks”. However, while pixels initially classified within the two water and the two vegetation classes are now merged in only one “water” and one “vegetation” classes, pixels classified as “roofs made of metal” maintain their status in the classification but they are not considered when TRUST performances are analyzed. Then, in the studied area, seven materials were considered.
Thus, this Madrid city center scene was used to illustrate the application of the presented methodology along the article. To this end, both the classification and the radiance images were undersampled to 8-m resolution in order to have a reference at 4 m (see Figure 3c,d). For this 8-m radiance image, each pixel was the averaged radiance of four 4-m pixels. On the other hand, in the 8-m classification, a pixel was considered to belong to a class if the four 4-m pixels contained inside belong to the same class. On the contrary, if at least one of these 4-m pixels was different from the 4-m pixel set, the 8-m pixel belongs to a new class, named “mixed”.

3. Methodology

The proposed methodology, called TRUST-DNS, is an improvement of TRUST [11], that takes advantage of day–night synergy (see Figure 4). This section explains the different steps of TRUST-DNS in analogy with the work of Cubero-Castan et al. [11] for TRUST and indicates the main differences between TRUST and TRUST-DNS.

3.1. Radiative Transfer Equations

Considering a thermal image with N spectral bands, the Bottom of Atmosphere (BOA) radiance of a given pixel at a given wavelength λ is:
R B O A , m e a s λ = R s e n s λ R a t m , λ τ a t m , λ
where R s e n s λ is the at sensor level measured radiance, R a t m , λ is the atmospheric upwelling radiance, and τ a t m , λ is the upwelling transmittance. Both atmospheric parameters were obtained using COMANCHE code [21], which is based on MODTRAN 5. In this study, to complete the DESIREX atmospheric description [7], the MODTRAN urban aerosols model was used with a visibility of 23 km, as indicated in the DESIREX technical report for those days.
On the other hand, for a flat-ground-scene, the resulting BOA radiance for a mixed pixel can be expressed as a linear mixture of radiances:
R B O A λ = i = 1 M ϵ i λ · B λ ( T ¯ i ) + ( 1 ϵ i λ ) · R a t m , λ S i
where M is the number of materials composing the pixel, ϵ i λ is the emissivity of material i at wavelength λ , T ¯ i is the mean temperature of material i in the pixel, B λ ( T ) is the Planck law at temperature T, R a t m , λ is the atmospheric downwelling radiance, and S i is the abundance of material i in the pixel. The abundance of material i in a pixel is defined as the fraction of the pixel covered by i. Thus, for any pixel, the sum of the abundances of the materials composing it is normalized to one:
i = 1 M S i = 1

3.2. Selection of Pure Pixels and Estimation of Their Temperature and Emissivity

Pure pixels are manually selected using the classification map at 4-m resolution (see Figure 2). From homogeneous areas on the classification map, five pixels far enough from the borders are selected to represent each pure material or endmember. Avoiding pixels from the borders of the homogeneous areas allows reducing errors due to misregistration between the classification map and the AHS (day and night) images. Each DESIREX image is georeferenced with an accuracy better than one pixel (<4 m). Then, they are coregistered with Gefolki, whose registration accuracy is better than 0.1 pixels [22]. In addition, using pixels far from the borders of the homogeneous areas allows reducing errors due to classification accuracy (at these resolutions, interfaces between homogeneous areas are considered to be mixed, even if the classification ignores this possibility).
The Thermal and Emissivity Separation (TES) method [11,23] is used on each pure pixel to obtain its temperature and emissivity. TES needs atmospheric correction but, contrary to other methodologies such as Split-Window or Mono-Window methods, it allows estimating both the temperature and emissivity of the pixel. TES is based on a three-step approach: Normalized Emissivity Method (NEM), Ratio, and Maximum and Minimum Difference (MMD) [23]. On the DESIREX 2008 campaign data, the TES root mean square errors (RMSE) were estimated to be 1.7 K for the LST and 3% for the emissivity retrieval [7,20].
The mean temperature T i ¯ and emissivity ϵ i λ of each endmember are then defined as the mean of the temperatures and emissivities measured on the five pixels identifying each material. Hence, this choice is extremely important since, even if the five selected pixels characterizing a material are pure, 3D structures and shadows (abundant in cities) can alter the obtained temperatures and spectra. Thus, the pure pixel selection should be considered as strongly influencing the methodology performances.

3.3. Joint Estimation of Temperatures and Abundances

Once each endmember is characterized by its emissivity and its mean LST (obtained from TES on pure pixels), and, given a mixed pixel made of M endmembers, TRUST allows the joint estimation of pixel temperatures and abundances from an iterative process (endmember emissivities are considered to be well defined from pure pixels and to remain constant across the image). TRUST has been already tested with a maximal value of M = 2 and M = 3 , i.e., allowing combinations of until two and three materials per pixel [16]. Thus, Cubero-Castan (2014) showed that TRUST performances are higher allowing sets of until two materials per pixel ( M = 2 ) [16].
Then, the iterative process starts by estimating the abundances for any possible set of materials with the minimization of the reconstruction error of the BOA radiance:
D ( S ) = 1 N λ = 1 N R B O A , m e a s λ R B O A λ ( S , T ) 2
where S are the abundances of the set of materials composing the mixed pixel and T = T ¯ + Δ T are the temperatures of the materials in the pixel defined as the mean temperature of the materials plus Δ T , whose estimation depends on S . In the first iteration, that provides an initial estimation of the abundances, Δ T = 0 .
Then, once the abundance S i of each material within the pixel is known, only one hypothesis is required to estimate the temperatures in the mixed pixel: the temperature of every material composing the pixel is close to the corresponding mean temperature of the material. For this hypothesis to be correct, it is preferable to work on small images, since the material temperatures can strongly vary between far locations. Thus, this hypothesis allows linearizing the black body law B λ ( T i ) around the mean temperature T i ¯ . Then, following the first-order Taylor series approximation of Equation (2), the centered radiance is:
Δ R λ 1 Δ R λ N = A λ 1 T 1 ¯ A λ 1 T M ¯ A λ N T 1 ¯ A λ N T M ¯ Δ T 1 Δ T M Δ R = A · Δ T
with the centered radiance Δ R λ j = R B O A λ j ( T i ) R B O A λ j ( T i ¯ ) , Δ T i = T i T i ¯ and A λ j T i ¯ = ϵ i · S i · B λ j ( T ) T | T i ¯ . The number of bands N defines the number of equations and the number of materials per pixel M defines the number of unknowns. Thus, for the system of equations to be determined, N should be greater or equal than M.
Finally, the linear unbiased estimator minimizing the variance of the estimation is [24]:
Δ T = ( A t · C 1 · A ) 1 · A t · C 1 · Δ R
where C is the noise covariance matrix.
Once Δ T is estimated, Equation (4) is newly minimized with T = T ¯ + Δ T to find S . Thus, for each possible combination of pure materials composing the mixed pixel, this iterative process aims at estimating the abundances and temperatures minimizing Equation (4).
A second minimization is needed to distinguish which combination of materials (among the tested sets) composes the mixed pixel. With this purpose, a new cost function is introduced:
D T ( S ) = D ( S ) + γ 1 M · i = 1 M ( Δ T i ) 2
where γ is a hyperparameter weighting the significance of Δ T in the minimization. The choice of γ is very important since small values will give more significance to emissivity differences and for high values the methodology will look mainly for material combinations with Δ T 0 .
Thus, TRUST selects the set of materials minimizing D T ( S ) with the optimal temperatures and abundances minimizing D ( S ) as the one composing the mixed pixel.

3.4. Day and Night Synergy: TRUST-DNS

To take advantage of possible synergies between day and night images, the above TRUST methodology has been slightly modified. TRUST is applied separately on day and night images with normalized cost functions:
D j ( S ) = 1 N λ = 1 N R B O A , m e a s λ R B O A λ ( S , T ) R B O A , m e a s λ 2 with j Day or Night
D T j ( S ) = D j ( S ) + γ 1 M · i = 1 M ( Δ T i T i ¯ ) 2 with j Day or Night
where D D a y and D N i g h t are estimated for each pixel with the same combinations of materials. Finally, the set of materials composing the mixed pixel is defined as the one minimizing:
D D N S = D T D a y ( S ) + D T N i g h t ( S )
The normalization of the cost functions is needed to give the same weight to the information coming from day and night images independently of their radiance and temperature absolute values. Abundances and temperatures are allowed to vary between day and night for the same mixed pixel. This is expected for temperatures but not for abundances, which would be supposed to remain constant. However, due to possible registration errors and viewing angle discrepancies, we decided to not impose the same abundances on the day and night mixed pixels.

3.5. Evaluation Criteria

The performances of TRUST-DNS for retrieving abundances in a given scene were evaluated differently for the mixed ( δ S m i x e d ) and pure ( δ S p u r e ) pixels composing the scene [16]. In both cases, the abundance errors represent an averaged misclassified pixel fraction, where 0 and 1 are, respectively, the best and worst possible performances. Thus, for pure pixels, the abundance error of material m was evaluated on pixels where S m = 1 by looking at the unmixed value of S m . On the other hand, for mixed pixels composed of a combination of materials, the abundance of materials which are not within this combination must be S i = 0 , and then the abundance error was estimated by looking at the unmixed values S i of materials which are not in the combination. For temperature retrieval performances ( δ T ), mixed and pure pixels were not discriminated. The temperature retrieval error is the temperature difference between the unmixed LST and the reference one and is measured in Kelvin.
δ S p u r e = m k p u r e m ( S k , m S ^ k , m ) 2 N
δ S m i x e d = m k m i x e d w i t h o u t m ( S ^ k , m ) 2 N
δ T = k T k ( m S ^ k , m ( T ^ k , m ) 4 ) 1 / 4 2 N
where k sums over the pixels and m over the materials in each pixel, and N is the total number of pixels taken into account. S ^ ( T ^ ) indicates the estimated unmixed abundance (temperature), while S (T) indicates the reference abundance (temperature). For abundances, the used reference is the classification at 4 m from which a reference abundance map at 8 m is generated. The ratio between the classification and the abundance map resolutions (4 and 8 m, respectively) leads to limitations in the abundance retrieval performances study since the reference map only presents very discretized abundances (0%, 25%, 50%, 75%, and 100%). For temperatures, the reference is the TES measured temperature at 8 m.

4. Results

This section compares the performances of TRUST-DNS and TRUST applied separately on day and night images of 4 July when estimating abundances and temperatures over a heterogeneous urban scene. The chosen urban scene, Madrid city center, is considered to be mainly composed of seven materials. The mean temperatures ( T m ¯ ) and emissivities ( ϵ m ) of each of these materials are defined as the mean of the temperatures and emissivities obtained on five manually chosen pixels (see Figure 2). For the unmixing, each pixel in the scene is considered to be composed of no more than two materials. This choice allows reducing computation time as well as the errors in unmixing [16]. Since TRUST has been shown to outperform other thermal unmixing techniques [11,16], this study focused on comparisons between TRUST applied on day and night images and TRUST-DNS.

4.1. Characterization of Endmembers

Figure 5a,b shows the endmembers emissivities obtained with TES on day and night images, respectively. Every spectrum presents emissivity values between 0.86 and 0.98. Moreover, for any pure material, differences are found between day and night emissivity spectra. Thus, day emissivities tend to higher values than night ones mainly at lower wavelengths (<9.700 μ m). These differences are at most of 2% of emissivity.
Table 3 shows the endmember mean temperatures for day and night. As expected, day temperatures are higher, and more important contrasts between day and night temperatures are found for impervious materials such as “roofs made of asphalt”, “roads made of asphalt”, “roofs made of concrete” and “roofs made of red bricks” than for natural materials such as “water” or “vegetation”. The obtained temperatures are within the expected range for sun exposed materials during summer with day temperatures between 25 C and 50 C and night temperatures between 18 C and 25 C.

4.2. Study on the Choice of γ

As explained in Section 3.3, two terms are minimized in TRUST (TRUST-DNS). In the second one, the γ hyperparameter, which weighs the importance of the temperature difference ( Δ T ) in the minimization, is introduced. To find the best value for γ , a previous study should be performed. Based on [16] a set of γ values, from γ = 10 4 to γ = 1 , was tested for TRUST applied on the day and night images separately and for TRUST-DNS. The analysis of unmixing performances in function of γ was based on abundance errors from Equations (11) and (12), which measure the pixel fraction difference between the classification and the unmixing results, and temperature error from Equation (13), which measures the temperature difference in K between the unmixed temperature map and the TES temperatures at 8-m resolution (see Figure 6). In every case, abundance errors for pure pixels obtained with Equation (11) are between 0.4 and 0.8 and their minimal values are smaller for TRUST-DNS. Mixed pixel errors obtained with Equation (12) are around 0.2 and 0.3 and their minimal values are similar for TRUST and TRUST-DNS. Moreover, TRUST-DNS appears less influenced by the choice of γ . On the other hand, temperature errors are around 0.3 and 0.6 K with similar minimal values for TRUST and TRUST-DNS on day but better performances of TRUST-DNS on night. Newly, as for abundance errors, TRUST-DNS temperature errors are less influenced by the choice of γ . The choice of the best γ is done separately for the different studied cases. While for TRUST on the day image, γ = 0.01 ( log ( γ ) = 4.6 ) minimizes the errors, for TRUST on night, the best choice is γ = 0.005 ( log ( γ ) = 5.3 ), and, for TRUST-DNS, γ = 0.5 ( log ( γ ) = 0.69 ) is chosen for both day and night images. In the following sections, only results with these γ values are shown. Then, for TRUST on the day image, δ S m i x e d = 0.25 and δ S p u r e = 0.48 of the pixel fraction, while δ T = 0.39 K. For TRUST on the night image, δ S m i x e d = 0.24 and δ S p u r e = 0.48 of the pixel fraction and δ T = 0.33 K. Finally, for TRUST-DNS on both day and night image δ S m i x e d = 0.24 and δ S p u r e = 0.43 of the pixel fraction while for daytime δ T = 0.40 K and for nighttime δ T = 0.29 K.

4.3. Abundances Retrieval

Figure 7, Figure 8, Figure 9 and Figure 10 show the abundances retrieved for each material together with the DESIREX classification at 8 m. Figure 7 shows the abundances retrieved with TRUST on the day image, Figure 8 with TRUST on the night image, Figure 9 with TRUST-DNS on the day image, and Figure 10 with TRUST-DNS on night.
Thus, TRUST on day image (Figure 7) presents root mean square errors of δ S m i x e d = 0.25 and δ S p u r e = 0.48 pixel fraction for mixed and pure pixels, respectively. It allows recovering some pure regions of “water” pixels as well as pure regions of “vegetation”, “roads with asphalt”, “other roads”, and “roofs made of red bricks” pixels which are in agreement with the pure regions of the classification. Trees and the water fountain in the avenues as well as the lake docks, the building, and some soil surfaces in the park are also found. However, pixels with water are found everywhere in the image, possibly due to shadow effects. In addition, mixed pixels are also found in agreement with the DESIREX classification. TRUST on night (Figure 8) shows worst performances when finding “water”: no pure pixels are found in the park lake, and the water fountain is lost. In addition, “other roads” pure pixels are also lost, and “vegetation” pixels in the avenues appear as mixed ones. However, RMSEs are close to those of TRUST on day with δ S m i x e d = 0.25 and δ S p u r e = 0.48 pixel fraction for mixed and pure pixels, respectively. TRUST-DNS allows reducing noise and to find more pure pixels in both day and night images (Figure 9 and Figure 10). Thus, the lake and its docks are perfectly defined as well as the water fountain in the avenue, the park vegetation, its small soil surfaces, and its building. In addition, mixed pixel regions are found at the interfaces of pure regions: between the park and the avenues around, in the limits of the lake docks, and also on the borders of the park building. Only some small differences are found between TRUST-DNS day and night, as expected since for both materials composing a given pixel are the same. For both day and night applications of TRUST-DNS, the RMSEs are only slightly lower than for TRUST, with δ S m i x e d = 0.24 pixel fraction for mixed pixels and δ S p u r e = 0.43 pixel fraction for pure ones. With every method and image, a square roof of concrete is found. Visually, it is possible to verify the existence of this roof. However, in the DESIREX classification, it was misclassified and confused with “other roads” material. In addition, in any case, the material “roofs made of asphalt” appears as negligible. Only tens of pixels are identified to contain this material and they are scattered on the right-hand side of the image. In general, TRUST and TRUST-DNS recover the mixed and pure areas found on the DESIREX classification.

4.4. Temperature Retrieval

Figure 11, Figure 12, Figure 13 and Figure 14 show the temperatures retrieved for each material together with the TES temperature at 8 m. Hence, TRUST applied on thermal images allows to link urban materials to LSTs without needing a previous land cover classification. Figure 11 shows the temperatures retrieved with TRUST on the day image, Figure 12 with TRUST on the night image, Figure 13 with TRUST-DNS on the day image, and Figure 14 with TRUST-DNS on night. For both day temperature images (Figure 11 and Figure 13) and for both pure and mixed pixels, impervious materials “roads made of asphalt” and “roofs made of red bricks” present the highest temperatures, and natural materials such as “water”, “vegetation”, and soil (“other roads”) present lower temperatures. Thus, this result shows that manmade materials lead to an increase of LST during day, which is mitigated by vegetation or water. TRUST and TRUST-DNS exhibit similar performances for day image temperature retrieval with mean square errors of δ T = 0.39 K and δ T = 0.40 K, respectively. On the other hand, for both night images, “roads with asphalt” presents the highest temperatures, followed by “water” and “other roads”, with roofs and “vegetation” exhibiting the lowest temperatures. Then, during night, the canyon structure drives the LST spatial distribution, with roofs being cooler and roads being hotter. In addition, vegetation and soil seem to lead to cooler LSTs. TRUST-DNS on night presents less noisy results than TRUST, possibly because of the better performances in abundance retrieval. However, this noisier result of TRUST is only slightly visible in the temperature retrieval mean square errors. TRUST on night presents a δ T = 0.33 K while TRUST-DNS presents a δ T = 0.29 K.

5. Discussion

This article evaluates the potential of TRUST and TRUST-DNS to perform urban LST cartography with a better spatial resolution than the previous acquired images. Moreover, TRUST and TRUST-DNS allow linking manmade and natural materials to different temperature behaviors, and thus appear as powerful tools for the characterization and understanding of SUHIs at high spatial resolution. In addition, several methodological aspects of TRUST (TRUST-DNS) can be tuned to improve its performances as a function of the city structural and material characteristics. It is also important to take into account that in this study only eight thermal spectral bands were used, while in previous TRUST studies no fewer than 32 bands were used. Of course, the more spectral bands there are, the better the performance [16], and thus this study places the methodology at the limits of its applicability.

5.1. Endmembers Definition in the Thermal Domain

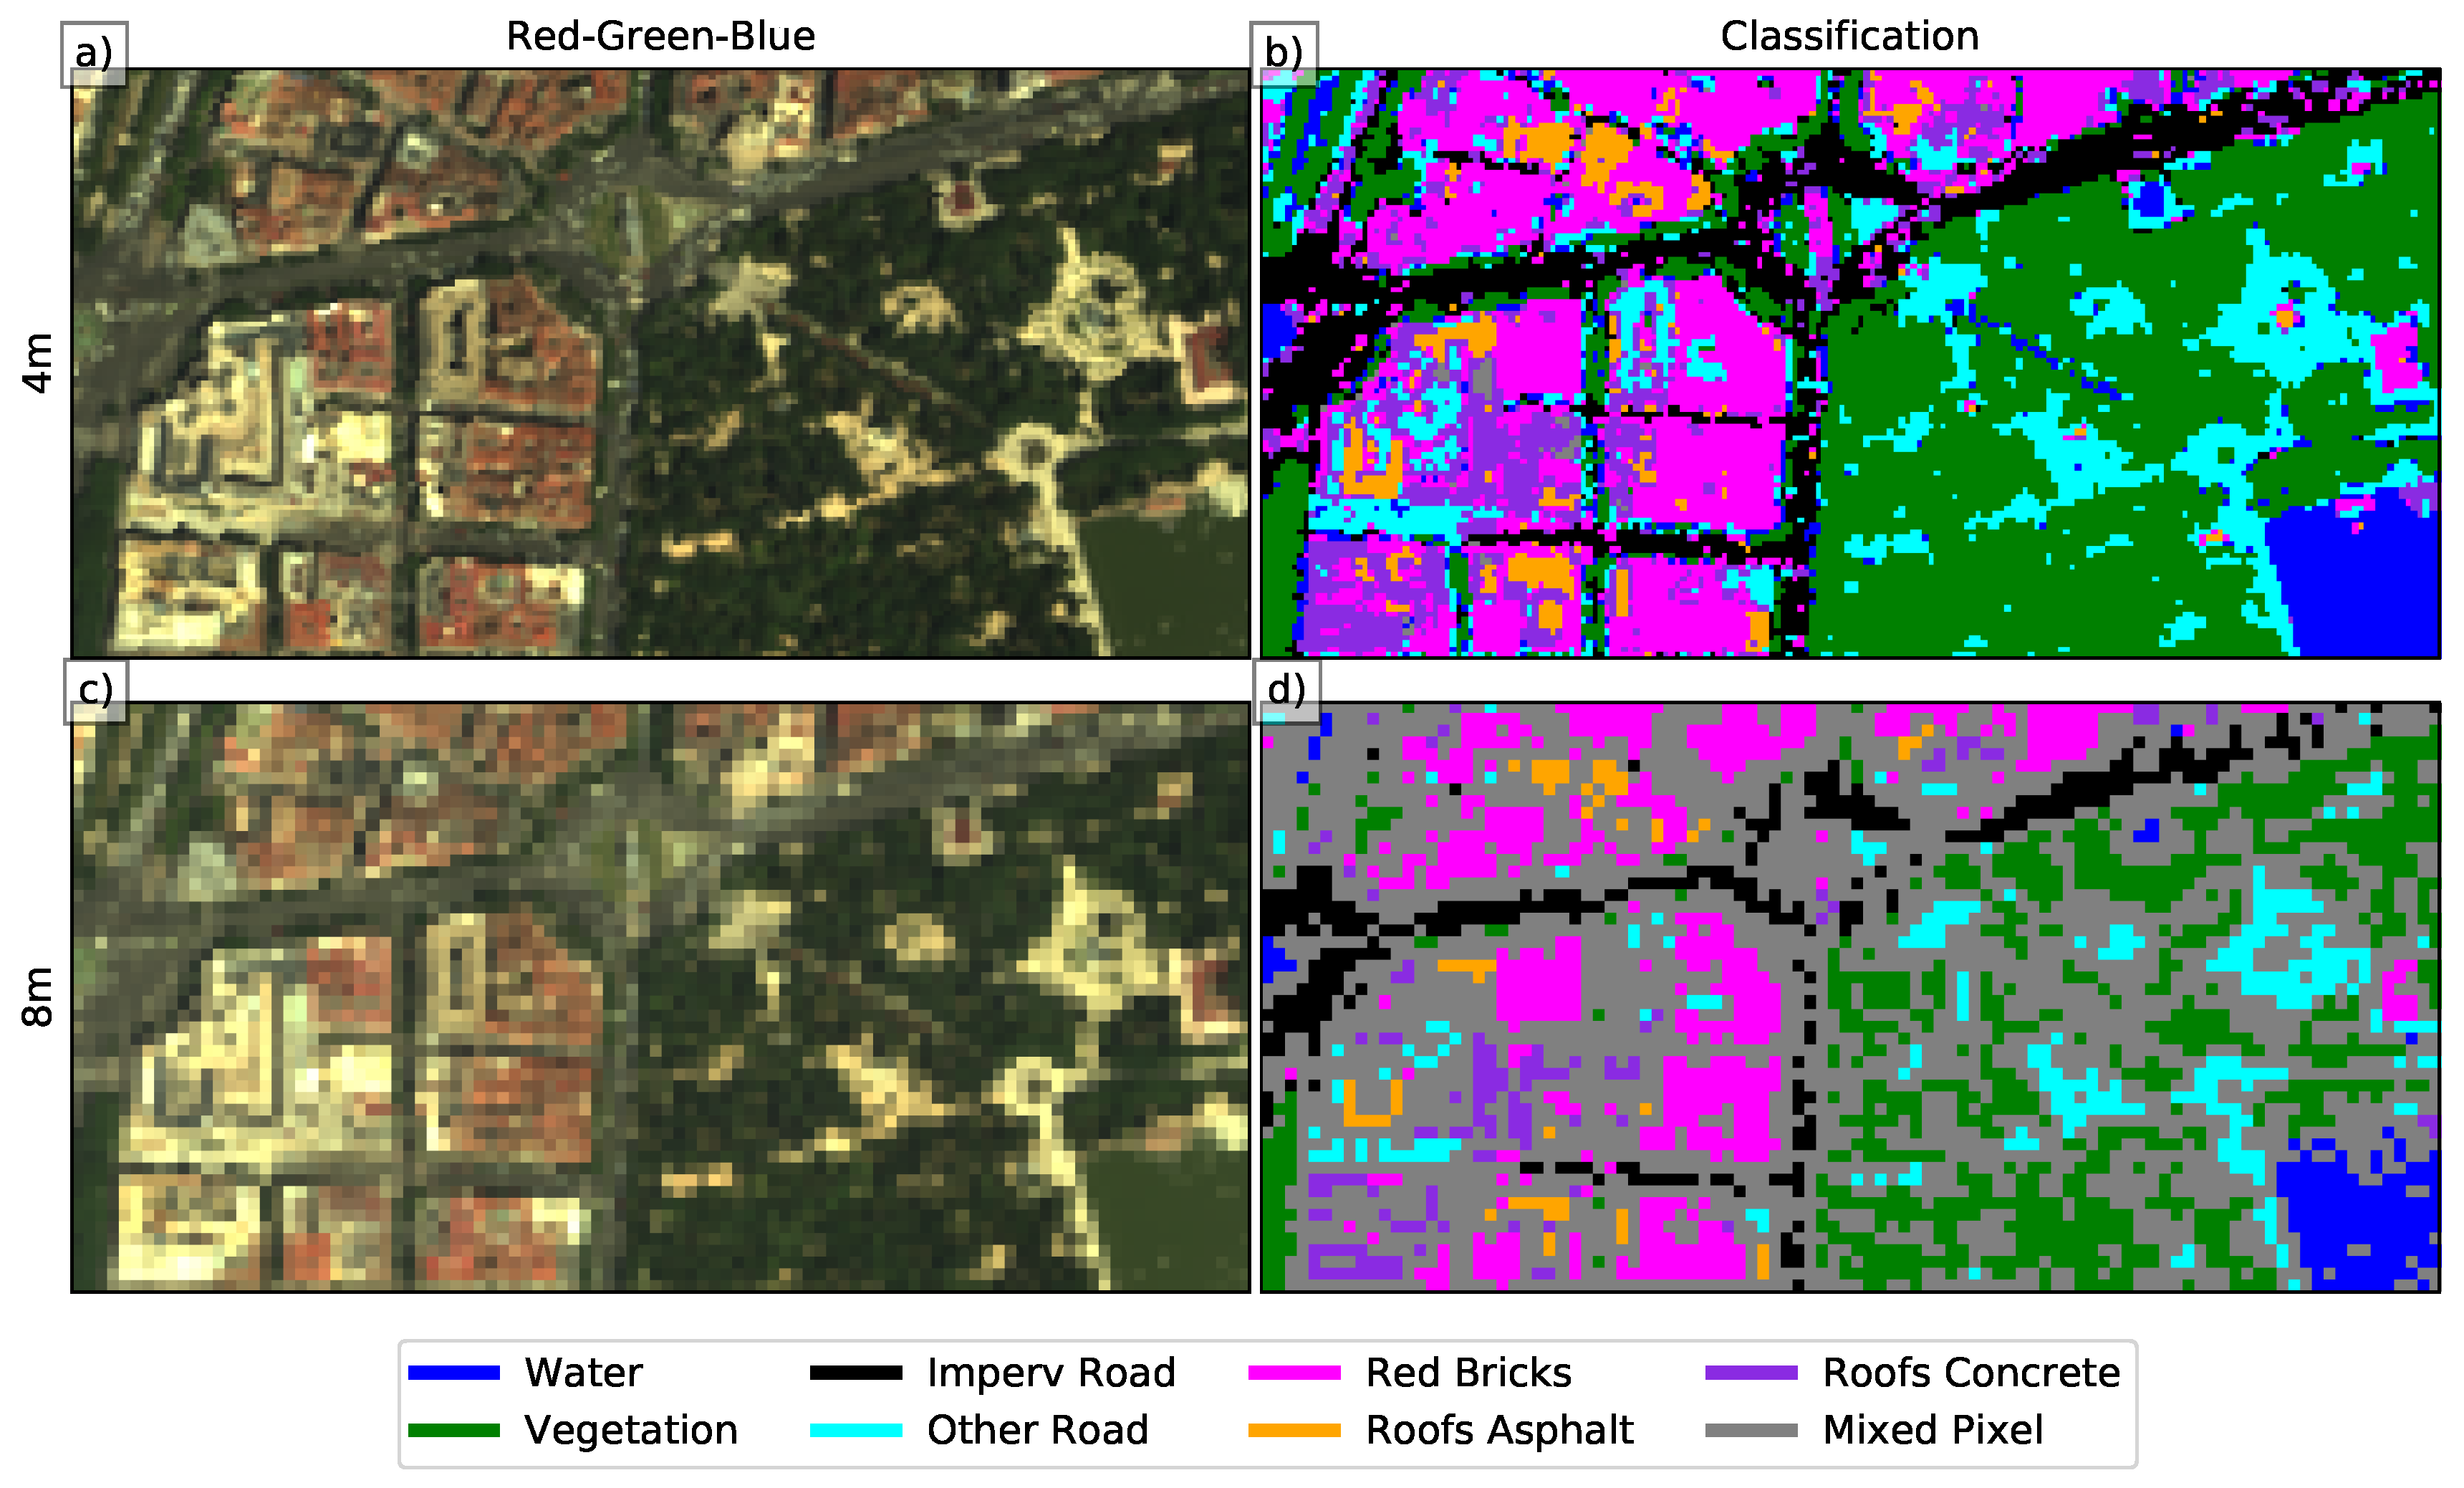
The ideal number of endmembers defined to unmix a given scene strongly depends on the scene and the image resolution. Thus, the number of pure materials should increase when the scene heterogeneity and/or the image resolution increase. However, too many pure materials lead to a loss of unmixing performances since the number of possible material combinations increases exponentially with the number of endmembers, inducing inaccuracies in the minimization of the radiance reconstruction. Having a previous classification at a slightly better resolution (in this case, the previous classification at 4 m and the radiance images at 8 m) allows recognizing the number of endmembers which is adapted to the scene and resolution. Furthermore, since DESIREX classification was done with 80 reflective and thermal bands and we have only eight, we decided to slightly decrease the number of pure materials defined in the DESIREX classification. Thus, from the two water and two vegetation classes, only one was retained to define each class. In addition, since TES presents low performances on metallic materials [23], “roofs made of metal” class was not used.
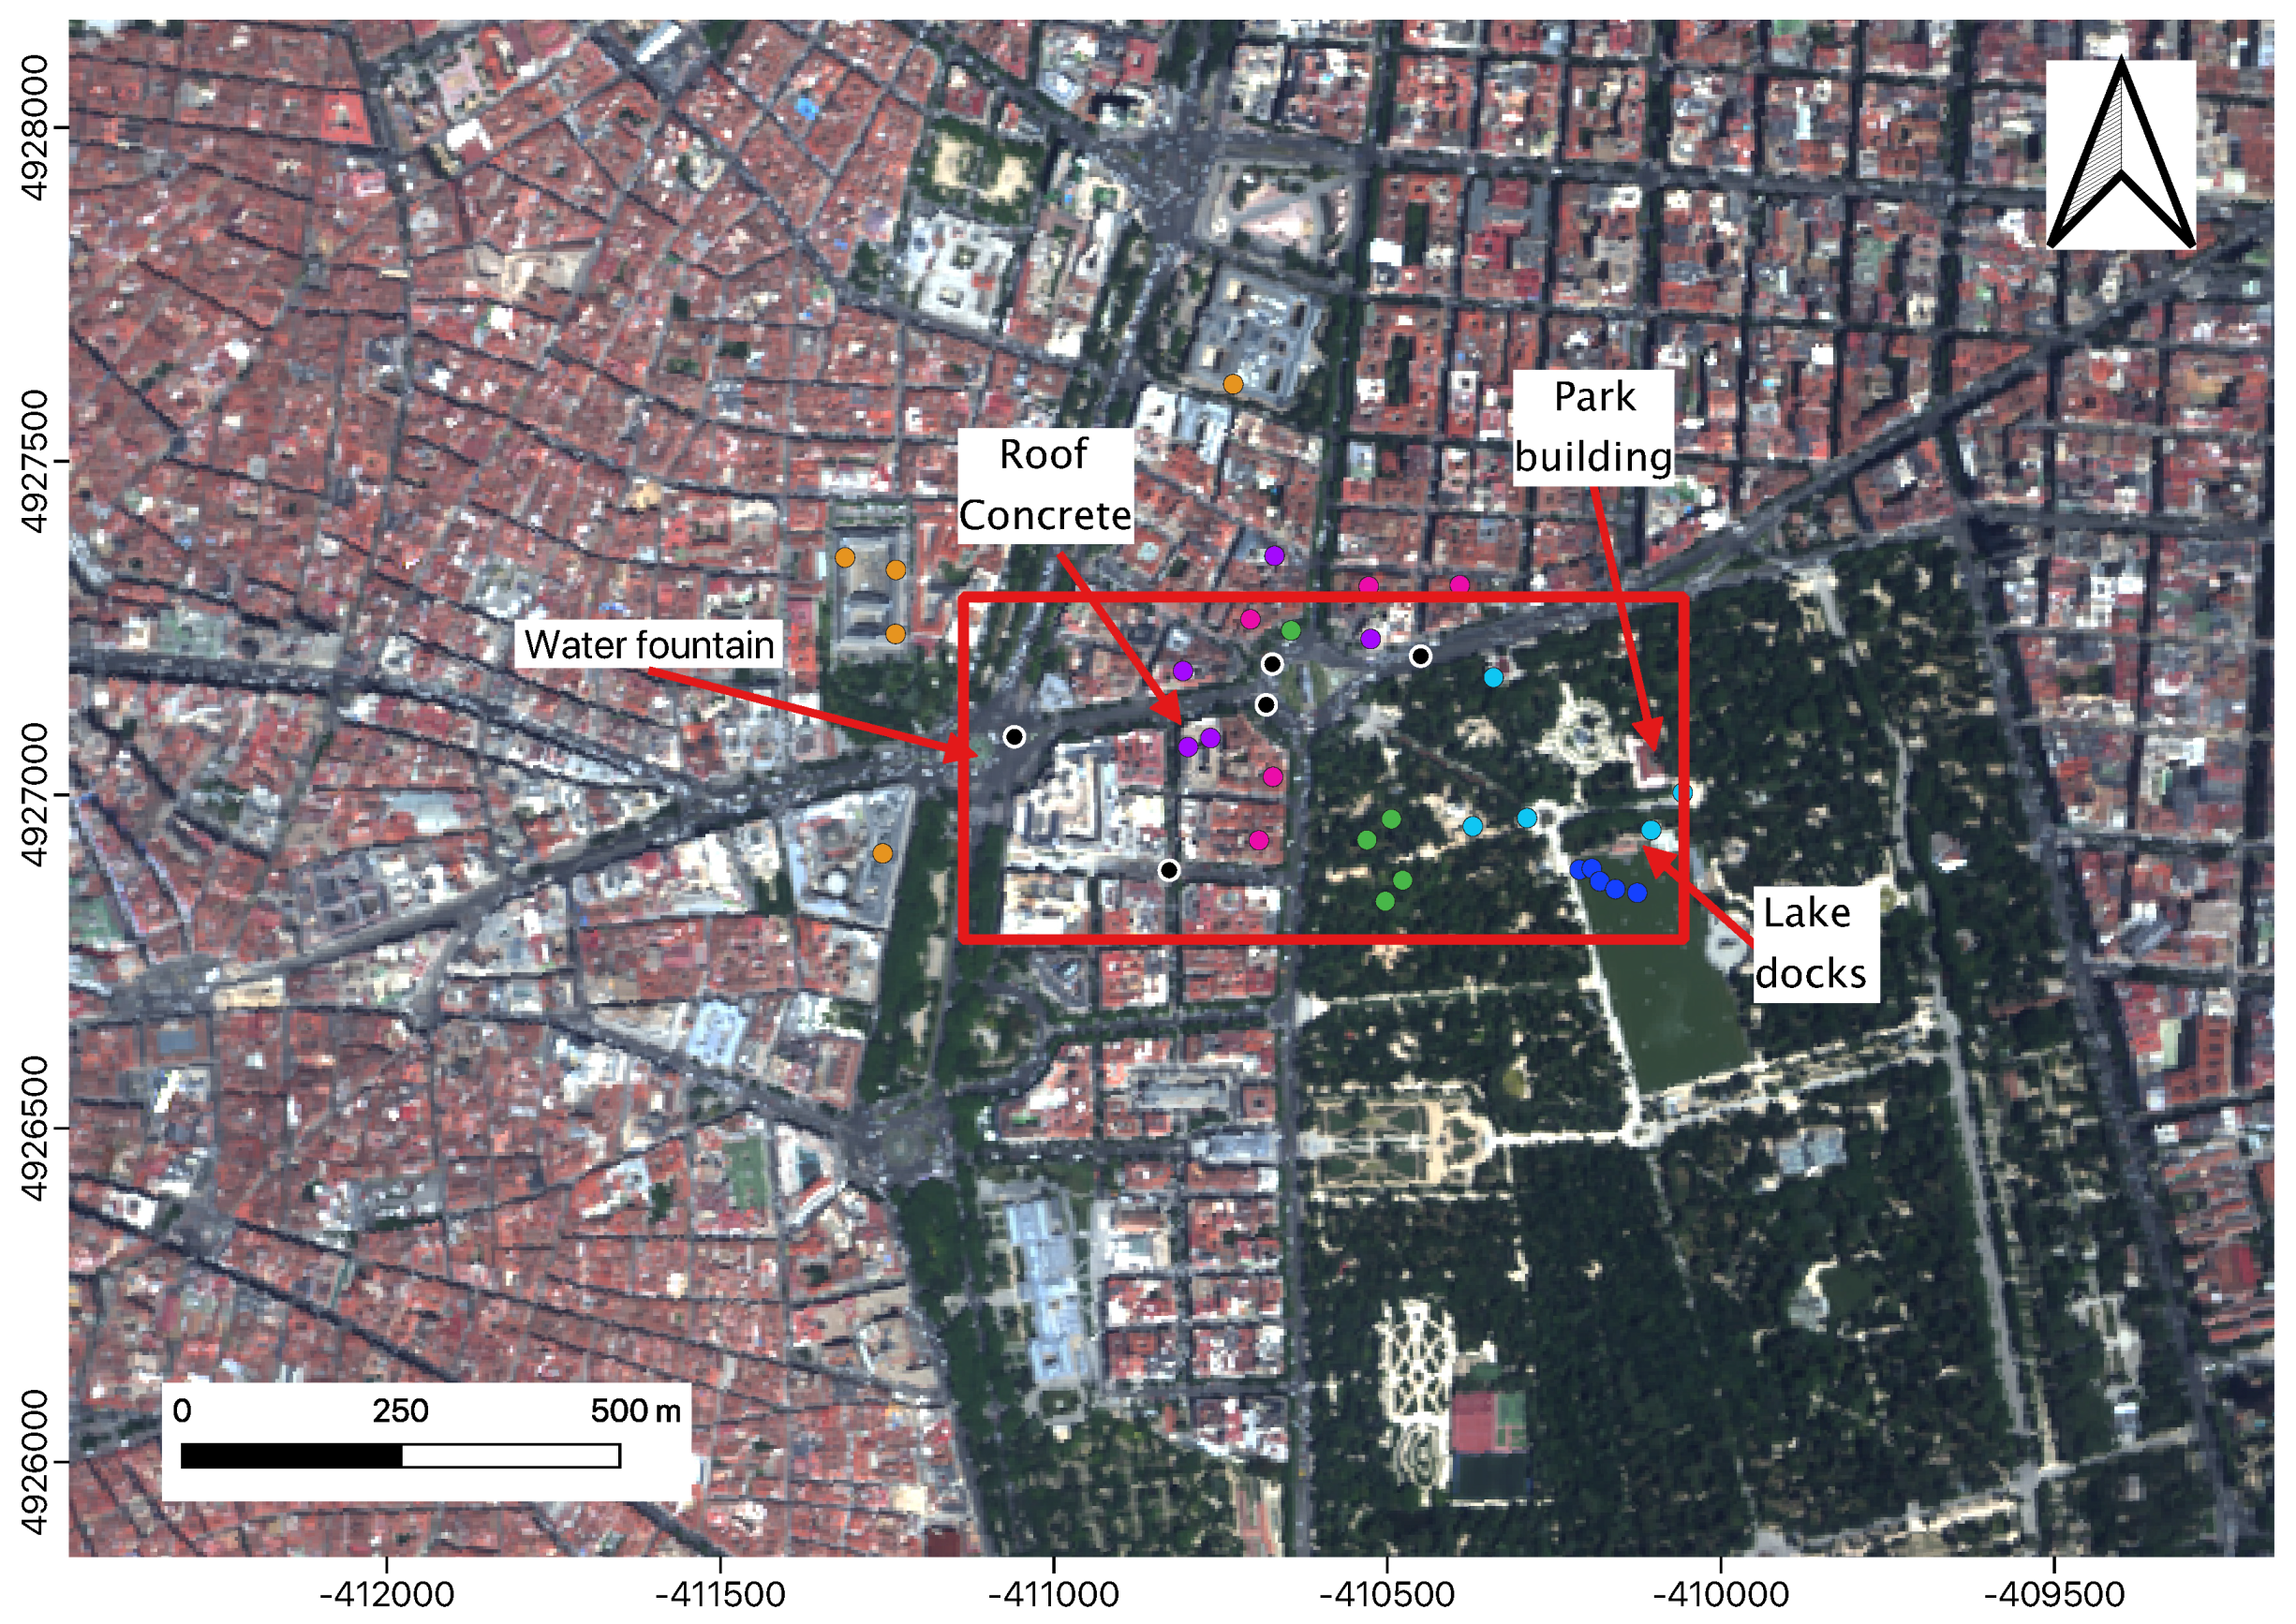
Furthermore, different methodologies can be used to define the emissivity spectra and mean temperatures of endmembers. In this work, based on [11,16], five pure pixels in the image were manually selected to define each pure material. Indeed, as recommended by [7,11,
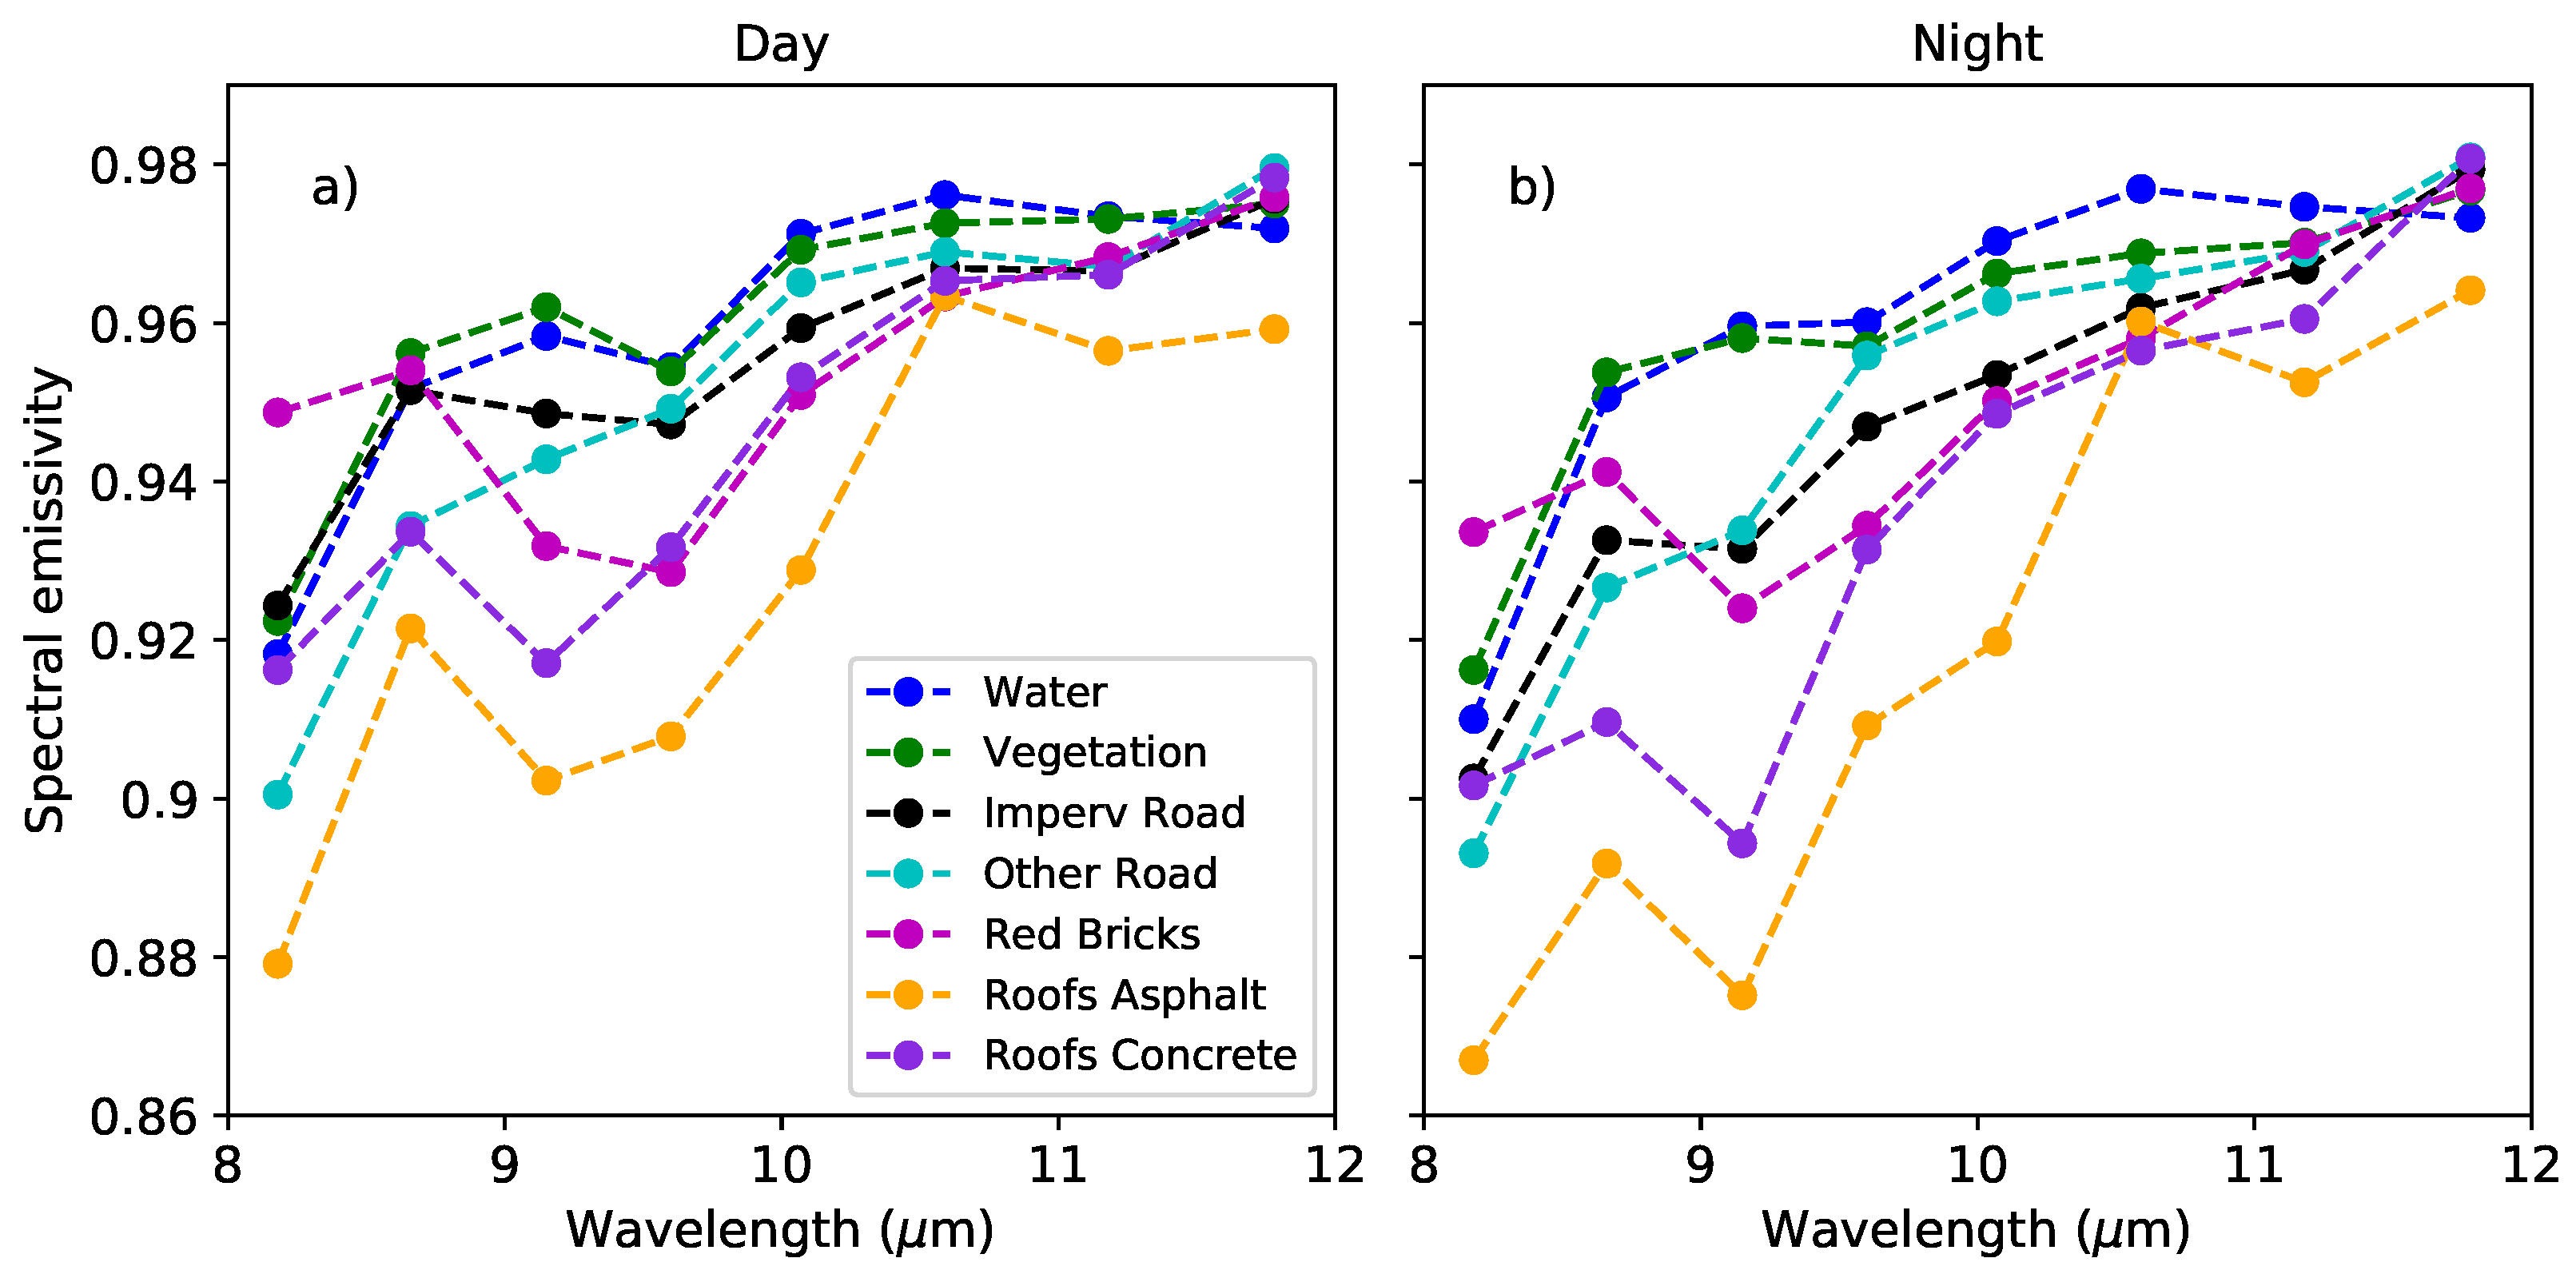
20], TES algorithm was used on both day and night images to obtain the emissivity spectrum and temperature of each manually selected pixel. However, emissivity differences between day and night pixels are found (see Figure 5). These differences are lower or equal to 2% of emissivity, which is within the range of the TES emissivity retrieval accuracy (1.5% was found by Gillespie et al. (1998) [23] and 3% by Oltra-Carrio (2013) [20]). Small co-registration errors and viewing angles differences between day and night images can also explain these small differences between day and night pure material spectra. In addition, atmospheric reflective contribution, which is more important during day, can be misestimated, influencing the emissivity characterization. A slight trend to small values at short wavelengths is also observed, especially for night emissivities. This may be partially explained by the 8- μ m band to be slightly influenced by water absorption bands below 8 μ m. Atmospheric water vapor content during 4 July acquisitions was 1.5 g cm 2 during day and 2.5 g cm 2 during night [7].

5.2. TRUST and TRUST-DNS Performances

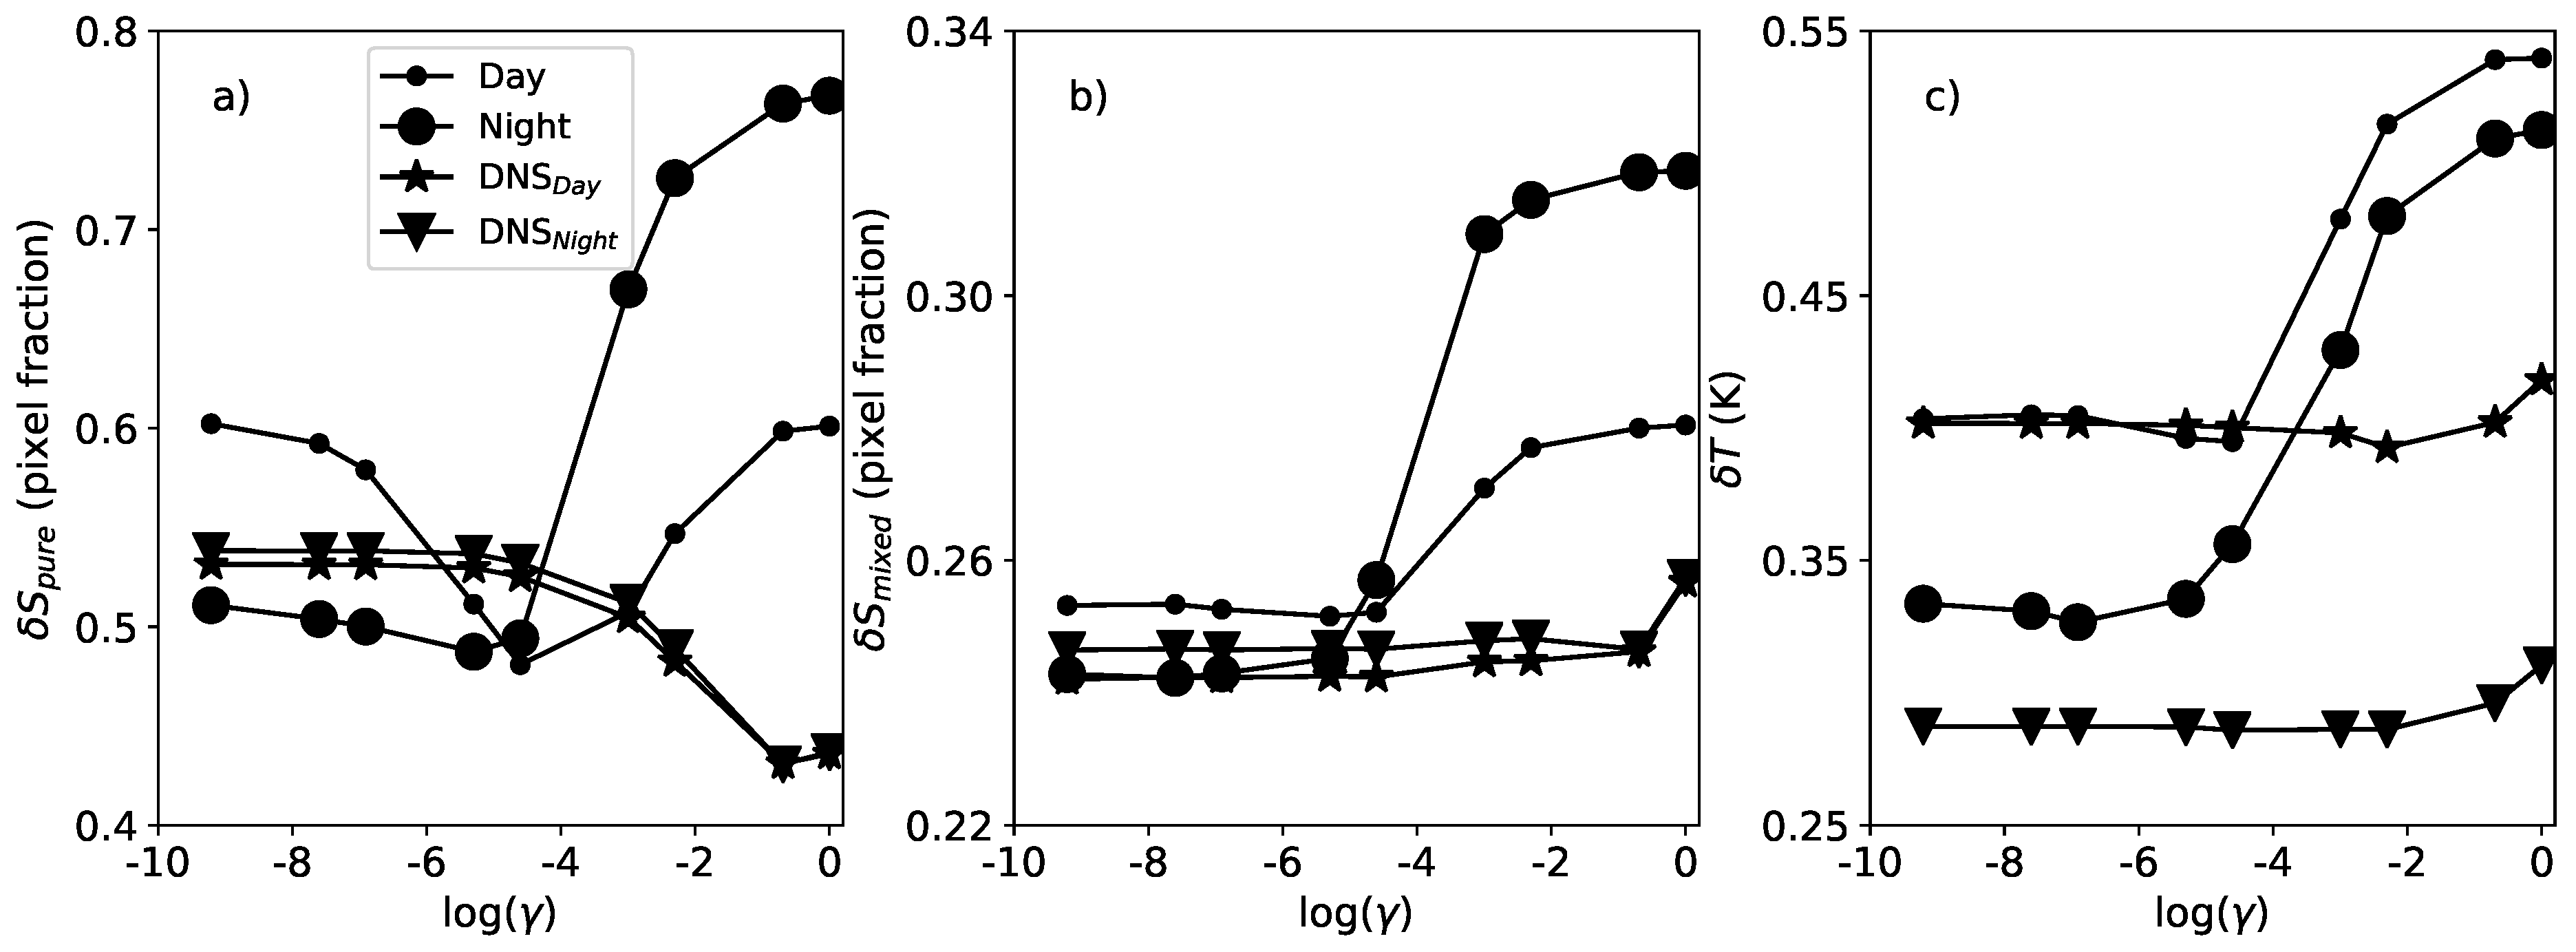
TRUST-DNS appears as more stable than TRUST when dealing with γ variations. In addition, the study on the choice of γ , showing the global unmixing errors, illustrates that, once the most performant γ is chosen, TRUST-DNS outperforms TRUST on both abundance and temperature retrieval.
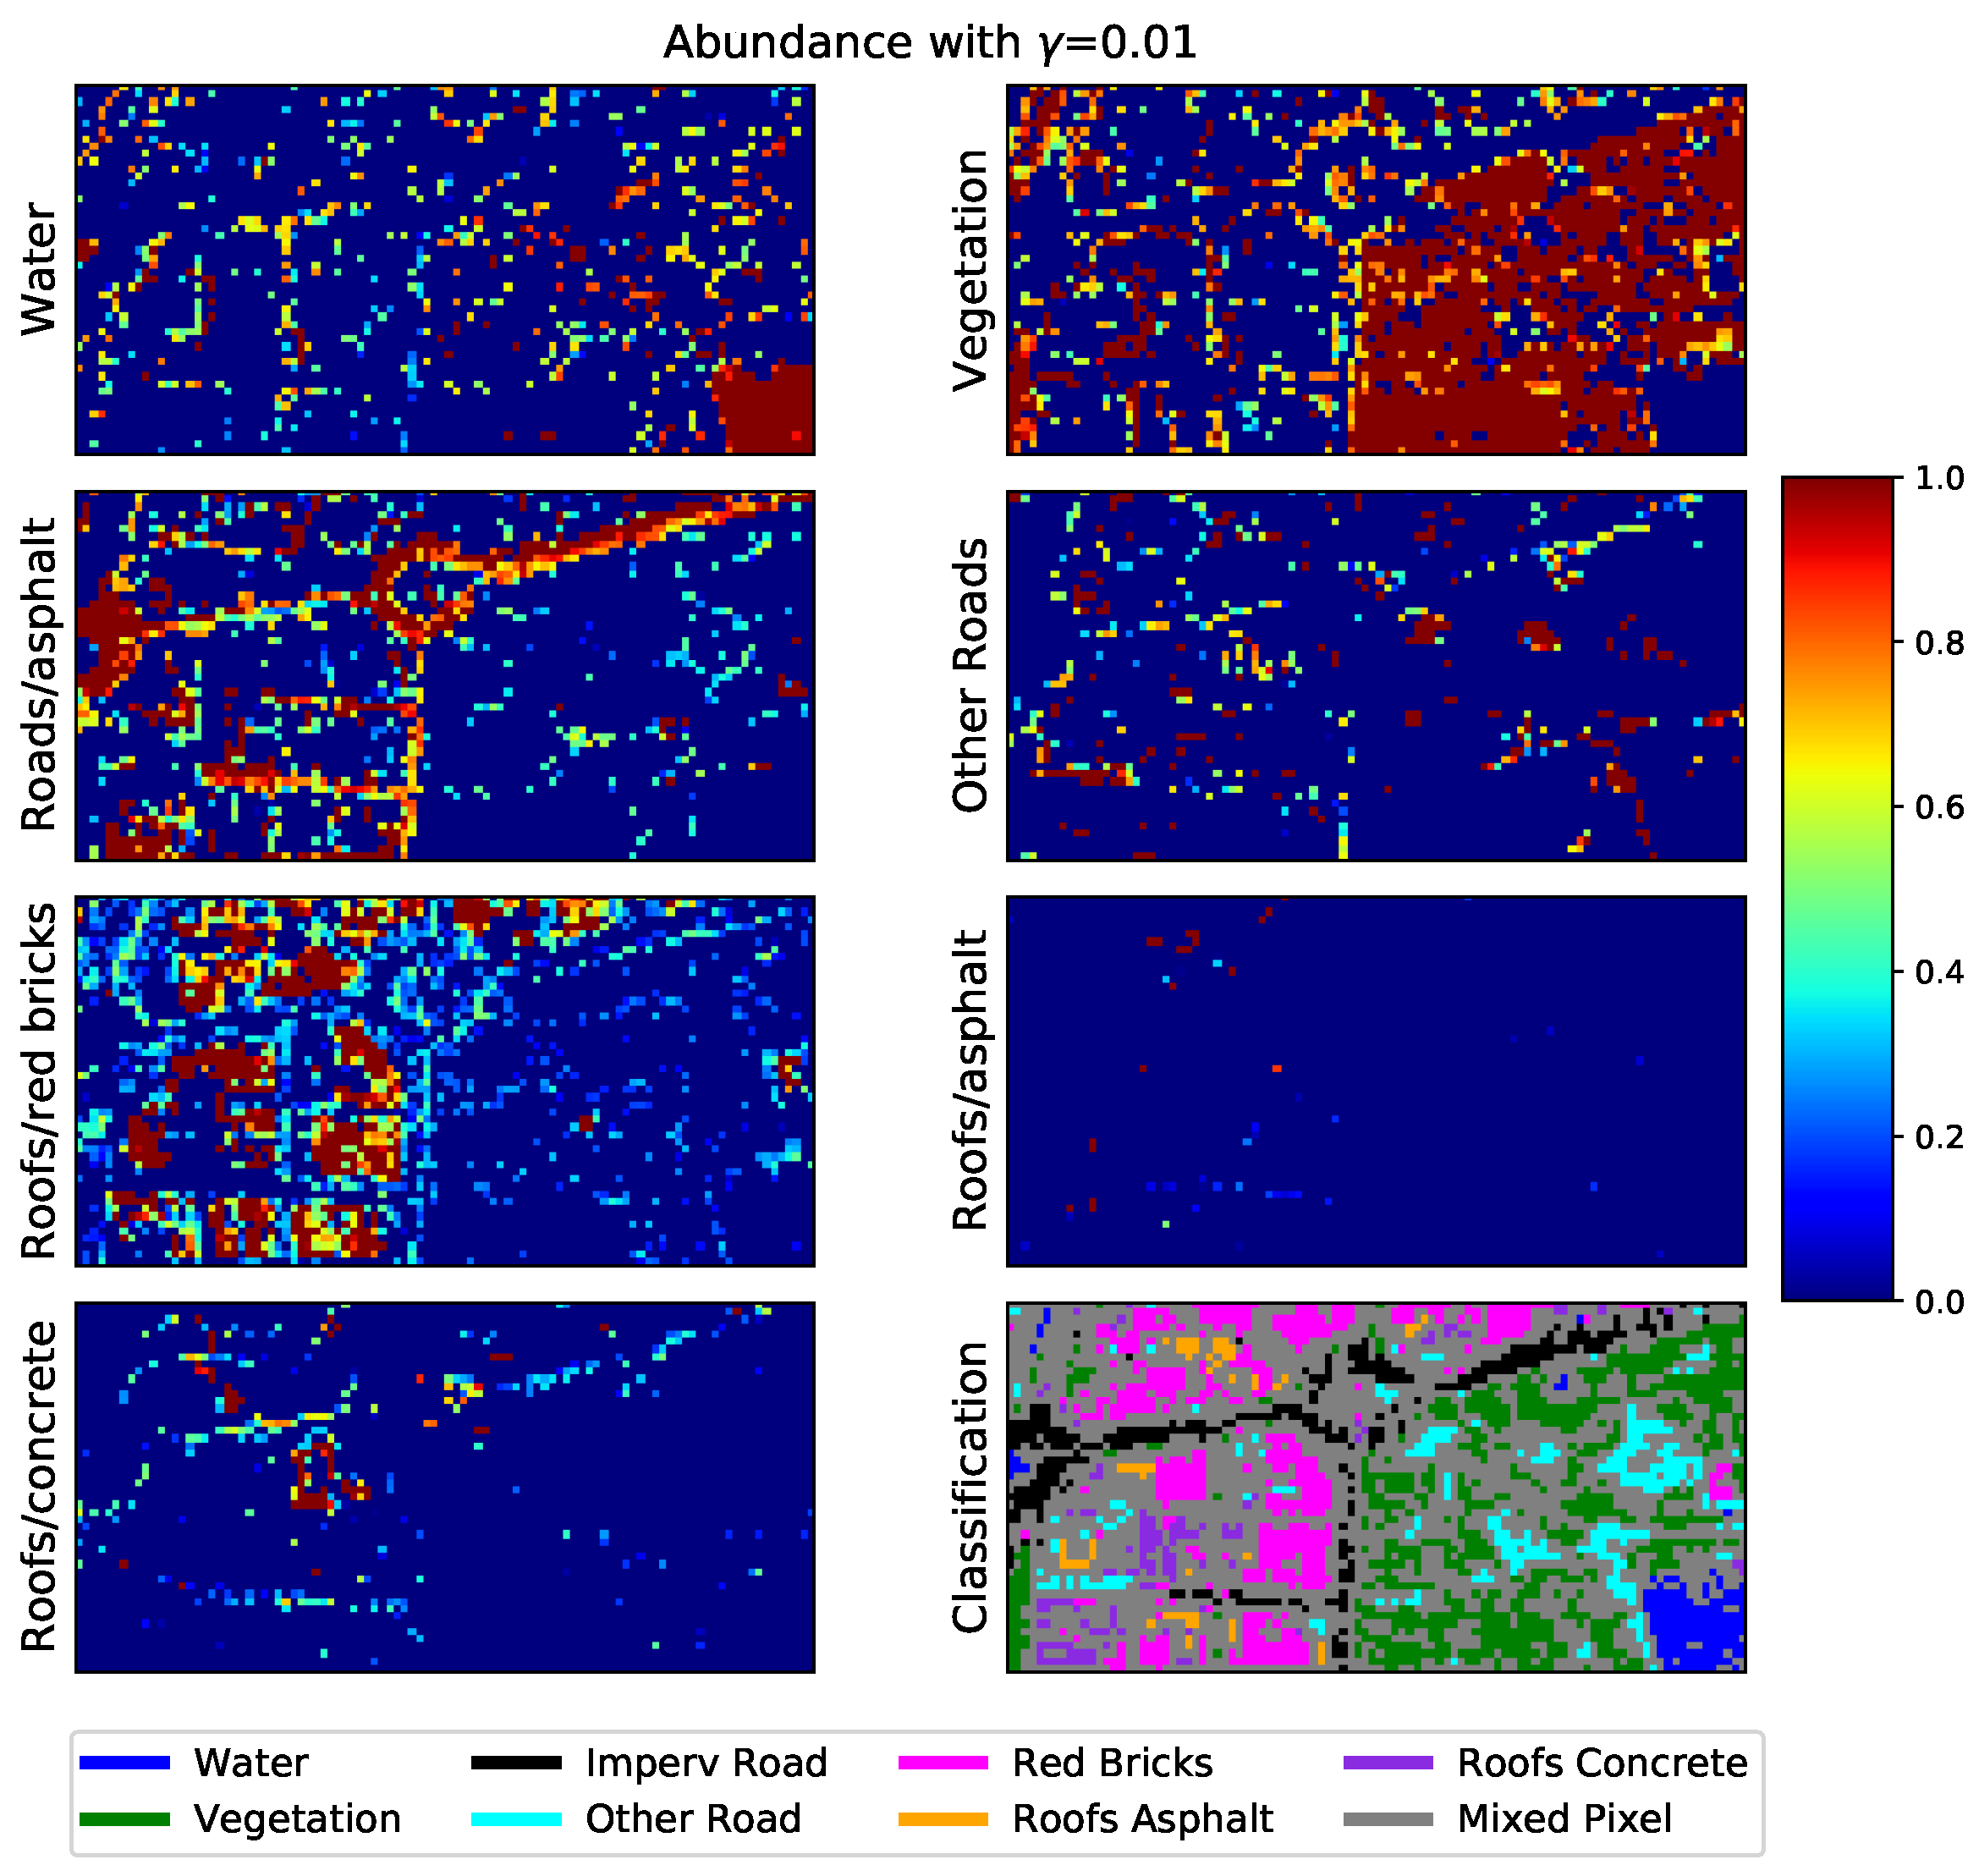
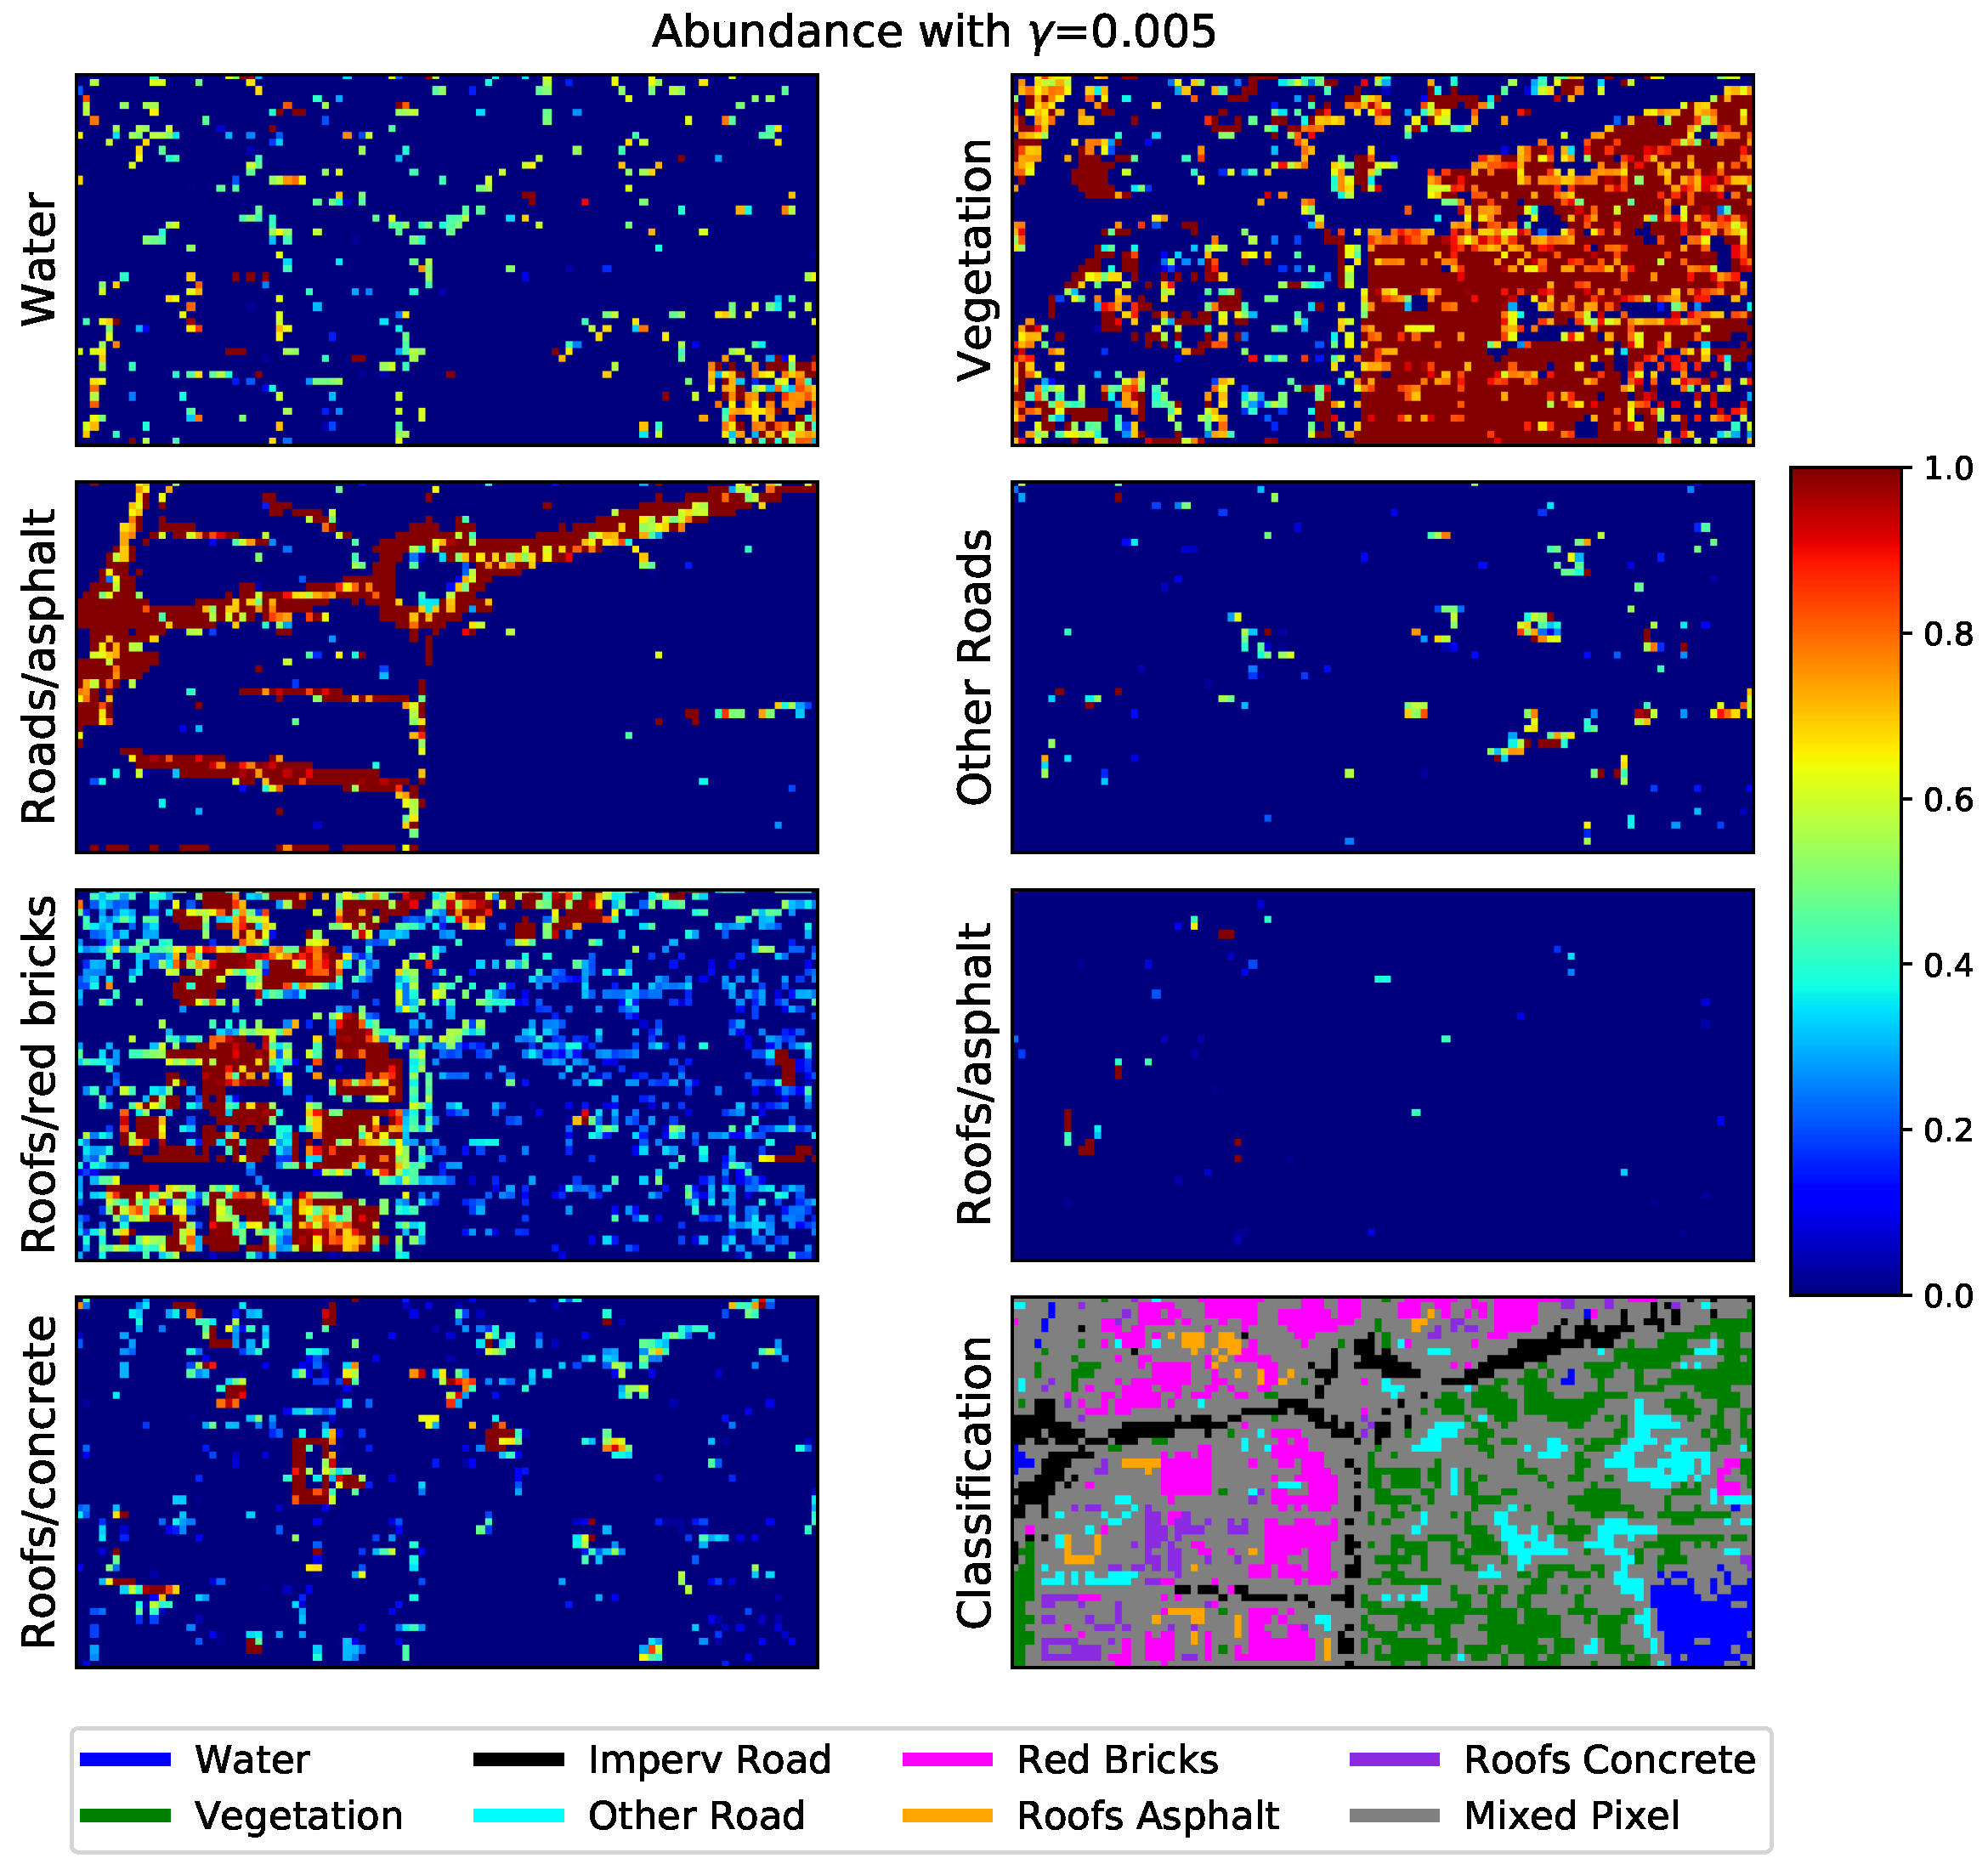
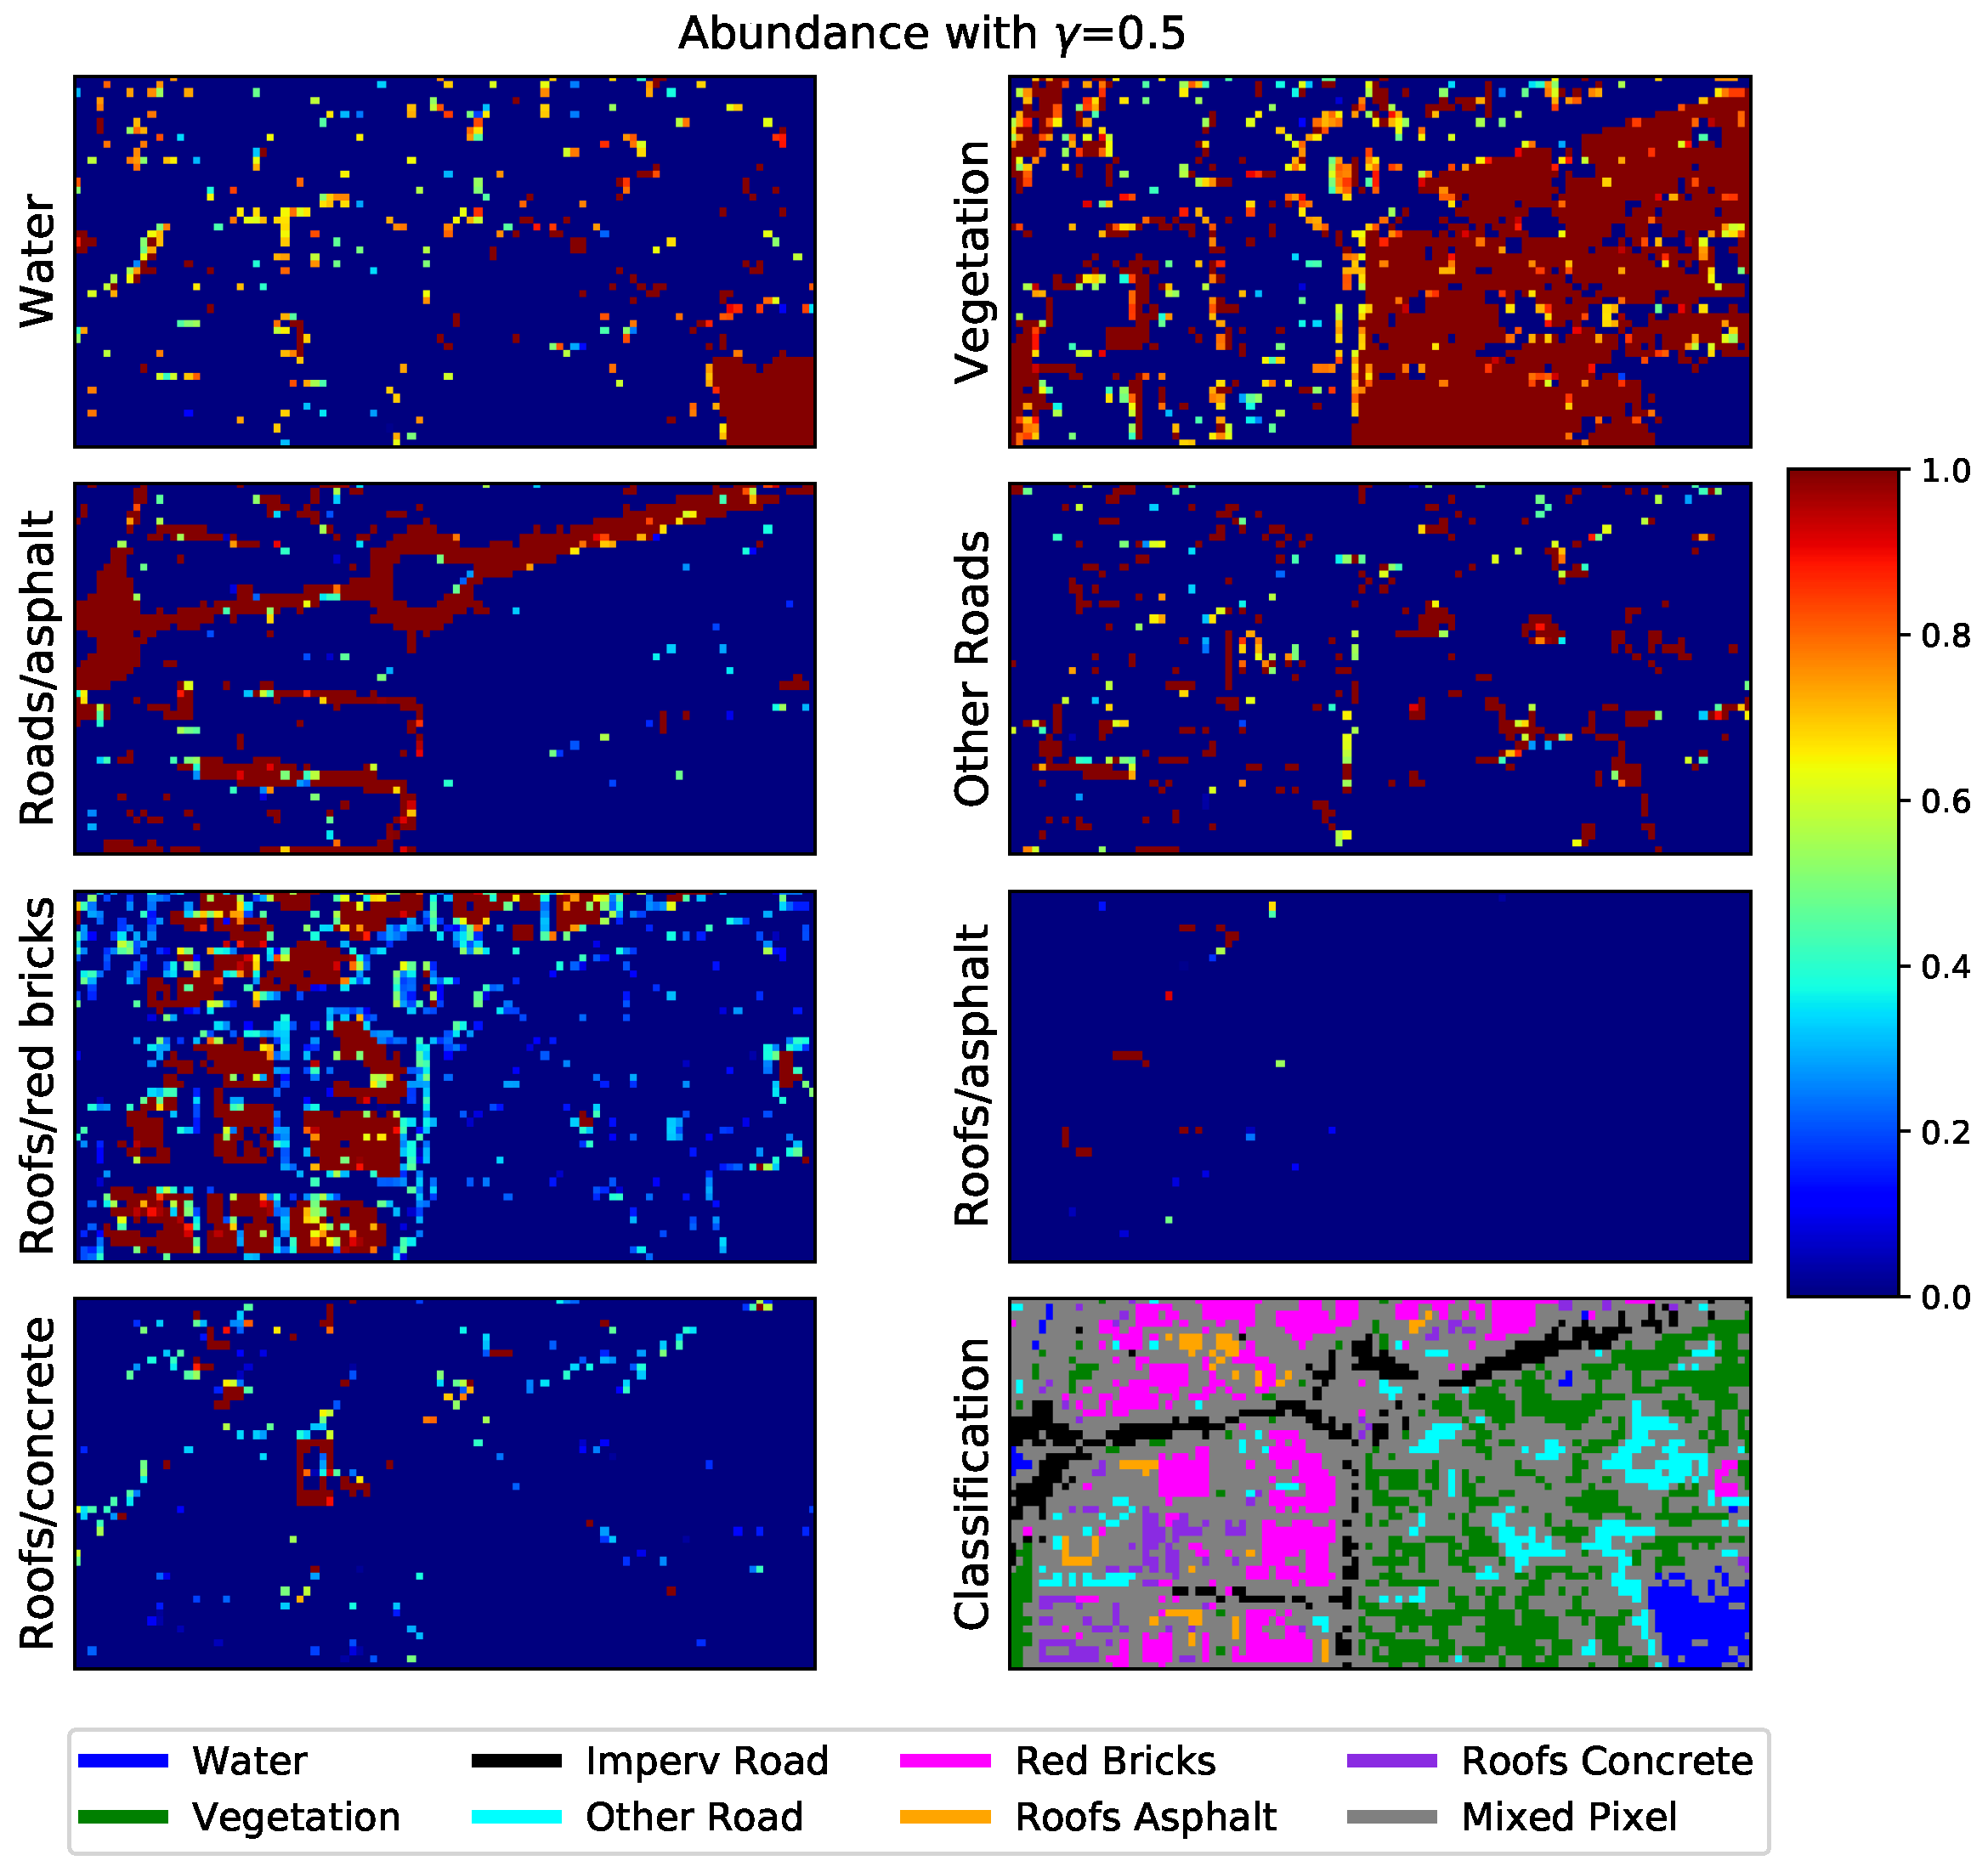
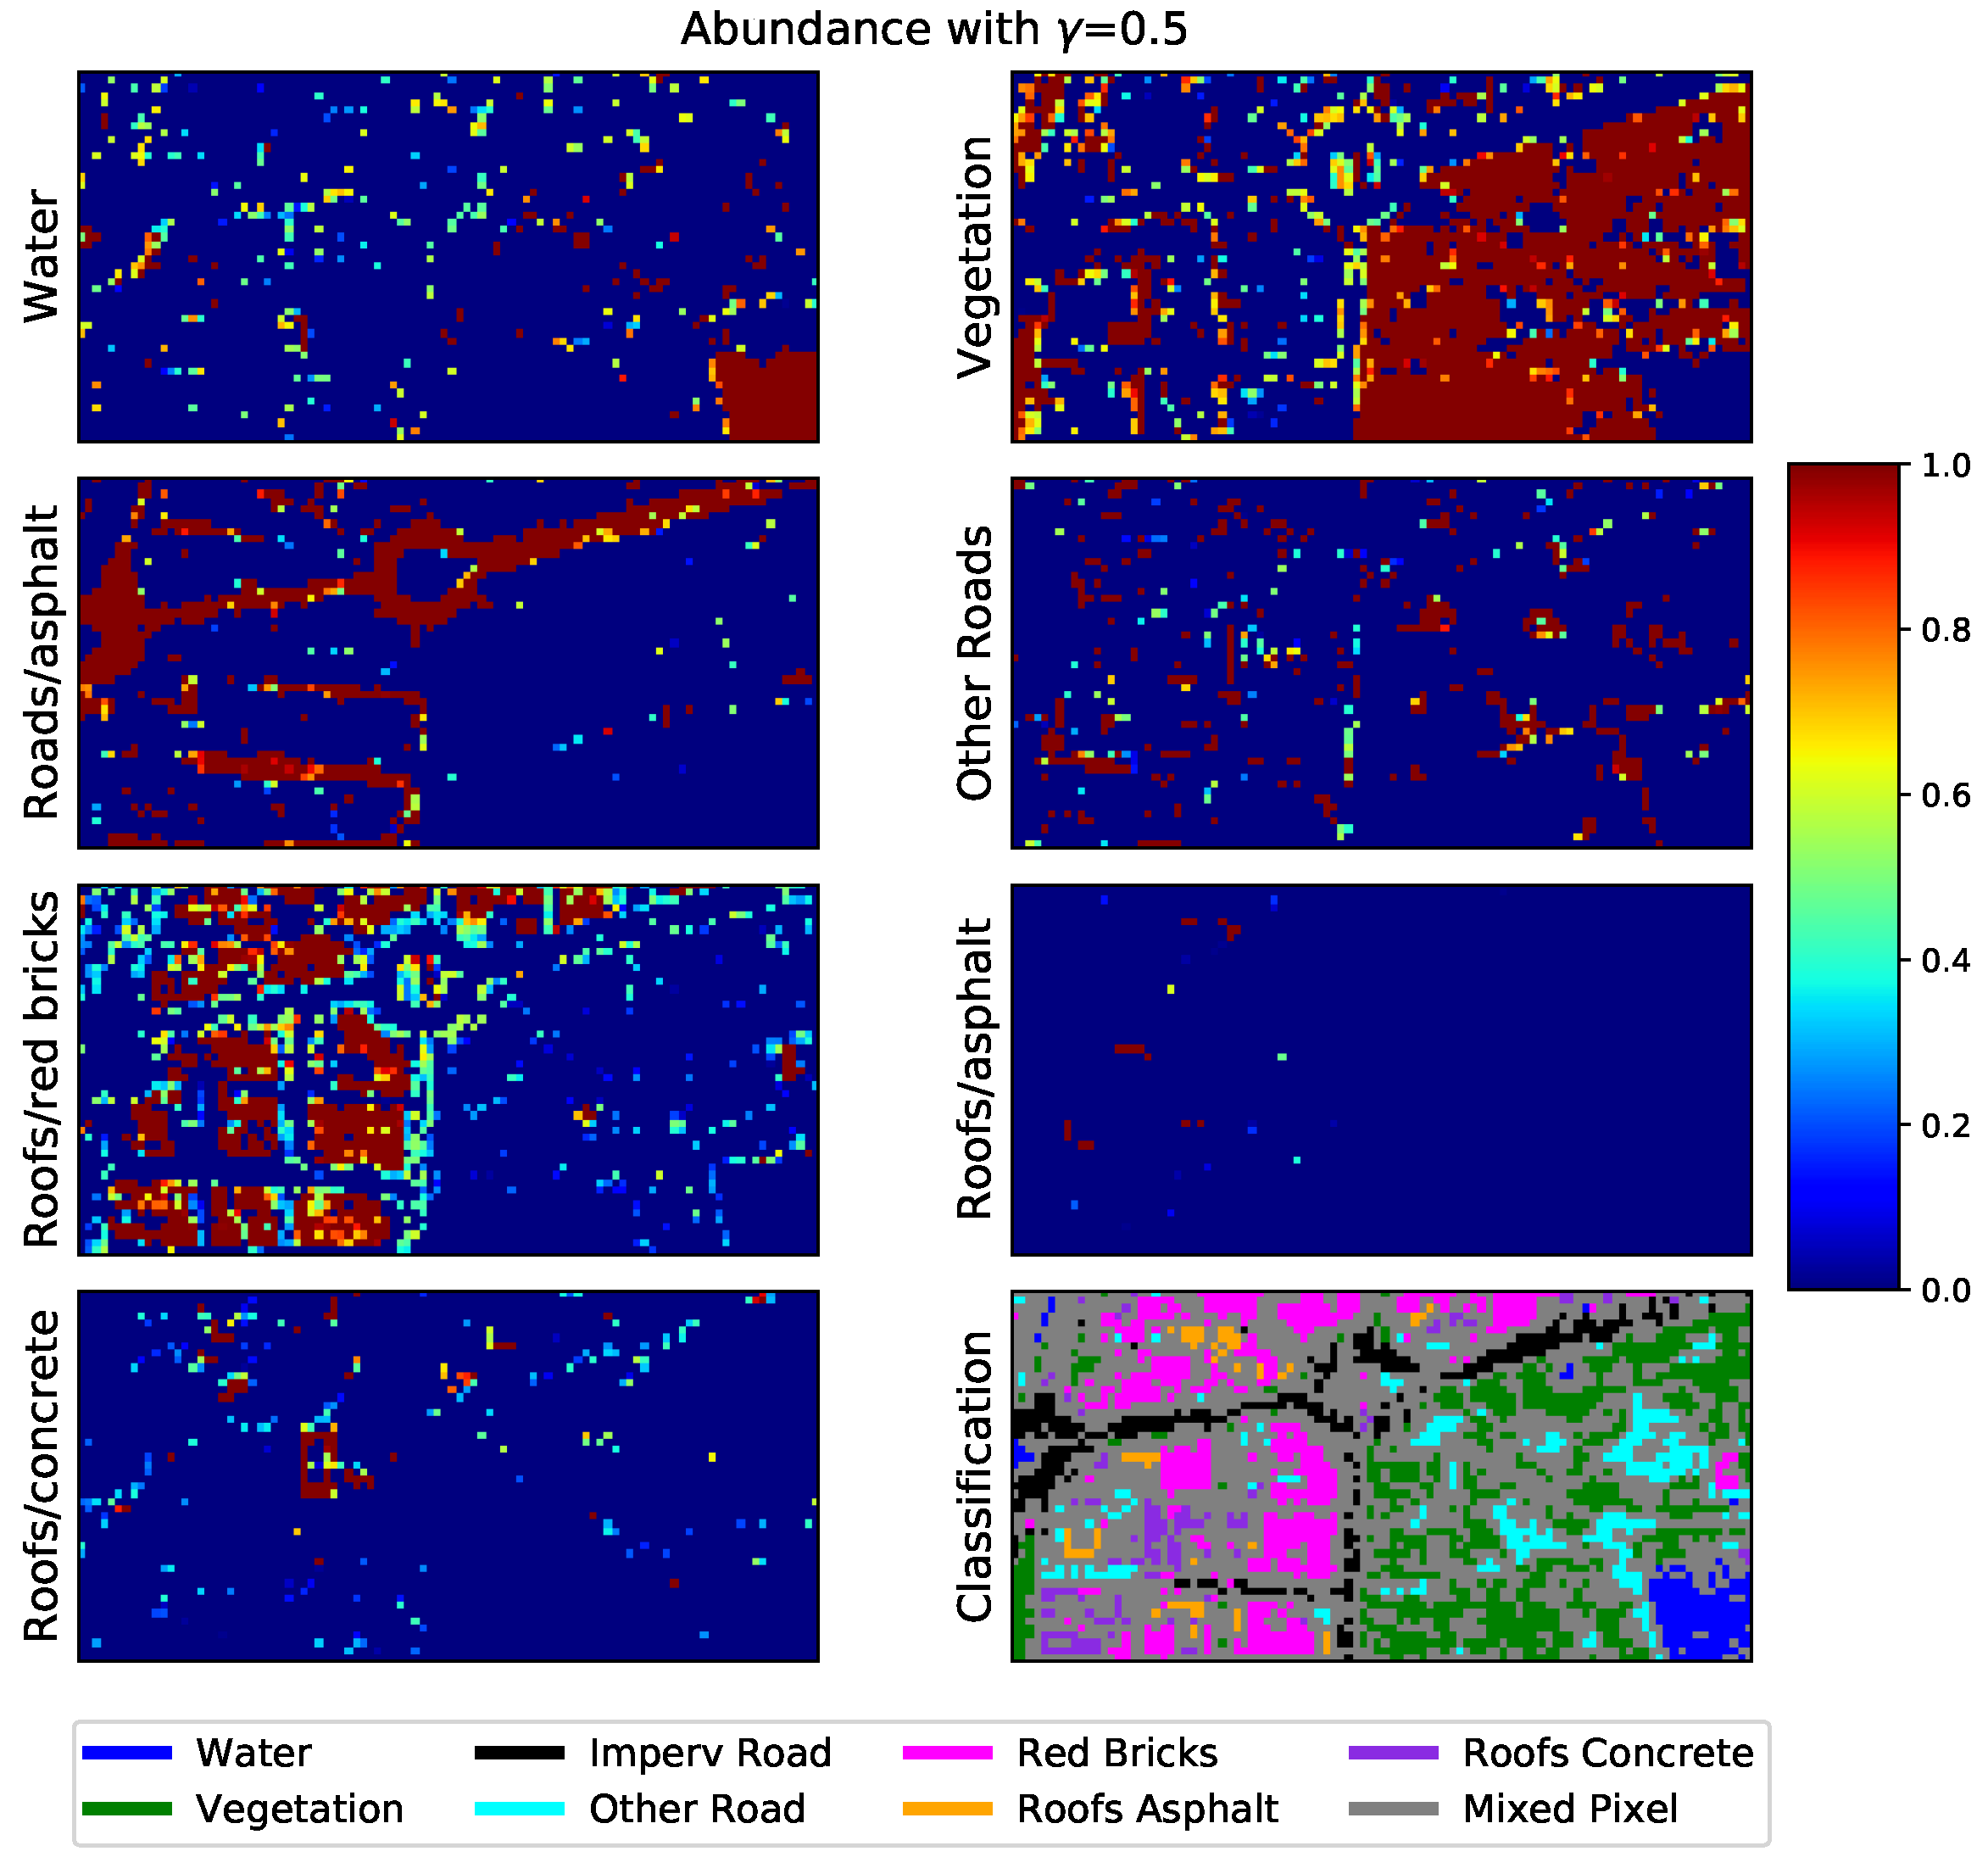
However, these results should be analyzed carefully since the 4-m classification used as reference for the material abundances presents two main drawbacks, and consequently can lead to misestimations of the unmixing errors. On the one hand, this reference for the material abundances does not include a mixed pixel class even if at this resolution in urban environments mixed pixels appear. Then, having the DESIREX classification as reference induces inaccuracies, mainly in the estimation of the pure pixel abundance errors. This effect is observed in Figure 6, where pure pixel abundance errors are double compared to those of mixed pixels, i.e., TRUST correctly finds mixed pixels where the classification considers pure ones, leading to an increase in the pure pixels abundance errors. Hence, using as reference a higher resolution classification of the studied area would allow going deeper in this study. Another option to advance in this study is to perform a new 4-m classification with a likelihood threshold in the maximum likelihood criterion, to consider mixed pixels. On the other hand, the resolution ratio between the classification used as reference and the unmixed image, being only of two, limits the abundance error quantification since reference abundances are restricted to few discretized values (0%, 25%, 50%, 75%, and 100% of the pixel) while TRUST (TRUST-DNS) abundances can take any value in [0%, 100%] range. However, greater ratios such as the 16-m/4-m one are not intended for the moment, since TRUST performances were strongly degraded when it was applied on lower resolution images (TRUST applied on 16-m resolution images of Madrid city center was tested within the framework of this work).
Thus, even if it is difficult to know which abundance map is better, since no accurate information is available (reference at 4 m), TRUST-DNS seems to better delineate urban objects such as streets, buildings, the park lake or vegetated areas. Thus, TRUST-DNS improves abundance retrieval performances on both day and night, especially on night. In addition, TRUST on day images performs better than TRUST on night. Both results indicate that day thermal contrast helps to unmix urban areas. Thus, day information helps to improve night unmixing when using TRUST-DNS.
Finally, for the temperature performance study, we decided to compare pixel by pixel the 8-m LST obtained directly with the TES method, with the aggregation (with the Wien’s law) of the unmixed LSTs, also at 8 m, but with intrapixel information. This choice was grounded in two main issues: (1) the spatial distribution of materials within a 8-m pixel is not known, thus comparing 8-m unmixed LSTs to 4-m LSTs from TES is not direct; and (2) comparing pixel by pixel 8-m unmixed LSTs with 4-m LSTs from TES for each material within the pixel leads to errors containing contributions from abundance and temperature retrieval errors. Thus, this choice allows dissociating temperature retrieval errors from abundance ones.

5.3. Relationship between LST and Materials

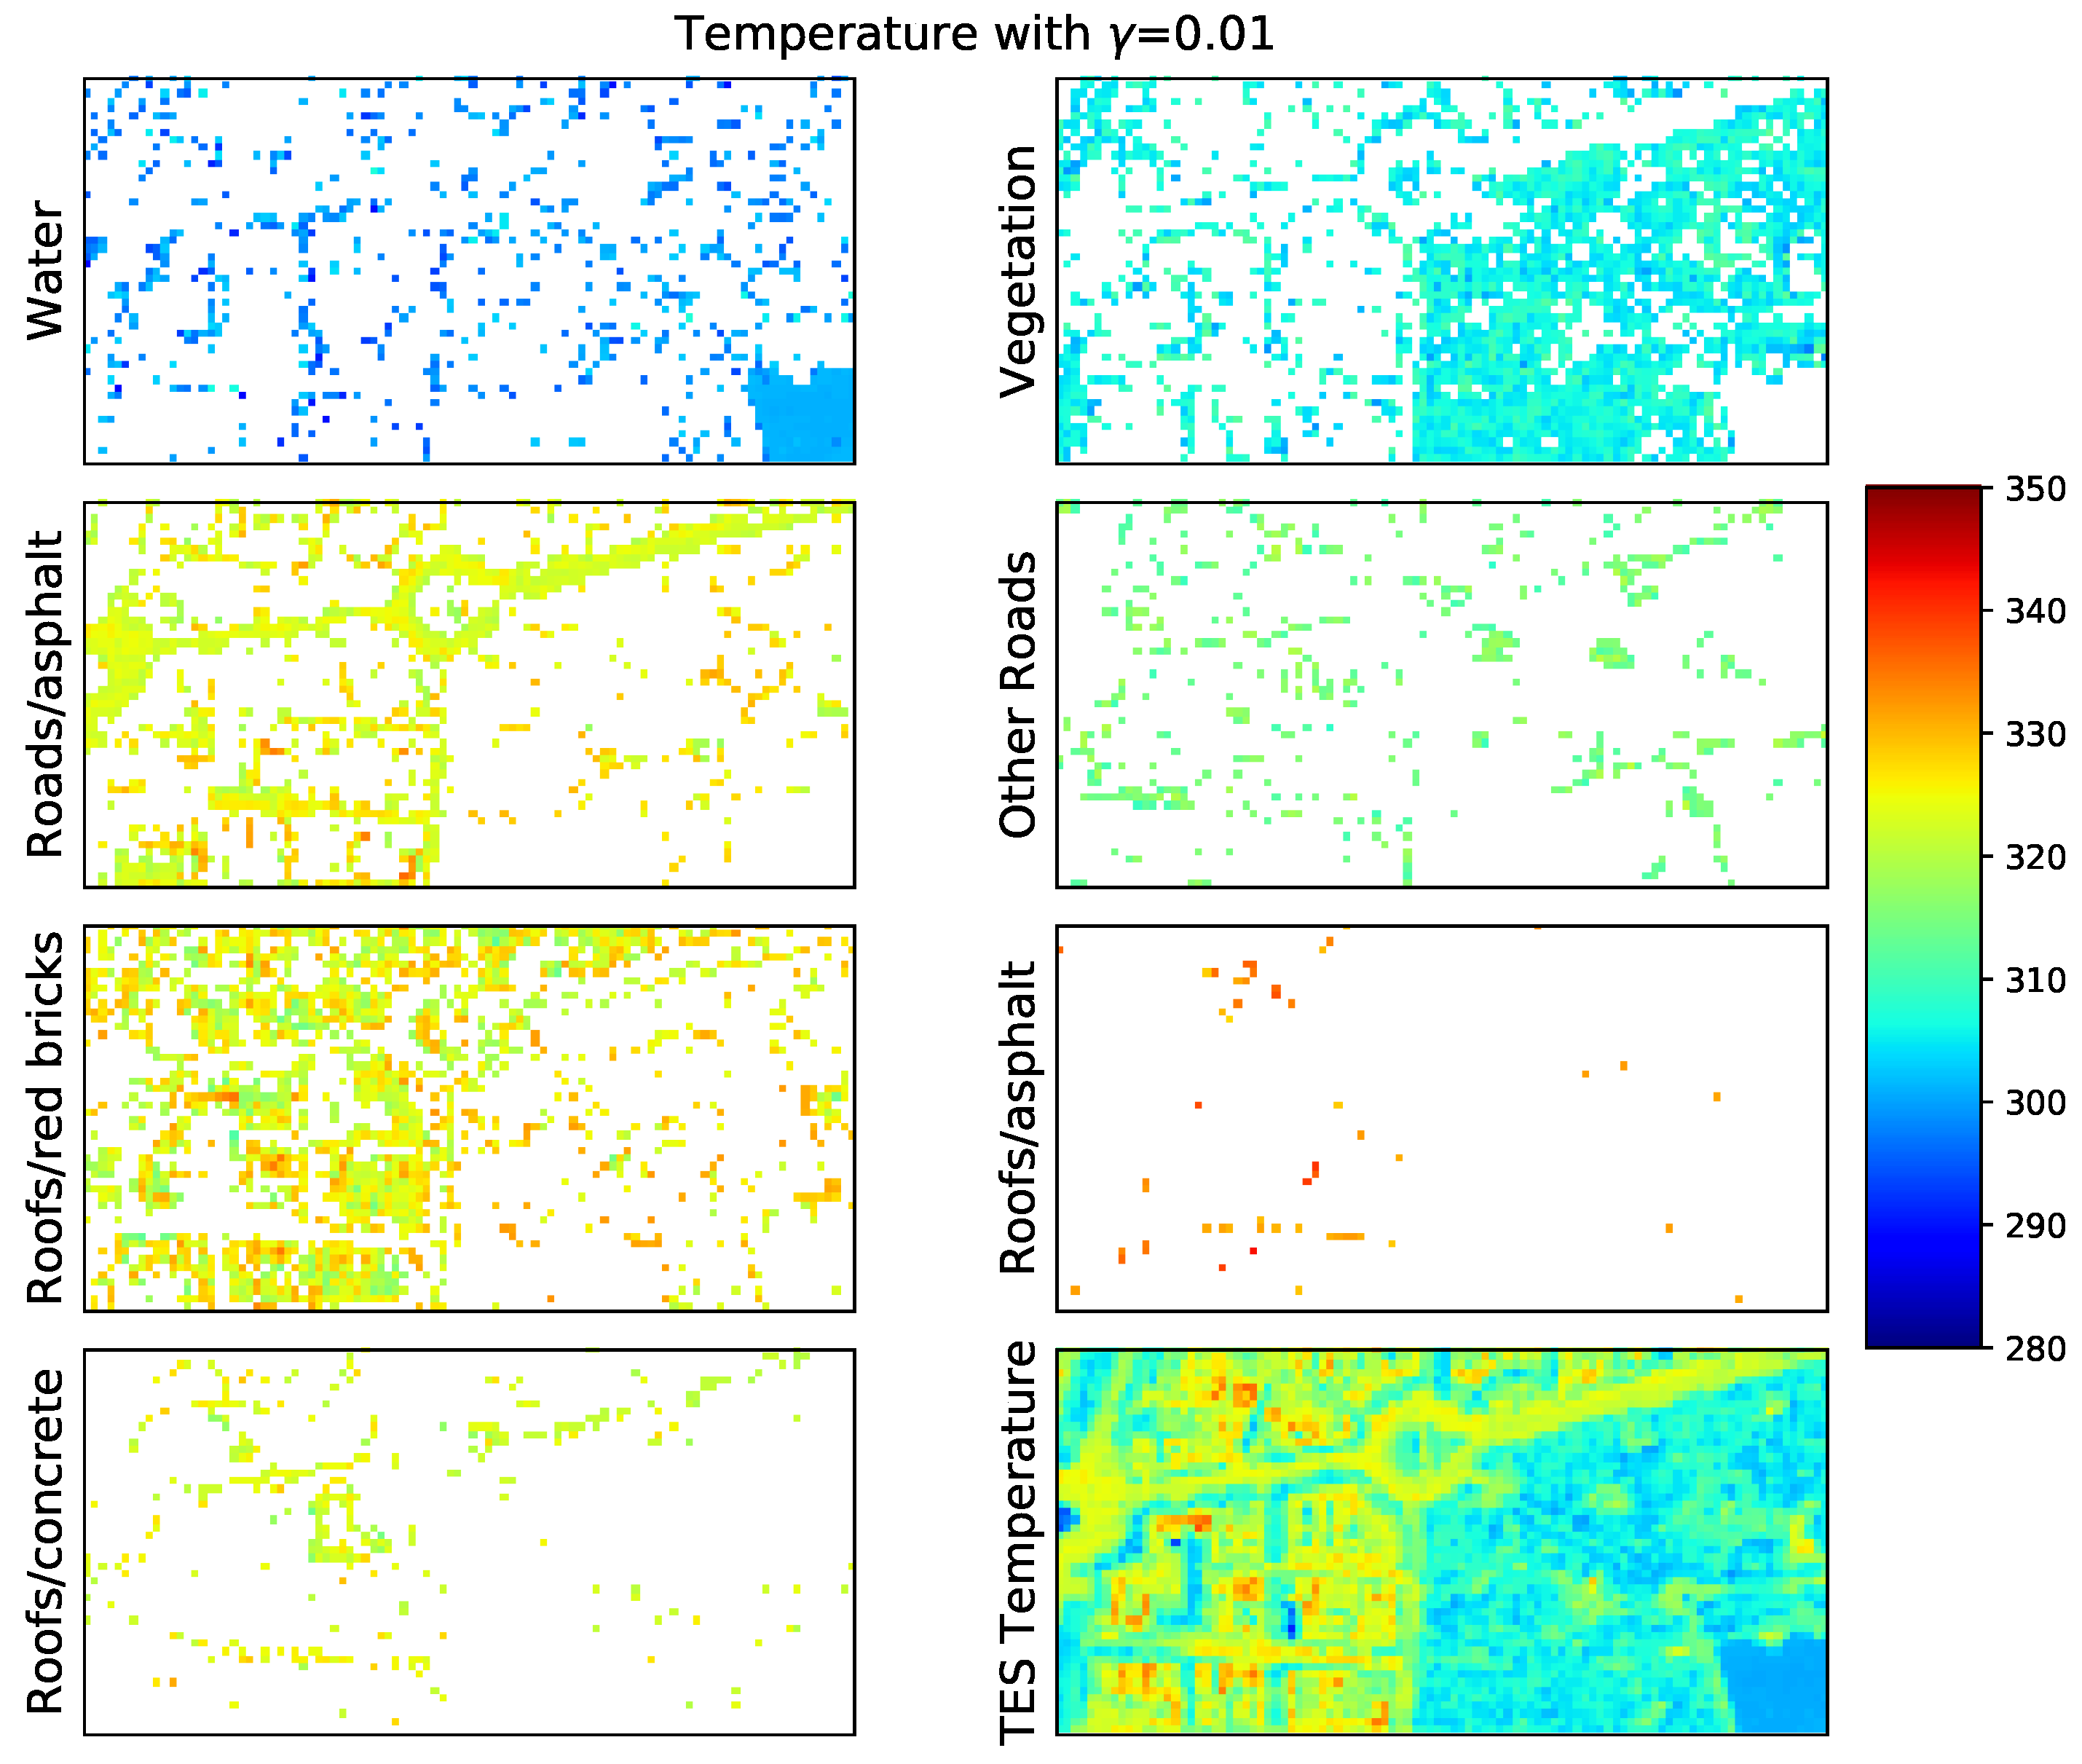
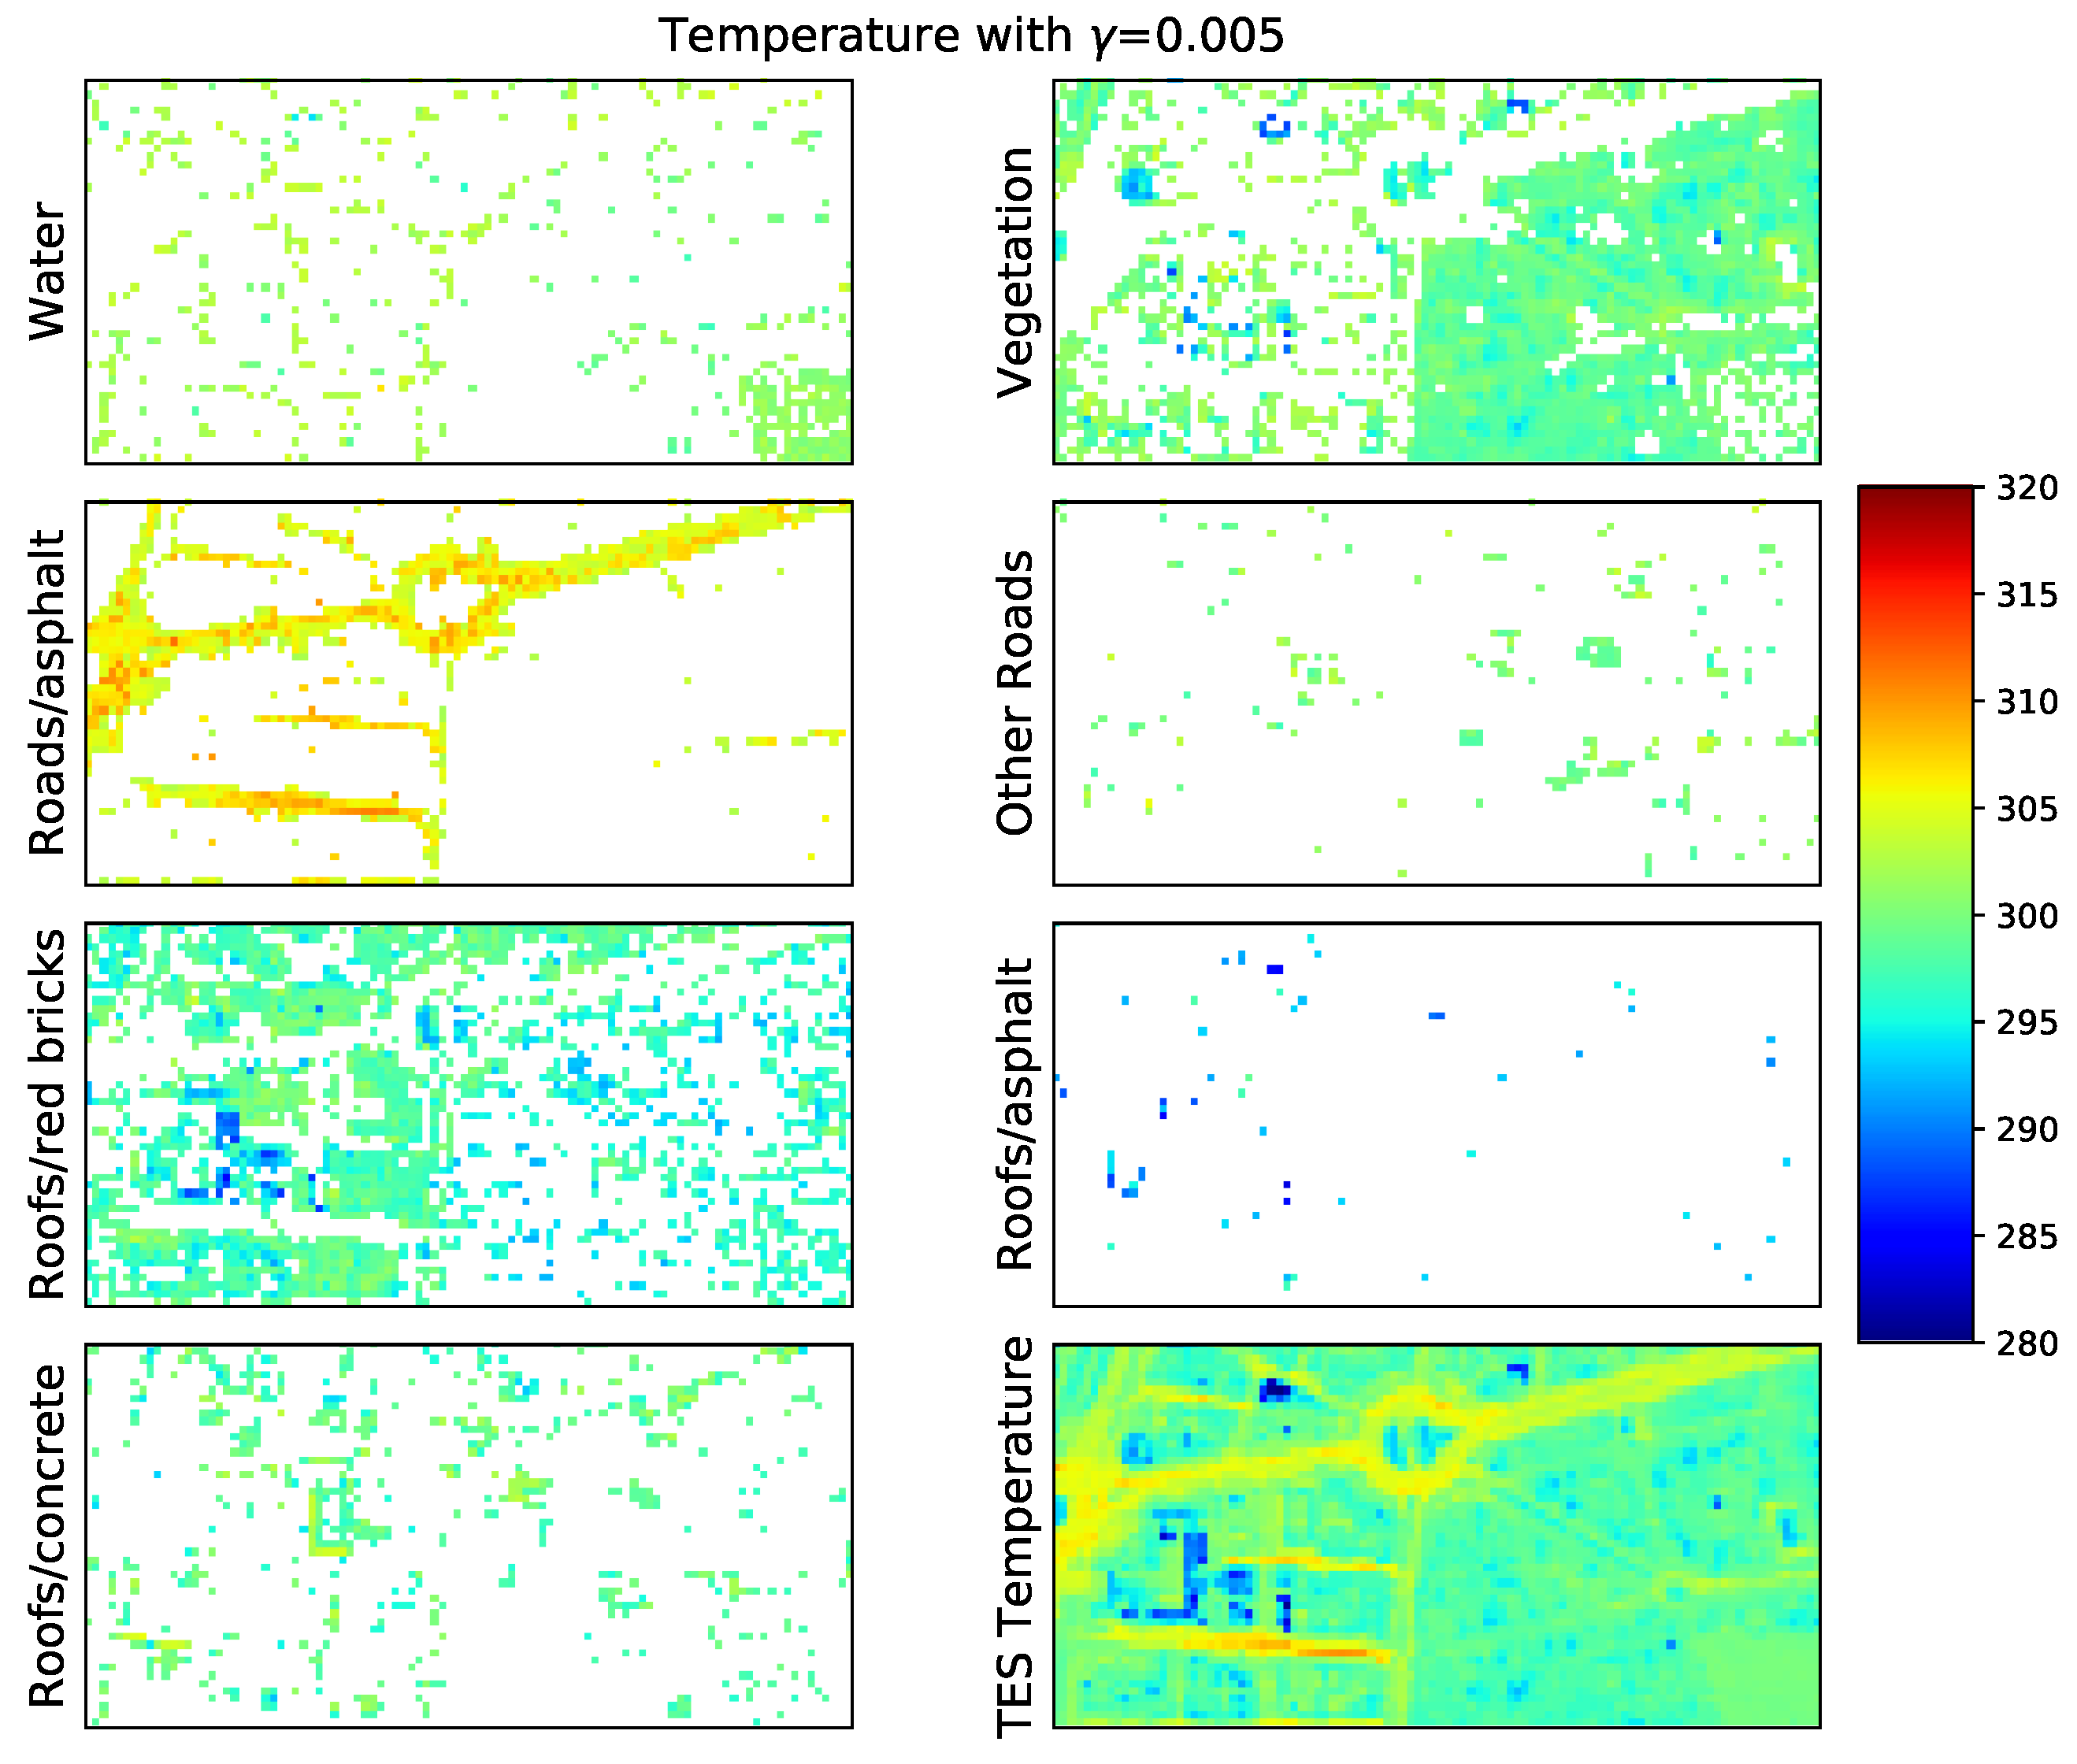
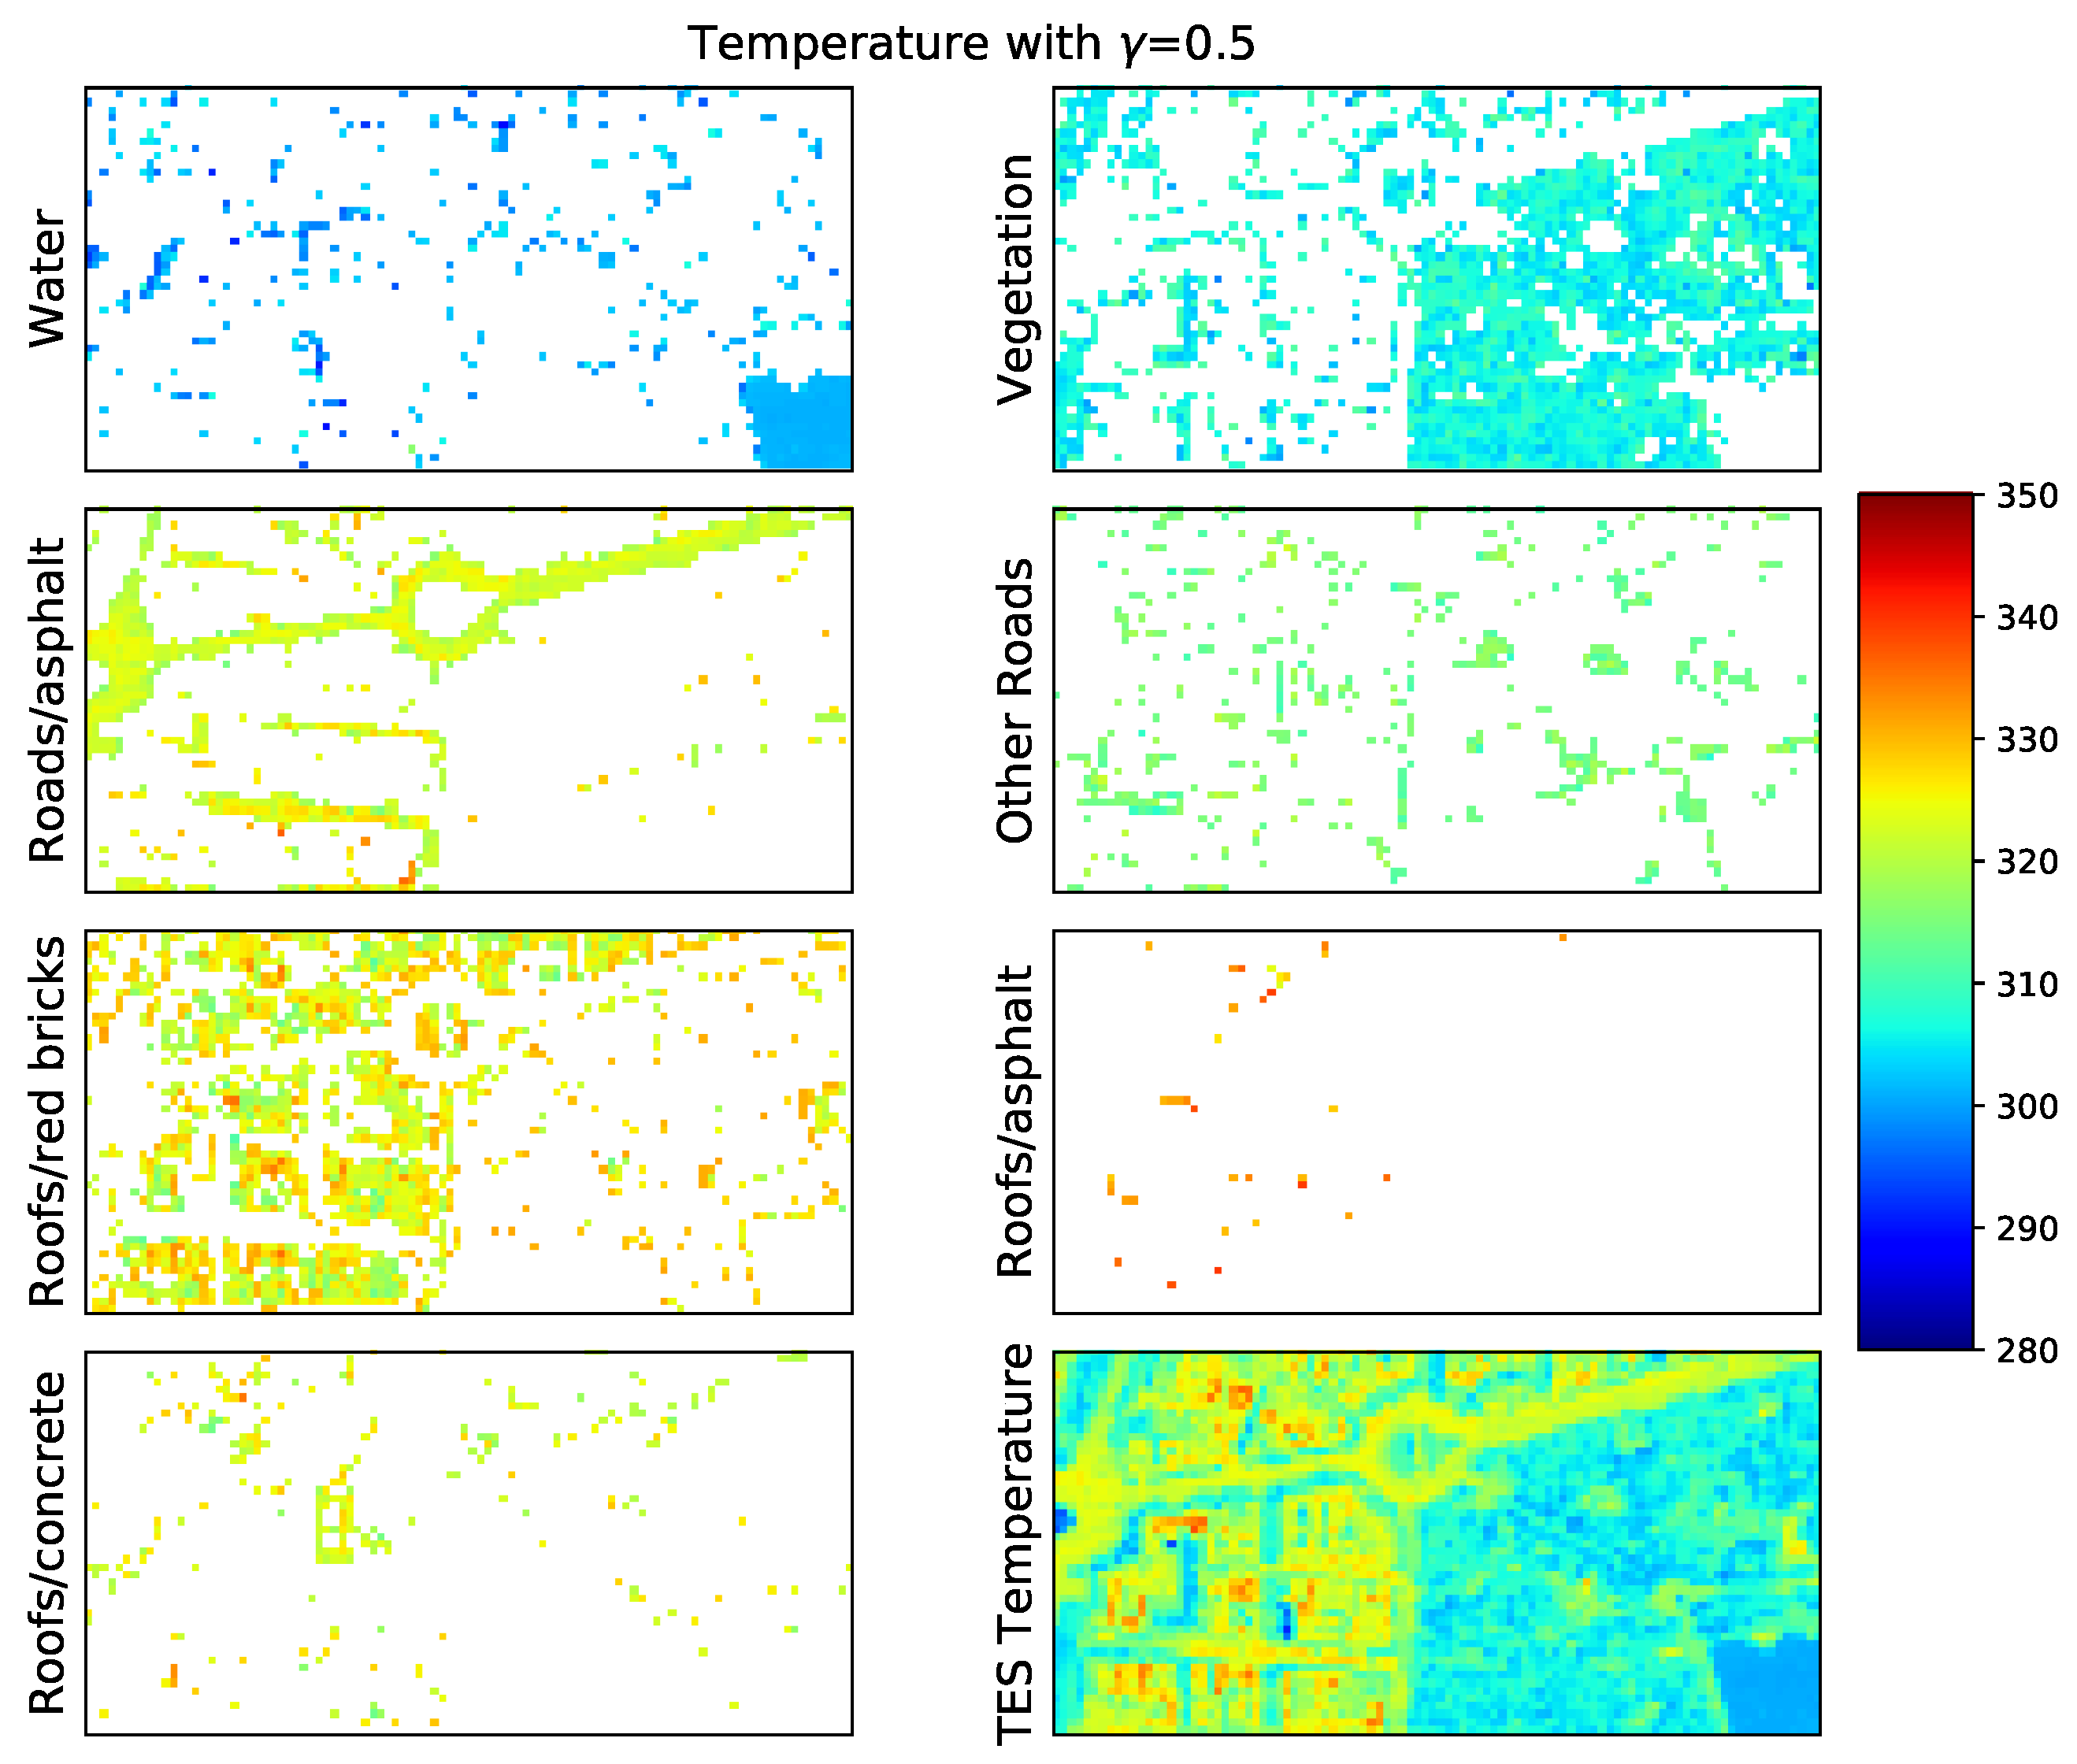
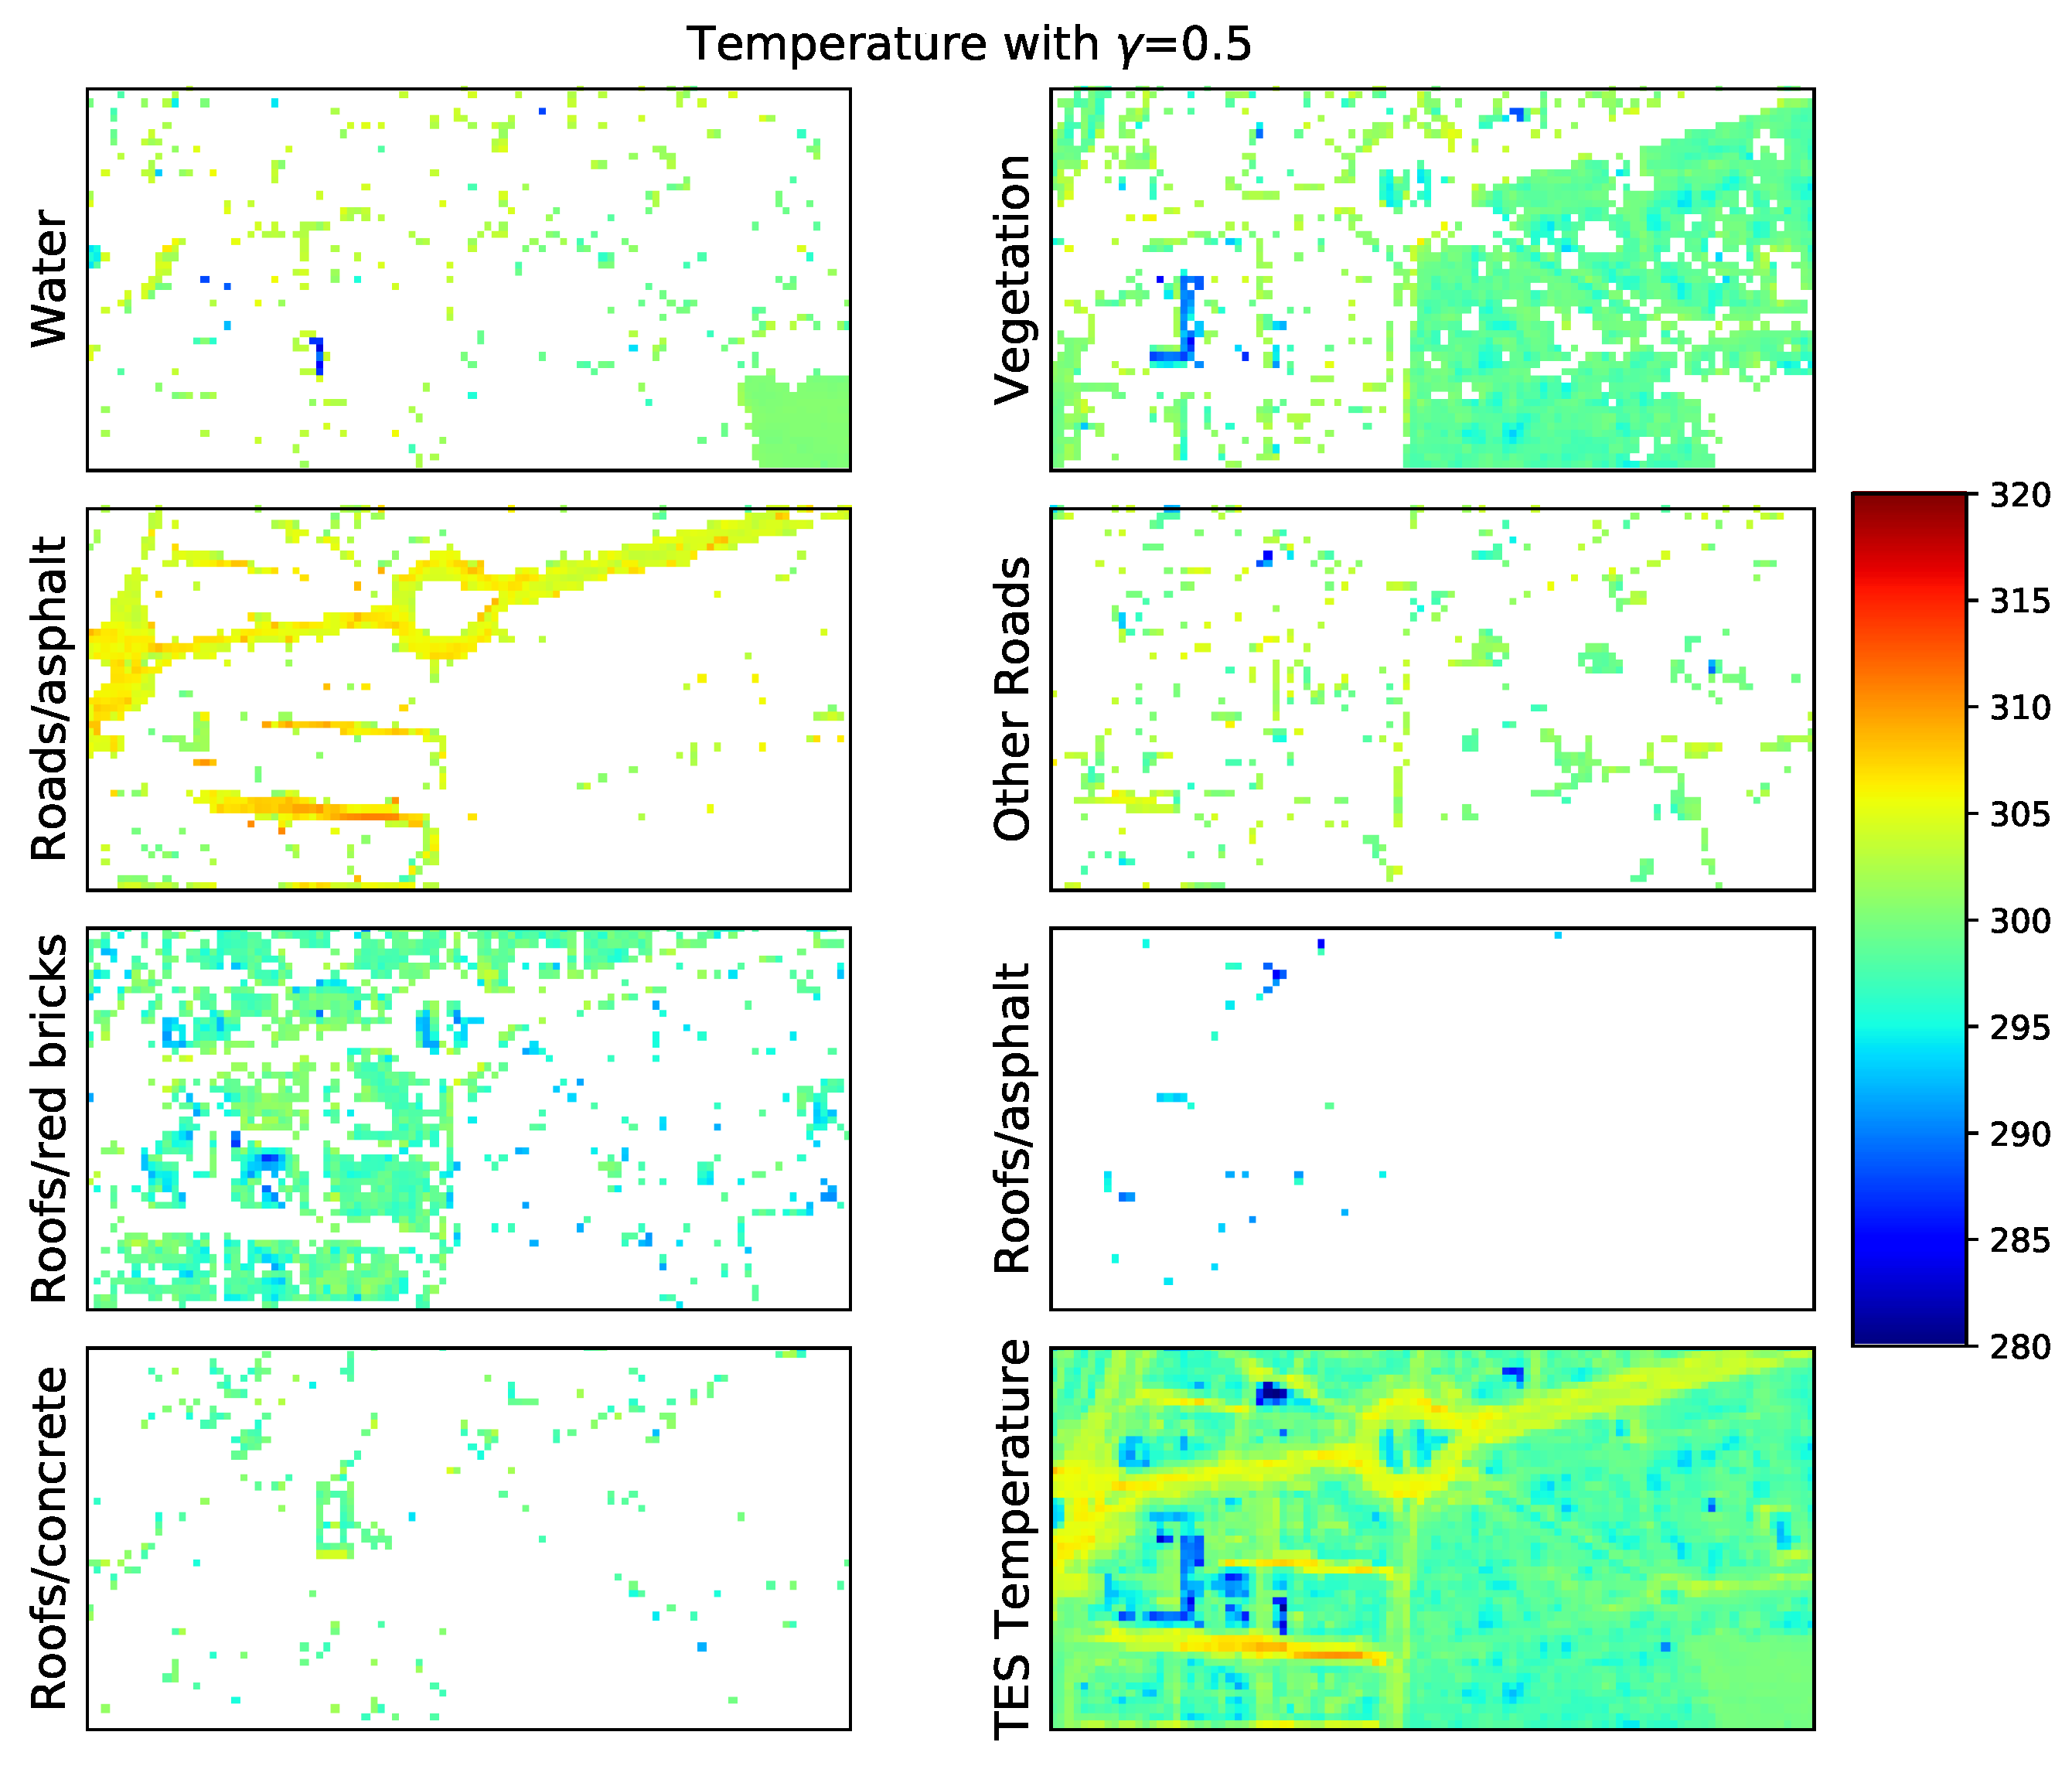
Analyzing the sign of the correlation coefficient between the abundance of a given endmember and the TES 8-m LST allows characterizing the impact of this endmember on the urban LST: negative correlations indicate that the endmember mainly cools the area, while positive correlations indicate that the endmember mainly heats the area.
Then, this study allows linking urban elements such as “roofs with red bricks”, “roofs with concrete” or “roofs with asphalt”, with high daytime temperatures and low nighttime ones, showing the low thermal inertia of these materials (see Figure 9 and Figure 13 for daytime analysis and Figure 10 and Figure 14 for nighttime analysis). Thus, the correlation coefficient between the TRUST-DNS material abundance and the TES 8-m LST for these materials during daytime is, respectively, R = 0.76 , R = 0.29 , and R = 0.42 , while during nighttime it is, R = 0.43 , R = 0.68 , and R = 0.47 . On the contrary, natural elements such as “water”, “vegetation”, and “other roads” (mainly bare soil) tend to cool the area, in particular during the day (see Figure 9 and Figure 13), with negative daytime and nighttime correlations coefficients of R = 0.91 , R = 0.78 , and R = 0.35 during daytime and R = 0.28 , R = 0.35 , and R = 0.18 during nighttime. The endmember “roads made of asphalt” seems to contribute to an increase of urban LSTs during both daytime and nighttime with R = 0.33 during daytime (see Figure 9 and Figure 13) and R = 0.39 during nighttime (see Figure 10 and Figure 14).

5.4. Further Studies

The thermal unmixing methodologies presented in this article have multiple applications in urban and building thermal studies as well as in urban land use/land cover studies. Thus, for example, both TRUST and TRUST-DNS allow enhancing classical classification maps done in the TIR domain since unmixing methods provide intrapixel LST and abundances. These intrapixel abundances will provide better estimations of impervious surfaces in urban environments. In the last years, the estimation of the impervious surface of cities has appeared as crucial for their correct sustainable development [25]. Another example is the improvement of the estimation of building thermal balances [26]. Since TRUST and TRUST-DNS provide intrapixel LSTs, they allow better delineating building borders and supplying better characterizations of building LSTs.

6. Conclusions

In this study, TRUST unmixing method was applied on DESIREX 2008 daytime and nighttime images of Madrid city center. In addition, a new version of TRUST, called TRUST-DNS for Day and Night Synergy, was developed to take advantage of available day and night images. Thus, from initial 4-m radiance images, 8-m ones were generated by aggregation. This allows using the DESIREX 2008 classification map at 4-m resolution as a reference for the abundance retrieval study. In addition, endmembers selection was based on the existing DESIREX classification, and the definition of their mean temperature and emissivity spectra was done by visually choosing 5 pixels (at 8-m resolution) per material and applying TES algorithm on these pixels. This endmembers characterization can be applied on any image without needing previous information and it was also the one chosen by Cubero-Castan et al. (2014) [16]. It was shown that both TRUST and TRUST-DNS can be applied on eight-band airborne images of urban environments at 8-m resolution. Thus, these methods provide subpixel material abundances and temperatures which are in agreement, respectively, with the DESIREX classification and the TES temperature retrieval algorithm directly applied on 8-m radiance images. In addition, it was shown that TRUST-DNS better delineates urban objects such as streets or buildings and that their unmixed temperatures outperform those from TRUST. This can be understood since day and night synergies are exploited. Hence, this paper shows the applicability of TRUST and TRUST-DNS on a challenging study case (highly heterogeneous images at 8-m resolution with eight thermal bands), compared to those previously studied by Cubero-Castan [10,11,16].
The main limitations of the proposed methodologies are: the high number of thermal bands needed (we used 8 instead of more than 30 thermal bands used in the previous works), as well as the relatively high spatial resolutions needed. This last limitation avoids the use of TRUST and TRUST-DNS on spacecraft sensors, whose spatial resolutions in the thermal domain are still, in the best case, tens of meters. Moreover, in this study, the analysis of abundance retrieval performances was limited by the rather coarse spatial resolution of the classification map used as reference, with only a factor 2 between the spatial resolutions of the processed image and the reference.
From this work, several perspectives and future research plans appear. Among them, the use of an airborne campaign with better resolution images should be envisaged to discriminate the main source of errors in the abundance retrieval performances among: (1) limited classification performances due to the presence of not considered mixed pixels at 4-m resolution; or (2) TRUST inaccuracies. Having higher than 4-m resolution initial images would allow increasing the accuracy of the classification as well as the ratio between the undersampled unmixed images and the reference. Thus, the analysis of the TRUST performances should be more precise. In addition, the main perspective of this work is the improvement of TRUST-DNS to be applied on urban environments at degraded resolutions (tens of meters). Cubero-Castan et al. (2015) [11] showed that TRUST performances strongly decrease when three pure materials are considered in a pixel. Then, in these highly heterogeneous environments, where several pure materials (more than two) are found in pixels with sizes between 100 and 1000 m 2 , TRUST is expected to provide lower performances. Nevertheless, coupling day and night images may provide supplementary constraints helping to unmix with a higher number of endmembers allowed in each pixel.

Author Contributions

Conceptualization, C.G.-B., A.M. and X.B.; methodology, C.G.-B., A.M. and X.B.; software, C.G.-B. and A.M.; validation, C.G.-B. and A.M.; formal analysis, C.G.-B., A.M., V.A. and X.B.; investigation, C.G.-B., A.M., V.A. and X.B.; writing—original draft preparation, C.G.-B.; writing—review and editing, C.G.-B., A.M., V.A. and X.B.; funding acquisition, X.B. All authors have read and agreed to the published version of the manuscript.

Funding

This research was funded by C.N.E.S in the A.P.R CATUT framework. The data has been collected under E.S.A contract number 21717/08/I-LG. The APC was funded by ONERA-DOTA.

Acknowledgments

The authors wish to thank Jose A. Sobrino for providing the DESIREX 2008 campaign data and for stimulating discussions. They also want to thank Eduardo de Miguel from INTA for stimulating discussions. The authors want also to thank C.N.E.S and ONERA for funding this research and APC.

Conflicts of Interest

The authors declare no conflict of interest.

References

  1. Core Writing Team; Pachauri, R.K.; Meyer, L.A. (Eds.) Climate Change 2014: Synthesis Report. Contribution of Working Groups I, II and III to the Fifth Assessment Report of the Intergovernmental Panel on Climate Change; Technical Report; IPCC: Geneva, Switzerland, 2014; Available online: https://www.ipcc.ch/site/assets/uploads/2018/05/SYR_AR5_FINAL_full_wcover.pdf (accessed on 8 June 2020).
  2. Zhou, D.; Xiao, J.; Bonafoni, S.; Berger, C.; Deilami, K.; Zhou, Y.; Frolking, S.; Yao, R.; Qiao, Z.; Sobrino, J. Satellite remote sensing of surface urban heat islands: Progress, challenges and perspectives. Remote Sens. 2019, 11, 48. [Google Scholar] [CrossRef] [Green Version]
  3. Robine, J.M.; Cheung, S.; Roy, S.L.; Oyen, H.V.; Griffiths, C.; Michel, J.P.; Herrmann, F. Death toll exceeded 70000 in Europe during the summer 2003. C. R. Biol. 2008, 331, 171–178. [Google Scholar] [CrossRef] [PubMed]
  4. Tiangco, M.; Lagmay, A.; Argete, J. ASTER-based study of the night-time urban heat island effect in Metro Manila. Int. J. Remote Sens. 2008, 29, 2799–2818. [Google Scholar] [CrossRef]
  5. Anniballe, R.; Bonafoni, S.; Pichierri, M. Spatial and temporal trends of the surface and air heat island over Milan using MODIS data. Remote Sens. Environ. 2014, 150, 163–171. [Google Scholar] [CrossRef]
  6. Jin, M.; Dickinson, R. Land surface skin temperature climatology: Benefitting from the strengths of satellite observations. Environ. Res. Lett. 2010, 5, 044004. [Google Scholar] [CrossRef] [Green Version]
  7. Sobrino, J.; Bianchi, R.; Paganini, M.; Sòria, G.; Jiménez-Muñoz, J.; Oltra-Carrió, R.; Mattar, C.; Romaguera, M.; Franch, B.; Hidalgo, V.; et al. DESIREX 2008: Dual-use European Security IR Experiment 2008; Technical Report; European Space Agency: Paris, Frence, 2009; Available online: https://earth.esa.int/c/document_library/get_file?folderId=21020&name=DLFE-905.pdf (accessed on 8 June 2020).
  8. Sobrino, J.; Oltra-Carrió, R.; Sòria-Barres, G.; Jiménez-Muñoz, J.C.; Franch, B.; Hidalgo, V.; Mattar, C.; Julien, Y.; Cuenca, J.; Romaguera, M.; et al. Evaluation of the surface urban heat island effect in the city of Madrid by thermal remote sensing. Int. J. Remote Sens. 2013, 34. [Google Scholar] [CrossRef]
  9. Deng, C.; Wu, C. Estimating very high resolution urban surface temperature using a spectral unmixing and thermal mixing approach. Int. J. Appl. Earth Obs. Geoinf. 2013, 23, 155–164. [Google Scholar] [CrossRef]
  10. Cubero-Castan, M.; Briottet, X.; Achard, V.; Chanussot, J. Physic based aggregation model for the unmixing of temperature and optical properties in the infrared domain. In Proceedings of the 4th Workshop on Hyperspectral Image and Signal Processing (WHISPERS), Shanghai, China, 4–7 June 2012. [Google Scholar]
  11. Cubero-Castan, M.; Chanussot, J.; Achard, V.; Briottet, X.; Shimoni, M. A physics-based unmixing method to estimate subpixel temperatures on mixed pixels. IEEE Trans. Geosci. Remote Sens. 2015, 53, 1894–1904. [Google Scholar] [CrossRef]
  12. Heinz, D.C.; Chang, C.I. Fully constrained least squares linear spectral mixture analysis method for material quantification in hyperspectral imagery. IEEE Trans. Geosci. Remote Sens. 2001, 39, 529–545. [Google Scholar] [CrossRef] [Green Version]
  13. Naughton, J.; McDonald, W. Evaluating the variability of urban land surface temperatures using drone observations. Remote Sens. 2019, 11, 1722. [Google Scholar] [CrossRef] [Green Version]
  14. Collins, E.F.; Roberts, D.A.; Borel, C.C. Spectral mixture analysis of simulated thermal infrared spectrometry data: An initial temperature estimated bounded TESSMA search approach. IEEE Trans. Geosci. Remote Sens. 2001, 39, 1435–1446. [Google Scholar] [CrossRef] [Green Version]
  15. Li, Z.L.; Tang, B.H.; Wu, H.; Ren, H.; Yan, G.; Wan, Z.; Trigo, I.F.; Sobrino, J.A. Satellite-derived land surface temperature: Current status and perspectives. Remote Sens. Environ. 2013, 131, 14–37. [Google Scholar] [CrossRef] [Green Version]
  16. Cubero-Castan, M. Étude du démélange en imagerie hyperspectrale infrarouge. Ph.D. Thesis, Université de Grenoble, Grenoble, France, 2014. [Google Scholar]
  17. Sobrino, J.; Bianchi, R.; Paganini, M.; Sòria, G.; Oltra-Carrió, R.; Romaguera, M.; Jiménez-Muñoz, J.; Cuenca, J.; Hidalgo, V.; Franch, B.; et al. Urban heat island and urban thermography project DESIREX 2008. In Proceedings of the 33rd International Symposium on Remote Sensing of Environment, ISRSE, Stresa, Italy, 4–8 May 2009. [Google Scholar]
  18. Sobrino, J.A.; Oltra-Carrio, R.; Jimenez-Muñoz, J.C.; Julien, Y.; Soria, G.; Franch, B.; Mattar, C. Emissivity mapping over urban areas using a classification-based approach: Application to the Dual-use Eropean Security IR Experiment (DESIREX). Int. J. Appl. Earth Obs. Geoinf. 2012, 18, 141–147. [Google Scholar] [CrossRef]
  19. Fawcett, T. An introduction to ROC analysis. Pattern Recognit. Lett. 2006, 27, 861–874. [Google Scholar] [CrossRef]
  20. Oltra-Carrió, R. Thermal remote sensing of urban areas. The case study of the Urban Heat Island of Madrid. Ph.D. Thesis, Universitat de Valencia, Valencia, Spain, 2013. [Google Scholar]
  21. Miesch, C.; Poutier, L.; Achard, V.; Briottet, X.; Lenot, X.; Boucher, Y. Direct and inverse radiative transfer solutions for visible and near-infrared hyperspectral imagery. IEEE Trans. Geosci. Remote Sens. 2005, 43, 1552–1562. [Google Scholar] [CrossRef]
  22. Plyer, A.; Colin-Koeniguer, E.; Weissgerber, F. A new coregistration algorithm for recent applications on urban SAR images. IEEE Geosci. Remote Sens. Lett. 2015, 12, 2198–2202. [Google Scholar] [CrossRef]
  23. Gillespie, A.; Rokugawa, S.; Matsunaga, T.; Cothern, J.S.; Hook, S.; Kahle, A.B. A temperature and emissivity separation algortihm for Advanced Spaceborn Thermal Emission and Reflection radiometer (ASTER) images. IEEE Trans. Geosci. Remote Sens. 1998, 36, 1113–1126. [Google Scholar] [CrossRef]
  24. Kay, S.M. Fundamentals of Statistical Signal Processing: Estimation Theory; Prentice Hall PTR: Upper Saddle River, NJ, USA, 1993. [Google Scholar]
  25. Hua, L.; Zhang, X.; Nie, Q.; Sun, F.; Tang, L. The impacts of the expansion of urban impervious surfaces on Urban Heat Islands in a coastal city in China. Sustainability 2020, 12, 475. [Google Scholar] [CrossRef] [Green Version]
  26. Malys, L.; Musy, M.; Inard, C. Microclimate and building energy consumption: Study of different coupling methods. Adv. Build. Energy Res. 2015, 9, 151–174. [Google Scholar] [CrossRef]
Figure 1. A Google Earth image of the study area location. The study area is the Madrid city center in the Madrid department of Spain.
Remotesensing 12 01871 g001
Figure 2. AHS image of Madrid city center from 4 July. RGB colors have been composed with AHS reflective images from 0.629, 0.542, and 0.456 μ m. The red square delimits the studied area. Color dots indicate the position of the pixels used to define pure materials in the TRUST methodology (see Section 3). Dark blue dots indicate “water” pixels, cyan shows “other roads” pixels, green indicates “vegetation” pixels, black indicates “impervious roads”, magenta indicates “roofs made of red bricks”, orange indicates “roofs made of asphalt”, and purple indicates “roofs made of concrete”.
Remotesensing 12 01871 g002
Figure 3. (Left) RGB AHS images of Madrid city center at 4-m resolution (a) and 8-m (c) resolution. (Right) DESIREX classification map at 4-m resolution (b) and undersampled classification map at 8-m resolution (d).
Remotesensing 12 01871 g003
Figure 4. TRUST-DNS methodology diagram. R B O A λ is the bottom of atmosphere radiance at wavelength λ , ϵ m and T ¯ m are the emissivity and the mean temperature used to characterize each endmember m, S m is the abundance of each endmember m, D T is the minimized reconstruction error in TRUST, and D D N S is the minimized reconstruction error in TRUST-DNS.
Remotesensing 12 01871 g004
Figure 5. Emissivity spectra of pure materials found in the studied area with TES over day (a) and night (b) images.
Remotesensing 12 01871 g005
Figure 6. Abundance errors on pure pixels δ S p u r e (a); abundance errors on mixed pixels δ S m i x e d (b); and temperature errors δ T (c). All three are functions of the logarithm of the hyperparameter γ , and for TRUST on day image, TRUST on night image, TRUST-DNS on day image, and TRUST-DNS on night image.
Remotesensing 12 01871 g006
Figure 7. TRUST day abundances map at 8 m for each considered material together with the DESIREX classification undersampled at 8 m.
Remotesensing 12 01871 g007
Figure 8. TRUST night abundances map at 8 m for each considered material together with the DESIREX classification undersampled at 8 m.
Remotesensing 12 01871 g008
Figure 9. TRUST-DNS day abundances map at 8 m for each considered material together with the DESIREX classification undersampled at 8 m.
Remotesensing 12 01871 g009
Figure 10. TRUST-DNS night abundances map at 8 m for each considered material together with the DESIREX classification undersampled at 8 m.
Remotesensing 12 01871 g010
Figure 11. TRUST day temperatures map at 8 m for each considered material together with the TES temperature at 8 m.
Remotesensing 12 01871 g011
Figure 12. TRUST night temperatures map at 8 m for each considered material together with the TES temperature at 8 m.
Remotesensing 12 01871 g012
Figure 13. TRUST-DNS day temperatures map at 8 m for each considered material together with the TES temperature at 8 m.
Remotesensing 12 01871 g013
Figure 14. TRUST-DNS night temperatures map at 8 m for each considered material together with the TES temperature at 8 m.
Remotesensing 12 01871 g014
Table 1. Spectral configuration of thermal AHS bands.
AHS BandWavelength CenterFWHM
Band 718.180 μ m0.370 μ m
Band 728.660 μ m0.390 μ m
Band 739.150 μ m0.410 μ m
Band 749.600 μ m0.430 μ m
Band 7510.070 μ m0.420 μ m
Band 7610.590 μ m0.550 μ m
Band 7711.180 μ m0.560 μ m
Band 7811.780 μ m0.560 μ m
Band 7912.350 μ m0.480 μ m
Band 8012.930 μ m0.490 μ m
Table 2. Classes’ accuracies of the used DESIREX classification image from 4 July.
ClassAccuracy
Water (lakes)1
Water (Pools)0.99
Trees0.93
Green grass0.99
Bright bare soil0.94
Dark bare soil0.88
Roads with asphalt0.94
Other roads0.82
Roofs with asphalt0.97
Roofs with red bricks0.90
Roofs with concrete0.89
Roofs with metal0.99
Table 3. Mean temperatures ( T m ¯ ) of pure materials found in the studied area with TES on day and night images. The standard deviation is indicated within brackets.
MaterialDay Mean Temperature (K)Night Mean Temperature (K)
Water301 (0.3)300 (0.2)
Vegetation306 (2.0)298 (1.0)
Roads made of asphalt324 (1.6)305 (2.3)
Other roads315 (1.4)300 (1.2)
Roofs made of red bricks323 (0.8)296 (0.8)
Roofs made of asphalt331 (5.0)293 (1.4)
Roofs made of concrete323 (1.8)297 (0.9)

