Article

Analyzing Water Dynamics Based on Sentinel-1 Time Series—a Study for Dongting Lake Wetlands in China

1
German Aerospace Center (DLR), Earth Observation Center (EOC), German Remote Sensing Data Center (DFD), 82234 Wessling, Germany
2
Strasbourg University, ICube-SERTIT, Parc d’Innovation, 300 Boulevard Sébastien Brant, 67412 Illkirch-Graffenstaden, France
3
Key Laboratory of Watershed Geographic Sciences, Nanjing Institute of Geography and Limnology, CAS, Nanjing 210008, China
4
Christian-Albrechts-University Kiel, Institute for Geography, 24098 Kiel, Germany
5
Chair of Remote Sensing, Institute for Geography and Geology, University of Wuerzburg, Am Hubland, 97074 Wuerzburg, Germany
*
Author to whom correspondence should be addressed.
Remote Sens. 2020, 12(11), 1761; https://doi.org/10.3390/rs12111761
Submission received: 8 April 2020 / Revised: 18 May 2020 / Accepted: 26 May 2020 / Published: 29 May 2020
(This article belongs to the Section Environmental Remote Sensing)

Abstract

:
In China, freshwater is an increasingly scarce resource and wetlands are under great pressure. This study focuses on China’s second largest freshwater lake in the middle reaches of the Yangtze River—the Dongting Lake—and its surrounding wetlands, which are declared a protected Ramsar site. The Dongting Lake area is also a research region of focus within the Sino-European Dragon Programme, aiming for the international collaboration of Earth Observation researchers. ESA’s Copernicus Programme enables comprehensive monitoring with area-wide coverage, which is especially advantageous for large wetlands that are difficult to access during floods. The first year completely covered by Sentinel-1 SAR satellite data was 2016, which is used here to focus on Dongting Lake’s wetland dynamics. The well-established, threshold-based approach and the high spatio-temporal resolution of Sentinel-1 imagery enabled the generation of monthly surface water maps and the analysis of the inundation frequency at a 10 m resolution. The maximum extent of the Dongting Lake derived from Sentinel-1 occurred in July 2016, at 2465 km2, indicating an extreme flood year. The minimum size of the lake was detected in October, at 1331 km2. Time series analysis reveals detailed inundation patterns and small-scale structures within the lake that were not known from previous studies. Sentinel-1 also proves to be capable of mapping the wetland management practices for Dongting Lake polders and dykes. For validation, the lake extent and inundation duration derived from the Sentinel-1 data were compared with excerpts from the Global WaterPack (frequently derived by the German Aerospace Center, DLR), high-resolution optical data, and in situ water level data, which showed very good agreement for the period studied. The mean monthly extent of the lake in 2016 from Sentinel-1 was 1798 km2, which is consistent with the Global WaterPack, deviating by only 4%. In summary, the presented analysis of the complete annual time series of the Sentinel-1 data provides information on the monthly behavior of water expansion, which is of interest and relevance to local authorities involved in water resource management tasks in the region, as well as to wetland conservationists concerned with the Ramsar site wetlands of Dongting Lake and to local researchers.

Graphical Abstract

1. Introduction

Wetlands are among the most productive and diverse ecosystems on earth, providing a large part of our fresh water [1] and supplying a variety of ecosystem services that contribute to human well-being, including the provision of fish and fiber, water supply, water treatment, climate regulation, flood control, coastal protection and recreation [2].
The mapping and monitoring of wetlands is a crucial endeavor for environmental assessments, resource management, and policy making. Synthetic Aperture Radar (SAR) satellite data are a highly suited data source for mapping surface water and wetlands due to the inherent characteristics of microwaves, such as the specular reflection on water surfaces [3]. SAR sensors are active systems that are independent of solar illumination, and microwaves penetrate most clouds, water vapor and rain, so the data acquisition is independent of climate or weather. Although a number of studies on water surface mapping based on optical data exist [4,5,6,7,8,9], SAR-based studies outnumber these. Space-borne SAR sensors suited for surface water detection and monitoring include the European ENVISAT ASAR (European Environmental Satellite, Advanced Synthetic Aperture Radar; however, only operational until 2012), the Canadian Radarsat-1/2, the Japanese ALOS Palsar (Advanced Land Observing Satellite-Phased Array type L-band Synthetic Aperture Radar), the Italian COSMO-SkyMed, the German TerraSAR-X/TanDEM-X, and the latest SAR satellites launched by the European Copernicus Program, Sentinel-1A and B. Sentinel-1 satellite data with simultaneously high spatial and high temporal resolution are of great advantage for the area-wide detection of the water surface changes of large ecosystems exposed to frequent inundation. SAR data have been employed extensively for the mapping of stable inland water bodies [10,11,12], the monitoring of floods [13,14,15], the assessment of natural inundation patterns in wetlands [16,17,18,19], and the analyses of managed wetlands such as irrigated rice fields [20,21,22]. Various studies have been published on the analyses of one or a few multi-temporal scenes [19,23,24,25,26,27,28], and some studies have also addressed extensive time series analyses, such as Kuenzer et al. [18,29]. In previous studies, all available SAR polarizations, modes and frequencies were used, whereas Mahdavi et al. [30] explicitly recommended the use of HH(horizontal transmit and horizontal receive) polarization and ascending mode for wetland mapping.
In addition, the inter-annual and intra-annual inundation patterns of several lake environments worldwide change very fast [8]. The mapping of large floodpath lakes [31], such as Dongting Lake in China, was recently conducted with time series information based on high temporal resolution MODIS data at low spatial resolution [32,33,34,35,36,37,38]. Further studies were conducted additionally incorporating Envisat ASAR [39,40] and altimetry data [32]. Although previous studies on Dongting Lake led to comprehensive time series analyses on the extent of the lake, almost all of them reported limitations due to the low spatial resolution of the available data [33,34,35,36,38,40]. Wu and Liu [36] also reported on the complex spectral conditions of the lake water when only optical data were used. Wang et al. [35], Hu et al. [40], and Wang and Yesou [31] clearly point out limitations for the collection of ground truth information, which result from the dynamics of the lake extent and water levels. Since cloud cover also impedes the analysis of optical data, Xing et al. [38] and Wang and Yesou [31] propose the use of active SAR sensors.
For this reason, the first analysis of the complete Sentinel-1 time series of the year 2016 is presented here to assess Dongting Lake’s monthly inundation patterns at high spatial and temporal resolution.

2. Data and Methodology

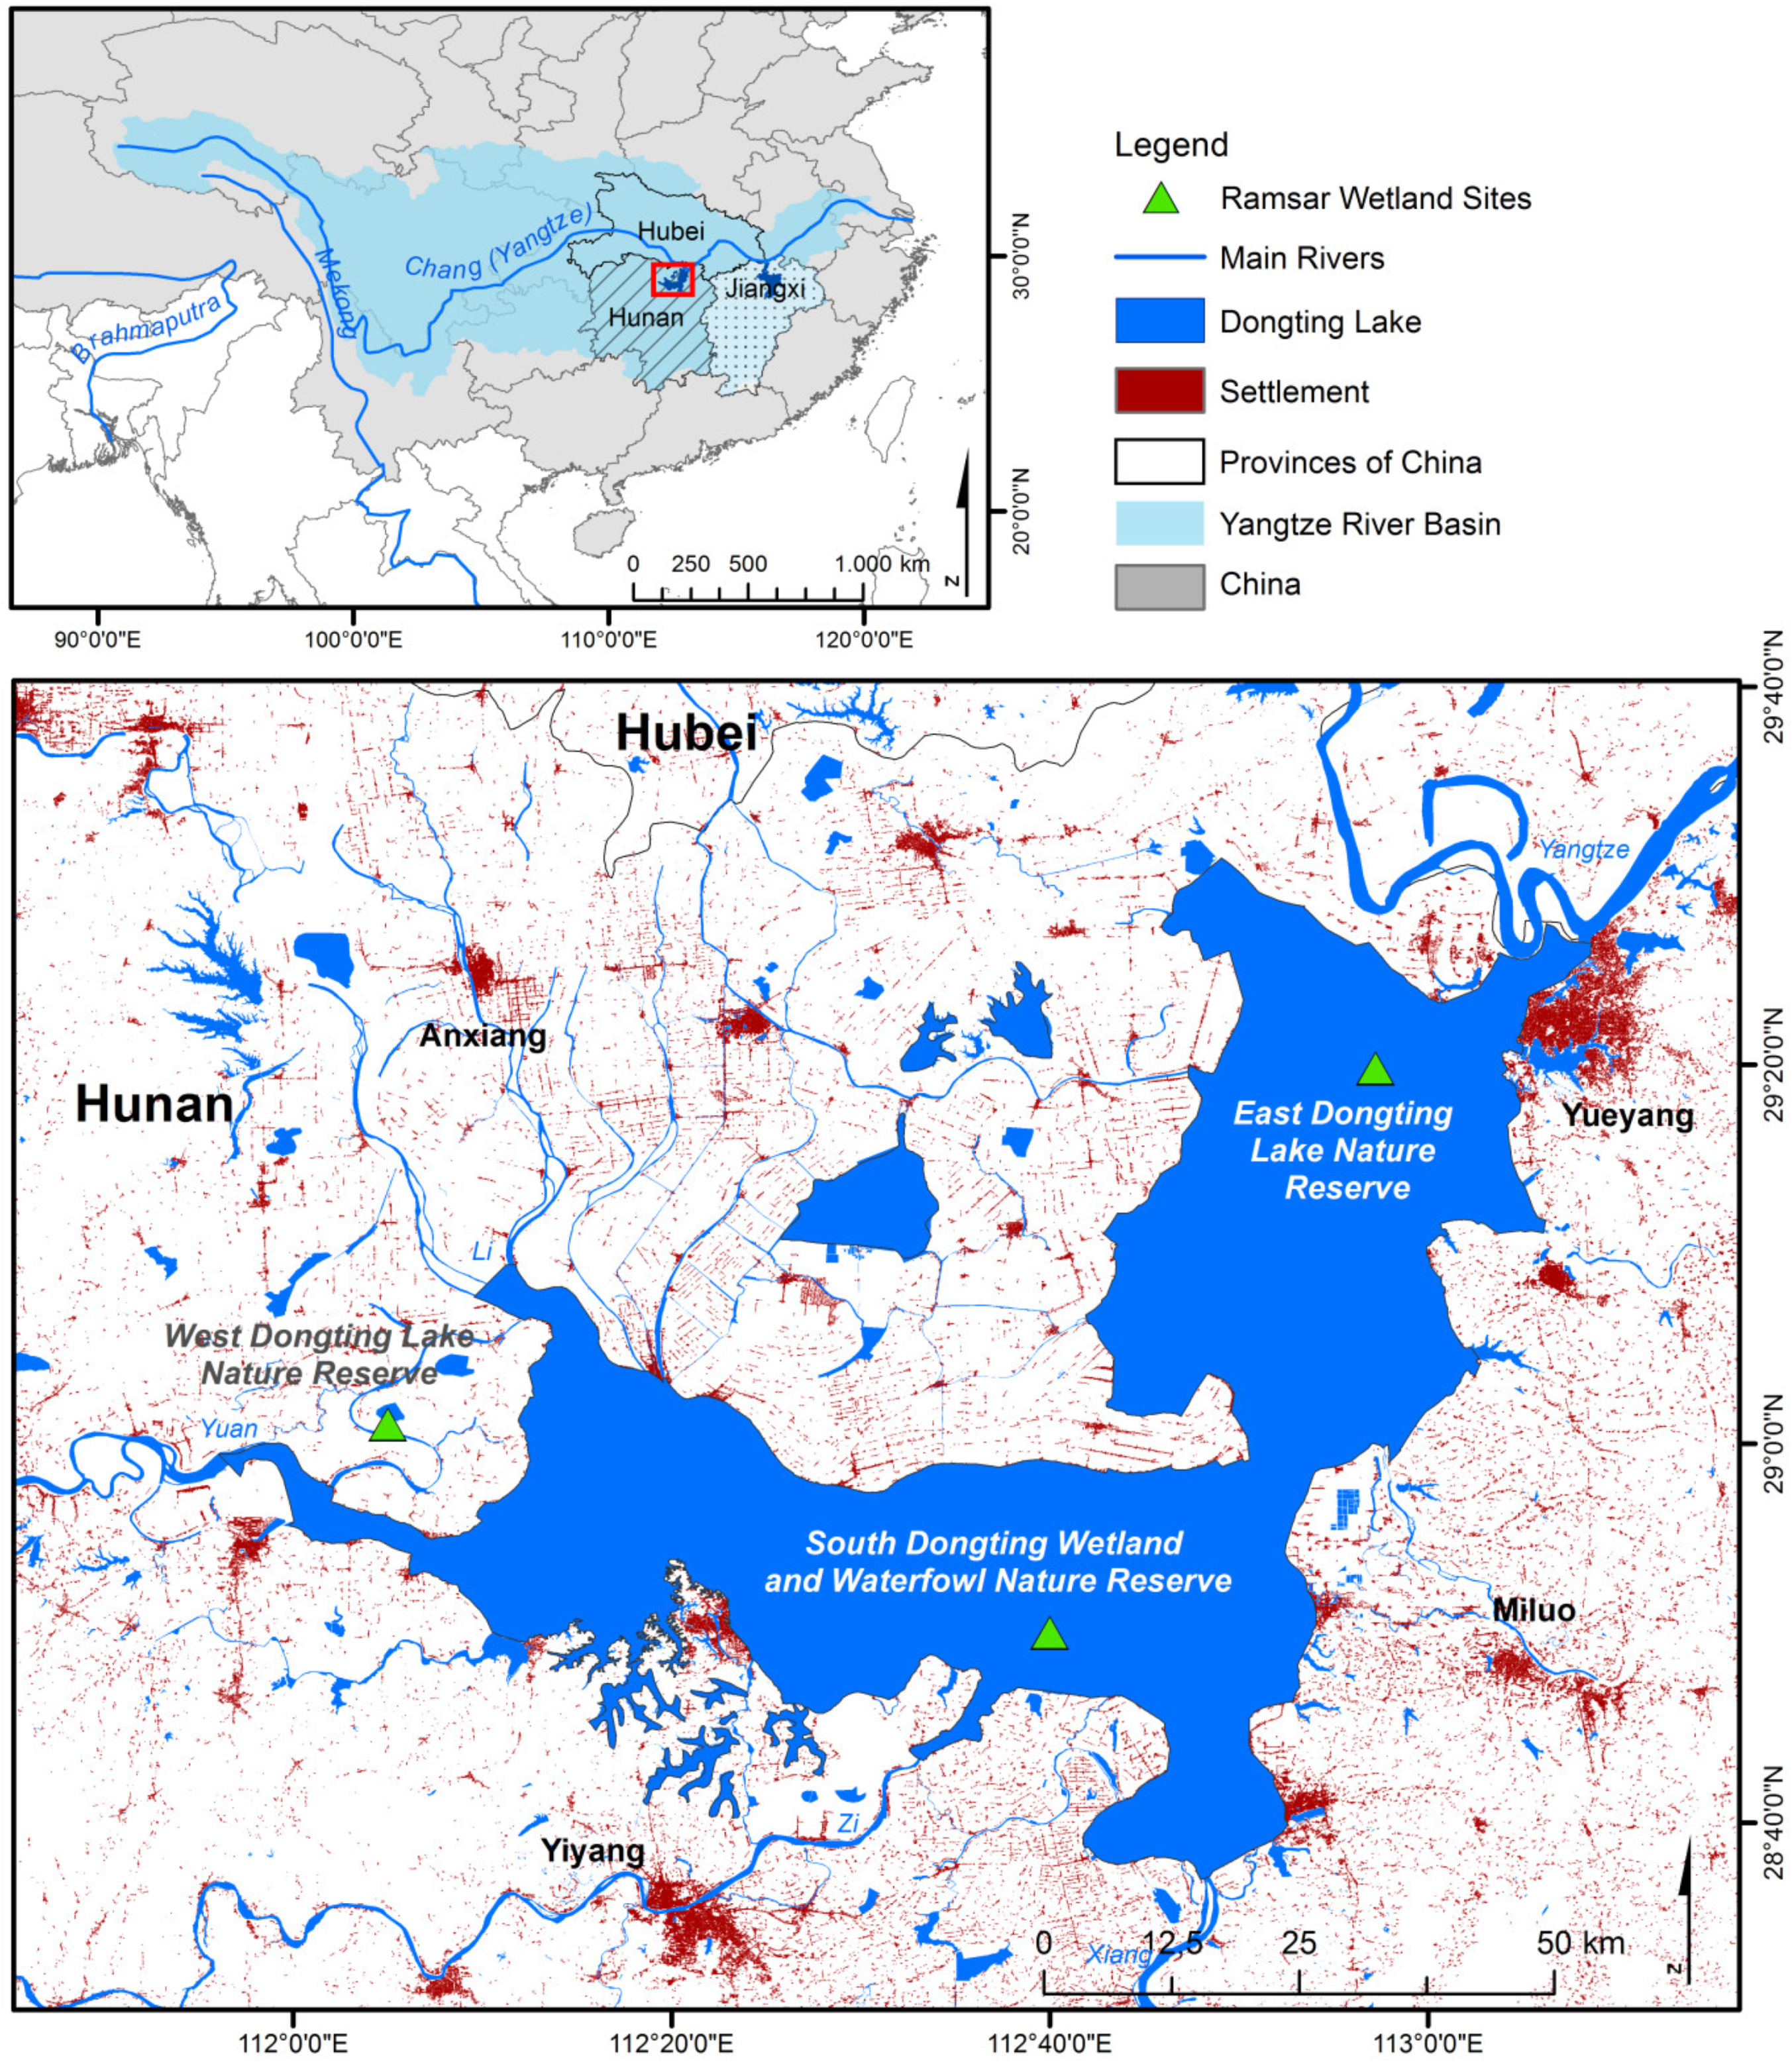
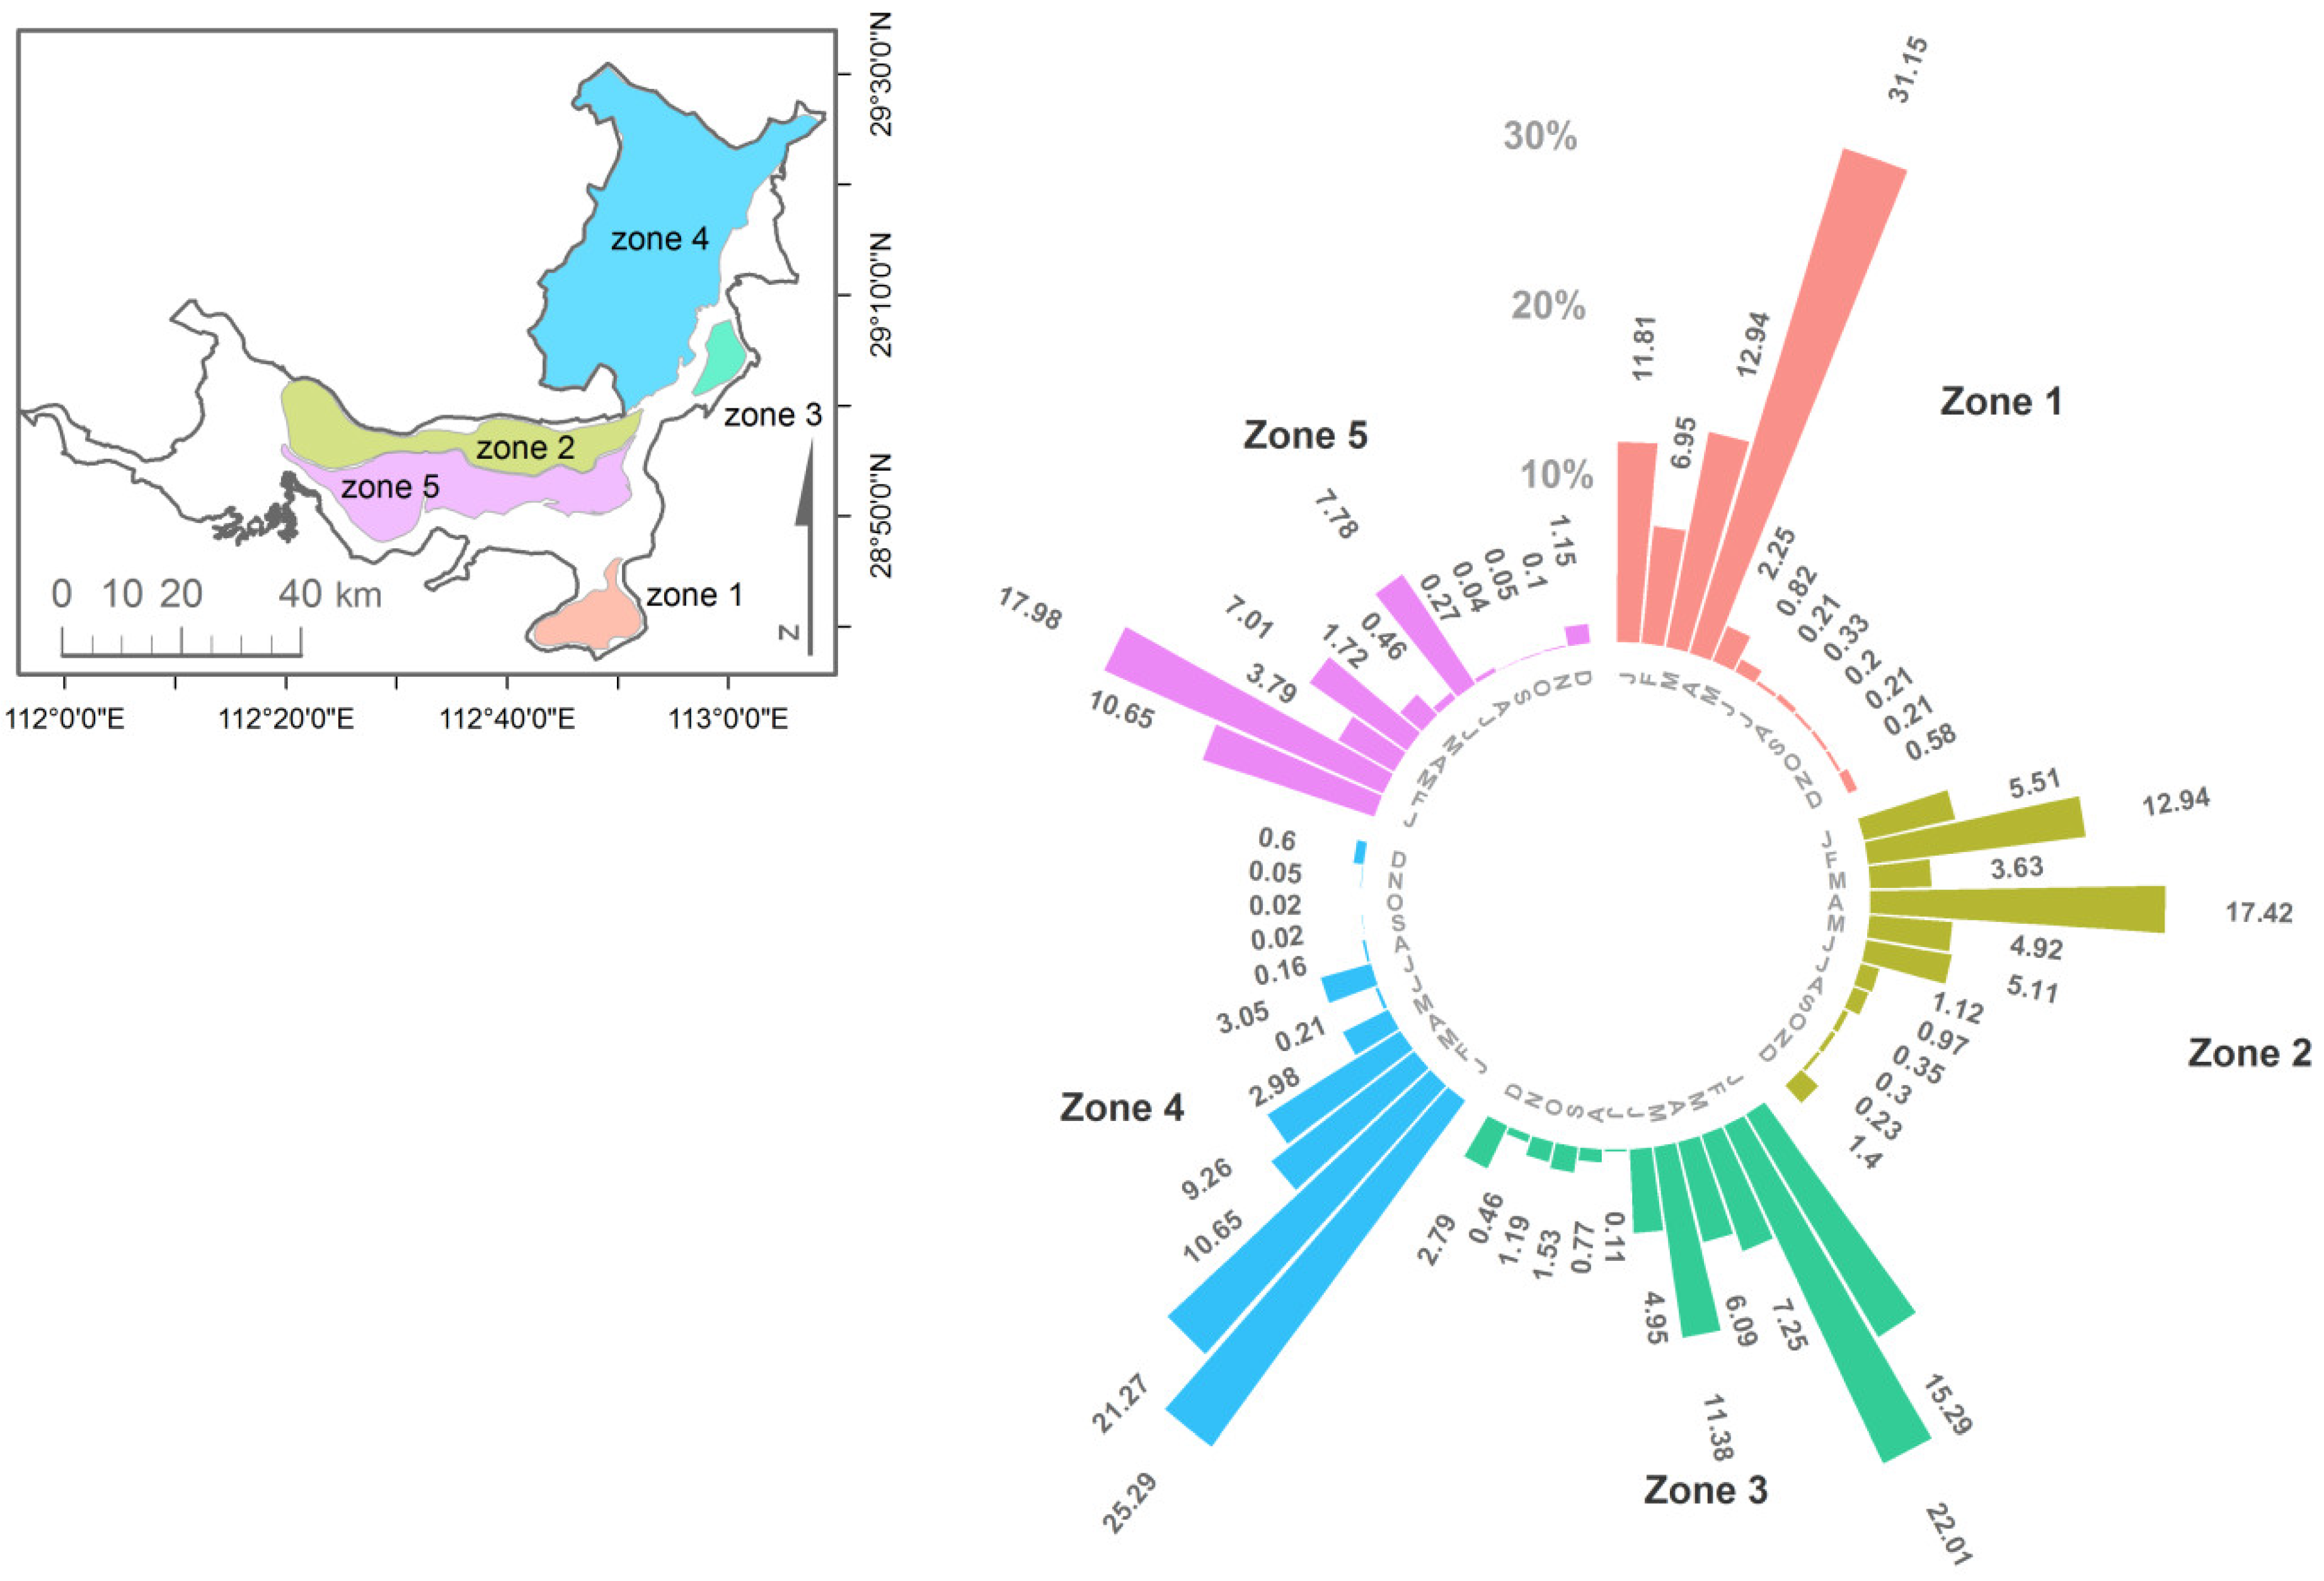
2.1. Study Area—Dongting Lake in China

The Dongting Lake area—rich in water resources and biodiversity but also considerably transformed by agricultural activities, tree plantations, and urban settlement development—is one of the most important ecosystems in China (Figure 1). The area that extends from 28°30’–29°50’ North and 112°00’–113°20’ East is located in the center of the Yangtze River watershed and north of Hunan Province (Figure 2). Dongting Lake—the second largest floodpath lake in China—plays, jointly with Poyang Lake, a crucial role in the accommodation of Yangtze flood waters, with a maximum water depth of up to 35 m and average depths of 6–7 m [41]. Before the 1990s, intensive land reclamation to gain new agricultural production ground, and strong sedimentation, following deforestation along the upper reaches of the Yangtze, resulted in a rapid decrease in the size of the lake. From 1820 to 1990, half of the lake area disappeared [42]. After one of the most severe floods in 1998, much of the land reclaimed had been inundated again [33]. In this study, the dyke line of Dongting Lake’s main diked area published by Yang et al. [43] is used as the extent for all lake analyses (Figure 2—large body of water marked in blue). The diked area comprises 3281 km2 and includes several polders such as Gongshuangsha in South Dongting Lake.
The polders within main dykes are included in this study because they are potentially used as artificial wetlands, a wetland type included in the wetland classification scheme of the Ramsar Convention, which provides a global framework for intergovernmental cooperation on wetland issues [1,44]. Dongting Lake includes three Ramsar wetland sites of international importance—No. 551—East Dongting Lake Wetland Nature Reserve declared in 1992; and No. 1151—South Dongting Wetland and Waterfowl Nature Reserve, and No. 1154—West Dongting Lake Nature Reserve, both declared in 2002—all including natural wetlands that are important for millions of migratory birds and home to endemic and rare species of birds, fish, mammals, and reptiles [45,46,47,48,49].

2.2. Sentinel-1 Time Series Data

This study uses SAR data from Sentinel-1A, launched on April 3, 2014, to assess the flood situation. The mission provides frequent high spatial resolution SAR data according to the acquisition scheme every 5–10 days [51]. The used standard product is in Ground Range Detected (GRD) format and contains amplitude information in dual-polarized default operation mode VH-VV (vertically transmitted and horizontally received (VH) and vertically transmitted and received (VV)). The GRD data are delivered at 10 m pixel spacing, after applying a 4 by 1 multi-looking processing [52]. The lake is largely covered by one scene and fully covered by two scenes (approx. 170 km by 280 km) from one ascending satellite orbit. The year 2016 marked the first complete year of coverage over the Dongting Lake region, including 18 acquisition dates unevenly distributed over the year (summarized in Table 1).

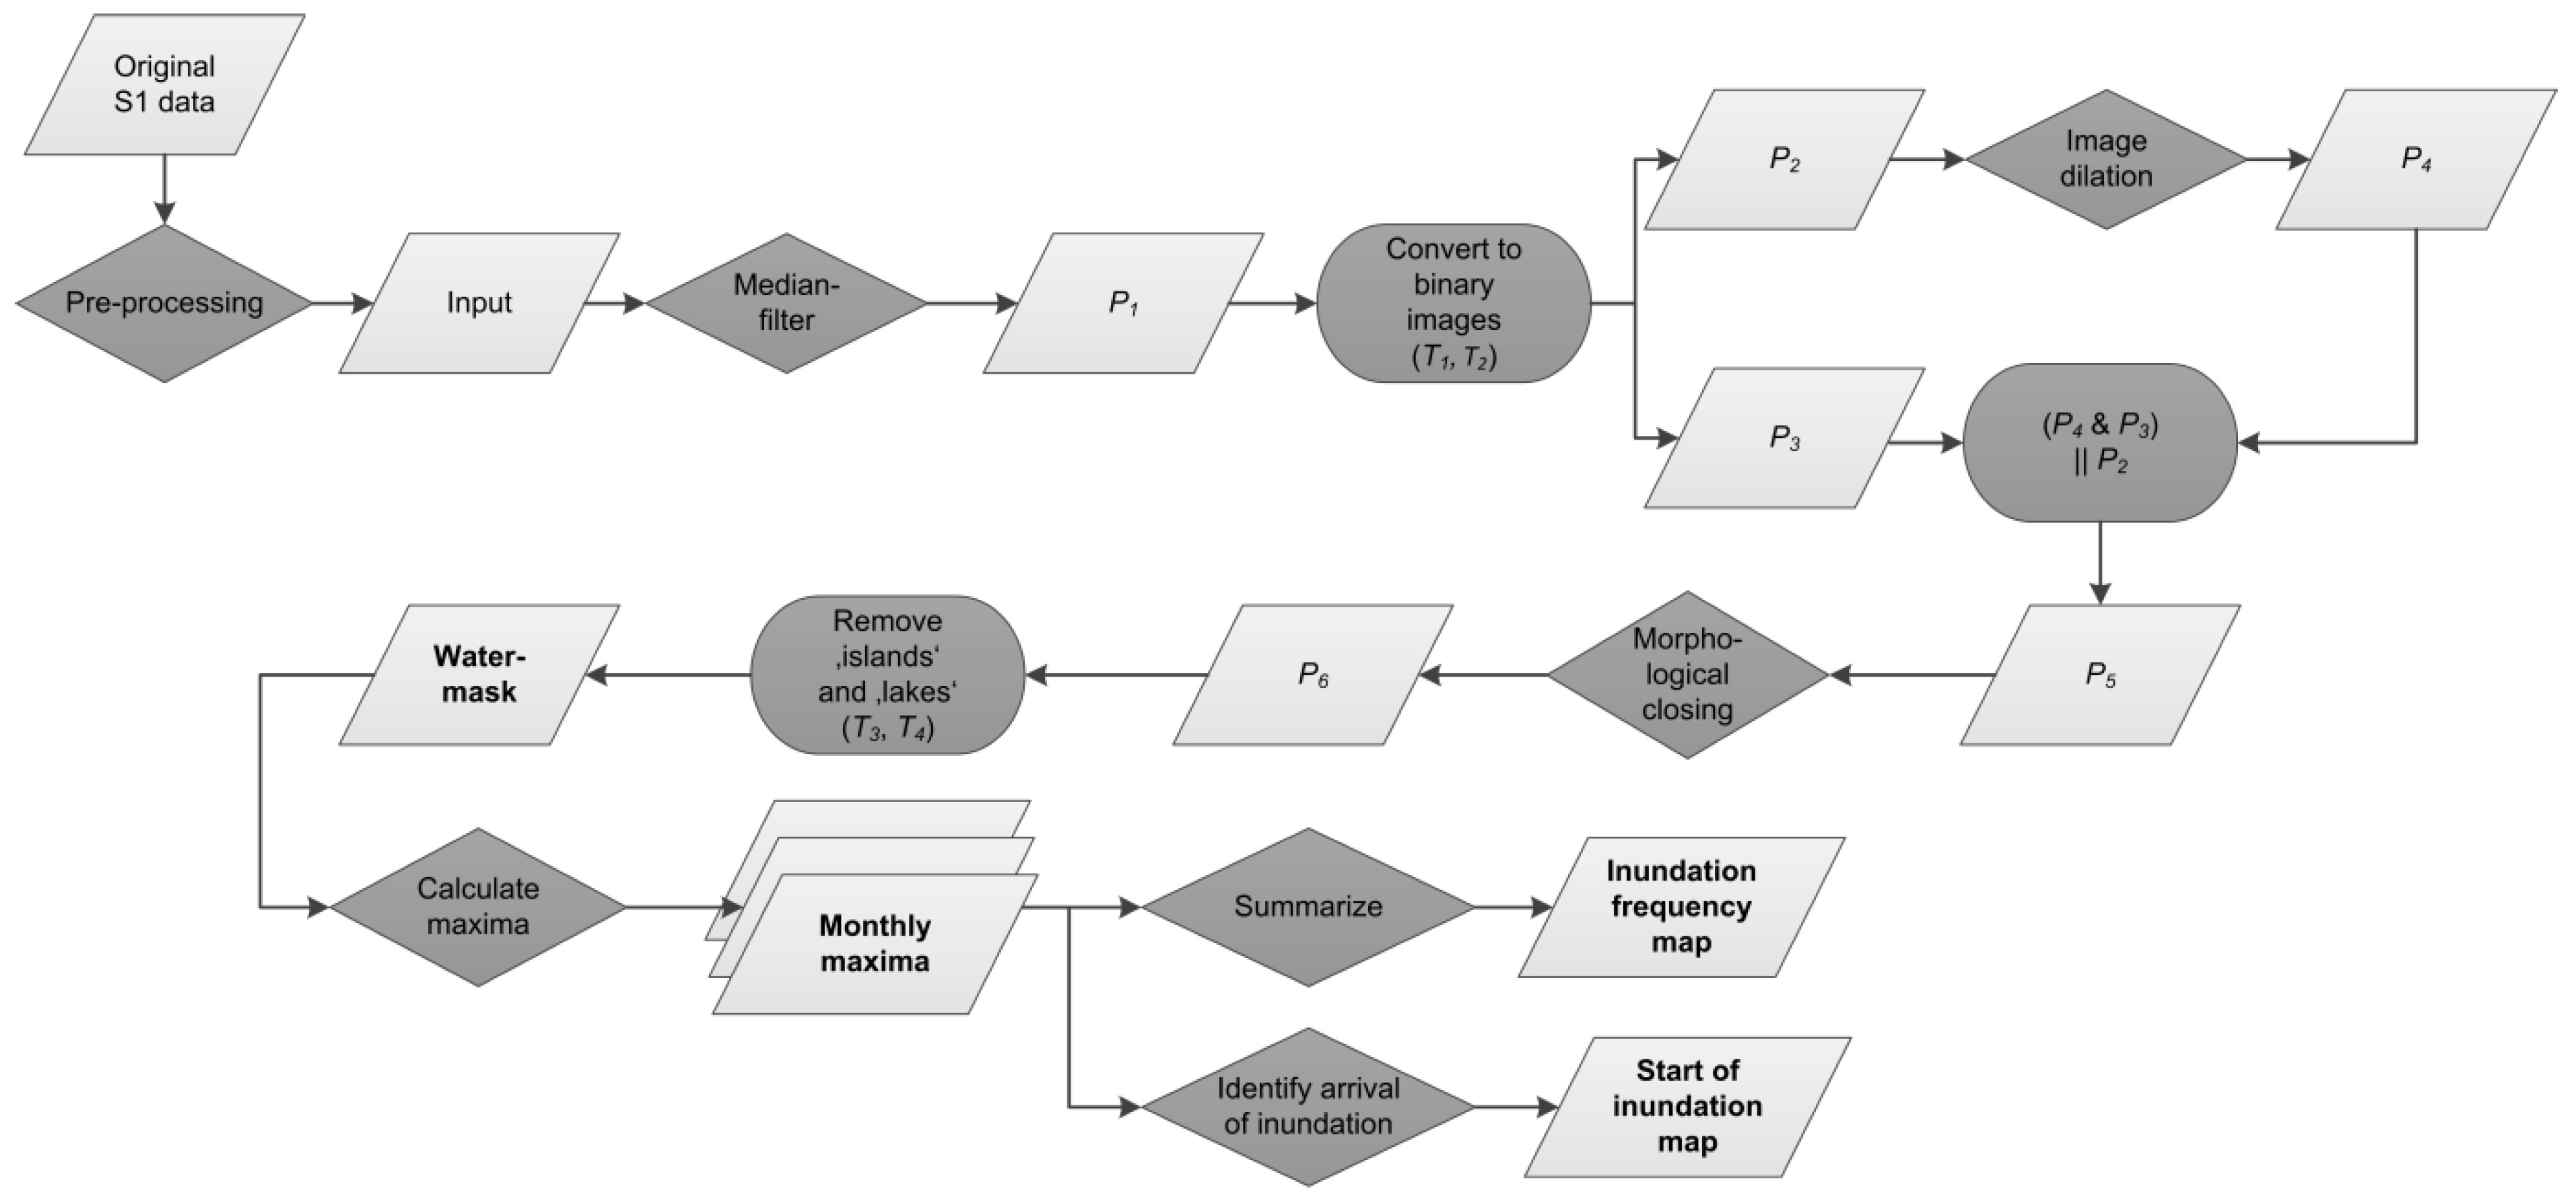
2.3. SAR Image Processing

Graph processing within ESA’s open source software SNAP (SeNtinel’s Application Platform) was utilized for pre-processing the Sentinel-1 GRD data. Within the graph, the VH amplitude band data were selected as mentioned in Ottinger et al. [53], as well as the implementation of geolocation and terrain corrections with the SRTM 1 sec data, and backscatter calibration to result in georeferenced radiometrically corrected datasets by creating comparable backscatter values.

2.4. Surface Water Extraction

The applied algorithm takes advantage of the fact that water surfaces usually act as specular reflectors for incoming microwave radiation. Therefore, the microwaves that are incident on the water surface are reflected away from the SAR sensor, and the return pulse can be very weak; the backscatter from water surfaces is zero or very low. Hence, smooth, undisturbed water surfaces appear as black surfaces in radar data [54,55,56]. Exceptions are very rough water surfaces, which might lead to a return pulse, as well as water surfaces, which are mixed with vegetation (e.g., reed grasses on lakes).
The principle utilized is the differentiation of water from land surfaces based on two empirically tested and chosen thresholds applied to radiometrically corrected and median-filtered SAR amplitude data (P1), and on subsequent morphological operations. The same thresholds are applied to all data sets in the performed calculations. A first, higher threshold of −20 db defines all pixels clearly identifiable as land (P3), while a second, lower threshold (P2) of −30 db defines pixels clearly identifiable as water. The pixel values falling in between the two thresholds are classified in a second step based on morphological operators, which perform dilation and closing operations at the land–water border, which result in P6, followed by a cleaning operation for very small artifacts (see Figure 3). The outputs of the calculation are binary water/no water products called watermasks. Detailed information on the methodological steps of the applied procedure can be found in [18,57] and on method validation in [58], which resulted in overall accuracy values between 85% and 96%.

2.5. Inundation Analyses of the Sentinel-1 Lake Water Extent for 2016

Based on the 36 temporally unevenly distributed watermasks in 2016, the maximum water extent in each month of 2016 was calculated. The maximum extent was chosen to prevent the underestimation of the water surface extents and water surface dynamics (compared to mean values).
In addition to these monthly watermasks, an inundation frequency map was created, summarizing for each pixel how often it is covered by water in the 12 monthly water extent maps. Moreover, the monthly maps of maximum water extent were used to produce a map of the beginning of the inundation, representing the month of the year in which the inundation started at each location within the study area. The workflow of all the conducted processing steps is presented in Figure 3.

3. Results

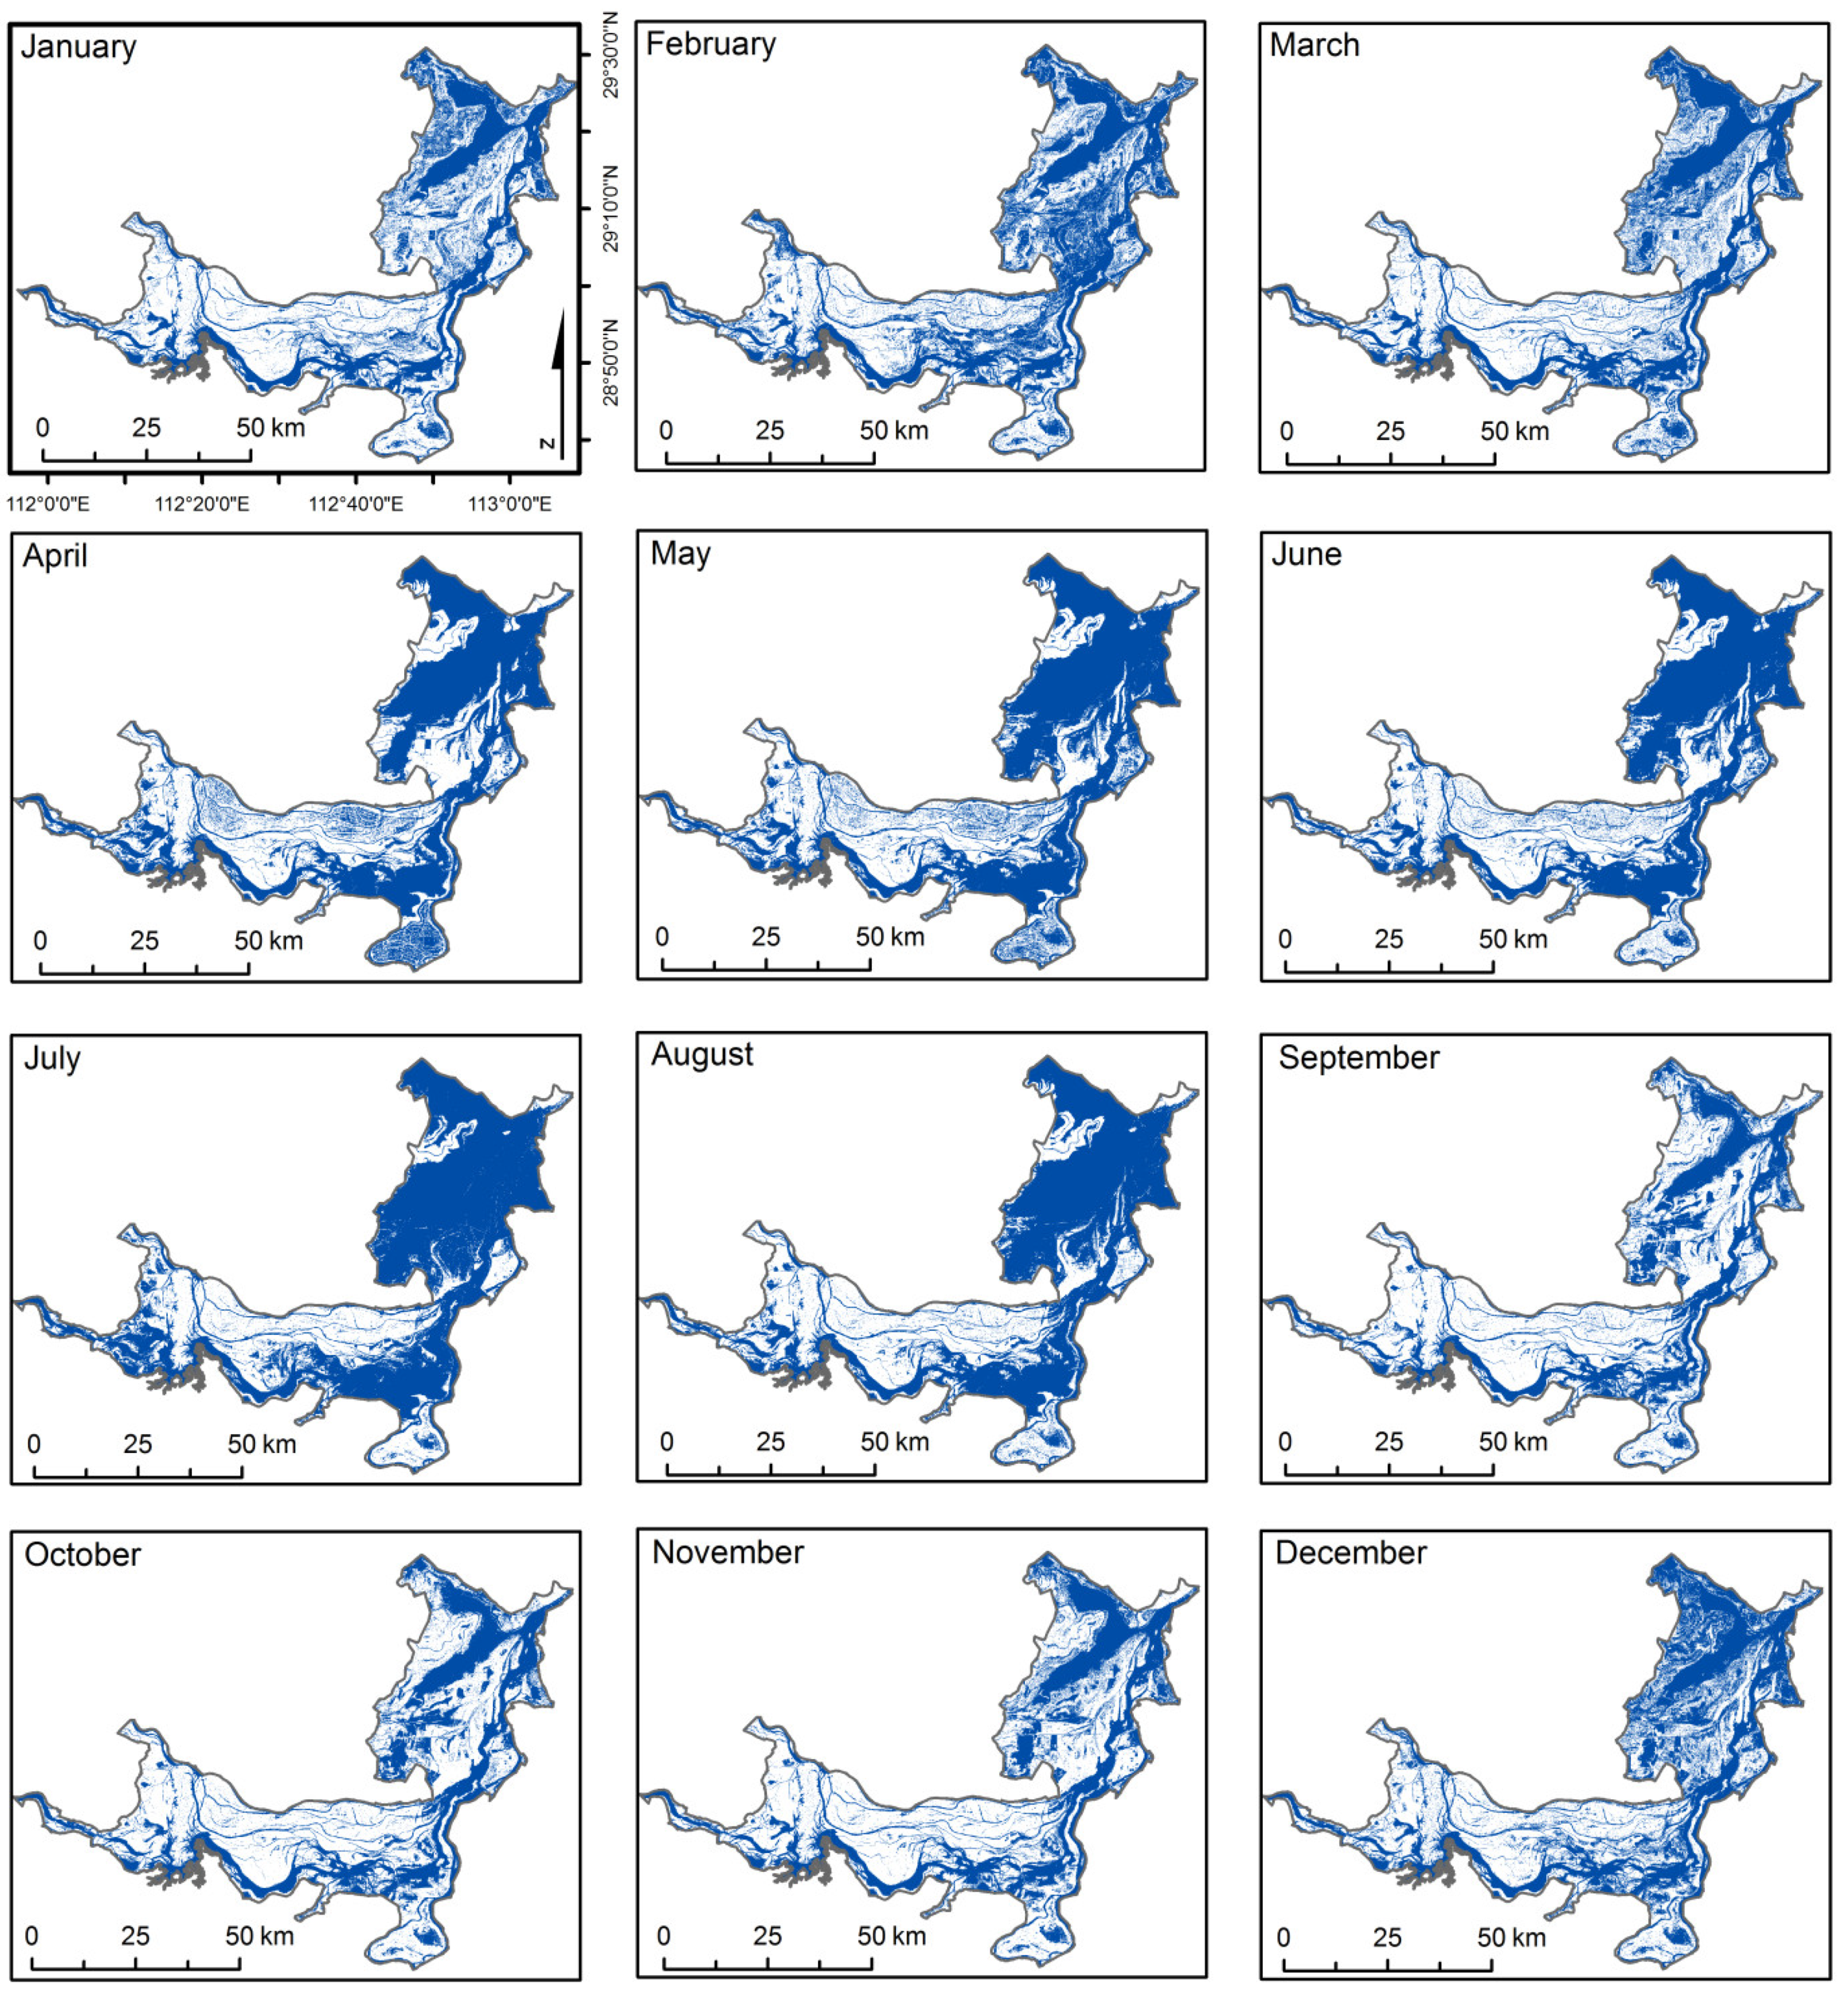
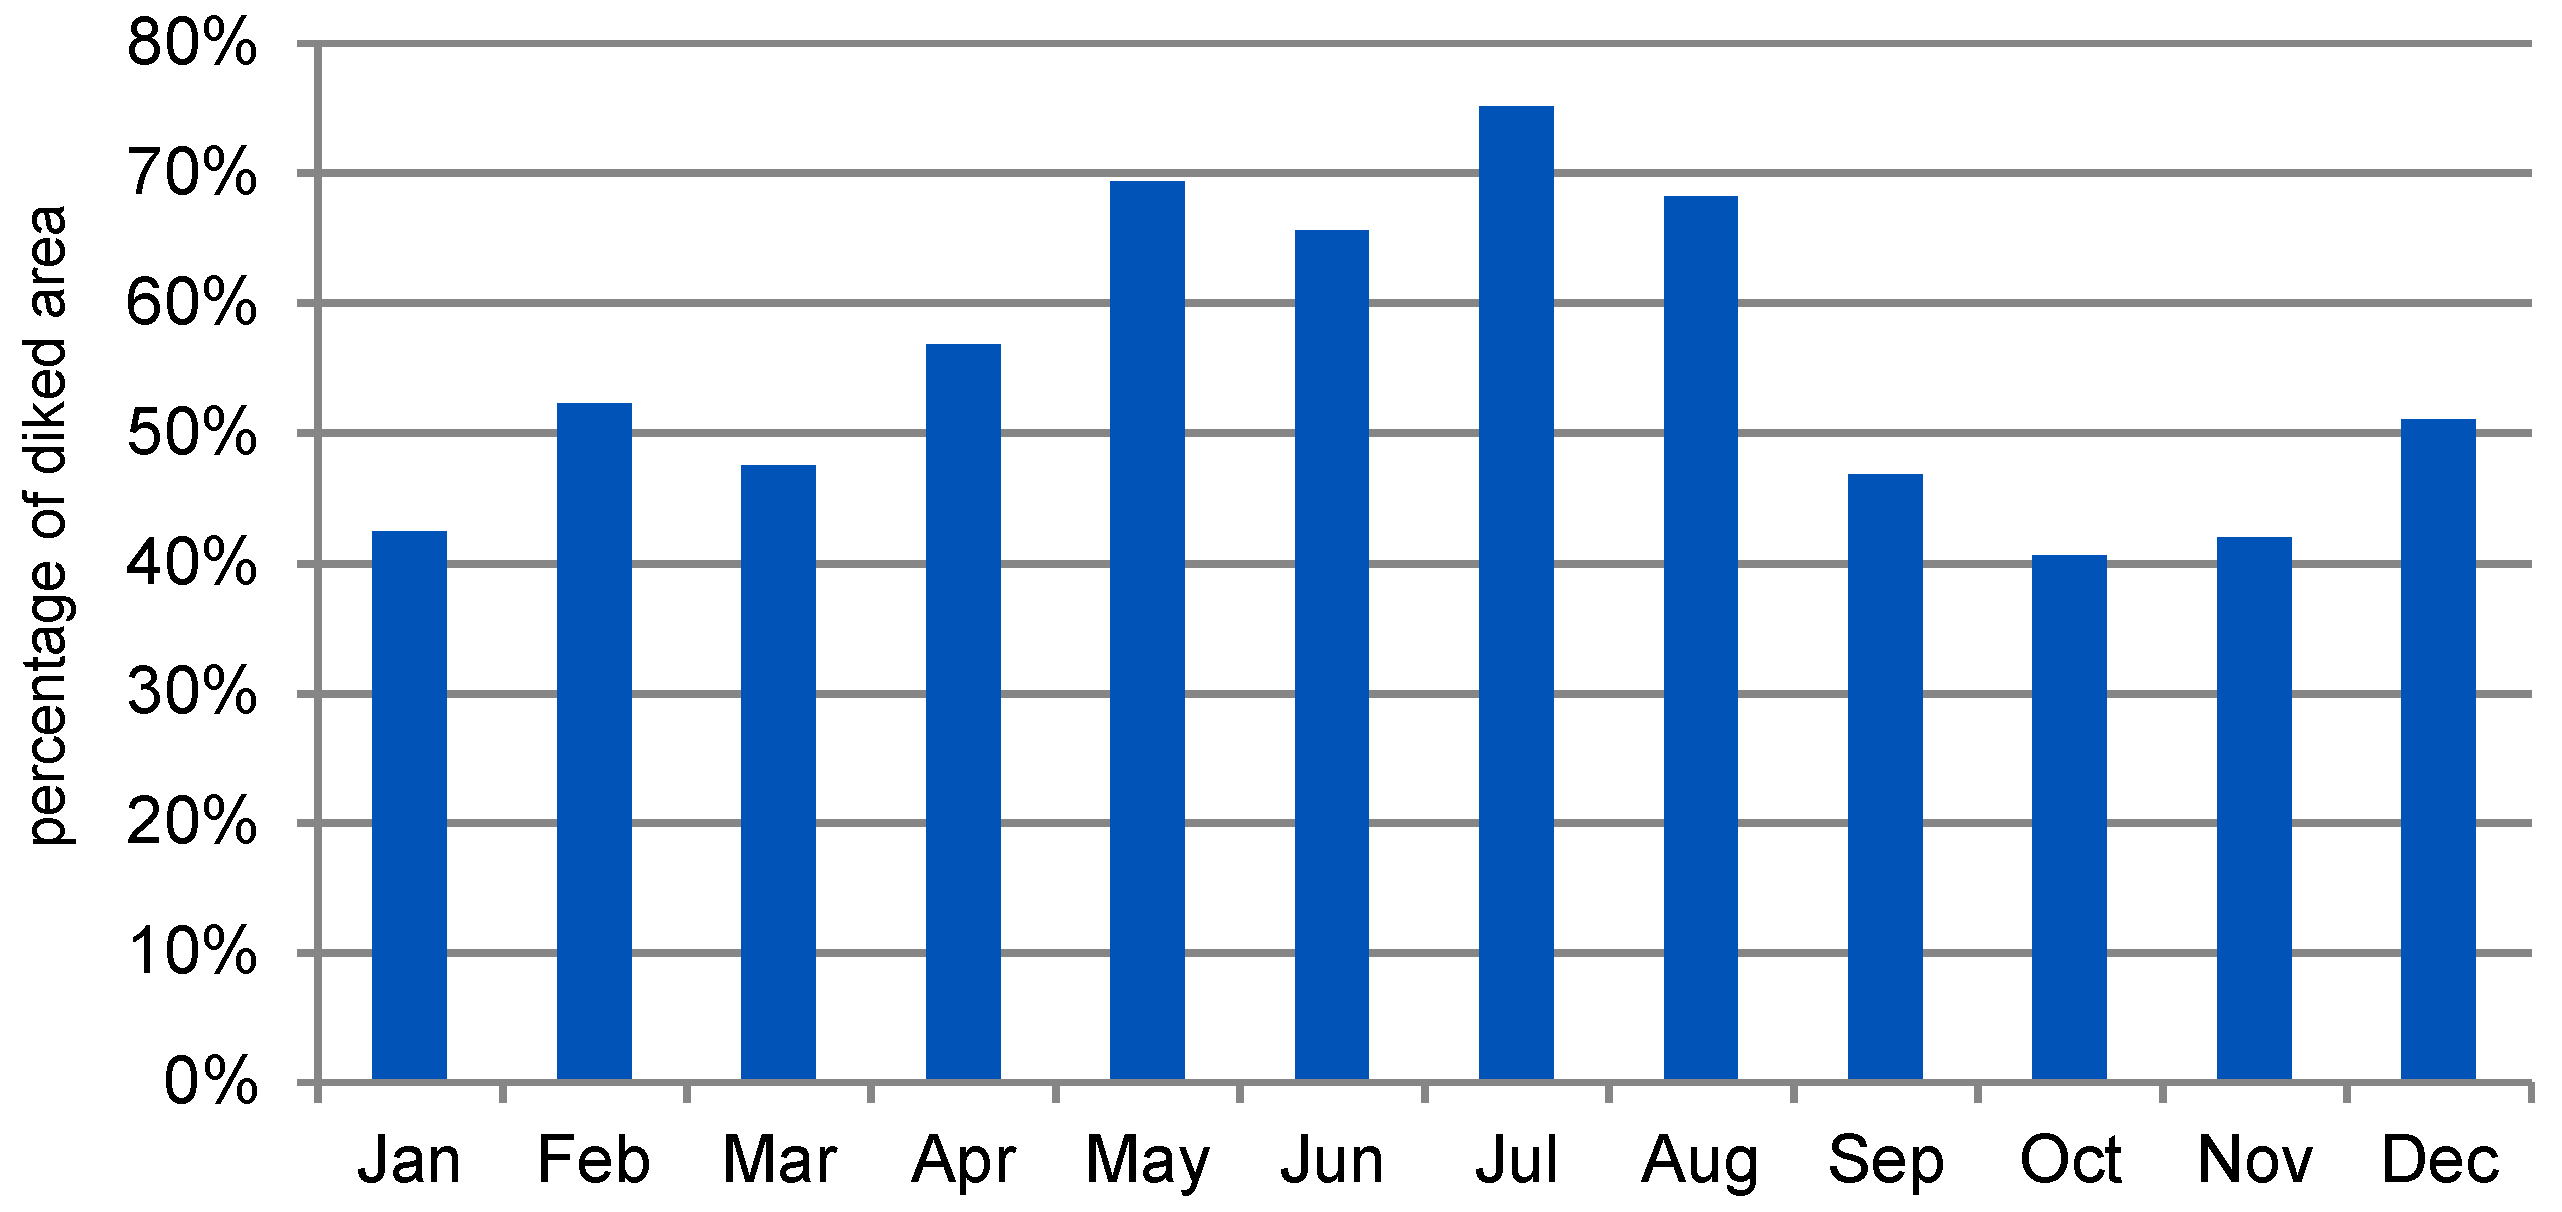
3.1. Duration and Frequency of Inundation from Sentinel-1 Time Series

Figure 4 shows the time series of Dongting Lake’s monthly maximum water extent in 2016. Normally, the growth of the water surface towards the annual flooding period is reported from May to August [59]. In accordance with Yuan et al. [60], who described the year 2016 as an exceptional flood year, it can be visually observed on the monthly maps that the 2016 flooding period had already begun in April. Thus, the maximum water surface was reached in July, and the minimum, in October. The area of the East Dongting Nature Reserve (Ramsar nomenclature, see Figure 2) is the most dynamic part of the lake. The southern part of the lake also faced water surface extent changes over the year, whereas, the western part of Dongting Lake was comparably stable. Figure 5 shows the increase in water extent per month for the complete lake area. Within the total area of the dyke, continuous swelling of the water coverage from 43% in January up to a first maximum of 69% in May and to a second maximum of 75% in July can be observed. From August onwards, the water area decreased within 3 months to a minimum of 41% total coverage in October, while it increased slightly in November and again by 10% by December.
Figure 6 displays the inundation frequency map. The dark blue areas, the so-called permanent water body, are defined as the water surface where the water was present in all observations—this involves the main river branches that flow in the lake and the stable parts of the lake. In 2016, this involved 28% of the diked area of Dongting Lake, i.e., about 920 km2. Areas of green tone are covered with water for 1–11 months. Proportions of 9% or 8% of the area were water-covered in 1 or 2 months in 2016, respectively, whereas 3% to 6% of the total area was water-covered for 3 to 9 months. A share of 18% of the diked area was not covered by water during the year 2016 (grey colored area).
The zoomed in maps in Figure 6a–d reveal the potential of the 10 m spatial resolution of the Sentinel-1 data. Wetland structures can be assessed in high detail—e.g., drainage areas, other man-made structures, and areas potentially used for agriculture (e.g., reed and grassland, Figure 6a). Due to its shape, agricultural land can be visually identified and also distinguished from other rectangular areas demarcated as potential aquaculture ponds or other artificial water reservoirs (Figure 6c). In addition, the details in Figure 6a,d show linear structures within the lake area, which are dykes or channels. In Figure 6b, permanently water-covered areas within South Dongting Lake Nature Reserve can be distinguished from temporally flooded, unstructured, approximate natural wetlands with natural channels. The area of the non-permanent waterbodies of the Ramsar wetland site (1151), as shown in Figure 6b, was covered with water for more than half of 2016. This is comparable to the areas near and within East Dongting Lake Wetland Nature Reserve (551), as displayed in Figure 6d.

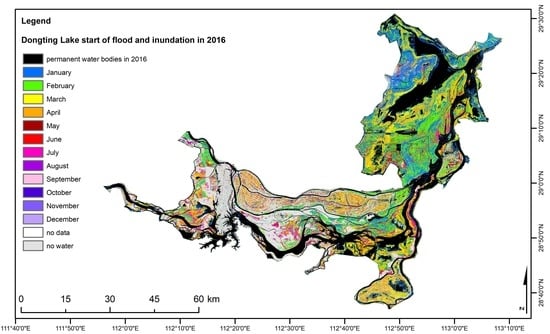
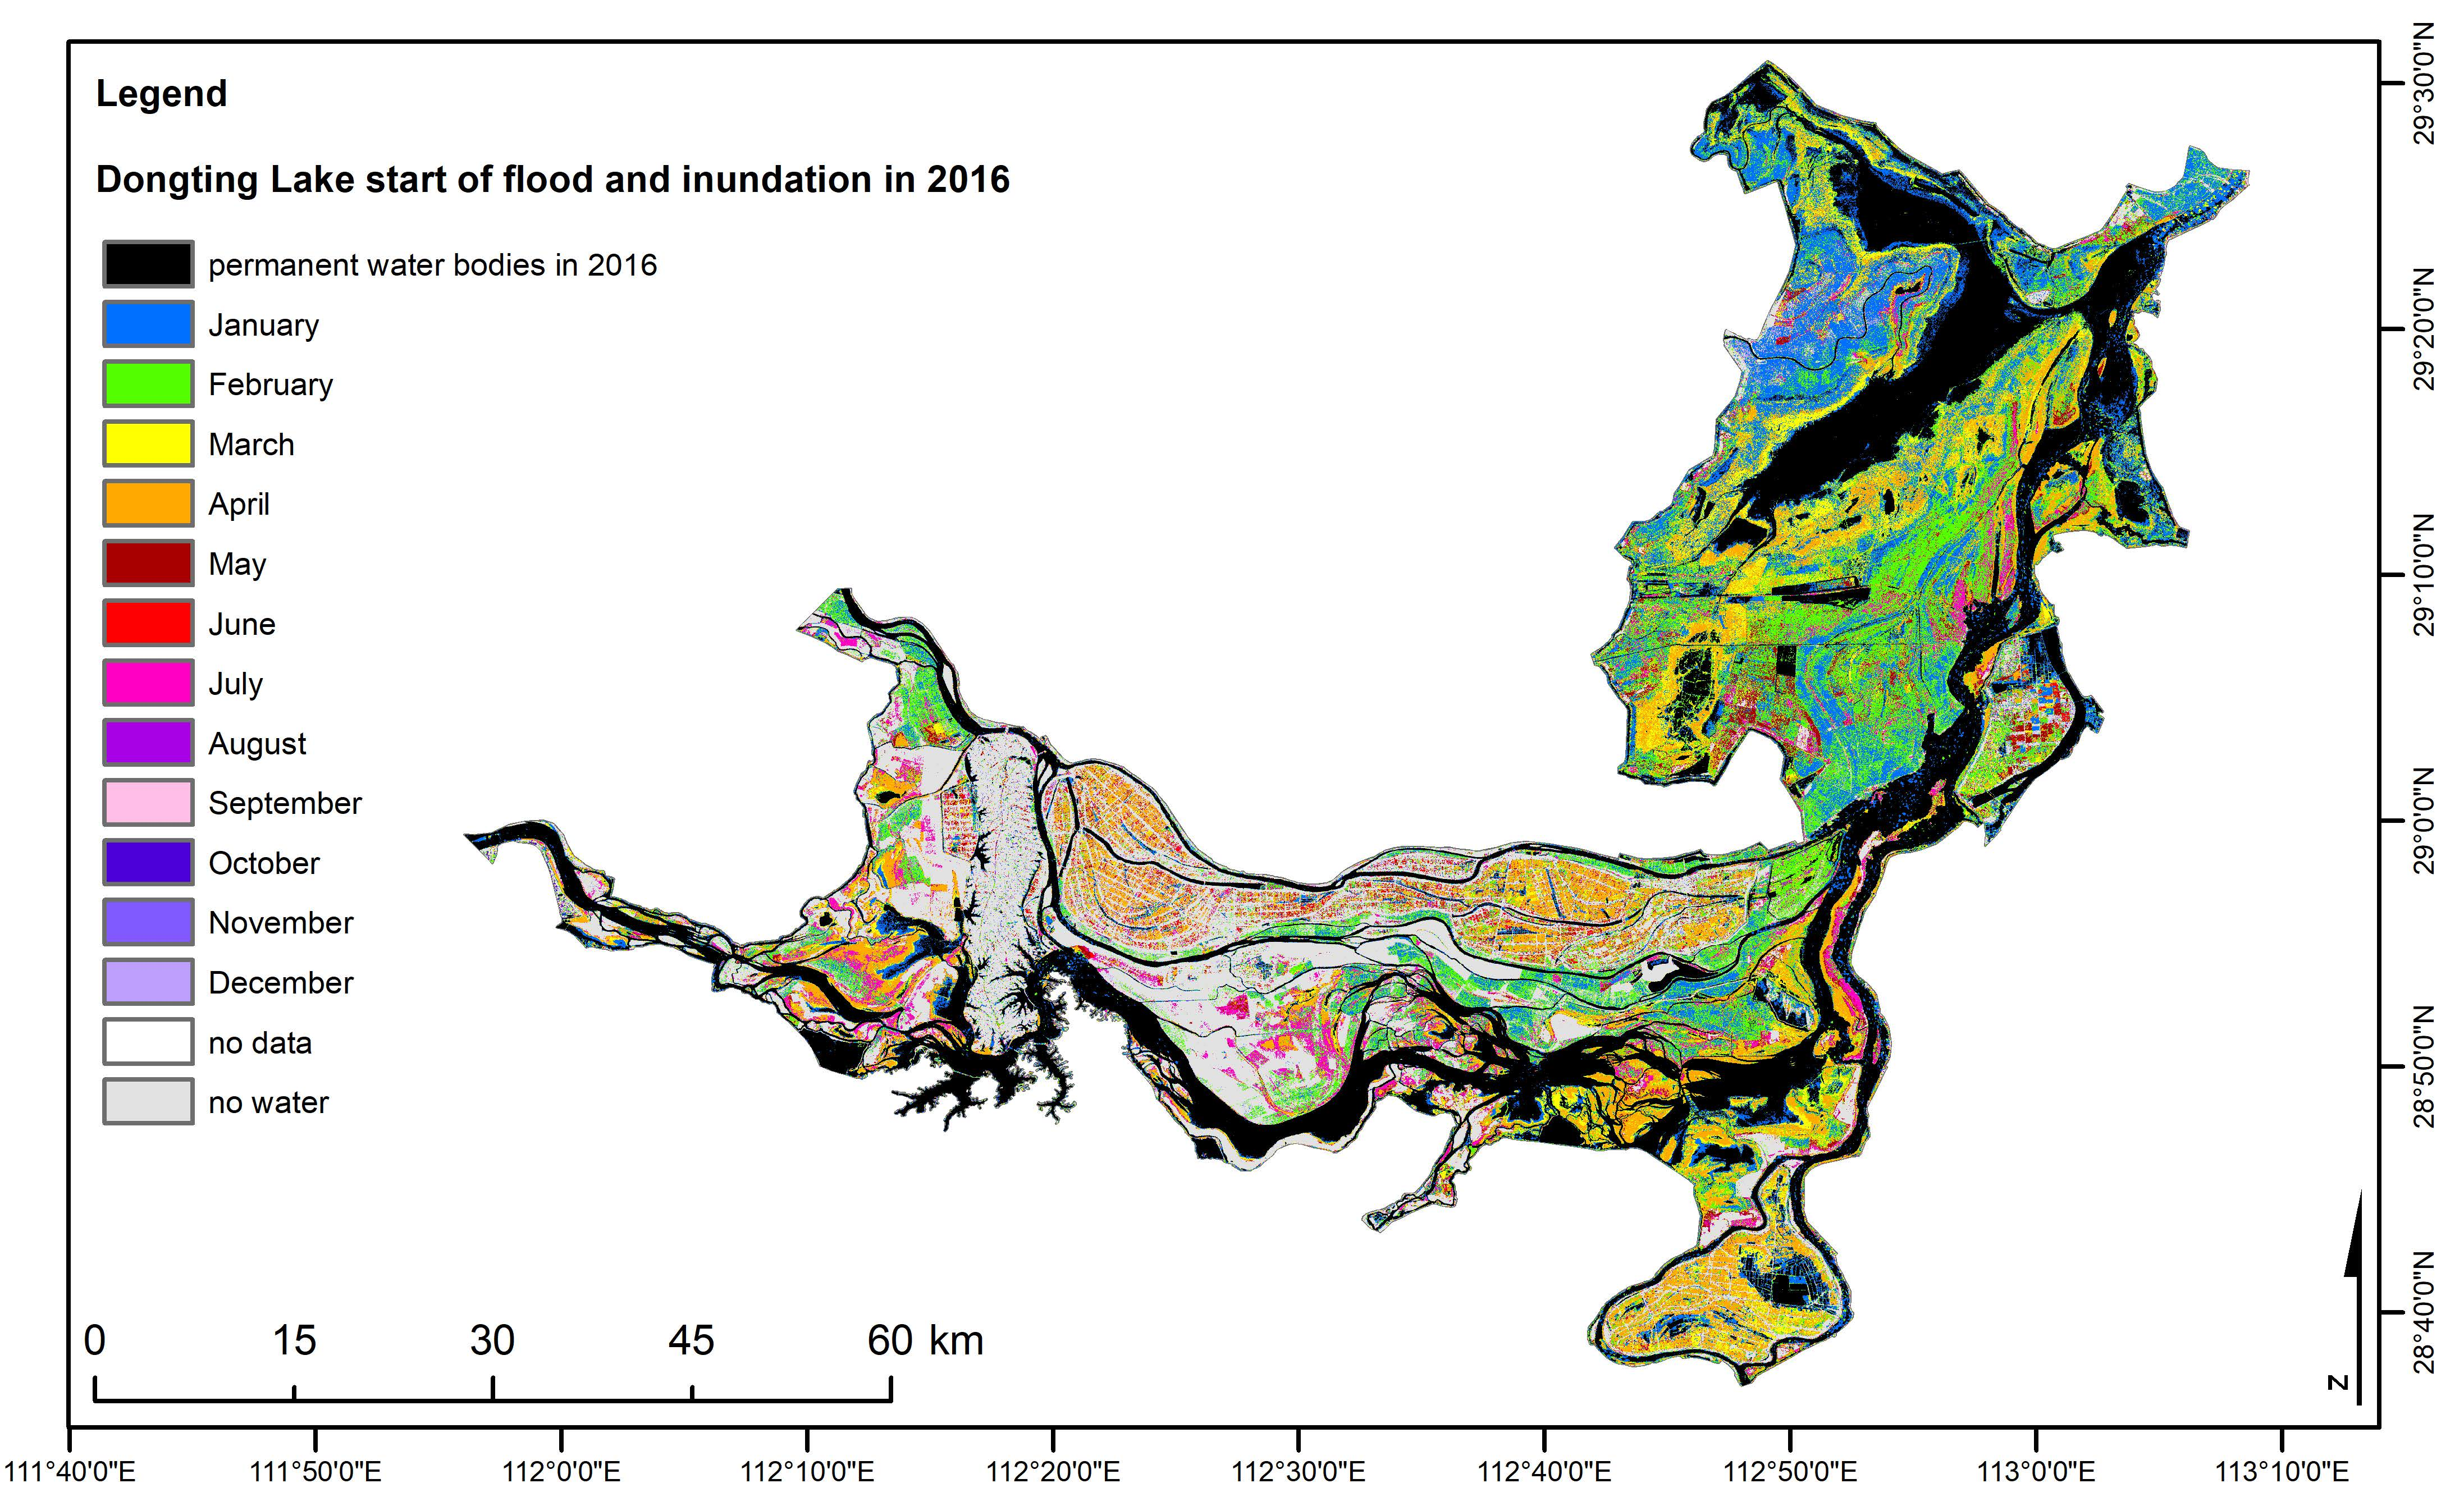
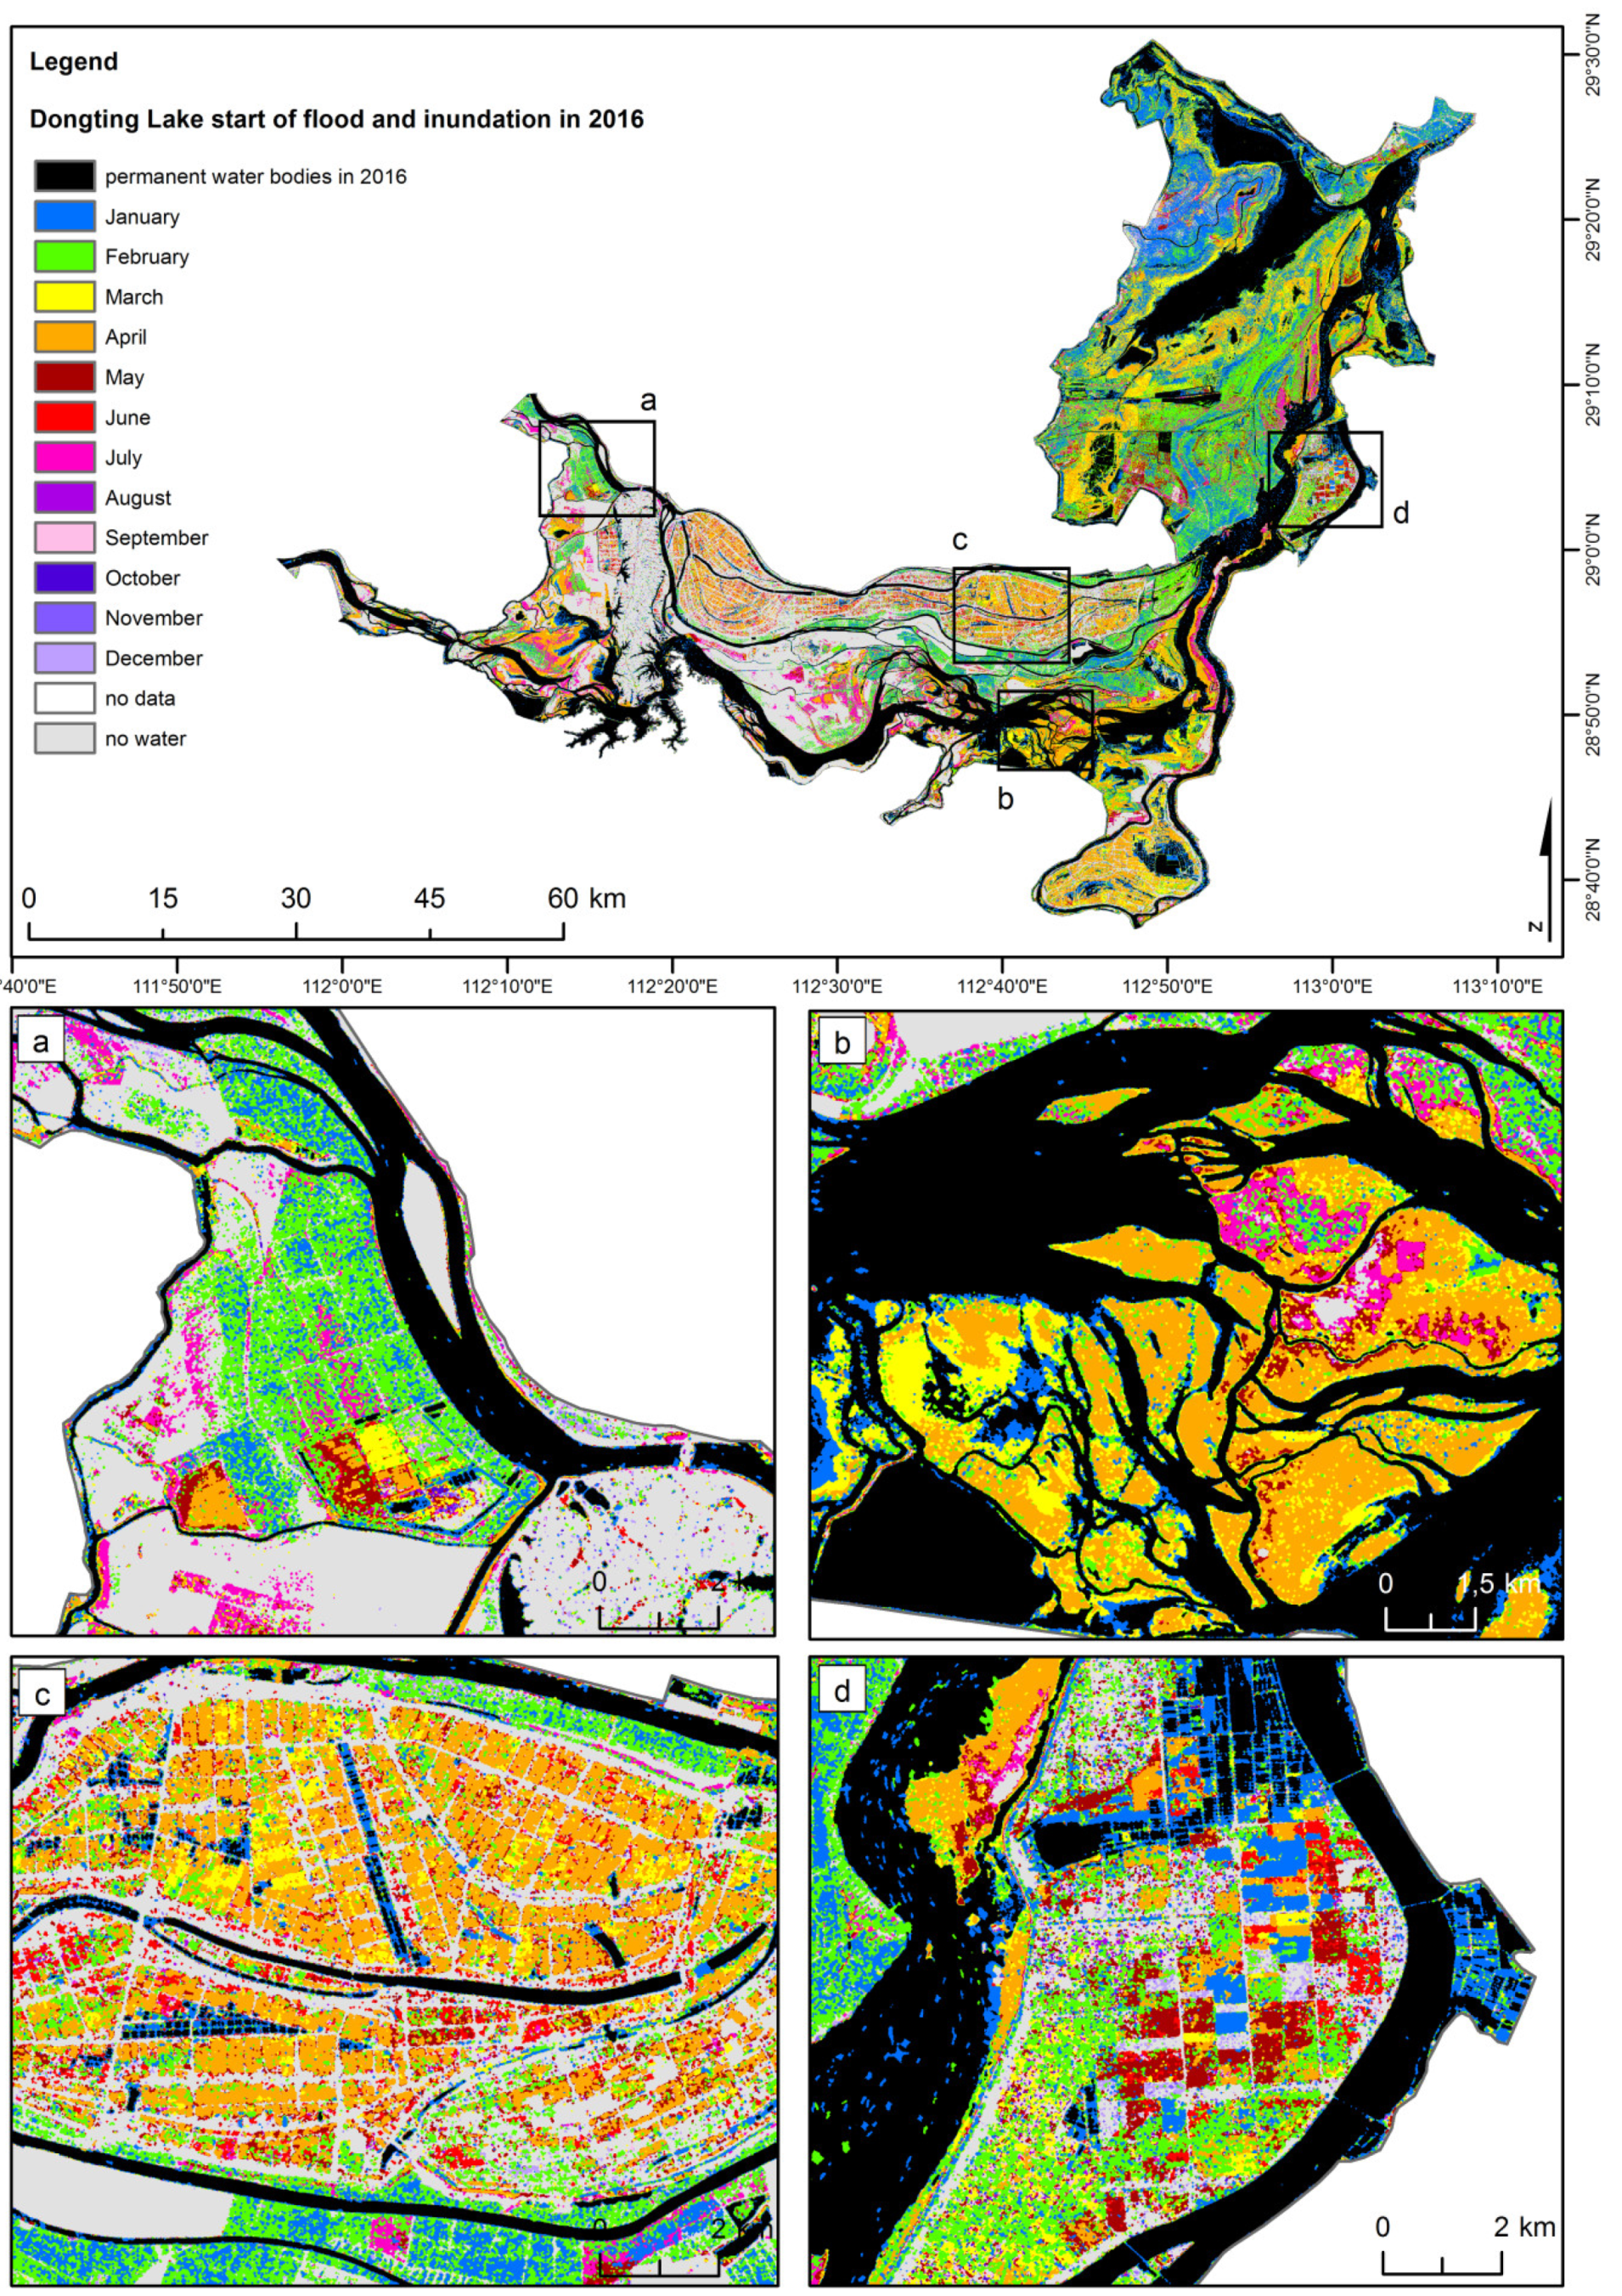
3.2. Start of Flood and Inundation in Dongting Wetlands

Figure 7 displays the start of inundation. Permanent bodies of water are shown in black. Areas that were dry all year are shown in light grey. The other colors represent the months of the beginning of inundation from January to December.
The light blue-colored areas in the northern part of the lake were flooded in January 2016. They are fed by the river junction that flows from the main river stem of the Yangtze to the northeast of Dongting Lake. The green and yellow areas were flooded in February and March. The Li River feeds water into West Dongting Lake (Figure 7a), which also caused the inundation of embankments in February (see the green areas in Figure 7c). Large parts of the area first flooded in April (orange, e.g., Figure 7b) are embanked or elevated, e.g., leaves and other natural material naturally elevate the ground (Figure 1). Due to the chessboard structure (also confirmed by local knowledge), it can be seen that the orange areas in Figure 7c are used for agriculture. From literature, it is known that rice is cultivated in the Dongting Lake region [61]. Rice requires extensive field flooding before it is planted. In addition, the rice plant needs temperatures between 17 and 33 °C to grow [61]. Considering the average monthly temperatures in the region [62], April is the first month of the year with sufficient temperatures (17 °C) to start rice cultivation. In Figure 7d, rectangular structures are mixed with unstructured areas that were flooded in February, whereas some rectangular fields were inundated—maybe by activated sluice gates—in January, April, May, and June. In Figure 7b, the structure indicates a natural wetland where the water seems to have spread uncontrollably—from March to July—possibly only interrupted by the altitude differences of the river islands. This is where the Ramsar wetland site South Dongting Lake Wetland and Water Fowl Nature Reserve is located.
For further quantification, five zones were identified in the study area according to Yang et al. [43] and visual interpretation (Table 2). It was determined which share of a designated zone was flooded first in which month (Figure 8).
In January, February, and March, the inundated area of Zone 1 increased by about 7% to 13% each month. In April, more than one third of the zone was additionally flooded. The floods of the remaining months increased by less than 2% per month and were negligible. This may mean that most of the flooding, most likely irrigation, occurred in April. A similar dispersion behavior of the water can be observed in Zone 2, with the largest floods taking place in February (13%) and April (17%). By contrast, in Zone 3, where the newly flooded area increased by 15% and 22% in January and February, respectively, the increase was only between 6% and 7% in March and April, before rising again by 11% in May. In Zone 4, a quarter of the area was flooded in January and another fifth in February. The flood pattern of Zone 4 is more difficult to describe and is most similar to that of Zone 2, with February being the month with the largest increase. Zone 4 and Zone 5 show an additional small peak of newly flooded area in July, which can be related to the Yangtze River flood in July 2016 (personal observation by the author on site).
Different patterns can be a measure of flood intensity as an expression of water management practices; for example, managed and natural wetlands need to be analyzed in a further study, supported by local information that unfortunately was not available here.

4. Validation

In order to confirm the validity of the lake water extents derived from the Sentinel-1 time series, the DLR Global WaterPack time series product [8,63]—hereinafter called simply Global WaterPack—high spatial resolution data, water level data from the Chenglingji Hydrological station at Dongting Lake, and detailed in situ knowledge from field campaigns were used. The authors have a detailed knowledge of the region, as they have been cooperating in the Sino-European Dragon Programme for more than 10 years. The first author has repeatedly been to the study area for field observations (in 2010, 2012, and 2016) and discussions with scientists, conservationists (e.g., at the Dongting Lake Station for Wetland Ecosystem Research), and local hydrological managers (e.g., at the Yueyang Hydrological Station).

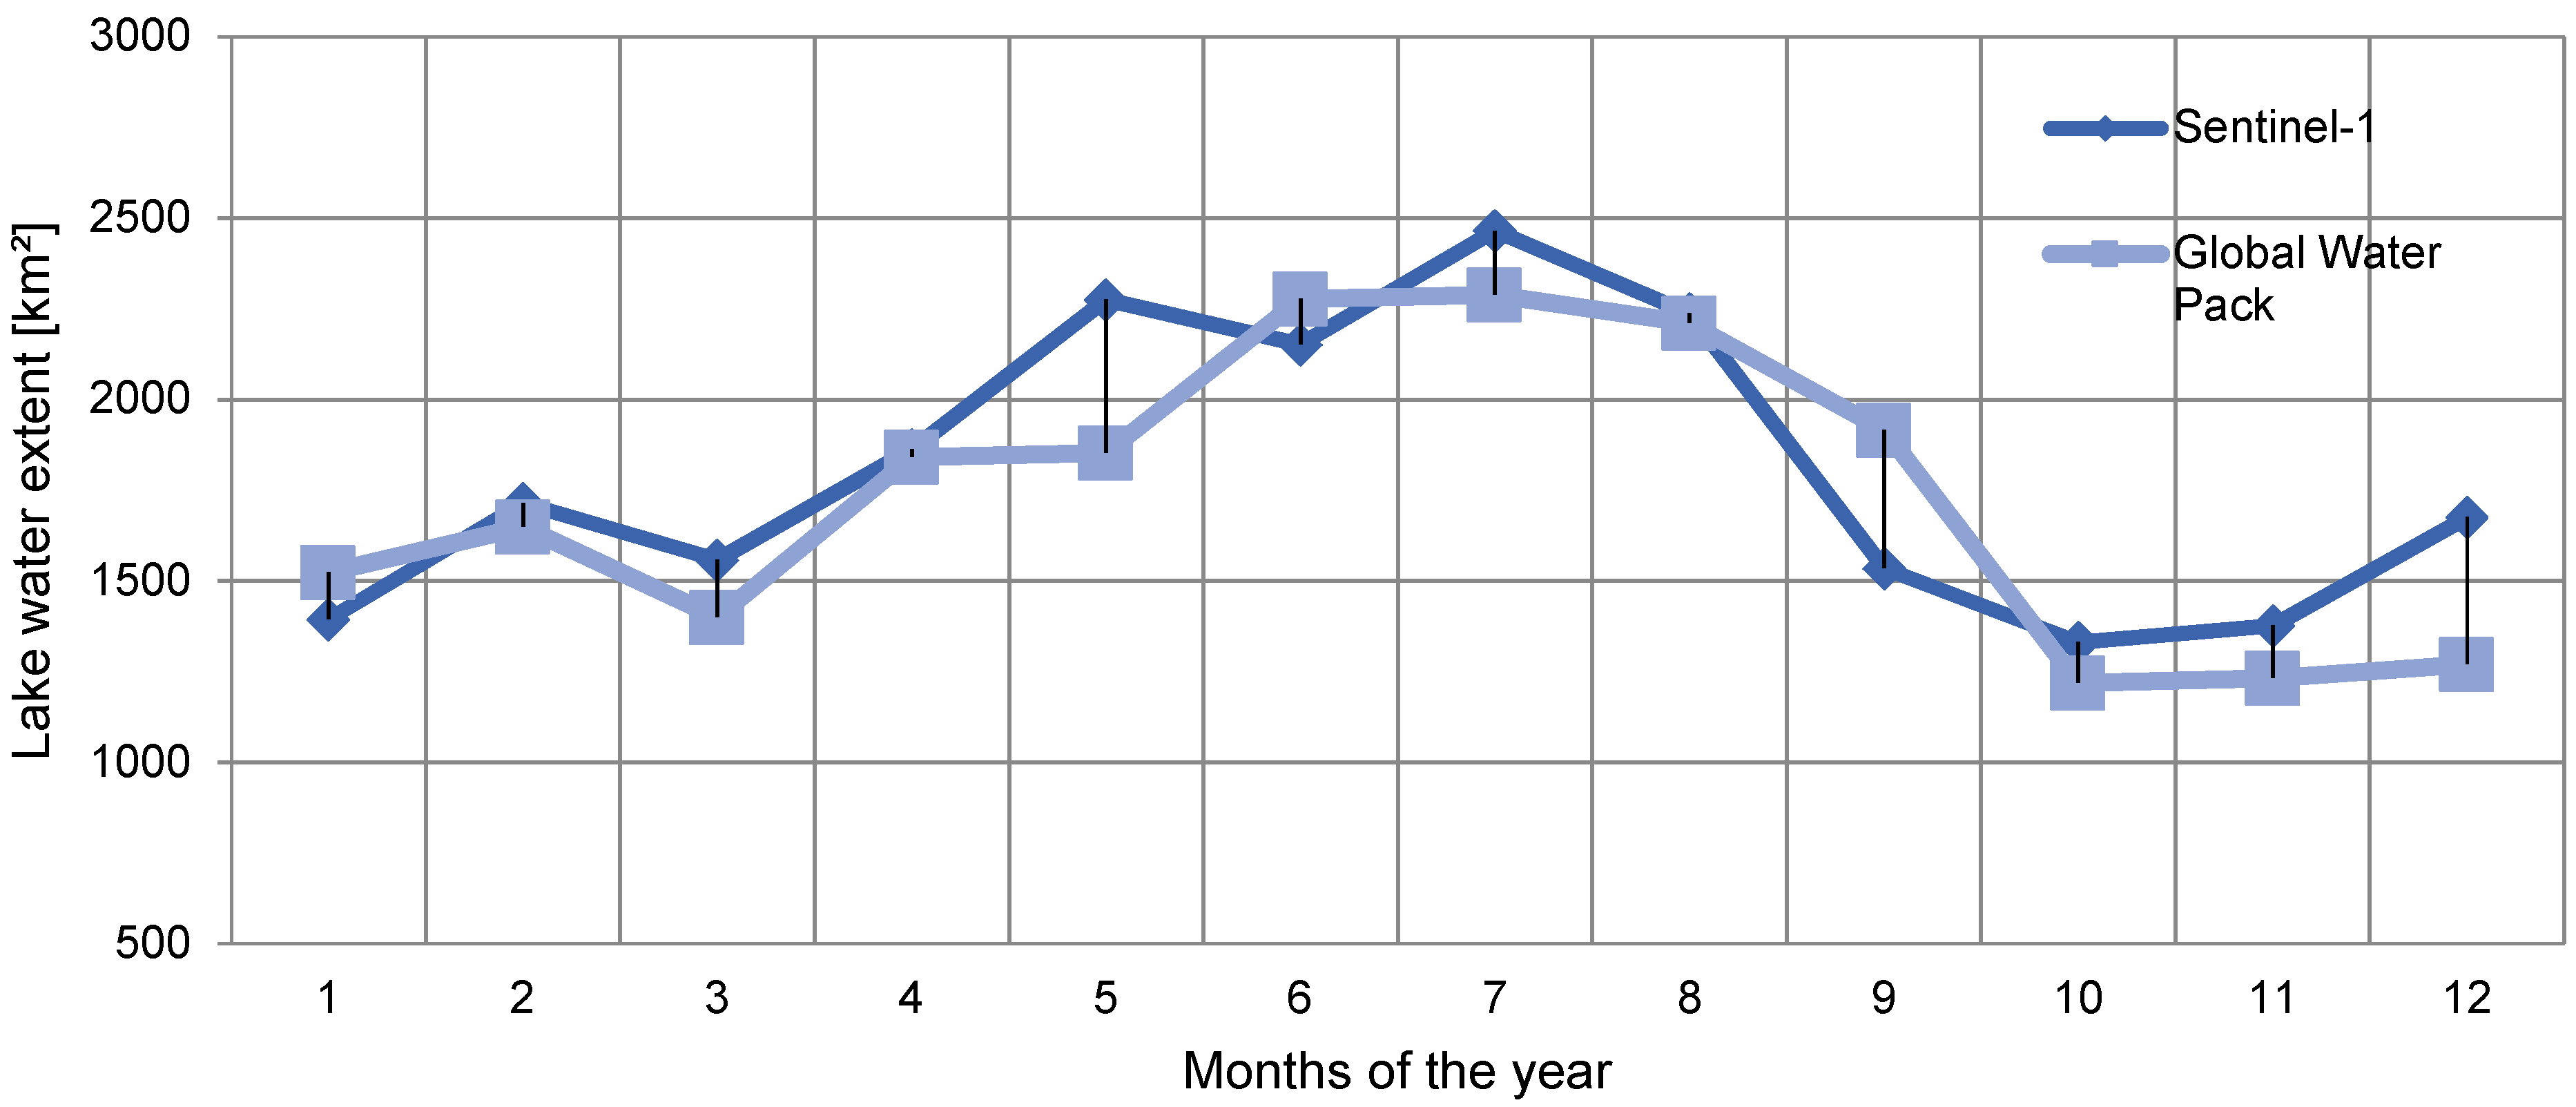
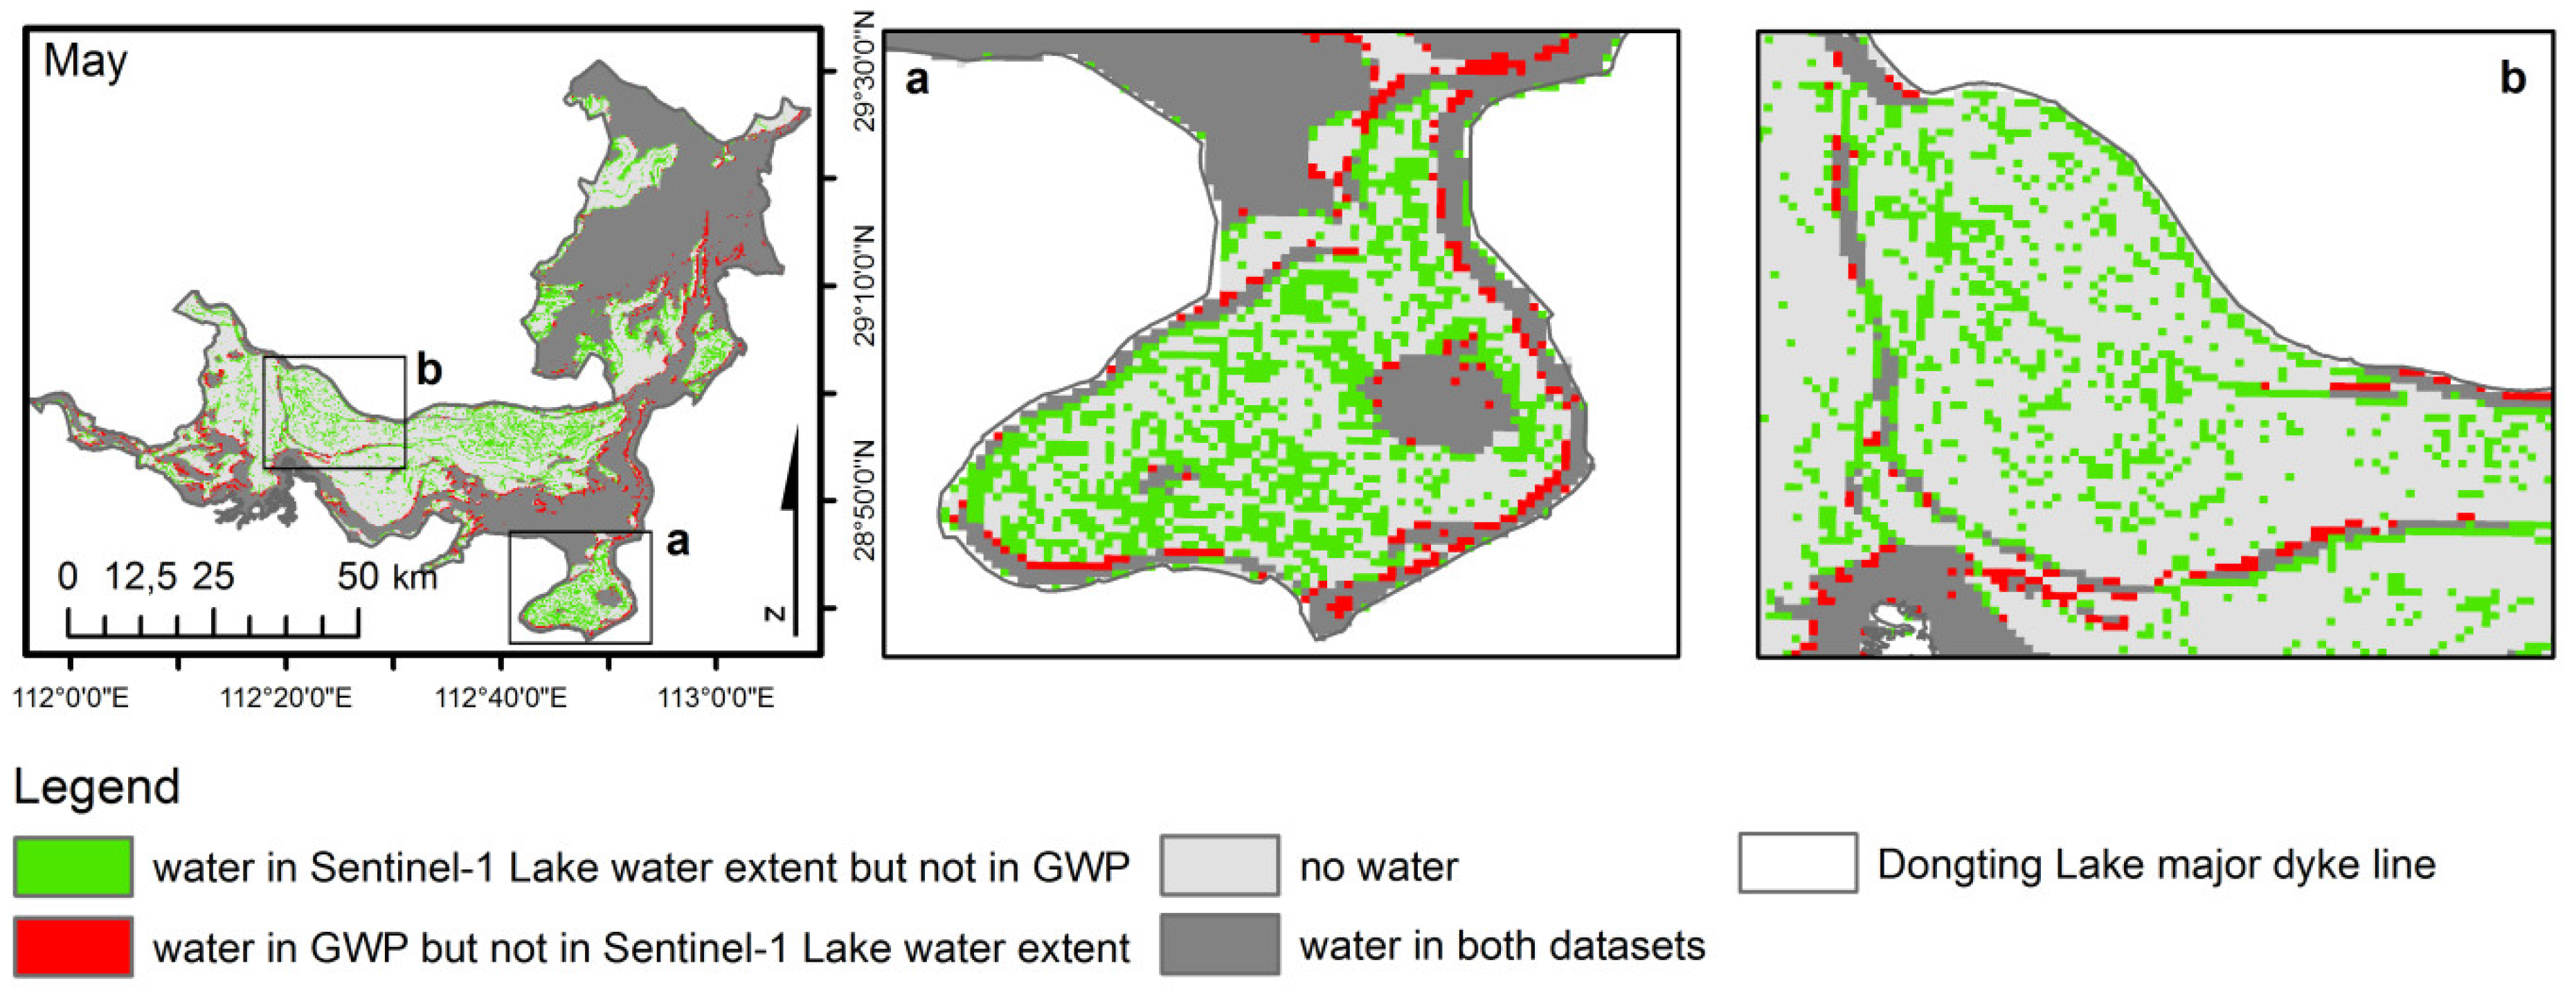
4.1. Relationship between the Sentinel-1 Lake Water Extent and Global WaterPack

The Global WaterPack is a dataset with 250 m spatial and daily temporal resolutions, based on the entire MODIS time series archive since 2000, which is utilized to generate information on the surface water coverage of lakes, reservoirs, and wetlands and their dynamics worldwide [8,63]. Technically, the dynamic thresholds for daily water classification are calculated for each MODIS tile based on selected training information from stable waterbody information. Subsequently, the daily watermask time series is interpolated for cloud and no data gaps. The approach proved to be able to capture the seasonal water coverage of lakes and reservoirs as well as flooding events [64].
A direct comparison of the Sentinel-1-derived dataset with the Global WaterPack for 2016 is shown in Figure 9. The course of the inundation at Dongting Lake, derived from the Sentinel-1 time series of the lake water extent, can be described as multimodal (Figure 9). The maximum occurs in July 2016 with a water extent of 2465 km2. The secondary maximum has a value of 2275 km2 and occurs in May 2016. A third but much lower maximum can be found in February at 1714 km2. The smallest lake water extent occurs in October 2016, at 1331 km2.
In comparison with the Global WaterPack time series, there is good agreement and a similar behavior during the year. The mean monthly lake water extent for 2016 from Sentinel-1 is 1798 km2, and it is 1723 km2 from the Global Water Pack.
As can be seen in Figure 9, in January, June, and September, the Sentinel–1 water extent is smaller than that derived from the data record of the Global Water Pack. The difference values are −130 km2 in January, −126 km2 in June, and −381 km2 in September 2016. The best agreement is shown in April and August, with differences of +20 km2 and +28 km2. The largest deviations occur in May and December, with differences of +423 km2 and +405 km2. The largest positive deviation (+423 km2) of the two datasets in relation to the mean water extent in 2016 of 1798 km2 (from Sentinel-1) is +23.5%, whereas the largest negative deviation (−381 km2) from the mean is −21.2%.
The largest difference between the Sentinel-1 lake water extent and the Global WaterPack occurs between the two maximum values of May 2016 (Sentinel-1: 2275 km2; Global WaterPack: 1852 km2). Figure 10 shows exemplary locations where Sentinel-1 is able to detect water areas that were not detected within the Global WaterPack—these areas are marked in green. Figure 10a shows mainly small-scale structured water areas, which can only be found in the Sentinel-1 lake water extent. In addition, the western part of Zone 2 (Figure 8) is shown in Figure 10b, in which narrow river channels are exclusively detected by Sentinel-1. The figure also shows that deviations only occur in the border zones between water and land. Given the fact that the Global WaterPack has a 250 m resolution, whereas our study presented here has a 10 m spatial resolution, and since our results are validated with in situ and higher spatial resolution optical data, it is postulated that the time series presented here is the most accurate flood dynamics analysis published to date.

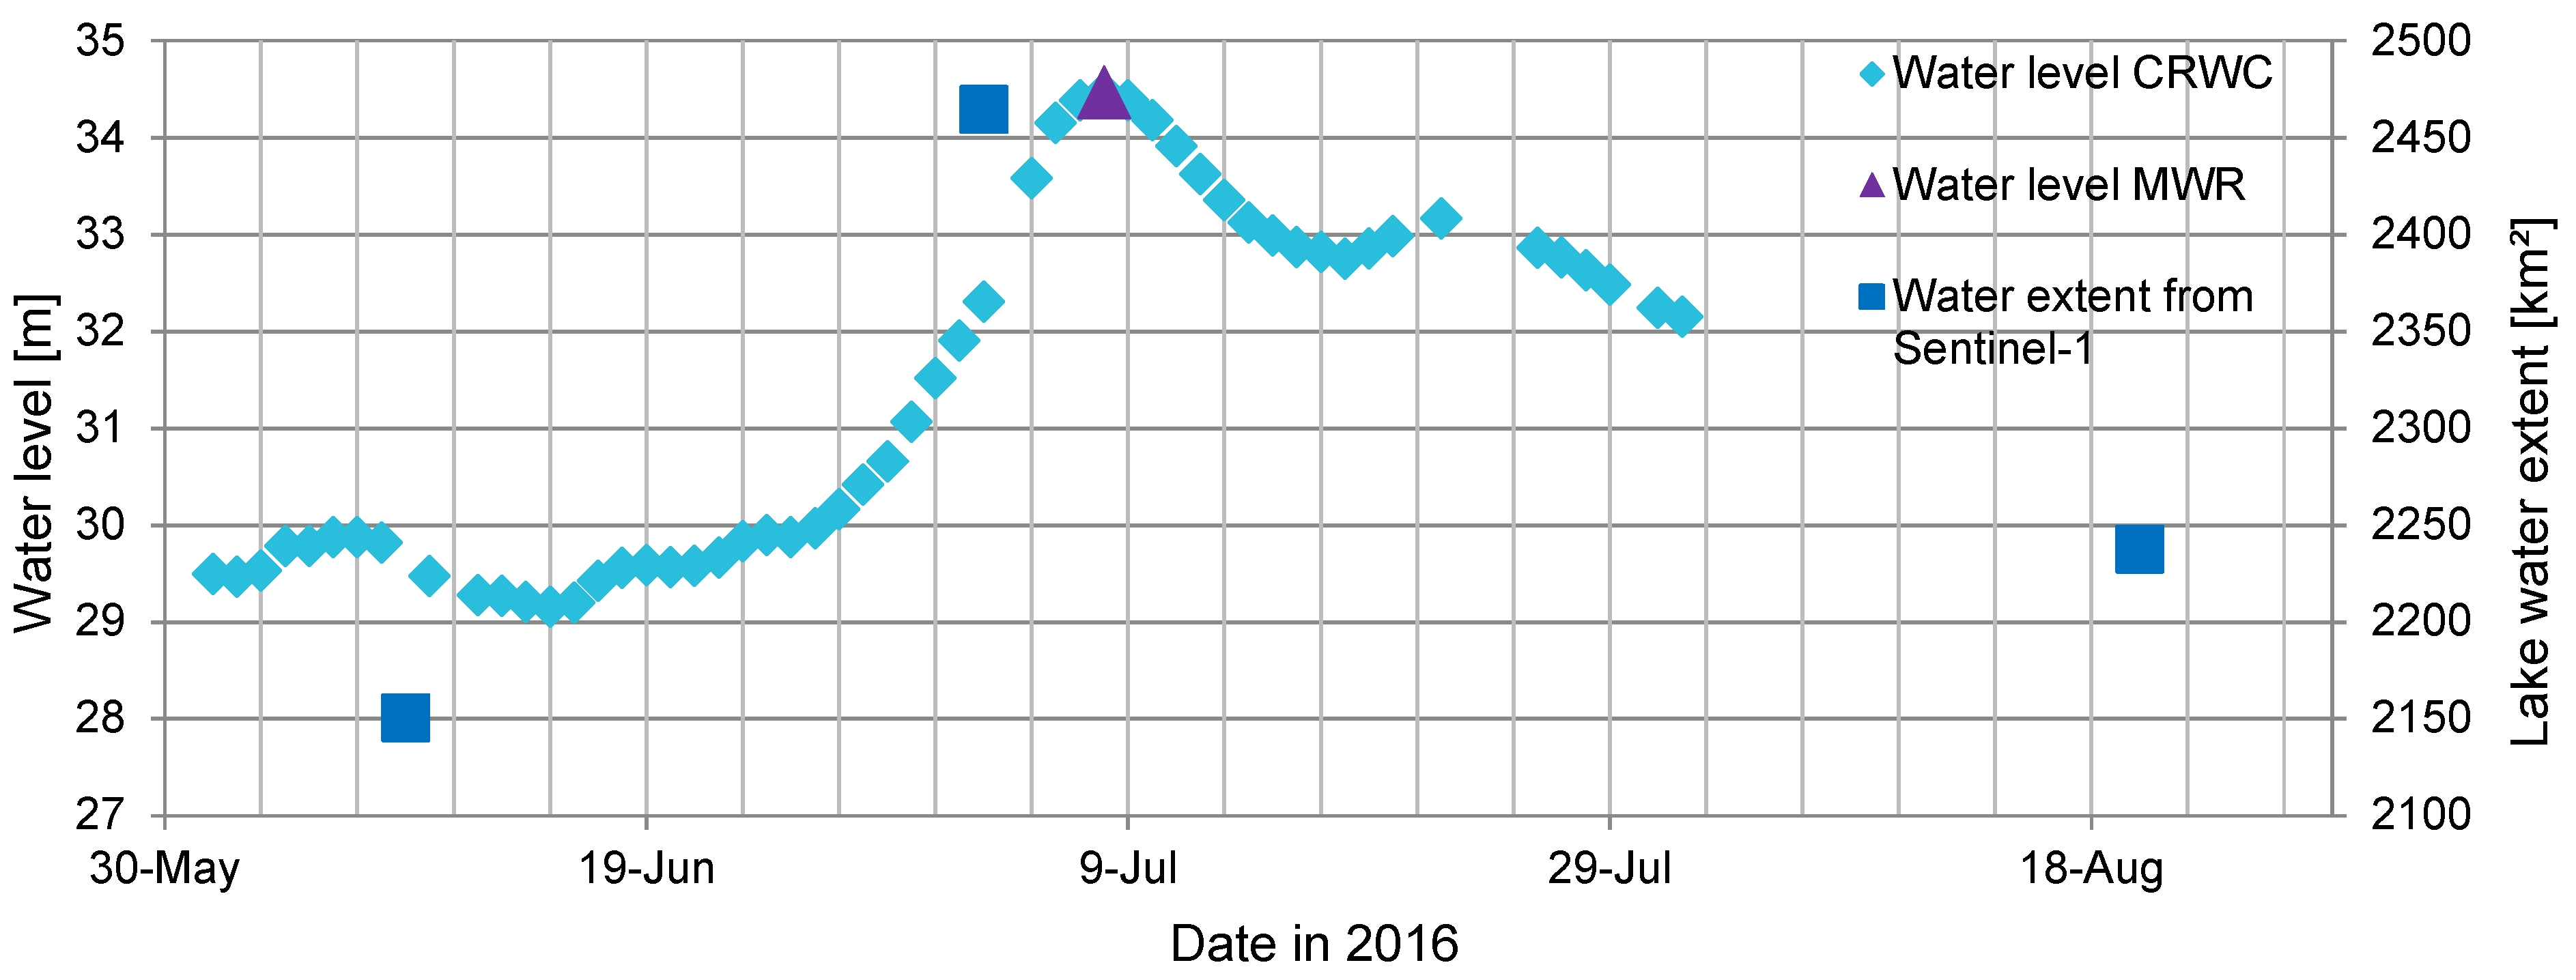
4.2. Relationship between Sentinel-1 Lake Water Extent and Water Level Measurements

Water level measurements from Chenglingji, the main hydrological station of Dongting Lake, were used. The station is located near the outflow/inflow to/from the main stem of the Yangtze River near Yueyang City in the northeast of the lake. Water level data published by the Yangtze River Commission (Chinese name: Changjiang Water Resource Commission (CWRC)) are used in this study to compare them with information generated from remote sensing data. Water level measurements are available from June 1 to August 1, 2016. In Figure 11, these almost daily water level data are displayed for the main flood months at Dongting Lake (see 4.1.) and compared to the lake water extents based on the satellite observations of June 9, July 3, and August 20. Even though we cannot quantitatively compare the water level data series for the whole year 2016, the relative increases of the water extent and water level are in good agreement.
In addition, the extreme water level information reported by the Chinese Ministry of Water Resources (MWR) [65] is also linked to water dispersion. The maximum water level was measured at 34.47 m on July 8 at Chenglingji Station (Figure 11), which is compatible with the maximum water area of July 3 derived from the EO data.

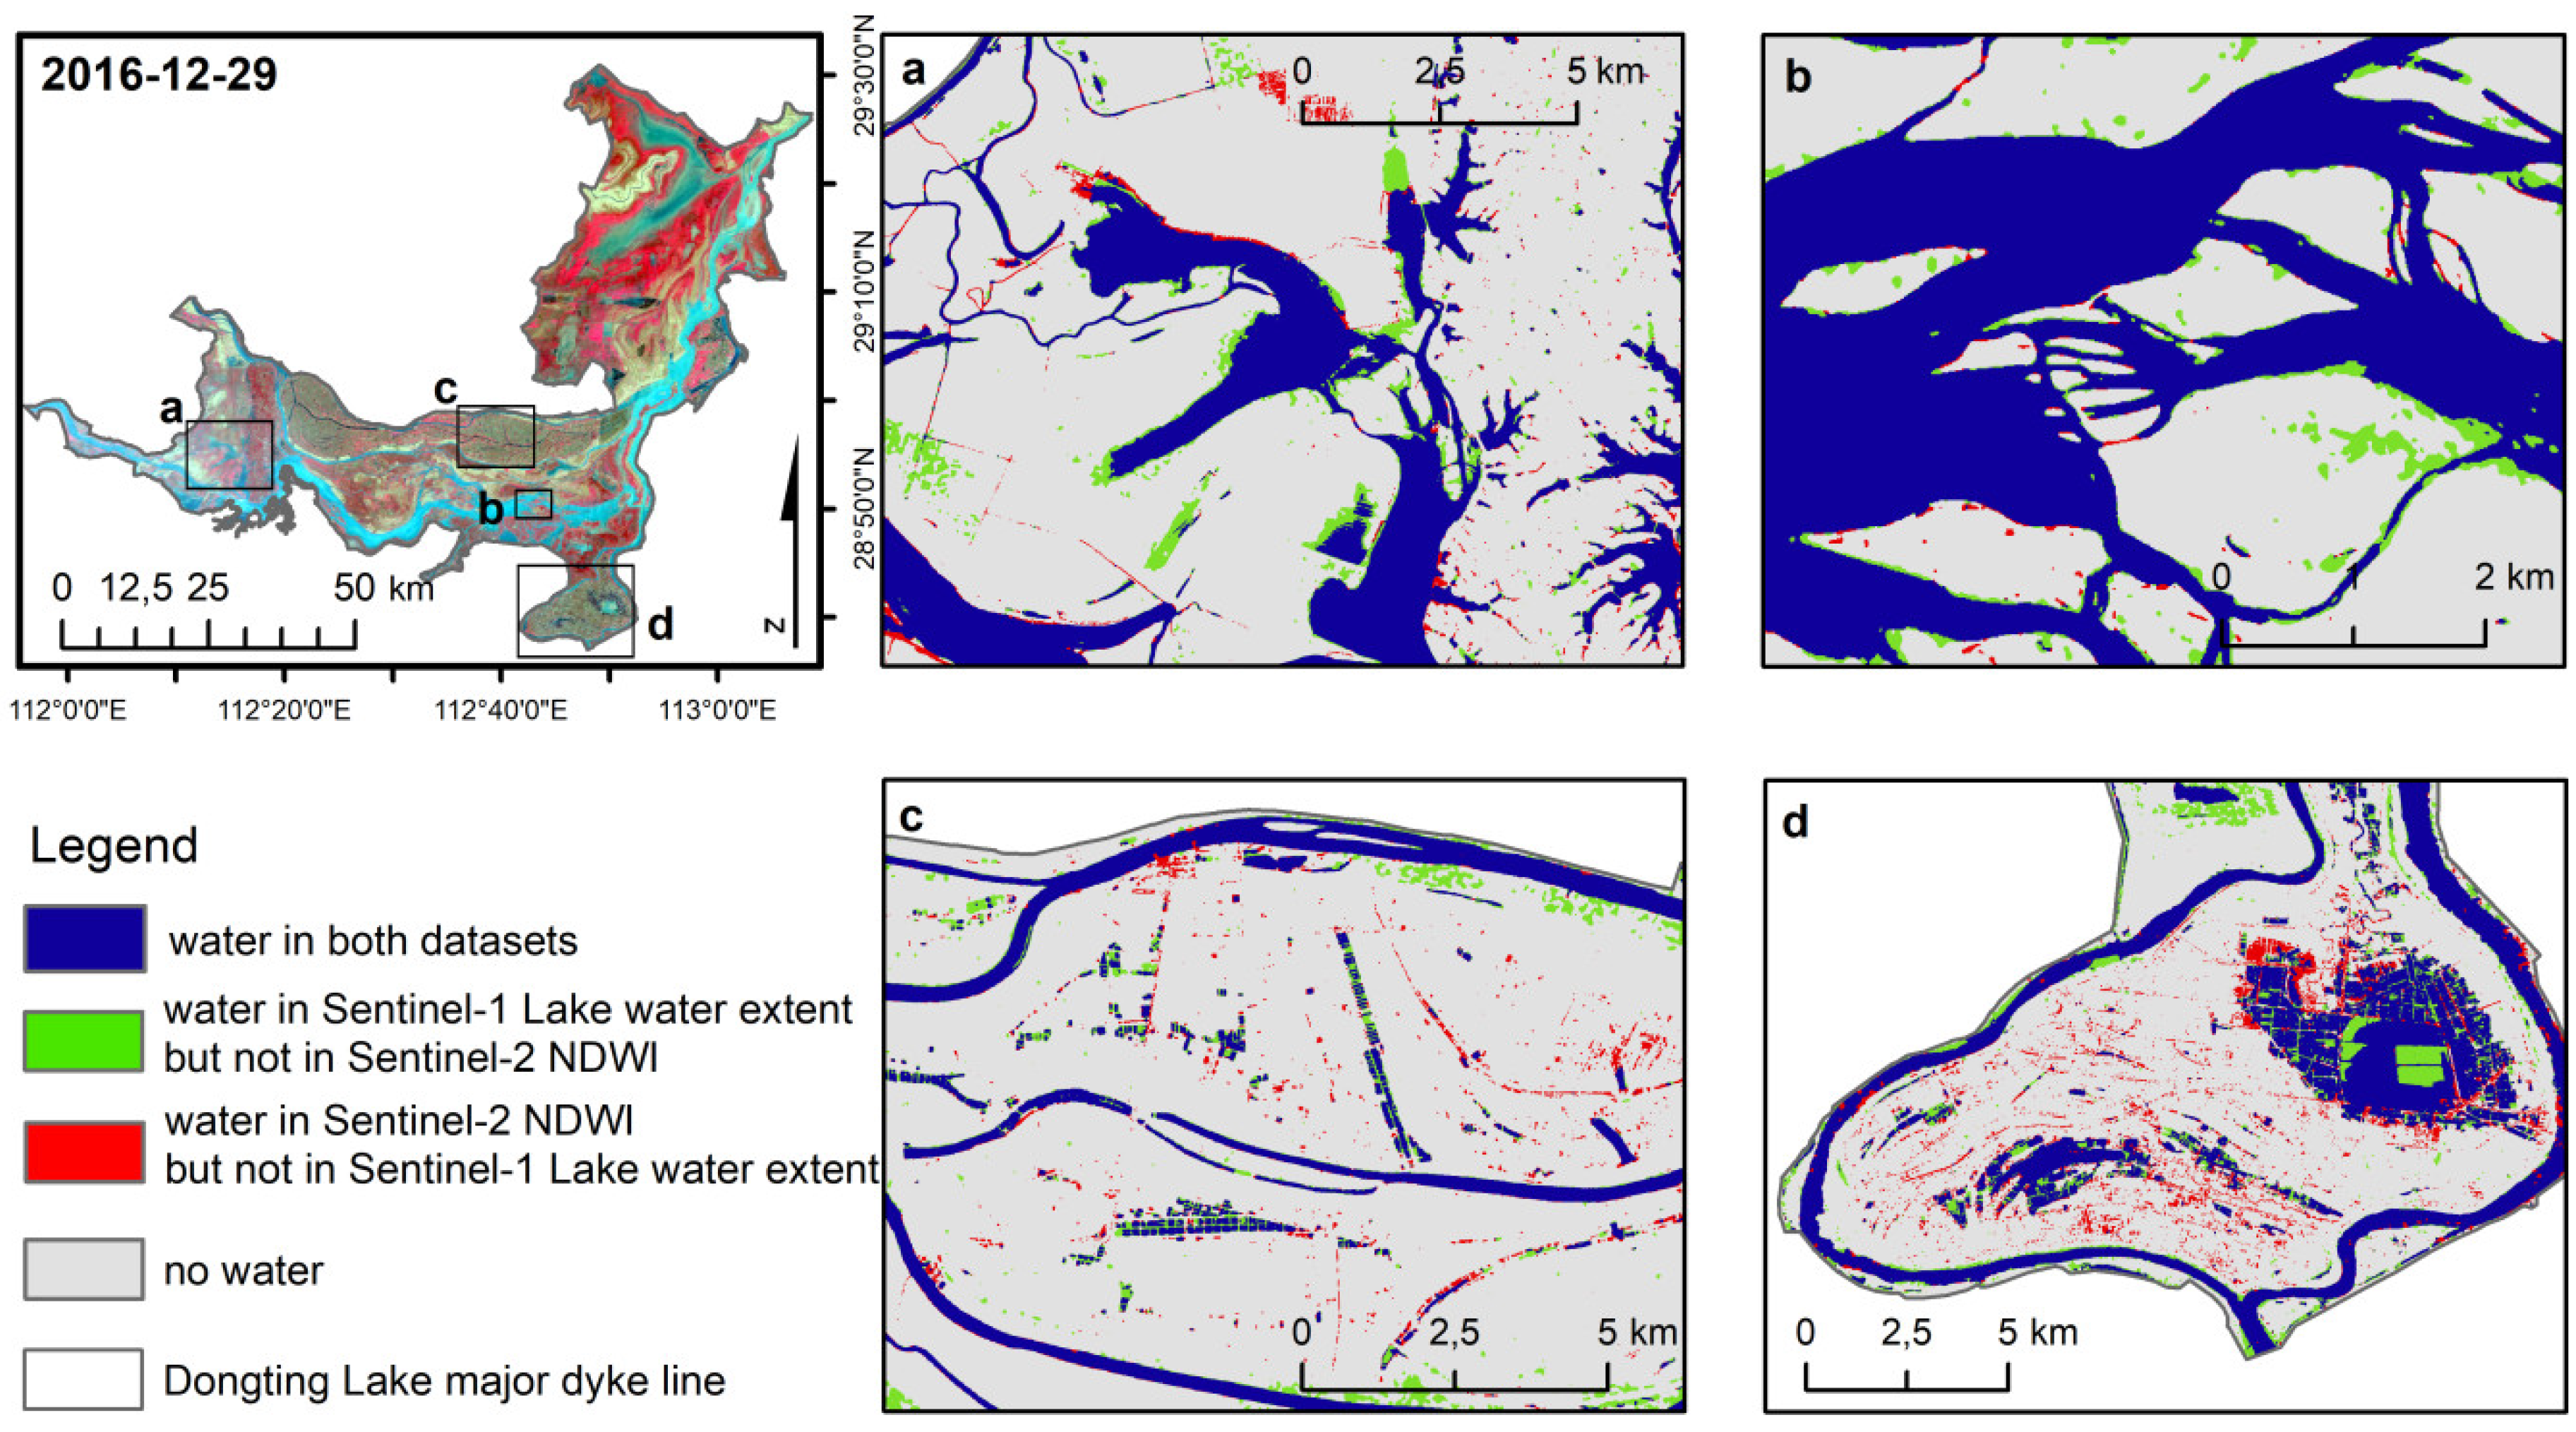
4.3. Relationship between the Sentinel-1 Lake Water Extent and Sentinel-2

The only cloud-free Sentinel-2 scene (from 29 December 2016), which has only one day difference to Sentinel-1 (from 30 December 2016), was used for indirect validation at a high spatial resolution of 10 m. The Normalized Difference Water Index (NDWI) was calculated from the green and near infrared bands, and a watermask was generated. The NDWI was developed by Mc Feeters [66] to define open water areas. Figure 12 shows the very good agreement between the watermasks of Sentinel-1 and Sentinel-2. The green areas in Figure 12a–d are water areas that were detected only by Sentinel-1, because the sediment content in the water is too high for it to be detected as water in Sentinel-2. Further deviations occur only in a few thin linear features and at the land–water border.

5. Discussion

In this study, Sentinel-1 data were used to map the monthly inundation patterns of the large Dongting Lake in unprecedented detail, not seen in any previous work. Challenges have been reported about cloud cover and the complex spectral conditions of lake water when only optical data are used [36,38]. A large share of the conducted analyses have used MODIS data and reported limitations due to low spatial resolution, while comprehensive information was derived from the high temporal resolution [33,35,36,38,40,67]. Compared to that, the following advantages of Sentinel-1, used here, can be clearly highlighted: i) the high spatial resolution of the Sentinel-1 data (10 m) that allows for a spatially high-detail analysis of surface water and related wetland patterns, ii) the temporal resolution of the Sentinel-1 time series allows for monthly wetland assessments, and iii) the Sentinel-1 lake water extent provides gap-free information from an active sensor, which is also available during cloudy periods. However, further aspects need to be discussed in the next sections.

5.1. Data Availability

In the first year of full coverage of the Sentinel-1 data (2016), Dongting Lake was recorded, on average, every 20 days, with at least one acquisition per month. This number of available Sentinel-1 scenes exceeds the availability of previous SAR data; for example, the Envisat ASAR satellite had a regular repeat cycle of 35 days in the Dongting Lake region before 2012 [68], as used by Ding and Li [39]. In addition, the two satellites available today—Sentinel-1 A and B—will most likely enable acquisitions with a 5 day repetition rate, as is currently being realized over Europe, [51]. Given the results of the analyses presented, which are very promising for 2016, this will lead to improved results for Dongting Lake in subsequent years.
Especially large and dynamically flooded wetlands are difficult to access for field investigations, as described for Dongting by Wang and Yesou [31], Hu et al. [40], and Wang et al. [35]. Due to large floods in 2016 that were observed by the author on site, field data were not acquired and indirect validation was applied here instead.

5.2. Spatio-Temporal Dynamics

As shown in Figure 10, Sentinel-1 is exclusively able to detect small-scale water areas. To complement the flood frequency maps of Dongting Lake from the MODIS data sources previously presented by Huang et al. [33], Hu et al. [40], and Wu and Liu [36], Sentinel-1 data can provide additional spatial information. This allows the differentiation of details related to natural wetland structures, like potential water bird habitats located at dynamically changing small lakes and ponds, as well as human-made wetland structures, such as narrow river channels (Figure 6a), small inundated agricultural areas, and aquaculture ponds (Figure 6c). In comparison with the time series data set Global WaterPack, although it has a much lower temporal resolution, the inundation frequency derived with Sentinel-1 shows very good agreement in the flood pattern. However, as seen in the differences in Figure 10, the daily data from Global WaterPack may reveal flooded areas that cannot be detected by Sentinel-1 during very dynamic flooding periods due to the higher temporal resolution. Combining the advantages of both data sources for flood mapping is a future task that could lead to further improved monitoring results.

5.3. Monitoring of Dynamics of Large Wetlands

Unusually heavy rain during the last El Niño event in 2015–2016 led to very rapid water propagation at Dongting Lake in 2016 that induced the most significant floods after 1998, 1999, and 2003 [60,69]. According to the Global WaterPack, 2016 emerges as the flood year with the third largest monthly maximum extent of Dongting Lake since mid-2003 (2289 km2 in July 2016), which is in good accordance with the Sentinel-1 lake water extent (2465 km2). In such extreme situations, the advantages of using Sentinel-1—the detailed determination of water expansion paired with wide area coverage—were not available before. Therefore, the results of this study are of interest to local authorities such as the Yueyang Hydrological Station (which was visited by the authors), who are concerned with flood warnings and flood impact assessment, and to authorities involved in estimating crop losses, health monitoring related to water-borne diseases such as schistosomiasis, the effects of sand dredging, and the navigability of the lake.
Moreover, monthly water extent maps from Sentinel-1 have been applied to detect the onset of flood and inundation processes. This information is useful to distinguish between the water management practices applied to different parts of the lake. Furthermore, the lake is an important wintering habitat for thousands of migratory birds such as the white-napped crane, Oriental stork, and lesser white fronted goose [46,70,71]. Information on water dynamics at landing, staging, and feeding places is of high relevance for conservationists such as the Dongting Lake Station for Wetland Ecosystem Research near the Ramsar site in the north of the lake.

5.4. Method and Validation

A stable and proven method for water detection from SAR satellite data was adapted for this study and used for the data processing of a Sentinel-1 time series. It has already been used and validated in other regions such as Vietnam [18,57]. Martinis et al. [58] investigated and validated the method in detail in comparison to other water detection algorithms. The overall accuracy was reported to be between 86% and 99%.
Since the collection of on-site ground truth data at the water–land border of Dongting Lake was hindered by floods in summer 2016, the time series had to be validated indirectly. The water extent was compared to the Global WaterPack dataset. The Sentinel-1 mean value of the monthly water expansion deviated by only 4% from this product. The water level at the Chenglingji water level station showed a similar tendency during the summer flood; the highest water level in 2016 was measured on July 8 at 34.47 m, close to the largest water extent of Dongting Lake, which was derived on July 3. The Sentinel-1 watermask was furthermore compared with the NDWI calculated from the Sentinel-2 data of a cloud-free date. They also show very good agreement.

5.5. Potential and limitations

For the studied wetland ecosystem—the large Yangtze floodpath lake Dongting in China—the Sentinel–1 time series delivered convincing results. Some limitations and potential sources of error must still be discussed here. As already published in the comparative validation study by Martinis et al. [58] with reference to further water detection approaches, submerged vegetation has a strong influence on the classification result. The roughness of the surface induced by vegetation alters the backscatter signal of the surface, and water is not detected reliably by the applied method. This effect can make it underestimate surface water in wetland ecosystems like Dongting Lake and can be counteracted by the use of quad-pol SAR data in subsequent studies. However, quad-pol data with high temporal frequency and high spatial resolution are not available to date because Sentinel-1 data are not (regularly) acquired in this mode, so another source would have to be used, like Radarsat data. Since Sentinel-1 provides dual-pol data in VV/VH polarizations, VV can contribute to the additional detection of submerged vegetation. Sensors that operate in the L-band can also make a major contribution due to the longer wavelength compared to the Sentinel-1 C-band but are not yet available at the required temporal resolution. Submerged vegetation must be detected to complement the results presented, but this is not the focus of this paper.
As concluded by Mahdavi et al. [30] and Gstaiger et al. [57], HH polarization and the ascending mode have the greatest potential for water detection. The data used here are collected in ascending orbit, but unfortunately, the HH polarization is not acquired by Sentinel-1. Furthermore, the wind also influences the surface roughness and thus the quality of the surface water detection, which can lead to an underestimation of the surface water, but, as known from Gstaiger et al. [57] and Brisco et al. [3], the C-band is less sensitive to wind-induced surface roughness. Nevertheless, the advantages of using SAR data, such as independence from clouds, far outweigh the potential difficulties.

6. Summary and Conclusions

This study presents the first high-resolution SAR time series monitoring of the very large and highly dynamic wetlands of Dongting Lake in China, which have not previously been monitored in such detail. The focus was on the detection and analysis of the spatio-temporal dynamics of the water surface extent of the Dongting Lake, an important Ramsar wetland site and a focus research region of the Sino-European Dragon Programme. The Sentinel-1 SAR time series—with a high spatial resolution (10 m), area-wide coverage, and relatively high temporal resolution (one to three acquisitions per month)—allows for the analysis of monthly water expansion. A well-established and tested threshold-based approach was used, which has proved to produce convincing results. The main findings are as follows: i) Sentinel-1 is exclusively capable of mapping the small-scale water areas and structures of Dongting Lake wetlands; ii) with the used Sentinel-1 time series, it is possible to map the wetland management practices of lake polders—for example, agricultural use was distinguished from natural flooding; and iii) the maximum extent of the lake was detected in July 2016 at 2465 km2, and the minimum water surface of 1331 km2 occurred in October 2016. The Sentinel-1 water extent of Dongting Lake is consistent with the DLR Global WaterPack, as the monthly mean value deviates by only 4%, thus providing good agreement with an available independent data set.
Large, dynamically changing wetlands, such as Dongting Lake, can be better analyzed to manage and plan for the future as a functioning wetland ecosystem. The spatio-temporal resolution of the results from the complete annual collection of the Sentinel-1 data provides information products that are of interest and relevance to local authorities involved in the management of water resources in the region. Detailed information on the monthly behavior of water expansion is applicable for flood impact assessment, lake navigability analyses, health monitoring (schistosomiasis risk), and crop loss estimation. The results also support the work of wetland conservationists in evaluating nature conservation concepts such as the Ramsar Convention. This has been confirmed during numerous talks with local authorities.
Furthermore, the presented methodology can be applied to other large and highly dynamic wetlands, such as neighboring Poyang Lake, and is expected to provide results of comparable quality.

Author Contributions

J.H. Sentinel-1 data processing, data analyses, method, writing of the first version of the manuscript; U.G. data analyses support, commenting and work on successive versions of the manuscript; C.K. supervision, commenting and work on the successive versions of the manuscript; I.K. processing of the DLR Global WaterPack; X.L. provision of local knowledge and commenting of final manuscript; H.Y. project LI, commenting of manuscript; N.O. commenting of final manuscript. All authors have read and agreed to the published version of the manuscript.

Funding

This research received no external funding. It was carried out in the framework of the ESA-MOST Dragon 4 Cooperation Program–within the project “New Earth Observations Tools for Water Resource and Quality Monitoring in Yangtze Wetlands and Lakes”–project ID.32442.

Acknowledgments

The authors like to thank the reviewers for the valuable comments. The authors like to thank the European Space Agency (ESA) for the provision of Sentinel-1 data. And the authors like to thank David Marshall for the final language check.

Conflicts of Interest

No potential conflict of interest was reported by the authors.

References

  1. Ramsar Ramsar Convention on Wetlands. Available online: https://www.ramsar.org/ (accessed on 8 May 2018).
  2. Mooney, H.A.; Cropper, A.; Leemans, R.; Arico, S.; Bridgewater, P.; Peterson, G.; Revenga, C.; Rivera, M.; Peter, A.W. Millenium Ecosystem Assesment 2005—Ecosystems and Human Well-Being: Wetlands and Water. Synthesis; UNEP: Washington, DC, USA, 2005. [Google Scholar]
  3. Brisco, B. Mapping and monitoring surface water and wetlands with synthetic aperture radar. In Remote Sensing of Wetlands; Tiner, R., Lang, M., Klemas, V., Eds.; CRC Press: Boca Raton, FL, USA, 2015; pp. 119–136. ISBN 978-1-4822-3735-1. [Google Scholar]
  4. Wang, Y. Using Landsat 7 TM data acquired days after a flood event to delineate the maximum flood extent on a coastal floodplain. Int. J. Remote Sens. 2004, 25, 959–974. [Google Scholar]
  5. Qi, S.; Brown, D.G.; Tian, Q.; Jiang, L.; Zhao, T.; Bergen, K.M. Inundation extent and flood frequency mapping using LANDSAT imagery and digital elevation models. GIScience Remote Sens. 2009, 46, 101–127. [Google Scholar]
  6. Zhang, F.; Zhu, X.; Liu, D. Blending MODIS and Landsat images for urban flood mapping. Int. J. Remote Sens. 2014, 35, 3237–3253. [Google Scholar] [CrossRef]
  7. Pekel, J.-F.; Cottam, A.; Gorelick, N.; Belward, A.S. High-resolution mapping of global surface water and its long-term changes. Nature 2016, 540, 418. [Google Scholar] [PubMed]
  8. Klein, I.; Gessner, U.; Dietz, A.; Kuenzer, C. Global WaterPack—A 250 m resolution dataset revealing the daily dynamics of global inland water bodies. Remote Sens. Environ. 2017, 198, 345–362. [Google Scholar] [CrossRef]
  9. Kuhwald, K.; Oppelt, N. Remote sensing for lake research and monitoring—Recent advances. Ecol. Indic. 2016, 64, 105–122. [Google Scholar]
  10. Hess, L.L.; Melack, J.M.; Filoso, S. Delineation of inundated area and vegetation along the Amazon floodplain with the SIR-C synthetic aperture radar. IEEE Trans. Geosci. Remote Sens. 1995, 33, 896–904. [Google Scholar]
  11. Horritt, M.S.; Mason, D.C.; Luckman, A.J. Flood boundary delineation from Synthetic Aperture Radar imagery using a statistical active contour model. Int. J. Remote Sens. 2001, 22, 2489–2507. [Google Scholar]
  12. Pierdicca, N.; Pulvirenti, L.; Chini, M.; Guerriero, L.; Candela, L. Observing floods from space: Experience gained from COSMO-SkyMed observations. Acta Astronaut. 2013, 84, 122–133. [Google Scholar] [CrossRef]
  13. Oberstadler, R.; Hoensch, H.; Huth, D. Assessment of the mapping capabilities of ERS-1 SAR data for flood mapping: A case study in Germany. Hydrol. Process. 1997, 11, 1415–1425. [Google Scholar] [CrossRef]
  14. Mouratidis, A.; Sarti, F. Flash-flood monitoring and damage assessment with SAR data: Issues and future challenges for earth observation from space sustained by case studies from the Balkans and Eastern Europe. In Earth Observation of Global Changes (EOGC) SE—8; Krisp, J.M., Meng, L., Pail, R., Stilla, U., Eds.; Lecture Notes in Geoinformation and Cartography; Springer: Berlin/Heidelberg, Germany, 2013; pp. 125–136. ISBN 978-3-642-32713-1. [Google Scholar]
  15. Zhang, J.; Zhou, C.; Xu, K.; Watanabe, M. Flood disaster monitoring and evaluation in China. Glob. Environ. Chang. Part B Environ. Hazards 2002, 4, 33–43. [Google Scholar] [CrossRef]
  16. Ozesmi, S.L.; Bauer, M.E. Satellite remote sensing of wetlands. Wetl. Ecol. Manag. 2002, 10, 381–402. [Google Scholar]
  17. Hess, L.L. Dual-season mapping of wetland inundation and vegetation for the central Amazon basin. Remote Sens. Environ. 2003, 87, 404–428. [Google Scholar] [CrossRef]
  18. Kuenzer, C.; Guo, H.; Huth, J.; Leinenkugel, P.; Li, X.; Dech, S. Flood mapping and flood dynamics of the Mekong delta: ENVISAT-ASAR-WSM based time series analyses. Remote Sens. 2013, 5, 687–715. [Google Scholar]
  19. Kuenzer, C.; Guo, H.; Schlegel, I.; Vo Quoc, T.; Li, X.; Dech, S. Varying scale and capability of Envisat ASAR-WSM, TerraSAR-X Scansar and TerraSAR-X Stripmap data to assess urban flood situations: A case study of the Mekong delta in can Tho province. Remote Sens. 2013, 5, 5122–5142. [Google Scholar]
  20. Bouvet, A.; Le Toan, T. Monitoring of the rice cropping system in the Mekong delta using ENVISAT/ASAR dual polarization data. IEEE Transactions on Geosci. Remote Sens. 2009, 47, 517–526. [Google Scholar] [CrossRef] [Green Version]
  21. Clauss, K.; Ottinger, M.; Kuenzer, C. Mapping rice areas with Sentinel-1 time series and superpixel segmentation. Int. J. Remote Sens. 2017, 39, 1399–1420. [Google Scholar] [CrossRef] [Green Version]
  22. Kuenzer, C.; Knauer, K. Remote sensing of rice crop areas. Int. J. Remote Sens. 2013, 34, 2101–2139. [Google Scholar] [CrossRef]
  23. Chaouch, N.; Temimi, M.; Hagen, S.; Weishampel, J.; Medeiros, S.; Khanbilvardi, R. A synergetic use of satellite imagery from SAR and optical sensors to improve coastal flood mapping in the Gulf of Mexico. Hydrol. Process. 2012, 26, 1617–1628. [Google Scholar]
  24. Hoque, R.; Nakayama, D.; Matsuyama, H.; Matsumoto, J. Flood monitoring, mapping and assessing capabilities using RADARSAT remote sensing, GIS and ground data for Bangladesh. Nat. Hazards 2011, 57, 525–548. [Google Scholar] [CrossRef]
  25. Martinis, S.; Kuenzer, C.; Twele, A. Flood studies using synthetic aperture radar data. In Remote Sensing Handbook Volume III—Remote Sensing of Water Resources, Disasters, and Urban Studies; Thenkabail, P., Ed.; Taylor and Francis: Oxfordshire, UK, 2015; pp. 145–173. ISBN 978-1-4822-1791-9. [Google Scholar]
  26. Mason, D.; Speck, R.; Devereux, B. Flood detection in urban areas using TerraSAR-X. IEEE Trans. Geosci. Remote Sens. 2010, 48, 882–893. [Google Scholar] [CrossRef] [Green Version]
  27. Schumann, G.J.-P.; Neal, J.C.; Mason, D.C.; Bates, P.D. The accuracy of sequential aerial photography and SAR data for observing urban flood dynamics, a case study of the UK summer 2007 floods. Remote Sens. Environ. 2011, 115, 2536–2546. [Google Scholar]
  28. Yesou, H.; Huber, C.; Haouet, S.; Lai, X.; Huang, S.; de Fraipont, P.; Desnos, Y.L. Exploiting Sentinel 1 time series to monitor the largest fresh water bodies in PR China, the Poyang Lake. In Proceedings of the 2016 IEEE International Geoscience and Remote Sensing Symposium (IGARSS), Beijing, China, 10–15 July 2016; pp. 3882–3885. [Google Scholar]
  29. Kuenzer, C.; Huth, J.; Martinis, S.; Lu, L.; Dech, S. SAR time series for the analysis of inundation patterns in the Yellow River Delta, China. In Remote Sensing Time Series; Kuenzer, C., Dech, S., Wagner, W., Eds.; Remote Sensing and Digital Image Processing; Springer: Cham, Switzerland, 2015; ISBN 978-3-319-15967-6. [Google Scholar]
  30. Mahdavi, S.; Salehi, B.; Granger, J.; Amani, M.; Brisco, B.; Huang, W. Remote sensing for wetland classification: A comprehensive review. GIScience Remote Sens. 2018, 55, 623–658. [Google Scholar] [CrossRef]
  31. Wang, Y.; Yésou, H. Remote Sensing of Floodpath Lakes and Wetlands: A challenging frontier in the monitoring of changing environments. Remote Sens. 2018, 10, 1955. [Google Scholar]
  32. Yesou, H.; Huber, C.; Lai, X.; Averty, S.; Li, J.; Daillet, S.; Bergé-Nguyen, M.; Chen, X.; Huang, S.; Burnham, J.; et al. Nine years of water resources monitoring over the middle reaches of the Yangtze River, with ENVISAT, MODIS, Beijing-1 time series, Altimetric data and field measurements. Lakes Reserv. Res. Manag. 2011, 16, 231–247. [Google Scholar]
  33. Huang, S.; Li, J.; Xu, M. Water surface variations monitoring and flood hazard analysis in Dongting Lake area using long-term Terra/MODIS data time series. Nat. Hazards 2012, 62, 93–100. [Google Scholar] [CrossRef]
  34. Feng, L.; Hu, C.; Chen, X.; Zhao, X. Dramatic inundation changes of China’s two largest freshwater lakes linked to the three gorges dam. Environ. Sci. Technol. 2013, 47, 9628–9634. [Google Scholar] [CrossRef]
  35. Wang, J.; Sheng, Y.; Tong, T.S.D. Monitoring decadal lake dynamics across the Yangtze Basin downstream of Three Gorges Dam. Remote Sens. Environ. 2014, 152, 251–269. [Google Scholar] [CrossRef]
  36. Wu, G.; Liu, Y. Mapping dynamics of inundation patterns of Two Largest River-Connected Lakes in China: A comparative study. Remote Sens. 2016, 8, 560. [Google Scholar] [CrossRef] [Green Version]
  37. Cai, X.; Feng, L.; Hou, X.; Chen, X. Remote sensing of the water storage dynamics of Large Lakes and reservoirs in the Yangtze River Basin from 2000 to 2014. Sci. Rep. 2016, 6, 36405. [Google Scholar] [CrossRef] [Green Version]
  38. Xing, L.; Niu, Z.; Xu, P.; Li, D. Wetlands classification and assessment of Ramsar sites in China based on time series Moderate Resolution Imaging Spectroradiometer (MODIS) imagery. Mar. Freshw. Res. 2018, 69, 658–668. [Google Scholar] [CrossRef]
  39. Ding, X.; Li, X. Monitoring of the water-area variations of Lake Dongting in China with ENVISAT ASAR images. Int. J. Appl. Earth Obs. Geoinf. 2011, 13, 894–901. [Google Scholar] [CrossRef]
  40. Hu, Y.; Huang, J.; Du, Y.; Han, P.; Huang, W. Monitoring spatial and temporal dynamics of flood regimes and their relation to wetland landscape patterns in Dongting Lake from MODIS time-series imagery. Remote Sens. 2015, 7, 7494–7520. [Google Scholar] [CrossRef] [Green Version]
  41. Lai, X.; Liang, Q.; Jiang, J.; Huang, Q. Impoundment effects of the three-gorges-dam on flow regimes in Two China’s Largest Freshwater Lakes. Water Resour. Manag. 2014, 28, 5111–5124. [Google Scholar] [CrossRef]
  42. Peng, D.; Xiong, L.; Guo, S.; Shu, N. Study of Dongting Lake area variation and its influence on water level using MODIS data. Hydrol. Sci. J. 2005, 50, 31–44. [Google Scholar] [CrossRef]
  43. Yang, B.; Zeng, F.; Yuan, M.; Li, D.; Qiu, Y.; Li, J. Measurement of Dongting Lake area based on visual interpretation of polders. Procedia Environ. Sci. 2011, 10, 2684–2689. [Google Scholar] [CrossRef] [Green Version]
  44. Davis, T.J. The Ramsar Convention Manual: A Guide to the Convention on Wetlands. Available online: https://portals.iucn.org/library/node/7298 (accessed on 27 January 2020).
  45. Ramsar Convention the Annotated Ramsar List, China. Available online: http://archive.ramsar.org/cda/en/ramsar-documents-list-anno-china/main/ramsar/1-31-218%5E16477_4000_0__ (accessed on 8 May 2018).
  46. Ramsar Convention Ramsar Sites Information Service. Available online: https://rsis.ramsar.org/ris-search/Dongting (accessed on 8 May 2018).
  47. An, A.; Cao, L.; Jia, Q.; Wang, X.; Zhu, Q.; Zhang, J.; Ye, X.; Gao, D. Changing abundance and distribution of the wintering swan goose Anser cygnoides in the middle and lower Yangtze River Floodplain: An investigation combining a field survey with satellite telemetry. Sustainability 2019, 11, 1398. [Google Scholar] [CrossRef] [Green Version]
  48. Cao, L.; Zhang, Y.; Barter, M.; Lei, G. Anatidae in eastern China during the non-breeding season: Geographical distributions and protection status. Biol. Conserv. 2010, 143, 650–659. [Google Scholar] [CrossRef]
  49. Fox, A.D.; Lei, C.; Barter, M.; Rees, E.C.; Hearn, R.D.; Hao, C.P.; Xin, W.; Yong, Z.; Tao, D.S.; Fang, S.X. The functional use of East Dongting Lake, China, by wintering geese. Wildfowl 2013, 58, 3–19. [Google Scholar]
  50. Esch, T.; Marconcini, M.; Felbier, A.; Roth, A.; Heldens, W.; Huber, M.; Schwinger, M.; Taubenböck, H.; Müller, A.; Dech, S. Urban footprint processor—Fully automated processing chain generating settlement masks from global data of the TanDEM-X mission. IEEE Geosci. Remote. Sens. Lett. 2013, 10, 1617–1621. [Google Scholar] [CrossRef] [Green Version]
  51. ESA ESA Sentinel Acquisition Scheme. Available online: https://sentinel.esa.int/web/sentinel/missions/sentinel-1/observation-scenario/archive (accessed on 4 May 2018).
  52. Sentinel-1 Team Sentinel-1 SAR User Guide Introduction. Available online: https://sentinels.copernicus.eu/web/sentinel/user-guides/sentinel-1-sar (accessed on 27 January 2020).
  53. Ottinger, M.; Clauss, K.; Kuenzer, C. Large-scale assessment of coastal aquaculture ponds with sentinel-1 time series data. Remote Sens. 2017, 9, 440. [Google Scholar] [CrossRef] [Green Version]
  54. Richards, J.A.; Jia, X. Remote Sensing Digital Image Analysis. An Introduction; Springer: Berlin, Germany, 1999; ISBN 3-540-64860-7. [Google Scholar]
  55. Zhou, C.; Luo, J.; Yang, C.; Li, B.; Wang, S. Flood monitoring using multi-temporal AVHRR and RADARSAT imagery. Photogramm. Eng. Remote Sens. Spec. Issue Geospat. Technol. China 2000, 66, 633–638. [Google Scholar]
  56. Campbell, J.B. Introduction to Remote Sensing, 4th ed.; Taylor & Francis: London, UK, 2006; ISBN 0-415-41688-4. [Google Scholar]
  57. Gstaiger, V.; Huth, J.; Gebhardt, S.; Kuenzer, C.; Wehrmann, T. Multi-sensoral and automated derivation of inundated areas using TerraSAR-X and ENVISAT ASAR data. Int. J. Remote Sens. 2012, 33, 7291–7304. [Google Scholar] [CrossRef]
  58. Martinis, S.; Kuenzer, C.; Wendleder, A.; Huth, J.; Twele, A.; Roth, A.; Dech, S. Comparing four operational SAR-based water and flood detection approaches. Int. J. Remote Sens. 2015, 36, 3519–3543. [Google Scholar] [CrossRef]
  59. Chen, Z.; Li, J.; Shen, H.; Zhanghua, W. Yangtze River of China: Historical analysis of discharge variability and sediment flux. Geomorphology 2001, 41, 77–91. [Google Scholar] [CrossRef]
  60. Yuan, Y.; Gao, H.; Li, W.; Liu, Y.; Chen, L.; Zhou, B.; Ding, Y. The 2016 summer floods in China and associated physical mechanisms: A comparison with 1998. J. Meteorol. Res. 2017, 31, 261–277. [Google Scholar] [CrossRef]
  61. Maclean, J.; Hardy, B.; Hettel, G. International Rice Research Institute—IRRI—Rice Almanac, 4th ed.; Rice Alamanc; International Rice Research Institute: Los Baños, Philippines, 2013; Volume 4, ISBN 978-971-22-0300-8. [Google Scholar]
  62. Climate-Data.org Climate in Yueyang. Available online: https://de.climate-data.org/asien/china/hunan/yueyang-2709/ (accessed on 25 March 2019).
  63. Klein, I.; Dietz, A.; Gessner, U.; Dech, S.; Kuenzer, C. Results of the Global WaterPack: A novel product to assess inland water body dynamics on a daily basis. Remote Sens. Lett. 2015, 6, 78–87. [Google Scholar] [CrossRef]
  64. Kuenzer, C.; Klein, I.; Ullmann, T.; Georgiou, E.F.; Baumhauer, R.; Dech, S. Remote sensing of river delta inundation: Exploiting the potential of coarse spatial resolution, temporally-dense MODIS time series. Remote Sens. 2015, 7, 8516–8542. [Google Scholar] [CrossRef] [Green Version]
  65. MWR Annual Water Regime Report of China. Available online: http://www.mwr.gov.cn/sj/tjgb/sqnb/201708/t20170810_973261.html (accessed on 1 February 2019).
  66. Mcfeeters, S.K. The use of the Normalized Difference Water Index (NDWI) in the delineation of open water features. Int. J. Remote Sens. 1996, 17, 1425–1432. [Google Scholar] [CrossRef]
  67. Feng, L.; Han, X.; Hu, C.; Chen, X. Four decades of wetland changes of the largest freshwater lake in China: Possible linkage to the Three Gorges Dam? Remote Sens. Environ. 2016, 176, 43–55. [Google Scholar] [CrossRef]
  68. ESA ASAR Product Handbook. Available online: http://envisat.esa.int/handbooks/asar/CNTR.html (accessed on 27 January 2020).
  69. World Meteorological Organization. WMO Statement on the State of the Global Climate in 2016; World Meteorological Organization: Geneva, Switzerland, 2017; p. 24. [Google Scholar]
  70. Cong, P.; Wang, X.; Cao, L.; Fox, A.D. Within-winter shifts in lesser white-fronted goose anser erythropus distribution at East Dongting Lake, China. Arde 2012, 100, 5–11. [Google Scholar] [CrossRef] [Green Version]
  71. Wang, X.; Fox, A.D.; Cong, P.; Barter, M.; Cao, L. Changes in the distribution and abundance of wintering Lesser White-fronted Geese Anser erythropus in eastern China. Bird Conserv. Int. 2012, 22, 128–134. [Google Scholar] [CrossRef] [Green Version]
Figure 1. Dongting Lake field visit impressions—high dykes (a); wetland vegetation, reeds, and poplar trees, partly managed area (b); large shipping traffic near Yueyang (c); poplar plantation on elevated ground due to dropped leaves (e); mixed wetland vegetation, partly flooded area (d,f)—pictures/source: J. Huth; C. Kuenzer.
Remotesensing 12 01761 g001
Figure 2. The Dongting Lake region (large map) with the location of three Ramsar Wetland sites, Global Urban Footprint data [50] representing information on settlements, and the location of Dongting Lake in the middle of the Yangtze River catchment (small map).
Remotesensing 12 01761 g002
Figure 3. Workflow of the conducted processing steps (adapted from [18]).
Remotesensing 12 01761 g003
Figure 4. Dongting Lake water surface extent (blue) of fully diked area—the 12 sub-figures show the monthly maximum maps from January to December, 2016.
Remotesensing 12 01761 g004
Figure 5. Dongting Lake monthly maximum water surface extent in 2016 as a percentage of the fully diked area.
Remotesensing 12 01761 g005
Figure 6. Inundation frequency map for 2016 at Dongting Lake displaying the duration of inundation in months (top) with detail maps (ad).
Remotesensing 12 01761 g006
Figure 7. Month of the start of inundation at Dongting Lake in 2016 (top) with detail maps (ad).
Remotesensing 12 01761 g007
Figure 8. Percentage increase of inundation per month for five embankment zones according to [43]. The increase is shown as a percentage of the area of the respective zone.
Remotesensing 12 01761 g008
Figure 9. Dongting Lake water extents from Sentinel-1 and Global Water Pack.
Remotesensing 12 01761 g009
Figure 10. Difference map of Dongting Lake water extent from Sentinel-1 (nearest neighbor resampling to 250 m MODIS spatial resolution) and Global WaterPack for May 2016 (left). Figure 10a,b show details in polders.
Remotesensing 12 01761 g010
Figure 11. Real-time water regime observations at the hydrological station Chenglingji during the flood season of 2016. Source: MWR and Changjiang Water Resources Commission (CWRC)—combined with the water extent derived from Sentinel-1.
Remotesensing 12 01761 g011
Figure 12. Difference maps of the water extent of Dongting Lake from Sentinel-1, recorded on 30 December 2016, and the Normalized Difference Water Index (NDWI) calculated from the Sentinel-2 data recorded on 29 December 2016—left: overview map of the Sentinel-2 data set in false color band combination, right (ad): difference maps.
Remotesensing 12 01761 g012
Table 1. Sentinel-1 imagery study details; 36 scenes were available over 18 acquisition dates.
Month of the YearSentinel 1 Data Set IdentifierDate of AcquisitionCoverages Per Month
JanuaryS1A_IW_GRDH_1SDV_20160117T103452_20160117T103517_009533_00DD94_C3662016/1/171
S1A_IW_GRDH_1SDV_20160117T103517_20160117T103551_009533_00DD94_08EC
FebruaryS1A_IW_GRDH_1SDV_20160210T103452_20160210T103517_009883_00E7C2_3BFB2016/2/101
S1A_IW_GRDH_1SDV_20160210T103517_20160210T103542_009883_00E7C2_A023
MarchS1A_IW_GRDH_1SDV_20160305T103452_20160305T103517_010233_00F1DB_1F272016/3/52
S1A_IW_GRDH_1SDV_20160305T103517_20160305T103550_010233_00F1DB_104C
S1A_IW_GRDH_1SDV_20160329T103453_20160329T103518_010583_00FBDA_05462016/3/29
S1A_IW_GRDH_1SDV_20160329T103518_20160329T103543_010583_00FBDA_4354
AprilS1A_IW_GRDH_1SDV_20160422T103453_20160422T103518_010933_010659_36212016/4/221
S1A_IW_GRDH_1SDV_20160422T103518_20160422T103543_010933_010659_CD91
MayS1A_IW_GRDH_1SDV_20160516T103457_20160516T103522_011283_011177_3CB52016/5/161
S1A_IW_GRDH_1SDV_20160516T103522_20160516T103547_011283_011177_4CEE
JuneS1A_IW_GRDH_1SDV_20160609T103459_20160609T103524_011633_011CB0_5A052016/6/91
S1A_IW_GRDH_1SDV_20160609T103524_20160609T103549_011633_011CB0_EC47
JulyS1A_IW_GRDH_1SDV_20160703T103500_20160703T103525_011983_0127C5_F17D2016/7/31
S1A_IW_GRDH_1SDV_20160703T103525_20160703T103550_011983_0127C5_F841
AugustS1A_IW_GRDH_1SDV_20160820T103503_20160820T103528_012683_013ED7_78522016/8/201
S1A_IW_GRDH_1SDV_20160820T103528_20160820T103553_012683_013ED7_B6C8
SeptemberS1A_IW_GRDH_1SDV_20160925T103504_20160925T103529_013208_015034_63962016/9/251
S1A_IW_GRDH_1SDV_20160925T103529_20160925T103554_013208_015034_7BD5
OctoberS1A_IW_GRDH_1SDV_20161007T103504_20161007T103529_013383_0155AE_9A8A2016/10/73
S1A_IW_GRDH_1SDV_20161007T103529_20161007T103554_013383_0155AE_F802
S1A_IW_GRDH_1SDV_20161019T103504_20161019T103529_013558_015B44_26C22016/10/19
S1A_IW_GRDH_1SDV_20161019T103529_20161019T103554_013558_015B44_648B
S1A_IW_GRDH_1SDV_20161031T103504_20161031T103529_013733_01609E_A40B2016/10/31
S1A_IW_GRDH_1SDV_20161031T103529_20161031T103554_013733_01609E_93DC
NovemberS1A_IW_GRDH_1SDV_20161112T103504_20161112T103529_013908_01662D_487A2016/11/122
S1A_IW_GRDH_1SDV_20161112T103529_20161112T103554_013908_01662D_1128
S1A_IW_GRDH_1SDV_20161124T103504_20161124T103529_014083_016B78_A2992016/11/24
S1A_IW_GRDH_1SDV_20161124T103529_20161124T103554_014083_016B78_B103
DecemberS1A_IW_GRDH_1SDV_20161206T103503_20161206T103528_014258_0170F8_7A652016/12/63
S1A_IW_GRDH_1SDV_20161206T103528_20161206T103553_014258_0170F8_705A
S1A_IW_GRDH_1SDV_20161218T103503_20161218T103528_014433_01767A_31072016/12/18
S1A_IW_GRDH_1SDV_20161218T103528_20161218T103553_014433_01767A_0F07
S1A_IW_GRDH_1SDV_20161230T103503_20161230T103528_014608_017BF2_2FE12016/12/30
S1A_IW_GRDH_1SDV_20161230T103528_20161230T103553_014608_017BF2_F74E
Table 2. List of zones of different use within Dongting Lake.
ZoneNameDescription of UseSource
1Chengxiagricultural useadapted from [43]
2Gongshuangshamixed useadapted from [43]
3Zhongzhoumixed useadapted from [43]
4East Dongting Lakenatural zonedigitized, own definition
5South Dongting Lakenatural zonedigitized, own definition

