Identification and Analysis of Microscale Hydrologic Flood Impacts Using Unmanned Aerial Systems


1
Department of Geosciences, Mississippi State University, Mississippi State, MS 39762, USA
2
Northern Gulf Institute, Mississippi State University, Starkville, MS 39759, USA
*
Author to whom correspondence should be addressed.
Remote Sens. 2020, 12(10), 1549; https://doi.org/10.3390/rs12101549
Submission received: 15 April 2020
/
Revised: 4 May 2020
/
Accepted: 11 May 2020
/
Published: 13 May 2020
(This article belongs to the Special Issue Unmanned Aerial Systems for Surface Hydrology)
Abstract
:The need for accurate and spatially detailed hydrologic information is critical due to the microscale influences on the severity and distribution of flooding, and new and/or updated approaches in observations of river systems are required that are in line with the current push towards microscale numerical simulations. In response, the aim of this project is to define and illustrate the hydrologic response of river flooding relative to microscale surface properties by using an unmanned aerial system (UAS) with dedicated imaging, sensor, and communication packages for data collection. As part of a larger project focused on increasing situational awareness during flood events, a fixed-wing UAS was used to overfly areas near Greenwood, MS before and during a flood event in February 2019 to provide high-resolution visible and infrared imagery for analysis of hydrologic features. The imagery obtained from these missions provide direct examples of fine-scale surface features that can alter water level and discharge, such as built structures (i.e., levees and bridges), natural storage features (low-lying agricultural fields), and areas of natural resistance (inundated forests). This type of information is critical in defining where and how to incorporate high-resolution information into hydrologic models and also provides an invaluable dataset for eventual verification of hydrologic simulations through inundation mapping.
1. Introduction
Flooding at a regional scale poses a serious risk to lives and property, especially those in or near low-lying areas; therefore, accurate diagnosis and prediction of flooding conditions (i.e., water depth and extent), as well as factors that can modify these conditions (i.e., built features, surface water storage, complex channel geometry), is critical for accurate forecasts of river conditions. Unfortunately, many of these factors exist and/or influence hydrologic characteristics at small spatial scales, which can modify and augment larger-scale processes related to atmospheric conditions. As a result, proper consideration of scale must be considered when developing prediction/diagnostic strategies for microscale hydrologic applications, especially considering that high spatial resolution applications require more data in both space and time for initial and boundary conditions.
While river gauges provide invaluable point-scale water level/discharge estimates at select locations, the lack of real-time data on inundated areas adjacent to river channels is a major limitation to accurate assessment of existing flood conditions. Satellite-based products are often used to enhance the situational awareness of operational hydrologic forecasters, although issues related to low spatial and temporal resolution and cloud obstruction limit the usefulness of the products. Additionally, with the advent of operational distributed hydrologic models at high spatial resolution, such as the National Water Model (NWM), it is necessary to recognize and incorporate small-scale hydrologic and hydraulic features for improved model performance and accuracy.
Unmanned aerial vehicles (UAVs), along with imaging and sensing equipment mounted on the platforms (which together comprise an unmanned aerial system, or UAS), offer a unique compromise to the issue of scale-dependent data requirements in hydrologic applications. While the data are viable at extremely high spatial resolution (centimeter scale), which is comparable to surface-based observations, the data can be obtained over larger areas comparable to satellite coverage. Given their spatial extent and resolution, UAS-based observations provide a unique platform for data collection between the point-scale (i.e., surface stations) and the regional scale (i.e., satellite data) [1]. As a result, UASs have been shown to be valuable tools for monitoring of surface characteristics, features, and processes in a variety of hydrologic and geomorphological applications, especially in regions that are difficult to access. [2] demonstrated the utility of UAV-based imagery in defining surface characteristics, namely high-resolution elevation data, associated with flood risk in difficult-to-reach areas. Furthermore, [3] and [4] showed that UAV-based imagery played an important role in characterizing elevation, aspect, and stream distribution at high spatial resolution, which was useful in interpolating surface-based observations and spatially analyzing hydrologic response.
Many studies have utilized UAV imagery and photogrammetric techniques for observing topological and geomorphological features and processes over landscapes with varying levels of environmental complexity [5,6,7,8,9]. [10] employed a small UAV to construct a high spatial resolution (5-cm) orthomosaic image and digital elevation model (DEM) to map a variety of surface and hydrologic features over a limited river reach of the Elbow River in Alberta, Canada, which was used to initialize a two-dimensional hydrodynamic model. The authors noted that the primary disadvantages of using UAVs for mapping river features include vegetation obstructions of the surface and immature regulations, while specific advantages include low cost, high efficiency and flexibility, and high spatial resolution.
In terms of direct applications of UAV platforms to hydrologic data and monitoring applications, [11] and [12] provided information on the utility and uses of UAV technologies on river mapping and floodplain characterization. Additionally, [13,14] discussed the advantages, uses, and applications of UAV platforms for monitoring river levels. [14] applied image recognition technology to UAV-based imagery to define water level in a complex hydrologic environment (spillway downstream of a hydropower station) and found that the methods were suitable for recognition of water level with high accuracy. This, along with the flexibility and low cost of UAV platforms, indicates that the procedure can be used to define water level and water surface variability in a variety of environments with complex topography, hydrologic characteristics, and/or flow regimes. As floodplain characterization and elevation mapping are critical aspects of developing accurate and representative hydrologic modeling frameworks, UAVs have also been proven useful in surveying of riverbanks and floodplains [15,16], as well as the generation of DEMs over various scales and landscapes [17,18]. [19,20,21] further illustrated the accuracy and utility of UAV-based photogrammetry in mapping river systems and river conditions rapidly and at high resolution.
Along with the usefulness of UAV technology in monitoring of hydrologic conditions and surface characteristics, UAVs also offer advantages over other remote sensing platforms (e.g., satellites and aircraft) in terms of initial and long-term cost [22,23]. While the various remote sensing platforms are often applied to different research objectives or serve specific data collection purposes, [24] noted a substantial decrease in cost of UAV-based products relative to similar satellite-based products, while [25] quantified the savings of using unmanned vehicles rather than manned aircraft for repeated surface monitoring. Although satellites are superior in providing spatially extensive coverage with a high revisit frequency, the variety of available UAV and imaging assets allows for a variable cost–benefit ratio depending on the specific mission being planned and the type, extent, and quality of data required for the research objectives. Additionally, the increasing availability of payloads that can be used on UAV platforms (i.e., thermally calibrated infrared cameras, gas sensors, microwave soil moisture sensors, etc.) provides multiple customization options to fit a variety of research frameworks, operational missions, and related budgets. With the decreasing cost of UAV platforms as more models are released to the market and the cost of technology goes down, the utilization of UAS equipment is becoming a more viable option for a wider range of research teams and applications. Further information regarding the cost–benefit aspects of UAVs, especially in terms of hydrologic applications, can be found in [26].
It is the purpose of this paper to outline and illustrate methods by which high-resolution data collected by UASs can be used beyond their initial operational applications, namely in the context of microscale hydrologic analysis. The results of the work will not only highlight the advantages of applying UAS technology to operational hydrologic prediction but will also quantify how and where additional improvements can be made to maximize the effectiveness and cost–benefit aspects of UAS-based imagery in flood assessment and forecasting at the local scale. The work is based on imagery collected during missions conducted around Greenwood, MS, in the context of a larger National Oceanic and Atmospheric Administration (NOAA) project, which is explained in Section 2. Section 3 provides the results of the study and a discussion of the potential uses and impacts of UAS data on microscale applications, while Section 4 defines future plans and paths forward for the use of UAVs and the associated data in hydrologic applications.
2. Materials and Methods
2.1. SHOUT4Rivers Project
The National Weather Service (NWS) River Forecast Centers (RFCs) are tasked with providing predictions of river and reservoir levels; therefore, it is critical that RFCs have as much data as possible on the real-time location and depth of water during flood events to enhance flood prediction. UAVs with mission-specific equipment such as visible and infrared imagers provide a potential avenue to address the lack of data; therefore, in an effort to determine the optimal UAS platforms and payloads for the work that the RFCs perform, a workshop was held at the NOAA Facility in Boulder, Colorado in February 2012 that brought together providers and RFC personnel to discuss what was available, what will be available, and the needs of the RFCs. The result was a report on the platforms and payloads available and plans to conduct the missions identified by the RFCs [27]. A follow-on workshop was held in September 2014 to update the requirements [28].
As a result of these workshops, a project was proposed and awarded to Mississippi State University for the purpose of developing and testing UAS equipment and mission strategies for operational hydrologic applications. The initial project, called Optimal UAS Observing Strategy, involved a series of missions over the lower Pearl River basin along the Louisiana/Mississippi border, in support of the Lower Mississippi RFC (LMRFC) and federal agency hydrology model development [29]. These nearly bi-monthly flights conducted between July 2014 and March 2015 produced sets of visible and infrared imagery that allowed the RFCs and other federal agencies to understand a number of physical processes, including sediment transport in coastal waterways, changes in water flow paths (changing river/land morphology) over time, and characterization of land surface features. The initial purpose of the data was to verify and parameterize hydrological models, although the high spatial resolution of the imagery also allowed for the determination of water vegetation type (i.e., submerged vs. aquatic vegetation). Interestingly, the spatial resolution also allowed for the identification of some animals (i.e., white-tailed deer), which helped determine the extent and severity of flooded areas by assessing wildlife displacement. The results of this work led to a better understanding of what data are most useful for operational forecasters, as well as the requirements needed for future UAS-based observations. For example, LMRFC personnel noted that spatial resolution was unnecessarily high for real-time situational awareness, while latency in data transmission was not optimal for time-sensitive decision support [30]. These comments showed that given a fixed amount of time to collect data, imaging a large area at a lower spatial resolution was preferred to minimize the data volumes and subsequent lag in imagery availability.
Having shown the value of frequent data collection with small UAVs in improving the diagnosis and prediction of river flooding events, the SHOUT4Rivers (Sensing Hazards with Operational Unmanned Technology for the River Forecasting Centers) project built on these results by directly addressing the requirements identified by the RFCs at the 2014 workshop. These requirements and their defined priorities (as defined by RFC personnel) are outlined in Table 1. Based on operational requirements of the RFCs in the NWS Southern Region, specifically the LMRFC in Slidell, LA, who are collaborators in this work, priorities 2, 4, and 5 were deemed the most appropriate to address with UAS at this time; therefore, the application of UAS platforms for adding and/or enhancing products to aid in operational river forecasting was the primary focus of the work.
Although a detailed discussion of the results of the SHOUT4Rivers Phase 2 work is beyond the scope of this study, the operational implementation of UAS imagery in the context of the project was proven to be successful during active flooding, and plans are underway for additional missions and imagery collection. To build on the overall success of the project, though, and maximize the cost-benefit ratio of the data collected both in economic and scientific terms, it is necessary to comprehend the applications and utility of the collected data beyond real-time operational analysis. In other words, while the primary objectives of the data collection missions were to put the UAS imagery into the context of the RFC operational pipeline and assess the usefulness and limitations of the imagery and mission framework in terms of the RFC requirements, the primary objective of this work is to outline the scientific efficacy of the imagery for assessment of microscale hydrologic features and processes.
2.2. Overview of UAS Equipment and Mission Parameters
Earlier flood analysis work had utilized a hand-launched UAV that provided 2 cm spatial resolution, but that UAS was only able to image 1–2 mi2 (2.6–5.2 km2) per hour and thus only 4–6 mi2 (10.4–15.5 km2) per day. In short, the spatial resolution was unnecessarily high, and the coverage was limited. That system also lacked any ability to communicate the captured imagery during flight, necessitating waiting until the UAV landed to transmit the imagery from the capture area.
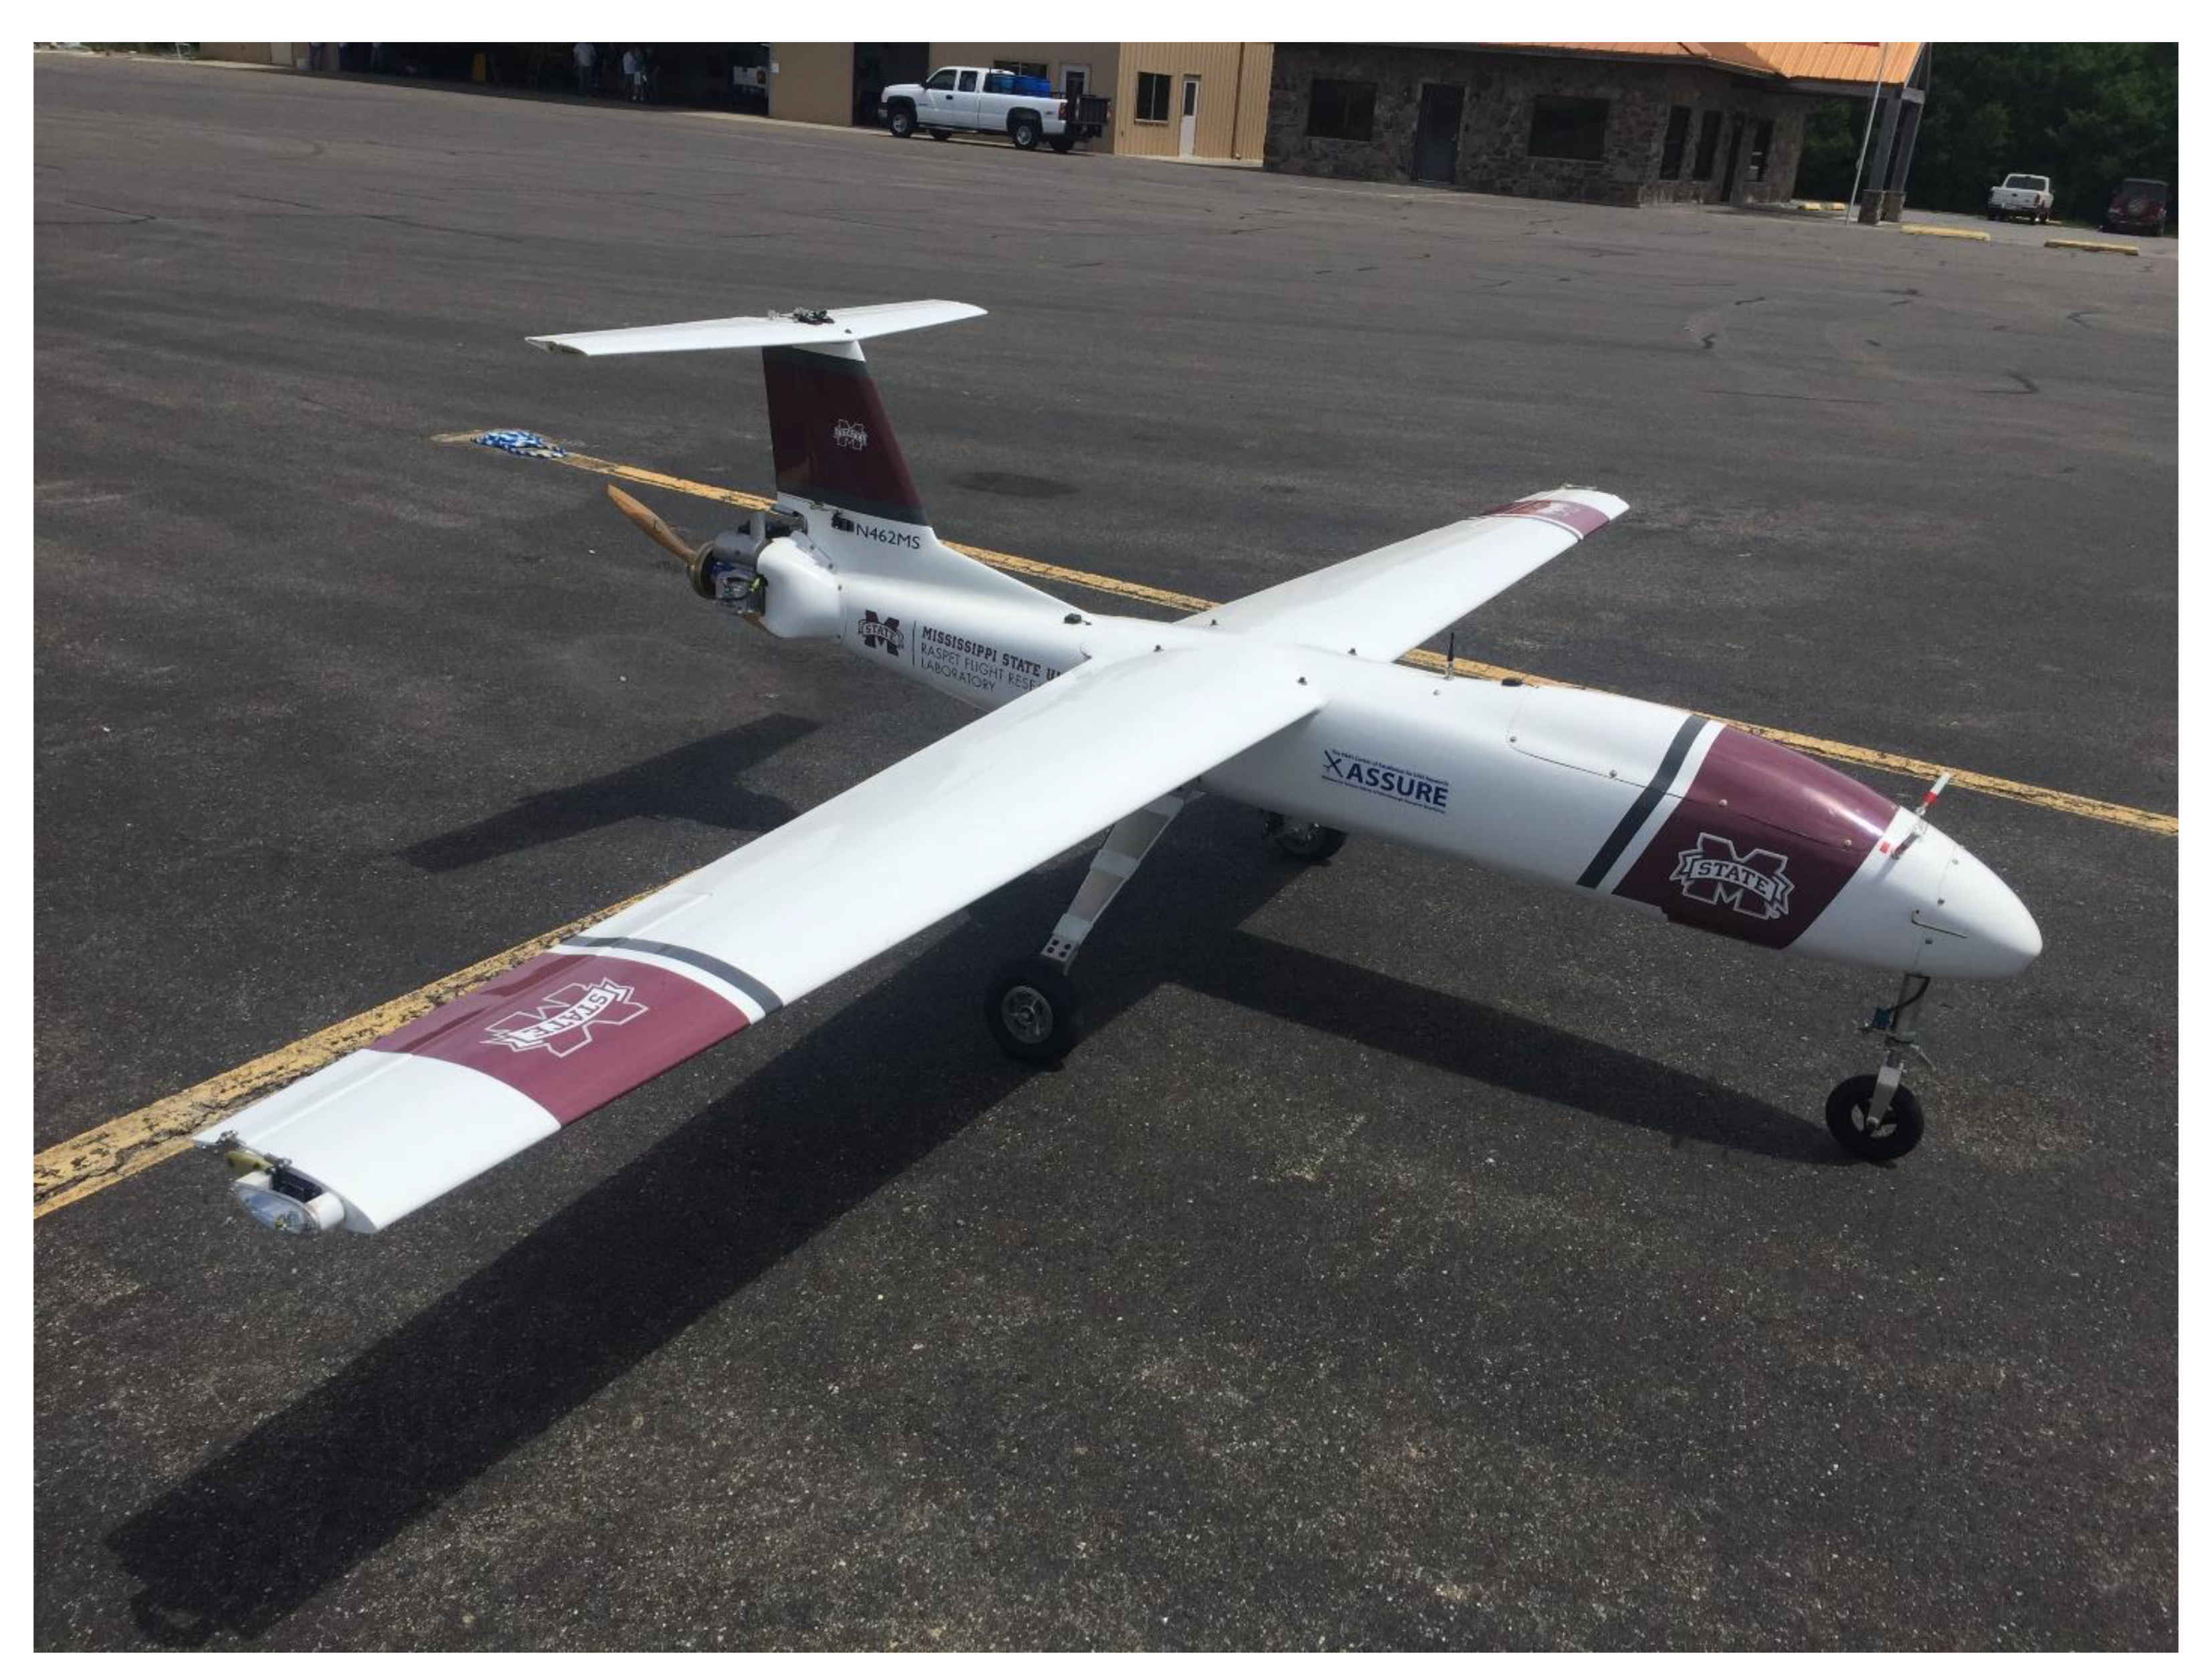
Working with Mississippi State University’s Raspet Flight Research Lab, we were able to exploit their Griffon Aerospace Outlaw G2E and associated equipment that will be described below. The G2E (shown in Figure 1) weighs approximately 180 lb. (81.6 kg) at take-off with a full tank of fuel. It is 8.5’ (2.6 m) long with a 14’ (4.3 m) wingspan. At a cruise speed of 65 kts (120 km hr-1), it can fly up to 2.5 h. We integrated an Overwatch Imaging (https://www.overwatchimaging.com/) TK5 payload, which has Red-Green-Blue (RGB), Near Infra-Red (NIR), and Long Wavelength Infra-Red (LWIR) cameras. Flying at 4500’ (1372 m) above ground level, it allows us to capture RGB and NIR infrared imagery at a ground sampling resolution of approximately 6” (16 cm) and image approximately 125 mi2 (324 km2) on each flight.
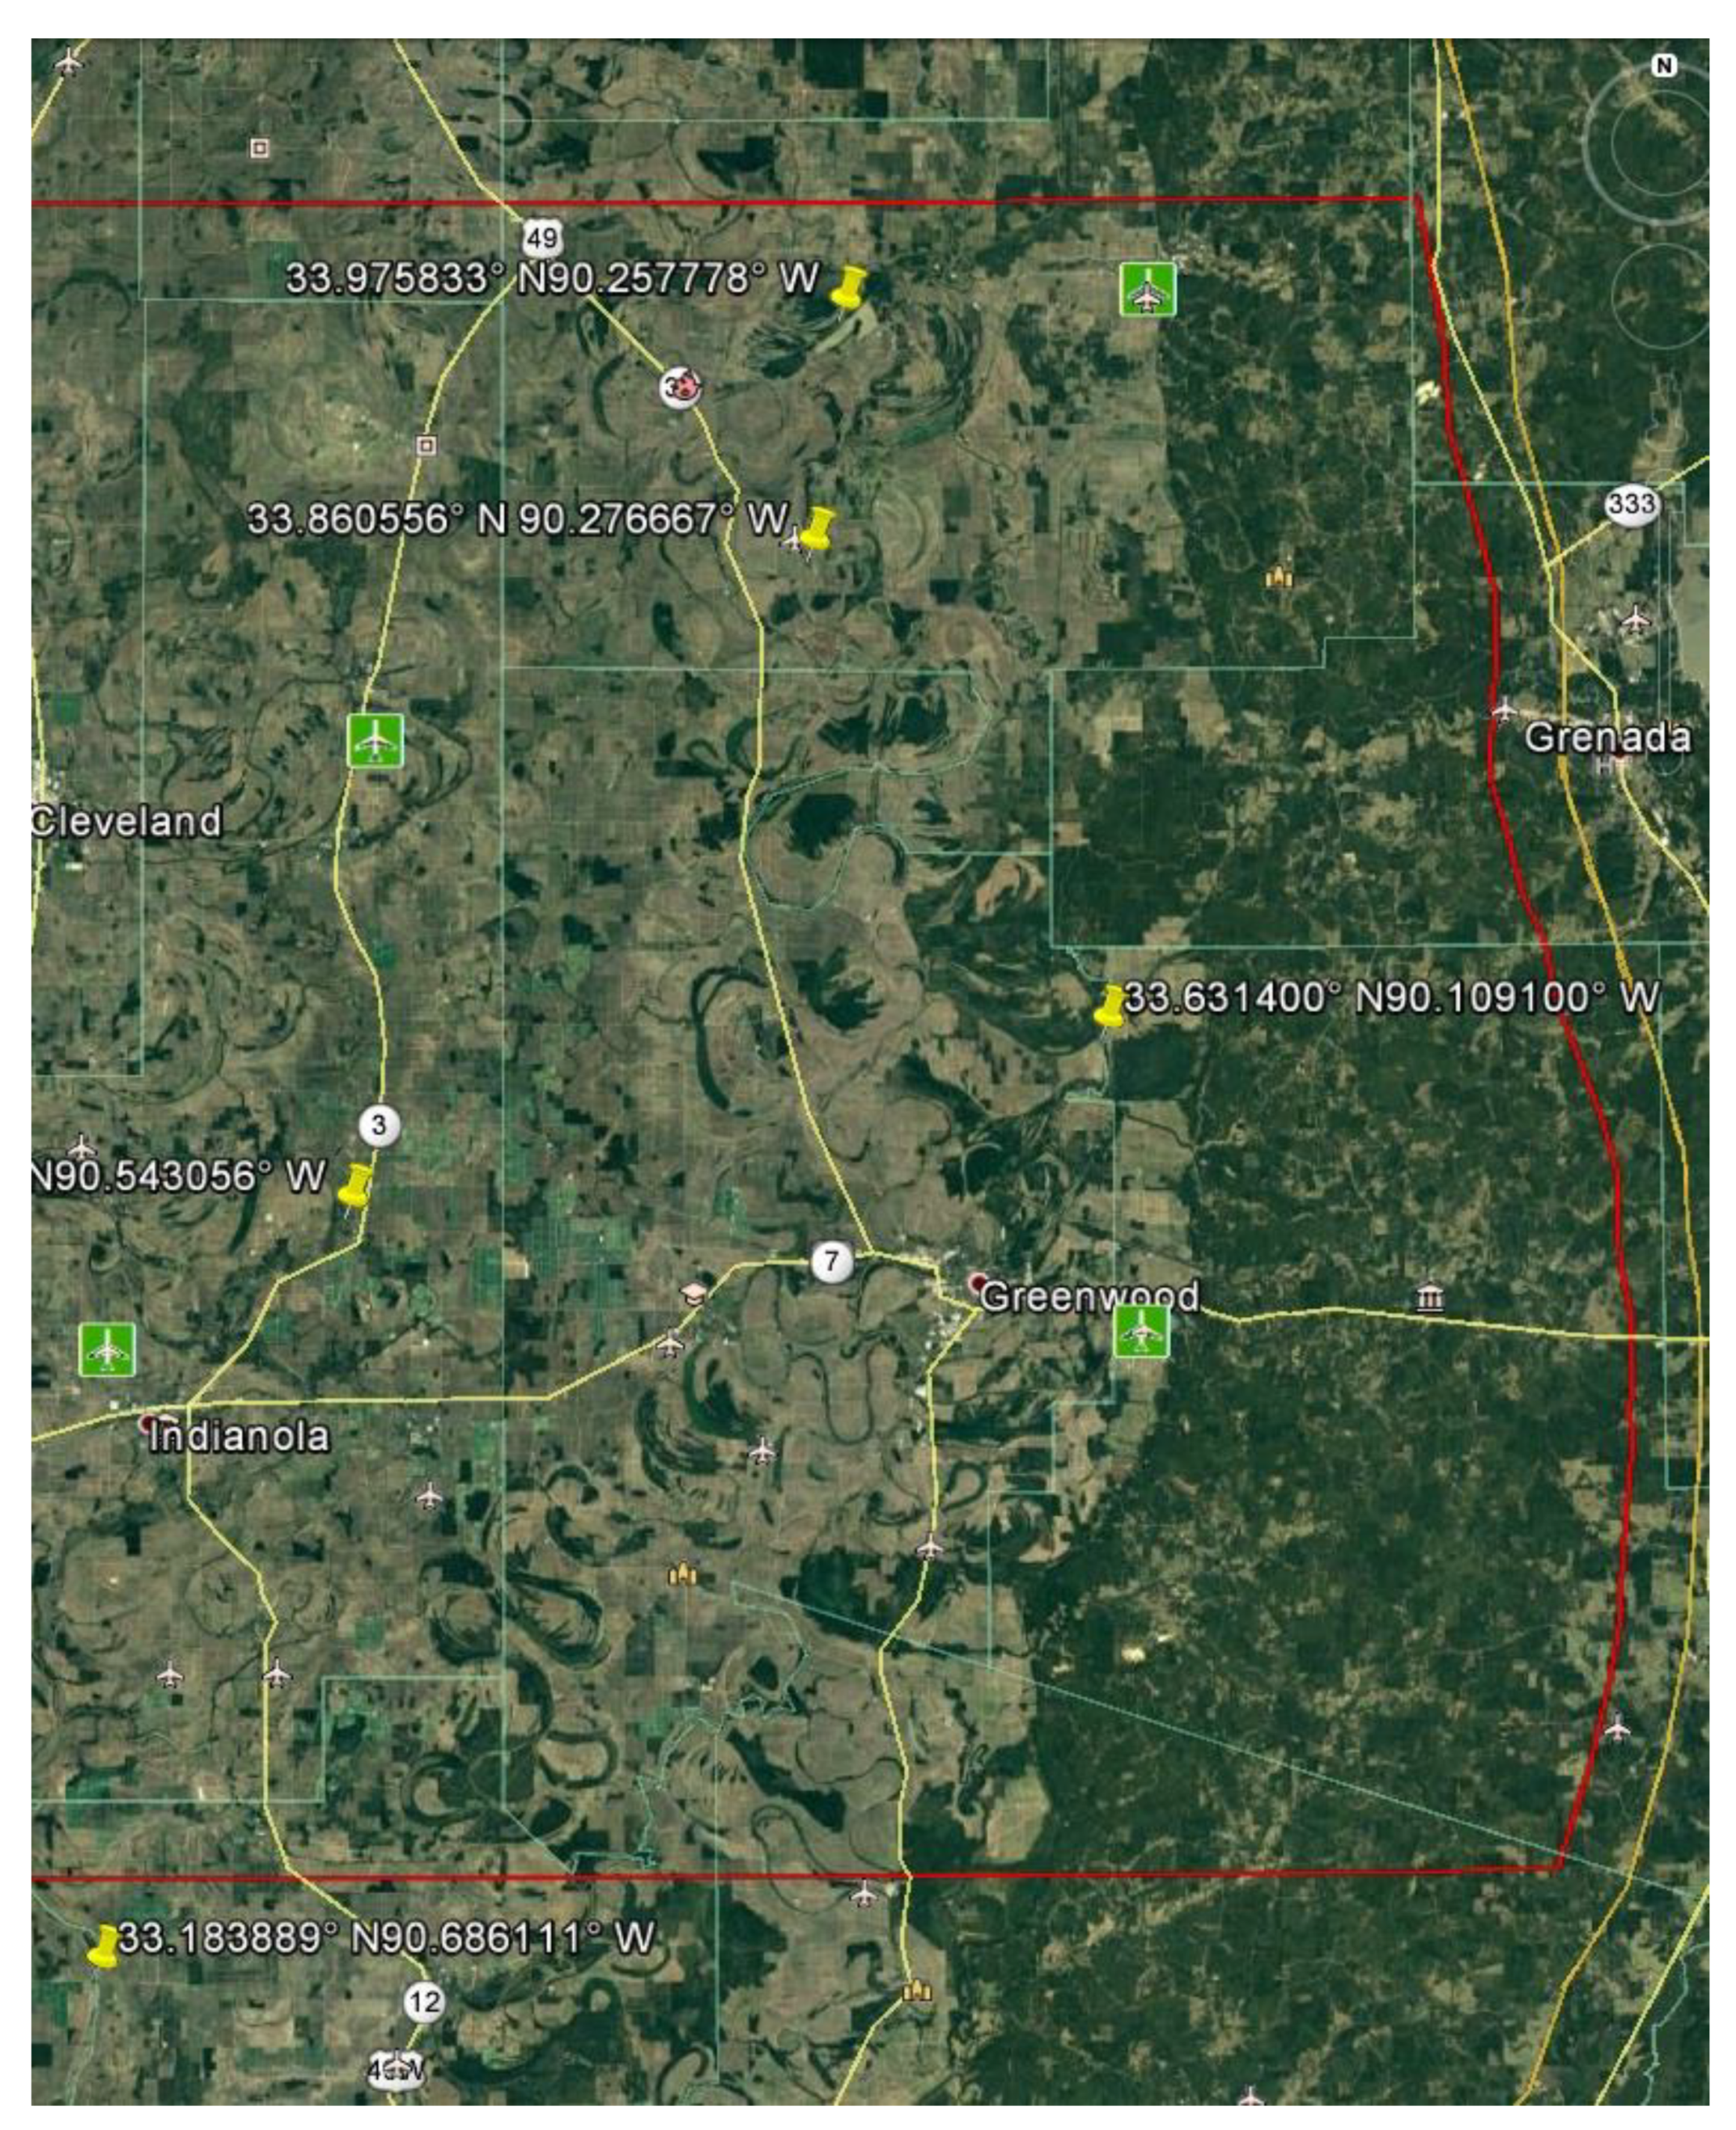
The Greenwood-Leflore airport was selected as the base of operations for several reasons, not the least of which is the topography. East of the airport, the elevation increases rapidly and undulates, while to the west, the elevation is almost constant. Furthermore, the Yalobusha River encircles Greenwood before merging with the Little Tallahatchie River and exiting the area to the southwest (now called the Tallahatchie River), increasing the flood risk in the area and making it an important region for study. In terms of logistics and flight planning, Raspet had previously secured a Certificate of Authorization (CoA) from the Federal Aviation Administration (FAA) to operate the G2E from Greenwood (and other area airports) for other projects. The eastern extent of the CoA area is shown in Figure 2. Other airports within the CoA from which the flights could have been conducted were farther from a major river stem (leading to longer response time during flooding), offered fewer airport facilities (hangers, communication infrastructure to allow for data transmission, etc.), or had shorter runways (making for challenging takeoffs and landings). All of these conditions must be considered for future research or operational missions, with the importance of the different factors changing depending on the exact purpose of the data collection and the equipment being used.
2.3. Imagery Collection Procedures
Based on the defined NWS requirements (Table 1) and how the data are to be used at a NWS river forecast center (in the case of this exercise, the LMRFC), the imagery collection framework for the SHOUT4Rivers Phase 2 study included two distinct stages, distinguished by levels of post-processing and the associated timing of the data in terms of availability to the LMRFC relative to measurement from the UAS platform. The first stage of data collection was real-time imagery from the UAS platform, including RGB and NIR geo-referenced images. As the data were collected, they were decimated to produce images with a lower resolution, then derived products such as normalized difference vegetation index (NDVI) and land-water masks were generated using edge computing in the TK5 payload. The standard NDVI formula was applied (NDVI = (NIR-R) / (NIR+R)), with values from -0.2 to -1.0 used for the water thresholds. As each set of georeferenced images was collected, KML wrappers were automatically generated for each data packet so that the data could be viewed directly in Google Earth, and finally the packet was compressed and transmitted to the ground control station (GCS). The data were then transmitted from the GCS in near real-time to a repository at Mississippi State University’s High Performance Computing Center (HPC2) and pushed out via webservices to the consumer. Although the LMRFC was the primary consumer for initial testing, any person or organization with proper authorization could access the data as it became available.
The Stage 1 data directly address Priority 4 of the NWS requirements (Table 1) by providing real-time information regarding the location and extent of water within the flight path. To make sure the data are available as quickly as possible to RFC forecasters, the individual images did not include adjustments for differences in lighting, camera angle, orientation of the UAS, etc.; therefore, the images were primarily used for real-time situational awareness of flooded areas and assessment of at-risk structures and locations. This highlights an important disadvantage of UAV imagery relative to satellite imagery, in that the UAV data for the study missions were collected using a zigzag pattern over a specific area and time; therefore, imaging of adjacent areas along alternate flight lines leads to changes in sun angle (irradiance). Despite this issue, based on feedback from operational hydrologic forecasters at the LMRFC during the flood event [30], this information was proven useful in defining and analyzing areas at risk of flooding. Additionally, forecasters were able to compare forecast model output with existing inundation to better assess flood severity and model performance in real time over the imaged areas. While these were the primary considerations for the use of the Stage 1 data, in the future, other users could benefit from access to the data. For example, emergency managers could utilize the imagery to organize evacuation plans and transportation officials could better manage road closures. As the number and type of users of the Stage 1 data increases, additional processing to account for lighting and camera angle variations can be applied to maximize the utility and reliability of the imagery; however, due to the real-time necessity of these data, further work must be done to establish an acceptable balance between dissemination speed, data accuracy, and image consistency.
After completion of each flight, the full-resolution imagery was acquired from the SSD in the TK5 payload and used to produce a full-resolution, higher-precision mosaic for each image type. This constitutes the second stage of data collection. The basic processing workflow was as follows: (1) convert raw imagery from the Overwatch Imaging native OWI format to TIFF, (2) import images into Agisoft Metashape, (3) align cameras to generate point cloud, (4) produce dense point cloud, (5) color balance the imagery, (6) generate a digital surface model (DSM) from the dense point cloud, (6) generate the orthomosaic. Regarding processing time, Table 2 describes the amount of time taken for each step of this process for the various flights using a machine with the following specifications: Intel Xeon E5-1620 v2, 3.7 GHz, 4 cores/8 threads, 64 GB RAM with a Nvidia Quadro K2000 (2 GB RAM, 2 compute units at 954 MHz). In general, the total time from the completion of the flight to imagery available for analysis ranged from roughly 15 h (Jan. 16 flight) to 40 h (Feb. 24 flight), although it is safe to estimate a processing time of 24–48 h for a mission.
The mosaicking procedure removes boundary effects between individual images to remove and/or minimize error associated with changing light conditions, UAS orientation, etc., so that environmental features such as river channels, inundated boundaries, and areas of debris can be analyzed with higher spatial accuracy. These data address Priority 2 of the NWS requirements (Table 1) by giving RFC forecasters the ability to analyze detailed spatial patterns of flooding as well as potential consequences of the flood to natural and built environments as the event is occurring. Additionally, transportation officials can use the second stage data to prepare for post-event repair efforts, while agricultural producers can use the data to assess the area of inundated cropland.
Due to the size of the original high-resolution images collected by the UAS cameras, the final post-processed imagery (generated at the HPC2 upon mission completion) were made available to the RFC on the order of days after the UAS flights were conducted. These high-resolution data address Priority 5 of the NWS requirements (Table 1) by providing detailed maps of flooded areas, inundated extent, and locations of damage/debris associated with the floods. As these high-resolution data are considered the final version of the collected imagery, they are the primary data source used for this project to define applications of UASs for hydrologic applications beyond real-time operational assessment and situational awareness.
2.4. Description of UAV Missions
The data collection strategies outlined for the SHOUT4Rivers Phase 2 project were meant to be applied to two test missions around Greenwood, MS (based out of the Greenwood-Leflore airport) in order to develop and streamline an operational data pipeline for the LMRFC during flooding events. The first mission was flown on the morning of January 16, 2019 and was focused on data collection concepts and technology, UAS flight parameters, and recognition of potential issues and limitations related to communications, data processing, and real-time dissemination and visualization of products at the LMRFC. Project personnel were stationed at Greenwood-Leflore airport for mission operations and at the MSU HPC2 for testing of data transmission and timing. The test flight conducted near Greenwood, MS on the morning of January 16, 2019 covered a variety of agricultural and built-up areas (Figure 3), and although water levels in the local rivers and reservoirs were at or near normal baseflow levels, the Stage 1 data were useful in highlighting examples of where RFC personnel could utilize the imagery to enhance their situational awareness of potential flood conditions.
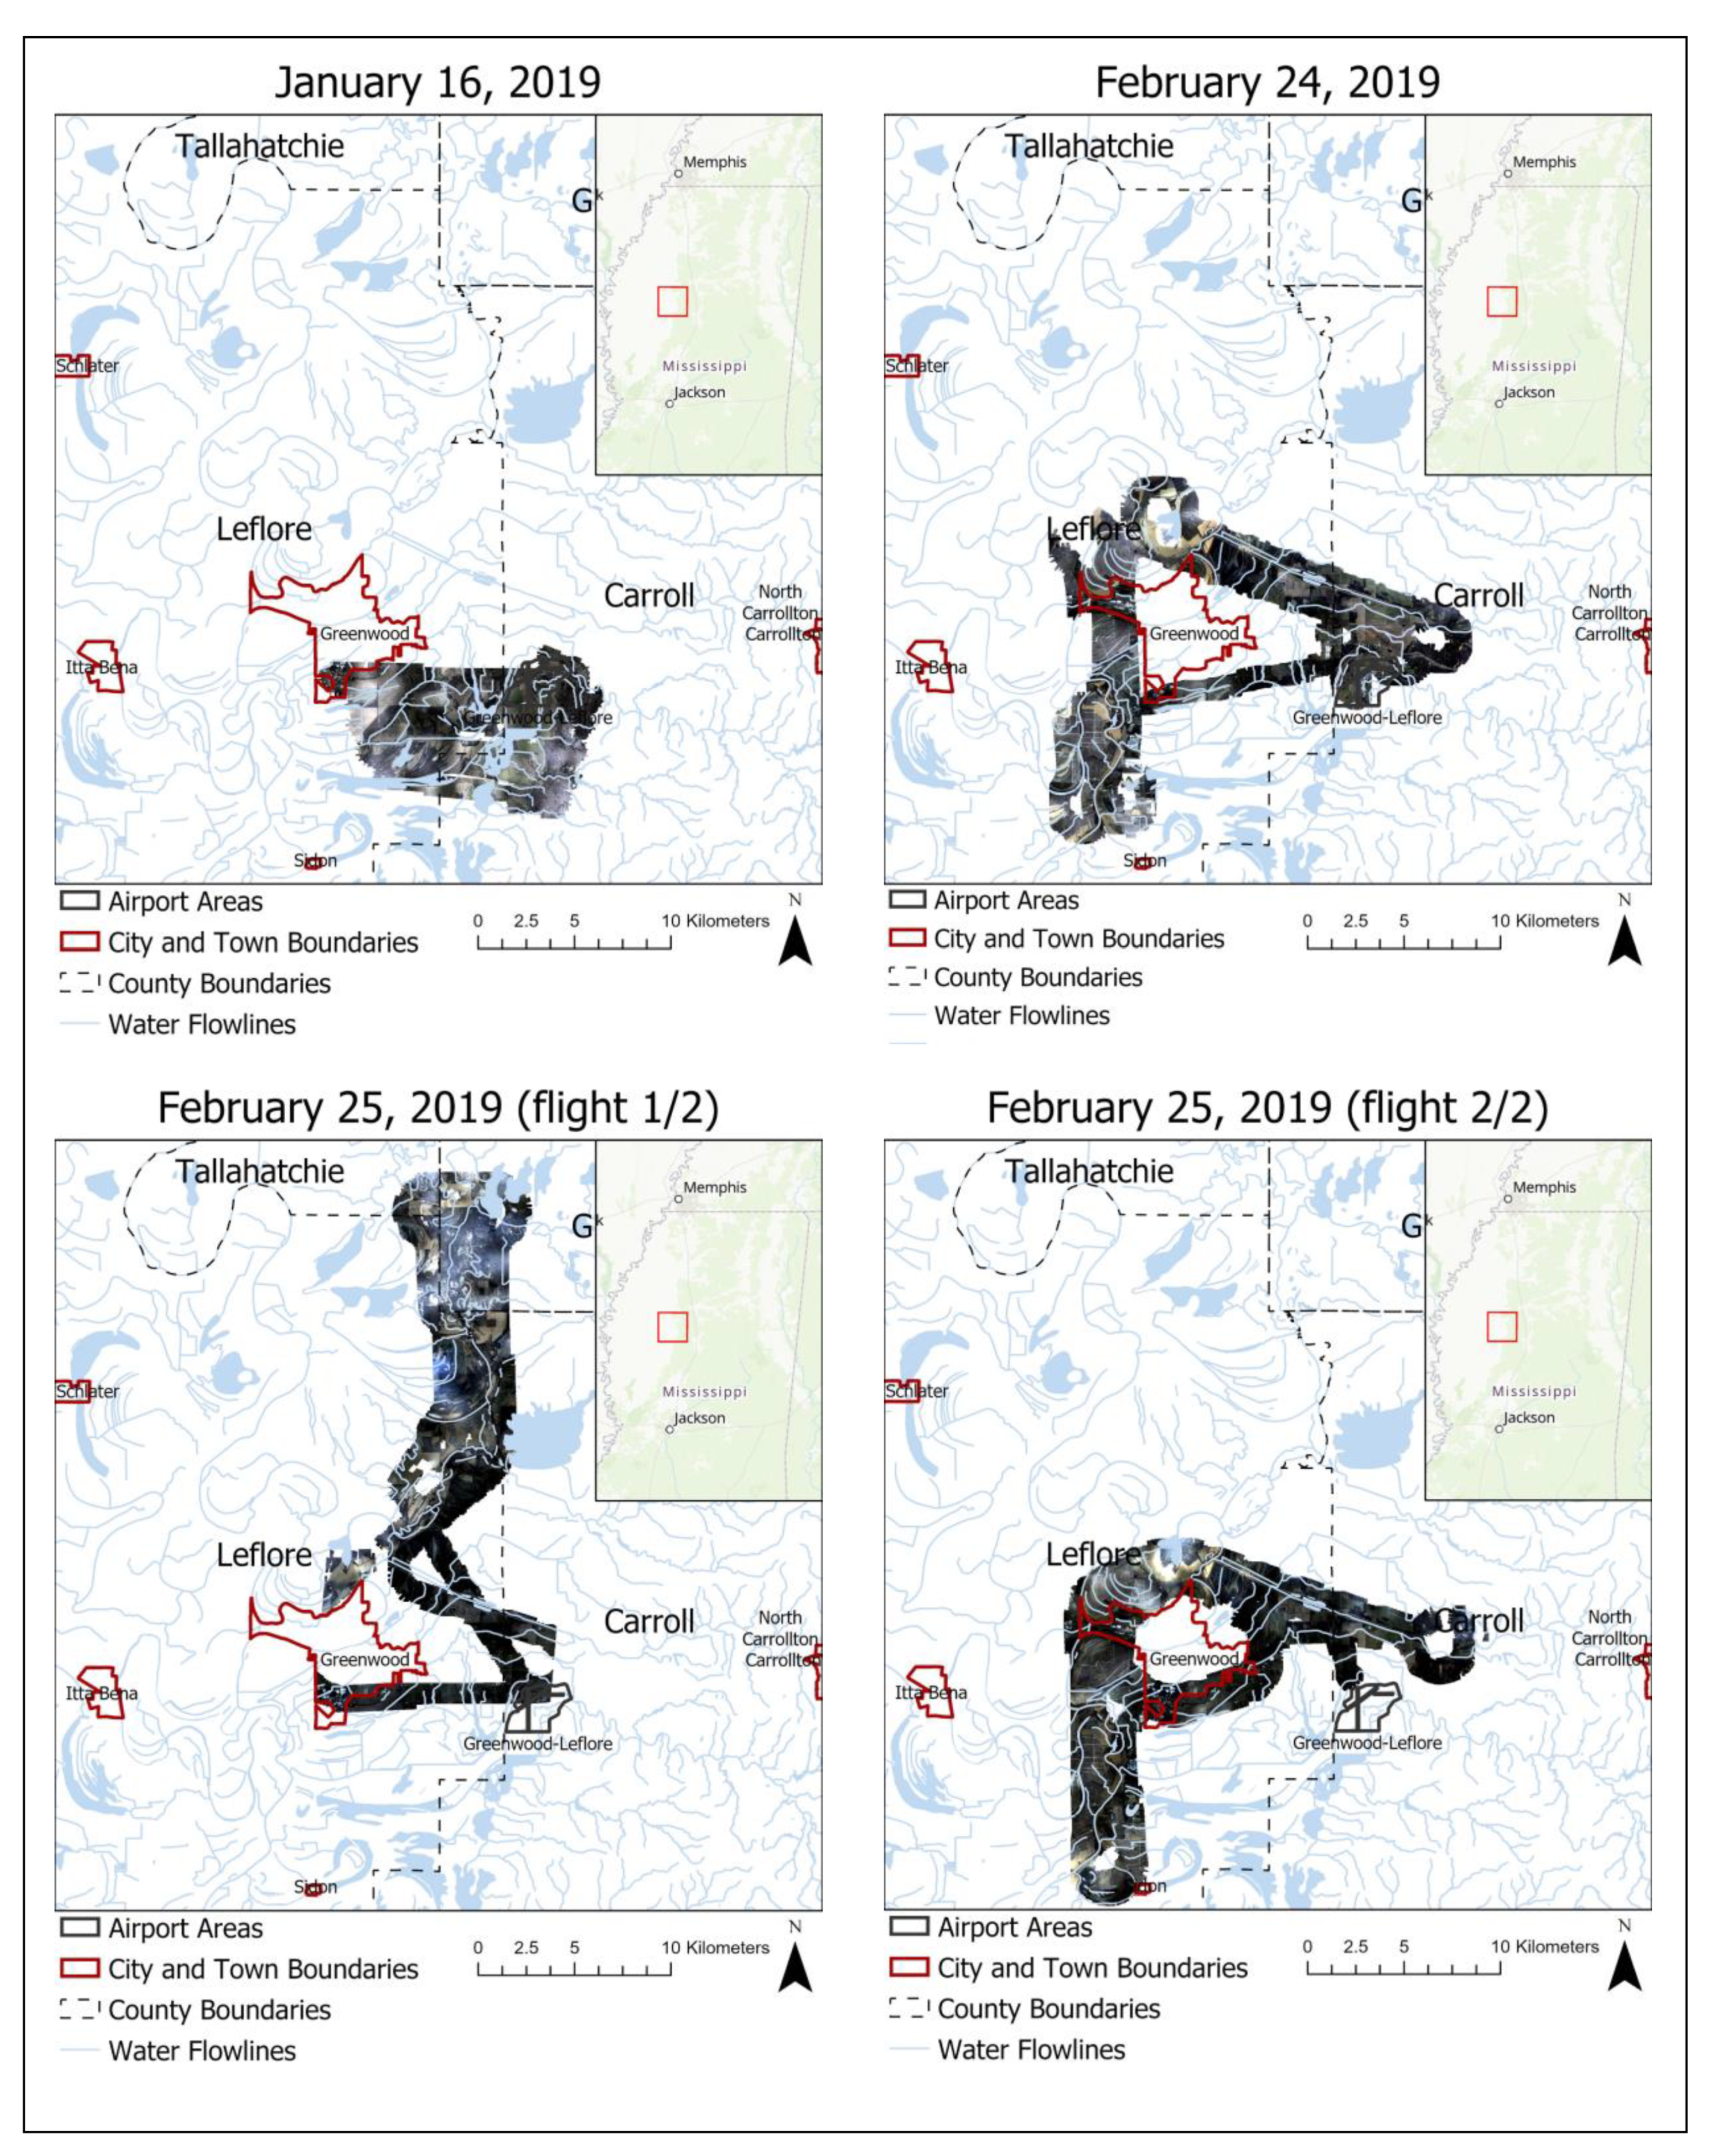
The second mission was originally intended to test and verify improvements and modifications to the data collection pipeline and UAS equipment based on results and lessons learned from the January 16 mission; however, historic flooding along the Yalobusha and Tallahatchie Rivers around Greenwood, which converge north of the city to form the Yazoo River, led the mission to become an operational activity in support of flood operations at the NWS LMRFC [30]. In response to the change in operations, the flight plans were modified to focus on specific river reaches and at-risk locations based on requests by forecasters at the LMRFC, which is illustrated by the various coverage areas during the missions (Figure 3). To be more specific, the Feb. 24 flight and the second flight on Feb. 25 focused on coverage of flooding around Greenwood, especially along the Yazoo river to the west and south of the city, while the first flight on Feb. 25 focused on imaging flooding along the Yalobusha River north of Greenwood to improve situational awareness of the flood crest. Although the focus of the missions was on operational hydrologic applications, the availability of UAV imagery during an active flood provided a unique opportunity to investigate how high spatial resolution imagery could be used for hydrologic applications at the microscale, especially given adequate time and resources to post-process the data to meet the needs of specific research objectives.
3. Results and Discussion
While UAS-based imagery is becoming a common product for a variety of scientific applications related to Earth science research, the benefits related to hydrology are best illustrated relative to microscale applications. While some of the benefits and uses of the data are well established, it is useful to properly define the applications using actual imagery to better justify and illustrate how UASs can be used for various hydrologic research approaches.
3.1. Assess Current Conditions of River Channels and Surface Runoff
The first step in any approach to diagnosing and predicting hydrologic conditions is the recognition of current river conditions, including flow rate, stage, and/or inundated extent. While direct measurement of discharge is not a quantity easily defined using aerial imagery, inundated extent is easily measured with such visual data. From these inundation data, stage can be inferred given a sufficient number and density of georeferenced points along the landscape. Along with river gauges to provide discharge, aerial data can be a critical factor in defining and assessing current river conditions along and adjacent to a water body at a scale much higher than the gauges alone can justify.
As far as the number of georeferenced ground control points (GCPs) necessary to adequately define water height across a landscape, the value depends on the level of accuracy required by the user and the variability of local topographical features. [31] suggest placing GCPs between 1/5 and 1/10 of the flight altitude, with the points spaced out evenly though not necessarily on a grid (especially where heights change substantially). Given the 4500 ft (1372 m) flight level for the study missions, this guidance indicates that GCPs should be provided roughly every 225–450 ft (68.6–137.2 m) for a minimum vertical accuracy for water level determination. This was not feasible during the missions, especially given the existing flood conditions; however, for future missions it would be possible to use known objects with positional data as GCPs. Furthermore, [32] mention that adding GCPs along the edges of flight runs can help to improve accuracy if an evenly spaced network of points is not available.
In terms of microscale hydrologic applications, high resolution imagery is a requirement in defining detailed flow patterns within a watershed. This is especially true in areas with low topographic relief where a small change in stage can lead to a large change in horizontal flooded area, or in areas with complex surface features such as cities or road intersections where flow direction changes over small spatial scales. By seeing and identifying areas that are flooded at a given stage and/or discharge, microscale surface conditions related to surface runoff direction, floodplain storage, and active routing channels (including channel structure) can be identified and tied to the given flow conditions.
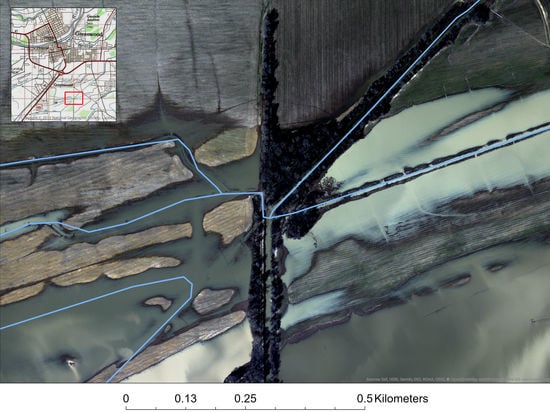
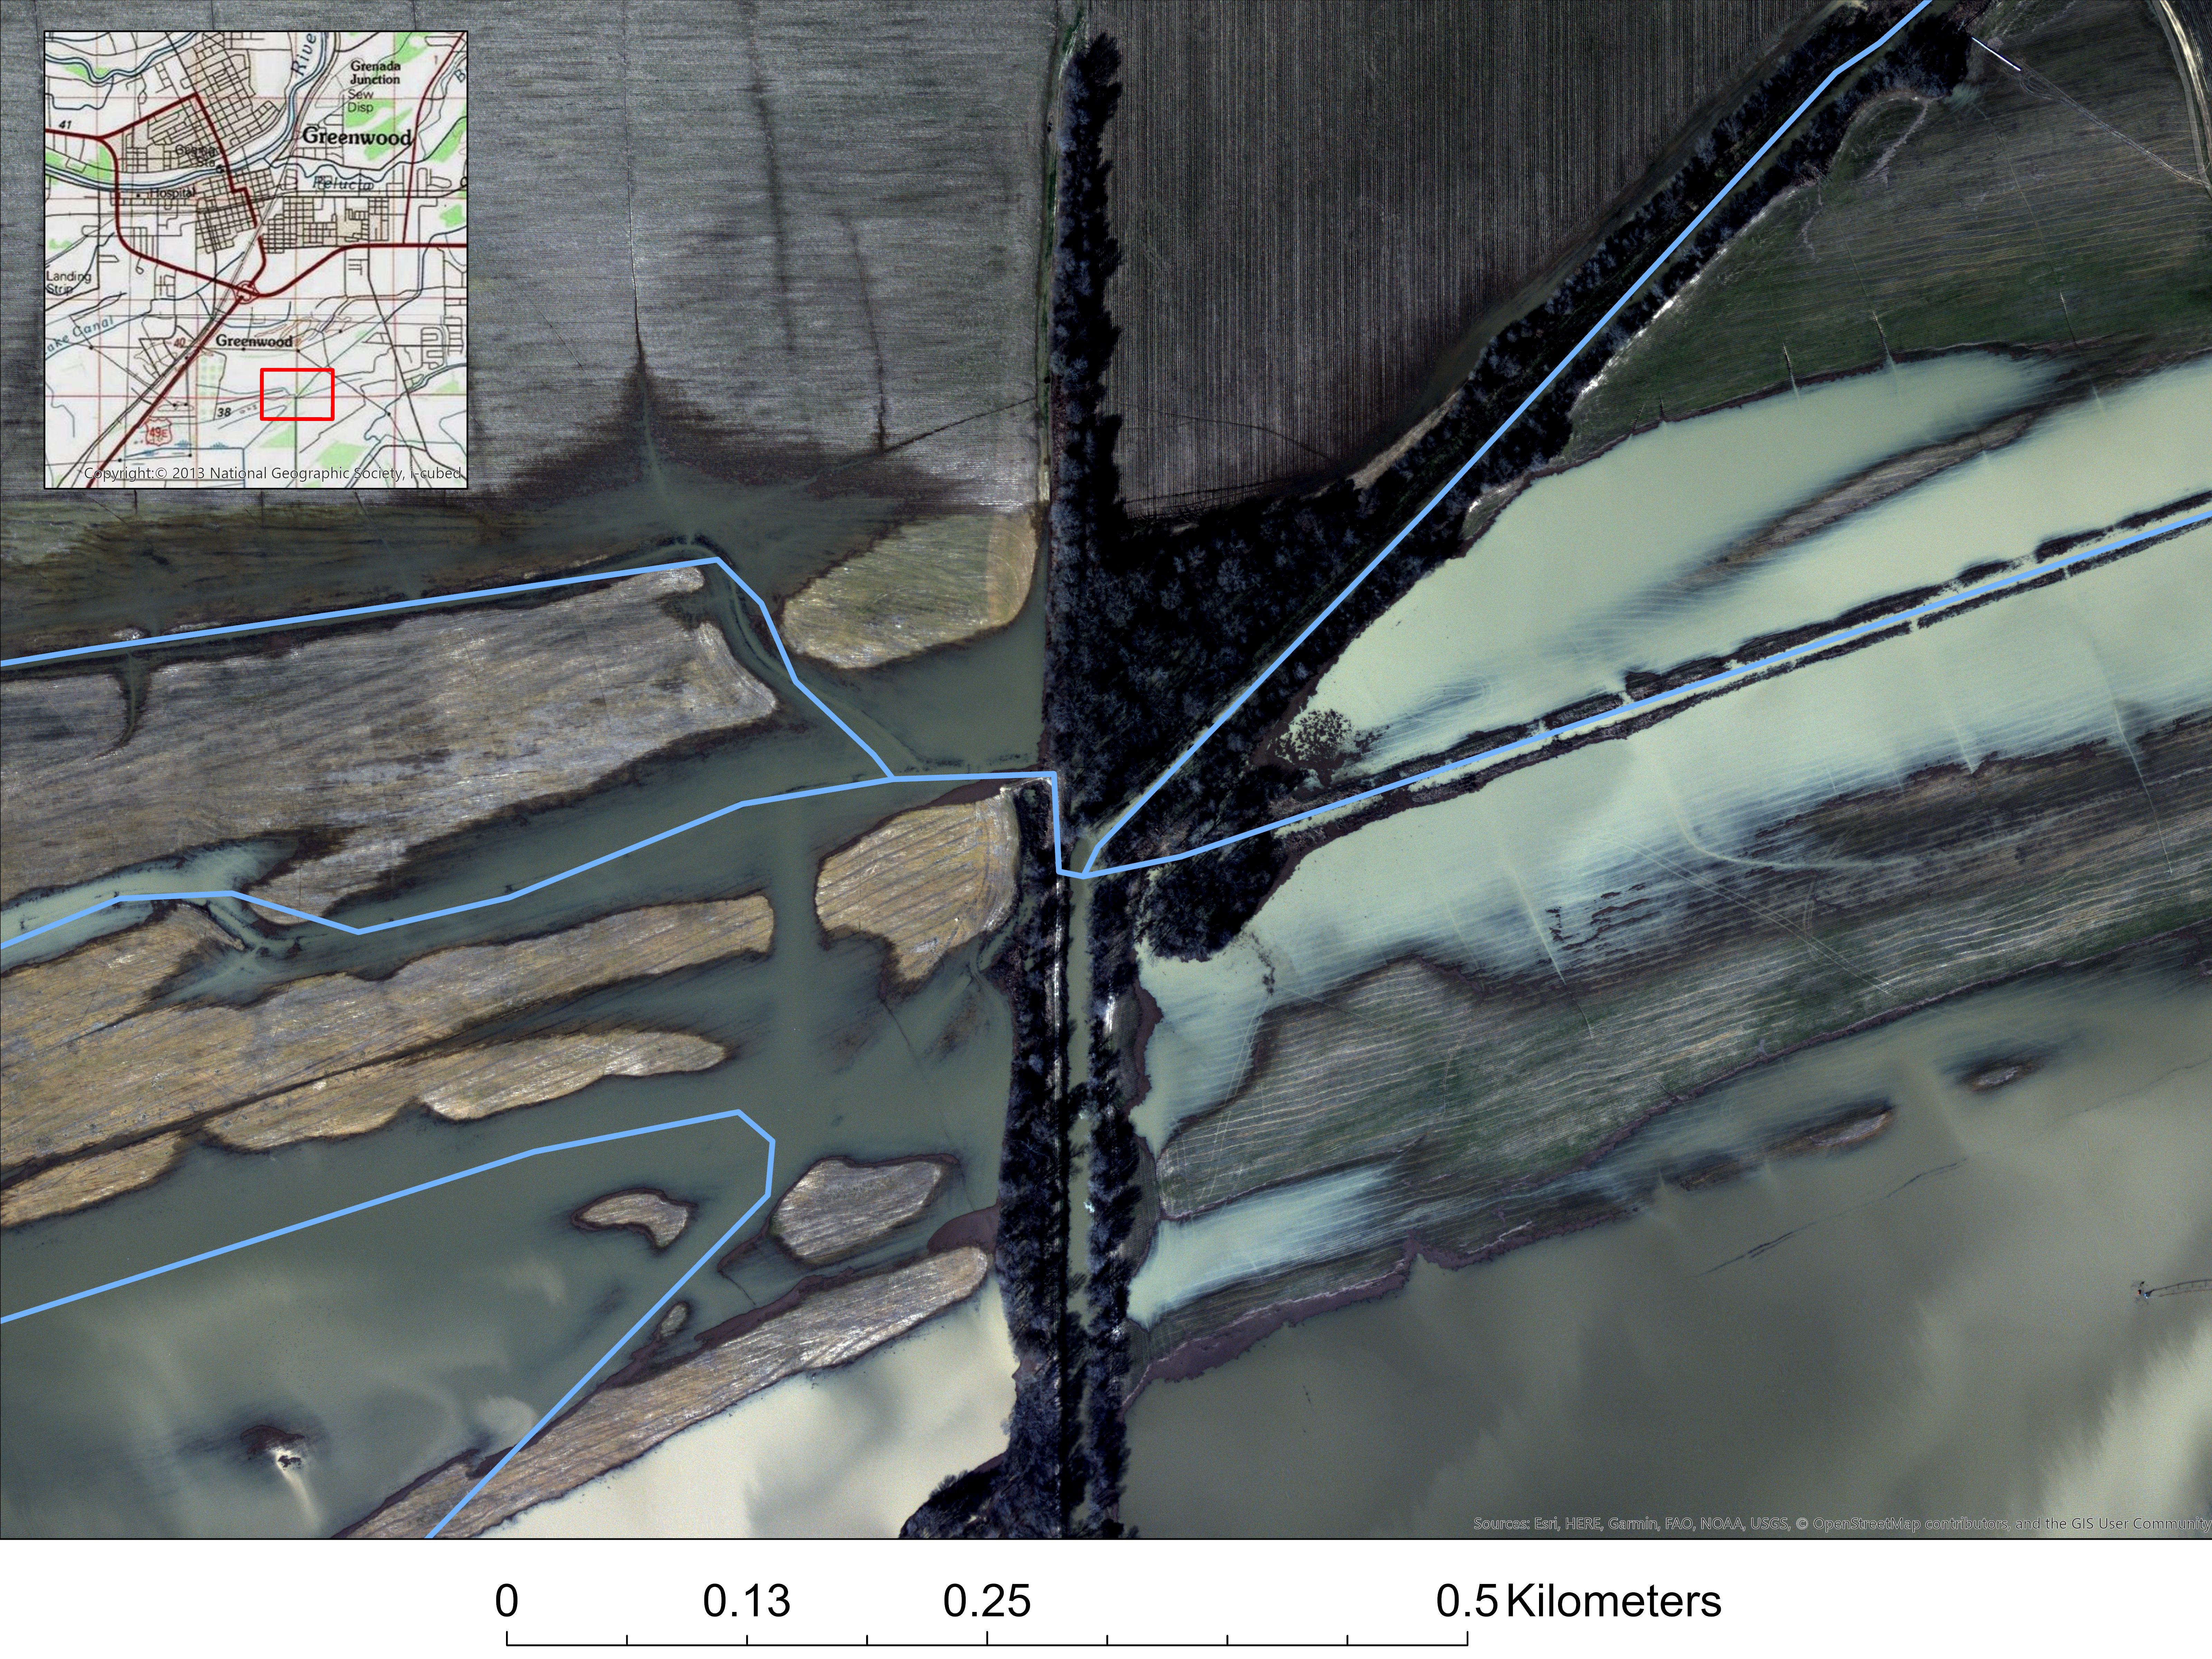
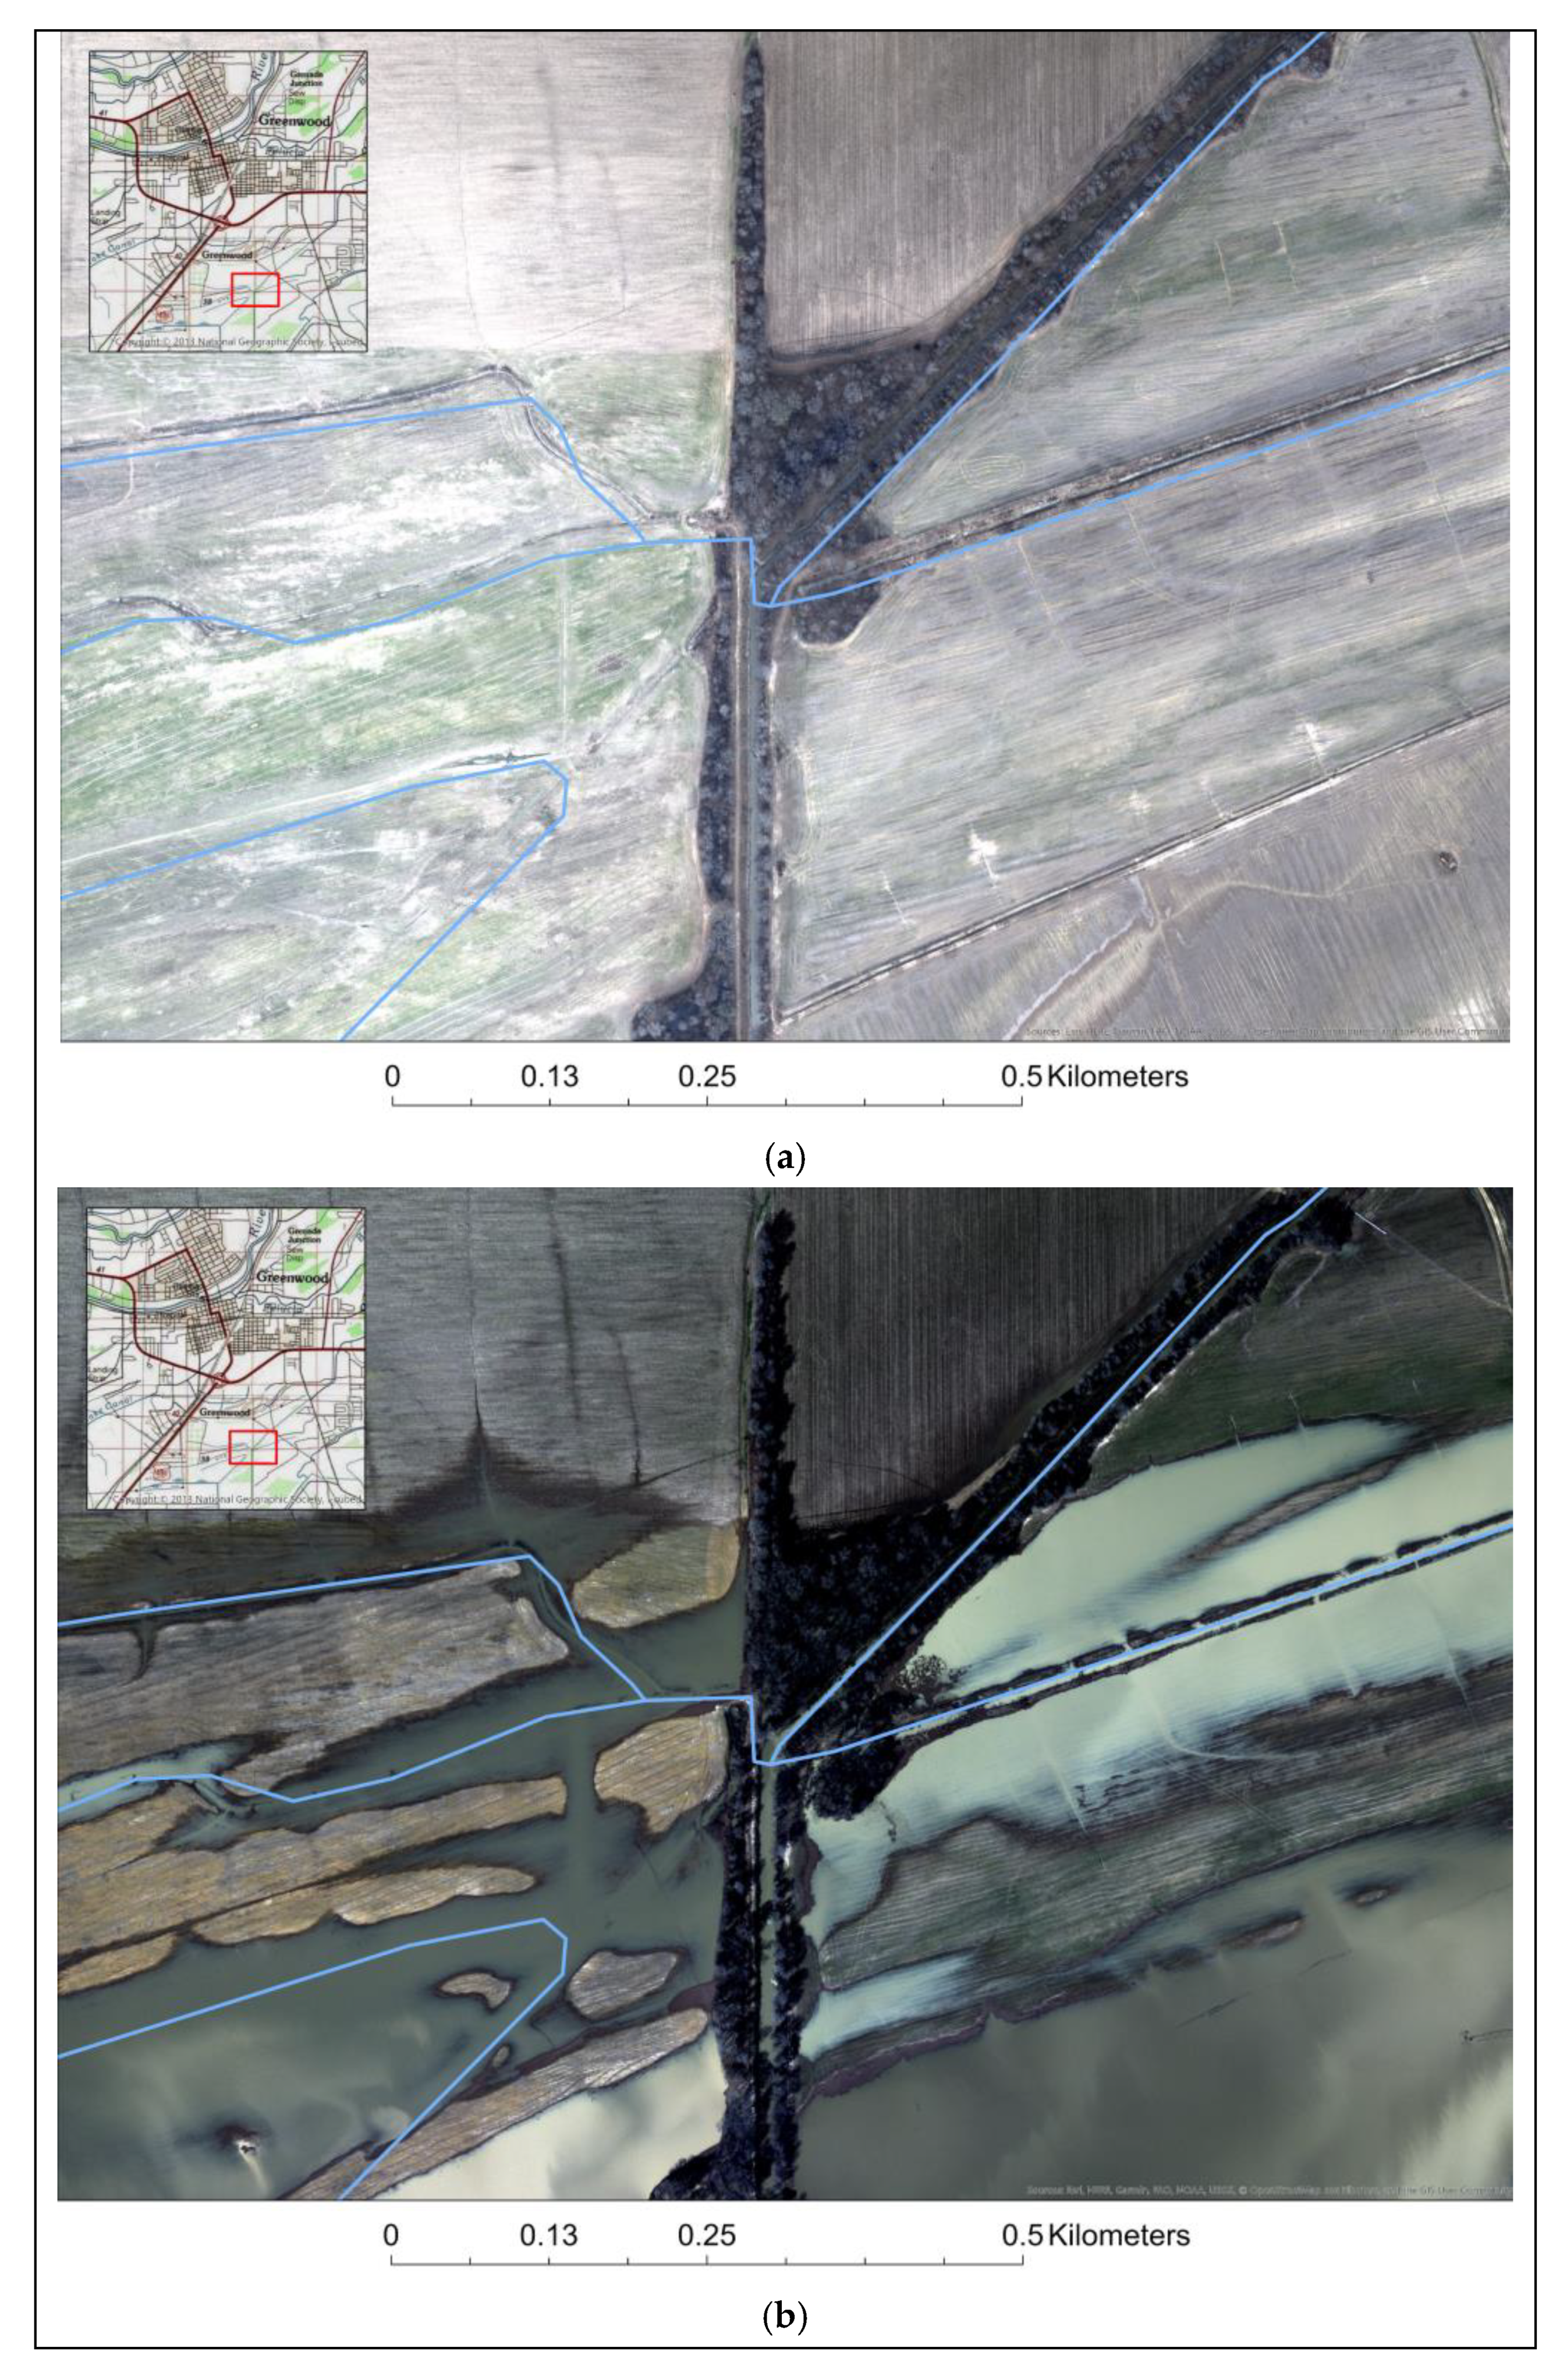
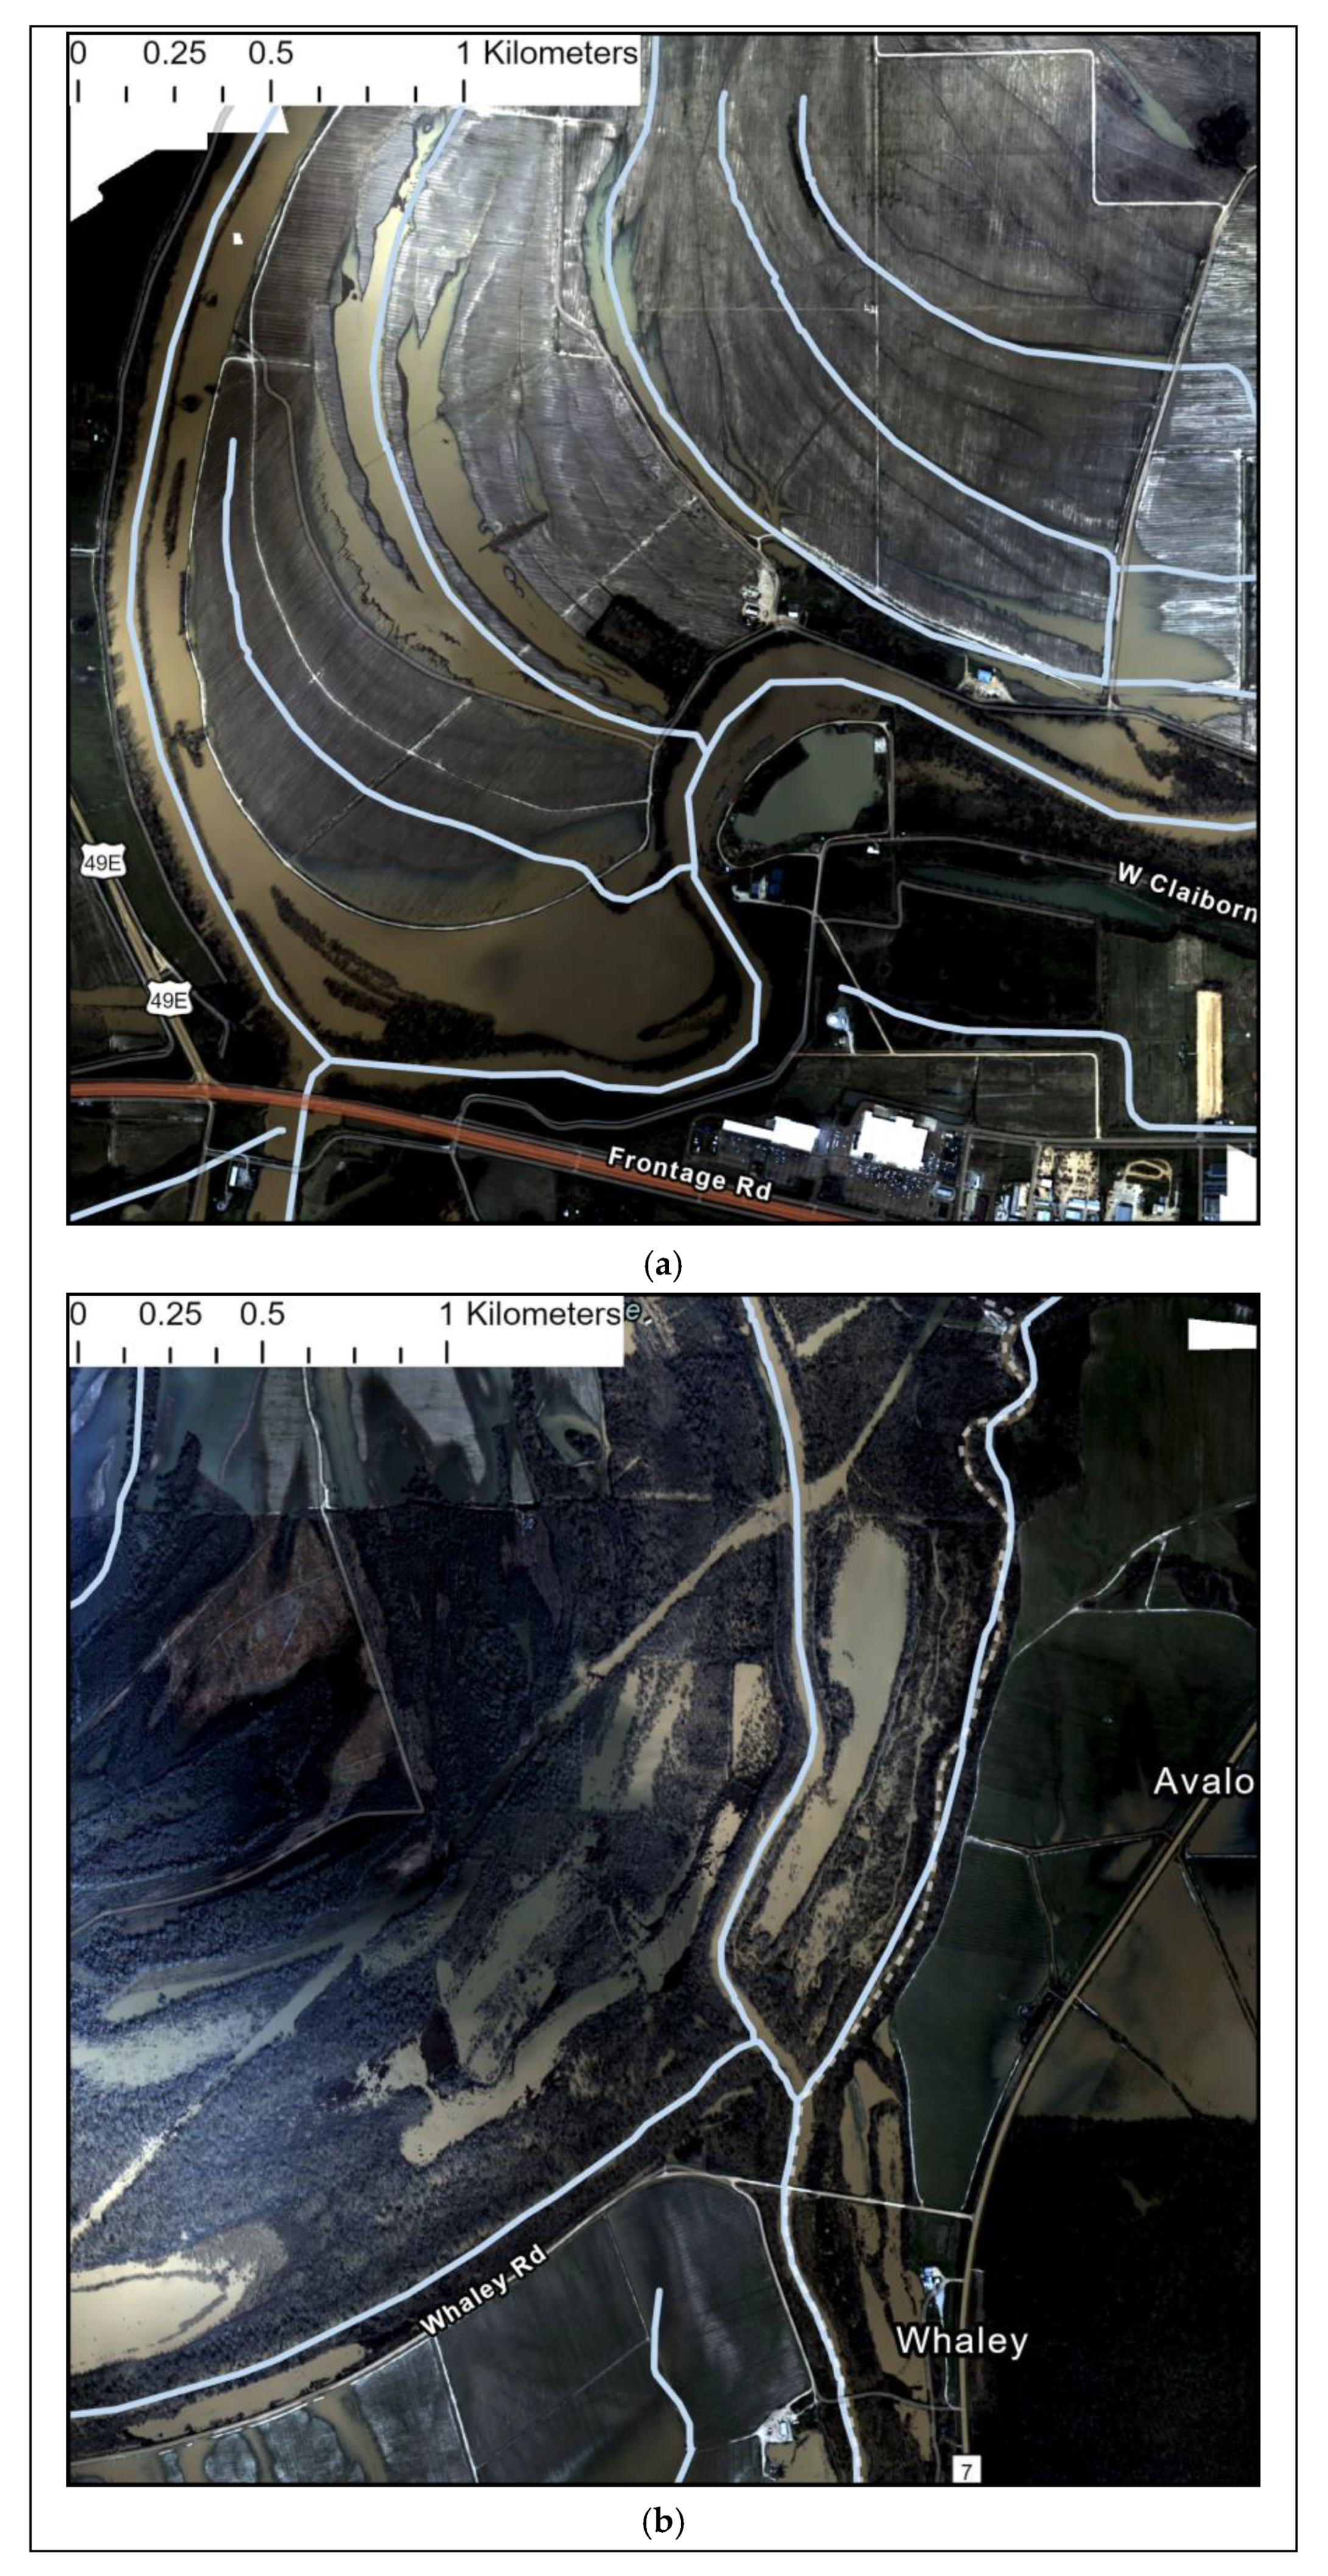
Using the Feb. 24, 2019 flood near Greenwood, MS as an example, Figure 4 shows the inundated area over an agricultural landscape with minimal topographic relief relative to non-flood conditions on Jan. 16, 2019. On Feb. 24, the Yazoo River at Greenwood, MS was at 38.1 feet (11.6 m), which was just below the record flood stage of 40.1 feet (12.2 m) [30]; however, it is difficult to assess the relationship between river stage at the observation point with flood conditions along minor tributaries and low-lying areas. While the defined river channels do provide some information about where inundation can be expected during over-bank conditions, the high-resolution imagery clearly shows the complex spatial patterns of flooded area over fields adjacent to the flow paths. While the inundation is likely quite shallow, the aggregate volume of water stored on the landscape can quickly become substantial, possibly leading to errors in predictive models that do not recognize nor account for the stored water. Further examples are shown in Figure 5, where inundated areas show varying spatial correlation with recognized river channels (in this case the National Hydrography Dataset). In Figure 5a, some channels do not show any surface water while in Figure 5b there is surface water well removed from the channels. Such inconsistencies can lead to substantial error in hydrologic modeling and planning, and in terms of agricultural or emergency management, diagnosing and predicting flooding in areas like this is critical for a variety of economic, environmental, and safety reasons.
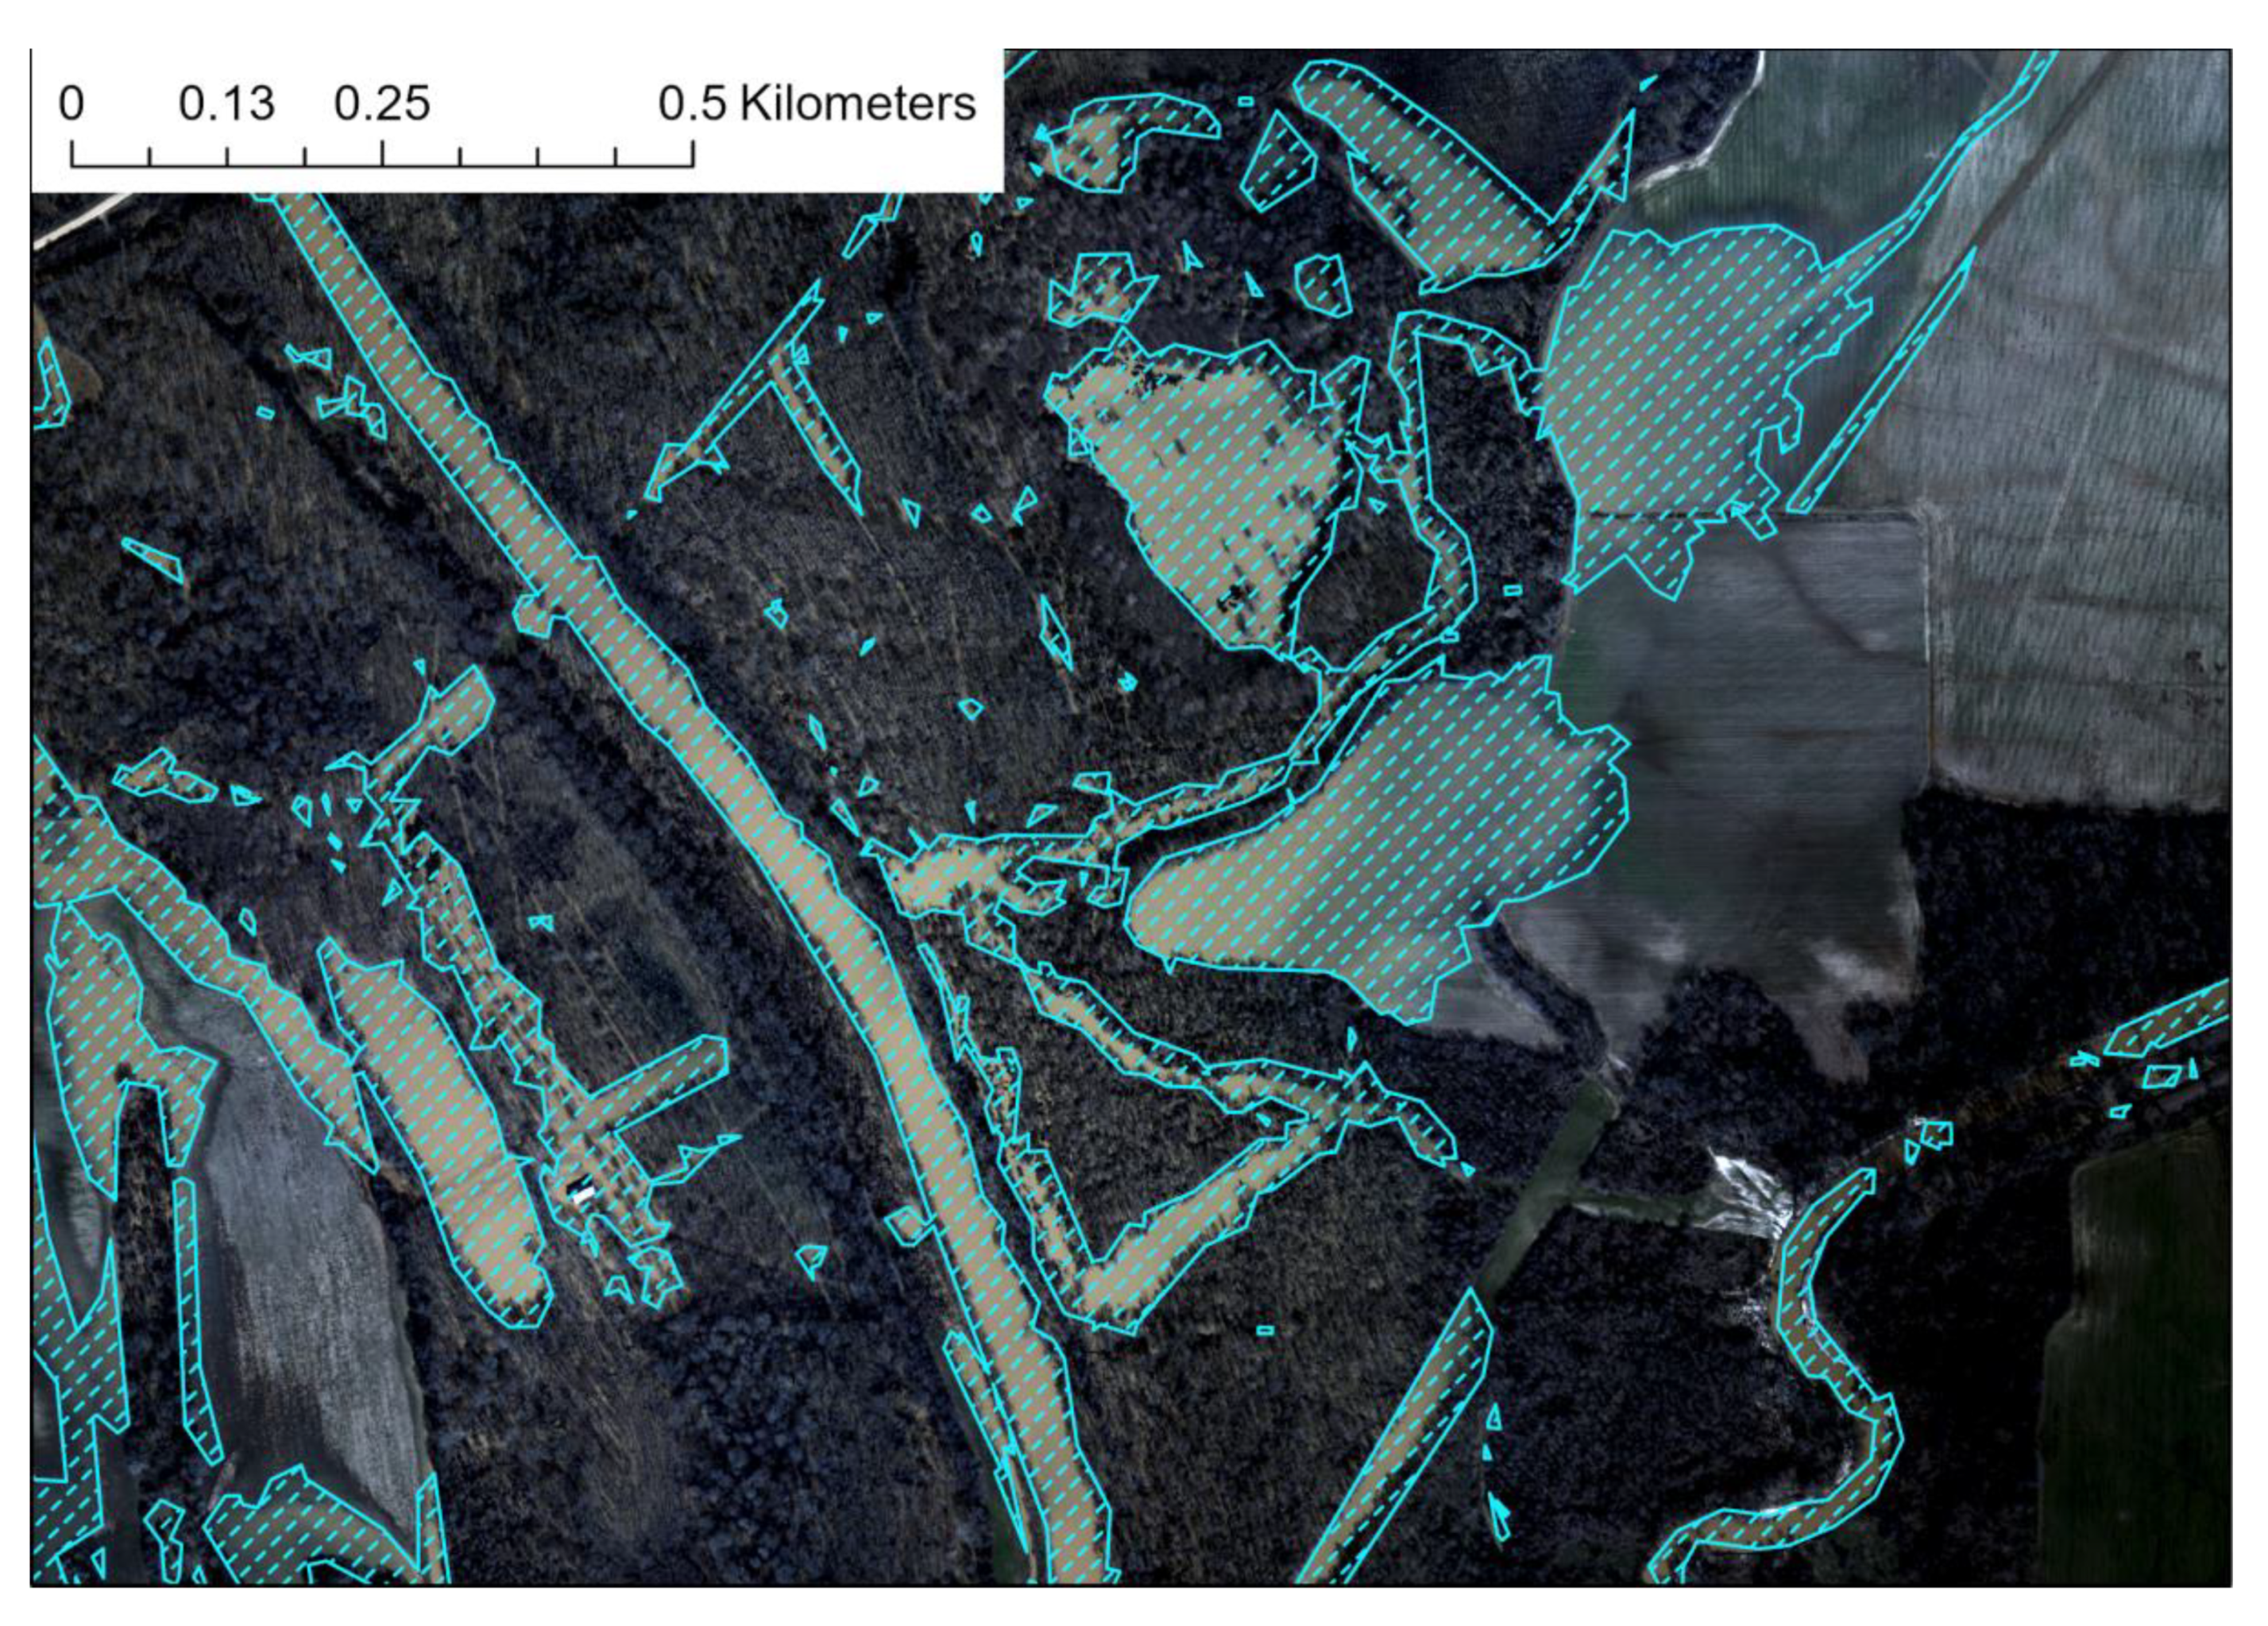
To better illustrate the utility of UAS data in assessing current surface hydrologic conditions, Figure 6 shows an example of a land-water mask denoting inundated area over an agricultural area northeast of Greenwood, MS. The low topographic relief and heavy vegetation in this area decrease the potential accuracy and utility of satellite estimates of inundation; however, applying an adjusted NDVI filter on the UAV imagery allows for the development of a highly detailed map showing inundated area both along a river channel as well as adjacent to a floodplain. As mentioned previously, surface water storage in flooded fields poses a substantial problem when quantifying the volume of water moving along a channel, so being able to define the extent and depth using elevation data along with the detailed land-water mask allows for improved estimates of water volume at the field scale. Although such estimates are highly sensitive to the vertical accuracy of the elevation data, recognition of the areal extent of inundation does allow for an approximate diagnosis of stored water within a floodplain (especially if there are GCPs with a known elevation within the imaged area), allowing for improved analysis of risk and damage.
High-resolution georeferenced imagery from UASs and the associated inundation maps, combined with observed gauge records at select points (if available and representative of the location), can provide a relatively complete description of the microscale hydrologic characteristics of a location. Furthermore, these data can be used to generate an event database for future reference, which is critical for post-event analysis and highlighting at-risk areas at specific flow criteria. Current databases offer limited qualitative information for select events, such as “flooding of courthouse steps” or “inundated parking lot”; therefore, inclusion of information such as high-resolution images, stage/discharge information, and maps and/or shapefiles of inundated area (along with estimated water elevation) would provide critical information for reference during future events. Additionally, this information could be used for verification or calibration of hydrologic models to improve microscale water level prediction over select areas. Such data could be stored and disseminated through a dedicated web portal, although the size of the processed imagery may necessitate the need for tiling of the data for easier delivery. As the number and types of applications using these data increase, specific data products can be generated from the initial imagery that can then be uploaded and made available to various stakeholders. Although not necessarily feasible, ideally the database would be updated during and after each major flood to provide information on inundation and the resulting modifications to the landscape.
3.2. Define Areas With Complex Hydrologic and/or Hydraulic Processes
Recognizing and assessing the influence of microscale features on surface water patterns during a flood is incredibly important for assessment of water storage and inundation, as the information can be used to define features impacting the hydraulic flow criteria along a channel leading to non-linear hydrologic responses. UAS platforms are especially useful for defining areas exhibiting complex hydrologic responses, including built structures, river confluences (leading to backwater effects), or submerged vegetation within a floodplain. As a flood event progresses, repeated imaging of an area having these features could help forecasters understand the impact of the microscale processes on the progression of flood waters, allowing for enhanced understanding of variations in the speed and magnitude of a flood peak as it moves downstream.
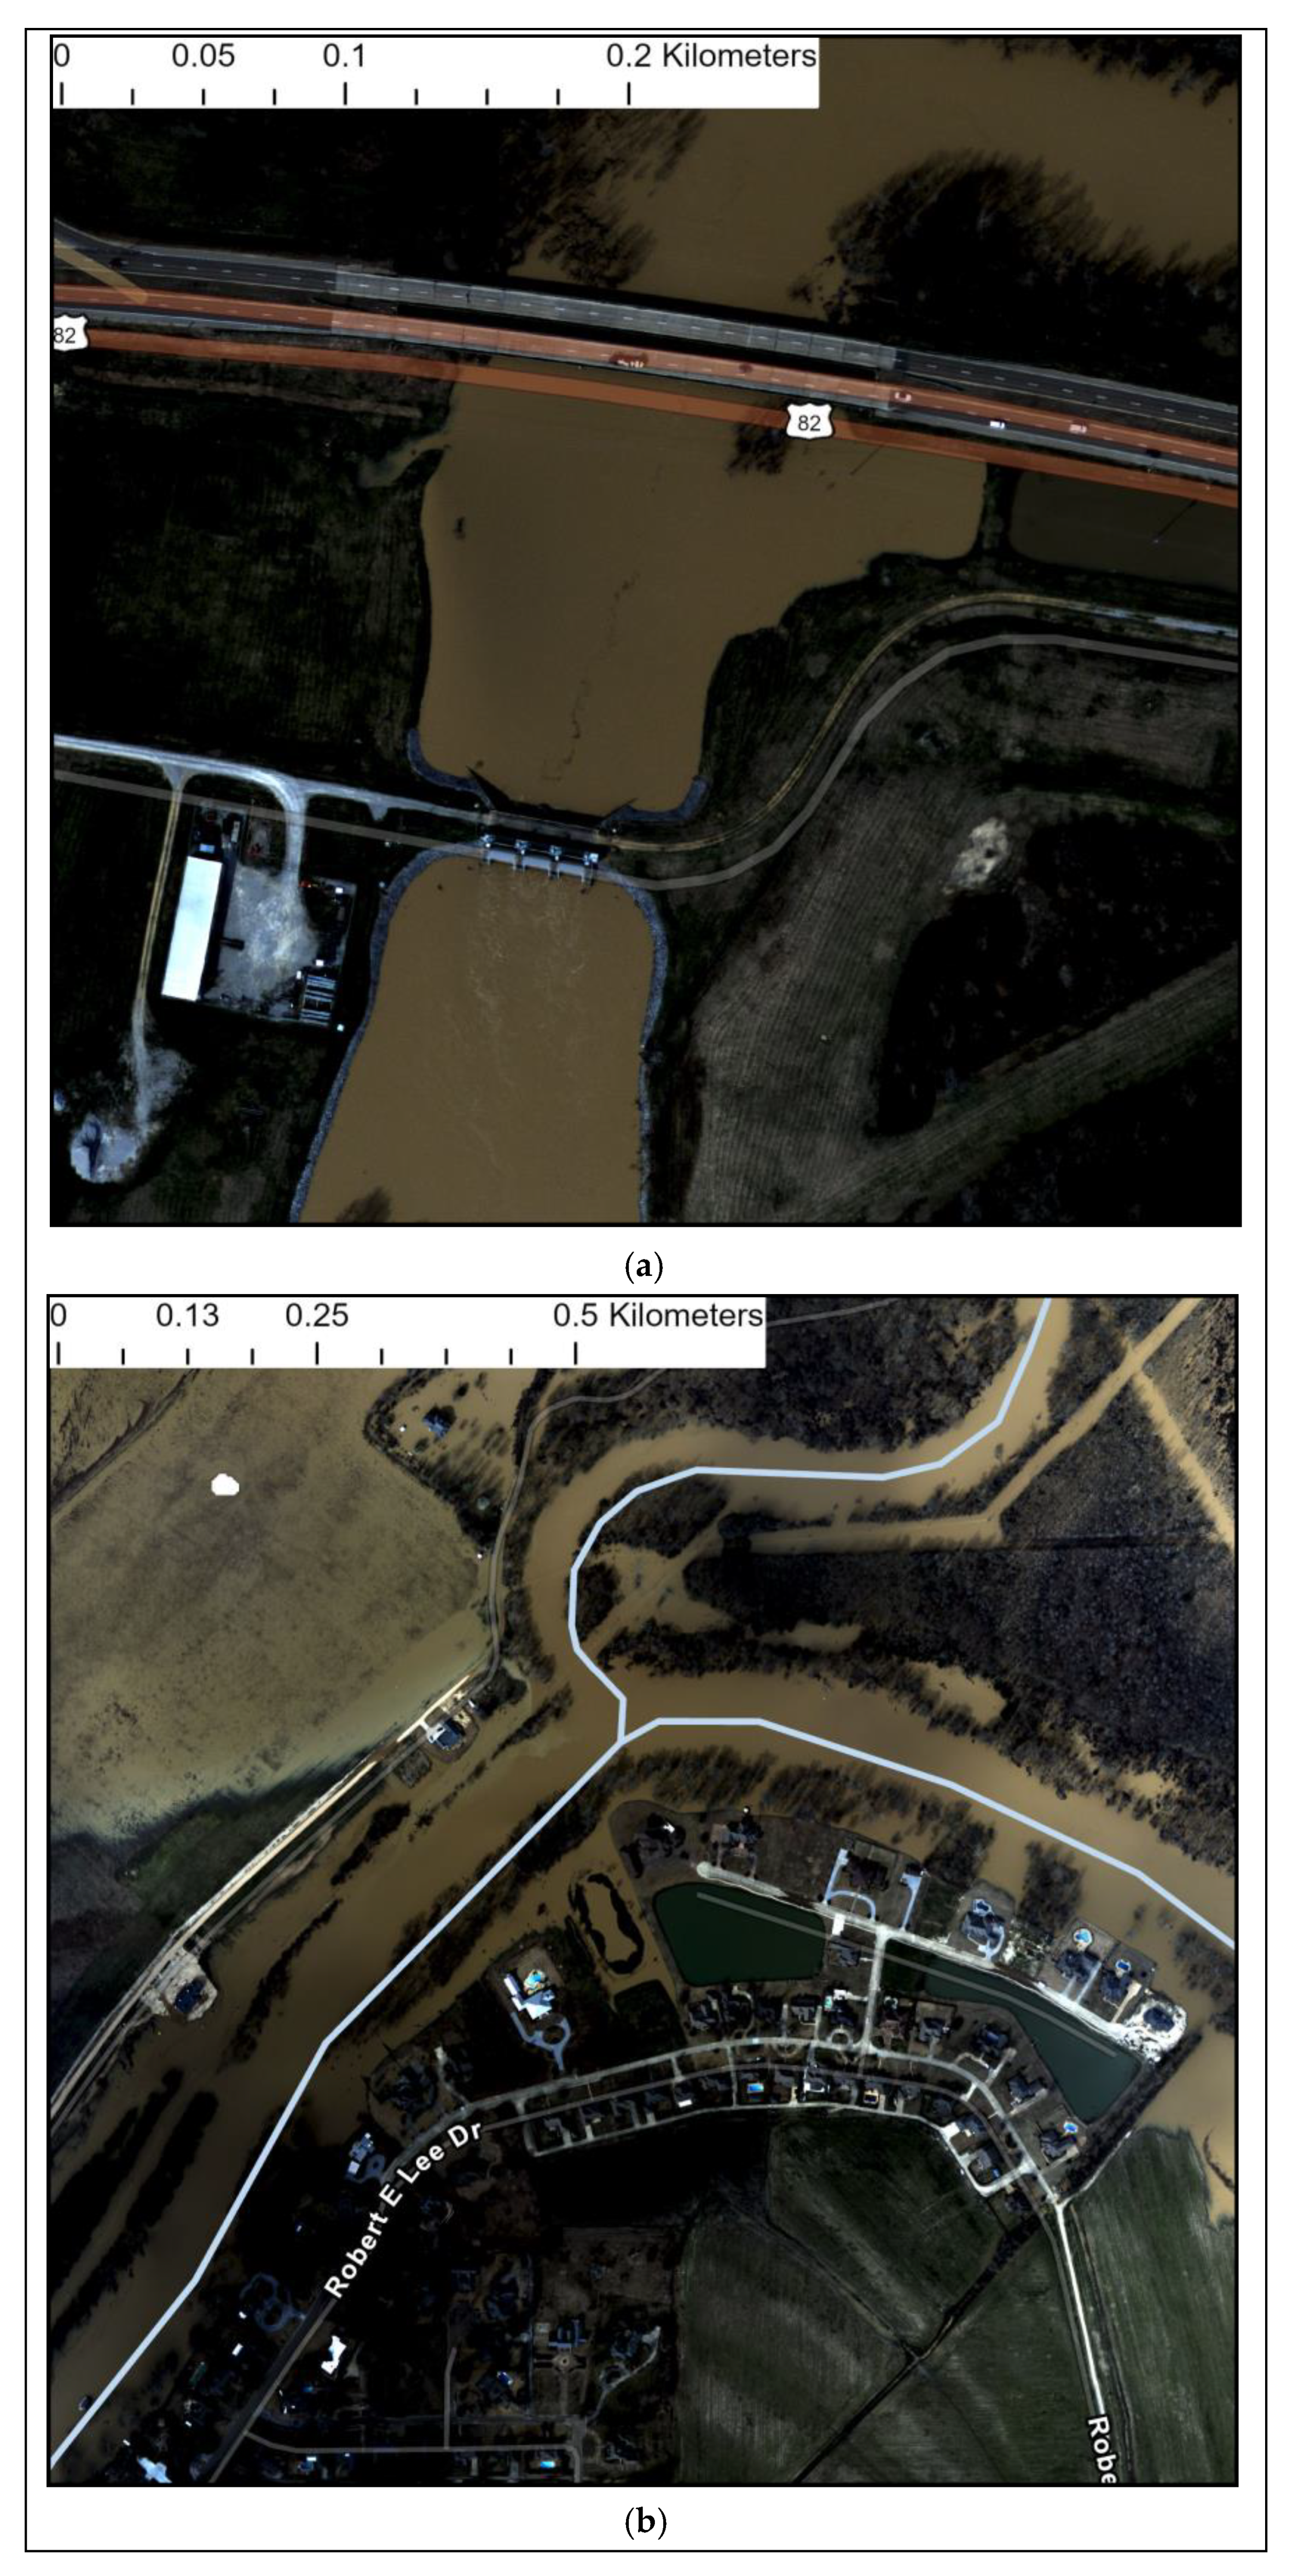
Figure 7 provides two examples of hydraulic influences on microscale hydrologic patterns, both of which are easily identified using UAS imagery. The first (Figure 7a) is a dam at the confluence of the Tallahatchie River and the Yalobusha River west of Greenwood, MS. During the progression of a flood event moving south along the Tallahatchie River, this dam can be used to dampen the progression of the floodwave around Greenwood. Although known discharge through the dam can be used to modify hydrologic model simulations, recognizing and understanding the amount of inundation around the structure is important both for flood control and dam safety.
Figure 7b, which shows the confluence of the Yalobusha River with a tributary northwest of Greenwood, MS, provides a good example of how changes in built structures along with natural hydraulic processes can lead to complex and often dangerous microscale hydrologic responses. In instances of a progressing flood wave from the north, this area becomes inundated and acts as an area of storage to slow the progression of flood waters and decrease the potential for flooding within Greenwood, MS. Despite the tiled nature of the images and the variability in lighting due to the changing conditions and orientation of the UAS during flight, the transition from urban to rural areas and the specific surface characteristics of the area (i.e., vegetation, orientation of roads and embankments, etc.) are easily seen and identified. As shown by the UAS imagery, there are flooded residential properties at this location where backwater effects from the confluence of the rivers make hydrologic prediction difficult. Recognizing the existence and influence of these structures on river flow and surface water storage, combined with the known backwater effects during flood conditions, can greatly enhance the diagnosis and prediction of microscale river properties and inundation over the area.
3.3. Improve Surface and Channel Representation in Model Frameworks
A critical issue in microscale hydrologic simulations is correctly representing the surface topographic and channel features within a modeling framework. This is especially true in areas with low topographic relief or complex stream networks, where stream density and meandering can substantially alter the speed and volume of surface runoff. During flood conditions, the complexity of a river system can change due to the development of backwater processes, inundation of smaller tributaries to generate fewer (albeit larger) flow paths, connection of previously independent storage areas (such as ponds or areas adjacent to levees), and so on. As a result, given the ability of UAVs to operate under cloud decks and fly along specific river channels, the related imagery can be extremely useful in providing detailed information about stream networks such as channel width, shape, and curvature. Additionally, the imagery can show inundated areas during high water events to illustrate ephemeral streams and floodplain storage areas, which can help with future risk assessment and additional UAV mission planning by outlining areas at risk during flood conditions. By knowing areas where stream complexity is high, future planning can focus on those regions to maximize the effectiveness of the resulting imagery in hydrologic analysis.
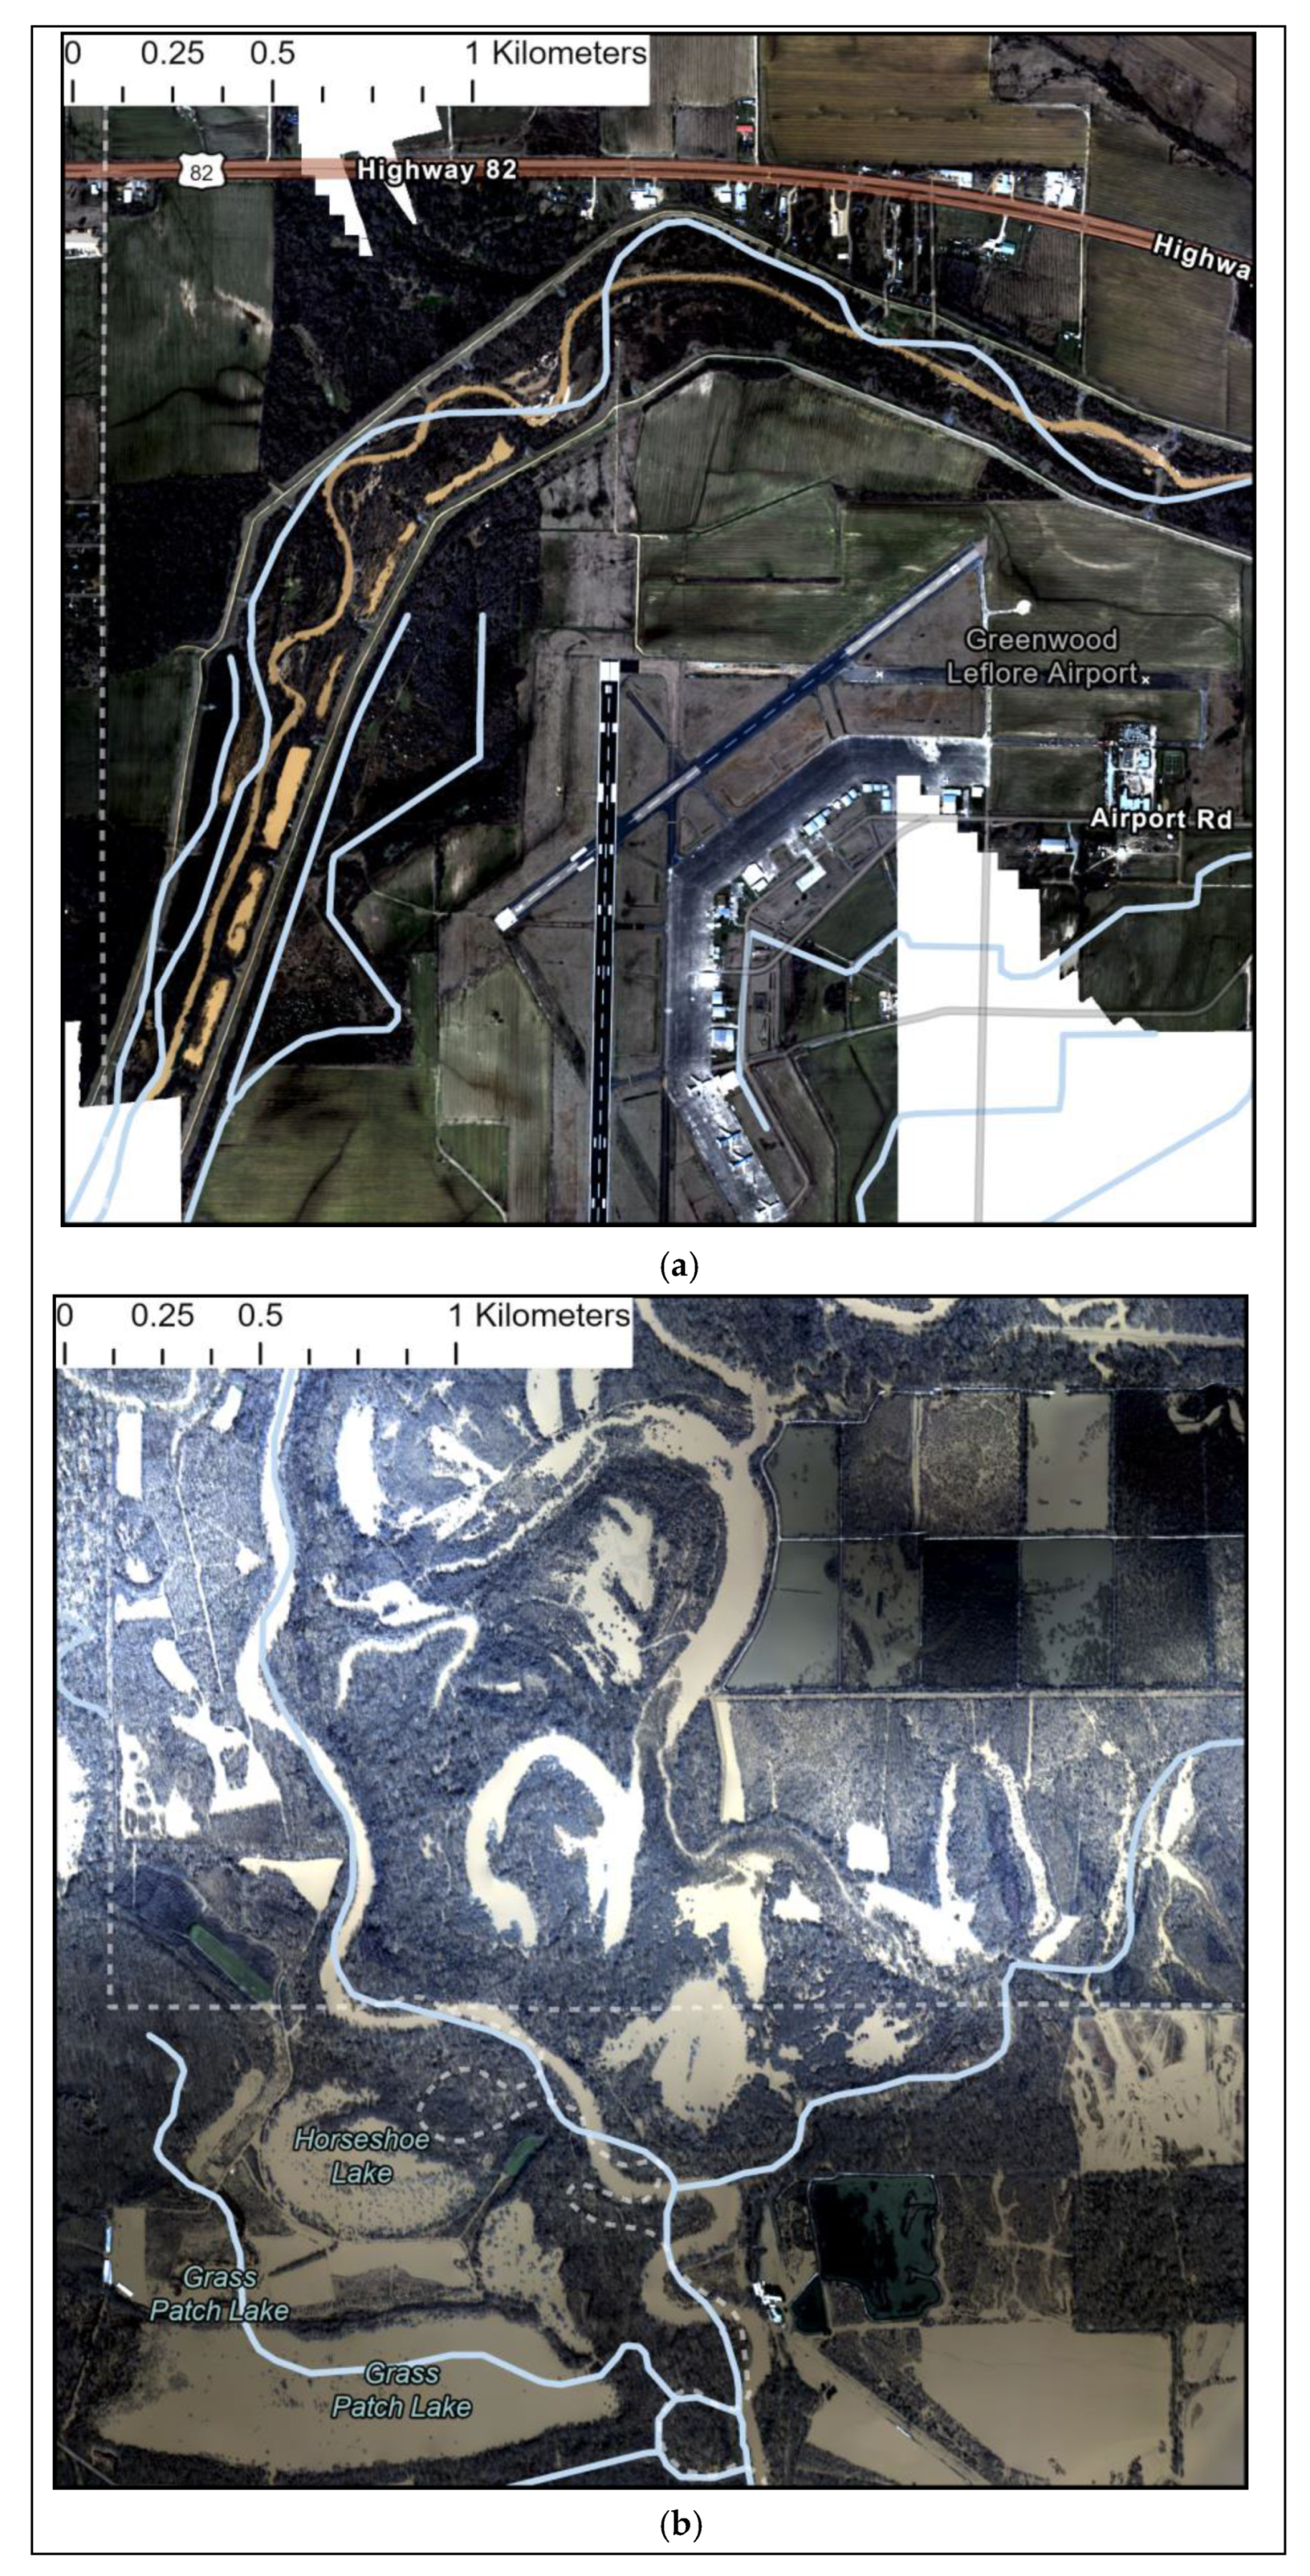
Figure 8 shows two examples where UAV imagery indicates potential issues in existing larger-scale channel networks, which can be easily recognized due to the high spatial resolution of the data. Figure 8a shows a creek running around Greenwood-Leflore Airport alongside the channel network defined by the National Hydrography Dataset (NHD). While the NHD flow lines are considered representative in regional hydrologic simulations, it is clear from this image that at the microscale the flow lines are not spatially accurate. By using the UAV imagery for developing a microscale hydrologic prediction framework, a more realistic channel network can be generated (or an existing network can be modified) to more appropriately route surface water. This would improve not only the timing and volume of surface runoff but would allow for more precise assessment of streamflow at specific geographic locations within the simulation domain (such as near built structures).
Building on this concept, at high water levels the channel network over small areas can and does change; therefore, defining a more realistic and representative hydrologic framework is critical for proper discharge and inundation estimation. Figure 8b illustrates how UAV-generated imagery is necessary in producing such a framework, as it allows for determination of surface water flow paths among existing waterways, ephemeral channels, and areas of water storage (such as oxbow lakes that are normally disconnected from river channels at normal flow levels). By improving channel representation in numerical hydrological models, especially those produced specifically for microscale flood prediction, the potential accuracy and overall usefulness of model output can be increased. It should be noted that the level of improvement in models is not just dependent on the representativeness of the underlying hydrologic network, but also on the initial data used to force the models. As a result, the final determination of how accurate the river network should be and what level of spatial detail should be included in the model framework is based on the experience and needs of the forecasters and decision makers.
Along with direct imagery, with the proper flight plan and image overlap considerations a digital surface model can be generated using photogrammetric methods. Based on guidance from the Agisoft software used for post-processing of the mission data, a recommended minimum 60% cross-track and 80% in-track overlap is necessary for “good quality” results. These recommendations have changed over time and can vary based on the availability of surface tie points and image resolution. For the study missions, the guidance provided by the Overwatch sensors was used, leading to a minimum cross-track and in-track overlap of 40% and 60%, respectively, with a 20% scan-frame overlap (overlap between the five images along the cross-track) for orthomosaic generation. Although a detailed quantification of the influence of the imagery overlap on orthomosaic accuracy is beyond the scope of this study, for a microscale hydrologic simulation, proper representation of the topography within the simulation domain is absolutely critical to account for overland flow and runoff. Additionally, if the elevation data are to be used to define channel networks, accurate and high-resolution microscale topographic relief are needed.
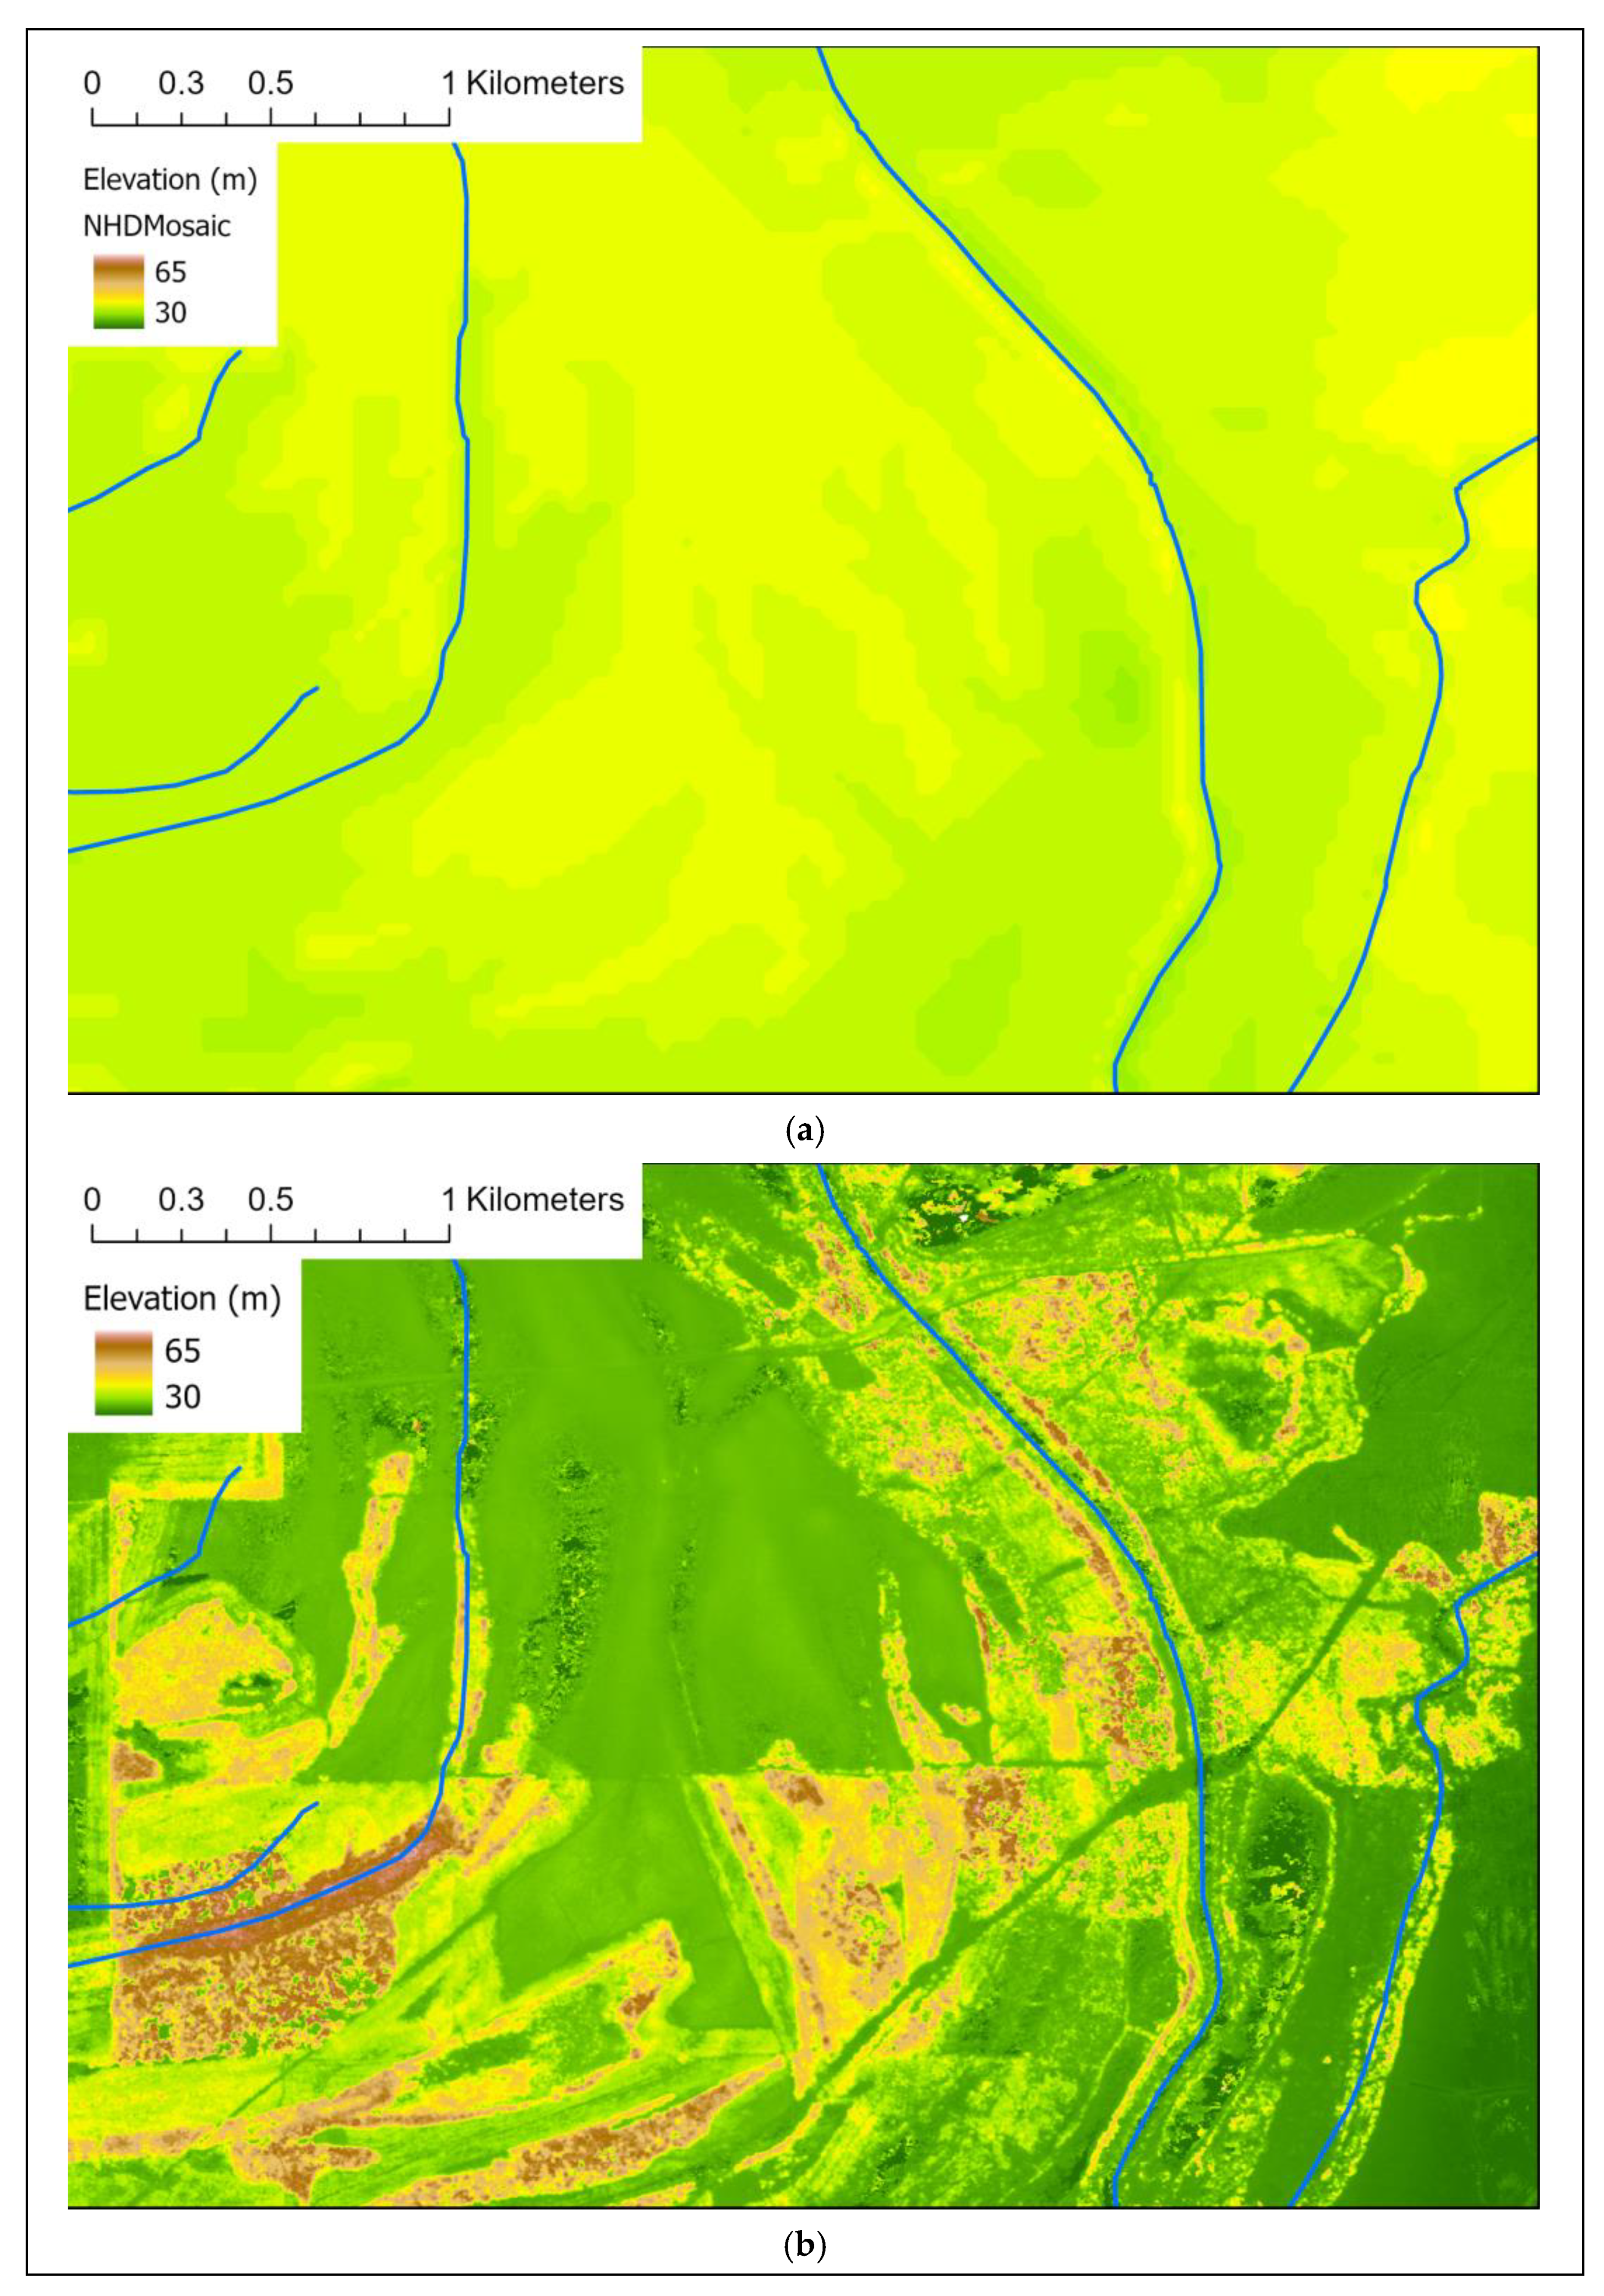
To illustrate the potential impact that UAV-generated elevation data can have in defining microscale topographic features, Figure 9 provides a comparison between a ~30 m DEM from the NHD and a ~16 cm DSM produced by the Feb. 25, 2019 UAV mission. Since the primary focus of the UAV flights for this work was obtaining imagery of hydrologic features, namely main river channels, the flight paths were not organized to maximize cross-track image overlap. Despite this, and noting that the two datasets do show different aspects (ground elevation vs. elevation of surface features, respectively), the figure does illustrate the variability in elevation that influences surface water flow direction, speed, and path at the microscale. Within the DSM (Figure 9b), small-scale features that could contribute to accelerated surface runoff are more clearly defined within otherwise flat agricultural fields, while the topographic variability in and adjacent to known channels is also more clearly defined. While hydrologic applications of UAVs are generally focused on flood conditions, the ability to generate a DSM highlights the utility of flights at low water levels during the winter season when vegetation obstructions are minimized.
4. Conclusions
As unmanned aerial vehicles (UAVs) and associated sensor and imaging packages become more readily available for scientific applications, it is important to define the utility of the associated data for specific applications. In the context of this research, the objective was to define the role of UAVs and associated imagery in meeting the data needs and requirements for microscale hydrologic analysis. A series of missions conducted over Greenwood, Mississippi in January and February 2019 during normal and extreme flood conditions were used to illustrate the use of high-resolution UAV-based imagery in identifying microscale hydrologic impacts. While the initial application of the data was for increased situational awareness of hydrologic conditions during operational river forecasting, the use of the data and related derived products for analysis of high-resolution features and processes indicated a much more robust set of benefits after initial mission completion.
The primary application of UAV-based imagery for hydrologic applications is the assessment of water levels within the river channels, as well as areas of surface water storage across the landscape. This information is important in defining the existence and extent of storage, which helps in both the diagnosis and forecasting of river levels before and after maximum flood stage, as well as defining inundated areas. The ability of UAV platforms to operate underneath cloud decks shows an added benefit compared to satellite imagery, especially during rapidly evolving high-water conditions when extensive cloud cover is in place. Additionally, due to the inherent high spatial resolution of the imagery, it is possible to define areas with complex hydrologic or hydraulic conditions such as river confluences or dams, respectively. The non-linear flow patterns in and around these areas make diagnosis of river conditions difficult; therefore, having high-resolution imagery during a flood event helps in defining the relative impact of these processes on water levels and flow paths.
Beyond direct image analysis, UAV-based imagery can be used to develop important derived products useful for microscale hydrologic model development. With proper flight planning to maximize image overlap along and across the flight path, photogrammetric techniques can be used to generate digital surface models (DSM) for development of gridded flow paths and channel networks. This information can be used to develop model frameworks over select microscale regions, potentially improving accuracy and/or precision of model output.
Although there are numerous benefits to the use of UAV imagery and associated data in hydrologic applications, there are distinct limitations that must be considered. First and foremost is the limited spatial coverage of UAV imagery relative to existing remotely sensed satellite datasets, which is directly associated with the cost and legal restrictions of UAV deployment. Considerable planning must be done before a mission can be performed, as a certificate of authorization (CoA) must be obtained from the Federal Aviation Administration (FAA) before flights can be conducted. Depending on the rules outlined by the CoA, additional resources may be needed (i.e., chase planes) or restrictions may be in place (i.e., cannot fly over specific points) that increase the cost and/or decrease the utility of the data. As UAVs are used in more scientific applications and the usefulness of the associated data are proven, some of these limitations may be minimized over certain times or areas. For example, permission to fly beyond visible line-of-sight (BVLoS) over some areas would allow for a substantial increase in collected imagery during a single flight, thereby maximizing the cost–benefit ratio of a mission. Additionally, although UAVs do offer the advantage of being able to fly under cloud decks that would otherwise obscure satellite imagery, other weather considerations such as high wind speeds, precipitation, or even extreme temperatures can limit the ability to operate. Therefore, planning and implementation of a UAV mission does depend on meteorological conditions.
Given the defined uses of UAV imagery in microscale hydrologic diagnosis and prediction, there are several clear paths forward to future research and data development. First and foremost, future work should focus on expanding the collection of UAV imagery over various locations and hydrologic conditions. This will enhance the knowledge of when and where high-resolution aerial data are the most useful, both in terms of landscape conditions (i.e., agricultural vs. forested, high vs. low topography, etc.) and river conditions (i.e., flood vs. low flow). As is generally the case in any scientific framework, the more data the better. Building on this, future missions could be planned with imagery from multiple platforms (i.e., satellite, aircraft, multiple UAVs, etc.), along with established GCP and georeferenced objects, with the specific purpose of accuracy assessment of the various derived products.
In terms of prediction, future work should focus on the use and application of UAV imagery and derived topographic data within the hydrologic forecast pipeline for microscale simulation domains. Derived elevation and stream channel information can enhance model domain configuration and setup, potentially increasing the physical representativeness of the model at the microscale and thereby improving the precision and accuracy of the output. Additionally, gridded estimates of inundated area through land-water masks of the UAV imagery could be used for model verification or model nudging, helping to improve subsequent model forecasts. Building on the concept of microscale hydrologic models and prediction, one important question that remains to be answered is the impact of high-resolution data on the accuracy of simulations. Although the idea of microscale forecasts of water level and inundation are intriguing, it is necessary to quantify the impact of spatial data resolution on model performance. Knowing the threshold where resolution no longer improves model accuracy can help define future UAV missions and products and could potentially set the stage for the development of guidelines in microscale hydrologic data collection. This information would then work backwards through the data collection pipeline, improving planning and implementation of missions. For example, if a specific horizontal resolution is defined as a criteria maximum value, then UAV flight altitude can be standardized, allowing for more precise determination of areal coverage and imagery extent.
Author Contributions
Conceptualization, J.L.D. and R.J.M.; methodology, J.L.D.; software, L.H.; validation, J.L.D. and R.J.M.; formal analysis, J.L.D. and L.H.; investigation, J.L.D., R.J.M., and L.H., data curation, L.H.; writing–original draft preparation, J.L.D.; writing–review and editing, R.J.M.; visualization, J.L.D.; supervision, J.L.D. and R.J.M.; funding acquisition, J.L.D. and R.J.M.. All authors have read and agreed to the published version of the manuscript.
Funding
This work was funded by the National Oceanic and Atmospheric Administration (NOAA) Unmanned Aircraft Systems Program in the Office of Oceanic and Atmospheric Research (OAR) through the Northern Gulf Institute (NGI), a NOAA Cooperative Institute.
Acknowledgments
The authors would like to thank personnel from the Mississippi State University Raspet Flight Laboratory for their work in mission planning and execution, as well as personnel from the Lower Mississippi River Forecast Center (LMRFC) in mission planning and real-time feedback during the missions.
Conflicts of Interest
The authors declare no conflict of interest. The funders had no role in the design of the study; in the collection, analyses, or interpretation of data; in the writing of the manuscript, or in the decision to publish the results.
References
- Pajares, G. Overview and current status of remote sensing applications based on unmanned aerial vehicles (UAVs). Photogramm. Eng. Remote Sens. 2015, 81, 281–330. [Google Scholar] [CrossRef] [Green Version]
- Şerban, G.; Rus, I.; Vele, D.; Breţcan, P.; Alexe, M.; Petrea, D. Flood-prone area delimitation using UAV technology, in the areas hard-to-reach for classic aircrafts: Case study in the north-east of Apuseni Mountains, Transylvania. Nat. Hazards 2016, 82, 1817–1832. [Google Scholar] [CrossRef]
- Templeton, R.C.; Vivoni, E.R.; Méndez-Barroso, L.A.; Pierini, N.A.; Anderson, C.A.; Rango, A.; Laliberte, A.S.; Scott, R.L. High-resolution characterization of a semiarid watershed: Implications on evapotranspiration estimates. J. Hydrol. 2014, 509, 306–319. [Google Scholar] [CrossRef]
- Rango, A.; Vivoni, E.R. Vivoni Hydrology with unmanned aerial vehicles (UAVs). In Proceedings of the AGU Chapman Conference on Remote Sensing of the Terrestrial Water Cycle, Kona, HI, USA, 19–22 February 2012. [Google Scholar]
- Hamshaw, S.D.; Engel, T.; Rizzo, D.M.; O’Neil-Dunne, J.; Dewoolkar, M.M. Application of unmanned aircraft system (UAS) for monitoring bank erosion along river corridors. Geomat. Natl. Hazards Risk 2019, 10, 1285–1305. [Google Scholar] [CrossRef] [Green Version]
- Langhammer, J.; Vacková, T. Detection and Mapping of the Geomorphic Effects of Flooding Using UAV Photogrammetry. Pure Appl. Geophys. 2018, 175, 3223–3245. [Google Scholar] [CrossRef]
- Hemmelder, S.; Marra, W.; Markies, H.; De Jong, S.M. Monitoring river morphology & bank erosion using UAV imagery—A case study of the river Buëch, Hautes-Alpes, France. Int. J. Appl. Earth Obs. Geoinf. 2018, 73, 428–437. [Google Scholar] [CrossRef]
- Tamminga, A.D.; Eaton, B.C.; Hugenholtz, C.H. UAS-based remote sensing of fluvial change following an extreme flood event. Earth Surf. Processes Landf. 2015, 40, 1464–1476. [Google Scholar] [CrossRef]
- Gallik, J.; Bolešová, L. sUAS and their application in observing geomorphological processes. Solid Earth 2016, 7, 1033–1042. [Google Scholar] [CrossRef] [Green Version]
- Tamminga, A.; Hugenholtz, C.; Eaton, B.; Lapointe, M. Hyperspatial remote sensing of channel reach morphology and hydraulic fish habitat using an unmanned aerial vehicle (UAV): A first assessment in the context of river research and management. River Res. Appl. 2014, 31, 379–391. [Google Scholar] [CrossRef]
- Tomsett, C.; Leyland, J. Remote sensing of river corridors: A review of current trends and future directions. River Res. Appl. 2019, 35, 779–803. [Google Scholar] [CrossRef]
- Rusnák, M.; Sládek, J.; Kidová, A.; Lehotský, M. Template for high-resolution river landscape mapping using UAV technology. Measurement 2018, 115, 139–151. [Google Scholar] [CrossRef]
- Tauro, F.; Petroselli, A.; Arcangeletti, E. Assessment of drone-based surface flow observations. Hydrol. Process. 2015, 30, 1114–1130. [Google Scholar] [CrossRef]
- Gao, A.; Wu, S.; Wang, F.; Wu, X.; Xu, P.; Yu, L.; Zhu, S. A Newly Developed Unmanned Aerial Vehicle (UAV) Imagery Based Technology for Field Measurement of Water Level. Water 2019, 11, 124. [Google Scholar] [CrossRef] [Green Version]
- Milani, G.; Volpi, M.; Tonolla, D.; Doering, M.; Robinson, C.; Kneubühler, M.; Schaepman, M. Robust quantification of riverine land cover dynamics by high-resolution remote sensing. Remote Sens. Environ. 2018, 217, 491–505. [Google Scholar] [CrossRef]
- Niwa, H.; Hayashi, N.; Morimoto, Y. Survey of riverbanks using UAV. Landsc. Ecol. Manag. 2016, 21, 75–80. [Google Scholar] [CrossRef] [Green Version]
- Gafurov, A.M. Small catchments DEM creation using Unmanned Aerial Vehicles. IOP Conf. Ser. Earth Environ. Sci. 2018, 107, 012005. [Google Scholar] [CrossRef]
- Hashemi-Beni, L.; Jones, J.; Thompson, G.; Johnson, C.; Gebrehiwot, A. Challenges and Opportunities for UAV-Based Digital Elevation Model Generation for Flood-Risk Management: A Case of Princeville, North Carolina. Sensors 2018, 18, 3843. [Google Scholar] [CrossRef] [Green Version]
- Room, M.H.M.; Ahmad, A. Mapping of a river using close range photogrammetry technique and unmanned aerial vehicle system. IOP Conf. Ser. Earth Environ. Sci. 2014, 18, 012061. [Google Scholar] [CrossRef]
- Lin, J.Y.; Shu, L.; Zou, H.; Zhang, B.S. Experimental measurement and assessment of ice conditions with a fixed-wing unmanned aerial vehicle over Yellow River, China. J. Appl. Remote Sens. 2012, 6, 063586. [Google Scholar] [CrossRef]
- Lewis, Q.W.; Lindroth, E.M.; Rhoads, B.L. Integrating unmanned aerial systems and LSPIV for rapid, cost-effective stream gauging. J. Hydrol. 2018, 560, 230–246. [Google Scholar] [CrossRef]
- Watts, A.C.; Ambrosia, V.G.; Hinkley, E.A. Unmanned aircraft systems in remote sensing and scientific research: Classification and considerations of use. Remote Sens. 2012, 4, 1671–1692. [Google Scholar] [CrossRef] [Green Version]
- Manfreda, S.; McCabe, M.F.; Miller, P.E.; Lucas, R.; Pajuelo Madrigal, V.; Mallinis, G.; Ben Dor, E.; Helman, D.; Estes, L.; Ciraolo, G.; et al. On the use of unmanned aerial systems for environmental monitoring. Remote Sens. 2018, 10, 641. [Google Scholar] [CrossRef] [Green Version]
- Matese, A.; Toscano, P.; Di Gennaro, S.F.; Genesio, L.; Vaccari, F.P.; Primicerio, J.; Belli, C.; Zaldei, A.; Bianconi, R.; Gioli, B. Intercomparison of UAV, Aircraft and Satellite Remote Sensing Platforms for Precision Viticulture. Remote Sens. 2015, 7, 2971–2990. [Google Scholar] [CrossRef] [Green Version]
- Dustin, M.C. Monitoring Parks with Inexpensive UAVs: Cost Benefits Analysis for Monitoring and Maintaining Parks Facilities. Ph.D. Thesis, University of Southern California, Los Angeles, CA, USA, August 2015. [Google Scholar]
- Jeziorska, J. UAS for Wetland Mapping and Hydrological Modeling. Remote Sens. 2019, 11, 1997. [Google Scholar] [CrossRef] [Green Version]
- Moorhead, R.; Hood, R.; Coffey, J. Optimal Unmanned Aircraft Systems River Observing Strategy Workshop Summary Report; National Oceanographic and Atmospheric Administration: Boulder, CO, USA, February 2012; pp. 21–23.
- Zarzar, C.; Moorhead, R.; Coffey, J. NOAA Unmanned Aircraft Systems (UAS). In Proceedings of the Program 2nd UAS Arctic and River Forecast Workshop Summary Report, Anchorage, AK, USA, 15 September 2014. [Google Scholar]
- Blain, C.A.; Cambazoglu, M.K.; Smythe, E.D.; van Cooten, S.; Brunet, D.P.; Roberts, A.; Moorhead, R.J., II; Dresback, K.M.; Kolar, R.L. Collaborative Development of a Forecast Capability for Water Levels in the Lower Pearl River Basin, LA/MS. In Proceedings of the 14th Symposium on the Coastal Environment, 96th AMS Annual Meeting, New Orleans, LA, USA, 11 January 2016. [Google Scholar]
- Van Cooten, S.; Moorhead, R. The use of unmanned aerial system imagery in the 2018–2019 Mississippi River flood event to enhanced NWS flood forecasting and decision support services. In Proceedings of the 100th American Meteorological Society Annual Meeting, 34th Conference on Hydrology, Boston, MA, USA, 12–16 January 2020. [Google Scholar]
- Harwin, S.; Lucieer, A. Assessing the accuracy of georeferenced point clouds produced via multi-view stereopsis from unmanned aerial vehicle (UAV) imagery. Remote Sens. 2012, 4, 1573–1599. [Google Scholar] [CrossRef] [Green Version]
- Shahbazi, M.; Sohn, G.; Théau, J.; Menard, P. Development and evaluation of a UAV-photogrammetry system for precise 3D environmental modeling. Sensors 2015, 15, 27493–27524. [Google Scholar] [CrossRef] [Green Version]
Figure 1.
The Griffon Outlaw G2E fixed-wing Unmanned Aerial Vehicle (UAV) used in the study.

Figure 2.
The areal extent of the Certificate of Authorization (CoA) for the data collection missions. The yellow pins indicate the positions of United States Geological Survey (USGS) river gauges, while the Greenwood-Leflore Airport is indicated by the aircraft icon east of Greenwood (near the center of the figure).

Figure 3.
Extent of Unmanned Aerial Systems (UAS) imagery during the SHOUT4Rivers Phase 2 flights over Greenwood, MS.
Figure 3.
Extent of Unmanned Aerial Systems (UAS) imagery during the SHOUT4Rivers Phase 2 flights over Greenwood, MS.

Figure 4.
UAS-collected Red-Green-Blue (RGB) imagery showing (a) low flow conditions on Jan. 16, 2019 and (b) flood conditions on Feb. 24, 2019 over an agricultural area south of Greenwood, MS. Blue lines denote water flowlines defined by the National Hydrography Dataset.
Figure 4.
UAS-collected Red-Green-Blue (RGB) imagery showing (a) low flow conditions on Jan. 16, 2019 and (b) flood conditions on Feb. 24, 2019 over an agricultural area south of Greenwood, MS. Blue lines denote water flowlines defined by the National Hydrography Dataset.

Figure 5.
UAS-collected RGB imagery showing flood conditions from Feb. 25, 2019 flight (a) over an agricultural area northwest of Greenwood, MS along the Tallahatchie River and (b) along the Yalobusha River near Whaley, MS (north of Greenwood, MS). Blue lines denote water flowlines defined by the National Hydrography Dataset.

Figure 6.
Inundated area based on a land-water mask generated from the Feb. 25, 2019 flight.

Figure 7.
UAS-collected RGB imagery showing flood conditions from Feb. 25, 2019 flight (a) near a dam along Hwy. 82 west of Greenwood, MS, and (b) the confluence of the Yalobusha and Little Tallahatchie Rivers (which marks the beginning of the Tallahatchie River). Blue lines denote water flowlines defined by the National Hydrography Dataset.

Figure 8.
UAS-collected RGB imagery showing flood conditions from (a) Feb. 24, 2019 flight near Greenwood-Leflore Airport and (b) Feb. 25, 2019 over an agricultural area south of Greenwood, MS. Blue lines denote water flowlines defined by the National Hydrography Dataset.
Figure 8.
UAS-collected RGB imagery showing flood conditions from (a) Feb. 24, 2019 flight near Greenwood-Leflore Airport and (b) Feb. 25, 2019 over an agricultural area south of Greenwood, MS. Blue lines denote water flowlines defined by the National Hydrography Dataset.

Figure 9.
Topographic image from an agricultural area northeast of Greenwood, MS, based on (a) NED 30 m digital elevation model and (b) 16 cm digital surface model generated from data collected during the Feb. 25, 2019 mission. Blue lines denote water flowlines defined by the National Hydrography Dataset. Note that scales are the same for the two images.


Table 1.
National Weather Service (NWS) River Forecast Centers (RFC) requirements based on September 2014 meeting.
Table 1.
National Weather Service (NWS) River Forecast Centers (RFC) requirements based on September 2014 meeting.
| Priority | Requirement | Temporal Resolution | Horizontal Resolution | Vertical Resolution |
|---|---|---|---|---|
| 1 | Improved river elevation data (i.e., digital elevation models (DEMs)) | Months–years | 1–10 m | 5–50 cm |
| 2 | Rapid response during and after a catastrophic flooding event to track changes in river channel structure and morphology and debris | Hours–days | 10 cm–1 m | 5 cm |
| 3 | Observations of total water level (tide, surge, storage, etc.) | Hourly during event | 1 m | 5 cm |
| 4 | Detailed information on levee breaches and inundation in near real time (location, width, depth) | Real-time | 1m | 10cm |
| 5 | Rapid response imagery to document extent of inundation to verify flash flooding and flood inundation maps and enable production of flood maps for more locations | Hours–days | 20 cm | 5 cm (for DEMs) |
Table 2.
Details on processing time required for the UAV imagery for the four flights. The settings within the Agisoft software used for processing include “high” accuracy for camera alignment/sparse cloud generation, with a key point/tie point limit of 40,000/4000, respectively. The dense cloud was generated using the “low” quality setting with “aggressive” point filtering.
| Jan. 16 | Feb. 24 | Feb. 25 (Flight 1) | Feb. 25 (Flight 2) | |
|---|---|---|---|---|
| Images used | ~5400 | ~7650 | ~5260 | ~5050 |
| Image matching | 6 h 30 m | 13 h 46 m | 6 h 34 m | 8 h 6 m |
| Image alignment | 3 h 9 m | 13 h 53 m | 4 h 29 m | 8 h 7 m |
| Depth map generation | 1 h 30 m | 8 h 4 m | 11 h 34 m | 2 h 11 m |
| Dense cloud generation | 0 h 51 m | 2 h 7 m | 1 h 47 m | 1 h 9 m |
| DEM generation | 0 h 3 m | 0 h 6 m | 0 h 21 m | 0 h 7 m |
| Orthomosaic | 3 h 6 m | 2 h 37 m | 2 h 43 m | 4 h 3 m |
| Total | 15 h 9 m | 40 h 33 m | 27 h 28 m | 23 h 43 m |
© 2020 by the authors. Licensee MDPI, Basel, Switzerland. This article is an open access article distributed under the terms and conditions of the Creative Commons Attribution (CC BY) license (http://creativecommons.org/licenses/by/4.0/).
Share and Cite
MDPI and ACS Style
Dyer, J.L.; Moorhead, R.J.; Hathcock, L. Identification and Analysis of Microscale Hydrologic Flood Impacts Using Unmanned Aerial Systems. Remote Sens. 2020, 12, 1549. https://doi.org/10.3390/rs12101549
AMA Style
Dyer JL, Moorhead RJ, Hathcock L. Identification and Analysis of Microscale Hydrologic Flood Impacts Using Unmanned Aerial Systems. Remote Sensing. 2020; 12(10):1549. https://doi.org/10.3390/rs12101549
Chicago/Turabian StyleDyer, Jamie L., Robert J. Moorhead, and Lee Hathcock. 2020. "Identification and Analysis of Microscale Hydrologic Flood Impacts Using Unmanned Aerial Systems" Remote Sensing 12, no. 10: 1549. https://doi.org/10.3390/rs12101549
Note that from the first issue of 2016, this journal uses article numbers instead of page numbers. See further details here.