Revealing the Fingerprint of Climate Change in Interannual NDVI Variability among Biomes in Inner Mongolia, China

 ,
,
Abstract
:
1. Introduction
2. Data and Methods
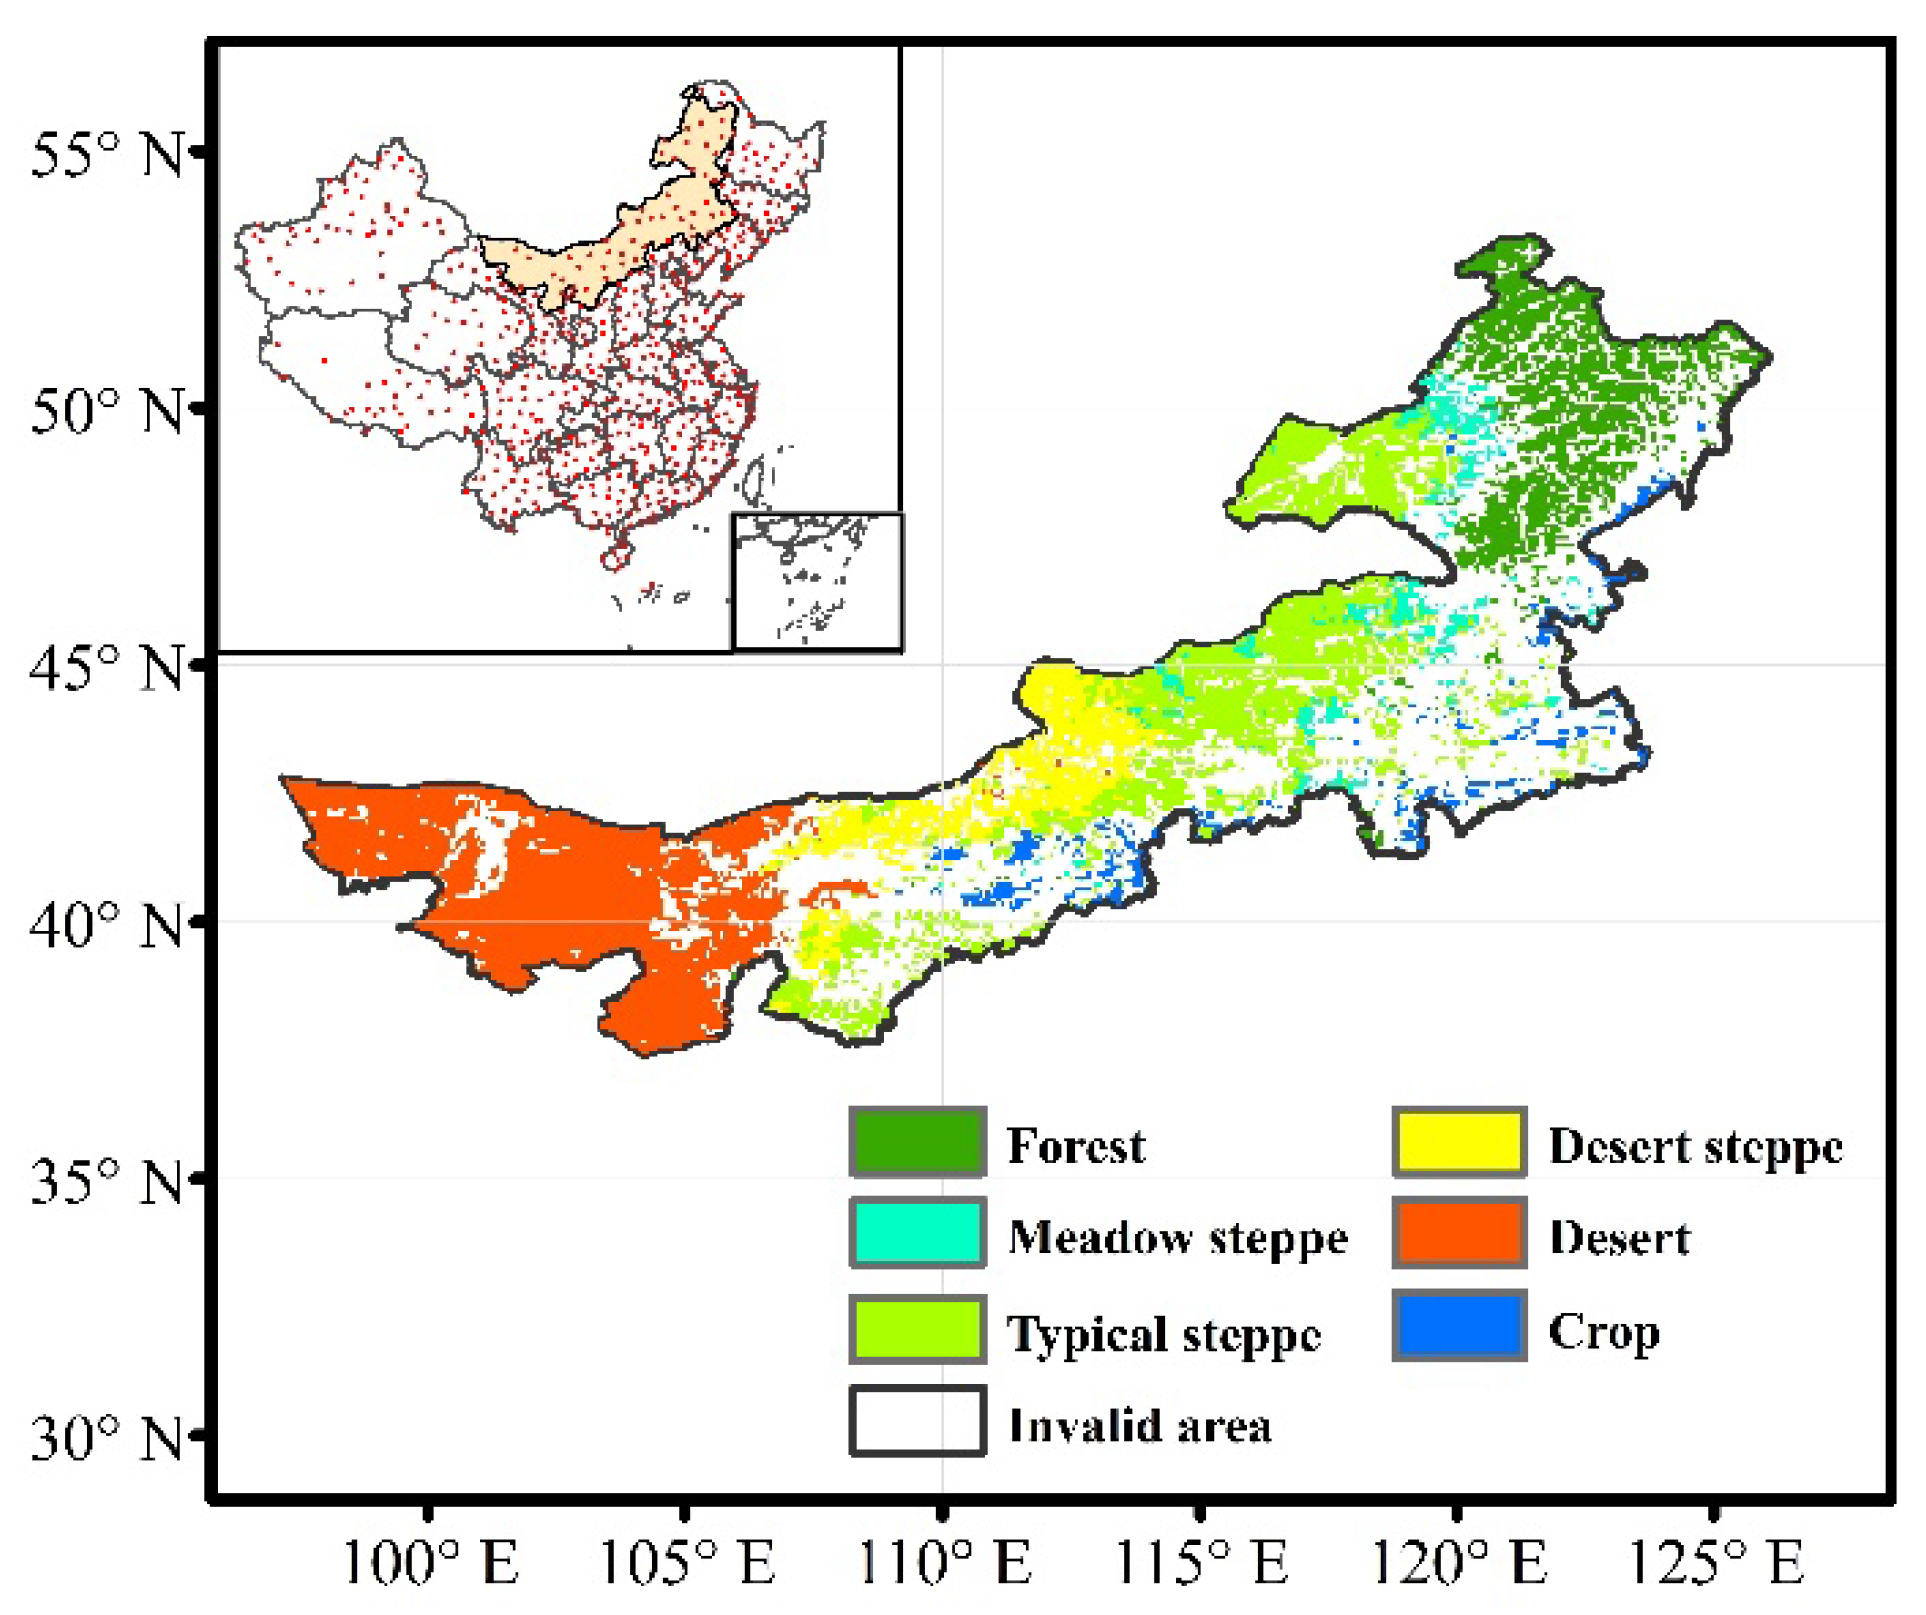
2.1. Study Area
2.2. Dataset
2.3. Methods
3. Results
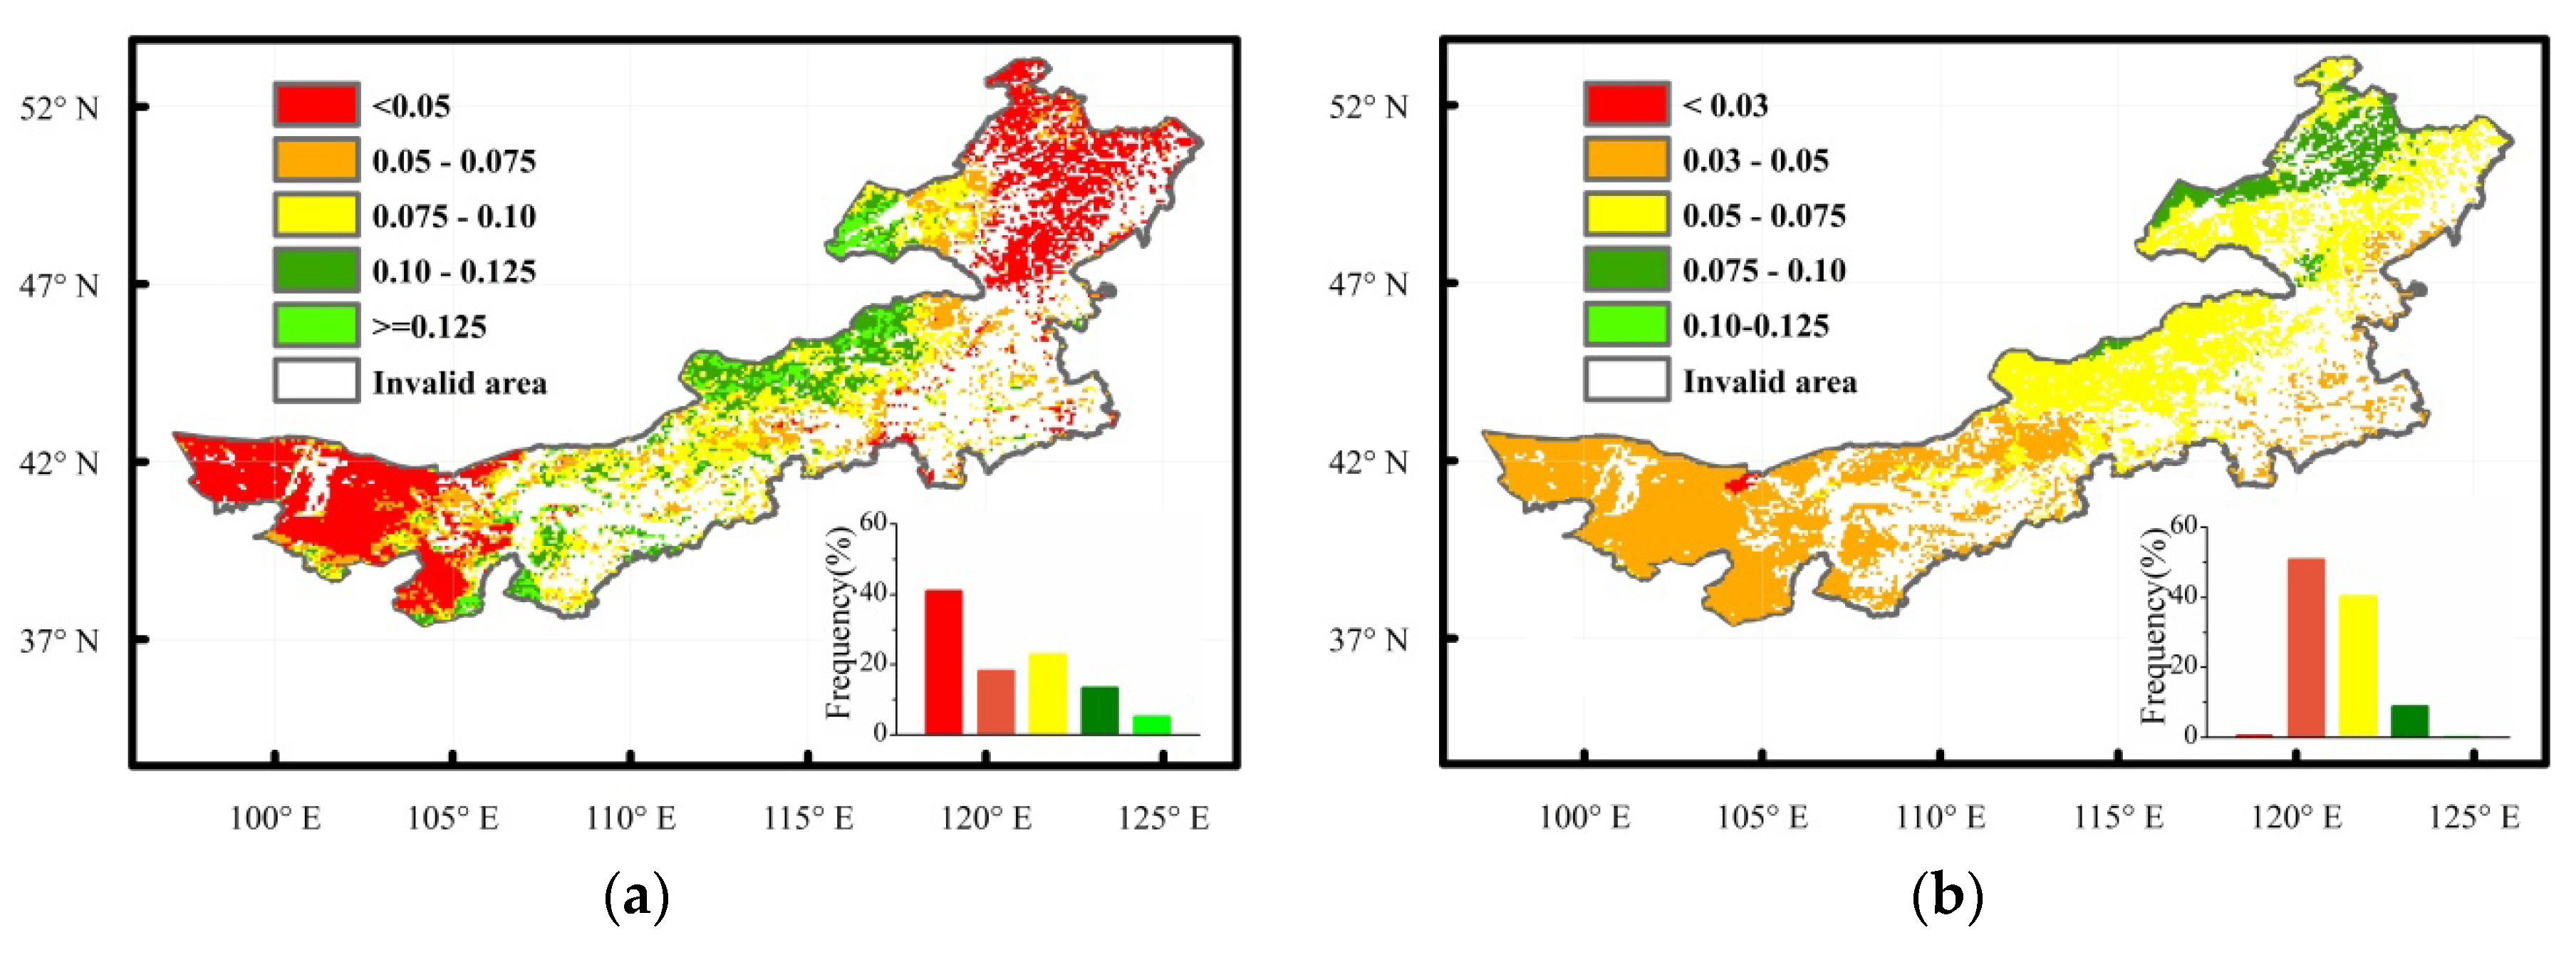
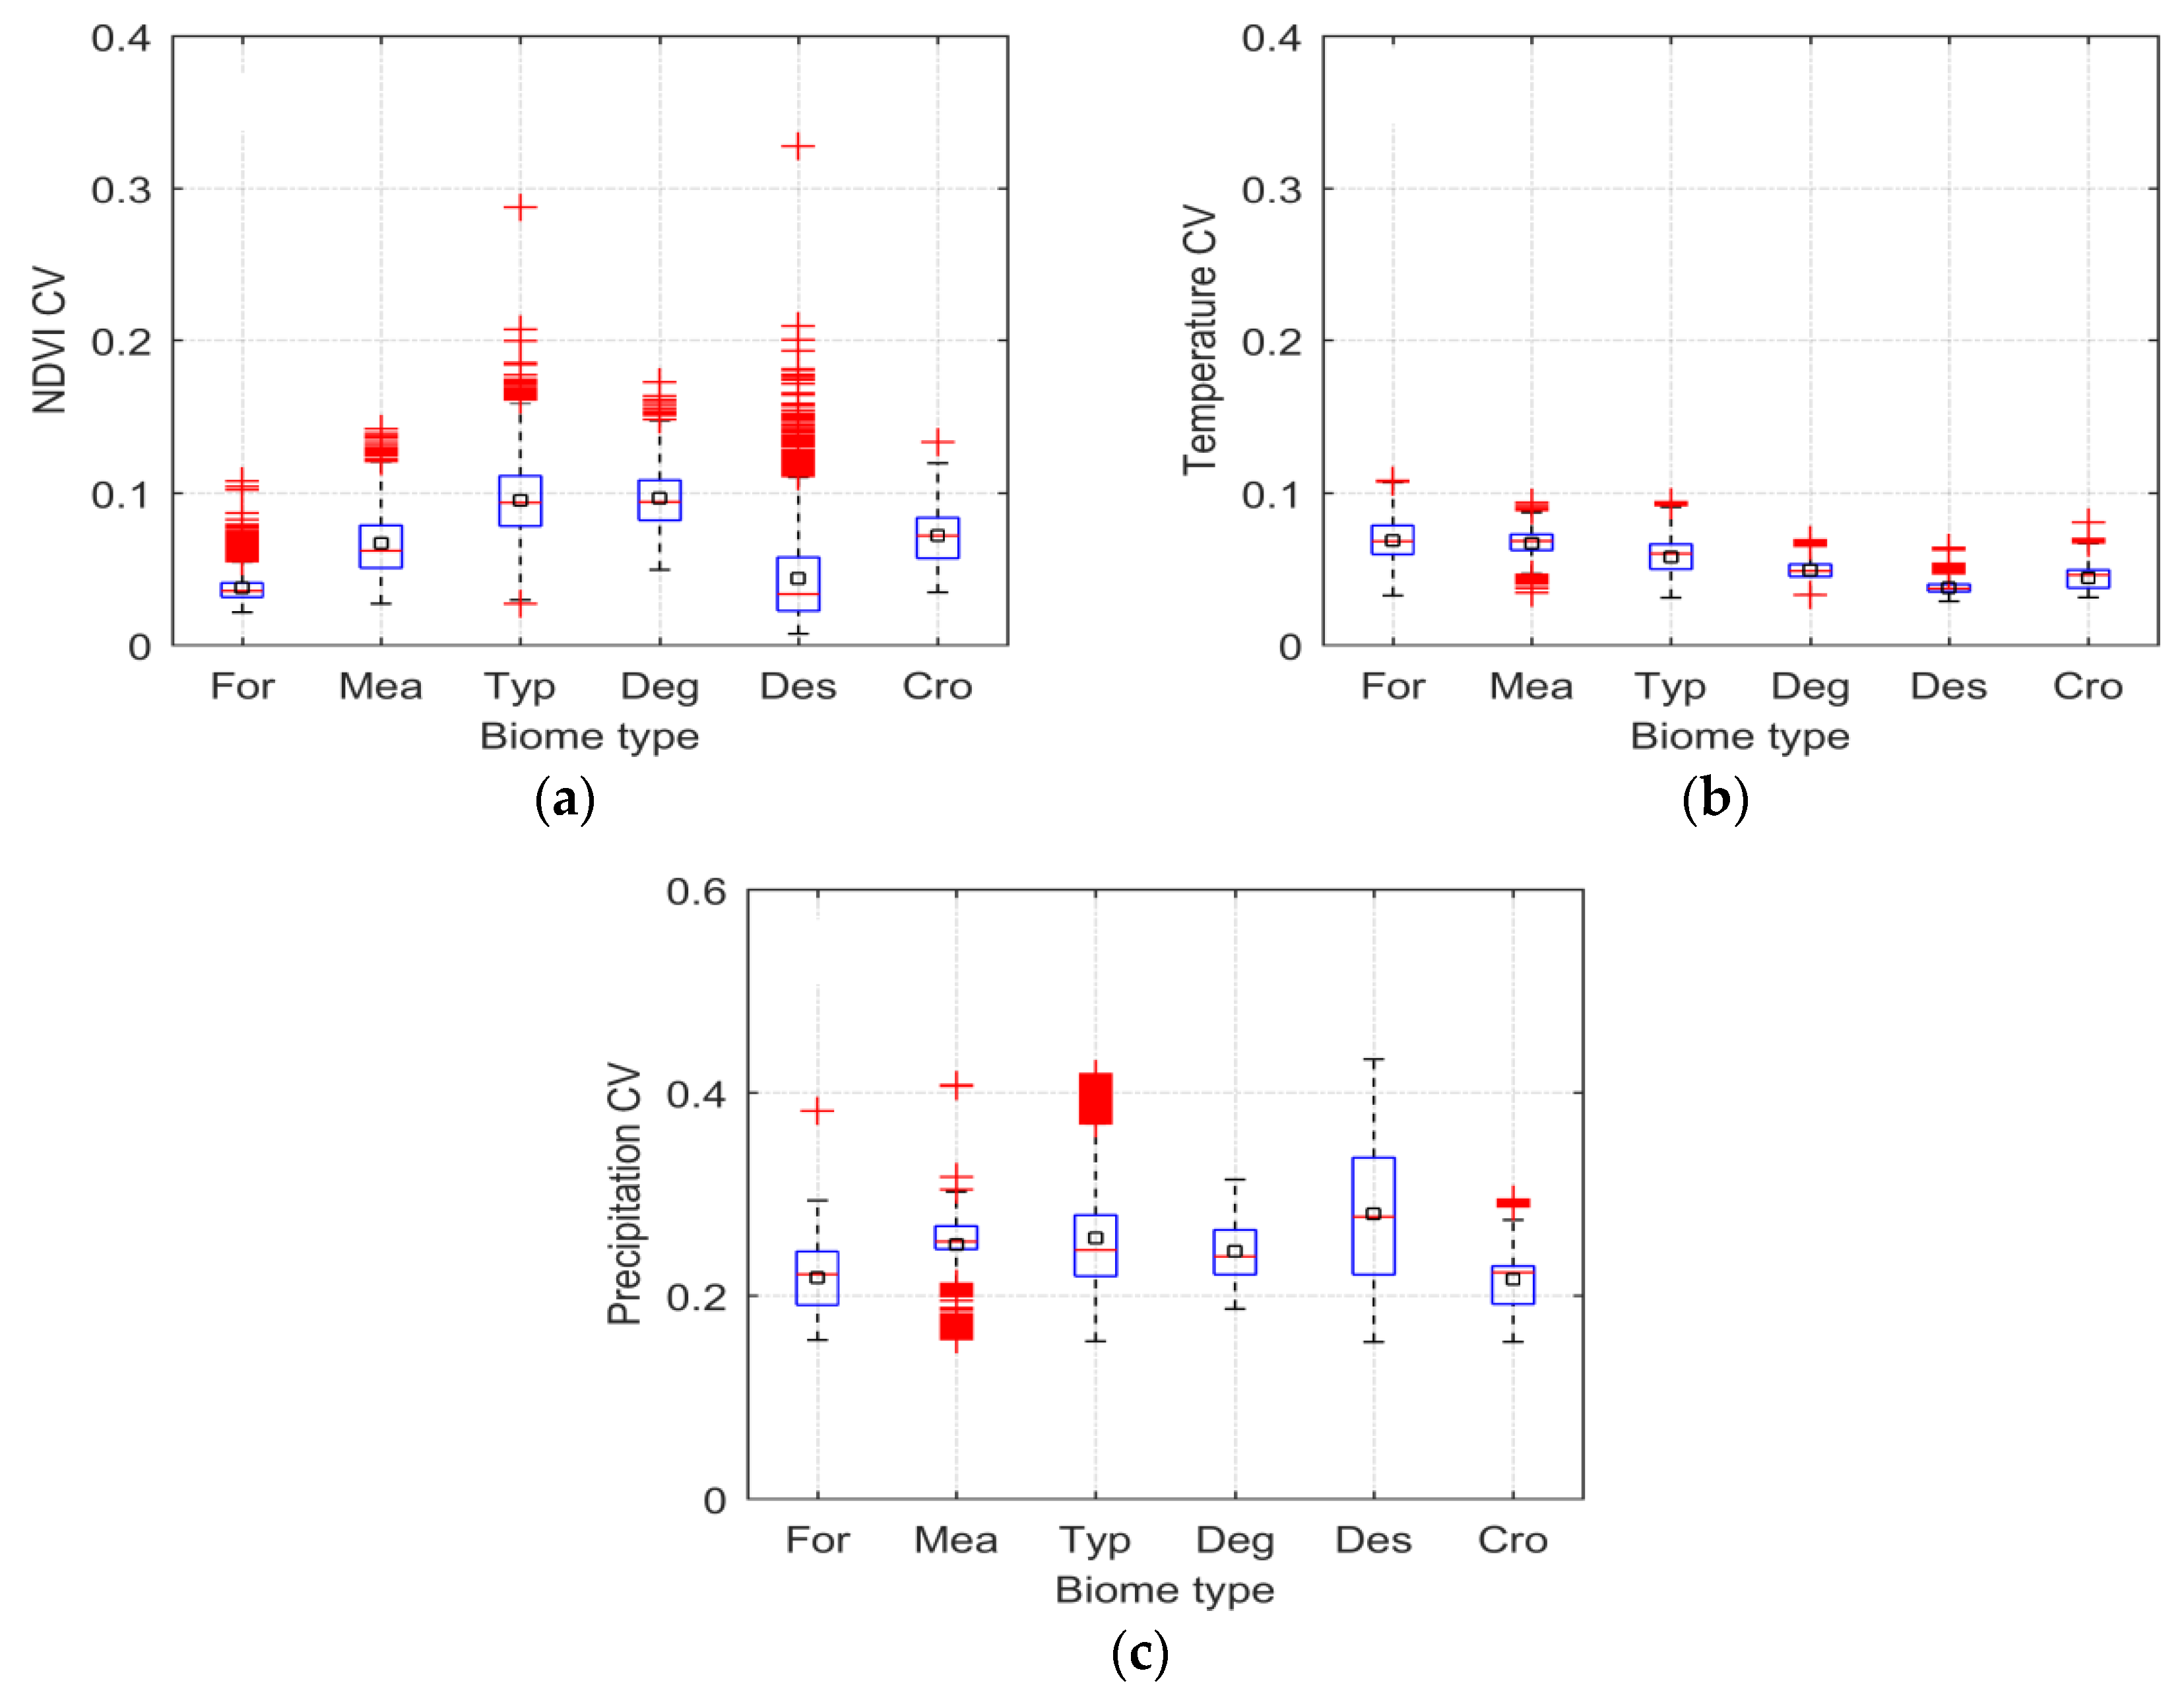
3.1. Spatial Patterns of NDVI Variability for Biomes
3.1.1. Patterns in the Growing Season
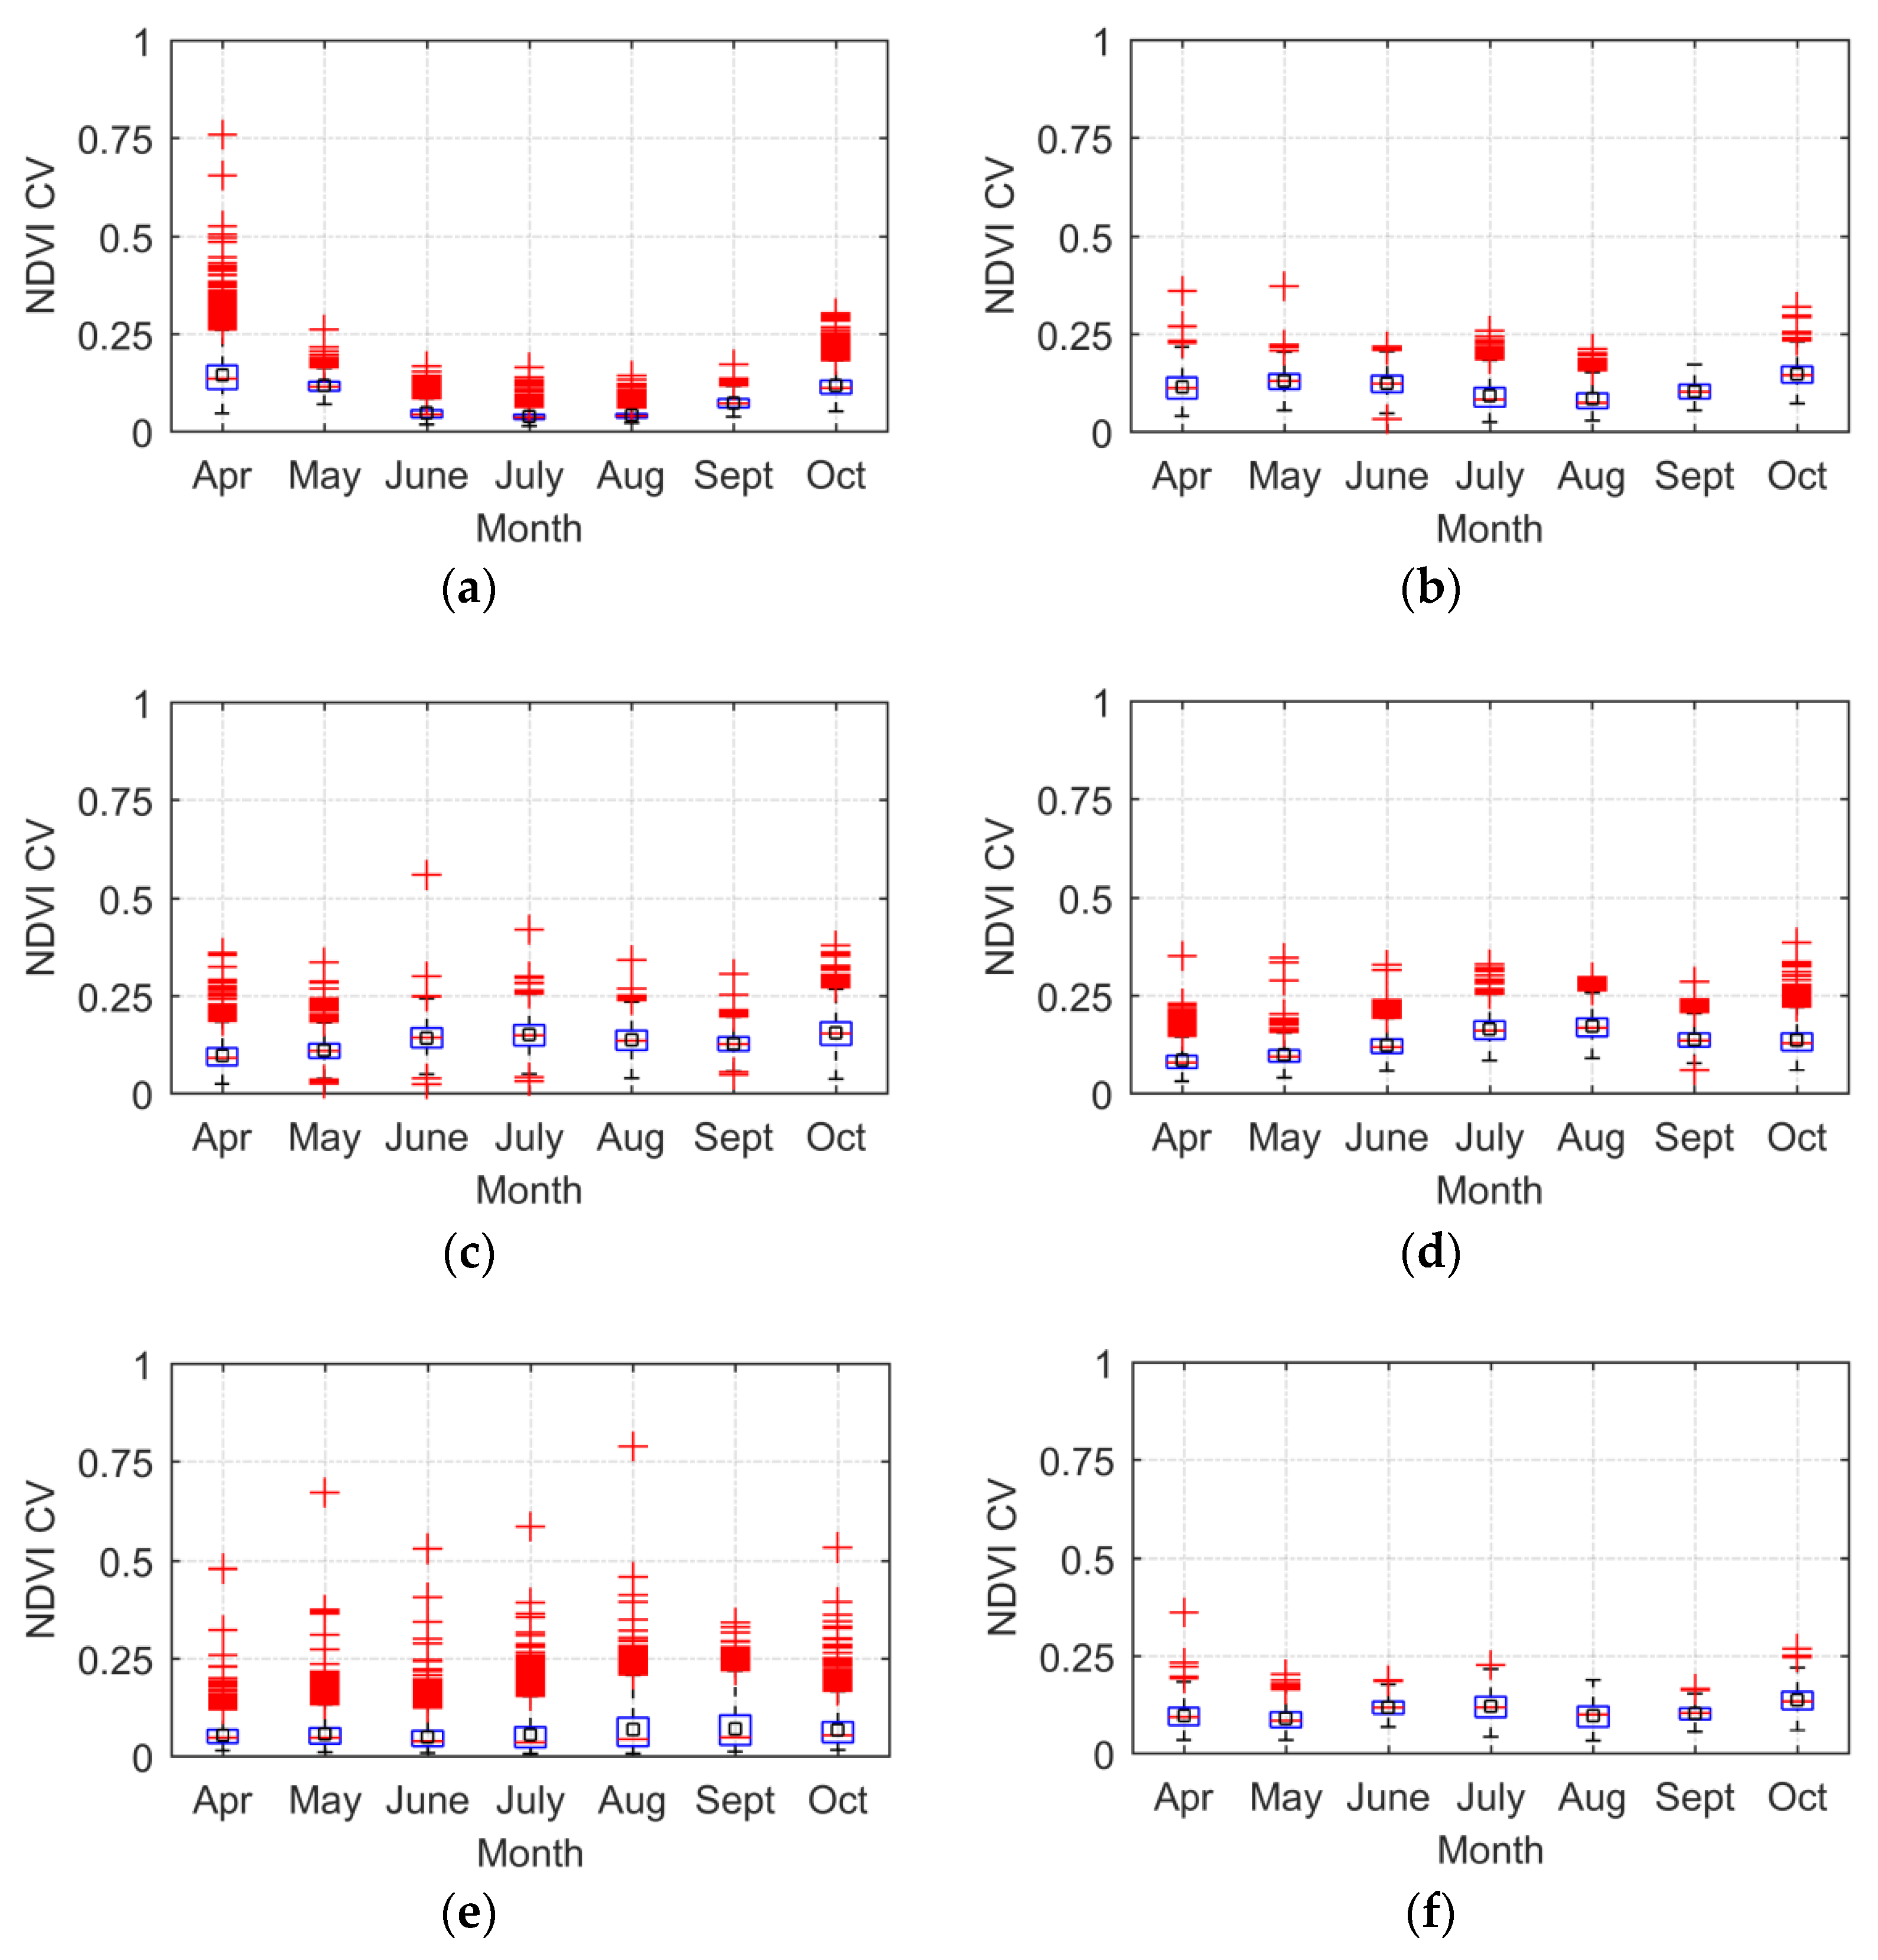
3.1.2. Variability by Month
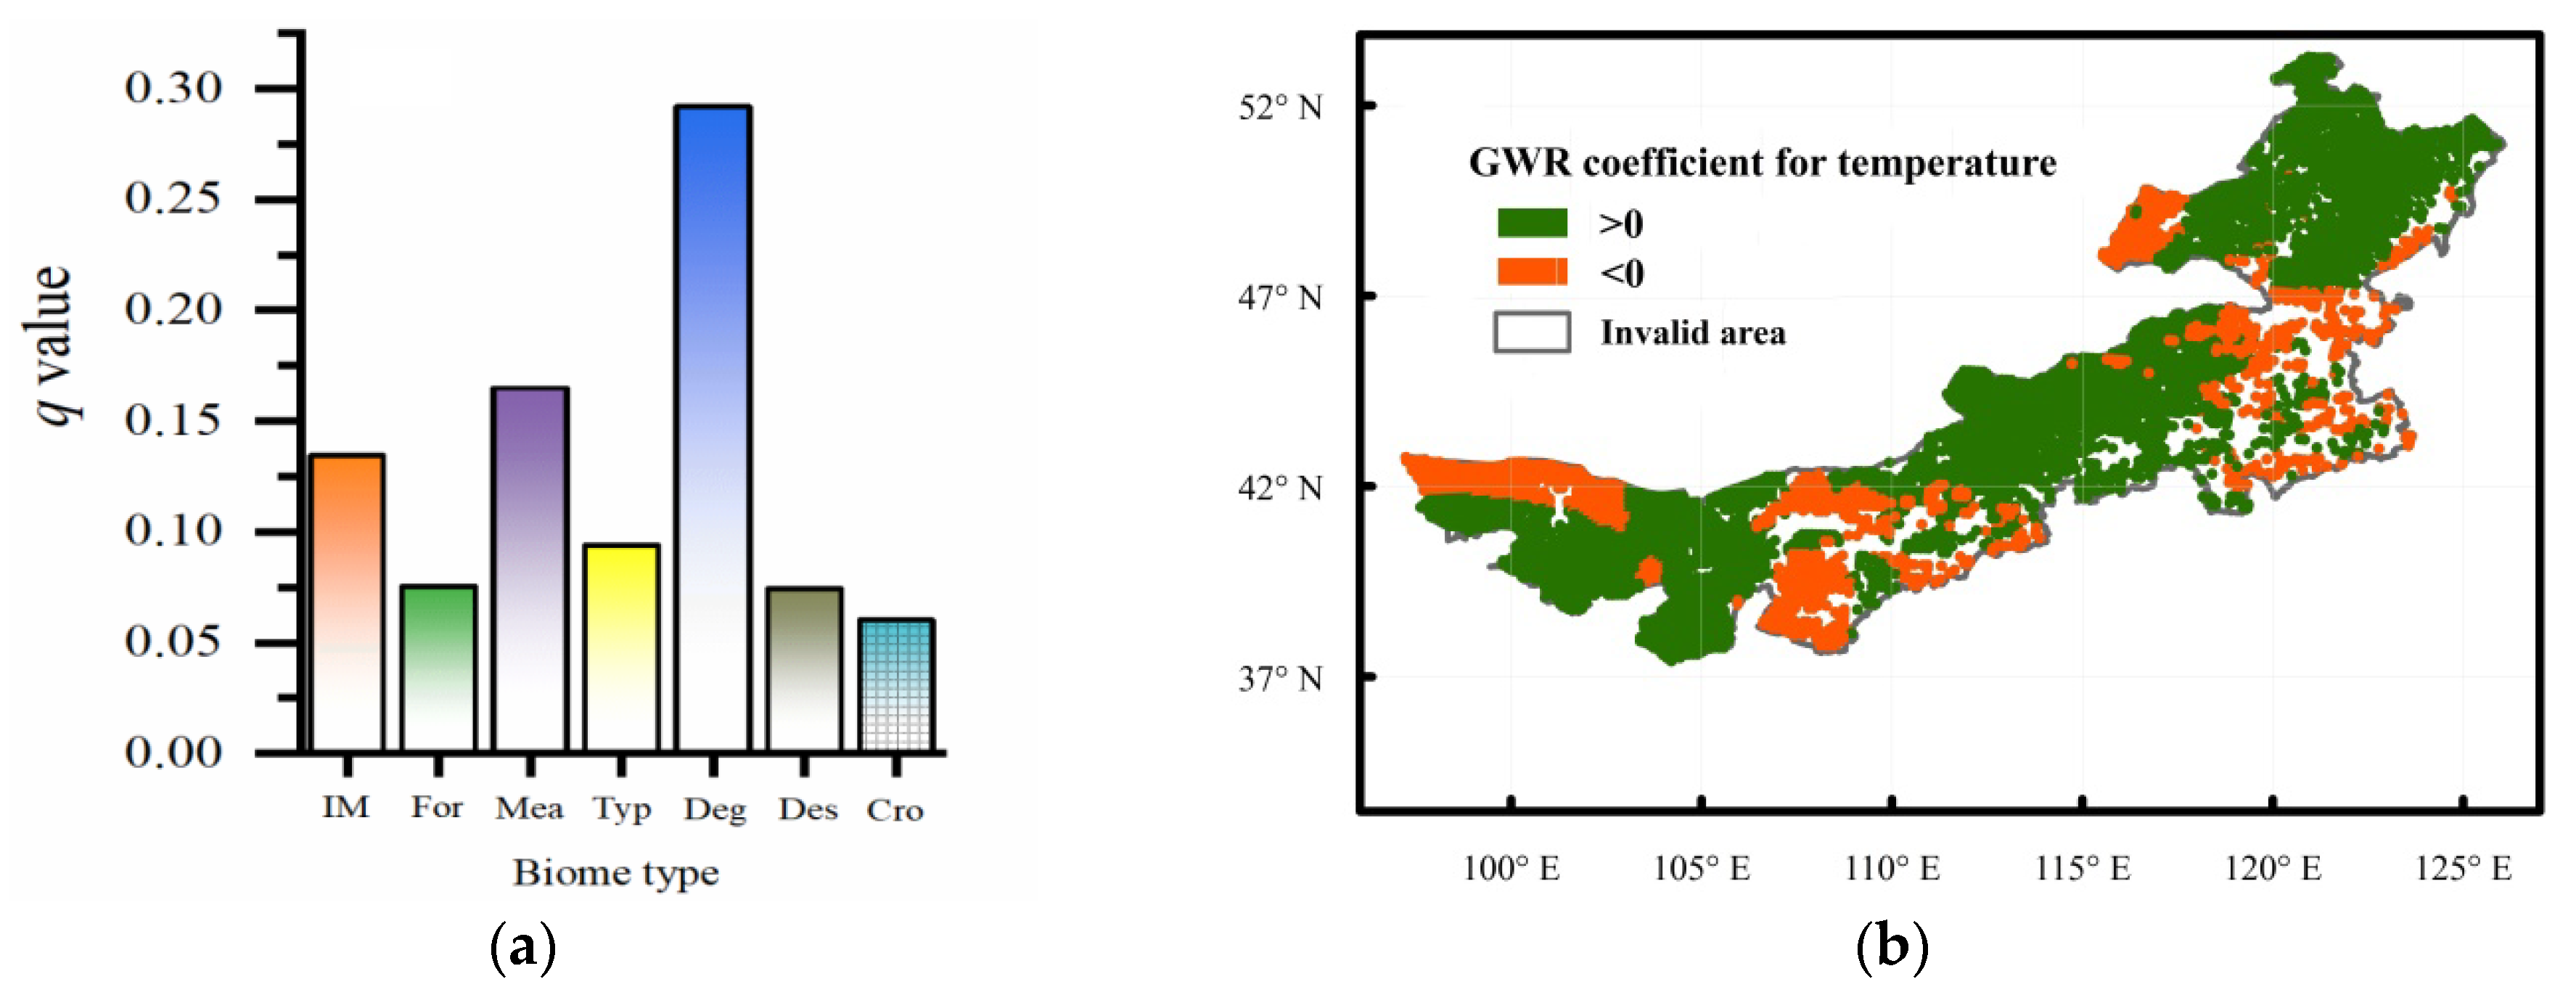
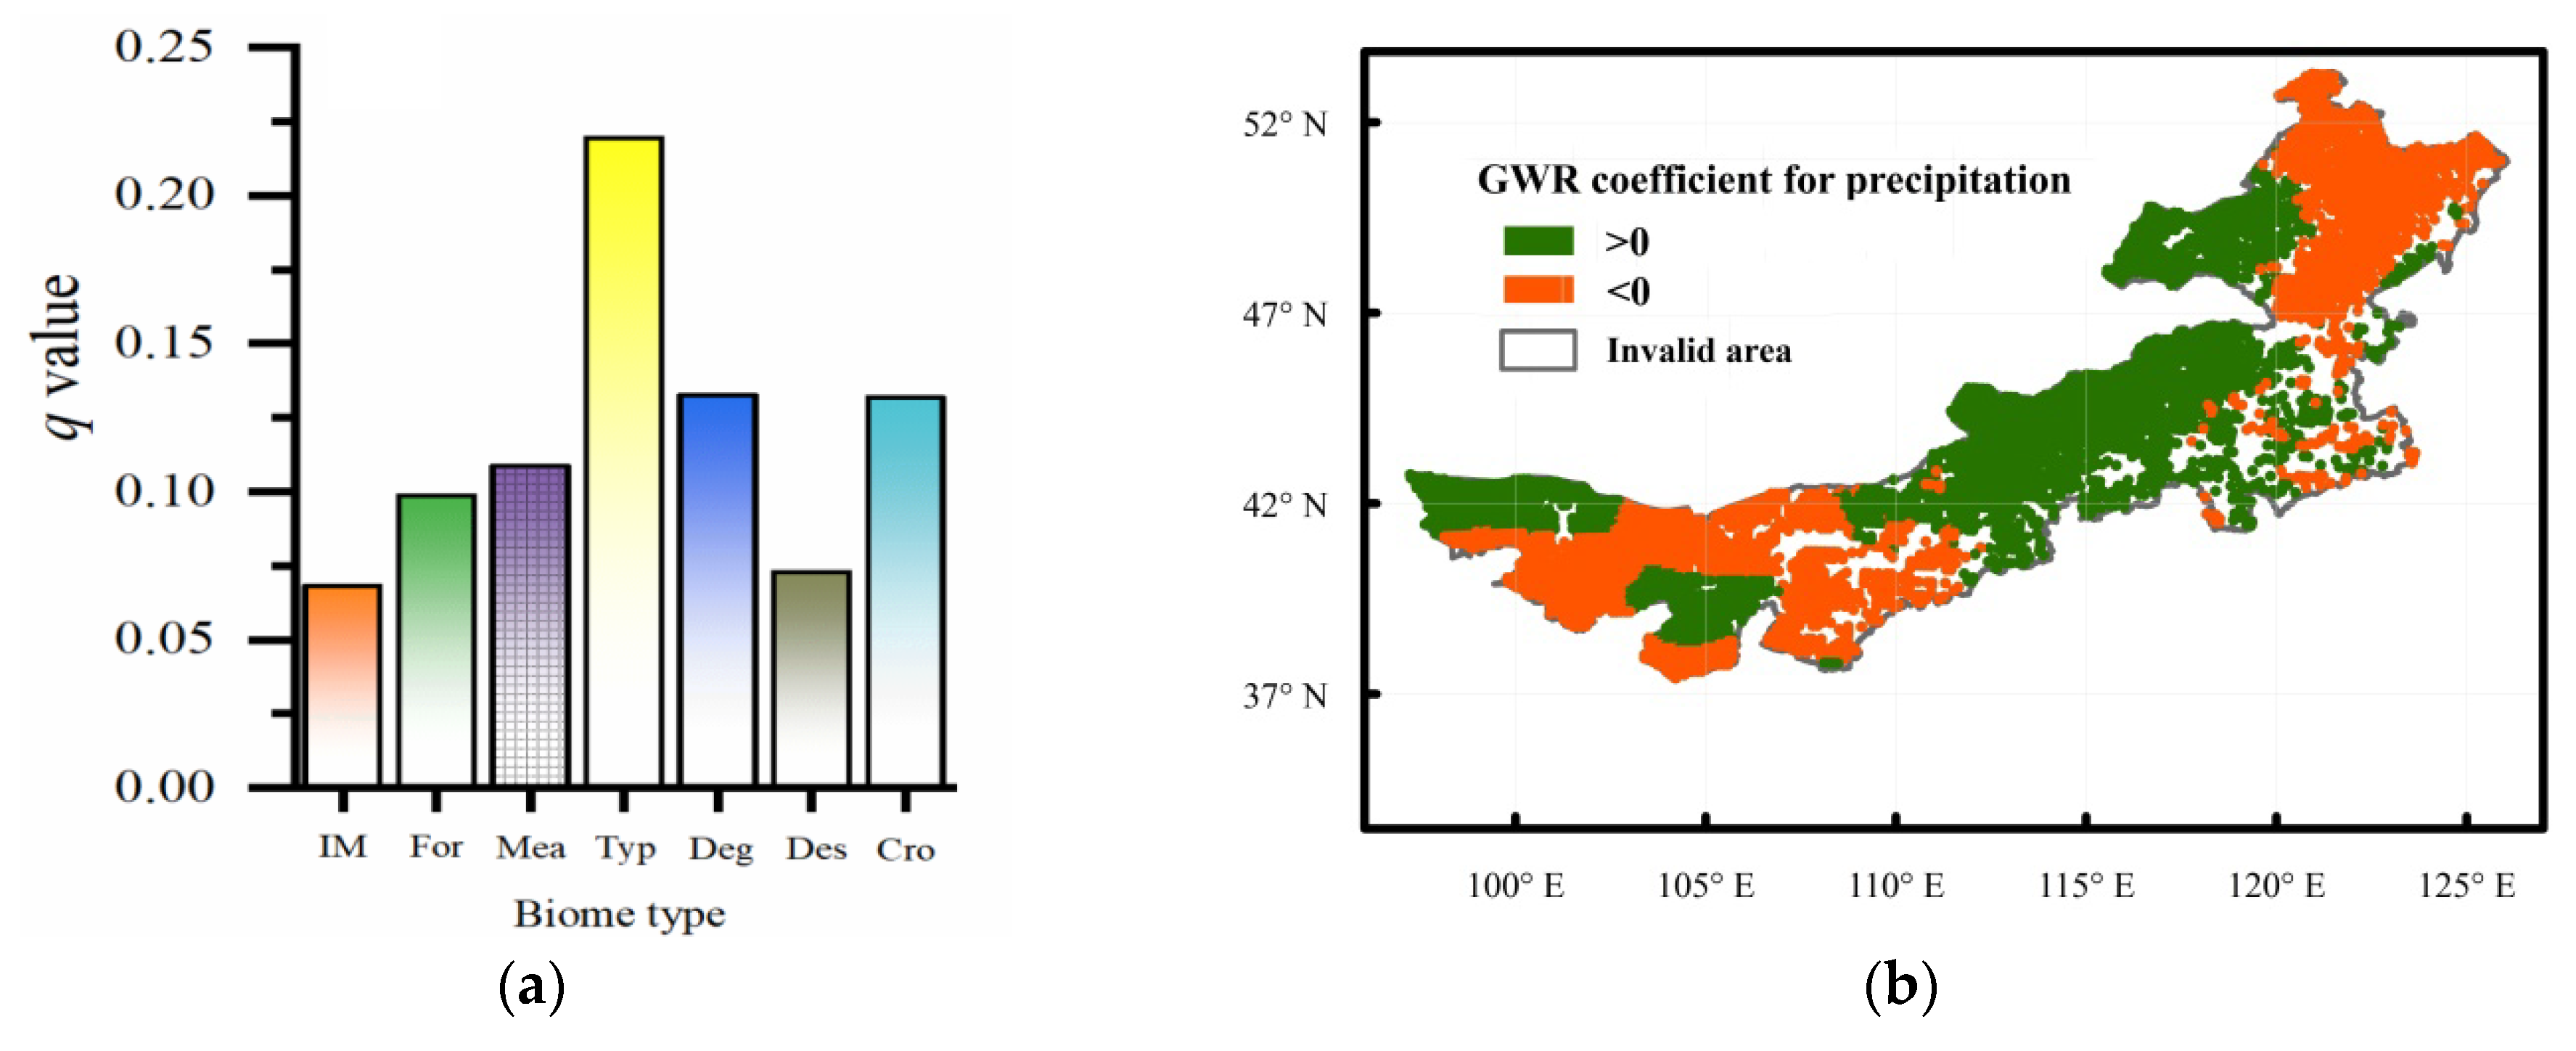
3.2. Spatial Relationships between the NDVI Variability and Those of Temperature and Precipitation
3.2.1. Correlation in the Growing Season
3.2.2. Relationship by Month
3.3. Lagged Effect of Climate Change
4. Discussion
4.1. Variability Patterns of NDVI for Vegetation Biomes
4.2. Correlations between NDVI Variability and Climate Change
4.3. Uncertainties
5. Conclusions
Author Contributions
Funding
Acknowledgments
Conflicts of Interest
References
- Lemordant, L.; Gentine, P.; Swann, A.S.; Cook, B.I.; Scheff, J. Critical impact of vegetation physiology on the continental hydrologic cycle in response to increasing CO2. Proc. Natl. Acad. Sci. USA 2018, 115, 4093–4098. [Google Scholar] [CrossRef] [Green Version]
- Yuan, W.; Piao, S.; Qin, D.; Dong, W.; Xia, J.; Lin, H.; Chen, M. Influence of Vegetation Growth on the Enhanced Seasonality of Atmospheric CO2. Glob. Biogeochem. Cycles 2018, 32, 32–41. [Google Scholar] [CrossRef]
- Gao, J.; Jiao, K.; Wu, S.; Ma, D.; Zhao, D.; Yin, Y.; Dai, E. Past and future effects of climate change on spatially heterogeneous vegetation activity in China. Earth’s Future 2017, 5, 679–692. [Google Scholar] [CrossRef] [Green Version]
- Ding, Y.; Xu, J.; Wang, X.; Peng, X.; Cai, H. Spatial and temporal effects of drought on Chinese vegetation under different coverage levels. Sci. Total Environ. 2020, 716, 137166. [Google Scholar] [CrossRef] [PubMed]
- Zscheischler, J.; Michalak, A.M.; Schwalm, C.; Mahecha, M.D.; Huntzinger, D.N.; Reichstein, M.; Berthier, G.; Ciais, P.; Cook, R.B.; El-Masri, B. Impact of large-scale climate extremes on biospheric carbon fluxes: An intercomparison based on MsTMIP data. Glob. Biogeochem. Cycles 2014, 28, 585–600. [Google Scholar] [CrossRef]
- Knapp, A.K.; Smith, M.D. Variation among biomes in temporal dynamics of aboveground primary production. Science 2001, 291, 481–484. [Google Scholar] [CrossRef] [PubMed] [Green Version]
- Lu, Q.; Zhao, D.; Wu, S.; Dai, E.; Gao, J. Using the NDVI to analyze trends and stability of grassland vegetation cover in Inner Mongolia. Theor. Appl. Climatol. 2019, 135, 1629–1640. [Google Scholar] [CrossRef]
- Ju, J.; Masek, J.G. The vegetation greenness trend in Canada and US Alaska from 1984–2012 Landsat data. Remote Sens. Environ. 2016, 176, 1–16. [Google Scholar] [CrossRef]
- Zhao, L.; Dai, A.; Dong, B. Changes in global vegetation activity and its driving factors during 1982–2013. Agric. For. Meteorol. 2018, 249, 198–209. [Google Scholar] [CrossRef]
- Guo, M.; Li, J.; He, H.; Xu, J.; Jin, Y. Detecting global vegetation changes using mann-kendal (MK) trend test for 1982–2015 time period. Chin. Geogr. Sci. 2018, 28, 907–919. [Google Scholar] [CrossRef] [Green Version]
- Meng, M.; Huang, N.; Wu, M.; Pei, J.; Wang, J.; Niu, Z. Vegetation change in response to climate factors and human activities on the Mongolian Plateau. PeerJ 2019, 7, e7735. [Google Scholar] [CrossRef] [PubMed]
- Fang, J.; Piao, S.; Tang, Z.; Peng, C.; Ji, W. Interannual variability in net primary production and precipitation. Science 2001, 293, 1723. [Google Scholar] [CrossRef] [PubMed] [Green Version]
- De Keersmaecker, W.; Lhermitte, S.; Honnay, O.; Farifteh, J.; Somers, B.; Coppin, P. How to measure ecosystem stability? An evaluation of the reliability of stability metrics based on remote sensing time series across the major global ecosystems. Glob. Chang. Biol. 2014, 20, 2149–2161. [Google Scholar] [CrossRef] [PubMed]
- Ray, D.K.; Gerber, J.S.; MacDonald, G.K.; West, P.C. Climate variation explains a third of global crop yield variability. Nat. Commun. 2015, 6, 5989. [Google Scholar] [CrossRef] [PubMed] [Green Version]
- Sloat, L.L.; Gerber, J.S.; Samberg, L.H.; Smith, W.K.; Herrero, M.; Ferreira, L.G.; Godde, C.M.; West, P.C. Increasing importance of precipitation variability on global livestock grazing lands. Nat. Clim. Chang. 2018, 8, 214–218. [Google Scholar] [CrossRef]
- Kawabata, A.; Ichii, K.; Yamaguchi, Y. Global monitoring of interannual changes in vegetation activities using NDVI and its relationships to temperature and precipitation. Int. J. Remote Sens. 2001, 22, 1377–1382. [Google Scholar] [CrossRef]
- Lauenroth, W.; Sala, O.E. Long-term forage production of North American shortgrass steppe. Ecol. Appl. 1992, 2, 397–403. [Google Scholar] [CrossRef] [Green Version]
- Wu, C.; Wang, L.; Niu, Z.; Gao, S.; Wu, M. Nondestructive estimation of canopy chlorophyll content using Hyperion and Landsat/TM images. Int. J. Remote Sens 2010, 31, 2159–2167. [Google Scholar] [CrossRef]
- Hou, W.; Gao, J.; Wu, S.; Dai, E. Interannual variations in growing-season NDVI and its correlation with climate variables in the southwestern karst region of China. Remote Sens. 2015, 7, 11105–11124. [Google Scholar] [CrossRef] [Green Version]
- Chu, H.; Venevsky, S.; Wu, C.; Wang, M. NDVI-based vegetation dynamics and its response to climate changes at Amur-Heilongjiang River Basin from 1982 to 2015. Sci. Total Environ. 2019, 650, 2051–2062. [Google Scholar] [CrossRef] [PubMed]
- Brogaard, S.; Runnström, M.; Seaquist, J.W. Primary production of Inner Mongolia, China, between 1982 and 1999 estimated by a satellite data-driven light use efficiency model. Glob. Planet. Chang. 2005, 45, 313–332. [Google Scholar] [CrossRef]
- Wu, S.; Yang, Q.; Zheng, D. Delineation of eco-geographic regional system of China. J. Geogr. Sci. 2003, 13, 309–315. [Google Scholar] [CrossRef]
- Holben, B.N. Characteristics of maximum-value composite images from temporal AVHRR data. Int. J. Remote Sens. 1986, 7, 1417–1434. [Google Scholar] [CrossRef]
- Wang, H.; Li, X.; Li, X.; Ying, G.; Fu, N. The variability of vegetation growing season in the northern China based on NOAA NDVI and MSAVI from 1982 to 1999. Acta Ecol. Sinica 2007, 27, 504–515. (In Chinese) [Google Scholar]
- Tong, S.; Zhang, J.; Bao, Y. Spatial and temporal variations of vegetation cover and the relationships with climate factors in Inner Mongolia based on GIMMS NDVI3g data. J. Arid Land 2017, 9, 394–407. [Google Scholar] [CrossRef] [Green Version]
- Department of animal husbandry and veterinary; General station of animal husbandry and veterinary of ministry of agriculture of China. Rangeland Resource of China 1996; China Science and Technology Press: Beijing, China, 1996. (In Chinese) [Google Scholar]
- Jiao, K.; Gao, J.; Wu, S. Climatic determinants impacting the distribution of greenness in China: Regional differentiation and spatial variability. Int. J. Biometeorol. 2019, 63, 523–533. [Google Scholar] [CrossRef]
- Bai, Y.; Han, X.; Wu, J.; Chen, Z.; Li, L. Ecosystem stability and compensatory effects in the Inner Mongolia grassland. Nature 2004, 431, 181–184. [Google Scholar] [CrossRef]
- Su, F.; Wei, Y.; Wang, F.; Guo, J.; Zhang, J.; Wang, Y.; Guo, H.; Hu, S. Sensitivity of plant species to warming and altered precipitation dominates the community productivity in a semiarid grassland on the Loess Plateau. Ecol. Evol. 2019, 9, 7628–7638. [Google Scholar] [CrossRef]
- Wardle, D.A.; Bonner, K.I.; Barker, G.M. Stability of ecosystem properties in response to above-ground functional group richness and composition. Oikos 2000, 89, 11–23. [Google Scholar] [CrossRef]
- Mcnaughton, S.J. Diversity and stability of ecological communities: A comment on the role of empiricism in ecology. Am. Nat. 1977, 111, 515–525. [Google Scholar] [CrossRef] [Green Version]
- Brown, B.L.; Downing, A.L.; Leibold, M.A. Compensatory dynamics stabilize aggregate community properties in response to multiple types of perturbations. Ecology 2016, 97, 2021–2033. [Google Scholar] [CrossRef] [PubMed]
- Paruelo, J.M.; Lauenroth, W.K. Interannual variability of NDVI and its relationship to climate for North American shrublands and grasslands. J. Biogeogr. 1998, 25, 721–733. [Google Scholar] [CrossRef]
- Harte, J.; Shaw, R. Shifting Dominance Within a Montane Vegetation Community: Results of a Climate-Warming Experiment. Science 1995, 267, 876–880. [Google Scholar] [CrossRef] [PubMed]
- Braswell, B.H.; Schimel, D.S.; Linder, E.; Moore III, B. The response of global terrestrial ecosystems to interannual temperature variability. Science 1997, 278, 870–873. [Google Scholar] [CrossRef]
- Mao, D.; Wang, Z.; Luo, L.; Ren, C. Integrating AVHRR and MODIS data to monitor NDVI changes and their relationships with climatic parameters in Northeast China. Int. J. Appl. Earth Obs. Geoinf. 2012, 18, 528–536. [Google Scholar] [CrossRef]
- Piao, S.; Fang, J.; Zhou, L.; Guo, Q.; Henderson, M.; Ji, W.; Li, Y.; Tao, S. Interannual variations of monthly and seasonal normalized difference vegetation index (NDVI) in China from 1982 to 1999. J. Geophys. Res. 2003, 108, 4401. [Google Scholar] [CrossRef]
- Piao, S.; Fang, J.; Zhou, L.; Ciais, P.; Zhu, B. Variations in satellite-derived phenology in China’s temperate vegetation. Glob. Chang. Biol. 2006, 12, 672–685. [Google Scholar] [CrossRef]
- Zhang, G.; Xu, X.; Zhou, C.; Zhang, H.; Ouyang, H. Responses of grassland vegetation to climatic variations on different temporal scales in Hulun Buir Grassland in the past 30 years. J. Geogr. Sci. 2011, 21, 634–650. [Google Scholar] [CrossRef]
- Nicholson, S.E.; Davenport, M.L.; Malo, A.R. A comparison of the vegetation response to rainfall in the Sahel and East Africa, using normalized difference vegetation index from NOAA AVHRR. Clim. Chang. 1990, 17, 209–241. [Google Scholar] [CrossRef]
- Piao, S.; Friedlingstein, P.; Ciais, P.; Viovy, N.; Demarty, J. Growing season extension and its impact on terrestrial carbon cycle in the Northern Hemisphere over the past 2 decades. Glob. Biogeochem. Cycles 2007, 21, GB3018. [Google Scholar] [CrossRef]
- Mu, S.; Yang, H.; Li, J.; Chen, Y.; Gang, C.; Zhou, W.; Ju, W. Spatio-temporal dynamics of vegetation coverage and its relationship with climate factors in Inner Mongolia, China. J. Geogr. Sci. 2013, 23, 231–246. [Google Scholar] [CrossRef]
- Vidiella, P.E.; Armesto, J.J. Emergence of ephemeral plant species from soil samples of the Chilean coastal desert in response to experimental irrigation. Rev. Chil. de Hist. Nat. 1989, 62, 99–107. [Google Scholar]
- Piao, S.; Mohammat, A.; Fang, J.; Cai, Q.; Feng, J. NDVI-based increase in growth of temperate grasslands and its responses to climate changes in China. Glob. Environ. Chang. 2006, 16, 340–348. [Google Scholar] [CrossRef]
- Gu, R.; Zhou, W.; Bai, M.; Li, X.; Di, R.; Yang, J. Impacts of climate change on phenological phase of herb in the main grassland in Inner Mongolia. Acta Ecol. Sinnica 2011, 32, 767–776. (In Chinese) [Google Scholar] [CrossRef] [Green Version]
- Yang, L.; Hou, Q. Phenological changes of populus simonii and its relationship with meteorological conditions in the Eastern Inner Mongolia. J. Meteorol. Environ. 2008, 22, 39–44. (In Chinese) [Google Scholar] [CrossRef]
- Peng, S.; Chen, A.; Xu, L.; Cao, C.; Fang, J.; Myneni, R.B.; Pinzon, J.E.; Tucker, C.J.; Piao, S. Recent change of vegetation growth trend in China. Environ. Res. Lett. 2011, 6, 44027. [Google Scholar] [CrossRef]
- Anselin, L. Under the hood issues in the specification and interpretation of spatial regression models. Agric. Econ. 2002, 27, 247–267. [Google Scholar] [CrossRef]
- Keitt, T.H.; Bjornstad, O.N.; Dixon, P.M.; Citron-Pousty, S. Accounting for spatial pattern when modeling organis-environment interactions. Ecography 2002, 25, 616–625. [Google Scholar] [CrossRef] [Green Version]
- Smith, P.A. Autocorrelation in logistic regression modelling of species distributions. Glob. Ecol. Biogeogr. Lett. 1994, 4, 47–61. [Google Scholar] [CrossRef]
- Diniz-Filho, J.A.F.; Hawkins, B.A.; Bini, L.M.; De Marco, P.; Blackburn, T.M. Are spatial regression methods a panacea or a Pandora’s box? A reply to Beale et al. (2007). Ecography 2007, 30, 848–851. [Google Scholar] [CrossRef]
- Dormann, F.C.; McPherson, J.M.; Araújo, M.B.; Bivand, R.; Bolliger, J.; Carl, G.; Davies, R.G.; Hiezel, A.; Jetz, W.; Kissling, W.D.; et al. Methods to account for spatial autocorrelation in the analysis of species distributional data: A review. Ecography 2007, 30, 609–628. [Google Scholar] [CrossRef] [Green Version]
- Bickford, S.A.; Laffan, S.W. Multi-extent analysis of the relationship between pteridophyte species richness and climate. Glob. Ecol. Biogeogr. 2006, 15, 588–601. [Google Scholar] [CrossRef]
- Kissling, W.D.; Carl, G. Spatial autocorrelation and the selection of simultaneous autoregressive models. Glob. Ecol. Biogeogr. 2008, 17, 59–71. [Google Scholar] [CrossRef]
- Serrat-Capdevila, A.; Scott, R.L.; Shuttleworth, J.; Valdés, J.B. Estimating evapotranspiration under warmer climates: Insights from a semi-arid riparian system. J. Hydrol. 2011, 399, 1–11. [Google Scholar] [CrossRef]
- Sala, O.E.; Lauenroth, W.K. Small rainfall events: An ecological role in semiarid regions. Oecologia 1982, 53, 301–304. [Google Scholar] [CrossRef]


| Vegetation Type | April | May | June | July | August | September | October | |||||||
|---|---|---|---|---|---|---|---|---|---|---|---|---|---|---|
| Slope | R | Slope | R | Slope | R | Slope | R | Slope | R | Slope | R | Slope | R | |
| Forest | −0.00 | −0.54 ** | 0.09 | 0.14 ** | −0.29 | −0.17 ** | −0.02 | −0.01 | 0.24 | 0.20 ** | 0.28 | 0.58 ** | 0.00 | 0.06 * |
| Meadow steppe | −0.00 | −0.19 ** | 0.82 | 0.56 ** | −0.14 | −0.05 | 1.87 | 0.32 ** | 0.29 | 0.08 * | 0.15 | 0.15 ** | 0.00 | 0.06 |
| Typical steppe | 0.03 | 0.37 ** | 0.49 | 0.37 ** | 1.14 | 0.62 ** | 0.73 | 0.21 ** | 1.16 | 0.32 ** | 0.26 | 0.23 ** | 0.00 | 0.12 ** |
| Desert steppe | 0.01 | 0.02 | 0.57 | 0.24 ** | 0.78 | 0.27 ** | 0.80 | 0.21 ** | 0.12 | 0.02 | 0.15 | 0.06 * | 0.12 | 0.27 ** |
| Desert | 0.14 | 0.12** | −0.33 | −0.06 ** | 0.82 | 0.13 ** | −0.13 | −0.01 | 7.34 | 0.56 ** | 3.70 | 0.33 ** | 0.04 | 0.03 |
| Crop | 0.00 | 0.01 | 0.44 | 0.21 ** | 0.29 | 0.15 ** | 1.33 | 0.23 ** | 1.65 | 0.53 ** | 0.34 | 0.28 ** | 0.00 | 0.02 |
| Vegetation Type | April | May | June | July | August | September | October | |||||||
|---|---|---|---|---|---|---|---|---|---|---|---|---|---|---|
| Slope | R | Slope | R | Slope | R | Slope | R | Slope | R | Slope | R | Slope | R | |
| Forest | −0.33 | −0.57 ** | −0.10 | −0.24 ** | −0.08 | −0.18 ** | 0.05 | 0.19 ** | −0.02 | −0.11 ** | −0.10 | −0.28 ** | −0.06 | −0.12 ** |
| Meadow steppe | −0.08 | −0.28 ** | 0.04 | 0.08 | −0.03 | −0.04 | 0.55 | 0.59 ** | 0.21 | 0.27 ** | −0.05 | −0.14 ** | 0.00 | 0.01 |
| Typical steppe | −0.04 | −0.15 ** | 0.07 | 0.17 ** | −0.07 | −0.13 ** | 0.32 | 0.49 ** | 0.15 | 0.27 ** | −0.03 | −0.08 ** | −0.01 | −0.02 |
| Desert steppe | 0.04 | −0.20 ** | 0.05 | 0.21 ** | 0.01 | 0.05 | 0.23 | 0.42 ** | 0.24 | 0.42 ** | 0.18 | 0.29 ** | 0.07 | 0.27 ** |
| Desert | −0.02 | −0.19 ** | −0.05 | −0.30 ** | −0.14 | −0.24 ** | −0.17 | −0.37 ** | −0.15 | −0.41 ** | −0.13 | −0.57 ** | −0.03 | −0.26 ** |
| Crop | 0.03 | 0.08 | 0.06 | 0.16 ** | 0.12 | 0.22 ** | −0.18 | −0.22 ** | −0.21 | −0.36 ** | −0.07 | 0.32 ** | −0.03 | −0.08 |
| Vegetation Type | Correlation Coefficient (R) | ||||||
|---|---|---|---|---|---|---|---|
| April | May | June | July | August | September | October | |
| Forest | 0.21 ** | 0.06 * | −0.26 ** | −0.24 ** | 0.05 | 0.65 ** | 0.19 ** |
| Meadow steppe | 0.22 ** | 0.16 ** | −0.17 ** | −0.45 ** | −0.32 ** | 0.44 ** | 0.28 ** |
| Typical steppe | 0.01 | 0.27 ** | 0.56 ** | 0.13 ** | 0.13 ** | 0.34 ** | 0.38 ** |
| Desert steppe | 0.03 | 0.29 ** | 0.30 ** | 0.23 ** | 0.16 ** | 0.01 | 0.22 ** |
| Desert | 0.02 | 0.12 ** | −0.04 * | 0.10 ** | 0.01 | 0.56 ** | 0.32 ** |
| Crop | 0.06 | 0.21 ** | 0.14 ** | −0.36 ** | 0.32 ** | 0.48 ** | −0.24 ** |
| Vegetation Type | Correlation Coefficient | ||||||
|---|---|---|---|---|---|---|---|
| April | May | June | July | August | September | October | |
| Forest | −0.12 ** | −0.14 ** | 0.11 ** | 0.02 | −0.09 ** | −0.25 ** | −0.05 |
| Meadow steppe | −0.11 * | −0.35 ** | 0.31 ** | −0.07 | 0.55 ** | 0.16 ** | −0.34 ** |
| Typical steppe | 0.19 ** | −0.14** | 0.38 ** | 0.04 | 0.43 ** | 0.36 ** | −0.19 ** |
| Desert steppe | 0.35 ** | 0.20** | 0.22 ** | −0.04 | 0.34 ** | 0.33 ** | 0.31 ** |
| Desert | −0.36 ** | −0.24 ** | −0.31 ** | −0.19 ** | −0.41 ** | −0.45 ** | −0.38 ** |
| Crop | −0.04 | −0.26 ** | 0.12** | −0.07 | −0.23 ** | −0.40 ** | 0.01 |
| Vegetation Type | Correlation Coefficient | |||||
|---|---|---|---|---|---|---|
| Forest | Meadow Steppe | Typical Steppe | Desert Steppe | Desert | Crop | |
| Precipitation | −0.11 ** | 0.25 ** | 0.41 ** | 0.27 ** | −0.28 ** | 0.14 ** |
| Temperature | 0.19 ** | −0.24 ** | 0.18 ** | 0.25 ** | 0.25 ** | −0.03 |
© 2020 by the authors. Licensee MDPI, Basel, Switzerland. This article is an open access article distributed under the terms and conditions of the Creative Commons Attribution (CC BY) license (http://creativecommons.org/licenses/by/4.0/).
Share and Cite
Guo, L.; Zuo, L.; Gao, J.; Jiang, Y.; Zhang, Y.; Ma, S.; Zou, Y.; Wu, S. Revealing the Fingerprint of Climate Change in Interannual NDVI Variability among Biomes in Inner Mongolia, China. Remote Sens. 2020, 12, 1332. https://doi.org/10.3390/rs12081332
Guo L, Zuo L, Gao J, Jiang Y, Zhang Y, Ma S, Zou Y, Wu S. Revealing the Fingerprint of Climate Change in Interannual NDVI Variability among Biomes in Inner Mongolia, China. Remote Sensing. 2020; 12(8):1332. https://doi.org/10.3390/rs12081332
Chicago/Turabian StyleGuo, Linghui, Liyuan Zuo, Jiangbo Gao, Yuan Jiang, Yongling Zhang, Shouchen Ma, Youfeng Zou, and Shaohong Wu. 2020. "Revealing the Fingerprint of Climate Change in Interannual NDVI Variability among Biomes in Inner Mongolia, China" Remote Sensing 12, no. 8: 1332. https://doi.org/10.3390/rs12081332