Land Use/Land Cover Change (2000–2014) in the Rio de la Plata Grasslands: An Analysis Based on MODIS NDVI Time Series


1
Departamento de Sistemas Ambientales, Facultad de Agronomía, Universidad de la República. Garzón 780, Montevideo, Uruguay
2
Laboratorio de Análisis Regional y Teledetección, Depto. Métodos Cuantitativos y Sistemas de Información, Facultad de Agronomía and IFEVA, UBA and CONICET, Av. San Martín 4453, 1417 Buenos Aires, Argentina
3
Instituto de Ecología y Ciencias Ambientales, Facultad de Ciencias, Universidad de la República. Iguá 4225, Montevideo, Uruguay
4
Instituto Nacional de Investigación Agropecuaria, INIA la Estanzuela, Colonia 70000, Uruguay
*
Author to whom correspondence should be addressed.
Remote Sens. 2020, 12(3), 381; https://doi.org/10.3390/rs12030381
Submission received: 13 November 2019
/
Revised: 10 January 2020
/
Accepted: 15 January 2020
/
Published: 24 January 2020
Abstract
:Latin America in general and the Rio de la Plata Grasslands (RPG) in particular, are one of the regions in the world with the highest rates of change in land use/land cover (LULC) in recent times. Despite the magnitude of this change process, LULC descriptions in the RPG are far from being complete, even more those that evaluate LULC change through time. In this work we described LULC and its changes over time for the first 14 years of the 21st century and for the entire grassland biome of the Rio de la Plata, one of the most extensive grassland regions in the world. We performed simple but exhaustive classifications at regional level based on vegetation phenology, using extensive LULC field database, time series of MODIS NDVI satellite images and decision trees classifiers, generating an annual map for all RPG. The used technique achieved very good levels of accuracy at the regional (94.3%–95.5%) and sub-regional (78.2%–97.6%) scales, with commission and omission errors generally low (Min = 0.6, Max = 10.3, Median = 5.7, and Min = 0, Max = 41.8, Median = 6.8 for regional and sub regional classification respectively) and evenly distributed, but fails when LULC classifications are generated in years when the climate is very different from those used to generate spectral signatures and train decision trees, or when the NDVI time series accumulates large volumes of lost data. Our results show that the RPG are immersed in a strong process of land use change, mainly due to the advance of the agricultural frontier and at the expense of loss of grassland areas. The agricultural area increased 23% in the analyzed period, adding over than 50,000 Km2 of new crops. Most agricultural expansion, and therefore the greatest losses of grassland, concentrates on both sides of Uruguay river (Mesopotamic Pampa and the western portion of Southern and Northern Campos) and the western portion of Inland Pampa. The generated maps open the door for more detailed and spatially explicit modeling of many important aspects of ecosystem functioning, for quantification in the provision of ecosystem services and for more efficient management of natural resources.
1. Introduction
Humanity transforms the landscape to obtain food, fibers, fuels and other goods provided by ecosystems. Sanderson et al. [1] estimated that 83% of the Earth’s surface is directly or indirectly influenced by human activity. Tilman et al. [2] calculated that around 4 million hectares per year of natural vegetation were used for agriculture in the last 40 years. Crops and pastures dedicated to livestock production cover 38% of the ice-free land area [3,4]. These land use/land cover (LULC) changes are associated with complex interactions between the availability of resources, climate fluctuations and a very broad set of socio-economic factors [5,6,7,8]. The consequences of LULC changes are profound. Habitat loss by replacing the original cover is the most important factor in the global biodiversity crisis [9,10]. Declining natural land cover has changed biogeochemical cycles [11,12] and climate [13,14]. This set of changes in the structure and functioning of ecosystems positions the LULC change as one of the main drivers of Global Change [15] and has led to a decline in the provision of goods and services that ecosystems provide to humans, ultimately affecting their well-being.
The increasing number of sensors mounted on satellite and airborne platforms and improvements therein have changed the ability to observe the Earth’s surface [16]. Despite technological progress, the absence of uninterrupted time series of LULC maps, long enough to reflect socio-ecological dynamics is a major problem. The Millennium Ecosystem Assessment identifies the lack information on LULC change, as one of the main gaps to advise decision makers on the consequences of ecosystems changes in human welfare [17]. The scientific and political community needs recent LULC maps (and its changes over time) to track how different factors drives land use changes and what their effects are [18].
Latin America is one of the world regions with the highest rates of LULC change in recent times. Within Latin America, Argentina, Brazil, and Uruguay are among the countries with the greatest changes in the area planted with agricultural crops [19]. The documented LULC changes related to this agricultural expansion include mainly the substitution of forests for crops or sown pastures [20]. There is practically no works that report LULC changes in the southern cone of South America (see, however [21]) and even less, the substitution of natural grasslands for other land uses, in accordance with the work of Overbek et al. [22], who define natural grasslands as the “neglected biome”.
The Rio de la Plata Grasslands (RPG) is one of the most extensive areas of natural grasslands in the world, with an area of more than 70 million hectares, covering the great plain of central-eastern Argentina, Uruguay and the south of Brazil [23]. In recent decades the areas occupied by this ecosystem have been largely replaced by crops, implanted pastures and afforestation [24,25,26,27,28]. Although there are still remnants of natural grasslands, these are only found in marginal areas of the region, where agriculture and intensive livestock farming are not economically profitable activities [29,30]. The grassland biome in general, and RPG in particular, is currently one of the biomes with the highest risk of disappearance, because it has one of the highest percentages of transformed habitats and the lowest percentage of protected surfaces of all the other biomes of the Earth [31].
LULC existing descriptions in the RPG can be divided into two groups. On the one hand there are partial descriptions, of some thousands of Km2, generally made from classifications of high spatial resolution satellite images (Landsat, CBERS, etc.) [24,32,33,34,35]. On the other hand, there are classifications made at a global [36,37,38] or continental level [18,20,39,40], generally from satellite images with low or medium spatial resolution, and high temporal resolution (AVHRR, SPOT-VEGETATION, MODIS). These large-scale classifications are exhaustive (cover the entire territory), but present, in most cases, inconsistencies with LULC local knowledge.
LULC temporary changes have been little studied in the region. Previous works are also represented by partial descriptions of the process [34,41,42] or works at continental level [18,20], where changes in the RPG are little discussed. At an intermediate scale between the local and continental classifications, Volante et al. [21] generated crops classifications for Argentina, Bolivia, Chile, Paraguay, and Uruguay for the years 2000/01 and 2010/11, and evaluated the changes that have occurred between the two periods. This work does not include all of the RPG, by leaving out of the analysis the Brazilian portion of the study area. A recent initiative, Mapbiomas.org, has generated annual LULC maps, for all of Brazil from 1980 to the present [43].
In this work we use MODIS NDVI time series and an extensive LULC database to describe the LULC of entire Rio de la Plata Grasslands biome and analyze their changes over the first 15 years of the 21st century. The work is carried out at an intermediate scale between the partial and continental classifications described above, highlighting the usefulness of regional analysis. The generated maps and LULC change analysis are discussed at sub-region level of the RPG according to the divisions proposed by Soriano [23]. Additionally, we detail the maps construction process, discussing the advantages and limitations of phenological approaches for vegetation classification.
2. Materials and Methods
2.1. Study Area
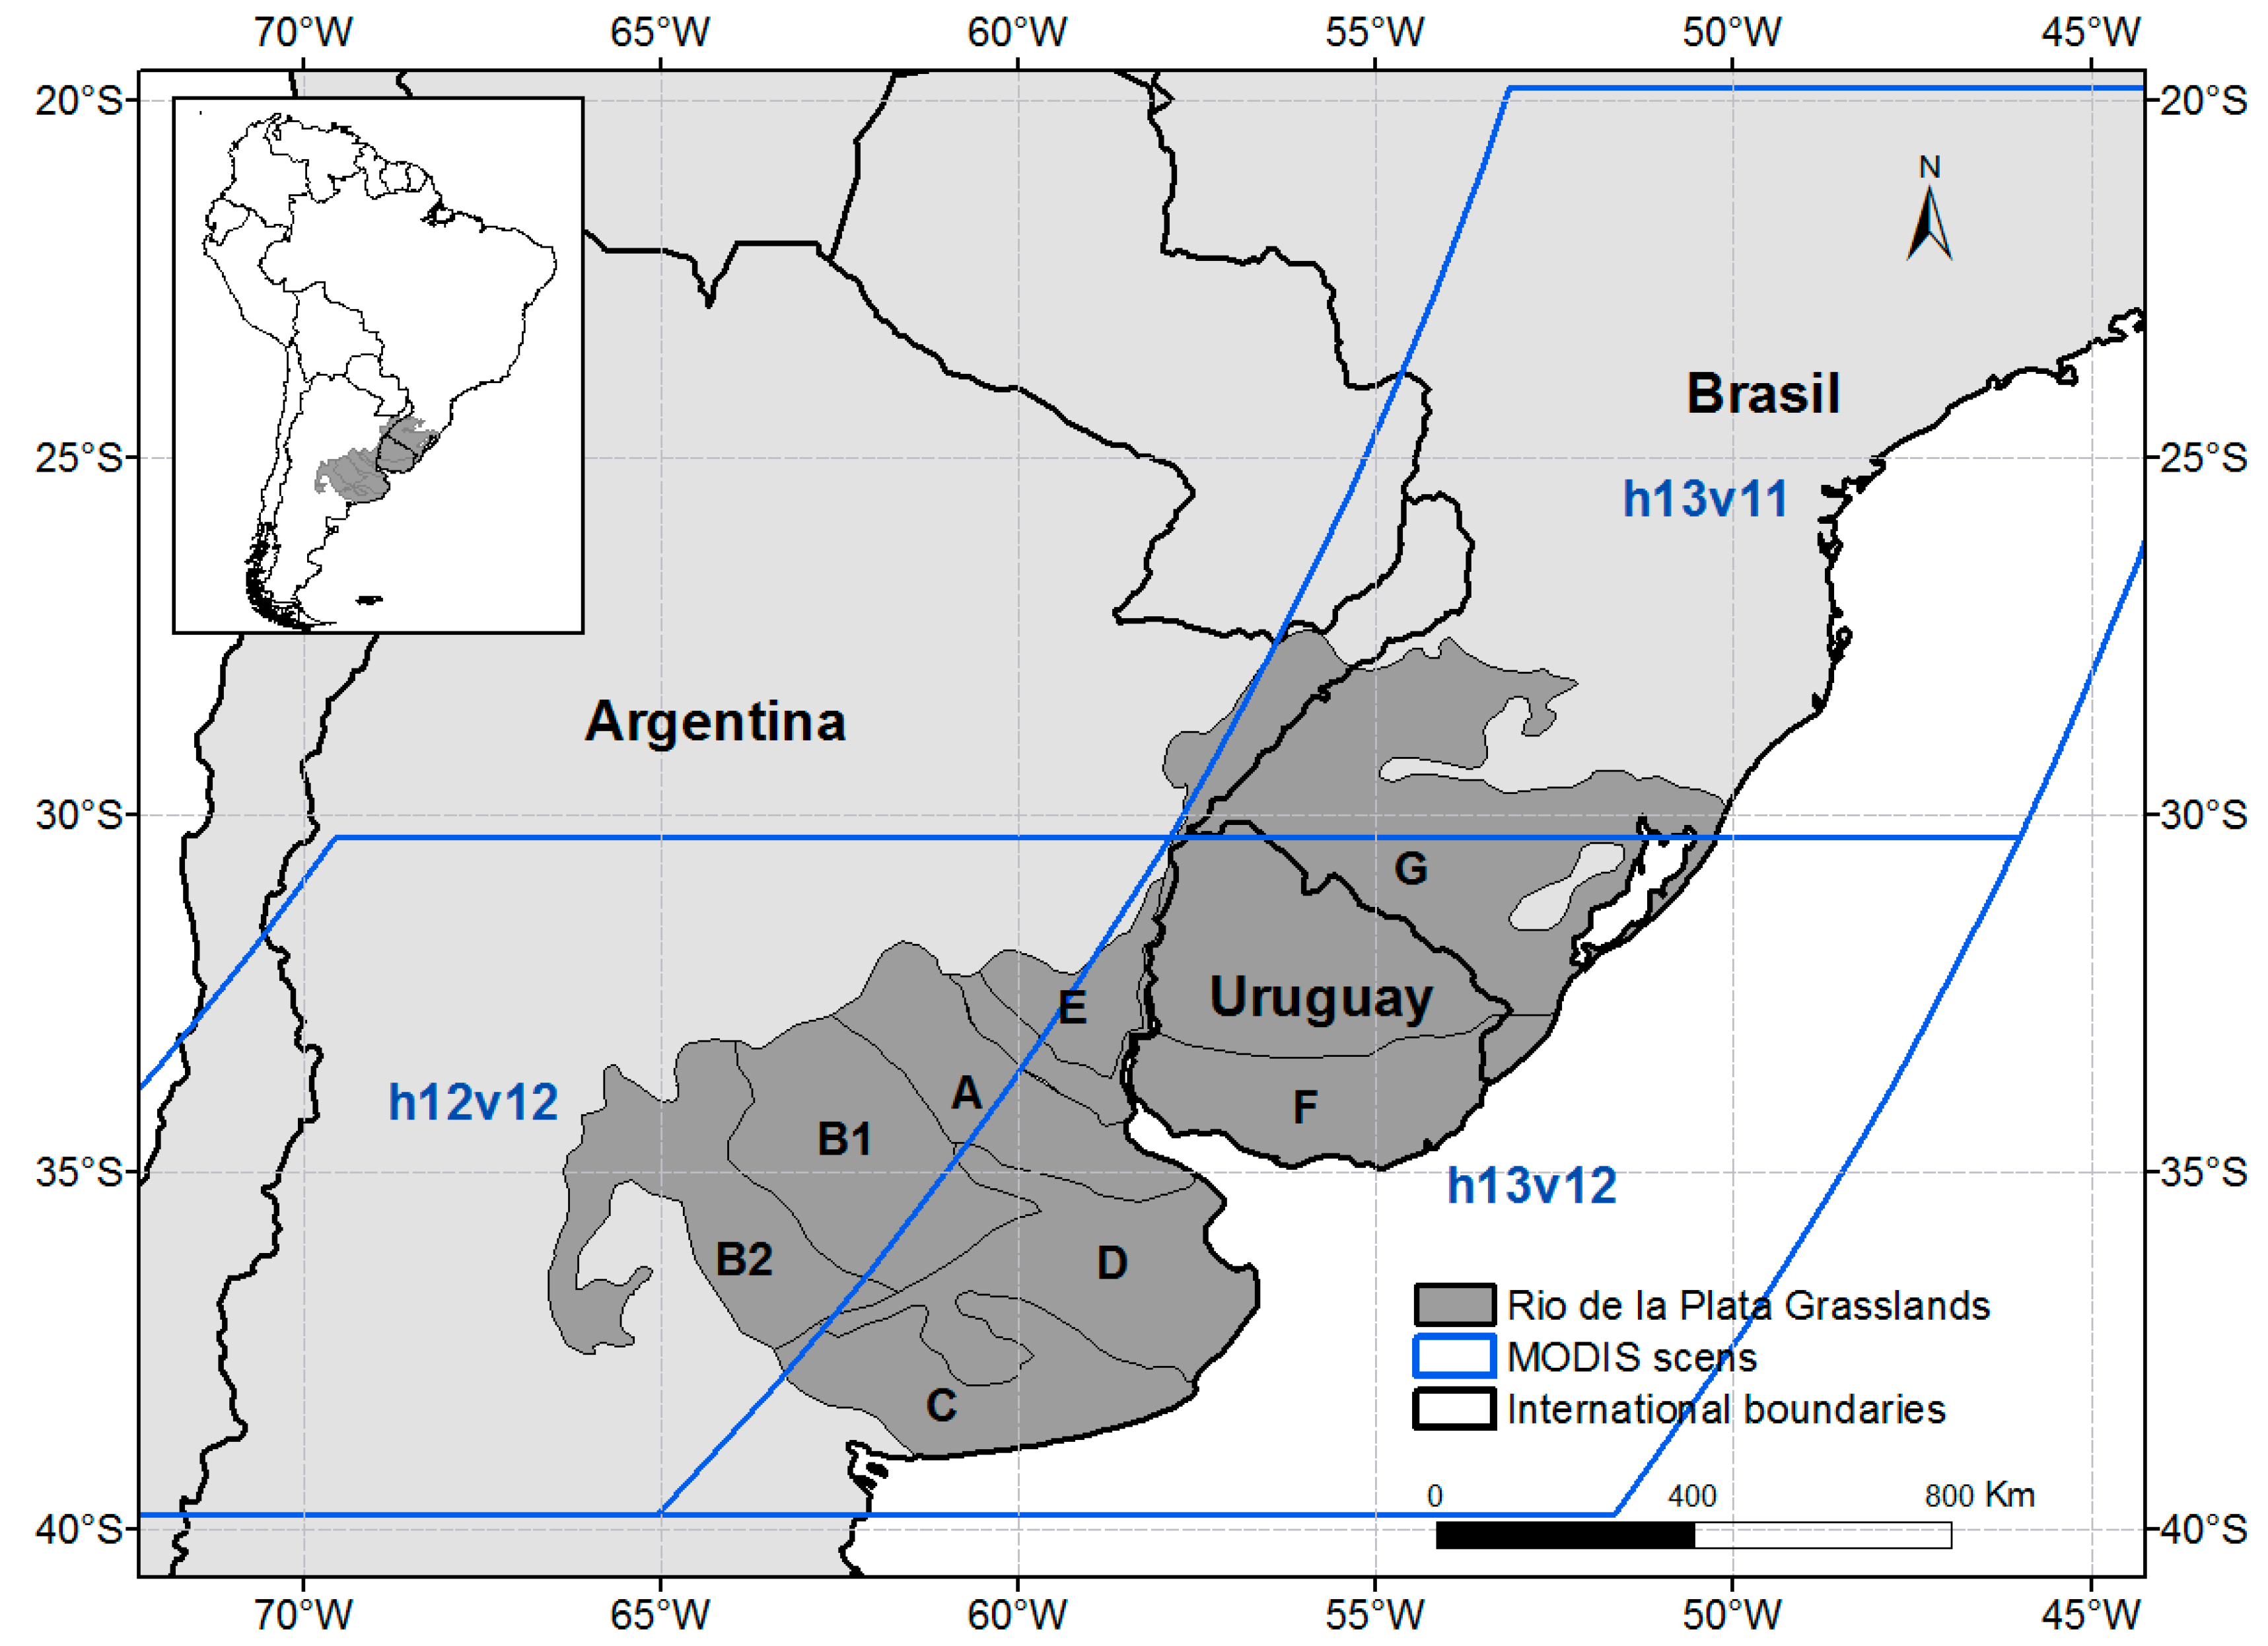
The Rio de la Plata Grasslands (RPG), as defined by Soriano [23], occupy approximately 700,000 Km2, covering the south of Brazil, Uruguay and the center-east of Argentina. According to the cartographic base, the area covered by this region is somewhat larger, slightly more than 825,000 Km2. The average annual temperature varies from 13 ° C in the south to 20 ° C in the North, and the precipitation presents a Southwest-Northeast gradient, with values of 400 mm/year to 1800 mm/year, respectively [34]. In the Argentine portion of the RPG, the soils, developed on Quaternary sediments, change in a West–East gradient from mollic Entisols with incipient differentiation, to well-developed Mollisols with high clay accumulation in subsurface horizons, generally with high levels of organic matter and saturation of bases, which makes them very suitable for agriculture. The lower and flatter portions of the landscape are characterized by the presence of sodic and/or hydromorphic soils with greater restrictions for agriculture [30]. In the Uruguayan and Brazilian portions of RPG, a more complex combination of parent materials and topography, generates a greater variety of soils, with well-developed Mollisols that occur frequently, but also shallow soils on rocky outcrops (entisols) and soils with little saturation of bases (alfisols, inceptisols, and oxisols) [40]. Grasslands, formed by different combinations of C3 and C4 grasses and a broad set of herbs are the dominant vegetation [22,23,44,45,46]. The RPG are and have been subjected to an intense process of land use change since the beginning of the 20th century [47], mainly due to the substitution of natural grasslands by annual crops and tree plantations [26,30].
RPG were divided by Rolando Leon (in [23]) into several sub regions based on their geomorphology, soils, drainage and their link with natural vegetation and land use. These sub regions are the Rolling, Southern, Flooding, Flat Inland, West Inland, and Mesopotamic Pampas, and the Southern and Northern Campos (Figure 1). Details on its definition and vegetation can be seen in Soriano [23].
2.2. Classification Process
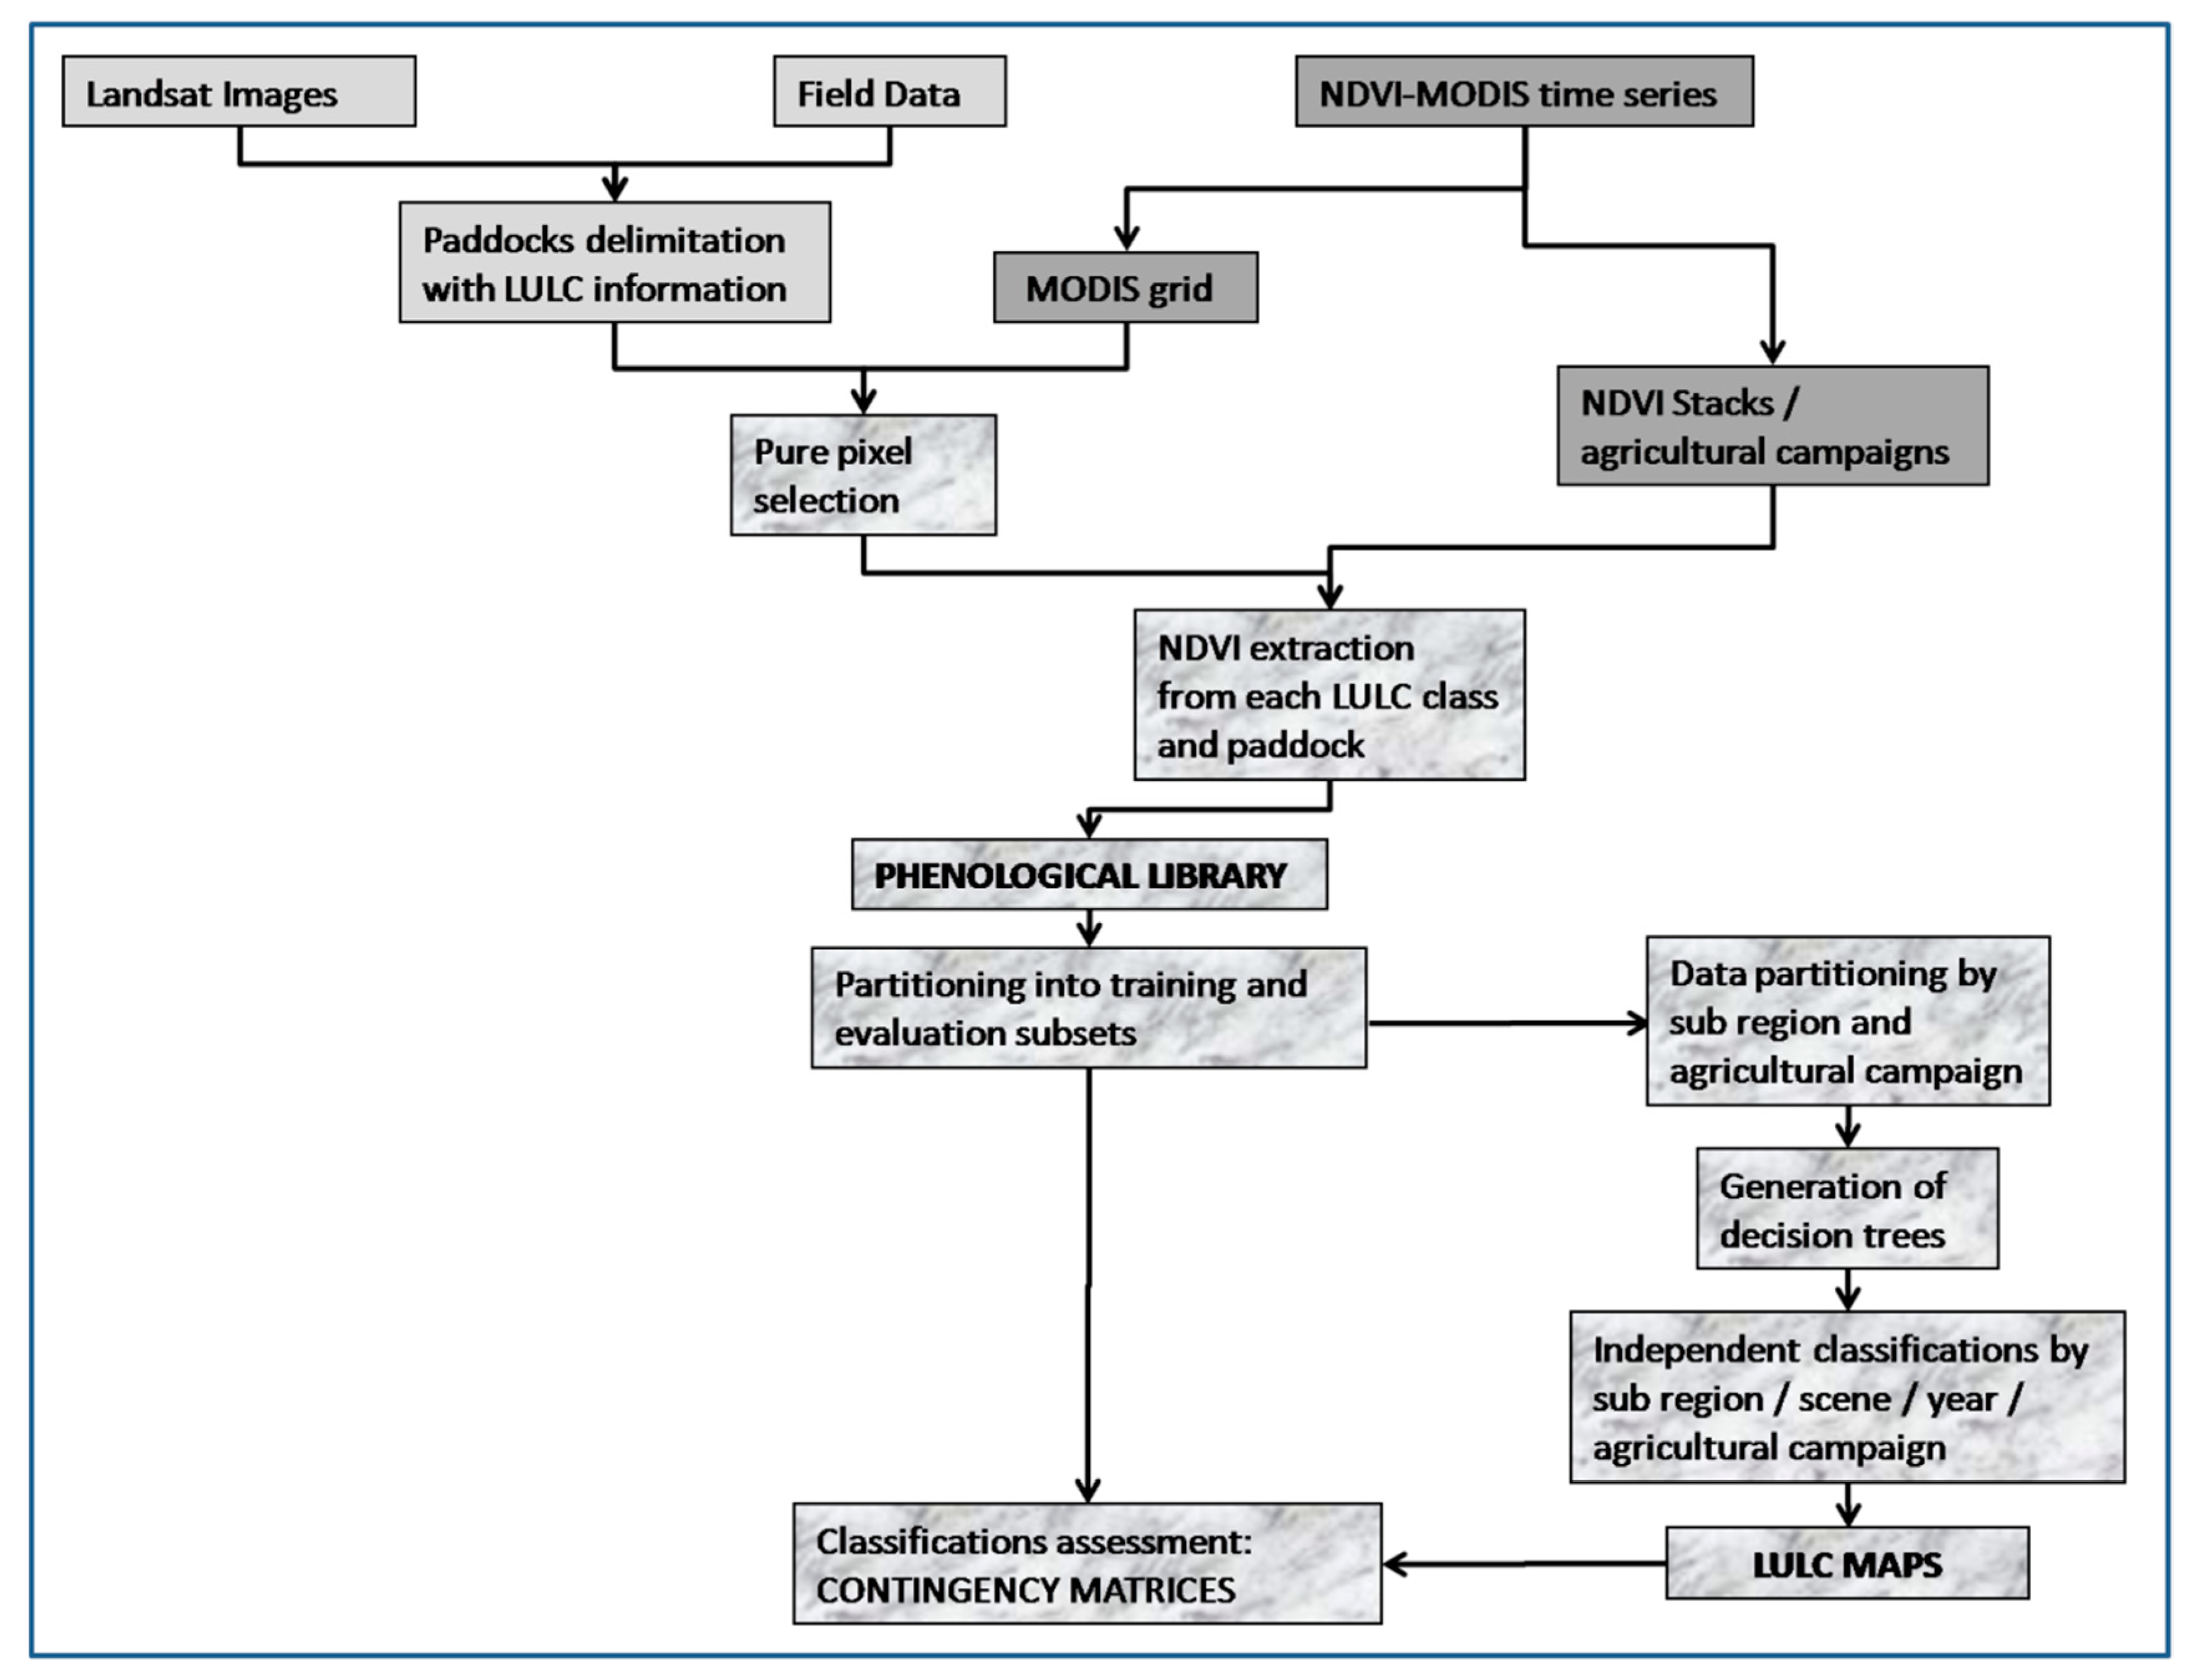
The performed classifications imply the use of phenological information of the different LULC obtained from images of the MODIS sensor, with “ground truth” data from field campaigns, the digitization of “pure” paddocks (a single LULC class) in high spatial resolution images (Landsat), the crossing of such information and its classification by decision trees. Given the extension of the study area and its internal differences (soil types, topography, climate, etc.), classifications were generated independently for each RPG sub-region. In this way we try to separate different phenological behaviors for the same t LULC category that are related to their different location in the study area. For example, a summer crop that is sown later in the growing season in the Southern Pampa than in the Northern Campos, will be classified independently in both regions, reducing the internal variability of this category. Additionally, given the structure of the field database, classifications of winter and summer agricultural campaigns were generated separately in each sub-region. Furthermore, in those sub regions covered by more than one MODIS tile (storage unit of MODIS sensor products), classifications were generated for each tile separately and joined ex post. Finally, this process was carried out for 14 years of MODIS data, lumping together the maps of both agricultural campaigns (winter and summer) to generate maps for 2000/2001 to 2013/2014 growing seasons (see below). Figure 2 summarizes the steps taken to obtain LULC maps.
2.2.1. MODIS NDVI Image Processing
We used NDVI time series of MODIS sensor (product MOD13Q1: “Vegetation Indices 16-Day L3 Global 250m”), a spectral index calculated from red (R) and infrared (IR) reflectance of the surface according the following equation:
We obtained the MODIS NDVI time series through the Land Processes Distributed Active Archive Center: EOS Data Gateway. RPG are covered almost entirely by MODIS tiles h13v11 (i.e., horizontal 13, vertical 11), h12v12, and h12v13. The h12v12 tile covers only 0.7% of the study area and was excluded from the analysis. We use NDVI images for the period from the start of operation of the sensor, in February 2000 until 2014, which were subjected to a quality filter [48]. Images were filtered to obtain pixels with NDVI values free of clouds, shadows and low presence of aerosols in the atmosphere. Those pixels that did not meet these requirements were masked and replaced by the average value between the previous and subsequent date. NDVI time series were regrouped by year and by agricultural campaign. Winter agricultural campaigns group NDVI images from period between May 9 and January 3 of the following year (15 images, 1 every 16 days). Summer agricultural campaigns group NDVI images corresponding to the period between November 1 and May 24 of the following year (13 images, 1 every 16 days). Fourteen new time series were generated for winter and summer campaigns for each of the MODIS tile involved in the classification process. Additionally, for each of these new time series, we calculated a set of synthetic variables that summarize the temporal variation of NDVI values and that provide important information on the phenology of the different LULC classes. Calculated variables were: the average value of NDVI (NDVI-Mean); the maximum (NDVI-Max) and minimum NDVI (NDVI-Min); the difference between the maximum and minimum NDVI value (NDVI-Range); the relative range of NDVI-values (IVN-RR), calculated as IVN-Range/IVN-Mean; the standard deviation of NDVI value (NDVI-SD); and the annual sum of the NDVI values, calculated as the sum for each pixel of all NDVI values of the time series (NDVI-Sum). Some of these metrics summarize much of the spatial variability of the NDVI dynamics in temperate areas [49,50,51].
2.2.2. Collection and Processing of Field Data
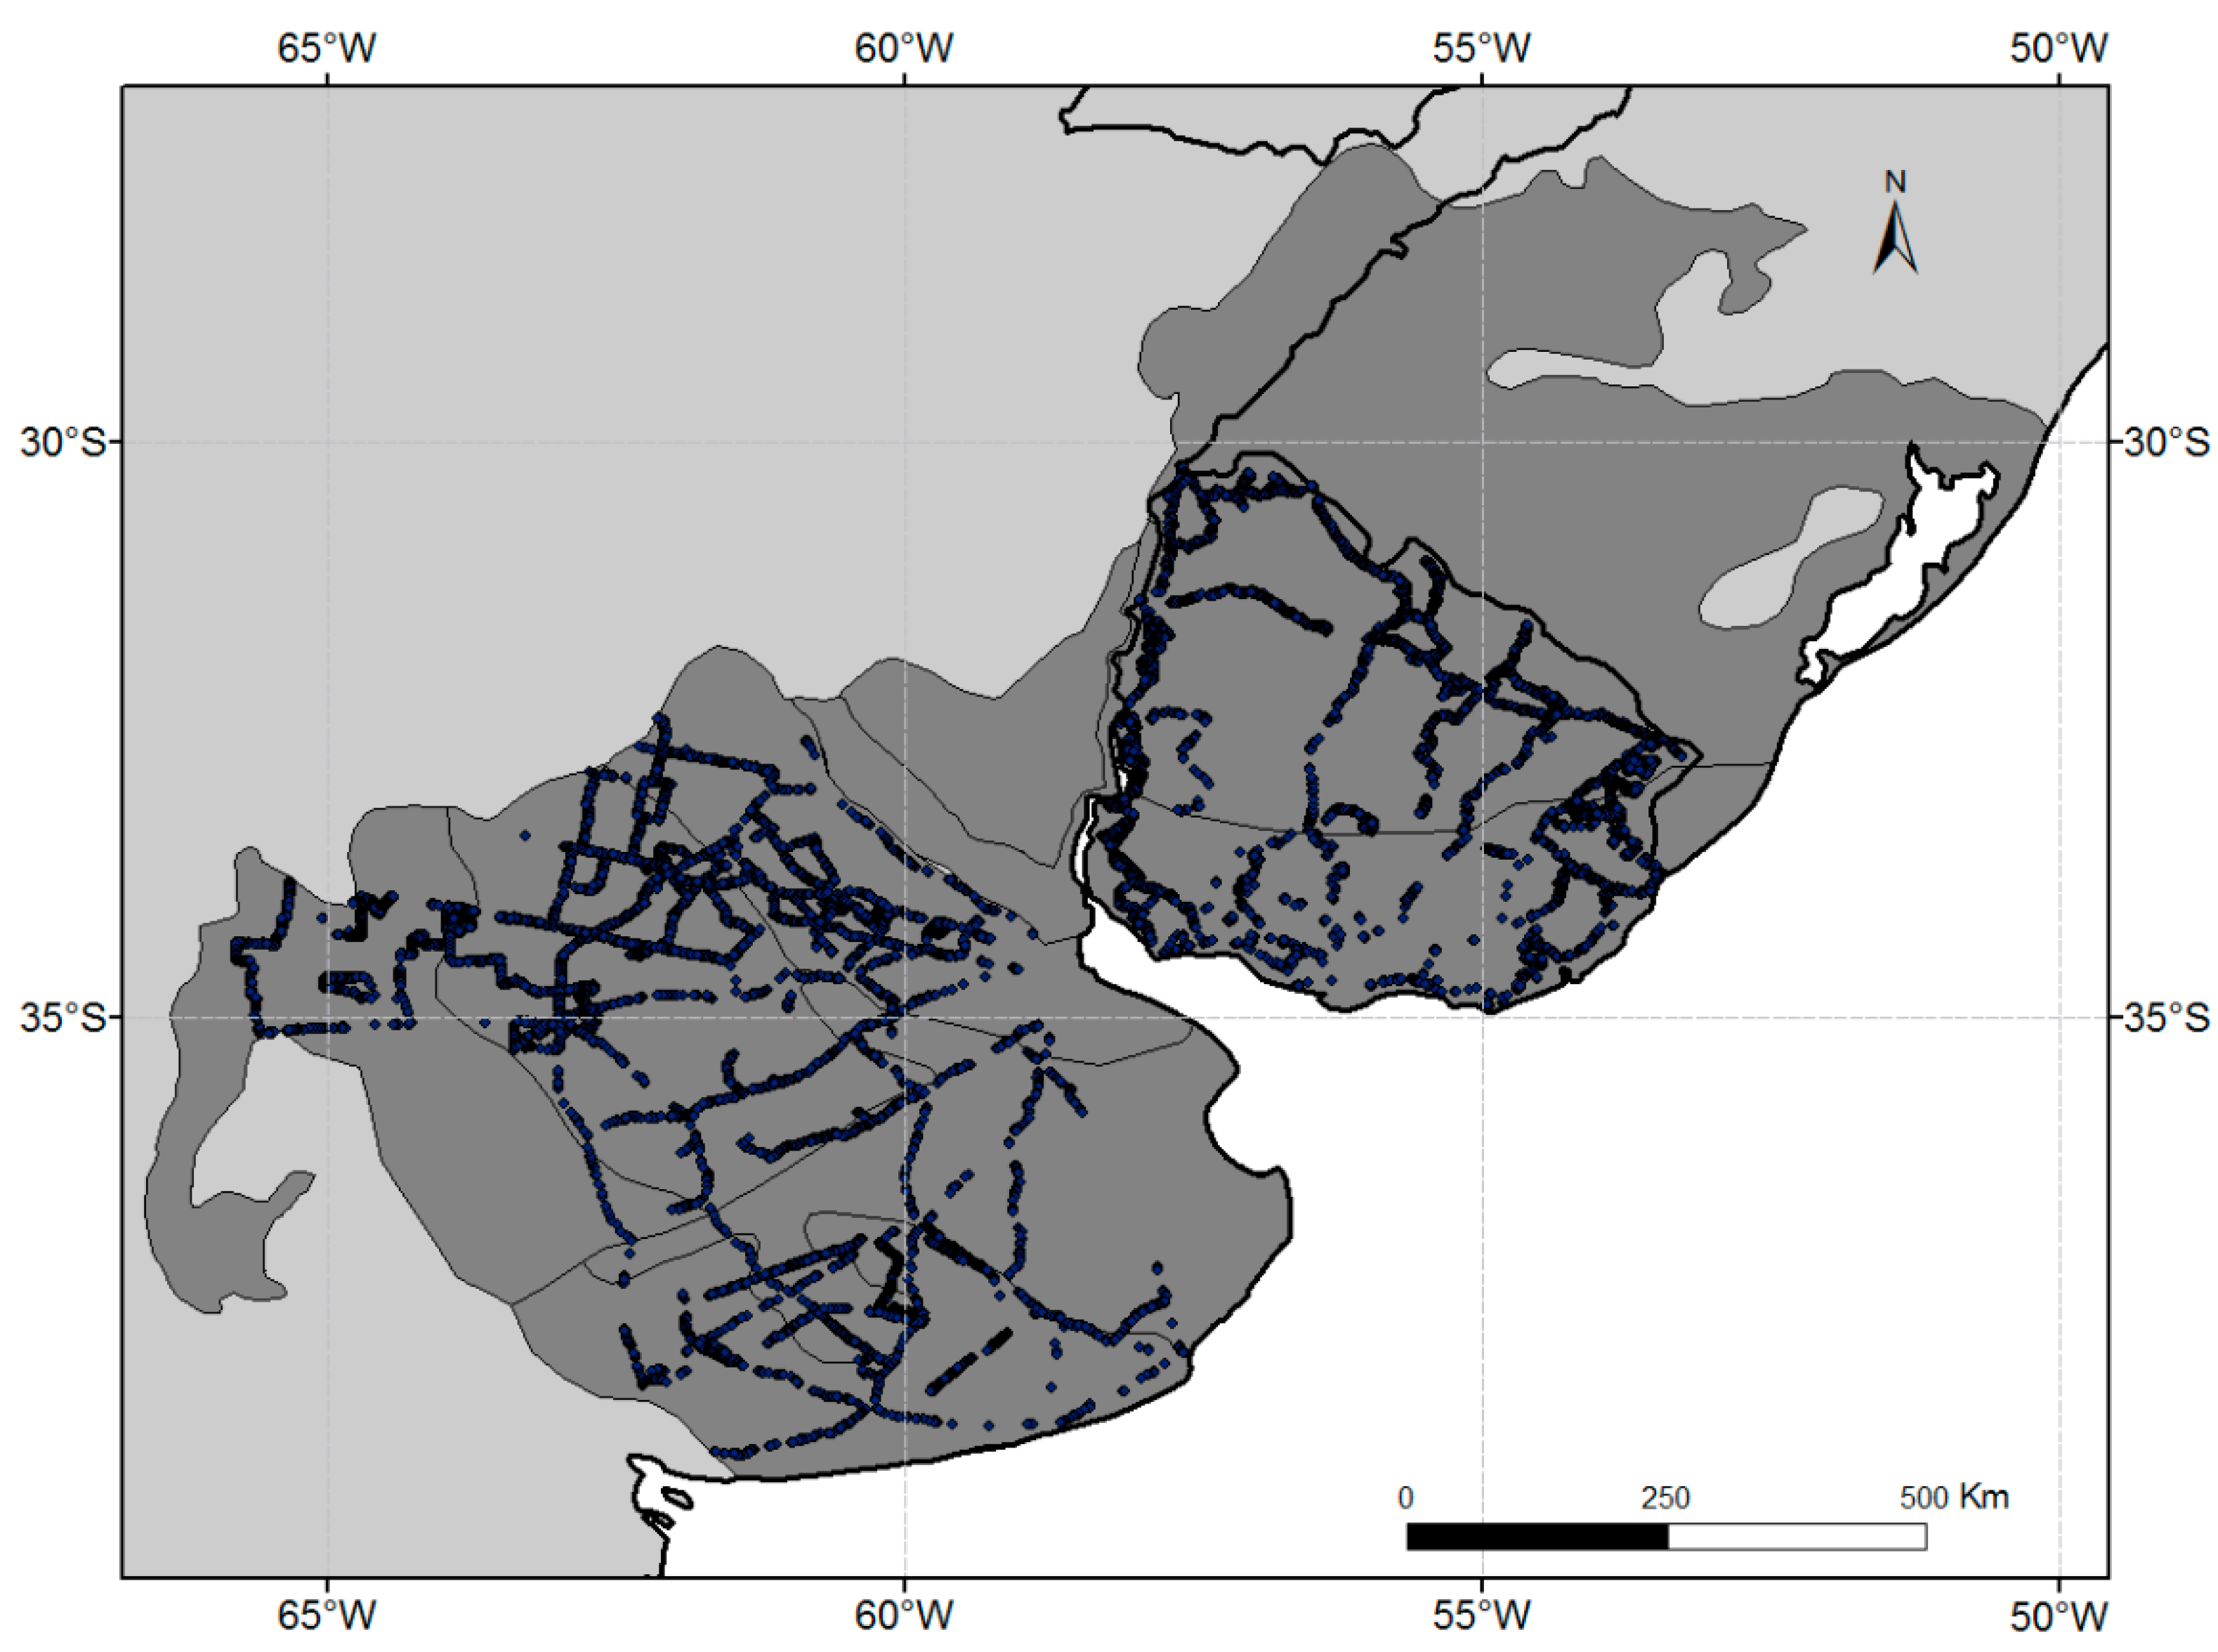
Field information comes from trips through the study area where the location and LULC class was recorded by GPS. The complete database includes information collected in different projects and compiles the LULC of 20,146 paddocks distributed in most of the study area and for different years, except the Mesopotamian Pampa and the Brazilian portion of Southern and Northern Campos (Figure 3). Field information was superimposed on high spatial resolution images (Landsat 5 TM or ETM Landsat 7) delimiting the boundaries of the different paddocks. Landsat images were obtained by courtesy of the US Geological Survey (http://www.usgs.gov), and in all cases represent the Landsat image, free of clouds, closest to the date of field sampling. Paddocks with field data were superimposed on the MODIS NDVI time series to extract phenology information, considering all MODIS pixels completely included in each paddock. The final data base had 11,927 paddocks containing at least one completely included MODIS pixel.
2.2.3. Generation of Phenological Library
The vegetation index (NDVI, EVI, etc.) behavior of a given pixel along a growing season is called “phenological signature” since it allows to see vegetation seasonal dynamics. We denominate “Phenological Library” to all different LULC phenological signatures derived from spectral data [52]. For database generation, each of the pure pixels with LULC information, was superimposed on the corresponding time series (year, agricultural campaign, and MODIS tile) extracting the NDVI values and the synthetic variables detailed above. Phenological signature of each of the paddocks considered corresponds to the average value of all fully included MODIS pixels. All phenological signatures were checked for errors in NDVI information not corrected by the interpolation and filtering process and/or errors in LULC class recorded during field trips. Some LULC classes that were poorly represented in the database were also eliminated, such as water bodies and urban centers, which were then mapped with other methods (see below). After revision, the Phenological Library had 10,731 phenological signatures distributed by different sub region of the study area and belonging to different years and agricultural campaigns (Table 1).
The different categories of Phenological Library were reassigned, for classification purposes, in the following LULC categories: Winter crops (WC) which include the winter crops devoted to grain (usually wheat or barley) and forage (oats and ryegrass); Sumer crops (SC) devoted to grain (usually soybeans, corn, sorghum, or rice) and forage (corn and sorghum) Perennial Forage Resources (PFR) which includes natural grasslands and permanent implanted pastures; Afforested areas and Forests (A&F) which includes natural riparian or hillside woodlands and commercial tree plantations(usually Pinus and Eucalyptus).
2.2.4. Classification
Phenological signatures were used for LULC classification of the whole study area using decision trees generated and evaluated using See 5 software. See 5 is based on the algorithm developed by Quinlan [53] for data mining, widely used for the LULC map from satellite images (see for example, [38,40,54,55].
The data set was randomly divided into two subsets, one training dataset to generate the decision tree (70% of the database) and another to evaluate it independently (30% of the database). Decision trees were generated for each sub region and for each agricultural campaign, grouping data from different years and MODIS tiles. In total, 12 decision trees were generated, two (one for the winter agricultural campaigns and the other for the summer ones) for each of the following RPG sub regions: Northern Campos, Southern Campos, Rolling Pampa, Inland Pampa, Flooding Pampa, and Southern Pampa. Due to the size of the databases and their internal similarities, the two sub divisions of the Inland Pampa (Flat Inland Pampa and Wet Inland Pampa) were lumped together. Due to the absence of field data for the Mesopotamic Pampa, no decision trees were generated for this sub region. Decision trees of Northern and Southern Campos sub regions, in the winter campaigns, discriminate between winter crops (WC), perennial forage resources (PFR) and Afforested areas and Forests (A&F), while those generated for summer campaigns discriminate between summer crops (SC), PFR and A&F. Due to the absence of significant areas of A&F, and the consequent absence of field data in this category in the Pampas sub regions, the decision trees generated for this portion of the study area discriminate, in winter, WC and PFR, and in summer, SC and PFR.
Classification decision rules resulting from See 5 analysis were implemented in Envi 4.7 (Exelis Visual Information Solutions, Boulder, Colorado) in order to generate continuous LULC maps s of the entire study area. An independent map was generated for each sub-region, year, agricultural campaign, and MODIS tile. For the classifications of the Mesopotamic Pampa the decision rules generated for Campos del Sur were used, due to their climatic similarities and in the type LULC.
2.2.5. Final Maps Construction
All the individual classifications of each sub region, year, agricultural campaign, and MODIS tile, were combined to generate maps per agricultural year (it covers the period between May 9 of a year and May 24 of the following year) and the entire study area. First, for each year and agricultural campaign, we combine the maps of different MODIS tile and the same sub-region. Subsequently, for each sub region, we combine the maps of each winter agricultural campaign with that of the immediately following summer agricultural campaign. Agricultural year maps were performed through simple decision rules in which the LULC category in the final map depends on the categories to which each pixel belonged in winter and summer agricultural campaigns. For example, if a pixel belonged to the class WC, in winter campaign maps, and to SC, in summer campaign maps, in the map of the agricultural year it is assigned to the category Double Crops (DC: paddocks with two agricultural cycles per year). The set of decision rules for the creation of the agricultural year maps is summarized in Table 2.
As a result of the construction of agricultural years, the maps of Northern Campos, Southern Campos, and Mesopotamic Pampa sub regions have 5 LULC categories: WC, SC, DC, PFR and A&F. The agricultural year maps for the rest of Pampa sub-regions, which, as explained above, do not have the A&F category, include WC, SC, DC, PFR categories. The maps of the different sub regions were joined, generating 14 agricultural year maps from 2000/2001 to 2013/2014 that cover the entire study area.
Two other categories (non-discriminated in the classification process) were superimposed on each agricultural year map: Water and Urban. These categories were taken from the MODIS LAND COVER product (MCD12Q1).
2.3. Accuracy Assessment
Maps were evaluated using three complementary approaches: contingency matrices to the accuracy assessment with field data, global visual evaluation for each RPG sub region and comparison with official statistics. Given the absence of field data for all years and portions of the study area, and to the limited size of the evaluation data subset for some sub regions and years, contingency matrices were generated at various levels. First, classifications were evaluated with the whole data subset, that is, considering together the evaluation data of all years, sub-regions and MODIS tiles, discriminated by agricultural campaign. Second, we evaluated the classifications for the different RPG sub-regions, grouping data from different years and MODIS tiles, discriminated by agricultural campaign. Finally, when there was information available, we evaluated the classifications as they were generated, that is, by evaluating separately each of the classifications for the different sub regions, MODIS tiles, years, and agricultural campaigns.
Additionally, an exhaustive visual analysis of the different annual maps of each RPG sub region was performed. The analysis focused on three characteristics: the presence of agricultural areas in zones that, given the local knowledge, are absent; abrupt temporal changes in the area covered by any of LULC categories; and/or, in the observation of very marked discontinuities in the spatial LULC pattern without apparent justification (e.g., absence of political boundaries or marked changes in soil type).
Finally, the best maps resulting from the two previous assessments (contingency matrices and visual analysis) were compared with official statistics from the different countries in the study area (agricultural censuses and/or agricultural statistics of Argentina, Uruguay, and Brazil). Both official statistics information, as well as classifications results, was summarized in three categories: Crops, Afforestations and Forests (A&F), and Perennial Forage Resources (PFR); and they were expressed as a percentage of the administrative unit. Appendix 1 shows the information used in each country and the data aggregation process (Supplementary Materials, Appendix 1).
2.4. Land Use/Land Cover Change Analysis
LULC changes were analyzed using two complementary approaches. On the one hand, pixel by pixel maps of change were made, identifying the type of transitions occurred between two maps of different agricultural years. On the other hand, we analyze the relative change in the mapped area of the different categories between two periods of time. Both analyzes were performed considering the extremes of agricultural maps temporal series, and analyzing the change in two periods of time, the first and the second half of the time series.
Change maps were generated from simple decision rules defining a series of transitions grouped into seven categories. The first category was no change. The second category was Agricultural Intensification, defined when a pixel changes from PFR to one of the agricultural categories (WC, SC, DC); this category includes new agricultural lands, but also, the entry into the agricultural phase in agricultural-pastoral rotations. The third category was the re-establishment of PFR, defined as the process opposite to Agricultural Intensification (includes the abandonment of agriculture and the entry into the pastures phase in agricultural-pastoral rotations). The fourth category was Forest Intensification, defined when a pixel changes from PFR to A&F (mostly new commercial plantations, but also to a lesser extent, expansion of existing native forests). The fifth was Deforestation, defined as the process opposite to the previous category (includes the native forests deforestation and the harvest of tree plantations). The last two mapped categories occur very infrequently and attempt to capture the transitions between agricultural classes and A&F. The sixth category evaluates the passage of agricultural classes (WC, SC, DC) to A&F, while the seventh category evaluates the opposite process.
The relative change (RC) in the surface of the different LULC categories between two periods was calculated as:
where Y is the area covered by each LULC category [34]. The relative change analysis was made for each RPG sub-region lumping together the agricultural categories.
3. Results
3.1. Land Use/Land Cover Classification
The mapped area covers just over 825,000 Km2, including almost all RPG, with the exception of a small portion of Northern Campos (0.7% of the study area), which belongs to MODIS h12v11 tile, excluded from the analysis. Appendix 2 shows the generated decision trees, the variables used in their construction and the confusion matrices made with the training and evaluation data (Supplementary Materials, Appendix 2). Considering the whole study area, Perennial Forage Resources (PFR) were the dominant class, covering a maximum of 66.1% of the RPG in the 2001/2002 map, and a minimum of 40.3% in the 2008/2009 map. In almost all the agricultural years reported, the PFR were followed in importance by SC, (maximum 37.4%, minimum 10.9%), the DC (maximum 17.6%, minimum 6.1%), the WC (maximum 7.3%, minimum 2.3%) and A&F (maximum 5%, minimum 1.3%) (Supplementary Materials, Appendix 3).
At the RPG sub-regions level, the area covered by the different LULC classes showed, generally, a similar behavior. The PFR were generally the class with the largest area in almost all sub-regions and years. This dominance is particularly evident in Northern Campos, Southern Campos and Flooding Pampa, where almost always exceeded 60% of sub-region area. PFR dominance was also very important, although somewhat less, in Southern Pampa Austral, where this category rarely covered less than 50% of sub-region area. In Mesopotamic and Inland Pampa sub-regions, PFR were majority at the beginning of classifications time series but tended to be equated with the agricultural classes over time, mainly with summer crops (SC) and in some cases, with Double Crops (DC) class. In the case of Rolling Pampa, the PFR surface never surpassed that of the agricultural classes, being the SC the dominant class practically every year (Supplementary Materials, Appendix 3).
Regarding the agricultural categories, SC was the most generally represented class in all sub-regions and years, being particularly important in the Rolling, Inland and Mesopotamic Pampas. In Rolling Pampa, SC surface was at around 45%. In Inland and Mesopotamic Pampas, the area covered with SC was somewhat lower, mainly at the beginning of the analyzed period, but with a very marked increase in its surface over time. DC was particularly important in the Rolling and Mesopotamic Pampas and in the northern portion of Northern Campos. In the Northern Campos, Southern Campos and Mesopotamic Pampa sub-regions there is a clear tendency to increase of DC area over time. Winter Crops (WC) were important only in the Southern Pampa, being a poorly represented category in the rest of RPG.
The Afforestations and Forests (A&F) category occupies low percentages in all the regions where it was mapped. Its greatest territorial expression occurred in Northern Campos, duplicating the surface found in Southern Campos and Mesopotamic Pampa. The Northern Campos A&F surface is concentrated in the commercial forest foci of the northeast of Uruguay and in the southeast of Rio Grande del Sur (Micro-region Sierras del Sudeste) next to the “island” of deciduous forest that is not part of the RPG (Supplementary Materials, Appendix 3).
3.2. Classifications Evaluation
The contingency matrices, made pixel by pixel on the whole evaluation data subset (pooling together all years and sub-regions), showed very good levels of accuracy. Overall accuracy in winter campaigns was 94.3%, while in summer campaigns it was 95.5%, with low and equally distributed commission and omission errors (Table 3, Table 4 and Table 5).
Contingency matrices made by sub-region (grouping the different agricultural years) also showed good overall accuracy. The distribution of commission and omission errors was changeful and depended on the campaign (winter, summer), sub-region and class considered. Errors were generally low although they reached important values for some categories, sub-regions and agricultural campaigns. The evaluations of the classifications as they were generated, that is, classifying independently each sub-region, MODIS tile, year, and agricultural campaign, showed generally good results. In some cases the overall accuracy was extremely low or extremely high, mainly due to the small size of the evaluation subsets. Appendix 4 shows the contingency matrices and the error analysis at different levels (Supplementary Materials, Appendix 4).
Despite the generally good performance of the classifications observed from the contingency matrices, the detailed visual analysis of the maps reveals a series of errors in several of the classifications of the different sub-regions, MODIS tiles and years. These errors were clearly visible and contrast with LULC local knowledge. Very clear examples are given in traditionally non-agricultural areas due to edaphic restrictions, such as Basaltic surface soils in Northern Campos or floodable soils of the Flooding Pampa. They are also very visible in some years with abrupt increases in the cropped area, such as 2007/2008 and 2008/2009 (Supplementary Materials, Appendix 3)
Comparison between selected maps (agricultural years 2001/2002, 2006/2007, 2012/2013, see below) and official statistics showed high levels of agreement, mainly in the crop category. The correlations of the percentage with crops in each administrative unit had an average value of 0.87, with a maximum of 0.91 and a minimum of 0.76. Correlations in PFR and A&F categories (limited to the data available in the agricultural censuses of Argentina and Uruguay) were somewhat lower, with r maximum values of 0.86 and minimum of 0.61 for PFR, and r maximum of 0, 82, and a minimum of 0.62 for A&F (Table 6).
3.3. LULC Change Analysis
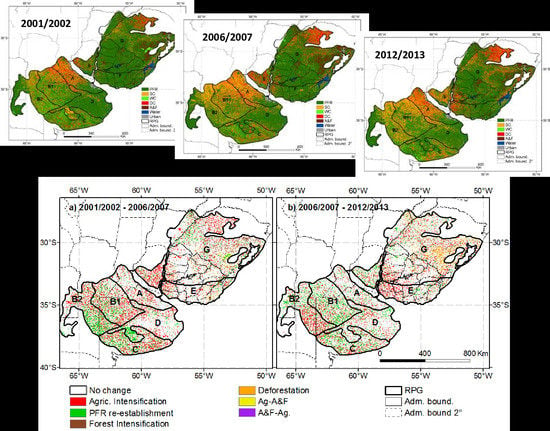
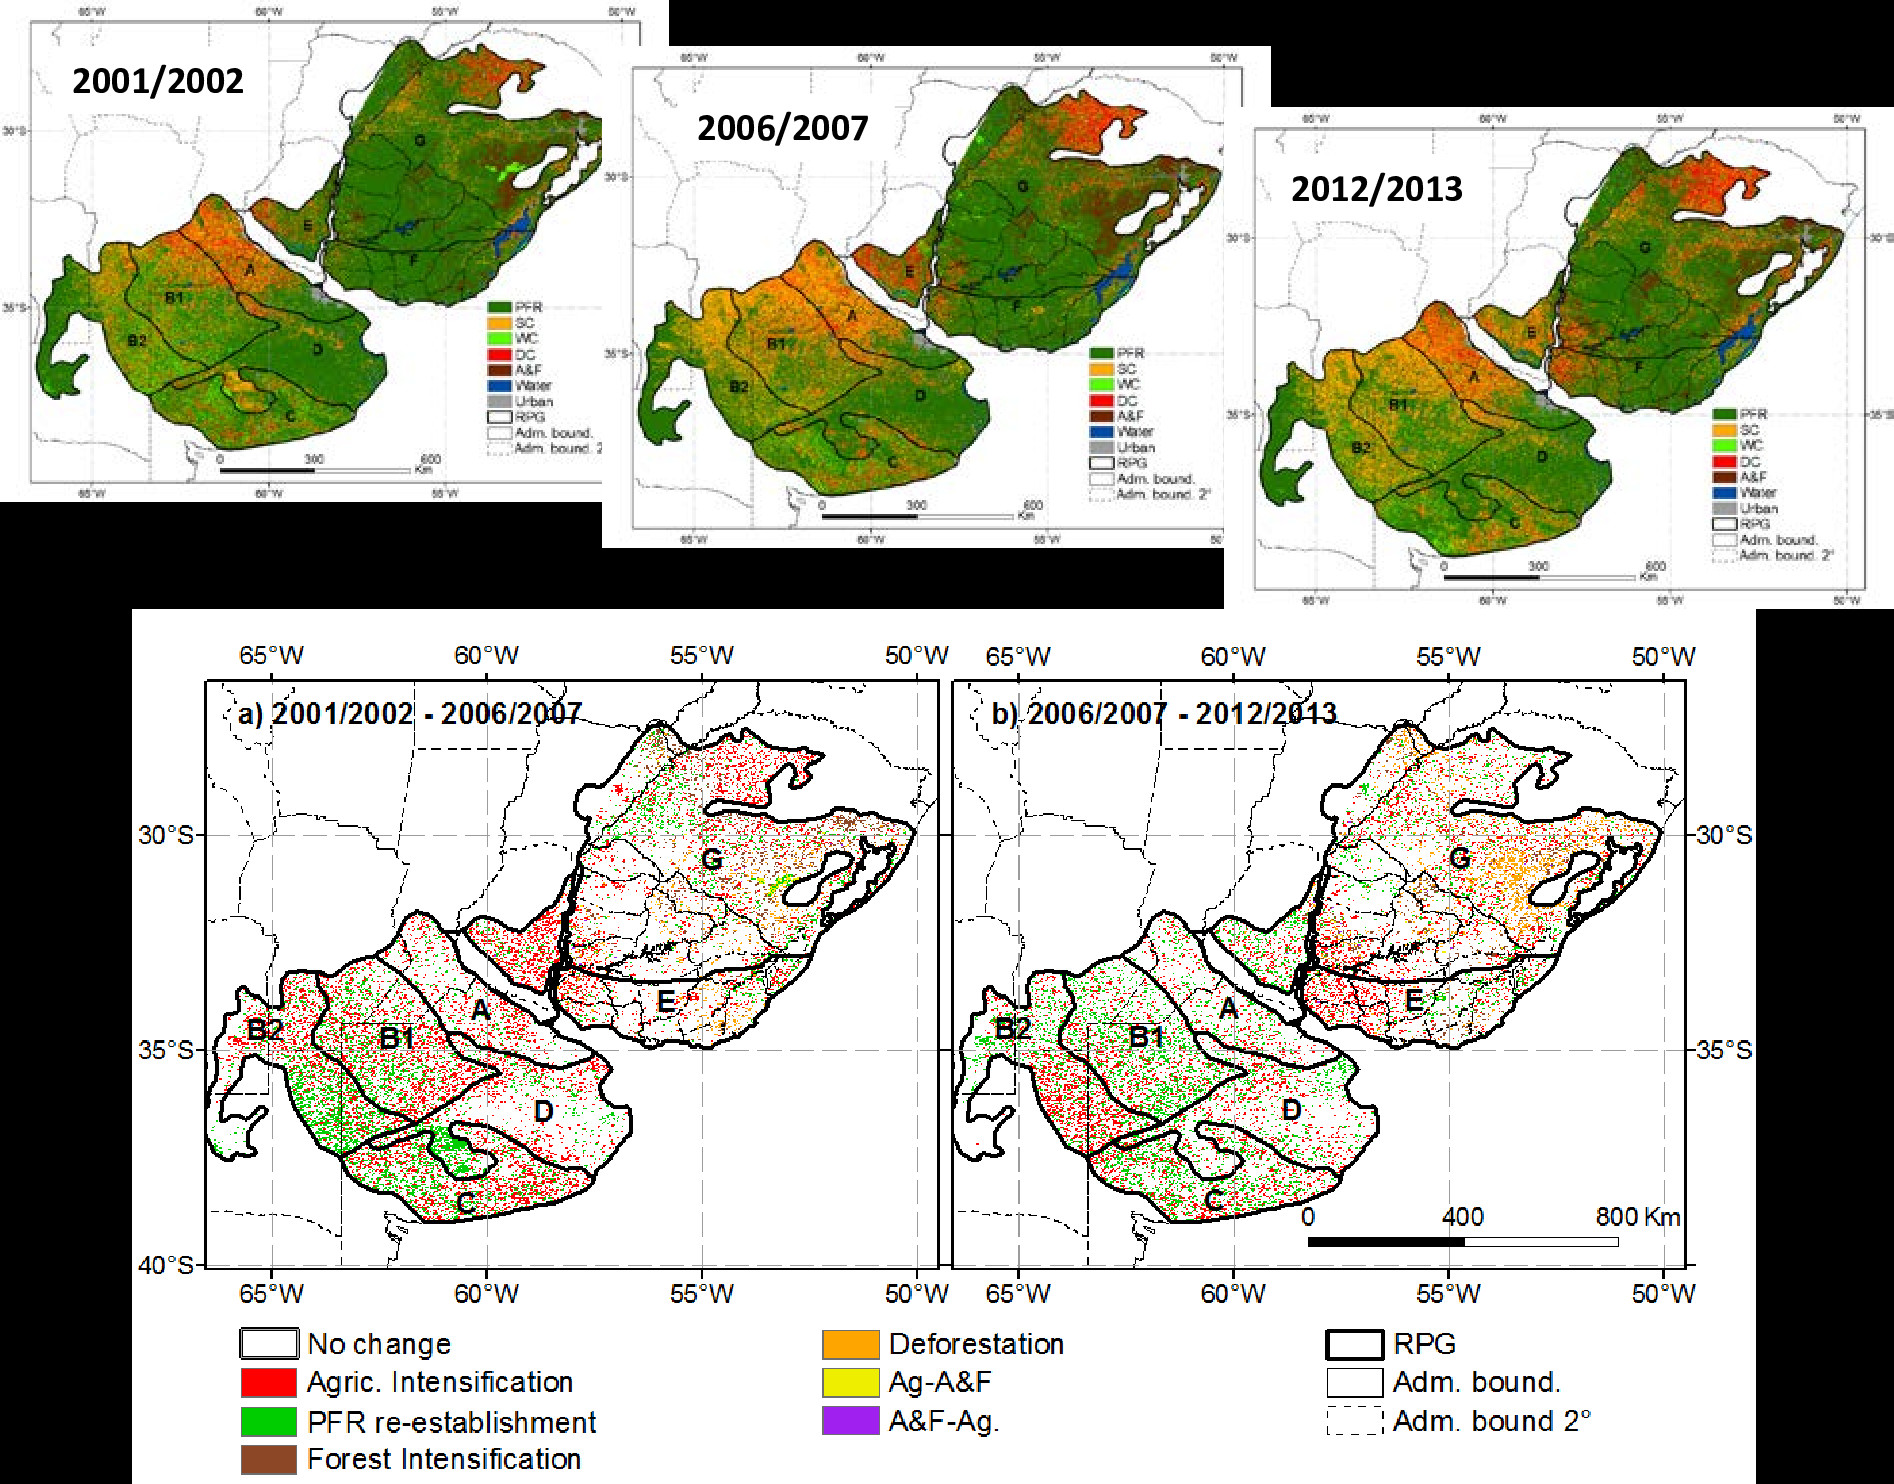
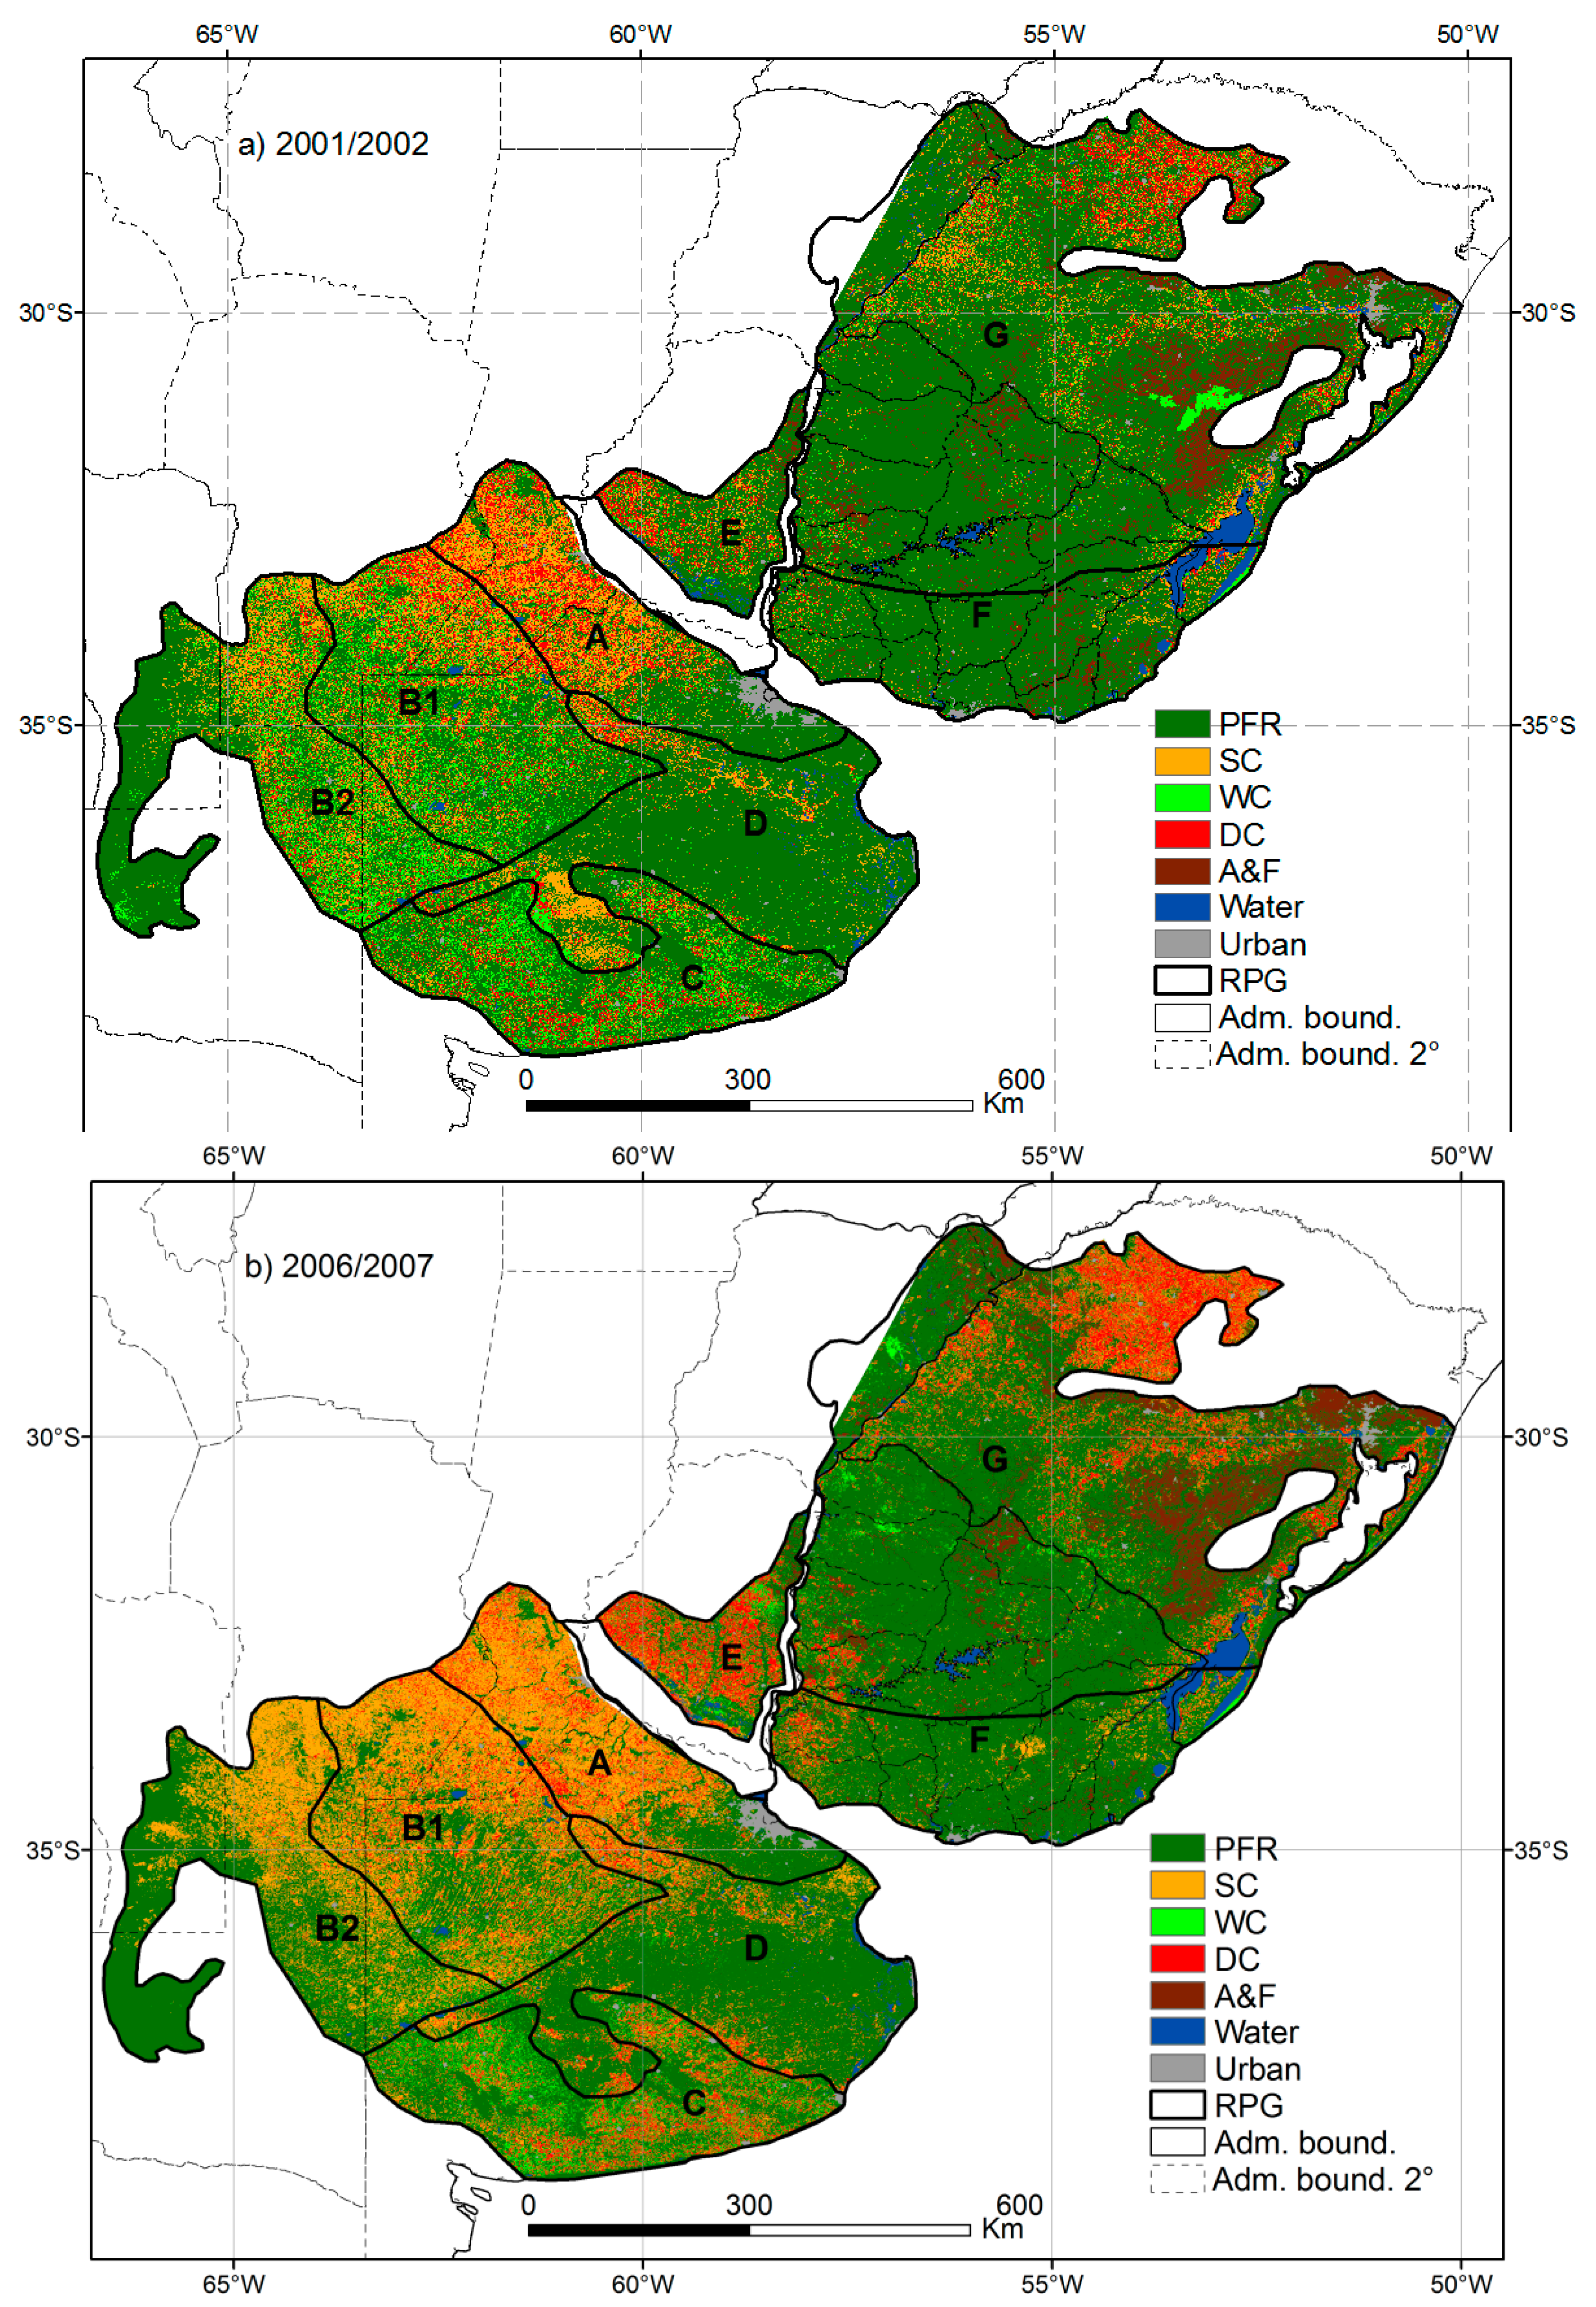
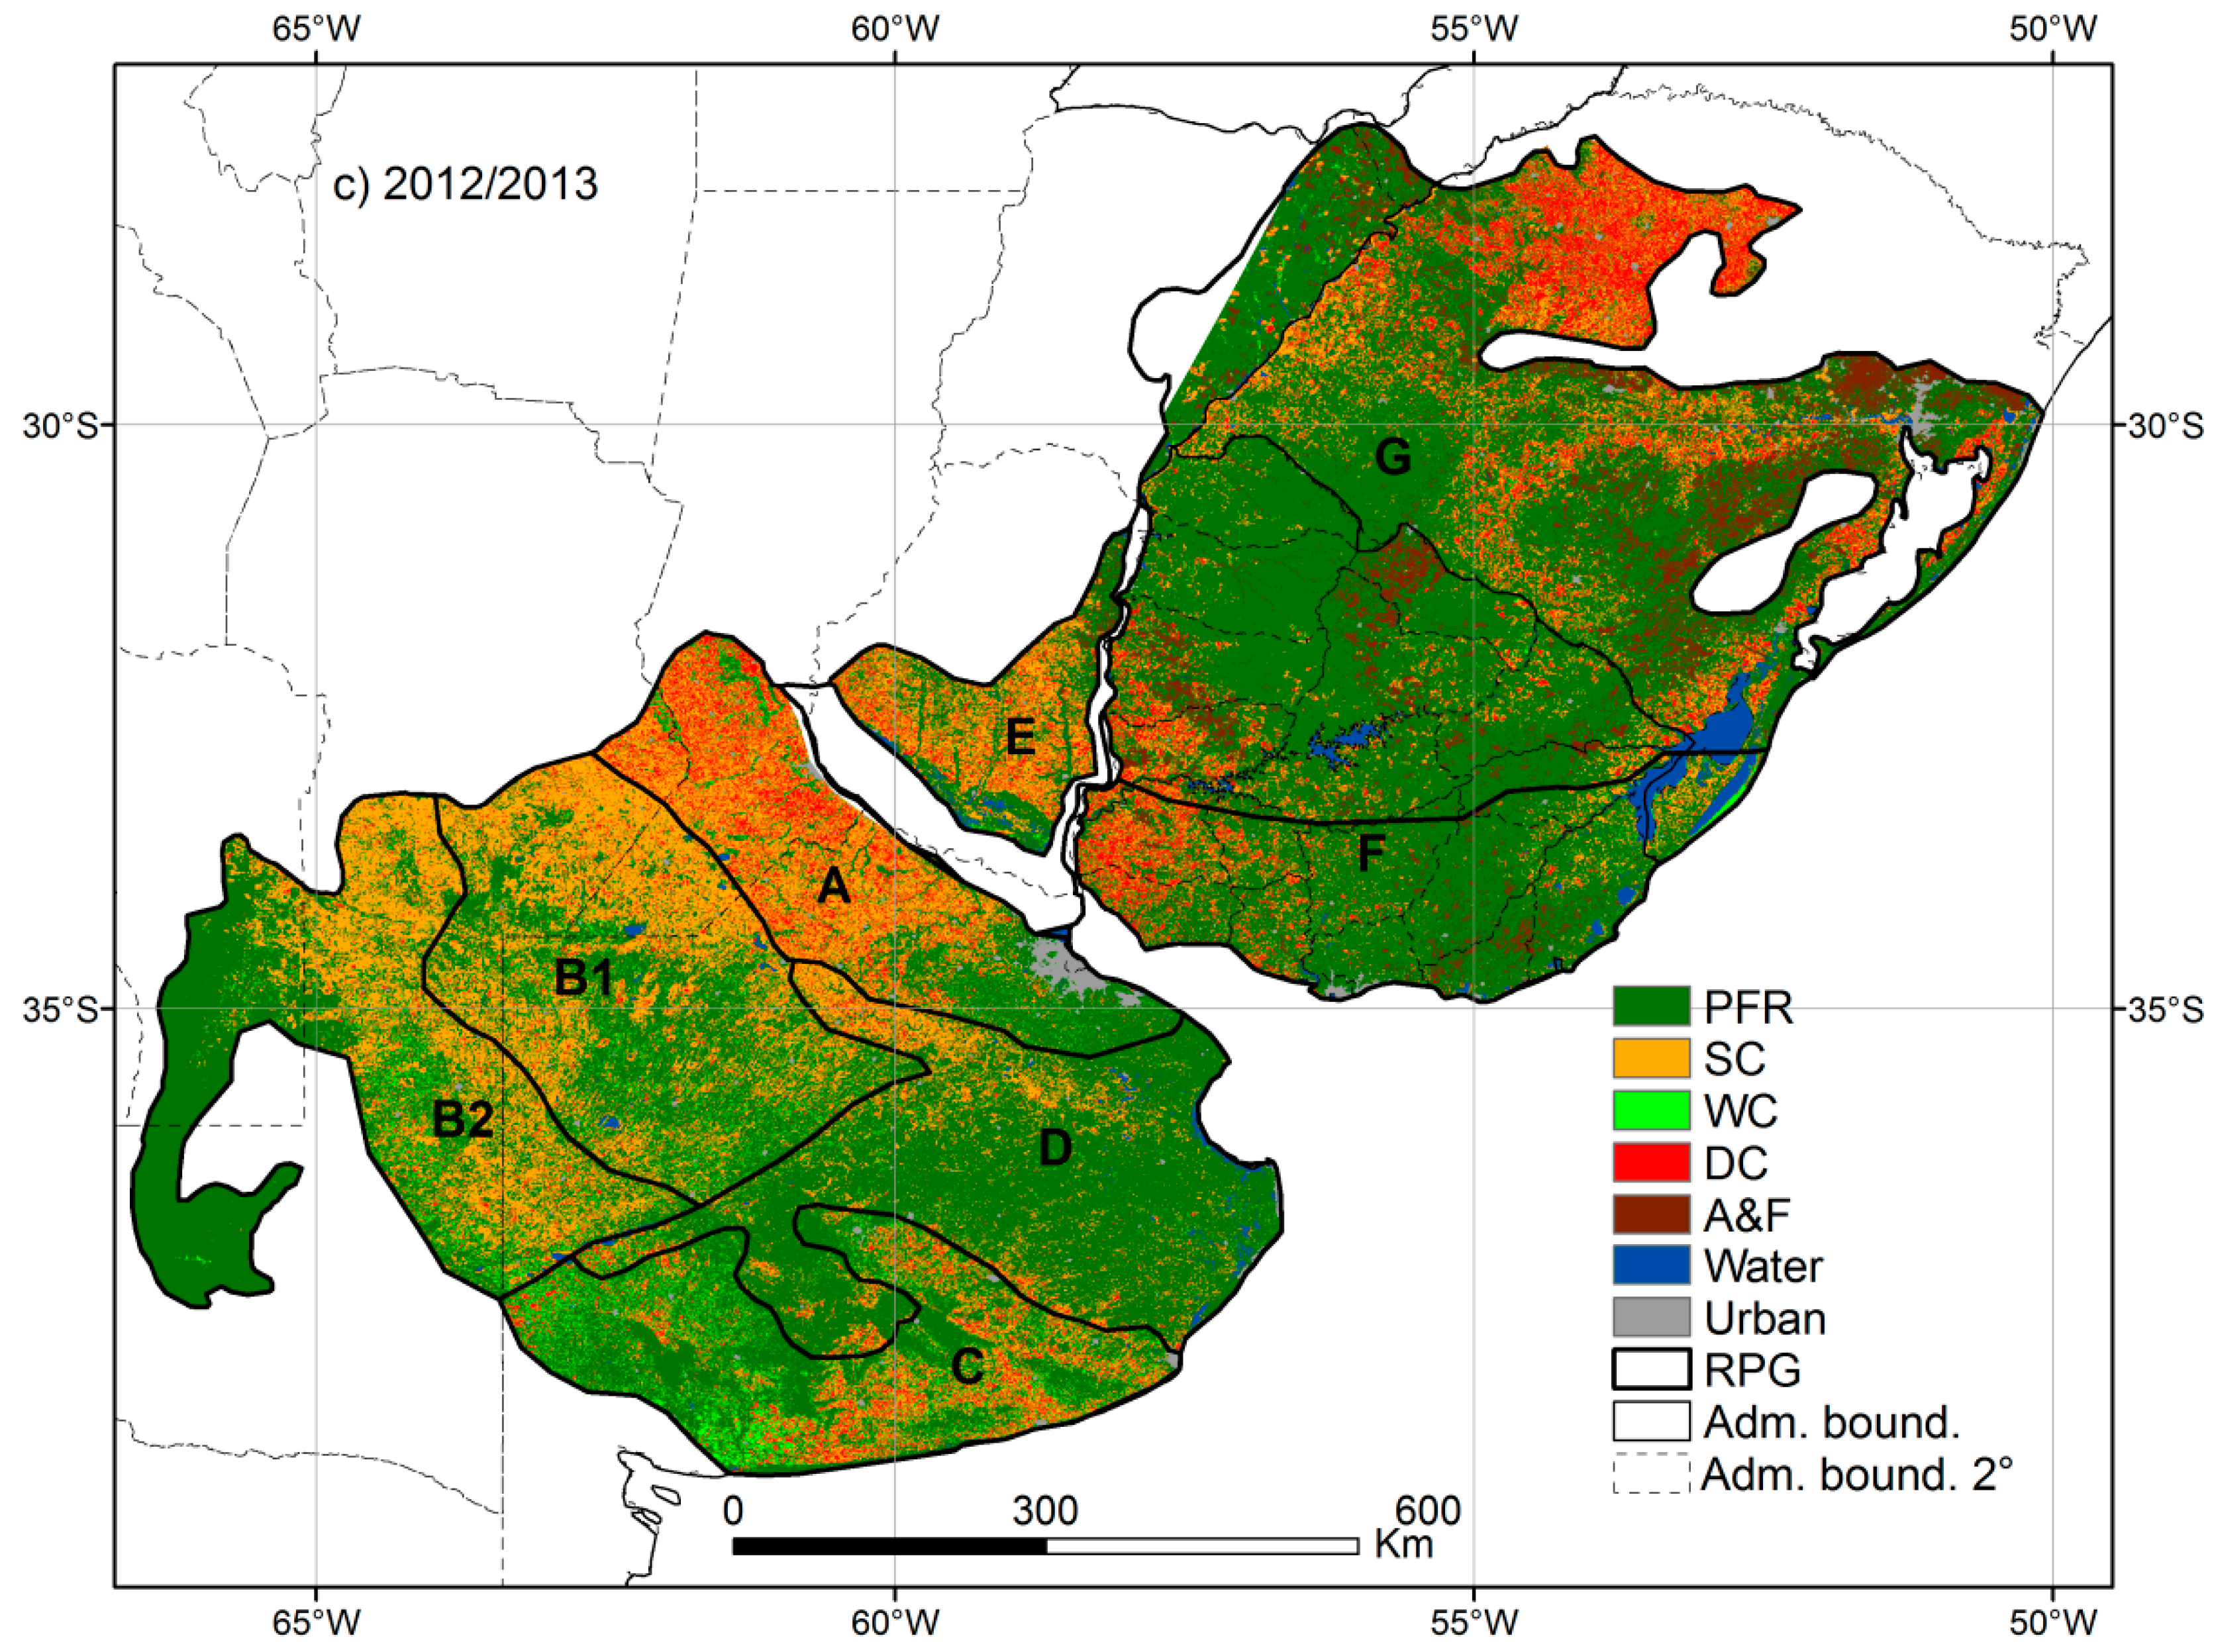
The maps selected for LULC change analysis correspond to the agricultural years 2001/2002, 2006/2007, 2012/2013 (Figure 4). The criterion for selection of the most reliable maps is based on the absence of evident errors in any of the sub-regions and/or MODIS tiles mapped; the coincidence with that reported by other authors for different portions of the study area; and the high correlation with land use official statistics of the countries involved. The 2001/2002 map retains some minor error in the northeast portion of Northern Campos and the southwest of Flooding Pampa (Figure 4a). The 2006/2007 map has some minor atypical agricultural area in the Uruguayan portion of Northern Campos (Basaltic superficial soils) and south central region of Uruguay (Figure 4b). There do not seem to be major errors in 2012/2013 map (Figure 4c).
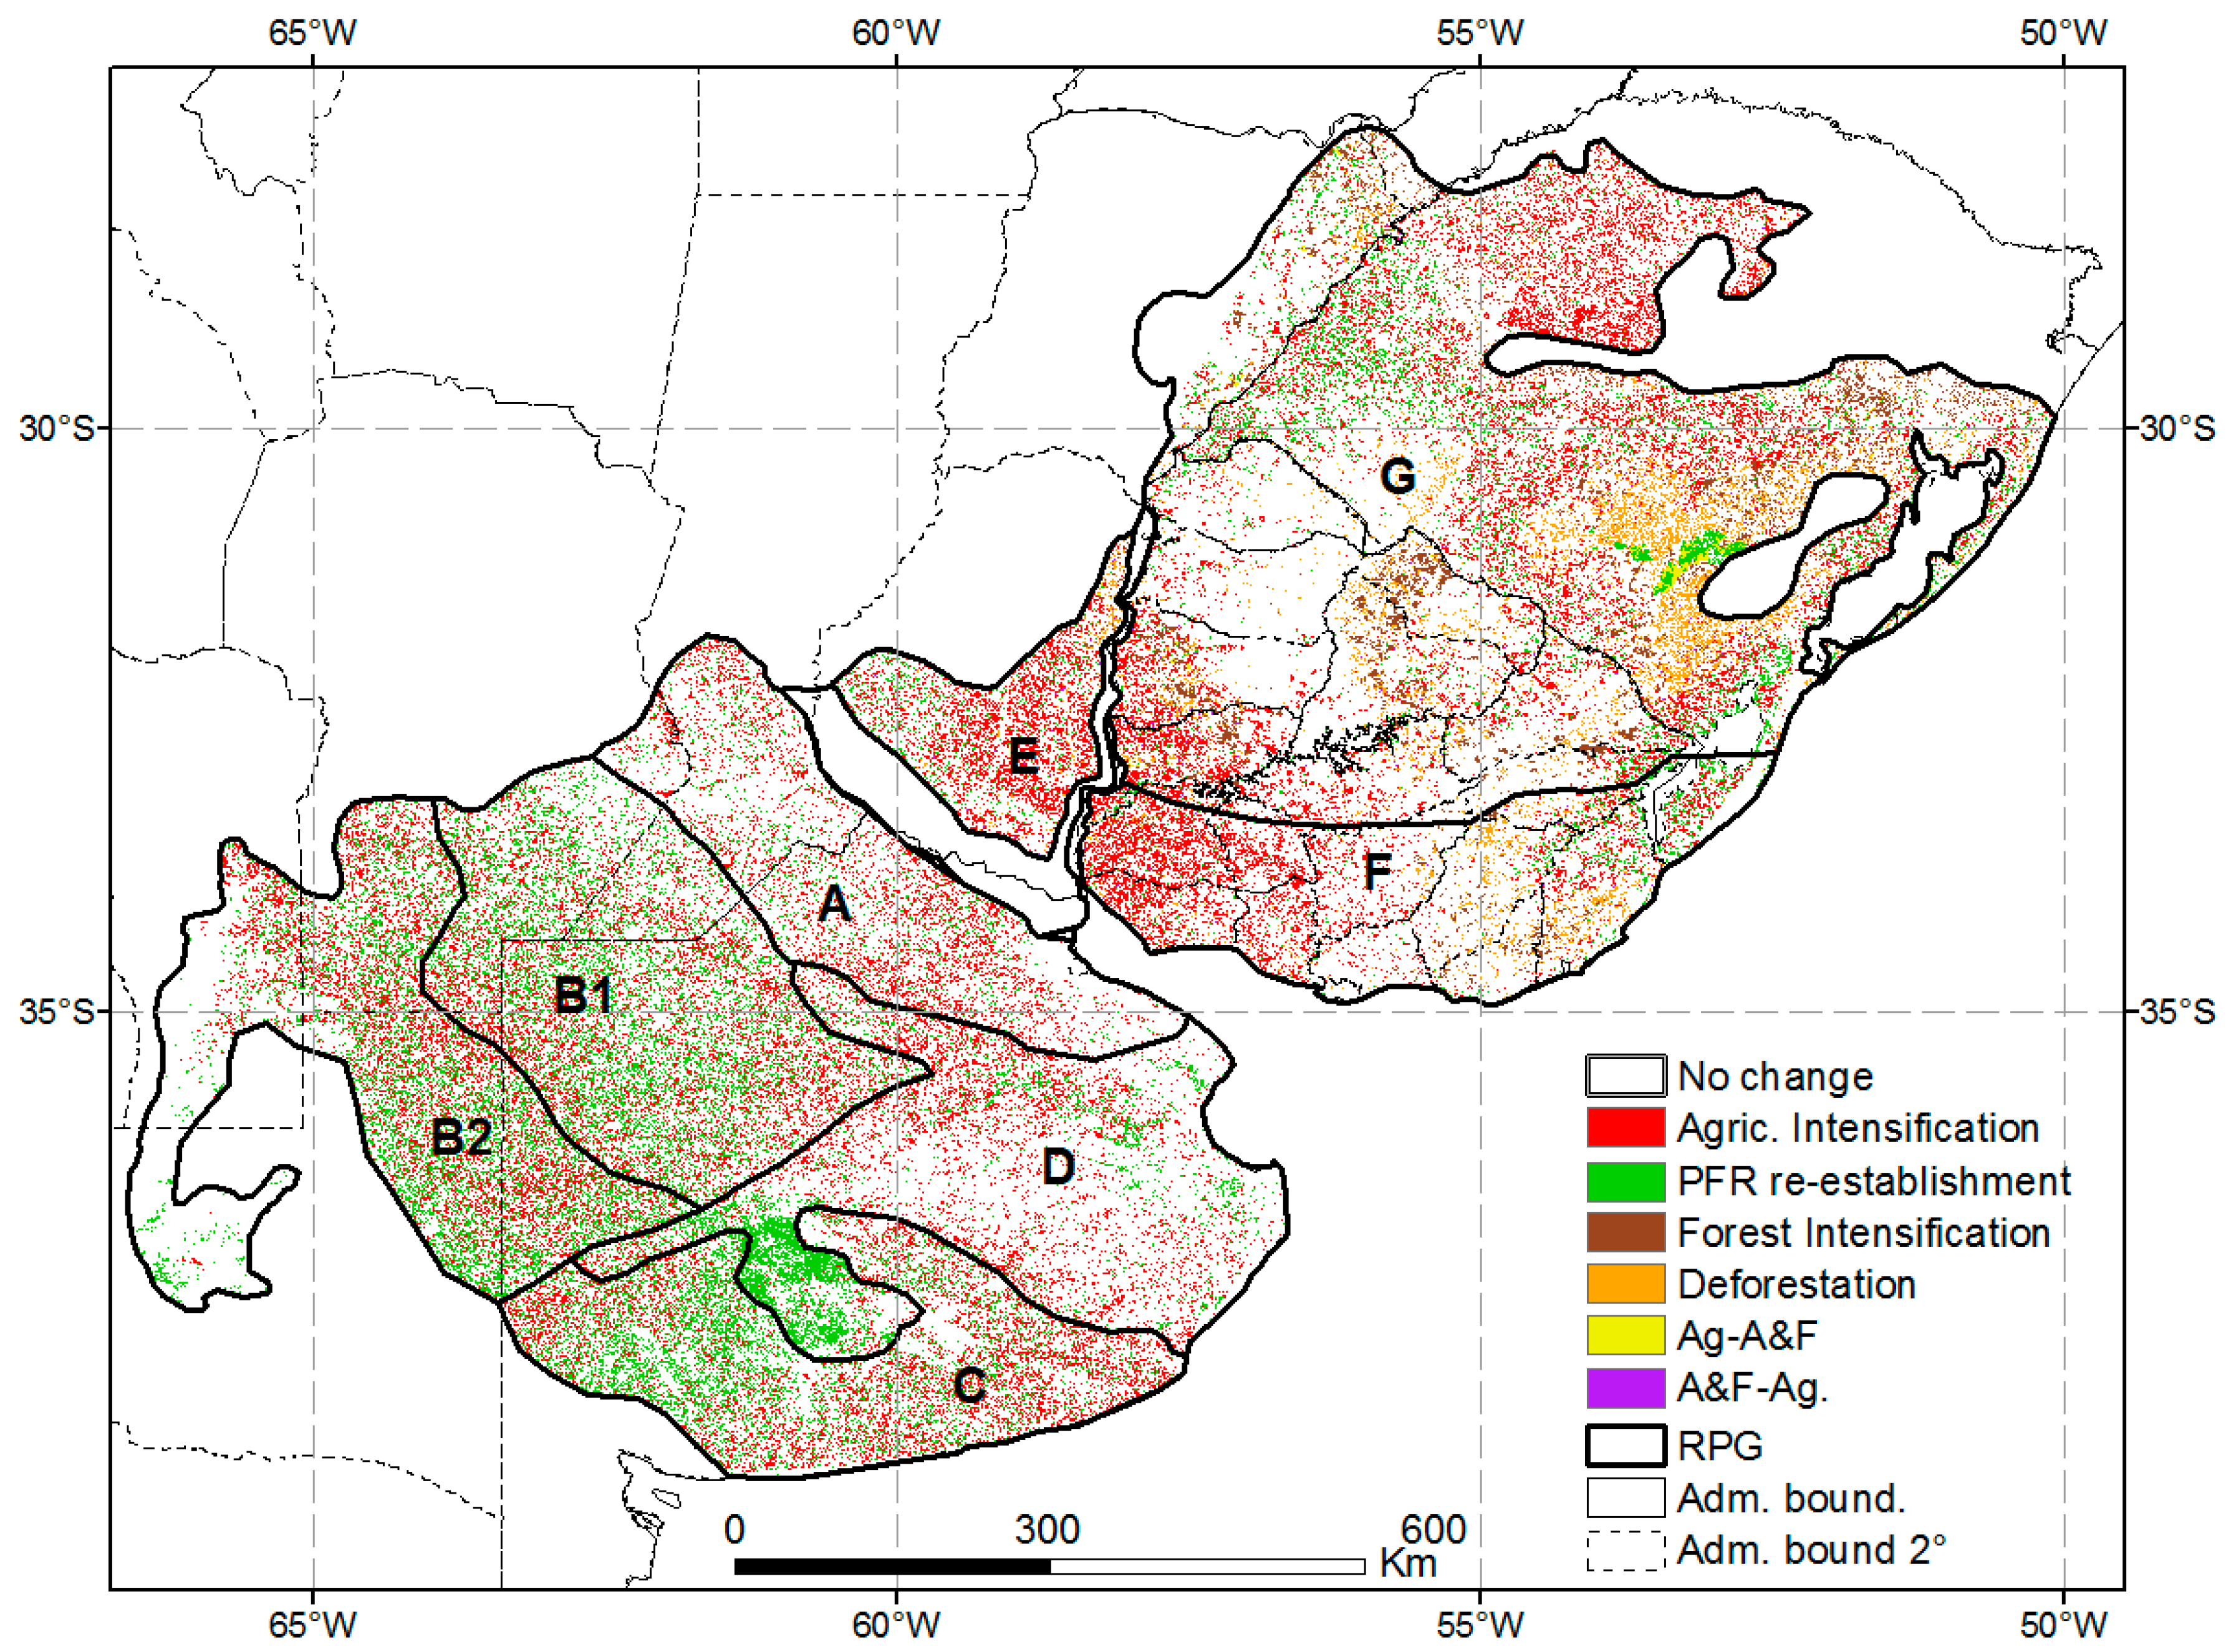
The LULC change map shows, considering the entire analyzed period (changes between 2001–2002 and 2012–2013 agricultural years), that most of the study area maintained LULC category (73.9%). The most frequent change was agricultural intensification, which occurred in 14.2% of the study area, followed by the re-establishment of PFR (8%). An important part of the re-establishment of PFR surface was associated with errors of the 2001/2002 map (see above). Forest intensification and Deforestation occupied 1.7% and 2% of the study area respectively. The other two changes analyzed, the passage of agricultural classes (Cinv, Cver and DC) to A&F and the opposite process, were very infrequent, occupying approximately 0.1% of the study area (Figure 5).
Analyzing the data by sub-region, the agricultural intensification was always the most important LULC change, with maximum values in the Mesopotamic Pampa (25.6%) and minimums in the Flooding Pampa and Northern Campos (11.8% and 11.6, % respectively). On the other hand, PFR re-establishment was important in Inland and Southern Pampas and, to a lesser extent, in the Flooding Pampa, although the greater area with this change responds to the error reported above. The net result of these two changes (Agricultural intensification minus PFR re-establishment) for the period 2001/2002 - 2012/2013 was maximum in the Mesopotamic Pampa, where represents 20.1% of the sub-region area. It was also important in Southern Campos (12%), Rolling Pampa (9.6%), and Northern Campos (7.5%) and was minimal in the Southern, Flooding and Inland Pampas (2.9%, 2%, and 1.4%, respectively).
Agricultural intensification was not homogeneous in most of the sub-regions. In Northern Campos, it was concentrated mainly in the southwest, against the coast of the Uruguay river, in the Laguna Merin basin (southeast) and in the north of the sub-region (Planalto das Missões). In Southern Campos, the process was concentrated on the littoral of the Uruguay River and the western portion of Uruguay south central region and, to a lesser extent, in the Laguna Merin basin. In the Mesopotamic Pampa, agricultural intensification was concentrated in the eastern half of the sub-region, again on the Uruguay River littoral. In the rest of the Pampa, agricultural intensification process was more dispersed, although with important areas in the union between the Flat Inland Pampa and West Inland Pampa, in the southwest of Rolling Pampa and, to a lesser extent, in the north of Flooding Pampa (Figure 5).
The largest expansion of A&F occurred on the Northern Campos (Change from PFR to A&F: 4%) mainly in forestry foci in Northeast and west Uruguay, and to a lesser extent, in the northeast of Northern Campos, in Rio Grande do Sul. Forest intensification in the Mesopotamic Pampa was minimal (0.7%) and concentrated in the northern portion. In Southern Campos, forest intensification occupied 1.7% of the surface and was concentrated over “Sierras del Este” region in southeastern Uruguay. The change in the opposite direction (from A&F to PFR) was also maximum in Northern Campos del Norte and was mainly concentrated in the southeast of Rio Grande do Sul (“Sierras del Sudeste” micro region), apparently associated with deforestation of native forest, and to a lesser extent, in the forestry foci of the Northeast and West of Uruguay, associated with harvest of forest plantations
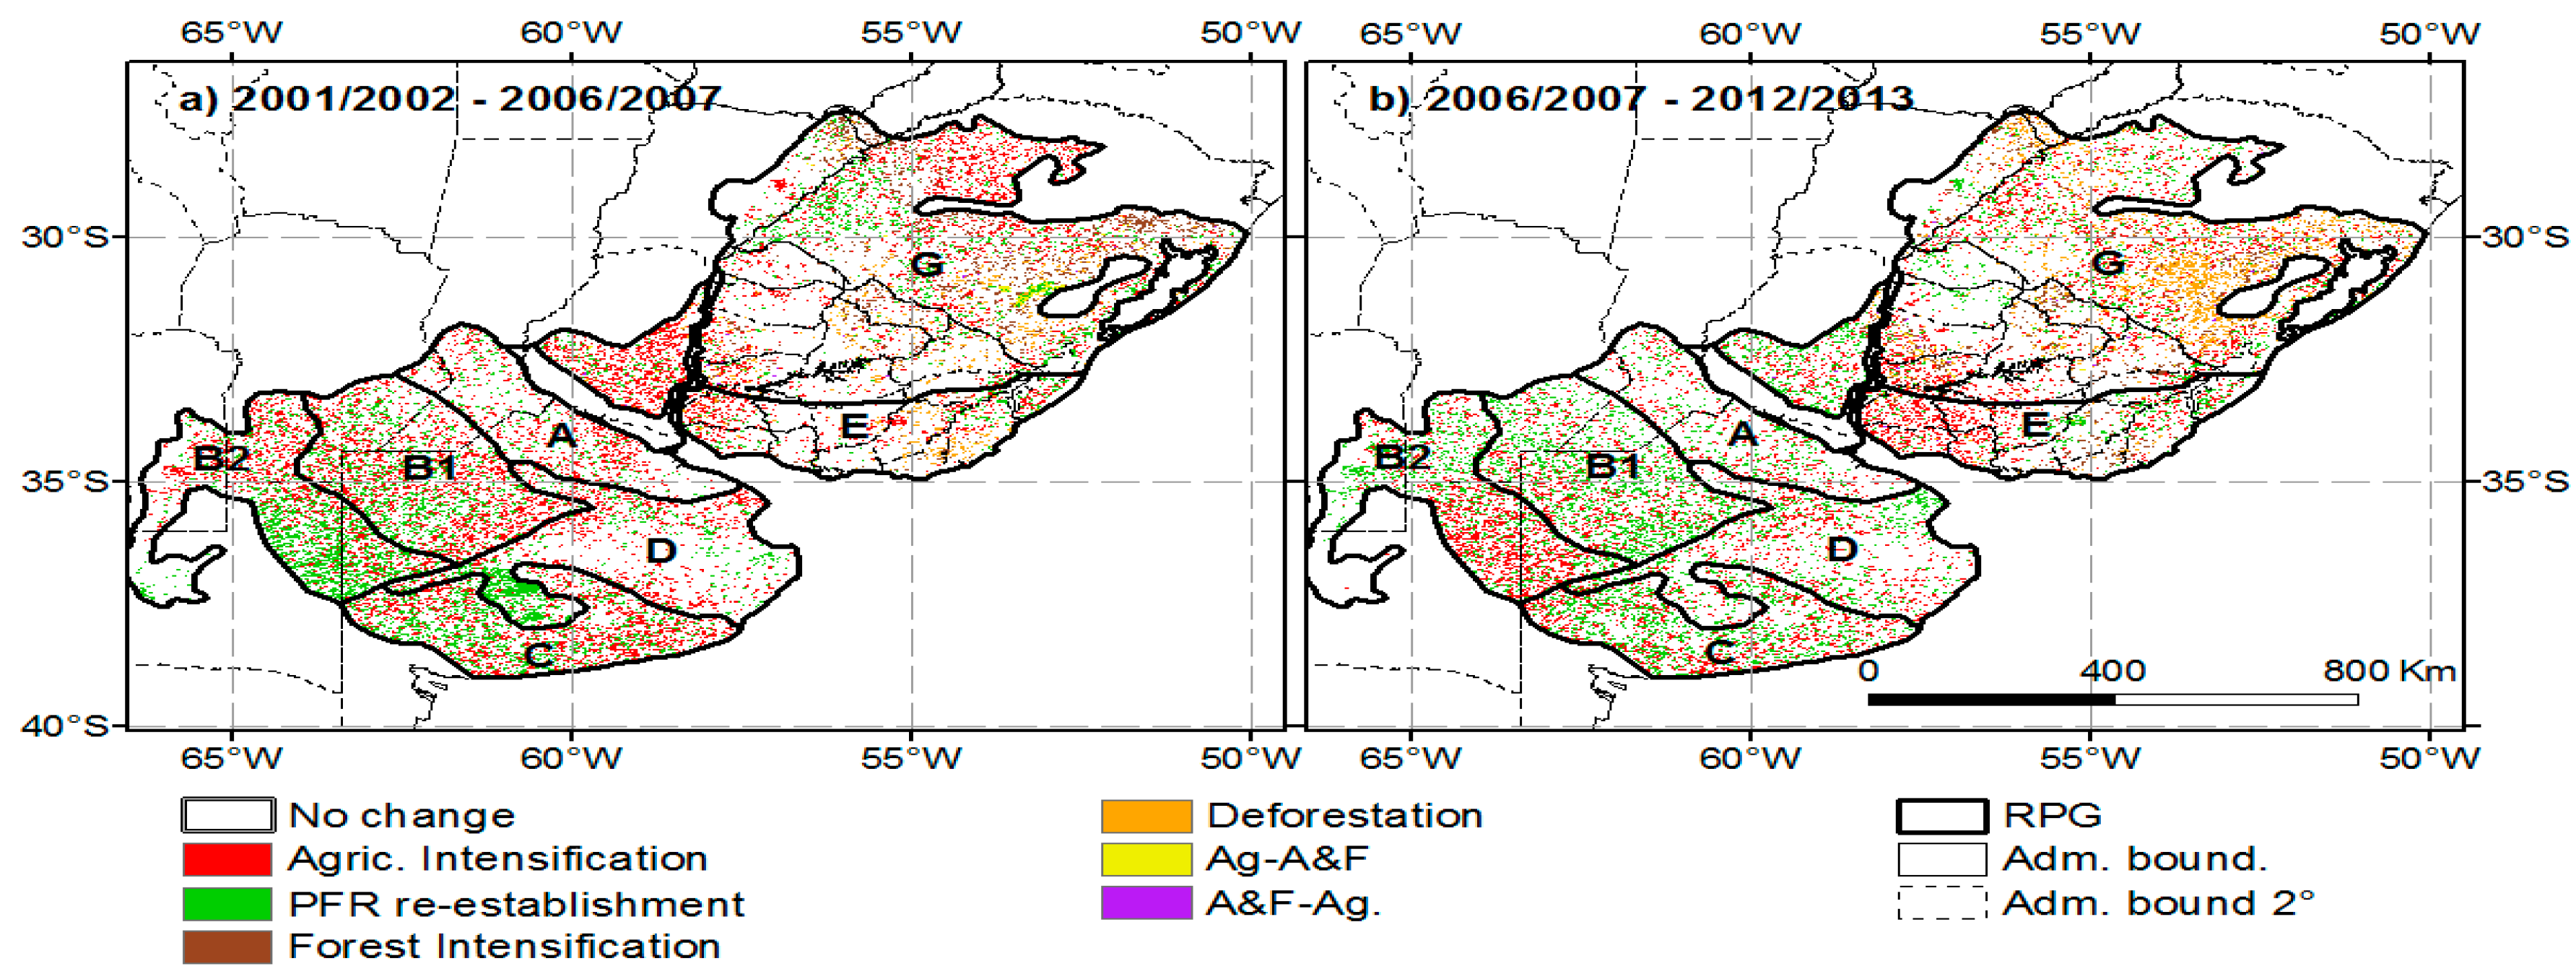
The analysis of LULC change maps in two periods (2001/2002–2006/2007 and 2006/2007–2012/2013) shows that these changes were not homogeneous in time either. In the period 2001/2002–2006/2007, agricultural intensification was concentrated in the Mesopotamic Pampa and the littoral of the Uruguay River (Southern and Northern Campos), in the northern portion of Northern Campos, in Flat Inland Pampa Flat and in the Southern Pampa. By contrast, in the period 2006/2007–2012/2013, large agricultural intensification foci shifts, occurring mainly in the west, southwest and south central Uruguay, losing relevance the Mesopotamic Pampa; and in the Inland Pampa, moving towards the West Inland Pampa and losing relevance the Flat Inland Pampa. On the other hand, the large A&F area losses of the Southeast of Rio Grande do Sul, are concentrated in 2006/2007–2012/2013 period (Figure 6).
Analysis of the relative change in the area covered by the different categories between two time periods yields similar and complementary results. Between 2001/2002 and 2012/2013, the cultivated area (WC, SC, and DC) had the highest relative change in all analyzed sub-regions, except in the Rolling Pampa where the biggest change was the decline of PFR. Cropped area had a maximum relative change in the Southern Campos, where it increased by 147.4%, and a minimum relative change in the Inland Pampa, where it increased by 3.2%. The other sub-regions with major cropped area relative changes were Mesopotamic Pampa and Northern Campos, registering increases of 67.9% and 49% respectively. In all cases, the cropped area relative changes s were more important in 2001/2002–2006/2007 than in 2006/2007–2012/2013, with some sub-regions even registering a decrease in the crop area in the second half of the time series. Increased crop surface occurred at the expense of decreasing the PFR surface, that was maximum in the Mesopotamic Pampa (–29.8%) and minimum in the Inland and Flooding Pampas (–2.6%) (Table 7).
4. Discussion
This paper presents the first spatially continuous regional LULC description of the Rio de la Plata Grasslands (RPG), one of the largest grassland areas in the world. The maps also cover, with an annual temporal resolution, a period of 14 years with intense LULC transformations. Additionally, our work provides a methodological alternative for the continuous description of LULC, relatively fast and with low cost, over large areas and with high periodicity. The products generated were based on an extensive LULC field database, avoiding errors derived from visual interpretations made by different technicians. The global accuracy of the maps as well as the low and similar values of the omission and commission errors indicates a low level of sub and overestimation of the different class coverage.
The spatial scale of the analysis is halfway between global and continental scale LULC descriptions and local maps, allowing the evaluation of results not only from contingency matrices, but also by expert knowledge. The maps generated cover more than 800,000 km2 providing a simple but complete description of the RPG LULC, a region with a great agricultural expansion in recent years. The overall accuracy achieved when pooling all the evaluation data (≈95%) is much higher than that reported at continental [18,20,39,40] or global scales [36,37,38]; furthermore, most of the evaluations carried out for the different combinations of RPG sub-region, MODIS tile, year and agricultural campaign, presents global accuracy values comparable or higher to the aforementioned works.
The results showed that an evaluation of the classification products based exclusively on contingency matrices overvalue the quality of the results. A visual expert evaluation of the resulting spatial patterns and of the temporal inconsistencies of LULC dynamics allows one to identify additional faults in the classification process. Most of these failures come from non-controllable errors, mainly due to the classification of the study area in climatically very different years from those used to train/evaluate the classifications, and/or, to the accumulation of errors in the MODIS NDVI time series. This highlights the risks of lacking local knowledge and expertise when generating LULC classifications. This may be particularly critical for continental or global descriptions
4.1. The Rio de la Plata Grasslands LULC Patterns and Its Changes over Time: The New Wave of Agriculturization
Our results showed not only the distribution of the agricultural foci of the region but also its recent dynamics. Natural grasslands have been almost completely displaced in the Rolling Pampa, the Southern Pampa and the Inland Pampa. These agricultural foci, associated with soils of good fertility and few edaphic restrictions, have a relatively long history of use in Rolling and Southern Pampas that goes back to the end of the 19th century [47]. In the Inland Pampa the agriculturization process is more recent and would be concentrated at the end of the 20th and the beginning of the 21st century [34,56]. These changes in the Inland Pampa together with the important expansion of the annual crops in the Mesopotamic Pampas represent a new wave of agriculturization registered in the Argentine Pampas in recent years [21,34,56]. Our results underline this trend, clearly showing that agricultural is still expanding.
In Uruguay, agricultural expansion is clearly visible in west, the center-south and some portions of the east and northwest of the country. In Uruguay is also evident another LULC change process: the increase of commercial tree plantations. Although this process is not reflected at the RPG sub regions scale, a detailed observation shows the expansion of three afforestation foci, one in the northwest of Uruguay (Tacuarembó and Rivera departments), another in the coast of the Uruguay River (Rio Negro and Paysandú), and another in Sierras del Este region. The expansion of forestry is associated with political and economic incentives and the installation of the cellulose industrial complex in Uruguay [25,28,34,51].
In the Brazilian portion of the study area there are practically no studies on LULC change [22] (but see [57]). The main agricultural foci are located in the northern portion of the study area in the geomorphologic region of Planalto das Missões; in the central “gauya” depression (Depressions of the Ibiuí and Jacui rivers) and the alluvial-colluvial plains of the great rivers; and in the plains of the De los Patos and Merin lagoons. Our maps showed a sustained increase of agricultural areas in these regions, and, then, an important loss of natural grasslands in Rio Grande do Sul [41,58]. Recent work developed by Mapbiomas.org shows similar trends, with almost 40% of the Brazilian portion of the RPG under agriculture and an increase in cultivated area of 7500 Km2 in the period 2000–2014 [43].
Agricultural expansion process involved both an increase in the area planted in traditional agricultural foci as well as the expansion of croplands into new areas formerly cover by native grasslands. This trend, already reported by Baldi & Paruelo [34] for the Argentine Pampas, is a common process to the three countries involved in Rio de la Plata Grasslands. Natural grasslands losses are probably higher than those reported in this article, since much PFR area is occupied by sown pastures integrated into agricultural rotation cycles, mainly in the traditional agricultural areas.
In most of the RPG, agriculture expanded at higher rate in the first half of the studied period (2001/2002–2006/2007) and slowed down in the second half. Graesser et al. [20] also report higher LULC change rates in the 2001–2007 than in the 2007–2013 period, attributing these differences to a global economic stagnation and its impact on agro-export economies. Volante et al. [21], also report a similar agricultural area spatial distribution, as well as a very important increase in cultivated area between 2000/01 and 2010/11.
Two other patterns are evident: the increase in the relative importance of summer crops and the intensification of agricultural production. SC expansion responds, both, to the increase in the planted area and to a winter crops retraction in practically all RPG sub-regions. Intensification results from an increase in the area covered by double crop systems. Similar results are found by Volante et al. [21] in part of the study region during the 2000–2010 period, reporting growth of 62% and 17% in Argentina and 711% and 528% in Uruguay, for summer crops and double crops, respectively.
4.2. Scope of the Approach: Advantages and Limitations
The used approach reveals a series of advantages over other approaches for LULC description, but also a number of intrinsic limitations. Spatial segmentation (classifications by RPG sub-regions) reduces LULC categories intra-class variation due to the reduction of variation in environmental conditions (precipitation, temperature, soil characteristics) and more homogeneous management conditions and cultural practices. On the contrary, sub-region classifications imply that the poor performance of the classification in a particular agricultural year and region, limits the use of that year’s map for the entire region in LULC change analysis. This strategy of mapping smaller portions of a study area and subsequently joining them has already been used successfully in other works in Latin America [18,20].
In temporal terms, classifications by agricultural campaign make it possible to discriminate between the crop cycles (winter, summer, double crop), providing information on the inter-annual temporal variation of carbon gains. For example, PFR substitution by agricultural crops implemented in a single season (summer or winter) reduces radiation interception (i.e., the entry of carbon into ecosystems) [32,59] and drastically modify its seasonality [32,60,61]. These changes in LULC also modify the albedo [62], the partition of the net radiation between latent and sensible heat [63], or the partition of the available water between evapotranspiration and runoff [64], being able to affect the climate at different spatial and temporal scales [65,66]. The generated maps are an important input to understand the RPG carbon balance and/or, modeling the effect of LULC changes on different interactions between the surface and the atmosphere.
We detected a series of problems that appear when trying to map large regions such as RPG and for a so long period, from vegetation phenological behavior, using a spatial and temporal incomplete “Phenological Library”. In spatial terms, involves to assume that the classes mapped in those portions of the territory without field data, behave similarly as in those places where there were. Given the segmentation of the study area into sub-regions with similar edaphic, climate and management characteristics, these risks are minimized.
In temporal terms, the absence of LULC field data in many of the classified years implies the assumption that the temporal behavior (i.e., the phenological signature) of the different categories will be similar to the behavior detected in years for which there are field data. Since the decision rules for the assignment of a pixel to a LULC comes from the structure of the training data, this assumption can lead to “uncontrollable” errors that are caused mainly by two factors. The first type of error comes from generating LULC classifications in years climatically very different from those used to generate spectral signatures and train the decision trees. This is probably what happens with 2007/2008 and 2008/2009 maps (Supplementary Materials, Appendix 3), due to the intense drought that has occurred in much of the region since late 2007, 2008, and early 2009 [67,68] The high sensitivity of this kind of approach to climate variations, has already been reported in other studies [18,38,69]. For example, Hüttich et al. [69], in semi-arid savannas of Namibia, founded that annual changes in precipitation affect the classification results, especially in the more dynamic classes such as grasslands, mainly when the precipitation exceeds 500 mm/year. Probably in sub-humid grassland systems like the one analyzed in this work, the opposite happens and the problems appear when the precipitation falls below a certain threshold.
The second factor that causes important “uncontrollable” errors appears due to problems of NDVI time series, not corrected during the filtering and interpolation process. The clearest example is that of Southern Campos and several of the Pampa sub-regions, mainly Flooding Pampa, on the 2013/2014 maps. Errors occur primarily in summer campaign classifications, with a very large number of pixels with missing values during February 2014, probably due to an accumulation of rainy and cloudy days. Several works with similar approaches (see for example: [21,69,70]) used vegetation indices time series depurated with an accessory system such as TIMESAT to reduce these problems. However, Clark et al. [70] report some questions for the use of these approaches with LULC categories without a clear seasonality and for the possible data losses due to high cloud presence. These two types of “uncontrollable” errors are in fact, controllable with an adequate data capture program that ensures the spatial and temporal consistency of the Phenological Library.
The significant presence of “uncontrollable” errors in several of the years and/or RPG sub-regions, the possibility of pixels covering more than one LULC category due MODIS images spatial resolution and the intrinsic error of the classification process, generate significant instability in the LULC maps time series. This limits the possibility of analyzing the LULC change on an annual basis, enabling only the analysis of large trends.
Despite the reported errors and the instability of the LULC change trends, the technique used and the maps of the selected periods provide a good description of the LULC patterns in the RPG and their changes over time. These maps have a high degree of concordance with reported by other authors and with official statistics of the different countries involved. The changes occurred in RPG have very important implications in many ecosystem processes, for example: changes in stocks and flows of C, N, P, and water; changes in energy flow; or environmental impacts (soil erosion, greenhouse gas emissions, water pollution, etc.). The maps generated in this work will make it possible to model these processes at much finer scales than those performed to date.
5. Conclusions
The methodological approach developed allowed to describe, relatively quickly and at a low cost, the LULC of the entire Rio de la Plata grassland biome and analyze the processes of LULC change occurred during the first 14 years of the 21st century. The RPG are immersed in a strong process of land use change, mainly due to the advance of the agricultural frontier and at the expense of loss of grassland areas (natural or implanted). Despite this, the PFR continue to be the dominant LULC category, covering 60% of the entire area at the end of the analyzed period, mainly due to the strong dominance of this category in the Northern Campos, Southern Campos, and Flooding Pampa sub-regions.
The agricultural area increased 23% in the period, adding over than 50,000 Km2 of new crops. Most agricultural expansion, and therefore the greatest losses of grassland, concentrates on both sides of Uruguay river (Mesopotamic Pampa and the western portion of Southern and Northern Campos) and de western portion of Inland Pampa.
Our results show a number of problems encountered when trying to map large regions such as RPG and for a long period of time, from the phenological behavior of the vegetation cover, mainly caused by two factors: 1) LULC classifications generated in years climate very different from those used to generate spectral signatures and train decision trees, and 2) the use of NDVI time series with uncorrected errors during the filtering and interpolation process. To minimize these problems, continuous LULC survey programs should be developed in order to achieve a more complete “Phenological Library” in spatial and temporal terms.
The generated maps open the door for more detailed and spatially explicit modeling of many important aspects of ecosystem functioning, for quantification in the provision of ecosystem services and for more efficient management of natural resources.
Supplementary Materials
The following are available online at https://www.mdpi.com/2072-4292/12/3/381/s1. Appendix 1: Comparison of classifications results with official statistics of the involved countries. Appendix 2: Decision trees used in the classification process. Appendix 3: Annual Land Use/Land Cover (LULC) maps of Rio de la Plata Grasslands. Appendix 4: Contingency matrices, overall accuracy and commission - omission errors distribution.
Author Contributions
S.B. and J.M.P. conceived, designed, performed, and wrote this study. All authors have read and agreed to the published version of the manuscript.
Funding
This research was supported on doctoral fellowships for ANII and CAP UdelaR, Uruguay (Baeza); by a grant from the Inter-American Institute for Global Change Research (IAI) CRN3095 which is supported by the US National Science Foundation (Grant GEO-1128040); by FONCYT, CONICET and UBACYT (Argentina) and by ANII INNOVAGRO projects FSA_PI_2018_1_149022 and FSA_PI_2018_1_148811.
Acknowledgments
The authors would like to thank Priscilla Pinto, Pablo Baldassini and Camilo Bagnato for their help with the C5 software. We thank Rocksy Zhang and three anonymous reviewers for their support and comments.
Conflicts of Interest
The authors declare no conflict of interest.
References
- Sanderson, E.W.; Jaiteh, M.; Levy, M.A.; Redford, K.H.; Wannebo, A.V.; Woolmer, G. The human footprint and the last of the wild. BioScience 2002, 31, 891–904. [Google Scholar] [CrossRef]
- Tilman, D.; Fargione, J.; Wolff, B.; D’Antonio, C.; Dobson, A.; Howarth, R.; Schindler, D.; Schlesinger, W.H.; Simberloff, D.; Swackhamer, D. Forecasting agriculturally driven global environmental change. Science 2001, 292, 281–284. [Google Scholar] [CrossRef] [PubMed] [Green Version]
- Ramankutty, N.; Evan, A.T.; Monfreda, C.; Foley, J.A. Farming the planet: 1. Geographic distribution of global agricultural lands in the year 2000. Glob. Biogeochem. Cycles 2008, 22. [Google Scholar] [CrossRef]
- Monfreda, C.; Ramankutty, N.; Foley, J.A. Farming the planet: 2. Geographic distribution of crop areas, yields, physiological types, and net primary production in the year 2000. Glob. Biogeochem. Cycles 2008, 22. [Google Scholar] [CrossRef]
- Lambin, E.F.; Geist, H.J.; Lepers, E. Dynamics of land-use and land-cover change in tropical regions. Annu. Rev. Environ. Resour. 2003, 28, 205–241. [Google Scholar] [CrossRef] [Green Version]
- Song, X.P.; Hansen, M.C.; Stehman, S.V.; Potapov, P.V.; Tyukavina, A.; Vermote, E.F.; Townshend, J.R. Global land change from 1982 to 2016. Nature 2018, 560, 639–643. [Google Scholar] [CrossRef]
- Curtis, P.G.; Slay, C.M.; Harris, N.L.; Tyukavina, A.; Hansen, M.C. Classifying drivers of global forest loss. Science 2018, 361, 1108–1111. [Google Scholar] [CrossRef]
- Paudel, B.; Zhang, Y.; Yan, J.; Rai, R.; Li, L. Farmers’ perceptions of agricultural land use changes in Nepal and their major drivers. J. Environ. Manag. 2019, 235, 432–441. [Google Scholar] [CrossRef]
- Sala, O.E.; Chapin III, F.S.; Armesto, J.J.; Berlow, E.; Bloomfield, J.; Dirzo, R.; Huber-Sanwald, E.; Huenneke, L.F.; Jackson, R.B.; Kinzig, A.; et al. Global Biodiversity Scenarios for the Year 2100. Science 2000, 5459, 1770–1774. [Google Scholar] [CrossRef]
- Pimm, S.L.; Raven, P. Biodiversity: Extinction by numbers. Nature 2000, 403, 843–845. [Google Scholar] [CrossRef]
- Vitousek, P.M.; Mooney, H.A.; Lubchenco, J.; Melillo, J.M. Human domination of earth’s ecosystems. Science 1997, 277, 494–499. [Google Scholar] [CrossRef] [Green Version]
- Houghton, R. Counting terrestrial sources and sinks of carbon. Clim. Chang. 2001, 48, 525–534. [Google Scholar] [CrossRef]
- Pielke, R.A.; Marland, G.; Betts, R.A.; Chase, T.N.; Eastman, J.L.; Niles, J.O.; Niyogi, D.S.; Running, S.W. The influence of land-use change and landscape dynamics on the climate system: Relevance to climate-change policy beyond the radiative effect of greenhouse gases. Philos Trans. R. Soc. A 2002, 360, 1705–1719. [Google Scholar] [CrossRef] [PubMed]
- Gibbard, S.; Caldeira, K.; Bala, G.; Phillips, T.J.; Wickett, M. Climate effects of global land cover change. Geophys. Res. Lett. 2005, 32. [Google Scholar] [CrossRef] [Green Version]
- Foley, J.A.; DeFries, R.; Asner, G.P.; Barford, C.; Bonan, G.; Carpenter, S.R.; Chapin, F.S.; Coe, M.T.; Daily, G.C.; Gibbs, H.K.; et al. Global consequences of land use. Science 2005, 309, 570–574. [Google Scholar] [CrossRef] [Green Version]
- Turner, B.L., II; Lambin, E.F.; Reenberg, A. The emergence of land change science for global environmental change and sustainability. Proc. Natl. Acad. Sci. USA 2007, 104, 20666–20671. [Google Scholar] [CrossRef] [Green Version]
- Carpenter, S.R.; DeFries, R.; Dietz, T.; Mooney, H.A.; Polasky, S.; Reid, W.V.; Scholes, R.J. Millennium ecosystem assessment: Research needs. Science 2006, 314, 257–258. [Google Scholar] [CrossRef]
- Clark, M.L.; Aide, T.M.; Riner, G. Land change for all municipalities in Latin America and the Caribbean assessed from 250-m MODIS imagery (2001–2010). Remote Sens. Environ. 2012, 126, 84–103. [Google Scholar] [CrossRef]
- FAOSTAT: Food and Agriculture Organization of the United Nations Statistical Databases; Technical Report; United Nations: New York, NY, USA, 2013.
- Graesser, J.; Aide, T.M.; Grau, H.R.; Ramankutty, N. Cropland/pastureland dynamics and the slowdown of deforestation in Latin America. Environ. Res. Lett. 2015, 10, 3. [Google Scholar] [CrossRef]
- Volante, J.; Mosciaro, J.; Morales Poclava, M.; Vale, L.; Castrillo, S.; Sawchik, J.; Tiscornia, G.; Fuente, M.; Maldonado, I.; Vega, A.; et al. Expansión agrícola en Argentina, Bolivia, Paraguay, Uruguay y Chile entre 2000–2010. Caracterización espacial mediante series temporales de índices de vegetación. Rev. Investig. Agropecu. 2015, 41, 179–191. [Google Scholar]
- Overbeck, G.E.; Müller, S.C.; Fidelis, A.; Pfadenhauer, J.; Pillar, V.D.; Blanco, C.C.; Boldrini, I.I.; Both, R.; Forneck, E.D. Brazil’s neglected biome: The South Brazilian Campos. Perspect. Plant Ecol. 2007, 9, 101–116. [Google Scholar] [CrossRef]
- Soriano, A. Rio de la Plata Grasslands. In Natural Grasslands; Coupland, R.T., Ed.; Elsevier: Amsterdam, The Netherlands, 1991; pp. 367–407. [Google Scholar]
- Baeza, S.; Gallego, F.; Lezama, F.; Altesor, A.; Paruelo, J.M. Cartografía de los pastizales naturales en las regiones geomorfólogicas de Uruguay predominantemente ganaderas. In Bases Ecológicas y Tecnológicas Para el Manejo de Pastizales; Altesor, A., Ayala, W., Paruelo, J.M., Eds.; INIA: Montevideo, Uruguay, 2011; pp. 33–54. [Google Scholar]
- Baeza, S.; Baldassini, P.; Bagnato, C.; Pinto, P.; Paruelo, J. Caracterización del uso/cobertura del suelo en Uruguay a partir de series temporales de imágenes MODIS. Agrociencia 2014, 18, 95–105. [Google Scholar]
- Jobbágy, E.; Vasallo, M.; Farley, K.; Piñeiro, G.; Garbulsky, M.; Nosetto, M.; Jackson, R.; Paruelo, J. Forestación en Pastizales: Hacia una visión integral de sus oportunidades y costos ecológicos. Agrociencia 2006, 10, 109–124. [Google Scholar]
- Paruelo, J.M.; Jobbajy, E.; Sala, O.E. Current distribution of ecosystem functional types in temperate South America. Ecosystem 2001, 4, 683–698. [Google Scholar] [CrossRef]
- Paruelo, J.M.; Guershman, J.P.; Piñeiro, G.; Jobbágy, E.G.; Verón, S.R.; Baldi, G.; Baeza, S. Cambios en el uso de la tierra en Argentina y Uruguay: Marcos conceptuales para su análisis. Agrociencia 2006, 10, 47–61. [Google Scholar]
- Krapovickas, S.; Di Giacomo, A.S. The conservation of Pampas and grasslands in Argentina. Parks 1998, 8, 47–53. [Google Scholar]
- Paruelo, J.M.; Jobbágy, E.G.; Oesterheld, M.; Golluscio, R.A.; Aguiar, M.R. The grasslands and steppes of Patagonia and the Rio de la Plata plains. In The Physical Geography of South America; Veblen, T., Young, K., Orme, A., Eds.; Oxford University Press: Oxford, UK, 2007; pp. 232–248. [Google Scholar]
- Hoekstra, J.M.; Boucher, T.M.; Ricketts, T.H.; Roberts, C. Confronting a biome crisis: Global disparities of habitat loss and protection. Ecol. Lett. 2005, 8, 23–29. [Google Scholar] [CrossRef]
- Guershman, J.P.; Paruelo, J.M.; Di Bella, C.; Giallorenzi, M.C.; Pacin, F. Land cover classification in the Argentine Pampas using multi-temporal Landsat TM data. Int. J. Remote Sens. 2003, 24, 3381–3402. [Google Scholar] [CrossRef]
- Baldi, G.; Guerschman, J.P.; Paruelo, J.M. Characterizing fragmentation in temperate South America grasslands. Agric. Ecosyst. Environ. 2006, 116, 197–208. [Google Scholar] [CrossRef]
- Baldi, G.; Paruelo, J.M. Land-use and land cover dynamics in South American temperate grasslands. Ecol. Soc. 2008, 13, 6. [Google Scholar] [CrossRef]
- Baeza, S.; Lezama, F.; Piñeiro, G.; Altesor, A.; Paruelo, J.M. Spatial variability of aboveground net primary production in Uruguayan Grasslands: A remote sensing approach. Appl. Veg. Sci. 2010, 13, 72–85. [Google Scholar] [CrossRef]
- DeFries, R.S.; Hansen, M.C.; Townshend, J.R.G.; Sohlberg, R.S. Global land cover classifications at 8 km spatial resolution: The use of training data derived from Landsat imagery in decision tree classifiers. Int. J. Remote Sens. 1998, 19, 3141–3168. [Google Scholar] [CrossRef]
- Hansen, M.C.; Defries, R.S.; Townshend, J.R.G.; Sohlberg, R. Global land cover classification at 1 km spatial resolution using a classification tree approach. Int. J. Remote Sens. 2000, 21, 1331–1364. [Google Scholar] [CrossRef]
- Friedl, M.A.; Sulla-Menashe, D.; Tan, B.; Schneider, A.; Ramankutty, N.; Sibley, A.; Huang, X. MODIS Collection 5 global land cover: Algorithm refinements and characterization of new datasets. Remote Sens. Environ. 2010, 114, 168–182. [Google Scholar] [CrossRef]
- Eva, H.D.; Belward, A.S.; De Miranda, E.E.; Di Bella, C.M.; Gond, V.; Huber, O.; Jones, S.; Sgrenzaroli, M.; Fritz, S. A land cover map of South America. Glob. Chang. Biol. 2004, 10, 731–744. [Google Scholar] [CrossRef] [Green Version]
- Blanco, P.D.; Colditz, R.R.; Saldaña, G.L.; Hardtke, L.A.; Llamas, R.M.; Mari, N.A.; Fischer, A.; Caride, C.; Aceñolaza, P.G.; del Valle, H.F.; et al. A land cover map of Latin America and the Caribbean in the framework of the SERENA project. Remote Sens. Environ. 2013, 32, 13–31. [Google Scholar] [CrossRef]
- Cordeiro, J.L.; Hasenack, H. Cobertura vegetal atual do Rio Grande do Sul. In Campos Sulinos—Conservação e uso Sustentável da Biodiversidade; Pata Pillar, V., Müller, S.C., de Souza Castihos, Z.M., Avila, A.V., Eds.; Ministério do Meio Ambiente: Brasília, Brasi, 2009; pp. 285–299. [Google Scholar]
- Rama, G.; Lezama, F.; Baeza, S. Recent land use changes in the Cuesta Basaltica of Uruguay. Oecol. Aust. 2018, 22, 210–223. [Google Scholar] [CrossRef]
- Projeto MapBiomas—Coleção 4 da Série Anual de Mapas de Cobertura e Uso de Solo do Brasil. Available online: http://mapbiomas.org/termos-de-uso (accessed on 1 October 2019).
- Paruelo, J.M.; Piñeiro, G.; Baldi, G.; Baeza, S.; Lezama, F.; Altesor, A.; Oesterheld, M. Carbon stocks and fluxes in rangelands of the Rio de la Plata Basin. Rangel. Ecol. Manag. 2010, 63, 94–108. [Google Scholar] [CrossRef]
- Perelman, S.B.; León, R.J.C.; Oesterheld, M. Cross-scale vegetation patterns of Flooding Pampa grasslands. J. Ecol. 2001, 89, 562–577. [Google Scholar] [CrossRef] [Green Version]
- Lezama, F.; Pereira, M.; Altesor, A.; Paruelo, J. Grasslands of Uruguay: Classification based on vegetation plots. Phytocoenologia 2019, 49, 211–229. [Google Scholar] [CrossRef]
- Hall, A.J.; Rebella, C.M.; Ghersa, C.M.; Culot, J.P. Field crop systems of the Pampas. In Field Crop Ecosystems; Pearson, C.J., Ed.; Elsevier: Amsterdam, The Netherlands, 1992; pp. 413–450. [Google Scholar]
- Roy, D.P.; Borak, J.S.; Devadiga, S.; Wolfe, R.E.; Zheng, M.; Descloitres, J. The MODIS Land product quality assessment approach. Remote Sens. Environ. 2002, 83, 62–76. [Google Scholar] [CrossRef]
- Paruelo, J.M.; Aguiar, M.R.; Golluscio, R.A.; León, R.J.C.; Pujol, G. Environmental controls of Normalized Difference Vegetation Index dynamics in Patagonia based on NOAA-AVHRR satellite data. J. Veg. Sci. 1993, 4, 425–428. [Google Scholar] [CrossRef]
- Paruelo, J.M.; Lauenroth, W.K. Regional patterns of normalized difference vegetation index in North American shrublands and grasslands. Ecology 1995, 76, 1888–1898. [Google Scholar] [CrossRef]
- Baeza, S.; Paruelo, J.M.; Altesor, A. Caracterización funcional de la vegetación de Uruguay mediante el uso de sensores remotos. Interciencia 2006, 31, 382–388. [Google Scholar]
- Bagnato, C.; Conde, C.; Noe, Y.; Caride, C.; Baeza, S.; Paoli, H.; Vallejos, M.; Gallego, F.; Vale, L.; Amdan, L.; et al. Utilización de firmas espectrales de alta resolución temporal para la elaboración de mapas de uso agrícola y estimaciones de superficie cultivada a escala de lote en Argentina y Uruguay. In Congreso Argentino de Teledetección; Universidad Nacional de Córdoba: Cordoba, Argentina, 2012. [Google Scholar]
- Quinlan, J.R. C4.5: Programs for Machine Learning; Morgan Kaufmann Publishers: San Mateo, CA, USA, 1993; p. 302. [Google Scholar]
- Friedl, M.; Brodley, C.E.; Strahler, A.H. Maximizing land cover classification accuracies produced by decision trees at continental to global scales. IEEE Trans. Geosci. Remote Sens. 1999, 37, 969–977. [Google Scholar] [CrossRef]
- Colditz, R.R.; Saldaña, G.L.; Maeda, P.; Espinoza, J.A.; Tovar, C.M.; Hernández, A.V.; Carlos Zermeño, C.; López, I.C.; Ressl, R. Generation and analysis of the 2005 land cover map for Mexico using 250m MODIS data. Remote Sens. Environ. 2012, 123, 541–552. [Google Scholar] [CrossRef]
- Viglizzo, E.F.; Frank, F.C.; Carreño, L.V.; Jobbagy, E.G.; Pereyra, H.; Clatt, J.; Pincen, D.; Ricard, M.F. Ecological and environmental footprint of 50 years of agricultural expansion in Argentina. Glob. Chang. Biol. 2011, 17, 959–973. [Google Scholar] [CrossRef]
- Hasenack, H.; Cordeiro, J.L.P. Mapeamento da Cobertura Vegetal do Bioma Pampa; Centro de Ecologia UFRGS: Porto Alegre, Brasil, 2006; p. 30. [Google Scholar]
- Nabinger, C.; Moraes, A.; Maraschin, G.E. Campos in Southern Brazil. In Grassland Ecophysiology and Grazing Ecology; Lemaire, G., Hodgson, J., Moraes, A., Nabinger, C., Carvalho, P.C.F., Eds.; CAB International: Cambridge, UK, 2000; pp. 355–376. [Google Scholar]
- Lauenroth, W.; Burke, I.; Paruelo, J. Patterns of production of winter wheat and native grasslands in the Central Grassland region of the United States. Ecosystems 2000, 3, 344–351. [Google Scholar] [CrossRef]
- Guerschman, J.P.; Paruelo, J.M. Agricultural impacts on ecosystem functioning in temperate areas of North and South America. Glob. Planet. Chang. 2005, 47, 170–180. [Google Scholar] [CrossRef]
- Paruelo, J.M.; Burke, I.C.; Lauenroth, W.K. Land-use impact on ecosystem functioning in eastern Colorado, USA. Glob. Chang. Biol. 2001, 7, 631–639. [Google Scholar] [CrossRef]
- Ollinger, S.V.; Richardson, A.D.; Martin, M.E.; Hollinger, D.Y.; Frolking, S.E.; Reich, P.B.; Plourde, L.C.; Katul, G.G.; Munger, J.W.; Oren, R.; et al. Canopy nitrogen, carbon assimilation, and albedo in temperate and boreal forests: Functional relations and potential climate feedbacks. Proc. Natl. Acad. Sci. USA 2008, 105, 19336–19341. [Google Scholar] [CrossRef] [PubMed] [Green Version]
- Yang, R.; Friedl, M.A.; Ni, W. Parameterization of shortwave radiation fluxes for non uniform vegetation canopies in land surface models. J. Geophys. Res. 2001, 106, 14275–14286. [Google Scholar] [CrossRef] [Green Version]
- Nosetto, M.D.; Jobbágy, E.G.; Brizuela, A.B.; Jackson, R.B. The hydrologic consequences of land cover change in central Argentina. Agric. Ecosyst. Environ. 2012, 154, 2–11. [Google Scholar] [CrossRef]
- Sellers, P.J.; Dickinson, R.E.; Randall, D.A.; Betts, A.K.; Hall, F.G.; Berry, J.A.; Collatz, G.J.; Denning, A.S.; Mooney, H.A.; Nobre, C.A.; et al. Modeling the exchanges of energy, water, and carbon between continents and the atmosphere. Science 1997, 275, 502–509. [Google Scholar] [CrossRef] [Green Version]
- Pielke, R.A.; Avissar, R.; Raupach, M.; Dolman, A.J.; Zeng, X.; Denning, A.S. Interactions between the atmosphere and terrestrial ecosystems: Influence on weather and climate. Glob. Chang. Biol. 1998, 4, 461–475. [Google Scholar] [CrossRef]
- Caffera, M. Análisis de las Condiciones Hídricas Hacia Finales de 2008, Anuario OPYPA (Oficina de Programacion Y Politica Agropecuaria). 2008. Available online: http://www.mgap.gub.uy/unidad-organizativa/oficina-de-programacion-y-politicas-agropecuarias/publicaciones/anuarios-opypa/2008 (accessed on 1 October 2019).
- Scarpati, O.E.; Capriolo, A.D. Sequías e inundaciones en la provincia de Buenos Aires (Argentina) y su distribución espacio-temporal. Investigaciones Geográficas Boletín del Instituto de Geografía 2013, 82, 38–51. [Google Scholar] [CrossRef] [Green Version]
- Hüttich, C.; Herold, M.; Wegmann, M.; Cord, A.; Strohbach, B.; Schmullius, C.; Dech, S. Assessing effects of temporal compositing and varying observation periods for large-area land-cover mapping in semi-arid ecosystems: Implications for global monitoring. Remote Sens. Environ. 2011, 115, 2445–2459. [Google Scholar] [CrossRef]
- Clark, M.L.; Aide, M.; Grau, R.; Riner, G. A scalable approach to mapping annual land cover at 250 m using MODIS time series data: A case study in the Dry Chaco ecoregion of South America. Remote Sens. Environ. 2010, 114, 2816–2832. [Google Scholar] [CrossRef]
Figure 1.
Geographical location of Rio de la Plata Grasslands (RPG) and its different sub regions: (A) Rolling Pampa; (B1) Flat Inland Pampa; (B2) West Inland Pampa; (C) Southern Pampa; (D) Flooding Pampa; (E) Mesopotamic Pampa; (F) Southern Campos; (G) Northern Campos. In blue the three MODIS tiles used in land use/land cover classifications.

Figure 2.
Data used and steps taken to generate and evaluate Land Use/Land Covermaps.

Figure 3.
Location of the field data in the study area.

Figure 4.
LULC classifications of the Río de la Plata Grasslands for 3 agricultural years, selected due to the absence of major errors. a) 2001/2002, b) 2006/2007 and c) 2012/2013.PFR: Perennial Forage Resources, SC: Summer Crops, WC: Winter Crops, DC: Double Crops, A&F: Afforestations and Forest;. RPG: Rio de la Plata Grasslands; Adm. bound.: administrative boundaries; Adm. bound. 2°: Second order administrative boundaries. (A) Rolling Pampa; (B1) Flat Inland Pampa; (B2) West Inland Pampa; (C) Southern Pampa; (D) Flooding Pampa; (E) Mesopotamic Pampa; (F) Southern Campos; (G) Northern Campos.


Figure 5.
LULC change map in RPG between the periods 2001/2002 and 2012/2013. Agric. Intensification: agricultural intensification. PFR re-establishment: passage of agricultural categories to Perennial Forage Resources (PFR). Forest Intensification: passage from PFR to Afforestation and Forest (A&F). Deforestation: passage from A&F to PFR. Ag-A&F: passage from agricultural categories to A&F. A&F-Ag.: passage from A&F to agricultural categories. RPG: Rio de la Plata Grasslands; Adm. bound.: administrative boundaries; Adm. bound. 2°: Second order administrative boundaries. (A) Rolling Pampa; (B1) Flat Inland Pampa; (B2) West Inland Pampa; (C) Southern Pampa; (D) Flooding Pampa; (E) Mesopotamic Pampa; (F) Southern Campos; (G) Northern Campos.

Figure 6.
LULC change maps in RPG occurred in two time periods: (a) between 2001/2002 and 2006/2007; (b) between 2006/2007 and 2012/2013. Agric. Intensification: Agricultural Intensification. PFR re-establishment: passage of agricultural categories to Perennial Forage Resources (PFR). Forest Intensification: passage from PFR to Afforestation and Forest (A&F). Deforestation: passage from A&F to PFR. Ag-A&F: passage from agricultural categories to A&F. A&F-Ag.: passage from A&F to agricultural categories. RPG: Rio de la Plata Grasslands; Adm. bound.: administrative boundaries; Adm. bound. 2°: Second order administrative boundaries. (A) Rolling Pampa; (B1) Flat Inland Pampa; (B2) West Inland Pampa; (C) Southern Pampa; (D) Flooding Pampa; (E) Mesopotamic Pampa; (F) Southern Campos; (G) Northern Campos.


Table 1.
Number of paddocks considered in the Phenological Library for each subregion, year and agricultural campaign; totals by sub region and general totals are highlighted in bold.
Table 1.
Number of paddocks considered in the Phenological Library for each subregion, year and agricultural campaign; totals by sub region and general totals are highlighted in bold.
| Sub region/Campaign | 2002 | 2003 | 2004 | 2005 | 2007 | 2008 | 2009 | 2010 | 2011 | 2012 | 2013 | Total |
|---|---|---|---|---|---|---|---|---|---|---|---|---|
| Northern Campos | 462 | 1289 | 689 | 2440 | ||||||||
| Winter | 462 | 653 | 1115 | |||||||||
| Summer | 636 | 689 | 1325 | |||||||||
| Southern Campos | 202 | 717 | 420 | 1339 | ||||||||
| Winter | 202 | 237 | 439 | |||||||||
| Summer | 480 | 420 | 900 | |||||||||
| Southern Pampa | 198 | 113 | 44 | 351 | 118 | 824 | ||||||
| Winter | 194 | 113 | 351 | 658 | ||||||||
| Summer | 4 | 44 | 118 | 166 | ||||||||
| Flooding Pampa | 132 | 223 | 110 | 4 | 15 | 265 | 32 | 781 | ||||
| Winter | 124 | 220 | 4 | 265 | 613 | |||||||
| Summer | 8 | 3 | 110 | 15 | 32 | 168 | ||||||
| Rolling Pampa | 14 | 228 | 326 | 735 | 79 | 129 | 151 | 135 | 1797 | |||
| Winter | 14 | 78 | 211 | 79 | 16 | 134 | 532 | |||||
| Summer | 150 | 115 | 735 | 113 | 17 | 135 | 1265 | |||||
| Inland Pampa | 356 | 260 | 278 | 5 | 684 | 1297 | 670 | 3550 | ||||
| Winter | 227 | 185 | 5 | 681 | 111 | 1209 | ||||||
| Summer | 129 | 75 | 278 | 3 | 1186 | 670 | 2341 | |||||
| Total | 14 | 914 | 922 | 1167 | 88 | 828 | 2064 | 955 | 664 | 2006 | 1109 | 10,731 |
Table 2.
Rules for the allocation of LULC in the agricultural year maps based on combining what happened in the maps of the winter and summer agricultural campaigns. WC: Winter Crops, SC: Summer Crops, DC: Double Crops, PFR: Perennial Forage Resources, A&F: Afforestations and Forests.
Table 2.
Rules for the allocation of LULC in the agricultural year maps based on combining what happened in the maps of the winter and summer agricultural campaigns. WC: Winter Crops, SC: Summer Crops, DC: Double Crops, PFR: Perennial Forage Resources, A&F: Afforestations and Forests.
| Winter Map | Summer Map | Agricultural Year Map |
|---|---|---|
| PFR | PFR | PFR |
| PFR | SC | SC |
| PFR | A&F | PFR * |
| WC | PFR | WC |
| WC | SC | DC |
| WC | A&F | WC * |
| A&F | PFR | PFR * |
| A&F | SC | SC * |
| A&F | A&F | A&F |
* Situations that are unlikely to occur probably associated with errors in the classification process and that occur with very low frequency (0.26% of the total of classified pixels).
Table 3.
Matrices between classification results and field information collected in winter campaigns, expressed in pixels (a) and in percentage (b). The field data correspond to the evaluation subset and groups information of all RPG sub-regions and all the agricultural years. WC: Winter Crops, PFR: Perennial Forage Resources, A&F: Afforestations and Forests.
| (a) | Ground Truth (Pix) | (b) | Ground Truth (%) | |||||||||
|---|---|---|---|---|---|---|---|---|---|---|---|---|
| WC | PFR | A&F | Total | WC | PFR | A&F | Total | |||||
| Classification | WC | 1241 | 77 | 0 | 1318 | Classification | WC | 89.7 | 2.7 | 0 | 29.0 | |
| PFR | 142 | 2791 | 24 | 2957 | PFR | 10.3 | 96.8 | 8.7 | 65.1 | |||
| A&F | 0 | 16 | 251 | 267 | A&F | 0 | 0.6 | 91.3 | 5.9 | |||
| Total | 1383 | 2884 | 275 | 4542 | Total | 100 | 100 | 100 | 100 | |||
Table 4.
Contingency matrices between classification results and field information collected in summer campaigns, expressed in pixels (a) and in percentage (b). The field data correspond to the evaluation subset and groups information of all RPG sub-regions and all the agricultural years. SC: Summer Crops, PFR: Perennial Forage Resources, A&F: Afforestations and Forests.
| (a) | Ground Truth (Pix) | (b) | Ground Truth (%) | |||||||||
|---|---|---|---|---|---|---|---|---|---|---|---|---|
| SC | PFR | A&F | Total | SC | PFR | A&F | Total | |||||
| Classification | SC | 5446 | 229 | 0 | 5675 | Classification | SC | 97.7 | 8.9 | 0 | 62.1 | |
| PFR | 126 | 2330 | 54 | 2510 | PFR | 2.3 | 90.8 | 5.4 | 27.5 | |||
| A&F | 0 | 6 | 943 | 949 | A&F | 0 | 0.2 | 94.6 | 10.4 | |||
| Total | 5572 | 2565 | 997 | 9134 | Total | 100 | 100 | 100 | 100 | |||
Table 5.
Commission and omission errors, expressed as percentage, for the contingency matrices of the global evaluation (Grouping the data of all Rio de la Plata Grasslands (RPG) sub-regions and all the agricultural years. (a) Winter campaign, (b) Summer campaign.
Table 5.
Commission and omission errors, expressed as percentage, for the contingency matrices of the global evaluation (Grouping the data of all Rio de la Plata Grasslands (RPG) sub-regions and all the agricultural years. (a) Winter campaign, (b) Summer campaign.
| (a) | Commission (%) | Omission (%) | (b) | Commission (%) | Omission (%) | |
|---|---|---|---|---|---|---|
| WC | 5.8 | 10.3 | SC | 4.0 | 2.3 | |
| PFR | 5.6 | 3.2 | PFR | 7.2 | 9.2 | |
| A&F | 6.0 | 8.7 | A&F | 0.6 | 5.4 |
Table 6.
Degree of agreement between land use/land cover (LULC) results for the selected agricultural years (2001/2002, 2006/2007 and 2012/2013) and official statistics of the countries present in the study area, expressed through of the Pearson correlation coefficient (r). Source refers to the type of official statistics. Ag census: agricultural censuses; SIIA: Integrated Agricultural Information System (for its Spanish acronym: Sistema Integrado de Información Agrícola). PAM: Municipal Agricultural Production (for its Portuguese acronym: Produção Agrícola Municipal). Year Source: date of official statistics. Year Class: agricultural year of the classification used in the comparison. n: number of administrative divisions used in the comparison. PFR: Perennial Forage Resources, A&F: Afforestations and Forests.
| Crops | PFR | A&F | |||||
|---|---|---|---|---|---|---|---|
| País | Source | Year Source | Year Class | n | r | r | r |
| Uruguay | Ag census | 2000 | 2001/2002 | 431 | 0.76 | 0.61 | 0.62 |
| 2011 | 2012/2013 | 430 | 0.92 | 0.86 | 0.78 | ||
| Argentina | SIIA | 2001/2002 | 2001/2002 | 115 | 0.88 | ||
| 2006/2007 | 2006/2007 | 126 | 0.88 | ||||
| 2012–2013 | 2012–2013 | 122 | 0.88 | ||||
| Ag census. | 2002 | 2001/2002 | 127 | 0.90 | 0.86 | ||
| 2002 | 2001/2002 | 12 | 0.82 | ||||
| Brazil | PAM | 2002 | 2001/2002 | 146 | 0.82 | ||
| 2007 | 2006/2007 | 153 | 0.91 | ||||
| 2013 | 2012–2013 | 146 | 0.90 |
Table 7.
Relative change, expressed as a percentage, on the surface of mapped categories for the different RPG sub-regions and for different periods of time. 01/02–06/07 represents the changes that occurred between 2001/2002 and 2006/2007. 06/07–12/13 represents the changes that occurred between 2006/2007 and 2012/2013. 01/02–12/13 (in bold) represents the changes that occurred between 2001/2002 and 2012/2013. Change refers to the period analyzed for the calculation of the relative change. Crops group the categories Winter Crops, Summer Crops, and Double Crops. PFR: Perennial Forage Resource. A&F: Afforestation and Forest. NorC: Northern Campos; SouC: Southern Campos; MesP: Mesopotamic Pampa; SouP: Southern Pampa; InlP: Inland Pampa; FloP: Flooding Pampa; RolP: Rolling Pampa.
| Sub-Region | Change | Crops | PFR | A&F |
|---|---|---|---|---|
| NorC | 01/02-06/07 | 24.9 | –8.9 | 28.3 |
| 06/07-12/13 | 19.2 | –1.2 | –22.8 | |
| 01/02-12/13 | 49.0 | –10.0 | –0.9 | |
| SouC | 01/02-06/07 | 63.7 | –3.4 | –45.2 |
| 06/07-12/13 | 51.1 | –10.0 | 24.1 | |
| 01/02-12/13 | 147.4 | –13.1 | –32.0 | |
| MesP | 01/02-06/07 | 73.8 | –33.6 | –33.4 |
| 06/07-12/13 | -3.4 | 5.6 | –23.2 | |
| 01/02-12/13 | 67.9 | –29.8 | –48.9 | |
| SouP | 01/02-06/07 | 12.2 | –7.4 | |
| 06/07-12/13 | -3.9 | 2.9 | ||
| 01/02-12/13 | 7.8 | –4.7 | ||
| InlP | 01/02-06/07 | 5.9 | –4.7 | |
| 06/07-12/13 | -2.5 | 2.2 | ||
| 01/02-12/13 | 3.2 | –2.6 | ||
| FloP | 01/02-06/07 | 8.5 | –2.0 | |
| 06/07-12/13 | 2.2 | –0.6 | ||
| 01/02-12/13 | 10.9 | –2.6 | ||
| RolP | 01/02-06/07 | 15.9 | –20.3 | |
| 06/07-12/13 | 1.9 | –3.6 | ||
| 01/02-12/13 | 18.1 | –23.1 |
© 2020 by the authors. Licensee MDPI, Basel, Switzerland. This article is an open access article distributed under the terms and conditions of the Creative Commons Attribution (CC BY) license (http://creativecommons.org/licenses/by/4.0/).
Share and Cite
MDPI and ACS Style
Baeza, S.; Paruelo, J.M. Land Use/Land Cover Change (2000–2014) in the Rio de la Plata Grasslands: An Analysis Based on MODIS NDVI Time Series. Remote Sens. 2020, 12, 381. https://doi.org/10.3390/rs12030381
AMA Style
Baeza S, Paruelo JM. Land Use/Land Cover Change (2000–2014) in the Rio de la Plata Grasslands: An Analysis Based on MODIS NDVI Time Series. Remote Sensing. 2020; 12(3):381. https://doi.org/10.3390/rs12030381
Chicago/Turabian StyleBaeza, Santiago, and José M. Paruelo. 2020. "Land Use/Land Cover Change (2000–2014) in the Rio de la Plata Grasslands: An Analysis Based on MODIS NDVI Time Series" Remote Sensing 12, no. 3: 381. https://doi.org/10.3390/rs12030381
Note that from the first issue of 2016, this journal uses article numbers instead of page numbers. See further details here.