Article

Analysis of Cold-Developed vs. Cold-Acclimated Leaves Reveals Various Strategies of Cold Acclimation of Field Pea Cultivars

1
Centre of the Region Haná for Biotechnological and Agricultural Research, Department of Biophysics, Faculty of Science, Palacký University, 783 71 Olomouc, Czech Republic
2
Centre of the Region Haná for Biotechnological and Agricultural Research, Department of Chemical Biology and Genetics, Faculty of Science, Palacký University, 783 71 Olomouc, Czech Republic
3
Centre of the Region Haná for Biotechnological and Agricultural Research, Department of Genetic Resources for Vegetables, Medicinal and Special Plants, Crop Research Institute, 783 71 Olomouc, Czech Republic
*
Author to whom correspondence should be addressed.
Remote Sens. 2019, 11(24), 2964; https://doi.org/10.3390/rs11242964
Submission received: 1 November 2019 / Revised: 2 December 2019 / Accepted: 6 December 2019 / Published: 11 December 2019
(This article belongs to the Special Issue Advanced Imaging for Plant Phenotyping)

Abstract

:
Peas (Pisum sativum L.) belong among the world’s oldest domesticated crops, serving as a source of proteins, complex carbohydrates, vitamins and minerals. Autumn sowing allows a higher biomass production as well as the avoidance of the drought and heat stresses of late spring. However, the character of European continental winters limits plant growth and development through cold stress. This work sought parameters that reflect the cold tolerance of pea plants and consequently to suggest an afila-type pea cultivar with resilience to European continental winters. For this purpose, we employed indoor remote sensing technology and compared the 22-day-long acclimation to 5 °C of four pea cultivars: Arkta, with normal leaves and the known highest cold resistance to European continental winters, and Enduro, Terno and CDC Le Roy, all of the afila type. Besides evaluation of shoot growth rate and quenching analysis of chlorophyll fluorescence (ChlF) by imaging methods, we measured the chlorophyll content and ChlF induction with a nonimaging fluorometer. Here we show that the acclimation to cold of the Arkta exhibits a different pattern than the other cultivars. Arkta showed the fastest retardation of photosynthesis and shoot growth, which might be part of its winter survival strategy. Terno, on the other hand, showed sustained photosynthetic performance and growth, which might be an advantageous strategy for spring. Surprisingly, Enduro showed sustained photosynthesis in the stipules, which transferred and acclimated to 5 °C (cold-acclimated). However, of all the cultivars, Enduro had the strongest inhibition of photosynthesis in new stipules that developed after the transition to cold (cold-developed). We conclude that the parameters of ChlF spatial imaging calculated as averages from whole plants are suboptimal for the characterization of various cold acclimation strategies. The most marked changes were obtained when the new cold-developed leaves were analyzed separately from the rest of the plant.

Graphical Abstract

1. Introduction

Peas (Pisum sativum L.), as one of the oldest domesticated crops in the world [1,2], have long been recognized as an inexpensive, readily available source of protein, complex carbohydrates, vitamins and minerals [3]. In an effort to improve grain yield, seed protein content, disease resistance, or the tolerance to various stresses, pea plants have been bred into different types. In 1965, Goldenberg discovered the afila type, whose leaves were transformed into tendrils that tend to twine together and so the plants offer mutual support to each other [4]. The leaves transformed into tendrils thus brought benefits in the form of a pea canopy with increased lodging resistance.
A further important trait is represented by the adaptability of plants to different climates. Various species of overwintering plants have developed adaptive responses to the seasonal changes in the weather [5,6,7,8]. They sense the upcoming cold period through the perception of environmental signals. The process of sensing an upcoming period with low temperatures leading to changes at the level of gene expression, cellular water management, plant metabolism and physiology is known as cold acclimation. Cold acclimation occurs in species from temperate regions where relatively low but nonfreezing temperatures precede a period of freezing [9]. In regions with winter temperatures falling considerably below the freezing point, spring peas form the base element of agriculture. However, the advantages of autumn sowing, such as higher biomass production and the avoidance of the drought and heat stresses of late spring [10], led to the first crucial steps in pea research [11,12,13,14]. Unfortunately, during the breeding process, most of the current pea cultivars lost their responsiveness to decreasing temperatures and the shorter length of the days, thus losing the ability to survive the cold season. The only cultivars known to be suitable for autumn sowing in the regions of the European central zone have normal leaves [15]. A cultivar that would connect the advantage of the increased lodging resistance of the afila type with the ability to survive autumn sowing could thus become a boon for farmers.
Nowadays, the advantages of automated phenotyping are often used for studies of plant stresses. Although the automated phenotyping and remote sensing methods were predominantly used for the detection of drought and salt stresses (reviewed in [16]), the number of studies dealing with cold stress is growing. The red-green-blue (RGB) camera still remains the main sensor in plant phenotyping; the detection of visible markers of stress seems a logical solution. The determination of leaf necrosis and inhibition of plant growth were assessed by an RGB sensor in a study of maize’s tolerance to cold [17]. However, such a method is not very suitable for more cold-tolerant species in which RGB traits, especially necrosis, will develop only as a late response to severe stress. For this reason, more sensitive noninvasive sensors, such as hyperspectral camera or chlorophyll fluorescence (ChlF) imaging, were used to detect cold tolerance in a physiological level. Although cold tolerance studies are mostly performed in controlled conditions, there are also examples of field studies using remote sensing phenotyping methods. Chiluwal et al. [18] used hyperspectral aerial imaging to detect sensitivity to cold in field-grown sorghum plants. They observed important differences in the normalized difference red-edge index (NDRE) and normalized difference vegetation index (NDVI). Even earlier than in hyperspectral traits, cold stress affects ChlF induction, which mainly reflects the function of photosystem II (PSII; for a review, see e.g., [19]). ChlF parameters determined for light-adapted states (under prolonged illumination) of a sample, as well as for dark-adapted states, were used to study cold stress or acclimation. For example, Moura et al. [20] studied 42 rice genotypes grown under optimal temperature conditions and selected five potentially tolerant genotypes based on PSII efficiency in a light-adapted state. In faba beans, Zhou et al. [21] used the measurement of PSII efficiency in a dark-adapted state (FV/FM parameter) via a nonimaging method to select cold- and heat-tolerant genotypes. To describe the overall response of the photosynthetic apparatus to various environmental stimuli, specific indices of ChlF were developed. What is termed the performance index (PIABS, on an absorption basis) and the total performance index (PIABS,total, on an absorption basis) are also often used for the description of plant stress (reviewed in [22]). The indices are derived from the fast measurement of the rise in ChlF (the O-J-I-P transient) with dark-adapted samples and they reflect the function of electron transport in PSII and the plastoquinone pool (PIABS) and in the whole thylakoid membrane (PIABS,total). The indices were also used for the exploration of the effect of low temperatures on several plant species (e.g. [23,24]). It can be inferred from the above that more information can be obtained by the evaluation of ChlF parameters determined for both the dark- and light-adapted states.
In an attempt to find parameters that reflect the cold resistance of pea plants and suggest the afila-type pea cultivar most suitable for resilience during winters in the European central zone, we studied four different pea cultivars. Two different afila-type cultivars that have been declared to be cold-resistant: a spring cultivar, CDC Le Roy, that has been bred to survive the relatively cold Canadian springs [25], and a winter cultivar, Enduro, bred to survive the mild winters of the south of France [26]. A spring cultivar of the afila type, Terno, without any declared cold resistance [15,27], and a winter cultivar with normal leaves, Arkta, which, according to trials organized by the Czech state authority [28], has the highest cold resistance to the winters of the European central zone. Arkta were used as controls. To shed light on the physiological mechanisms of their cold acclimation, the ChlF and RGB imaging tools of automated phenotyping and the nonimaging estimation of chlorophyll content and fast measurement of ChlF were employed.

2. Materials and Methods

2.1. Plant Materials

Four different pea (Pisum sativum L.) cultivars (Table 1) were used. Seeds were obtained from the Czech collection of pea genetic resources held by Agritec Ltd. (Šumperk, Czech Republic; AGT) and the Crop Development Centre, University of Saskatchewan (Saskatoon, Canada; CDC). The collection is run according to the framework methodology for the National Programme for Plant Genetic Resources of the Czech Republic [29]. Passport and description data are available in the Germplasm Resource Information Network (GRIN) database [30].

2.1.1. Plant Cultivation

The plants were cultivated in 190-ml containers (65 × 65 × 95 mm, Plant-It-Rite, Australia) filled with 100 g of soil (Substrate 2, Klasmann-Deilmann GmbH, Germany) and watered to full water capacity. The seeds were germinated in mini greenhouses (50 × 32 × 6 cm with a clear plastic lid) in FS-WI walk-in phytochambers (Photon Systems Instruments, Brno, Czech Republic) with white LED lighting (150 μmol photons of PAR m−2 s−1). The conditions were set up to 16h day/8h night with temperatures of 21 °C during the light period and 16 °C in the night. The relative humidity was set to 60%. After the development of the second leaves/stipules, the temperature was reduced to 5 °C for 22 days; the other parameters of the phytochamber remained unchanged. The second leaves/stipules were thus developed at 21 °C and then underwent the process of cold acclimation; therefore they are labeled as cold-acclimated. The third leaves/stipules developed under the cold treatment and are labeled as cold-developed.
The plants were watered regularly with the same amount of water. Fifteen seedlings from each cultivar were used for the automated phenotyping (RGB and ChlF imaging), and another fifteen plants were used for measurements of chlorophyll content and ChlF induction by a conventional (nonimaging) fluorometer.

2.2. Phenotyping Measurement/Evaluation

For measurements in the PlantScreenTM phenotyping platform (Photon Systems Instruments, Brno, Czech Republic) (described in [31]) the pots with the seedlings were placed in standardized trays, two pots per tray, and automatically loaded and measured by the platform. The conditions for measurement were set up to the same values as during the cultivation for the initial measurements (at 21 °C) and then, after the decrease of the cultivation temperature to 5 °C, were set to the closest possible temperature allowed by the phenotyping hardware (10 °C). The relative humidity and light conditions were the same as during cultivation for all measurements. The movement of the trays was performed by a robotic-driven conveyor belt that routinely transferred the experimental plants between the growing and measuring areas according to a user-defined protocol. A single measuring round of eight trays consisted of 20 minutes of adaptation to the dark, followed by the measurement of ChlF and digital RGB imaging from three optical projections. Approximately 16 plants per hour were analyzed, because of the length of the measuring round, which is dependent on the length of the adaptation to the dark and ChlF measurement. In the case of the RGB imaging, the platform throughput increases to about 60 experimental trays (120 plants) per hour. The data from the ChlF and RGB imaging were stored in a database server and analyzed either by the software provided by the manufacturer or by the software developed by the authors of this study, as described in detail in [31].

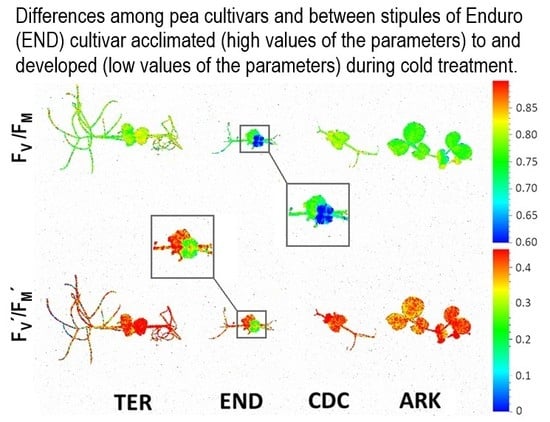
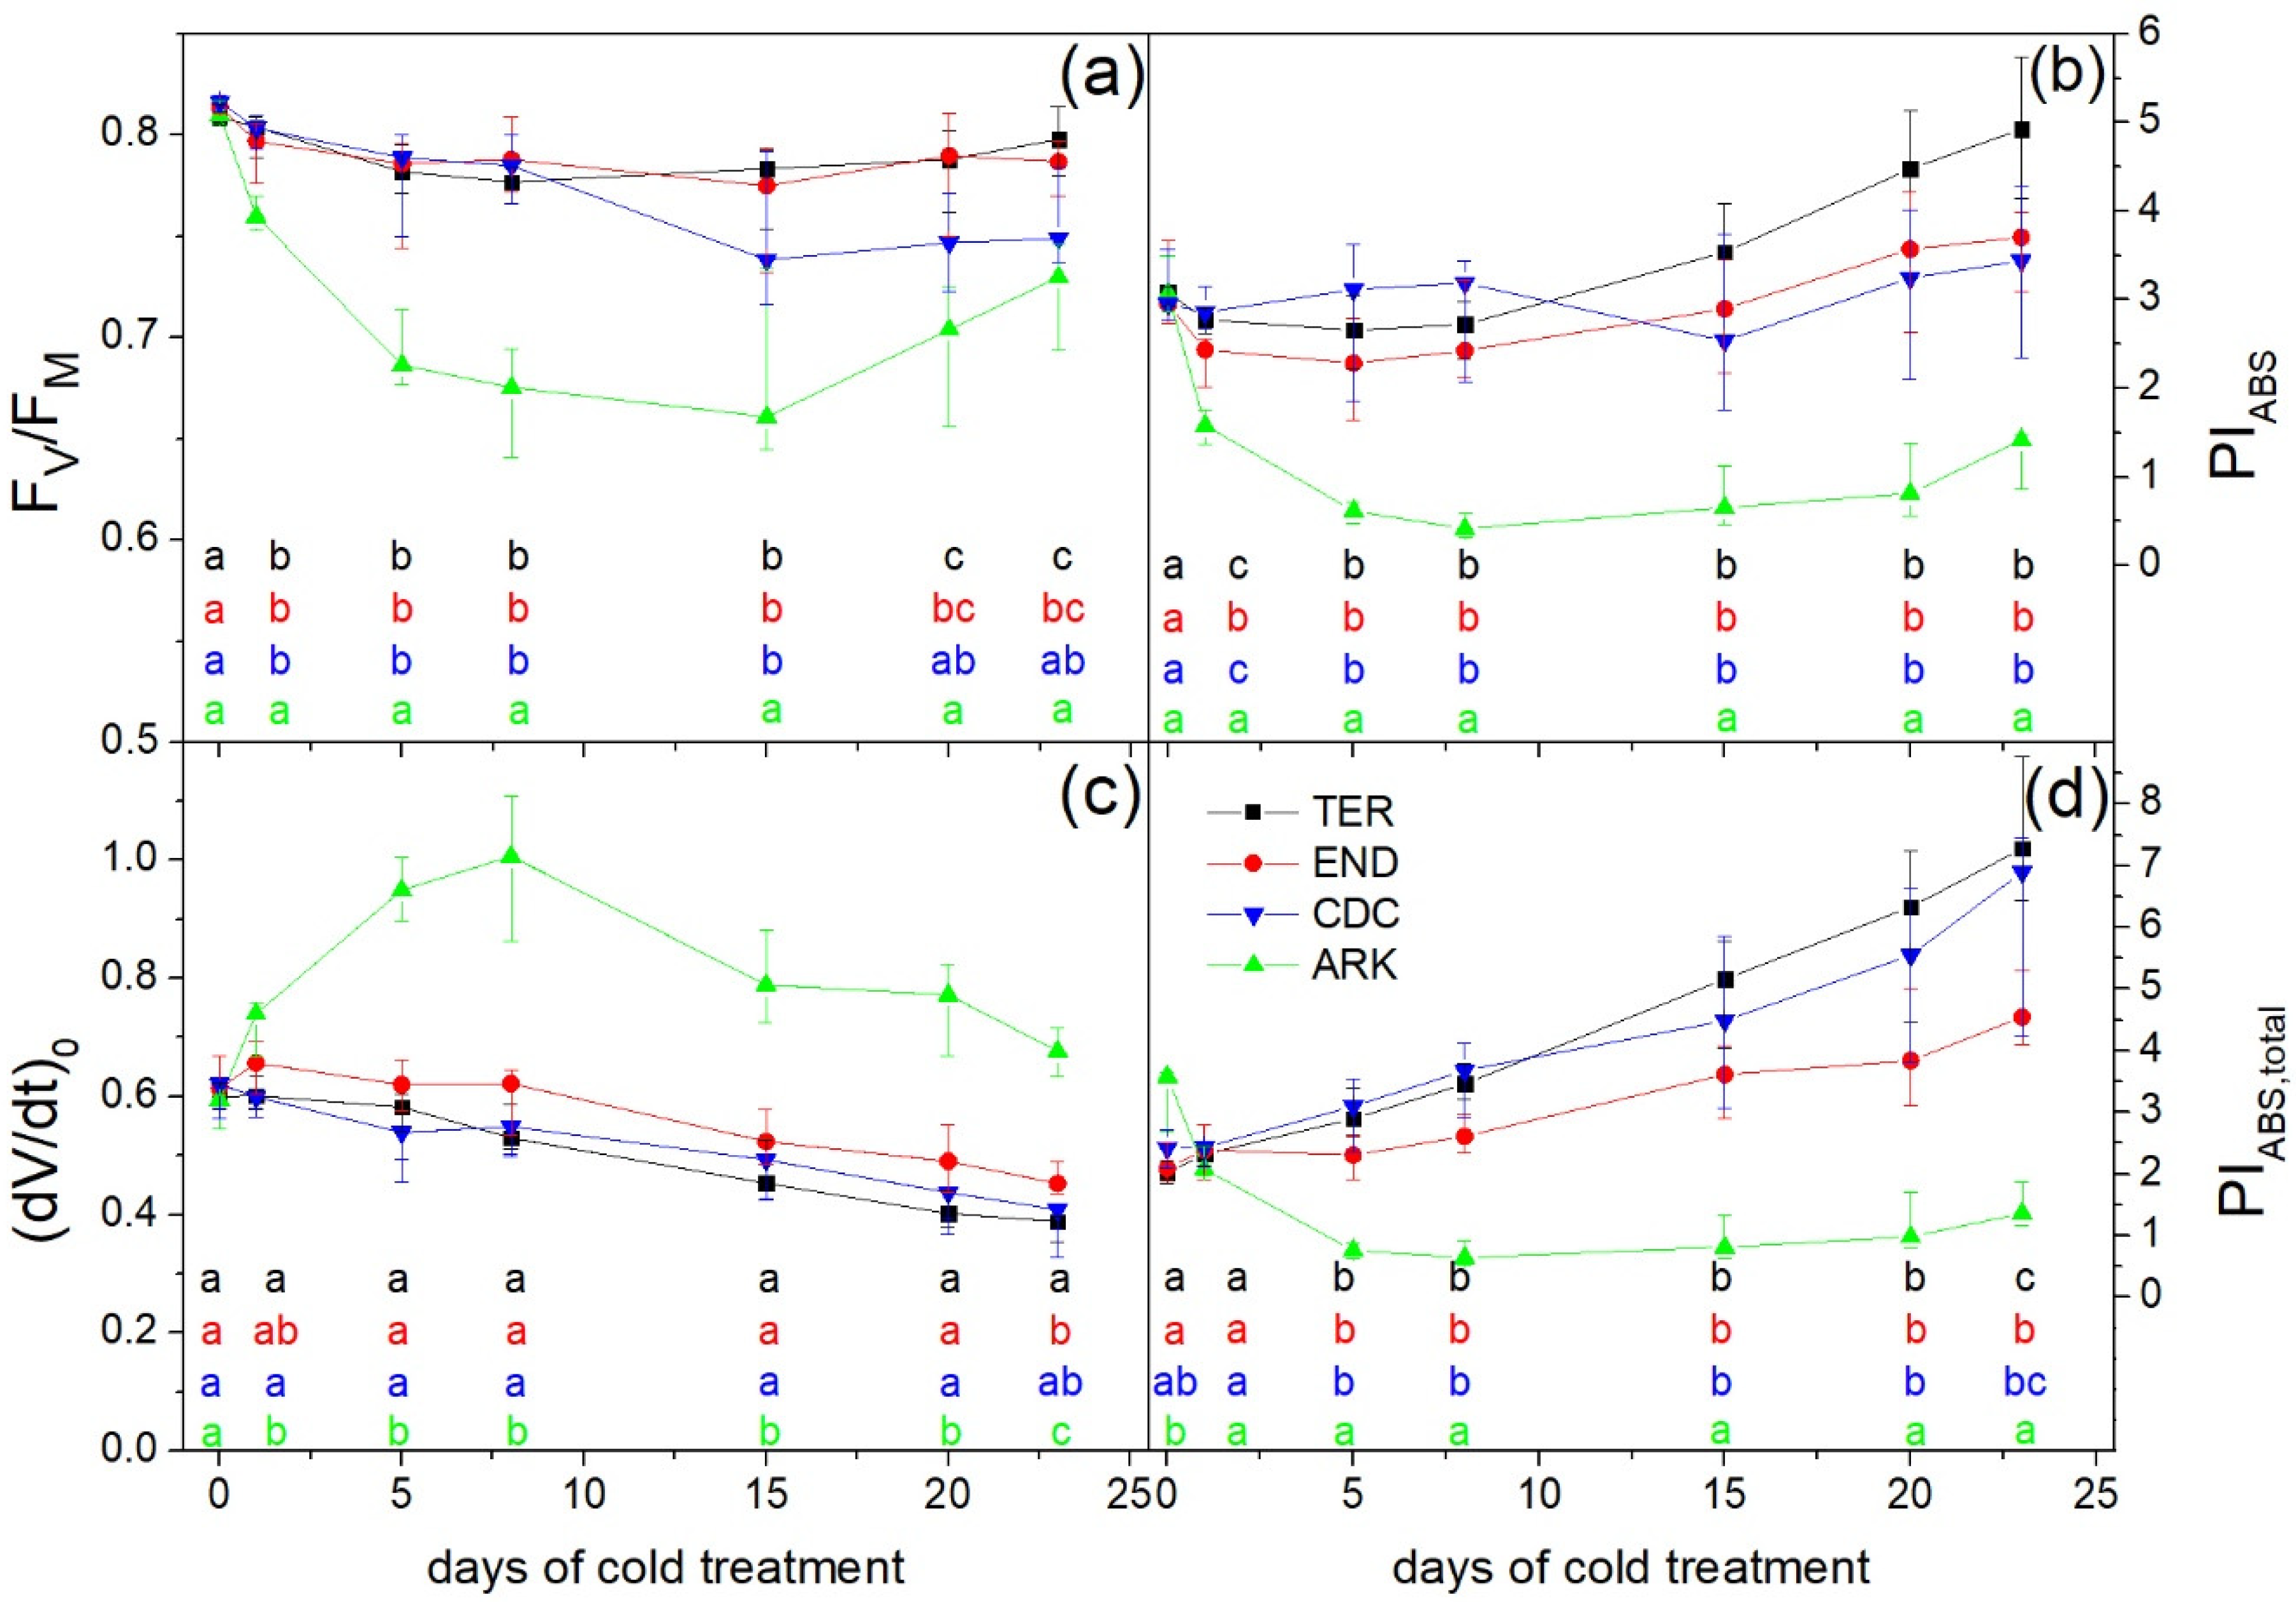
2.2.1. Chlorophyll Fluorescence Quenching Analysis

The minimal ChlF F0 was determined using measuring flashes (duration of 10 μs) of red light (650 nm). The maximal ChlF FM was estimated during a following saturating pulse (white light, 1900 µmol of photons m−2 s−1, duration of 800 ms). After subsequent 17-s-long dark relaxation, the plants were exposed to red actinic light (650 nm, 150 µmol photons of PAR m−2 s−1) for 70 s. A visual check that a steady-state ChlF signal was reached at 70 s of illumination was performed. To determine the maximal ChlF during the actinic light exposition (FM), a set of saturating pulses was applied. The first pulse was applied 8 s after the actinic light was switched on and was followed by two pulses at 10-s intervals and then by two pulses in 20-s intervals.
The maximal quantum yield of PSII photochemistry in the light-adapted state was calculated as:
(FM′ − F0′)/FM′ = FV′/FM′,
where F0′ is the minimal ChlF for the light-adapted state and was calculated as:
F0′ = F0/(FV/FM + F0/FM′).
The quantum yield of light-induced regulatory nonphotochemical quenching (ΦNPQ) was calculated as:
ΦNPQ = (Ft/FM′) − (Ft/FM);
and the fraction of closed reaction centers of PSII ((1qP), also called the excitation pressure) as:
(1 − qP) = 1 − (FM′ − Ft)/(FM′ − F0′),
where Ft stands for the actual ChlF before the respective saturating pulse and qP is the coefficient of photochemical quenching, which is used for the estimation of the fraction of the open reaction centers of PSII. The effective quantum yield of PSII photochemistry in the light-adapted state (ΦP) was calculated as:
ΦP = qP FV′/FM′ = (FM′ − Ft)/FM′.
All the parameters that are presented were calculated from values obtained at the end of the actinic light exposition. For a review of the parameters see, e.g., [32].

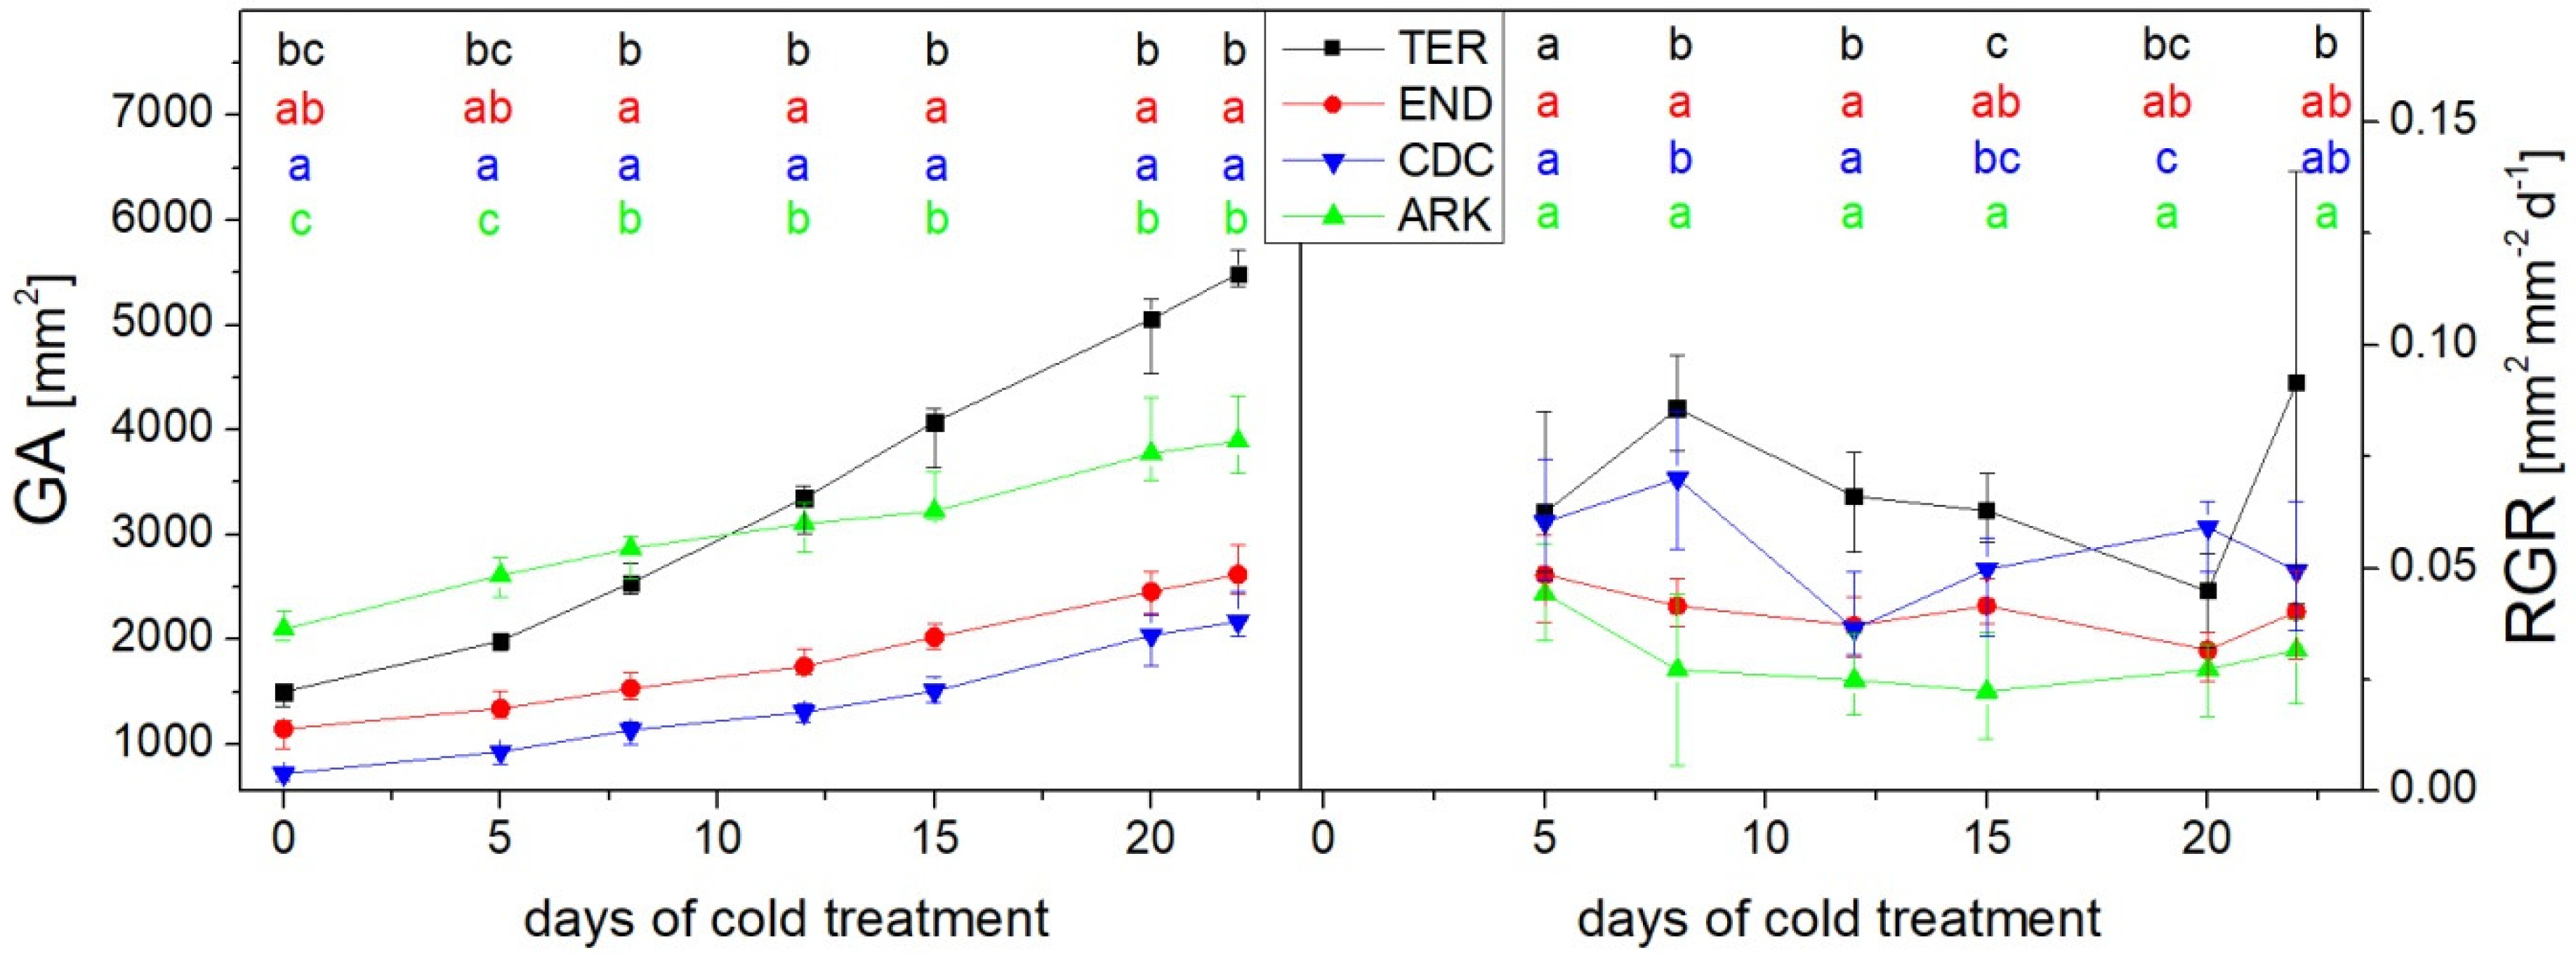
2.2.2. RGB Image Analysis

The procedure used for the calculation of digital biomass was described in detail in our previous study [31]. Briefly, RGB images from three projections were acquired automatically by the phenotyping platform. Afterwards, the RGB images were transformed to the HSV color space; the H channel was used for determining the green mask. For the optimum threshold the Otsu method [33] was applied. This was followed by the Canny automatic edge detection algorithm [34] in order also to recognize the tiny offshoots of the pea plants precisely. Afterwards, the values of the green area (GA) obtained from particular images were used for the calculation of the digital biomass according to the following equation:
G A = ( A x 2 + A y 2 + A z 2 ) ,
where Ax, Ay and Az are the respective projections [31]. The relative growth rate (RGR) was calculated according to [35] as follows:
R G R = ( l n W 2 ¯ l n W 1 ¯ ) / ( t 2 t 1 ) ,
where l n W 1 ¯ and l n W 2 ¯ are the means of the natural logarithms of the plant’s green areas at the times t1 and t2 at which the green areas were measured. The masking of the images of ChlF was performed in the FluorCam software. The overall plant mask was found by simple thresholding based on the signal strength in “measuring mode”.

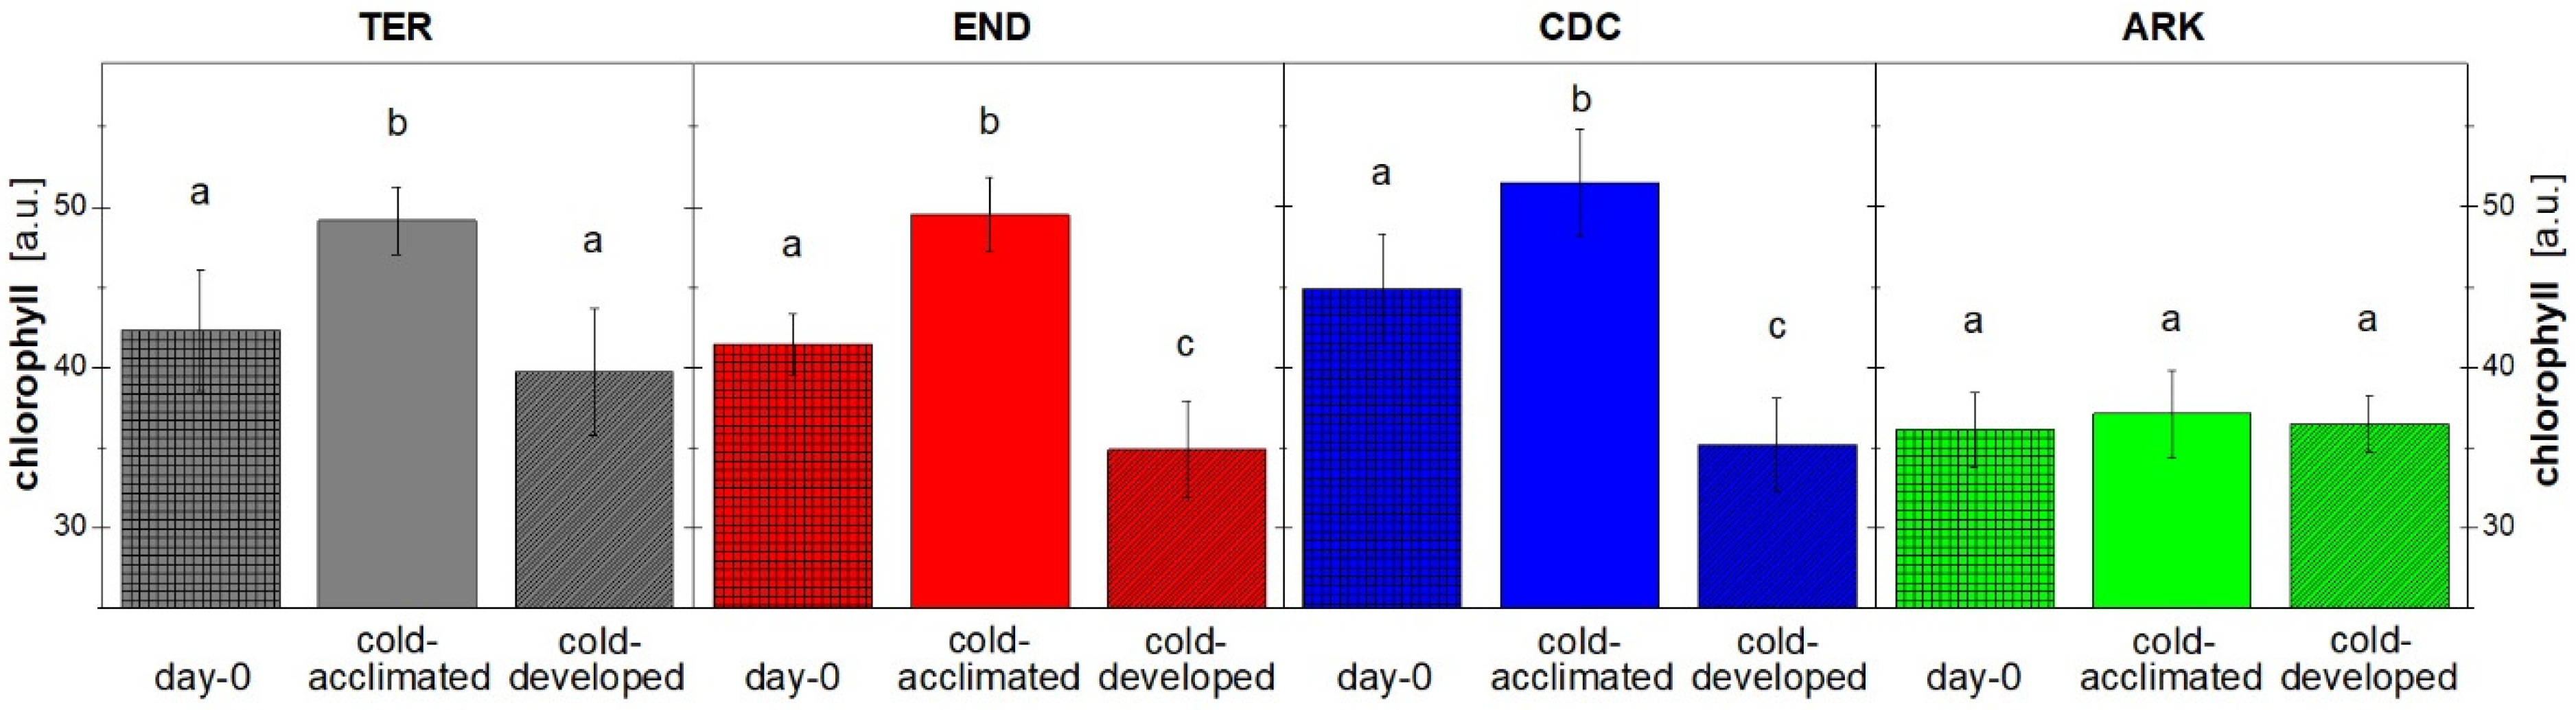
2.3. Chlorophyll Content and Chlorophyll Fluorescence Induction by Conventional Devices

The chlorophyll content and ChlF induction curves (O-J-I-P transients) were measured on the adaxial side of the leaves/stipules after 25 min of dark adaptation using hand-operated conventional (nonimaging) devices. The chlorophyll content was measured using an SPAD-502 chlorophyll meter (Minolta Sensing Konica, Osaka, Japan) and the O-J-I-P transients by a FluorPen FP 100 fluorometer (Photon Systems Instruments, Brno, Czech Republic). Measurements were performed on the second (cold-acclimating) and on the third (cold-developed) leaves/stipules. The duration of the excitation blue light (455 nm, 1000 µmol photons of PAR m−2 s−1) was 1 s. The maximum quantum yield of the primary PSII photochemistry (FV/FM) was calculated as:
FV/FM = (FVF0)/FM;
and the initial slope of the O-J ChlF rise (dV/dt)0 was evaluated as:
(dV/dt)0 = (F300µsF0)/(0.28 (FMF0)),
where F300µs is the ChlF intensity at the indicated time, F0 is a minimal ChlF and FM is ChlF at the P step. The (dV/dt)0 parameter, defined as the maximal rate of the accumulation of the fraction of closed reaction centers of PSII (RCII) [36], reflects the rate of excitation supply into the RCII, i.e., the apparent PSII antenna size, and consequently the rate of QA reduction.
The performance index on the absorption basis (PIABS) and the total performance index on the absorption basis (PIABS,total) were calculated as:
PIABS = (RC/ABS) ((FV/FM)/(1 − (FV/FM))) (ψE0/(1 − ψE0)),
PIABS,total = PIABS (δR0/(1 − δR0)),
where RC/ABS is the ratio of the total number of active PSII reaction centers (RC) per absorption flux (ABS), ψE0 is the efficiency with which a PSII trapped electron is transferred from QA to the plastoquinone and δR0 is the efficiency with which an electron from the reduced plastoquinone is transferred to the final PSI acceptors. The particular parameters were calculated as:
RC/ABS = (FV/FM)/((dV/dt)0)/VJ),
ψE0 = 1 − VJ,
δR0 = (FMFI)/(FMFJ),
where VJ is the relative variable ChlF at the J-step of the O-J-I-P transient defined as:
VJ = (FJF0)/FV.
where FJ (FI) is the ChlF signal at the J-step (I-step). For a review of the PIs see, e.g., [22].

2.4. Statistical Analysis

The data sets were first tested for normality (Kolmogorov–Smirnov test with Lilliefors’ correction) and equality of variances (Levene Median test). For parametric data, the ANOVA test (with all pairwise multiple comparison by the Holm–Sidak post-hoc test) was used and for nonparametric data, the Kruskal–Wallis ANOVA on Ranks test (with all pairwise multiple comparison by the Tukey test) was used. The critical probability level of 0.05 was chosen for all tests (P < 0.05 are indicated solely by different letters). The testing was performed using SigmaPlot version 11 (Systat Software, USA).

3. Results

3.1. Growth and Chlorophyll Content

Images of pea plants of all four cultivars that were tested were taken from three orthogonal directions during the cold treatment, and the changes in the green area (GA; calculated according to Equation (6)) and relative growth rate (RGR; calculated according to Equation (7)) are presented in Figure 1. The only cultivar with leaves—Arkta (ARK)—had the highest GA when grown at 21 °C (Figure 1 and Figure S1). Although this cultivar is, of all the cultivars that were tested, supposed to overcome the most severe winters, its growth rate (RGR) decreased to the lowest values after the shift to 5 °C. The cultivar Terno (TER), with the lowest cold resistance, on the other hand, showed the most marked increase in GA and, significantly, the highest RGR after the drop in the temperature from 21 °C to 5 °C (Figure 1). The two cold-resistant cultivars of the afila type—Enduro (END) and CDC Le Roy (CDC)—exhibited a lower GA in comparison to ARK and TER but their RGR during the cold treatment was similar to, or higher than, the growth of ARK.
Interesting changes were also observed in the chlorophyll content (Figure 2). When grown at 21 °C, the second leaves (Day 0) of ARK had the significantly lowest chlorophyll content of all the cultivars that were tested (Figure S1). The cultivars of the afila type (TER, END and CDC) thus probably needed to counterbalance the loss of photosynthetically active area caused by the transformation of their leaves into tendrils. In this way, the tendrils brought the advantage of increased lodging resistance and the loss of photosynthetically active area was compensated for by the increased chlorophyll content. This difference was even more marked when the air temperature dropped to 5 °C for 22 days. All the second stipules of the cultivars of the afila type that were transferred to 5 °C (cold-acclimated) markedly increased their chlorophyll content. The acclimation of the stipules to cold thus led to an increase in the chlorophyll content. However, the third stipules, which emerged and developed at the lower temperature (cold-developed), had a lower chlorophyll content than the cold-acclimated second stipules. In the case of END and CDC, the cold-developed third stipules had an even lower chlorophyll content than the second stipules (developed at 21 °C) on Day 0. On the other hand, the leaves of ARK did not show any significant changes in their chlorophyll content (Figure 2).

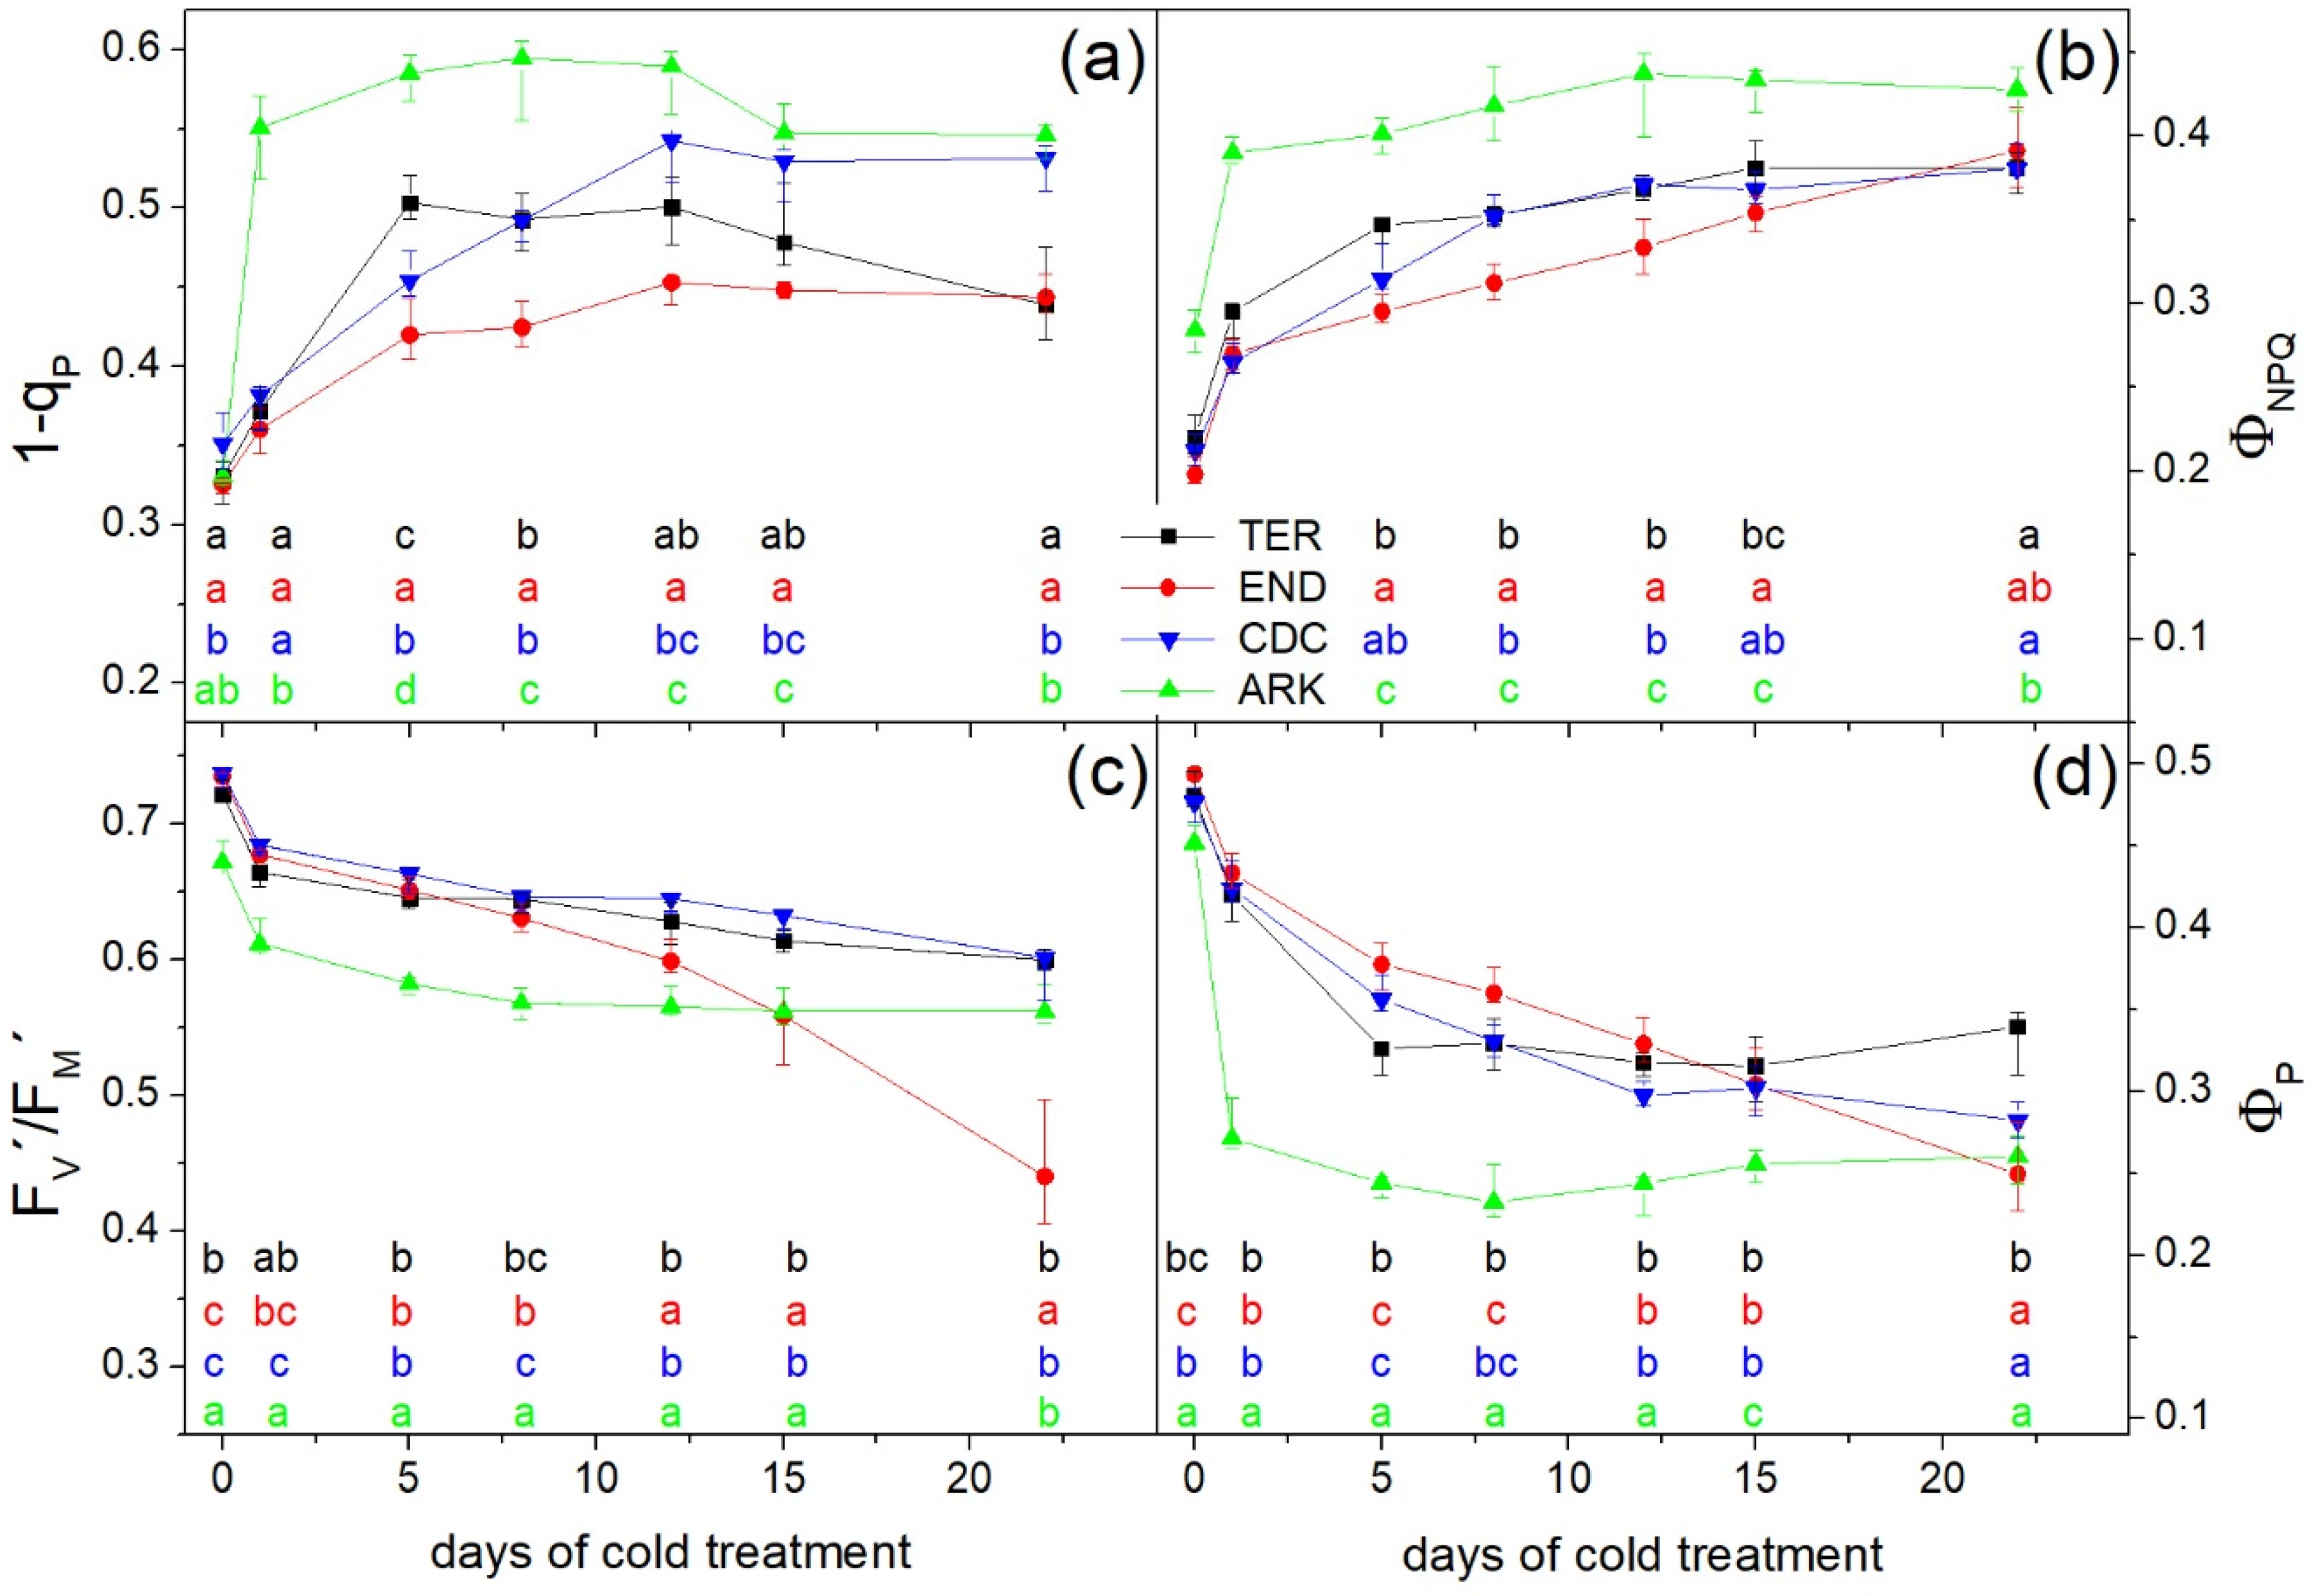
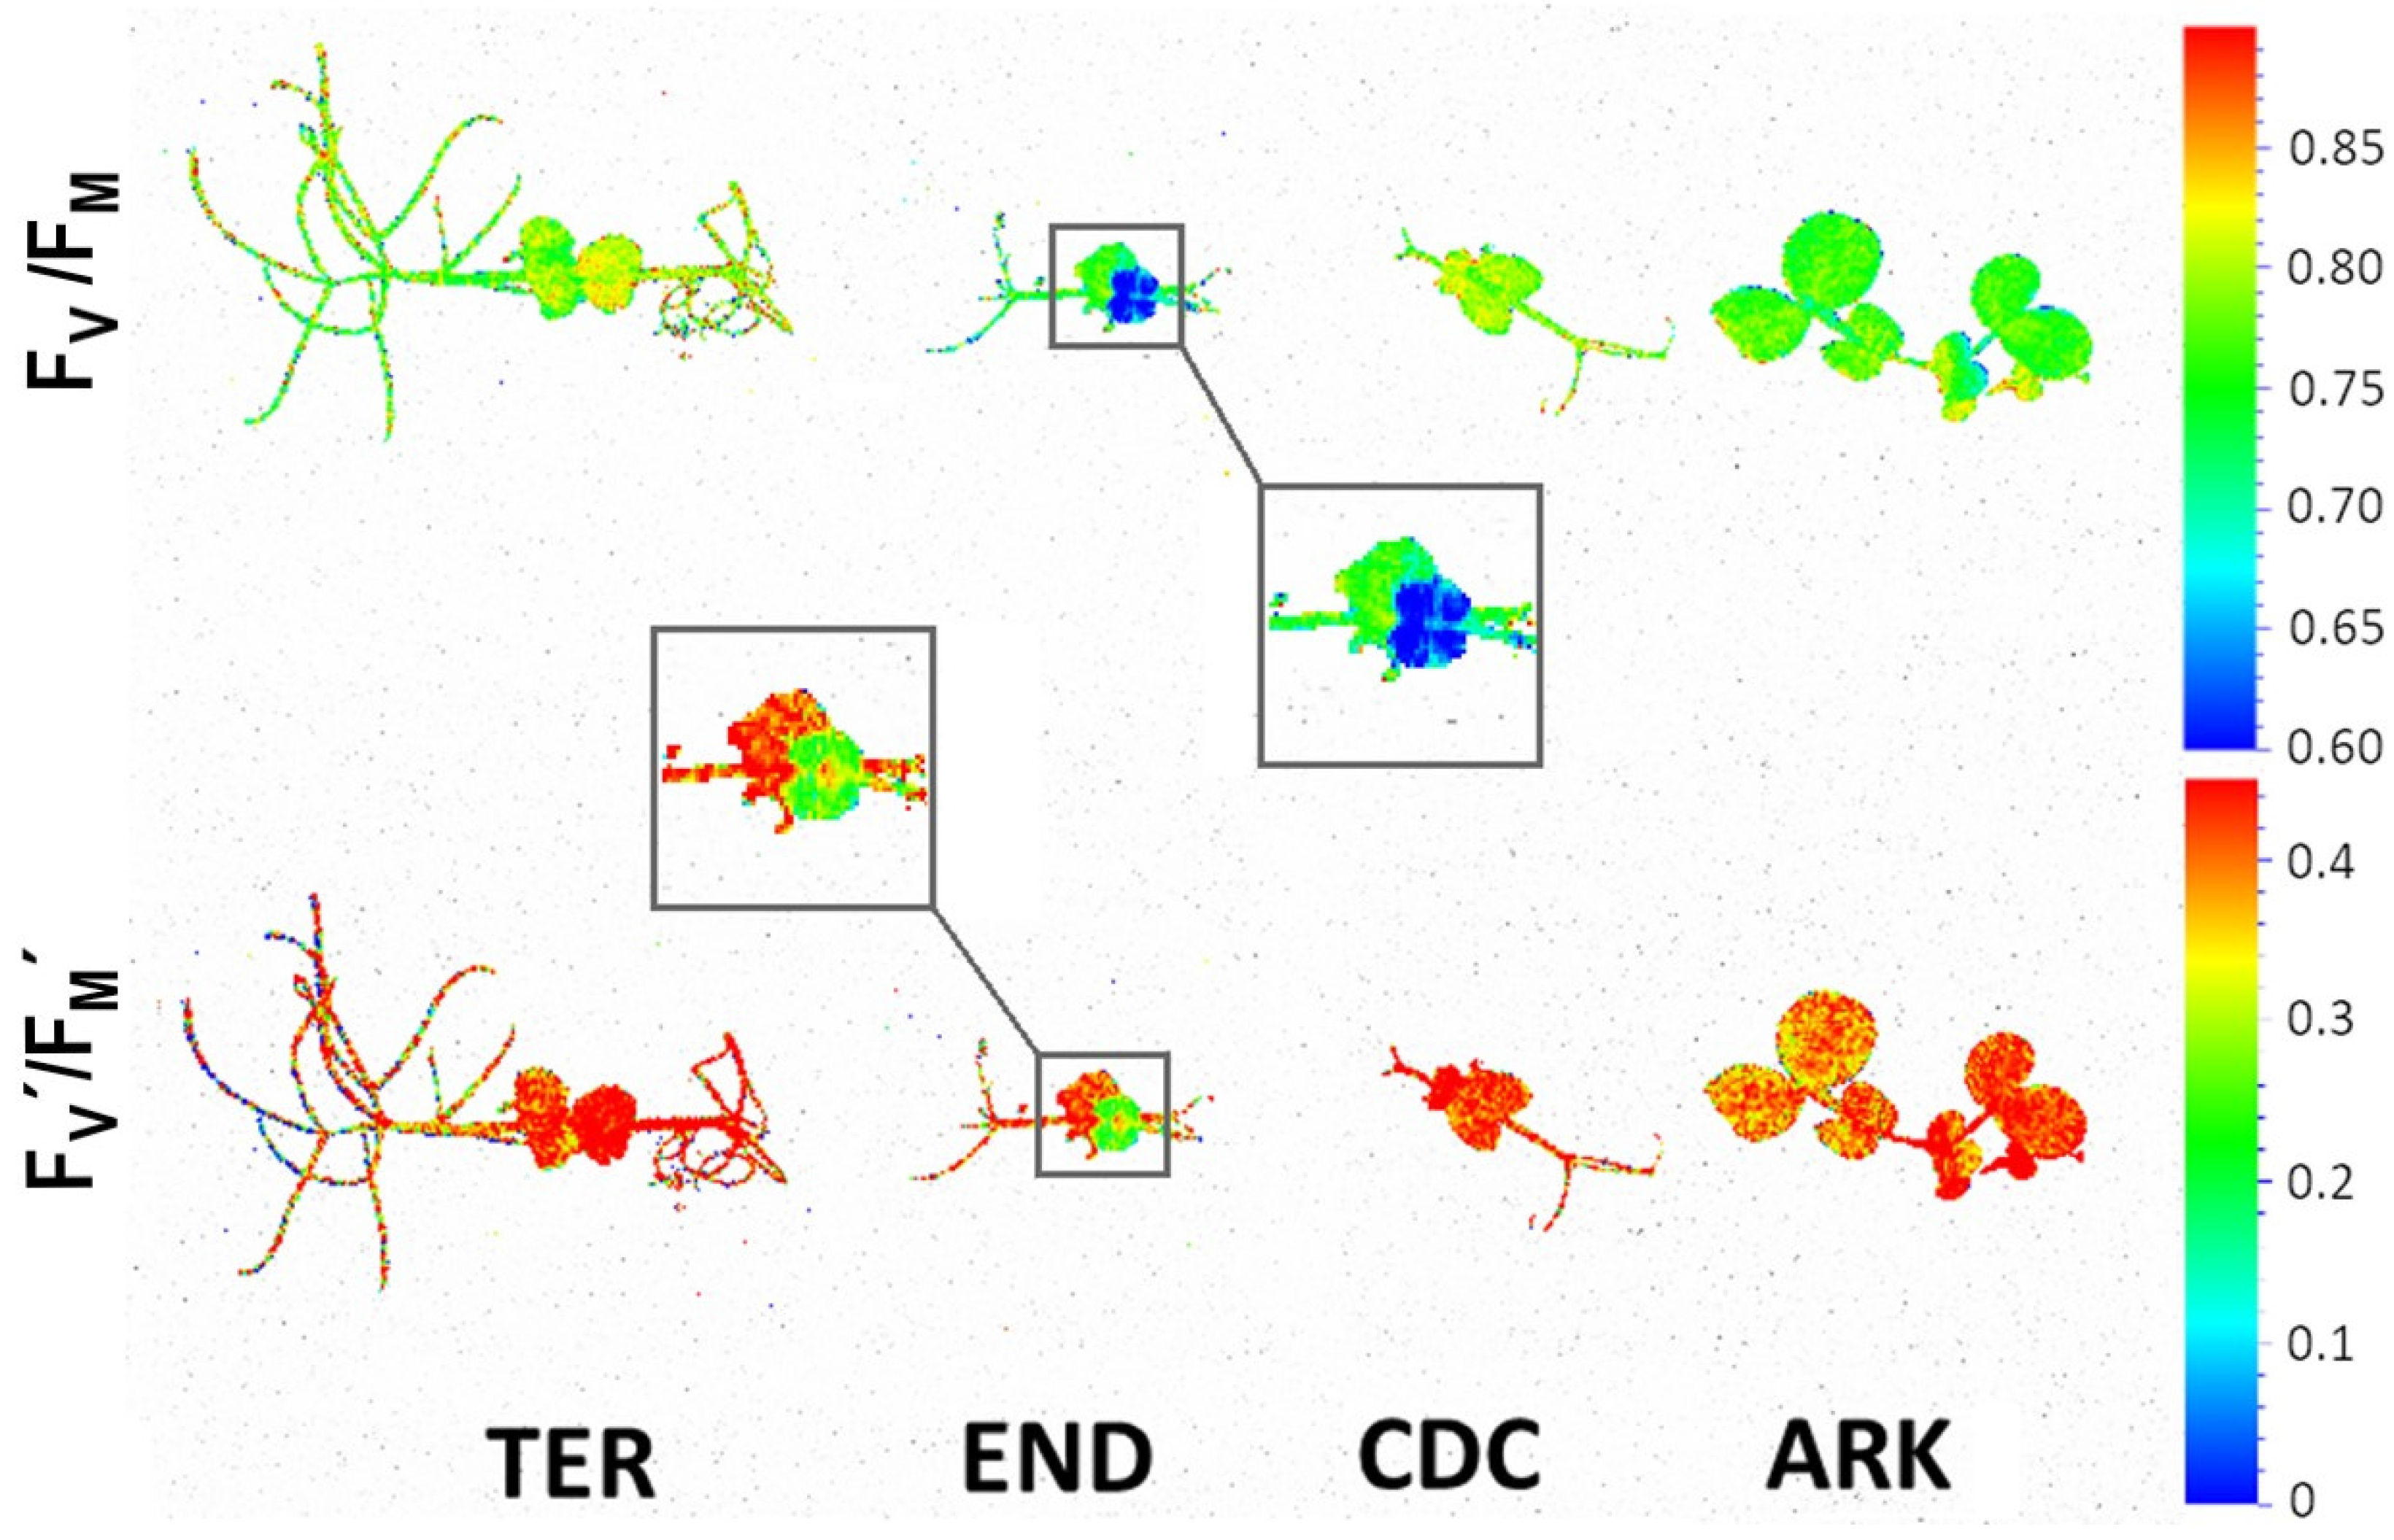
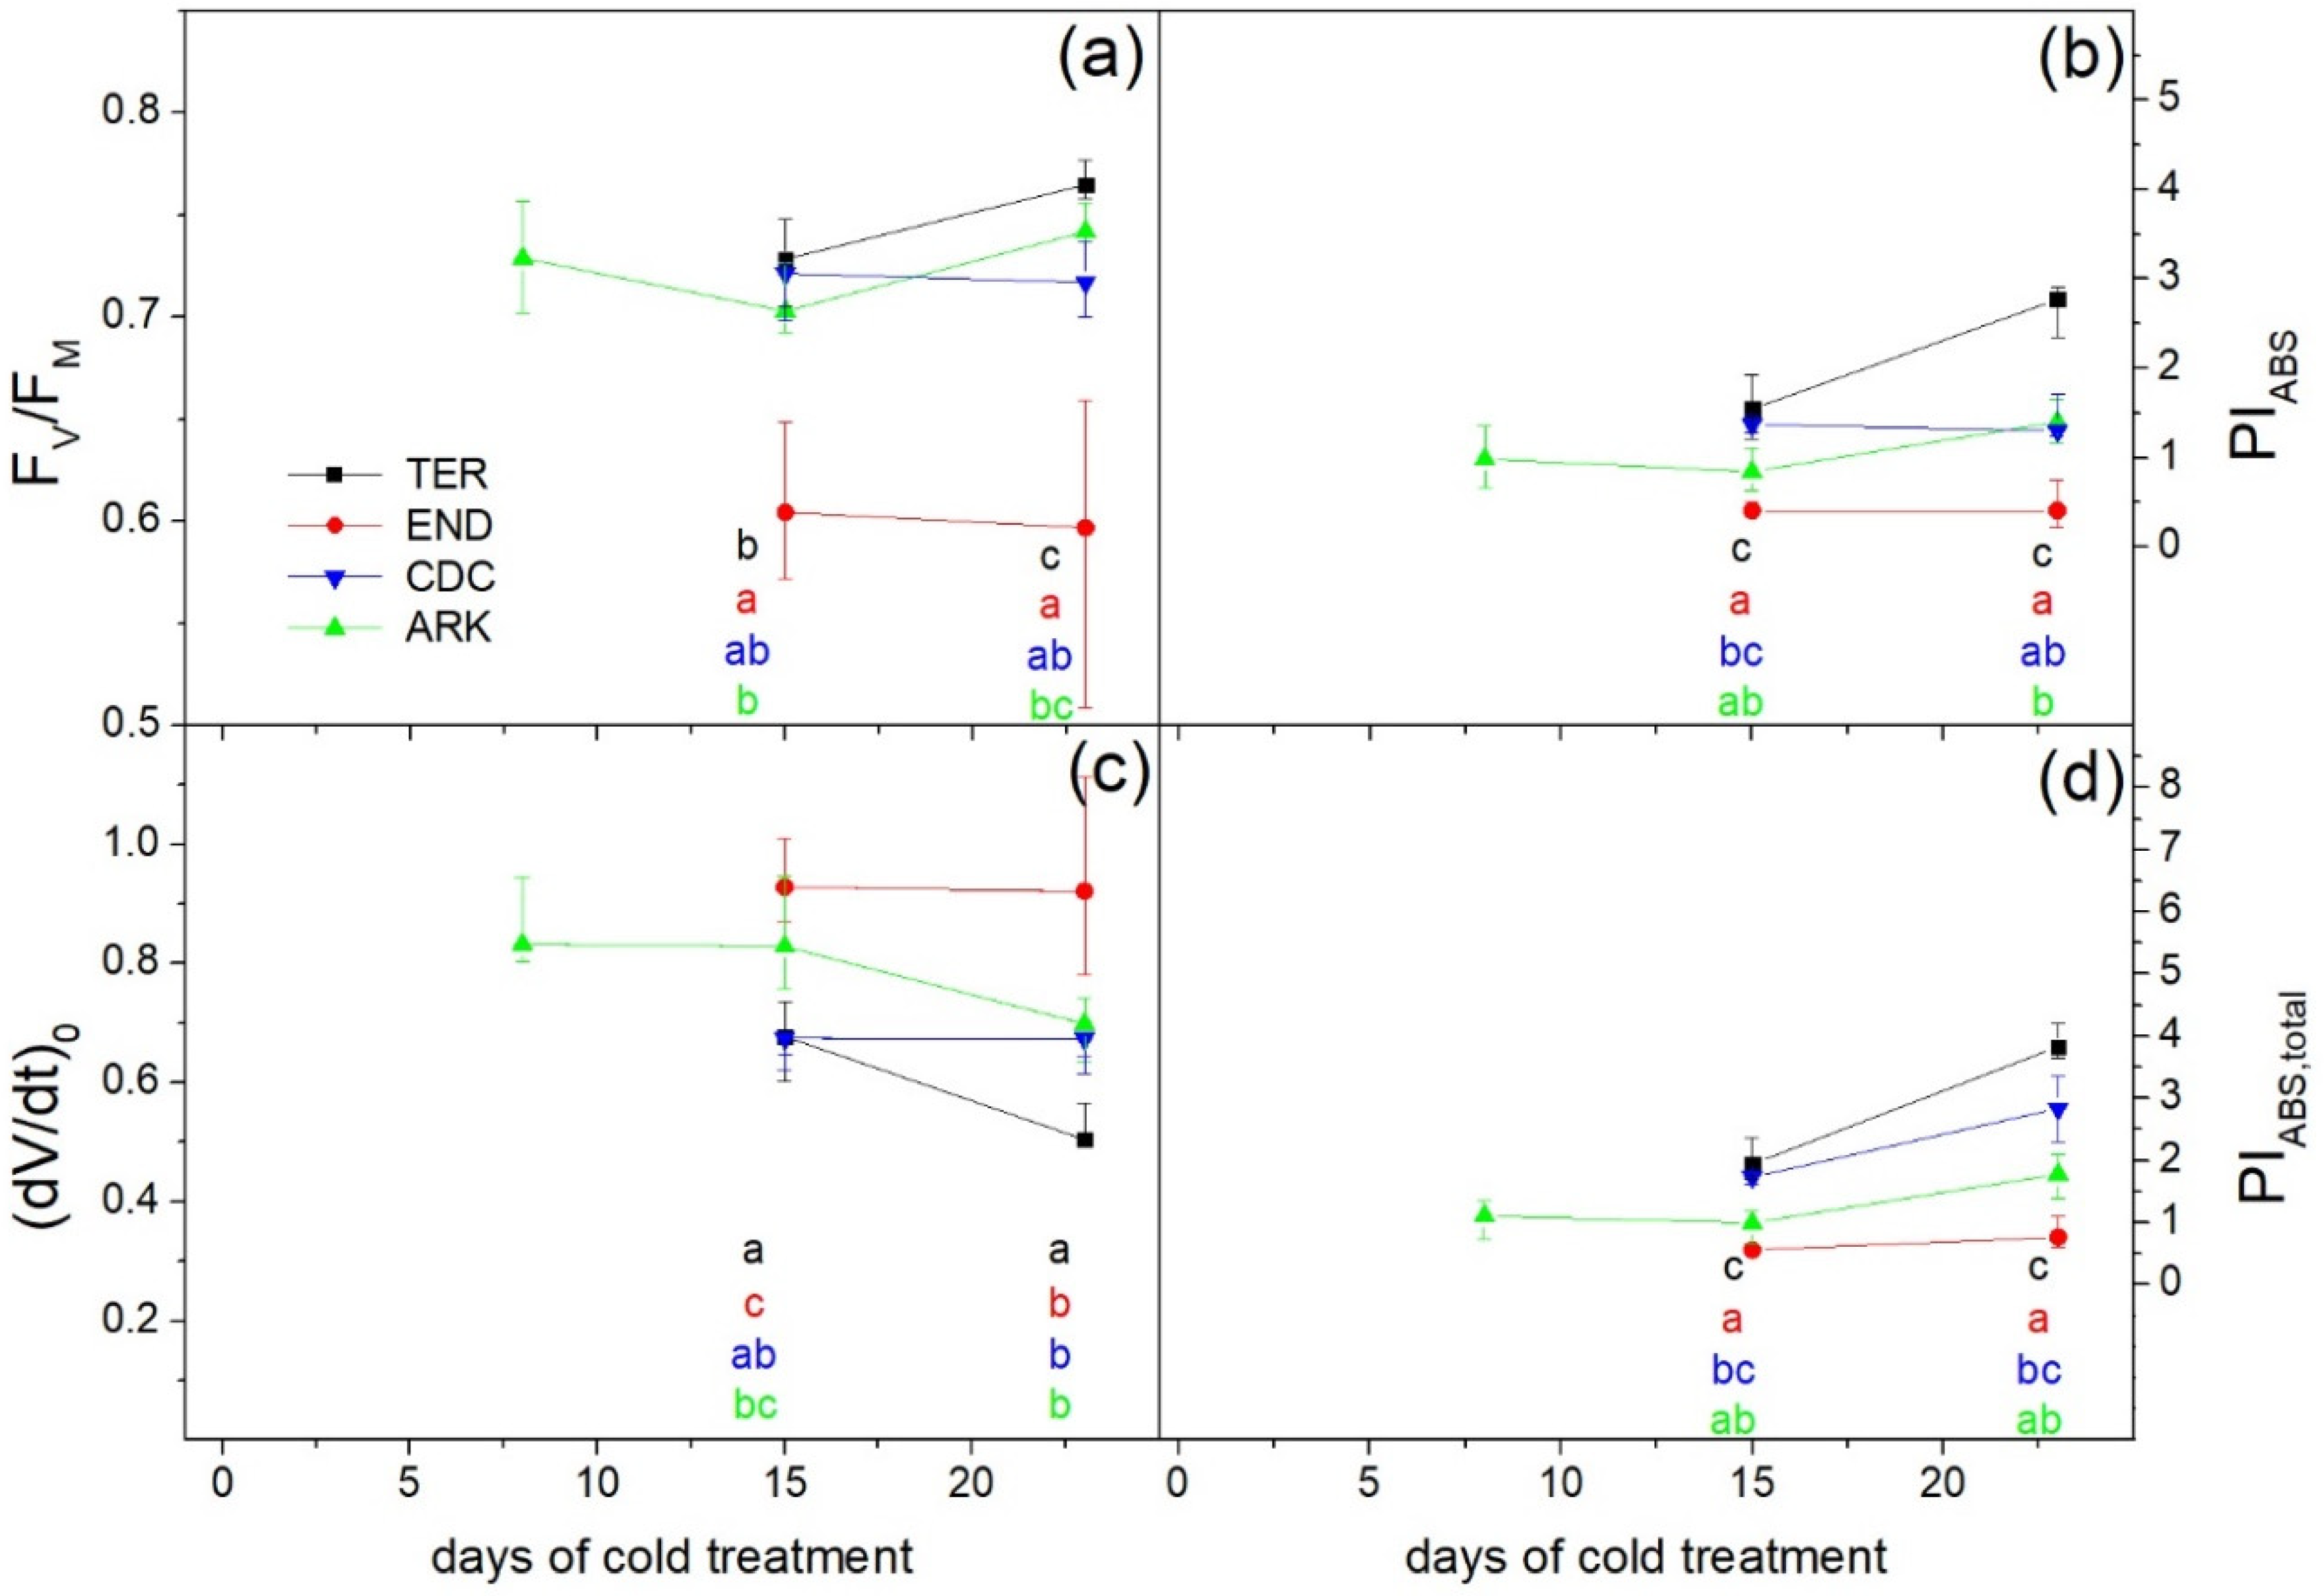
3.2. Photosynthetic Performance

The measurements of ChlF induction by both conventional (nonimaging) and imaging fluorometers and the evaluation of selected parameters brought further interesting results. ARK, as the only cultivar known to survive the freezing winters of the European central zone, exhibited the most marked decrease in the efficiency of PSII photochemistry in the dark-adapted state (FV/FM) during the beginning of the cold treatment. In the later phase of the cold treatment (after 15 days), FV/FM started to recover (Figure 3a). The TER, END and CDC cultivars showed much weaker inhibition of FV/FM during the cold acclimation of the second leaf. Surprisingly, the CDC cultivar exhibited its strongest inhibition after the 15th day of cold treatment, when the cold-acclimated leaves of ARK were already recovering. TER and END did not show such a marked inhibition after two weeks of cold treatment (Figure 3a).
Further analysis of the fast ChlF transient revealed that while the initial slope of the O-J ChlF rise (dV/dt)0 during the cold acclimation of the second stipules of all the cultivars had a rather decreasing trend, AKR showed a strong increase during the first eight days of cold treatment (Figure 3c). This strong increase in (dV/dt)0 reflects the increase in the apparent PSII antenna size and thus the fastest reduction of QA in PSIIs in ARK among all the cultivars that were explored. All the cultivars of the afila type (TER, END and CDC) kept the (dV/dt)0 relatively low.
The course of PIABS (it reflects the function of electron transport in PSII and the plastoquinone pool), during the cold treatment in the second leaves of ARK (Figure 3b) resembles the course of FV/FM in these leaves (Figure 3a). The PIABS of the second leaves of ARK was the lowest among all the cultivars during the time period of cold acclimation (Figure 3b). After an initial small decrease in PIABS in the second stipules of END and TER, the index rises after eight days at 5 °C, the rise being higher in TER than in END (Figure 3b). On the other hand, the second stipules of CDC kept about the same value of PIABS during the first eight days at 5 °C, then PIABS decreased slightly and started to increase after 15 days of cold acclimation.
The course of PIABS,total (it reflects the function of electron transport in the whole thylakoid membrane) of the second leaves of ARK (Figure 3d) resembles the course of PIABS of the leaves (Figure 3b), and the PIABS,total was again the lowest during cold acclimation among all the cultivars that were explored (Figure 3d). The END and TER cultivars showed increasing values of PIABS,total of their second stipules during the whole time of acclimation, the values being significantly higher in TER than in END (Figure 3d). PIABS,total also increased in the second stipules of CDC, reaching values between TER and END after 15 days of acclimation at 5 °C.
Beside the above ChlF parameters obtained with a conventional (nonimaging) fluorometer, we used ChlF imaging, which collects ChlF from whole plants. The parameters calculated from measurements with ChlF imaging (Figure 4) thus represent the average photosynthetic performance of the whole plant.
The faster supply of excitations to RCIIs after the transition of the ARK plants to 5 °C (Figure 3c) corresponded with a marked rise in the fraction of closed RCIIs (1 − qP) as a result of increased excitation pressure in the light-adapted state (Figure 4a). The other cultivars also showed an increase in 1 − qP, but milder than that observed in ARK. CDC reached its maximal 1 − qP on about the 12th day of cold treatment, when the 1 − qP of ARK was already stabilized and had started to decrease. Increased excitation pressure probably led to the increase in the quantum yield of regulatory light-induced nonphotochemical quenching (ΦNPQ; Figure 4b).
The quantum yield of PSII photochemistry in the light-adapted state (ΦP) showed a steep initial decrease in ARK (Figure 4d), and then remained almost unchanged until the end of the cold acclimation. This is not surprising since ΦP is a product of qP and FV′/FM′ (Equation (5); see Figure 4a,c). Interestingly, the ΦP of END and CDC decreased during the cold acclimation in a similar way (Figure 4d), even if particular contributions to ΦP showed different courses in END and CDC (Figure 4a,c). The pronounced decrease in FV′/FM′ at the end of the cold acclimation of END (Figure 4c) is compensated for by the lowest values of 1 − qP, and thus the highest values of qP, of END (Figure 4a). The ΦP of TER decreased during the cold acclimation in a similar way as in ARK but the decrease in ΦP was not so pronounced in TER as in ARK (Figure 4d).
Although ARK reached the significantly lowest values of FV′/FM′ during the first eight days of cold treatment (Figure 4c), and all the cultivars of the afila type kept their value of FV′/FM′ higher, after the 12th day of cold treatment the FV′/FM′ of END started to fall, and at the end of the cold treatment it was significantly the lowest. This observation is surprising when we take into account that FV/FM (the same parameter measured in the dark-adapted state of the second stipules) was at the same time kept at a high level (Figure 3a). An explanation of this phenomenon was found when we went through the images of the spatial distribution of the ChlF parameters.
The image of the spatial distribution of FV/FM and FV′/FM′ (Figure 5) demonstrates strong spatial heterogeneity, particularly in the END cultivar. While the cold-acclimated second stipules of END kept the PSII photochemistry at a relatively high level (green and red colors for FV/FM and FV′/FM′, respectively), the third stipules, which emerged and developed already under the cold treatment (cold-developed), had their PSII photochemistry markedly reduced (blue and green colors for FV/FM and FV′/FM′, respectively). (Dynamics of development of the third leaves is described in the supplementary file S2). Since all the parameters of the quenching analyses were obtained from ChlF imaging, which collects and averages the ChlF signal from the whole plant, the FV′/FM′ of the END cultivar was probably distorted by substantial differences between the second (cold-acclimated) and third (cold-developed) stipules. Confirmation of this finding was offered by the measurements of the ChlF using a conventional (nonimaging) fluorometer on the cold-developed leaves/stipules separately. Although END had quite well-maintained FV/FM in the cold-acclimated second stipules (Figure 3a), its cold-developed third stipules had their FV/FM markedly reduced (Figure 6a).
Further, TER showed a lower, and END even a markedly lower, FV/FM in the third stipules that developed at 5 °C (Figure 6a) when compared to the second stipules (Figure 3a). Contrary to that, the FV/FM of the cold-developed ARK leaves was slightly higher than of the cold-acclimated ARK leaves (Figure 6a). While the cold-developed ARK leaves had about the same values of PIABS (Figure 6b) as the cold-acclimated ARK leaves (Figure 3b), the PIABS of the cold-developed stipules of TER, CDC and END were significantly lower (Figure 6b) than in the cold-acclimated stipules (Figure 3b), the decrease being the highest in the END stipules. The time courses of the PIABS,total of the cold-developed leaves/stipules (Figure 6d) were about the same as the courses of the PIABS of the cold-developed leaves/stipules (Figure 6b). Although all the cultivars of the afila type (TER, END and CDC) kept the (dV/dt)0 relatively low in their second stipules (Figure 3c), their cold-developed third stipules had the (dV/dt)0 at a higher level (Figure 6c).

4. Discussion

The transformation of leaves into tendrils brought to the pea plants of the afila type the advantage of increased lodging resistance [4]. The connection of the acquired increased lodging resistance with the advantage of autumn sowing could bring further benefits in the form of higher biomass production and lower loses caused by the drought of late spring. However, at present there are no cultivars of the afila type that would be able to survive the winters of the European central zone. The question remained whether known cold-resistant cultivars of the afila type could be useful for breeding a cultivar that would be able to survive winters with freezing temperatures. We compared a “normal-leaf” cultivar, ARK, that is able to survive autumn sowing in the European central zone [28] with three cultivars of the afila type: a spring cultivar susceptible to low temperatures (TER) [15,27], and two cold-resistant cultivars (CDC and END) [25,26]. On the basis of a comparison of the cold-acclimated (already developed at the beginning of the cold treatment) and the cold-developed (developed during the cold treatment) leaves/stipules, we found various strategies of acclimation to cold of particular pea cultivars. Our work not only describes the differences among the cultivars, but also points out that an important piece of information can be lost when the signal is averaged from the whole plant area without the separation of the new leaves/stipules developed under stress.
All three cultivars of the afila type (TER, END and CDC) compensated for the loss of photosynthetically active area (Figure 1) by significant increases in their chlorophyll content (Figure 2) and in the efficiency of PSII photochemistry in the light-adapted state (Figure 4c,d), compared to the cultivar ARK with normal leaves. A further crucial difference between the leaves of ARK and stipules of the three cultivars of the afila type was found in the performance indices during the cold treatment. The drop in the temperature to 5 °C induced a marked decrease in both PIABS and PIABS,total in the leaves of ARK (Figure 3b,d). Such changes were already commonly described on the cold-acclimated leaves of different species during treatment at 4 °C and 8 °C [23], and 10 °C [24]. Nevertheless, the cold-acclimating stipules of TER, END and CDC exhibited the opposite trend to that observed in ARK and described in the literature [23,24]. Their PIs increased significantly during the cold treatment (Figure 3b,d). This suggests that stipules react to cold treatment differently than the leaves. Interestingly, this different behavior of the stipules disappeared in the cold-developed organs, where PIABS dropped below the values before the cold treatment both in the leaves and stipules (Figure 6b). Fundamental differences between the cold-acclimated and cold-developed leaves have already been described at the metabolome level for Arabidopsis [37]; the authors found that some metabolic networks are modulated by the environment, but some require full development under low-temperature conditions.
Although ARK, as the only cultivar with normal leaves, had the biggest GA when grown at 21 °C (Supplementary file S1), after the transition to 5 °C, its growth rate decreased most markedly of all the cultivars that were tested (Figure 1). This decrease was associated with the significantly most marked decrease in photosynthetic activity (Figure 3 and Figure 4). Thus, ARK markedly reduced the building of photosynthetic tissue and its activity after the shift to cold. This strategy is in agreement with the literature; the cold acclimation is accompanied by a decrease in growth (reviewed in [38]) and since sugars are not necessary to be synthesized to support growth, starch, as a source of energy for further usage, is synthesized preferentially at the expense of monosaccharides. Indeed, a negative correlation between plant growth and starch accumulation in plant leaves has been reported (reviewed in [39]). Further, these changes are accompanied by downregulation of photosynthetic activity, as observed in ARK (Figure 3 and Figure 4), the downregulation being driven by reprogramming of gene expression (reviewed in [40]). This strategy of sheltering resources might be advantageous in the case of a prospective freezing winter. Nevertheless, when no further signs of upcoming winter, such as greater decreases in the temperature or shortening of the day, occurred during the next three weeks, the leaves of ARK acclimated to the cold and the photosynthetic efficiency began to grow again (Figure 3a,b, Figure 4d). Subsequently, the relative growth rate also increased slightly (Figure 1).
On the other hand, TER, as the cultivar with the lowest cold resistance [15,27], showed the significantly lowest inhibition of growth rate during the cold treatment (Figure 1), the highest chlorophyll content in the cold-developed stipules (Figure 2) and the highest performance indices at the end of the cold treatment (Figure 6b,d). A similar conclusion was reached by Dahal et al., who reported that upon cold acclimation winter cultivars of wheat and rye exhibited high maintenance energy (per unit plant volume) and that the energy was stored and later utilized for rapid reproductive growth in spring, since the spring cultivars continued in the transition from vegetative to reproductive state even during the cold acclimation and showed lower maintenance as a result of continued energy consumption for elongation growth [41].
Thus, among all the cultivars that were tested, TER seems to have lost the ability to sense cold as a signal for the reduction of growth most pronouncedly. Insensitivity to cold might be advantageous for spring sowing where no decreases to freezing temperatures are expected any more, and the plant is not limited to producing the biggest biomass. For autumn sowing, however, it means the loss of the ability of stress avoidance.
The two cold-resistant cultivars of the afila type (CDC and END) had the lowest GA (Figure 1) but on the whole, the other traits, such as RGR (Figure 1) and the parameters of the ChlF induction curves (Figure 3), were predominantly kept between the values obtained for ARK and TER during the cold acclimation. Remarkable changes were obtained when the third leaves/stipules, which emerged after the transition to cold (cold-developed), were analyzed separately from the second leaves/stipules, which were transferred to 5 °C from 21 °C (cold-acclimated) (Figure 5 and Figure 6). Although the cold-acclimated second stipules of END kept relatively high PSII photochemistry (and markedly higher then ARK; see Figure 3), the cold-developed third stipules of END exhibited the most marked inhibition of the parameters of PSII photochemistry (even significantly lower values than ARK had; Figure 6a,b), as well as of the total performance index on an absorption basis (Figure 6d). Thus, similarly to ARK, this cultivar reduced its photosynthetic activity and growth (see Figure 1), although, contrary to ARK, this inhibition does not occur in the cold-acclimated organs (stipules) but manifests itself predominantly in the cold-developed parts. Then, despite the fact that END does not bear the characteristics of the genuine winter cultivar suitable for European continental winters, it might be useful for further research oriented toward winter cultivars of afila type. Nevertheless, we still should keep in mind that further factors, such as the responsiveness to the photoperiod [42], also play a prominent part in winter resilience (for a review see, e.g., [43]), and that cold acclimation in laboratory conditions does not always reflect real winter hardiness [44]. Further tests are thus needed, including a winter survival test in the field, to support this idea.
Our data further revealed that although plant phenotyping based on ChlF analyses represents a very sensitive tool for studies of plant adaptation to stress, the parameters calculated as averages from all plant organs are not optimal for the detection of delicate differences among cultivars in cold acclimation. Due to the fact that leaves from different shoot levels react in various manners, the information of our interest may be hidden in the average signal coming from the whole plant area. We further propound that the most marked changes reflecting the different responses to cold are manifested predominantly in the new leaves developing during the cold treatment.

5. Conclusions

On the basis of an evaluation of plant growth, chlorophyll content and photosynthetic function after the temperature drop from 21 °C to 5 °C in the leaves/stipules of TER, END, CDC and ARK pea cultivars, we conclude that despite the declared cold resistance of END and CDC, these cultivars do not have the genuine characteristics of a cultivar suitable for European continental winters. Although similar behavior as in END was also observed in the cold-acclimated stipules of other afila-type cultivars (TER, CDC), a significant decrease in photosynthetic function (FV/FM, PIABS, PIABS,total) occurred in the cold-developed END stipules. This decrease was even higher than in the cold-developed leaves of the winter cultivar ARK, where the decrease in photosynthetic function as a result of cold treatment was also observed in the cold-acclimated leaves. Thus, in the afila cultivars the most promising results were exhibited by the END cultivar, which showed the highest response to cold in the form of photosynthesis and growth inhibition, which can be seen as a storage preservation mechanism for overwintering. We further conclude that the parameters of ChlF calculated from the overall plant area are not optimal for the description of delicate differences in cold acclimation and recommend analyzing the leaves that developed after the transition to cold separately from the rest of the plant as a more precise strategy for the selection of cold-tolerant cultivars.

Supplementary Materials

The following are available online at https://www.mdpi.com/2072-4292/11/24/2964/s1.

Author Contributions

Conceptualization, M.H., J.F.H., A.H. and D.L.; project administration, coordination of the phenotyping process and data curation, J.F.H.; administration of the protocol for quenching analysis, D.L.; investigation of chlorophyll contents and ChlF induction transients, A.H.; formal analysis, D.L. and J.F.H.; writing—original draft preparation, A.H.; writing—review and editing, D.L. and J.F.H.; funding acquisition, L.S.; all authors revised the article.

Funding

This work was supported from the ERDF project “Plants as a tool for sustainable global development” (no. CZ.02.1.01/0.0/0.0/16_019/0000827) and from the Project of Ministry of Education CR no. RO0418.

Conflicts of Interest

The authors declare no conflict of interest. The funders had no role in the design of the study, in the collection, analyses or interpretation of data, in the writing of the manuscript, or in the decision to publish the results.

References

  1. Zohary, D.; Hopf, M. Domestication of Plants in the Old World; Oxford University Press: Oxford, UK, 2000; 316p. [Google Scholar]
  2. Riehl, S.; Zeidi, M.; Conard, N.J. Emergence of agriculture in the foothills of the Zagros Mountains of Iran. Science 2013, 341, 65–67. [Google Scholar] [CrossRef] [PubMed]
  3. Dahl, W.J.; Foster, L.M.; Tyler, R.T. Review of the health benefits of peas (Pisum sativum L.). Br. J. Nutr. 2012, 108 (Suppl. S1), S3–S10. [Google Scholar] [CrossRef] [PubMed] [Green Version]
  4. Biddle, A.J. Peas and beans. In Crop Production Science in Horticulture 25; CABI: Boston, MA, USA, 2017; pp. 3–9. [Google Scholar]
  5. Avia, K.; Pilet-Nayel, M.L.; Bahrman, N.; Baranger, A.; Delbreil, B.; Fontaine, V.; Hamon, C.; Hanocq, E.; Niarquin, M.; Sellier, H.; et al. Genetic variability and QTL mapping of freezing tolerance and related traits in Medicago truncatula. Theor. Appl. Genet. 2013, 126, 2353–2366. [Google Scholar] [CrossRef] [PubMed]
  6. Dhillon, T.; Pearce, S.P.; Stockinger, E.J.; Distelfeld, A.; Li, C.X.; Knox, A.K.; Vashegyi, I.; Vagujfalvi, A.; Galiba, G.; Dubcovsky, J. Regulation of freezing tolerance and flowering in temperate cereals: The VRN-1 connection. Plant Physiol. 2010, 153, 1846–1858. [Google Scholar] [CrossRef] [PubMed] [Green Version]
  7. Mikkelsen, M.D.; Thomashow, M.F. A role for circadian evening elements in cold-regulated gene expression in Arabidopsis. Plant J. 2009, 60, 328–339. [Google Scholar] [CrossRef] [PubMed]
  8. Franklin, K.A.; Whitelam, G.C. Light-quality regulation of freezing tolerance in Arabidopsis thaliana. Nat. Genet. 2007, 39, 1410–1413. [Google Scholar] [CrossRef]
  9. Thomashow, M.F. Plant cold acclimation: Freezing tolerance genes and regulatory mechanisms. Annu. Rev. Plant Physiol. Plant Mol. Biol. 1999, 50, 571–599. [Google Scholar] [CrossRef] [Green Version]
  10. Stoddard, F.L.; Balko, C.; Erskine, W.; Khan, H.R.; Link, W.; Sarker, A. Screening techniques and sources of resistance to abiotic stresses in cool-season food legumes. Euphytica 2006, 147, 167–186. [Google Scholar] [CrossRef]
  11. Mikić, A.; Mihailović, V.; Ćupina, B.; Đordević, V.; Milić, D.; Duc, G.; Stoddard, F.L.; Lejeune-Hénaut, I.; Marget, P.; Hanocq, E. Achievements in breeding autumn-sown annual legumes for temperate regions with emphasis on the continental Balkans. Euphytica 2001, 180, 57–67. [Google Scholar] [CrossRef]
  12. McPhee, K.E.; Muehlbauer, F.J. Registration of ‘Specter’ winter feed pea. J. Plant. Reg. 2007, 1, 118–119. [Google Scholar] [CrossRef]
  13. Xiaoyan, Z.; Shuwei, W.; Junjie, H.; Jinguo, H.; Tao, Y.; Xuxiao, Z. Large-scale evaluation of pea (Pisum sativum L.) germplasm for cold tolerance in the field during winter in Qingdao. Crop J. 2016, 5, 377–383. [Google Scholar]
  14. Lejeune-Henaut, I.; Hanocq, E.; Bethencourt, L.; Fontaine, V.; Delbreil, B.; Morin, J.; Petit, A.; Devaux, R.; Boilleau, M.; Stempniak, J.-J.; et al. The flowering locus Hr colocalizes with a major QTL affecting winter frost tolerance in Pisum sativum L. Theor. Appl. Genet. 2008, 116, 1105–1116. [Google Scholar] [CrossRef] [PubMed]
  15. National List of Varieties Listed in the State Variety Book by 15 June 2018; Central Institute for Supervising and Testing in Agriculture: Brno, Czech, 2018; 90p. (In Czech)
  16. Humplík, J.F.; Lazár, L.; Husičková, A.; Spíchal, L. Automated phenotyping of plant shoots using imaging methods for analysis of plant stress responses—A review. Plant Methods 2015, 11, 29. [Google Scholar] [CrossRef] [PubMed] [Green Version]
  17. Enders, T.A.; St. Dennis, S.; Oakland, J.; Callen, S.T.; Gehan, M.A.; Miller, N.D.; Spalding, E.P.; Springer, N.M.; Hirsch, C.D. Classifying cold-stress responses of inbred maize seedlings using RGB imaging. Plant Direct 2019, 3, e00104. [Google Scholar] [CrossRef] [Green Version]
  18. Chiluwal, A.; Bheemanahalli, R.; Perumal, R.; Asebedo, A.R.; Bashir, E.; Lamsal, A.; Sebela, D.; Shetty, N.J.; Krishna Jagadish, S.V. Integrated aerial and destructive phenotyping differentiates chilling stress tolerance during early seedling growth in sorghum. Field Crop Res. 2018, 227, 1–10. [Google Scholar] [CrossRef]
  19. Lazár, D. Chlorophyll a fluorescence induction. Biochim. Biophys. Acta 1999, 1412, 1–28. [Google Scholar] [CrossRef] [Green Version]
  20. Moura, D.S.; Brito, G.G.; Moraes, Í.L.; Fagundes, P.R.R.; Castro, A.P.; Deuner, S. Cold Tolerance in rice plants: Phenotyping procedures for physiological breeding. J. Agric. Sci. 2018, 10, 313–324. [Google Scholar] [CrossRef] [Green Version]
  21. Zhou, R.; Hyldgaard, B.; Yu, X.; Rosenqvist, E.; Ugarte, R.M.; Yu, S.; Wu, Z.; Ottosen, C.-O.; Zhao, T. Phenotyping of faba beans (Vicia faba L.) under cold and heat stresses using chlorophyll fluorescence. Euphytica 2018, 214, 68. [Google Scholar] [CrossRef]
  22. Stirbet, A.; Lazár, D.; Kromdijk, J.; Govindjee. Chlorophyll a fluorescence induction: Can just a one-second measurement be used to quantify abiotic stress responses? Photosynthetica 2018, 56, 86–104. [Google Scholar] [CrossRef]
  23. Baldassarre, V.; Cabassi, G.; Ferrante, A. Use of chlorophyll a fluorescence for evaluating the quality of leafy vegetables. Aust. J. Crop Sci. 2011, 5, 735–741. [Google Scholar]
  24. Adamski, J.M.; Cargnelutti, D.; Sperotto, R.A.; Terra, T.F.; Rosa, L.M.G.; Cruz, R.P.; Fett, J.P. Identification and physiological characterization of two sister lines of indica rice (Oryza sativa L.) with contrasting levels of cold tolerance. Can. J. Plant Sci. 2016, 96, 197–214. [Google Scholar] [CrossRef] [Green Version]
  25. Warkentin, T.; Klassen, E.; Bing, D.; Lopetinsky, K.; Kostiuk, J.; Barlow, B.; Ife, S.; Tar’an, B.; Vandenberg, A. CDC Tucker and CDC Leroy forage pea cultivars. Can. J. Plant Sci. 2009, 89, 661–663. [Google Scholar] [CrossRef]
  26. Mezlík, T.; Měřínská, S. Field Pea. Pisum sativum L.; Central Institute for Supervising and Control in Agriculture: Brno, Czech, 2010; 11p. (In Czech) [Google Scholar]
  27. Kreuzman, J.; Liška, M. Pea variety Terno. Czech J. Genet. Plant Breed. 2006, 42, 73–76. [Google Scholar] [CrossRef] [Green Version]
  28. Mezlík, T.; Měřínská, S. Fodder Pea—Winter Type. Pisum sativum Subsp. Arvense L.; Central Institute for Supervising and Control in Agriculture: Brno, Czech, 2017; 11p. (In Czech) [Google Scholar]
  29. Holubec, V.; Papoušková, L.; Faberová, I.; Zedek, V.; Dotlačil, L. Framework Methodology of the National Program of Conservation and Use of Plant Genetic Resources and Agrobiodiversity; VÚRV: Prague, Czech, 2015; 386p. (In Czech) [Google Scholar]
  30. Germplasm Resource Information Network (GRIN) Czech Release 1.10.3. Available online: https://grinczech.vurv.cz/gringlobal/search.aspx (accessed on 4 September 2019).
  31. Humplík, J.F.; Lazár, L.; Fürst, T.; Husičková, A.; Hýbl, M.; Spíchal, L. Automated integrative high-throughput phenotyping of plant shoots: A case study of the cold tolerance of pea (Pisum sativum L.). Plant Methods 2015, 11, 20. [Google Scholar] [CrossRef] [PubMed] [Green Version]
  32. Lazár, D. Parameters of photosynthetic energy partitioning. J. Plant Physiol. 2015, 175, 131–147. [Google Scholar] [CrossRef] [PubMed]
  33. Otsu, N. A threshold selection method from gray-level histograms. IEEE Trans. Systs. Man Cybern. 1979, 9, 62–66. [Google Scholar] [CrossRef] [Green Version]
  34. Canny, J.A. Computational approach to edge detection. IEEE Trans. Pattern Anal. 1986, 8, 679–698. [Google Scholar] [CrossRef]
  35. Hoffmann, W.A.; Poorter, H. Avoiding bias in calculations of relative growth rate. Ann. Bot. 2002, 90, 37–42. [Google Scholar] [CrossRef] [Green Version]
  36. Strasser, R.J.; Tsimilli-Michael, M.; Srivastava, A. The fluorescence transient as a tool to characterize and screen photosynthetic samples. In Probing Photosynthesis: Mechanisms, Regulation and Adaptation; Yunus, M., Pathre, U., Mohanty, P., Eds.; Taylor & Francis: London, UK, 2000; pp. 445–483. [Google Scholar]
  37. Gray, G.R.; Heath, D. A global reorganization of the metabolome in Arabidopsis during cold acclimation is revealed by metabolic fingerprinting. Physiol. Plant. 2005, 124, 236–248. [Google Scholar] [CrossRef]
  38. Xin, Z.; Browse, J. Cold comfort farm: The acclimation of plants to freezing temperatures. Plant Cell Environ. 2000, 23, 893–902. [Google Scholar] [CrossRef]
  39. de Freitas Lima, M.; Eloy, N.B.; de Siqueira, J.A.B.; Inzé, D.; Hemerly, A.S.; Ferreira, P.C.G. Molecular mechanisms of biomass increase in plants. Biotechnol. Res. Innov. 2017, 1, 14–25. [Google Scholar] [CrossRef]
  40. Chinnusamy, V.; Zhu, J.-K.; Sunkar, R. Gene regulation during cold stress acclimation in plants. Meth. Mol. Biol. 2010, 639, 39–55. [Google Scholar]
  41. Dahal, K.; Kane, K.; Gadapati, W.; Webb, E.; Savitch, L.V.; Singh, J.; Sharma, P.; Sarhan, F.; Longstaffe, F.J.; Grodzinski, B.; et al. The effects of phenotypic plasticity on photosynthetic performance in winter rye, winter wheat and Brassica napus. Physiol. Plant. 2012, 144, 169–188. [Google Scholar] [CrossRef] [PubMed]
  42. Annicchiarico, P.; Iannucci, A. Winter survival of pea, faba bean and white lupin cultivars in contrasting Italian locations and sowing times, and implications for selection. J. Agric. Sci. 2007, 145, 611–622. [Google Scholar] [CrossRef]
  43. Hüner, N.P.A.; Dahal, K.; Bode, R.; Kurepin, L.V. Photosynthetic acclimation, vernalization, crop productivity and ‘the grand design of photosynthesis’. J. Plant Physiol. 2016, 203, 29–43. [Google Scholar] [CrossRef] [PubMed]
  44. Rapacz, M.; Sasal, M.; Wójcik-Jagła, M. Direct and indirect measurements of freezing tolerance: Advantages and limitations. Acta Physiol. Plant. 2015, 37, 157. [Google Scholar] [CrossRef] [Green Version]
Figure 1. Green area (GA) and relative growth rate (RGR) of whole plants of the pea cultivars Terno (TER), Enduro (END), CDC Le Roy (CDC) and Arkta (ARK) in the course of cold treatment. Medians and quartiles are presented. Different letters indicate statistically significant differences among the cultivars on the same day (Holm–Sidak or Tukey tests; p < 0.05).
Remotesensing 11 02964 g001
Figure 2. Chlorophyll content of the pea cultivars Terno (TER), Enduro (END), CDC Le Roy (CDC) and Arkta (ARK) measured before the cold treatment (Day 0) on second leaves/stipules and after the 22-day-long cold treatment on second leaves/stipules (cold-acclimated) or on third leaves/stipules, which emerged during the cold treatment (cold-developed). Means and SD are presented. Different letters indicate statistically significant differences among the categories of the same cultivar (Holm–Sidak or Tukey tests; p < 0.05).
Remotesensing 11 02964 g002
Figure 3. The maximum quantum yield of primary PSII photochemistry in dark-adapted state (FV/FM; a); the performance index on an absorption basis (PIABS; b); the initial slope of the O-J ChlF rise ((dV/dt)0; c); and the total performance index on an absorption basis (PIABS,total; d) during cold treatment measured on the second leaves/stipules of the pea cultivars Terno (TER), Enduro (END), CDC Le Roy (CDC) and Arkta (ARK). Medians and quartiles are presented. Different letters indicate statistically significant differences among the cultivars on the same day (Holm–Sidak or Tukey tests; p < 0.05).
Remotesensing 11 02964 g003
Figure 4. The excitation pressure (1 − qP; a), the quantum yield of regulatory nonphotochemical quenching (ΦNPQ; b), the maximal quantum yield of PSII photochemistry (FV′/FM′; c) and the effective quantum yield of PSII photochemistry (ΦP; d) in the light-adapted state were averaged from whole plants during the cold treatment of the pea cultivars Terno (TER), Enduro (END), CDC Le Roy (CDC) and Arkta (ARK). Medians and quartiles are presented. Different letters indicate statistically significant differences among the cultivars on the same day (Holm–Sidak or Tukey tests; p < 0.05).
Remotesensing 11 02964 g004
Figure 5. Spatial distribution of the maximal quantum yield of PSII photochemistry in the dark-adapted state (FV/FM; upper line) and in the light-adapted state (FV′/FM′; lower line) obtained by ChlF imaging of the pea cultivars Terno (TER), Enduro (END), CDC Le Roy (CDC) and Arkta (ARK). Representatives of each cultivar after 15 days of cold treatment are displayed. The color represents the value of the respective parameter in the particular pixel as per their axes on the right-hand side. Close-up view to the contrasting spatial distribution of FV/FM and FV′/FM′ of the newly developed stipules of cultivar END is highlighted in squares.
Remotesensing 11 02964 g005
Figure 6. The maximum quantum yield of primary PSII photochemistry in dark-adapted state (FV/FM; a); the performance index on an absorption basis (PIABS; b); the initial slope of the O-J ChlF rise ((dV/dt)0; c); and the total performance index on an absorption basis (PIABS,total; d) during cold treatment measured on the third leaves/stipules of the pea cultivars Terno (TER), Enduro (END), CDC Le Roy (CDC), and Arkta (ARK). Medians and quartiles are presented. Different letters indicate statistically significant differences among the cultivars on the same day and leaf level (Holm–Sidak or Tukey tests; p < 0.05).
Remotesensing 11 02964 g006
Table 1. Cultivars used in the experiments.
CultivarOriginLeaf TypeUtilizationGrowth TypeFlower ColorSeed ColorCold ResistanceReference
ArktaAGTnormalForagewintervioletbrownCentral European winters[28]
EnduroAGTafilaFieldwinterwhiteyellowMediterranean winters[26]
CDC Le RoyCDCafilaForagespringwhiteyellowCanadian springs[25]
TernoAGTafilaFieldspringwhiteyellowNo[15,27]

