Article

Identifying Establishment Year and Pre-Conversion Land Cover of Rubber Plantations on Hainan Island, China Using Landsat Data during 1987–2015

1
Rubber Research Institute (RRI), Chinese Academy of Tropical Agricultural Sciences, (CATAS), Danzhou Investigation & Experiment Station of Tropical Cops, Ministry of Agriculture, Hainan Province, Danzhou 571737, China
2
Ministry of Education Key Laboratory for Biodiversity Science and Ecological Engineering, Institute of Biodiversity Science, Fudan University, No. 2005, Songhu Road, Shanghai 200438, China
3
Department of Microbiology and Plant Biology, Center for Spatial Analysis, University of Oklahoma, Norman, OK 73019, USA
4
School of Information Science and Technology, Nanjing Forestry University, Nanjing 210037, China
5
College of Big Data and Intelligence Engineering, Southwest Forestry University, Kunming 650224, China
6
Key Laboratory of Digital Earth Science, Institute of Remote Sensing and Digital Earth, Chinese Academy of Sciences, Beijing 100094, China
7
Key Laboratory of Earth Observation of Hainan Island, Sanya 572029, China
*
Author to whom correspondence should be addressed.
Remote Sens. 2018, 10(8), 1240; https://doi.org/10.3390/rs10081240
Submission received: 13 June 2018 / Revised: 26 July 2018 / Accepted: 31 July 2018 / Published: 7 August 2018
(This article belongs to the Special Issue Remote Sensing of Forest Cover Change)

Abstract

:
Knowing the stand age of rubber tree (Hevea brasiliensis) plantations is vitally important for best management practices, estimations of rubber latex yields, and carbon cycle studies (e.g., biomass, carbon pools, and fluxes). However, the stand age (as estimated from the establishment year of rubber plantation) is not available across large regions. In this study, we analyzed Landsat time series images from 1987–2015 and developed algorithms to identify (1) the establishment year of rubber plantations; and (2) the pre-conversion land cover types, such as old rubber plantations, evergreen forests, and cropland. Exposed soil during plantation establishment and linear increases in canopy closure during non-production periods (rubber seedling to mature plantation) were used to identify the establishment year of rubber plantations. Based on the rubber plantation map for 2015 (overall accuracy = 97%), and 1981 Landsat images since 1987, we mapped the establishment year of rubber plantations on Hainan Island (R2 = 0.85/0.99, and RMSE = 2.34/0.54 years at pixel/plantation scale). The results show that: (1) significant conversion of croplands and old rubber plantations to new rubber plantations has occurred substantially in the northwest and northern regions of Hainan Island since 2000, while old rubber plantations were mainly distributed in the southeastern inland strip; (2) the pattern of rubber plantation expansion since 1987 consisted of fragmented plantations from smallholders, and there was no tendency to expand towards a higher altitude and steep slope regions; (3) the largest land source for new rubber plantations since 1988 was old rubber plantations (1.26 × 10⁵ ha), followed by cropland (0.95 × 10⁵ ha), and evergreen forests (0.68 × 10⁵ ha). The resultant algorithms and maps of establishment year and pre-conversion land cover types are likely to be useful in plantation management, and ecological assessments of rubber plantation expansion in China.

1. Introduction

The rubber tree (Hevea brasiliensis) is native to the Amazon basin, but historically it has been widely cropped in tropical regions within equatorial zone (between 10°N and 10°S) [1]. To meet the increasing international demand for natural rubber, rubber plantations have expanded rapidly since the 20th century throughout Southeast Asia and China, where more than 80% of the world’s natural rubber is produced [2]. According to the Food and Agriculture Organization (FAO) of the United Nations Global Forest Resources Assessment (FRA) 2010 report, the global area of rubber plantations has steadily increased by 25% during the past two decades [3]. The planting of rubber trees has brought great benefits to the plantation owners and rubber-relevant industries. Knowledge of the spatial extent and stand age (or establishment year) of rubber plantations at regional scales is of great interest to plantation managers who are concern with the yield of natural rubber and rubberwood. However, the rapid expansion of monoculture rubber plantations also created conflicts between forest management and conservation [4]. In China, rubber plantations in Yunnan province have been expanded to marginal growing environments of as far north as 24°N and higher elevations exceeding 1300 m and steeper slopes. Therefore, data on stand age (or establishment year) and pre-conversion land cover of rubber plantations are necessary to correctly assess the impacts of land conversion on biodiversity, carbon sequestration, and water provisioning [5,6,7,8], and are critical to conservation policy development [9].
Stand age or establishment year of rubber plantations is usually obtained through on-site survey (interviewing owners or estimating from the length of tapping line), querying planting record data from farms or statistical yearbooks. Although data collected by these methods has high accuracy, it contains limited spatial distribution information and is difficult to be applied on a large scale. Remote sensing is a viable approach to determine the stand age or establishment year of rubber plantations at large spatial scales. Previous studies have used optical images [10,11,12,13,14,15,16,17,18], synthetic aperture radar (SAR) images [19], or their combination [20] (Table 1) to map changes in land cover. Historically, moderate-resolution (MR) optical images were the main data sources for estimating the stand age of rubber plantations [10,11,12,13,14,15,16,21], followed by high-resolution or very high-resolution (HR/VHR) optical imagery [4,17,18], and SAR data and optical-SAR integration [20] (Table 1).
The approaches used for estimating stand age of rubber plantations can be grouped into three categories: (1) statistical models; (2) image classification; and (3) land use and land cover change (LULCC) detection (Table 1). Statistical models like multivariate regression [11,15,18,21] and artificial neural networks [21] have been used to establish the relationships between the stand age of rubber plantations and optical-based parameters (spectral reflectance and/or vegetation indices) or SAR-based backscatter coefficients. The image classification approach usually divided the rubber plantations (usually 25–30 years of economic life cycle) into two or three age groups (e.g., ≤6, >6 years), then performed classification according to spectral metrics of the different groups. Different classification methods such as supervised classification [1,17,19], object oriented [16], and hybrid approaches [12] have been employed to identify the stand age of rubber plantations. Both the statistical model and imagery classification approaches assumed a good relationship between stand age and spectral/structural features of the plantation canopy. As tree volume and biomass growth usually have a sigmoid-shaped curve as a function of stand age, large estimation errors (RMSE = 3.7–8.2 years) were found by statistical model approaches [11,15,21]. Image classification approaches were usually unable to classify stands beyond two or three age groups and had wide ranges in accuracy (44–98%, dependent on classification algorithms, input images, and number of age groups) [12,18,19,20].
The most promising way to identify the establishment year of rubber plantations was to detect LULCC events [10,20]. New plantation establishment involves clearing land and transplanting rubber seedlings. A common practice in land clearing and preparation is to remove all vegetation (e.g., natural forests, old rubber plantations, and crops), and then to construct a gully and dike system in the flat lands (slope < 5°), or contour terraces on hillsides. Then, rubber seedlings are simultaneously transplanted into these patches with a spacing of about 3–4 m apart within rows and 5–8 m between rows with a planting density of ~450 trees/ha [15,18,22]. Rubber plantations have about seven years of non-productivity, of which the first four years or so have an open canopy and can be intercropped with pineapple, banana, sugarcane, and peanuts to increase economic returns [1]. Rubber latex harvesting usually begins at the seventh year when the canopy has totally closed. Latex harvest lasts for about 25 years, then trees are harvested for timber. Rubber trees rapidly defoliate (complete or near-complete defoliation) and foliate (RDF) in areas where have distinct dry seasons [14,23,24]. In the northern hemisphere, rapid defoliation usually occurs in mid-February, and the canopy quickly becomes dense in mid-March. The leaf area index (LAI) during this period (one month or so) can drop from around 3.3 to 0.9 then grow to 3.8 [24]. The rapid canopy change during the RDF period is a key indicator in differentiating rubber plantation from evergreen forest [23], while exposed bare soil during initial plantation establishment stage is valuable in identifying their stand age.
The land surface water index (LSWI) is particularly sensitive to bare soils and less affected by clouds [10], and has been used to estimate the stand age of rubber plantations [10,20]. Kou and Xiao first mapped the stand age of rubber plantations in Xishuangbanna, Yunnan Province, China using the first year when a rubber plantation had minimum LSWI less than zero (LSWImin < 0) during the defoliation period (from middle January to early February), and then grouped them into ≤5, 5–10, and ≥10 year age groups. Beckschäfer improved Kou and Xiao’s algorithm by detecting the last year when a rubber plantation has LSWImin < 0 in leaf-on season to estimate the establishment year of rubber plantations annually in Xishuangbanna since 1988. Using LSWImin during the leaf-on season resolved classification issues associated with defoliation, which degraded LSWI significantly (less than, or close to, zero) [23]. However, both intercropping and weeding would greatly increase the chance of exposing bare soil or producing dry vegetation, which significantly degraded LSWImin during the leaf-on season to less than or close to zero. Furthermore, severe natural disasters such as typhoons and drought may alter the plantation canopy or lead to leaf shedding [11] and, therefore, lower LSWI significantly. Low LSWI in the leaf-on season leads to an underestimation of plantation establishment years. However, the integration of biophysical metrics like increasing canopy closure in non-production period is possible to significantly reduce these uncertainties.
The objectives of this study were to: (1) develop a new algorithm to map the establishment year of rubber plantation by integrating LULCC events and biophysical metrics with time series Landsat imagery; (2) generate an establishment year map of rubber plantations on Hainan Island, China, and investigate the pattern of rubber plantation expansion since 1987; and (3) explore the sources, time, area, and spatial extent of land conversion during rubber plantation expansion over the past 30 years. The resultant algorithms, maps of plantation establishment year, and pre-conversion land covers are useful for practical land management, ecological assessment, and conservation policy development.

2. Material and Methods
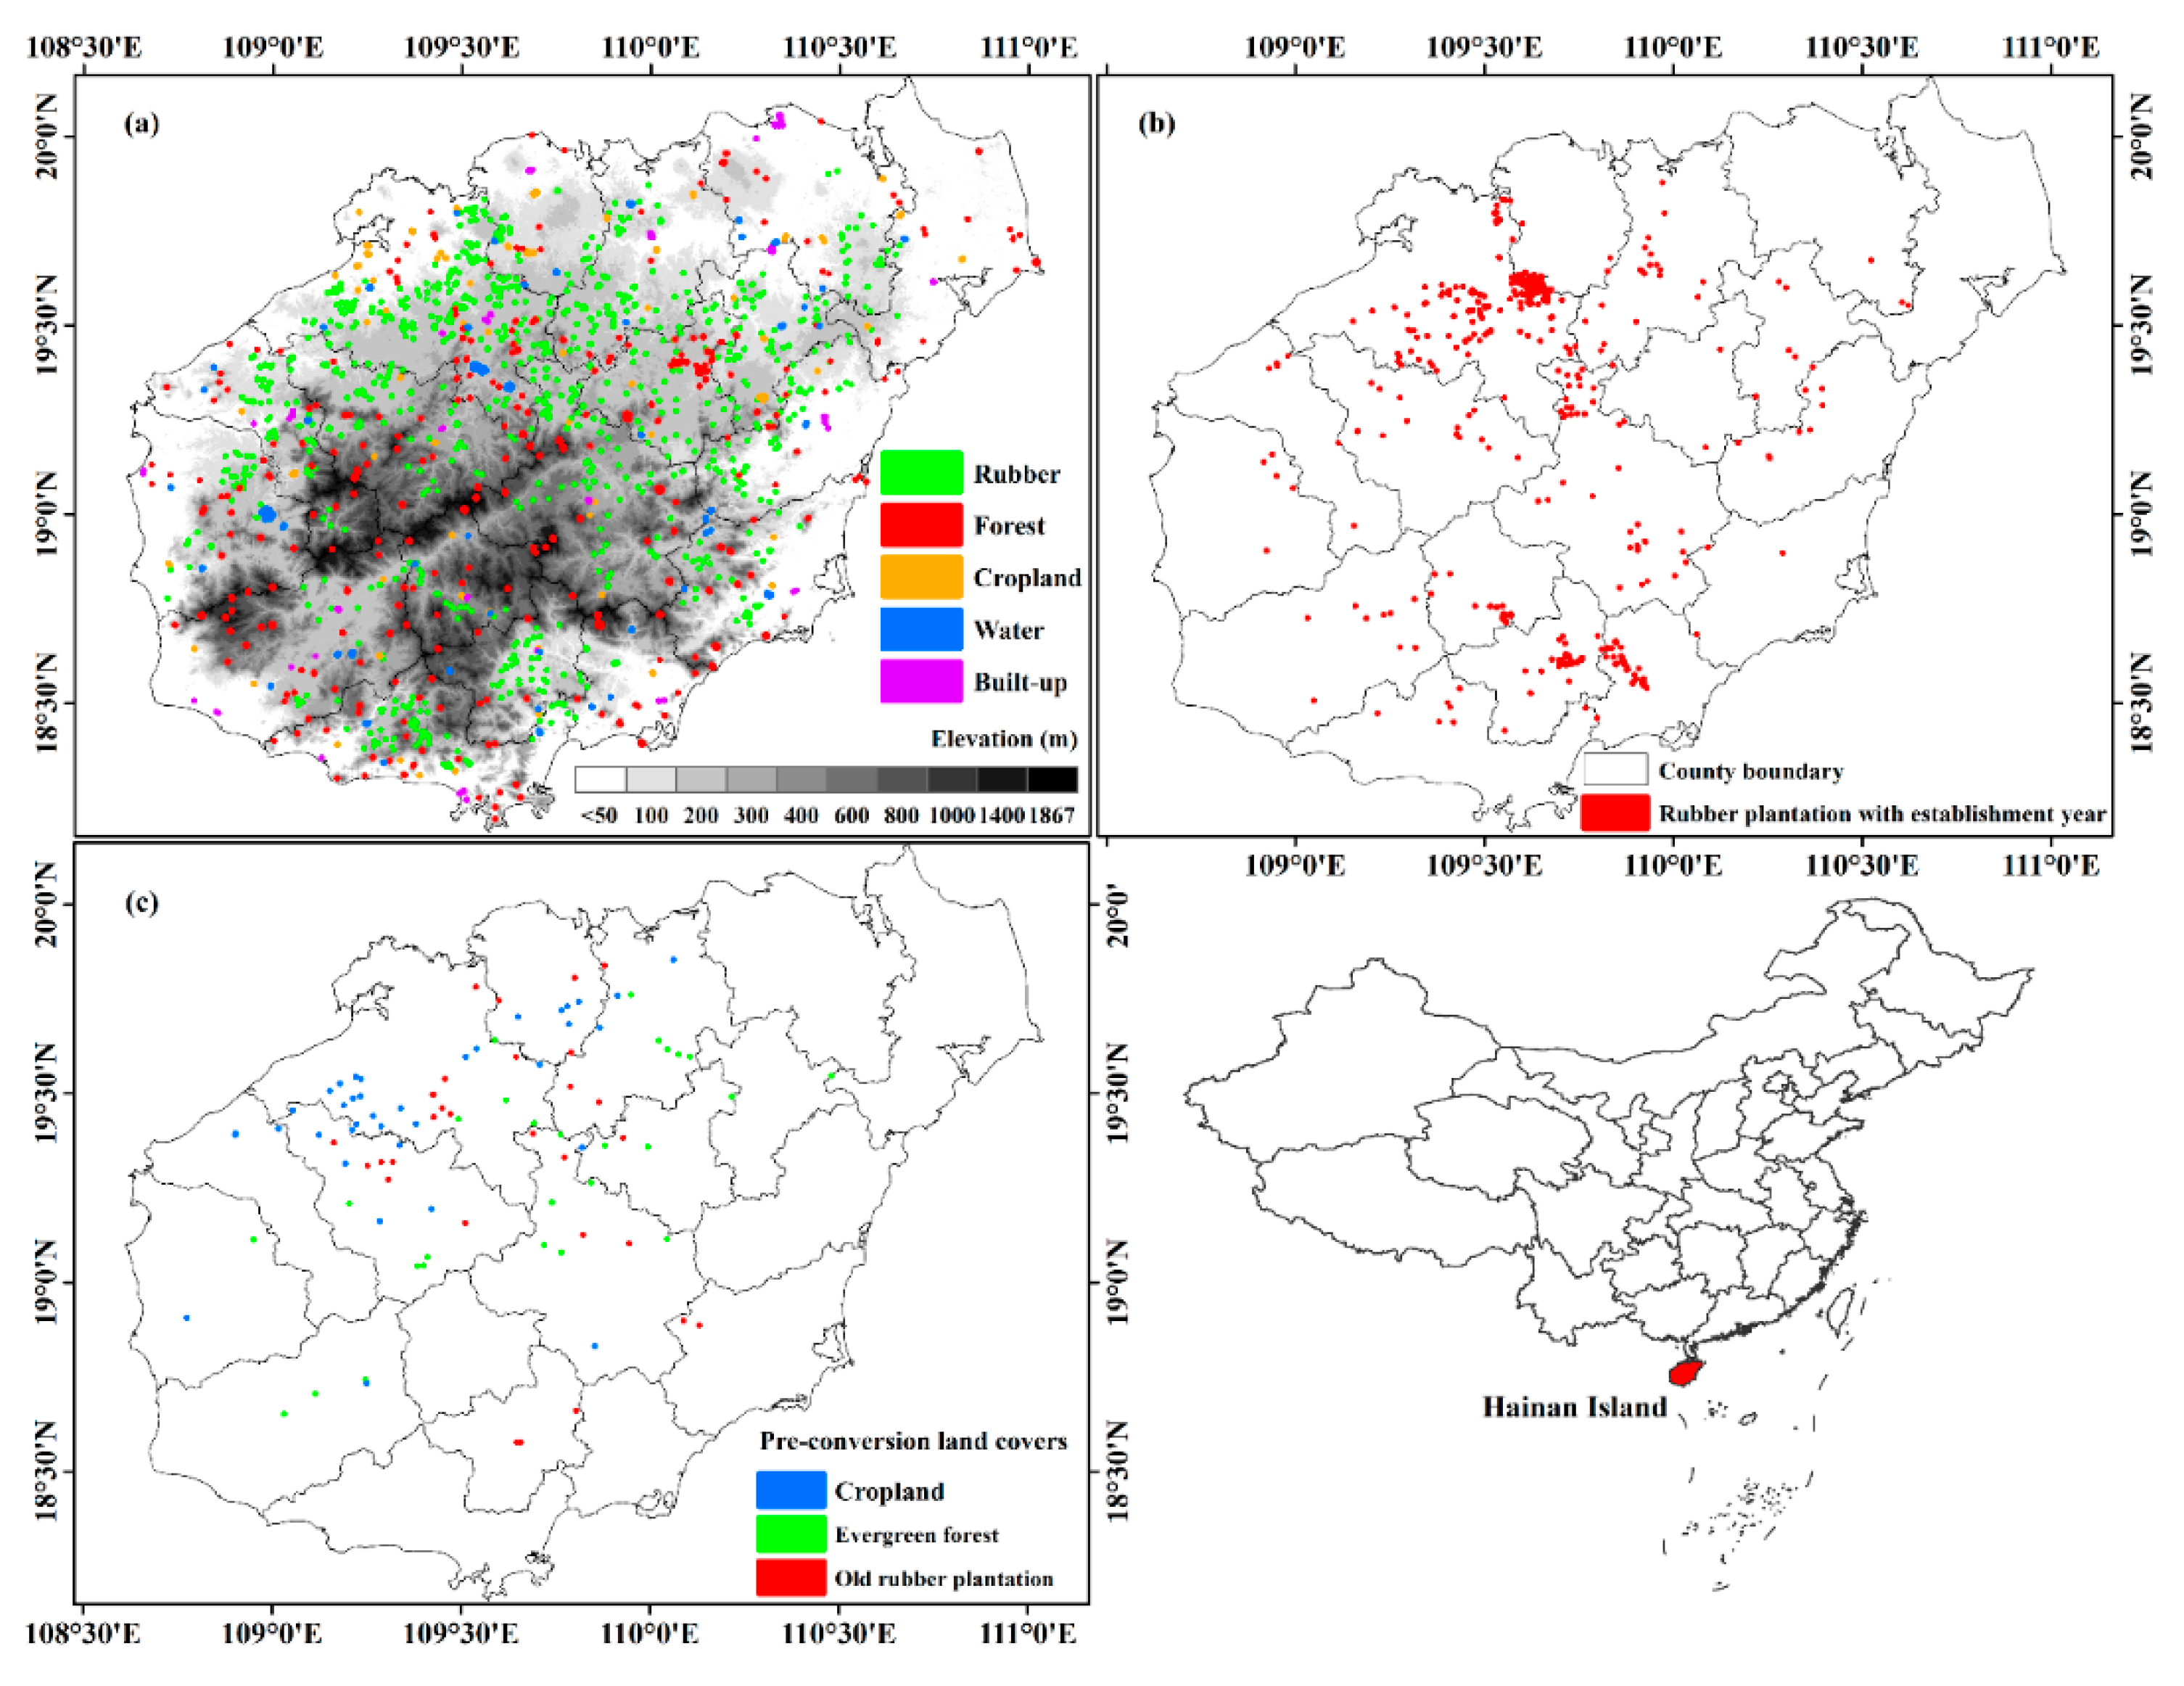
2.1. Study Area

Hainan Island (19°20′N–20°10′N, 108°21′E–111°03′E, Figure 1a) is the second largest island in China and has an area of about 3.4 million ha. The topography of the island is mountainous in the interior with lowlands along the coast. Wuzhi Mountain (1867-m above mean sea level, AMSL) is the highest mountain on the island. The climate varies from tropical to subtropical. The annual mean temperature is approximately 23–25 °C, and monthly temperature varies between ~16 °C in January and ~30 °C from May to July. The average annual precipitation is 1500 to 2000 mm, 80% of which occurs during the rainy season from May to October. However, the spatial distribution of precipitation can be as high as 2400 mm in the central and eastern areas, and as low as 900 mm in the coastal areas of the southwest.
In the 1950s, the island began to plant large areas of rubber trees to meet China’s national defense and economic needs. It is the second largest natural rubber production base in China, with an area of 5.4 × 10⁵ ha in 2015 [25]. According to Hainan Island National Land Cover Dataset in 2010 [26], forest (include rubber plantations), cropland, grassland, water, and built-up account for 63.4%, 25.7%, 3.3%, 3.8%, and 3.6% of the total land area, respectively.

2.2. Landsat Imagery and Processing

Hainan Island is covered by four Worldwide Reference System (WRS-2) path/row (123/46, 123/47, 124/46, and 124/47, respectively). A total of 1981 Collection 1 Tier Top-of-atmosphere reflectance of Thematic Mapper (TM), Enhanced Thematic Mapper (ETM+), and Operational Land Imager (OLI) images from 1987 to 2015 were available in Google Earth Engine (GEE) as image collections. The Landsat Collection 1 includes Level-1 Precision Terrain (L1TP) processed data that have well-characterized radiometry, are inter-calibrated across the different Landsat sensors, and are considered suitable for time-series processing analysis. Poor quality Landsat images, caused by clouds and shadows, were identified using cfmask [27,28] and were flagged in the Quality Assessment (QA) band. We considered observations unaffected by clouds, shadows, and ETM+ scan-line-off strips as good quality observations. The statistical information of Landsat imagery on Hainan Island is presented in Figure 2, and annual cloud-free observations is shown in Figure S1.
For each good quality Landsat TM/ETM+/OLI imagery, we calculated the normalized difference vegetation index (NDVI) [29], enhanced vegetation index (EVI) [30], and LSWI [31,32] using Equations (1)–(3):
N D V I = ρ N I R ρ r e d ρ N I R + ρ r e d  
E V I = 2.5 × ρ N I R ρ r e d ρ N I R + 6 × ρ r e d 7.5 × ρ b l u e + 1  
L S W I = ρ N I R ρ S W I R ρ N I R + ρ S W I R  
where ρ b l u e , ρ g r e e n , ρ r e d , ρ N I R , and ρ S W I R are blue (450–520 nm), green (520–600 nm), red (630–690 nm), near-infrared (NIR, 760–900 nm), and shortwave infrared (SWIR, 1550–1750 nm) bands of Landsat TM/ETM+/OLI imagery, respectively.
Annual minimum and standard deviation of LSWI in the RDF period (January–March, hereafter referred to as LSWIRDF_min and LSWIRDF_Std.Dev, respectively) [23], annual minimum and average LSWI during the leaf-on season (April–December, hereafter referred as LSWIleafon_min and LSWIleafon_avg, respectively), annual maximum NDVI (NDVImax) [23], and annual greenness frequency [33] (FGreenness, calculated using both EVI and LSWI, see Section 2.4.3), were generated for 1987–2015 to map rubber plantations and identify the establishment year of rubber plantations and pre-conversion land covers (see Section 2.4). Annual LSWIRDF_min and LSWIRDF_Std.Dev were composited using two consecutive years (e.g., 2015 composite image was generated using images acquired in RDF period of 2014 and 2015), while annual LSWIleafon_min, LSWIleafon_avg, NDVImax, and FGreenness were generated using images acquired in the leaf-on period of the corresponding year.

2.3. Ground Reference Data

2.3.1. Data for Rubber Plantations Map in 2015

The region of interest (ROI) samples for mapping rubber plantations in 2015 initially came from our previous study, which mapped forest and rubber plantations in 2010 on Hainan Island [23]. These ROIs data were updated with geotagged landscape photos taken in February 2015 and October 2016, and Google Earth VHR imagery acquired circa 2015, by adding, removing, or adjusting polygons to fit the rubber plantation boundaries. The non-rubber ROI data consisted of forest, water, cropland, and built-up areas, and they were come from our recent work which studies the spatial-temporal changes of forest on Hainan Island between 2007 and 2015 [34]. In total, we had 804 ROIs (27,539 pixels at 30-m spatial resolution) for rubber plantations and 469 ROIs (81,858 pixels at 30-m spatial resolution) for non-rubber. These ROI data (Figure 1a) were randomly divided into training (30%) and validation (70%) datasets using NOAA/NOS/NCCOS/CCMA Biogeography Branch’s Design Tool for ArcGIS.

2.3.2. Data for Establishment Year Map of Rubber Plantation

ROI samples for identifying establishment year of rubber plantation were obtained in three ways. First, we obtained six plantation vector maps of Hainan State Farm, which were produced using HR imagery (SPOT-5 acquired around 2005), field interviews, and querying historical land-use records from Hainan State Farm. These maps included detailed information for each plantation including establishment year, clones, farmer identification, and tapping scheme. Second, we obtained soil sampling data from the Fertilizer Application department of the Rubber Research Institute, Chinese Agriculture of Tropical Academy Science (RRI, CATAS). Establishment year and clone information of these rubber plantations were collected by reviewing the production departments of the Hainan State Farm or interviewing the private owners. Third, we visually interpreted the establishment year of rubber plantation with Google Earth VHR imagery and time series Landsat imagery.
ROI samples from the first and second ways (vector maps and soil sampling) were used to find rubber plantations established before 2007, while the third way (visual interpretation) was used to find rubber plantations established during 2007 and 2011. Rubber plantations established during 2012 and 2015 were seedlings, which cannot be mapped accurately by either optical and SAR imagery due to complex understory conditions and, therefore, were excluded. The vector maps from the first source was updated using the 2015 rubber plantation map, but only 10% of them were randomly selected as they were spatially clustered. Finally, we obtained 522 ROI samples with establishment year information. The spatial distribution of these ROI samples was presented in Figure 1b and plantation statistics by year was presented in Figure S2. The clustered ROIs in Figure 1b were selected from the vector maps. The spatial distribution of field data was relatively consistent with the spatial distribution of rubber plantations on Hainan Island [23]. We randomly selected five rubber plantations that were established in 1990, 1995, 2000, 2005, and 2010 from the 522 ROI samples for algorithm training, and the rest were used for validation.

2.3.3. Data for Pre-Conversion Land Cover Map

A stratified sampling was conducted to generate random ROI samples based on mask layers generated by the maps of pre-conversion land cover and establishment year for accuracy assessment. First, old rubber plantations that were established before 1990 and small rubber plantations with connected pixel fewer than 10 were masked out in advance. Pre-conversion land cover for old rubber plantations established before 1990 was difficult to identify accurately with limited amount Landsat TM images which starts in 1987 here, and small rubber plantations usually contain mixed pixels. Then, 50 random square ROI samples with areas of 0.25 ha for evergreen forests, old rubber plantations, and cropland were respectively created using GEE’s random function and the mask layers. We first screened and excluded mixed ROI, which have multiple land cover, multiple conversion sources, and different establishment years with Google Earth VHR images. We determined pre-conversion land covers for these ROIs samples by respectively observing annual minimum/average NDVI/EVI/LSWI composited from Landsat images in GEE platform, and double checked in TimeSync, a Landsat series visualization tool and web application (Version 3) (http://timesync.forestry.oregonstate.edu/). After these processes, 28, 30, and 37 relatively pure ROIs were identified that had been converted from evergreen forests, old rubber plantations, and cropland, respectively, to be used for map accuracy assessment (Figure 1c).

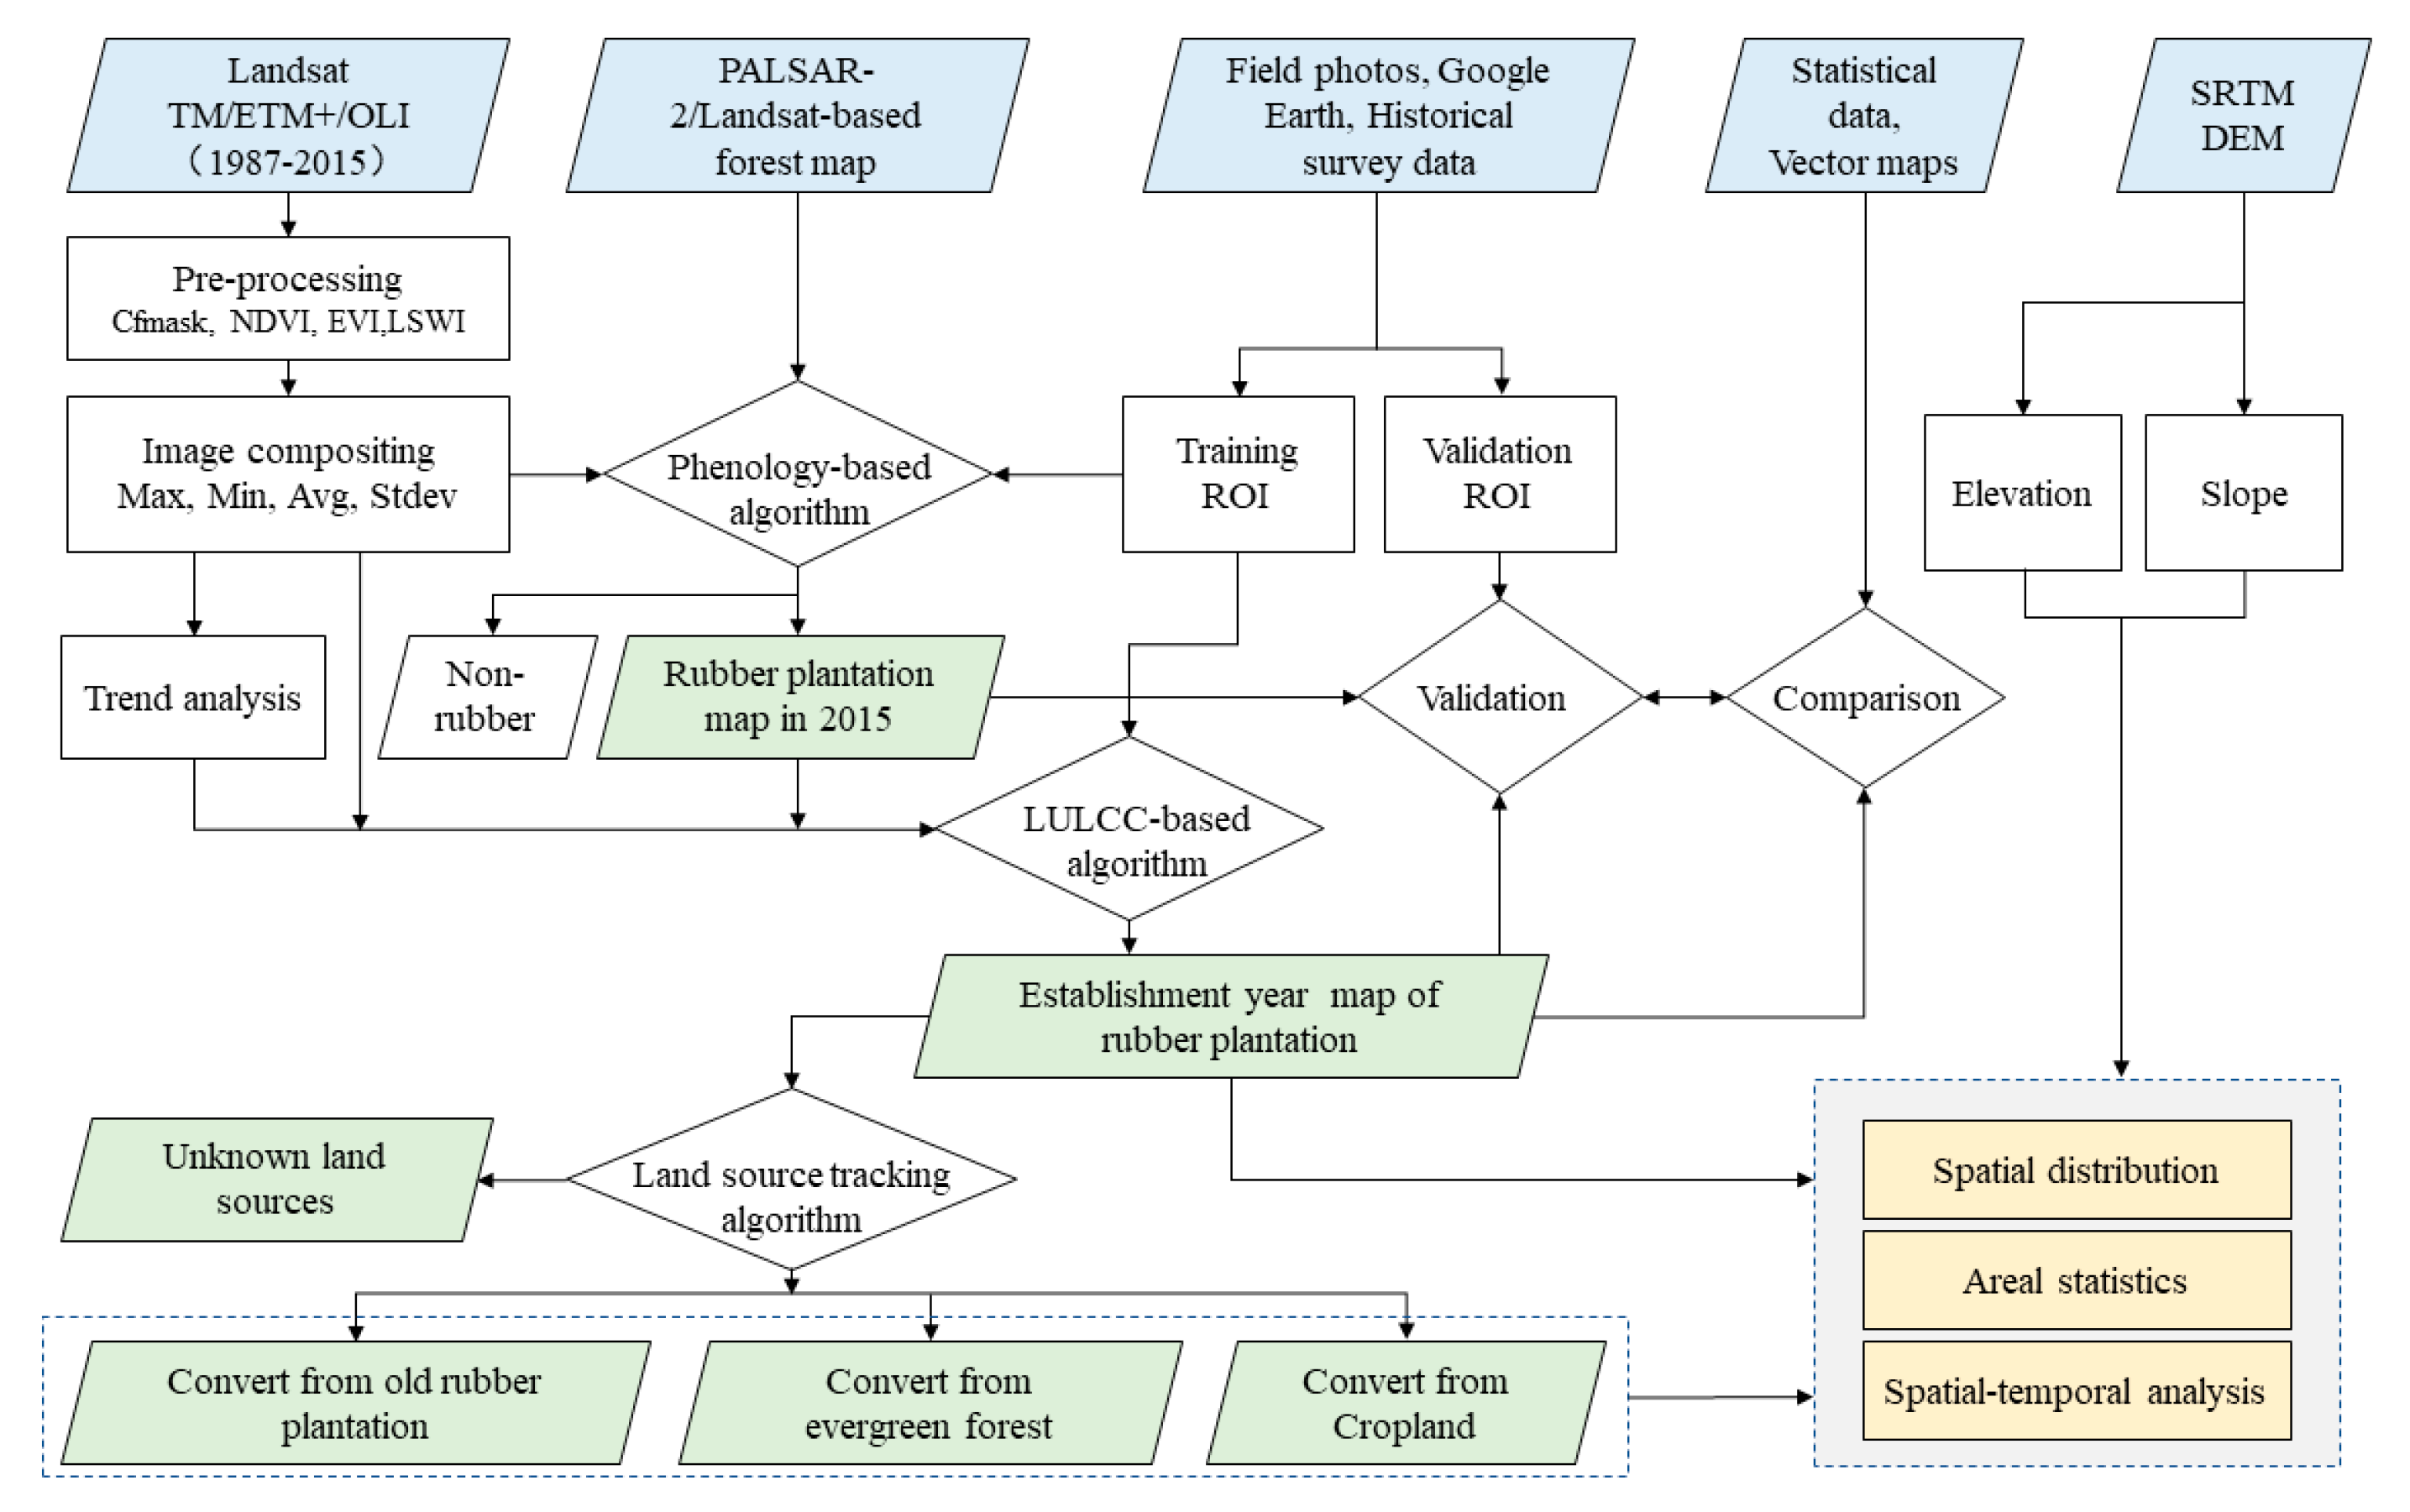
2.4. Workflow and Algorithms

2.4.1. Mapping Workflow

The workflow is presented in Figure 3. We generated rubber plantation map from a forest base map of 2015 (derived from Phased Array type L-band Synthetic Aperture Radar-2 (PALSAR-2) and Landsat images) and time series Landsat data, then identified the establishment year of rubber plantations using a LULCC- and biophysical-based algorithm. Finally, we tracked the pre-conversion land cover types, which were divided into old rubber plantations, evergreen forests, cropland, or unknown.

2.4.2. Algorithm for Mapping Rubber Plantations in 2015

To generate the rubber plantation map of 2015, we first identified forest, then distinguished deciduous rubber plantations from the forest base map using phenological metrics [23,35,36]. The 2015 forest base map came from our previous study on the annual spatial-temporal of forest on Hainan Island during 2007–2015 using PALSAR/PALSAR-2 and time series Landsat TM/ETM+/OLI images [34,37]. This forest base map had an overall accuracy (OA) of ~96% when validated with ground reference data [34] and, therefore, can serve as a reliable base map for mapping rubber plantation. Then, deciduous rubber plantations were identified from this forest base map using the criteria of dense canopy in the growing season (NDVImax > 0.85) and the criteria of rapid defoliation and foliation (LSWIRDF_min < 0.1, and LSWIRDF_Std.Dev > 0.08, See Figure S3 for justification). The LSWIRDF_min and LSWIRDF_Std.Dev were composited with Landsat ETM+/OLI images acquired in the RDF period of 2014 and 2015. A 3 × 3 median filter was performed on the resultant map to reduce the salt-and-pepper noise.

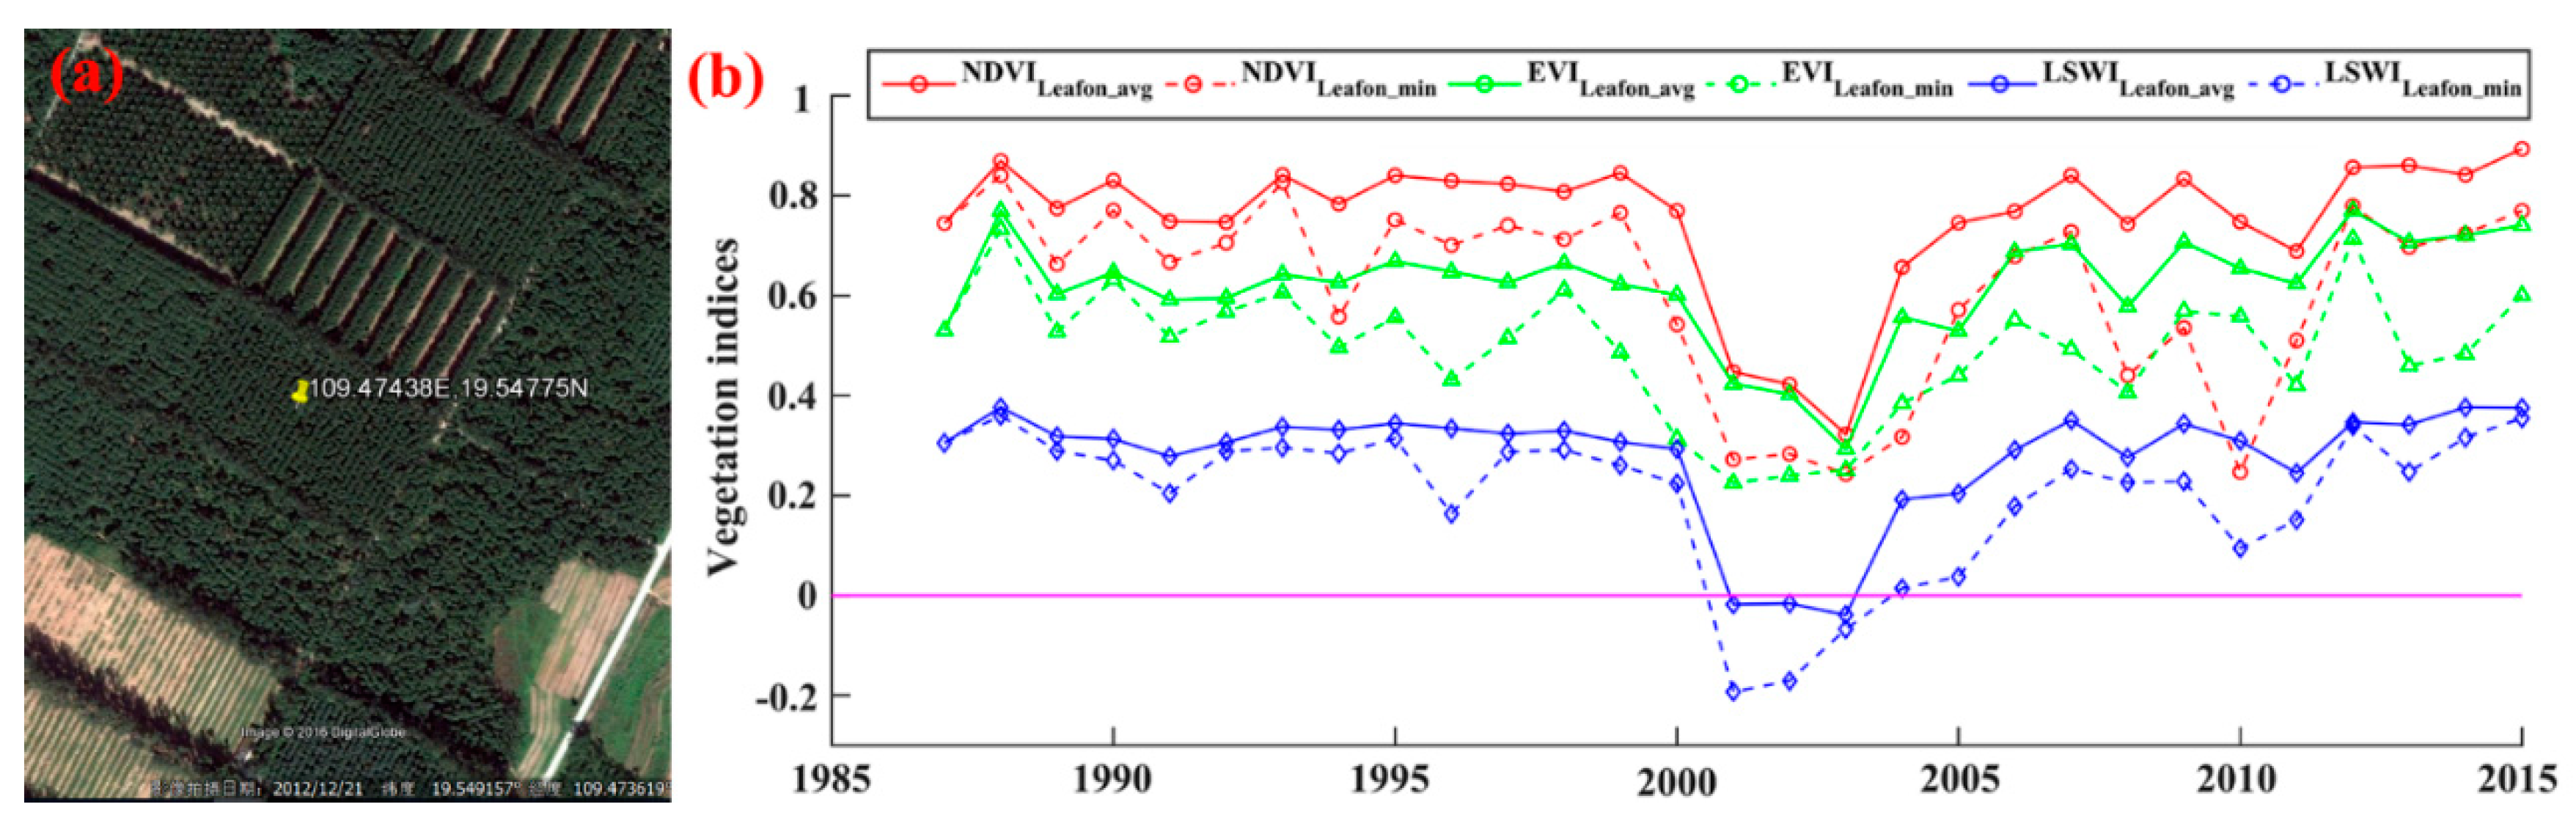
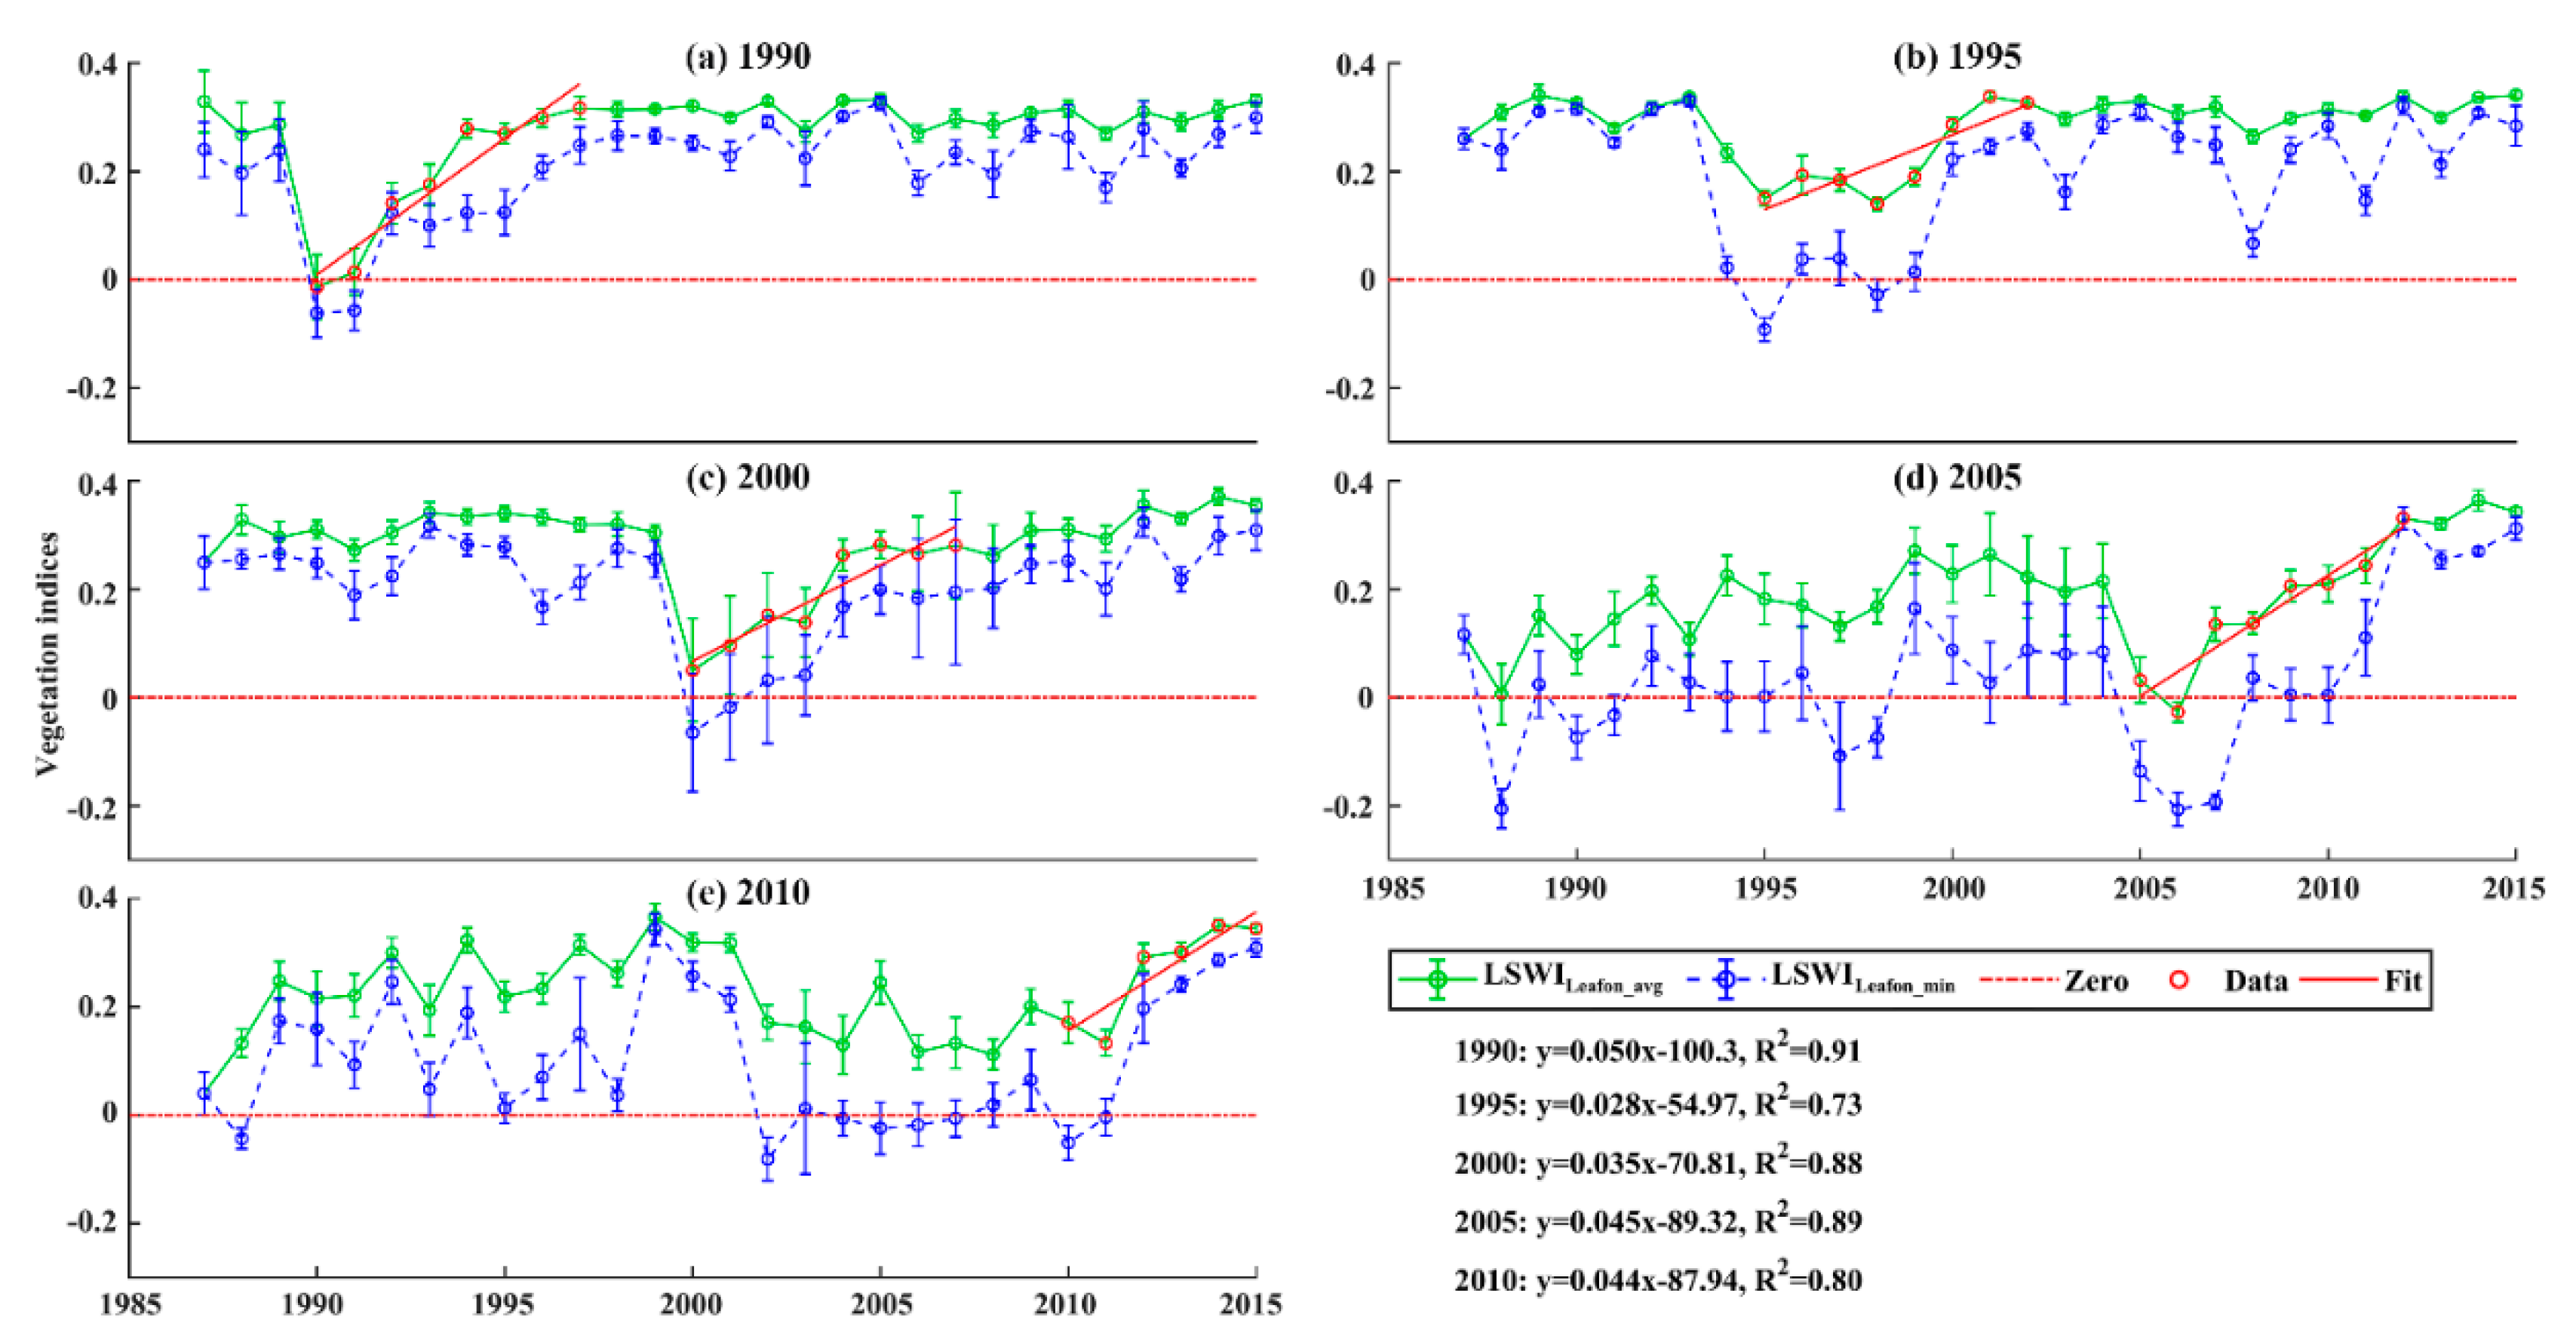
2.4.3. Algorithm for Identifying Establishment Year of Rubber Plantations

We used two features to identify the establishment year of rubber plantations: (1) exposed soils during initial plantation establishment, which have low vegetation indices (NDVI, EVI, and LSWI); and (2) increasing canopy closure in non-production period of rubber plantations (from rubber seedling to maturity plantation), which has a linear increase in vegetation indices. Figure 4 shows the temporal profile of Landsat-based annual mean and minimum NDVI, EVI, and LSWI during leaf-on season (April to December) in a rubber plantation, where old rubber trees were removed, and rubber seedlings were transplanted in 2001. All vegetation indices suddenly dropped in 2001, but gradually recovered within about seven years (non-production period). LSWI was found to be more sensitive to bare soil [10,20,38], and was thus selected to identify establishment year of rubber plantations (Figure 4). Specifically, we selected LSWILeafon_min to track bare soil and the slope of LSWILeafon_avg against year during the non-production period (hereinafter referred as SLSWI) to track the change of canopy closure. We marked the last year when a rubber plantation has LSWILeafon_min < T0 as Yi, and then search ahead for Ns years of seedling period to find a proper year as the establishment year of rubber plantation. Within the period of (Yi-Ns, Yi), we set the year that held the lowest LSWILeafon_min and met LSWILeafon_min < T0 and SLSWI > TSlope as the establishment year of rubber plantations. Here, T0 and TSlope are the thresholds of LSWILeafon_min and SLSWI, respectively.
The thresholds of T0 and TSlope were determined by the statistical value of the training ROI samples. The LSWILeafon_min was always less than zero in the year that rubber plantation was established, and remained relatively small in the first few years (Figure 5). The SLSWI ranged from 0.03 to 0.05, with a mean value (µ) of about 0.04 (Table S1). We set T0 as 0 and the rounded value of mean µ-σ from the five rubber plantations as the TSlope (0.03 here), where σ is the standard deviation. However, the rapid recovery of understory in young rubber plantations and frequent presence of clouds in the tropics made it difficult to acquire ideal observations (un-vegetated during plantation establishment and linear increase of LSWILeafon_avg). Thus, we employed the algorithm again with slightly higher thresholds of 0.1 for T0 and 0.02 for TSlope to address the less optimal conditions (Table S1). After executing the algorithm twice, we still had many rubber plantations with an unidentified establishment year because they were established earlier than 1987 when Landsat TM imagery was lacking. We set the establishment year of these rubber plantations as 1986 if they had high greenness frequency in leaf on season for all years between 1987 and 2015. Otherwise, the establishment year was marked as unknown. We first calculated greenness in a year using Equation (4) [33].
G r e e n n e s s = { 1 L S W I > 0   a n d   E V I   > 0.2 0 O t h e r   v a l u e s    
Then we calculated greenness frequency using Equation (5):
F G r e e n n e s s = N G r e e n n e s s N T o t a l N B a d × 100  
where FGreenness is the greenness frequency scaled between 0 and 100, NGreenness is the number of observations with LSWI > 0 and EVI > 0.2, NTotal is the total number of observations, and NBad is the number of bad observations (e.g., clouds, shadows, and ETM+ scan-line-off strips) [39]. We used FGreenness > 90% as the criteria (see Figure S4 for justification) because rubber plantations on Hainan Island frequently suffered canopy damage from severe typhoons, which may cause rubber plantations to not meet a higher greenness criterion.

2.4.4. Algorithm for Tracking Pre-Conversion Land Cover of Rubber Plantations

After we identified the establishment year of rubber plantations, we tracked pre-conversion land cover by analyzing the time-series vegetation indices. The conversion of grassland to rubber plantations was limited because grassland accounts for only 3.3% of the total land area [26], and the conversion of water and built-up areas to rubber plantations were highly unlikely, so our study focused on the conversion of evergreen forests, old rubber plantations, and cropland to rubber plantations. First, we identified the pre-conversion land cover as cropland or forest by observing LSWIleafon_min of Nx years before plantation was established. A cropland usually has some observations with LSWIleafon_min < 0 in a year due to exposed soils after harvest and during the fallow period. Here we set Nx as 5 to avoid classifying eucalyptus industrial plantation (usually having ca. six-year rotation) as cropland. Second, we divided the pre-conversion forest cover into old rubber plantations and evergreen forests. We used the annual NDVImax, LSWIRDF_min, and LSWIRDF_std.dev of the five years prior to plantation establishment and classified the pre-conversion forest cover as old rubber plantation if it met NDVImax > 0.85, LSWIRDF_min < 0.1, and LSWIRDF_std.dev > 0.08 (Figure S3). If it did not meet that condition, then we classified the pre-conversion forest cover as evergreen forests. Landsat TM imagery for Hainan Island is not available before 1987, so pre-conversion land cover types were labeled as unknown for rubber plantations established before 1988.

2.5. Accuracy Assessment

The error-adjusted matrix proposed by Olofsson et al. in terms of proportion of area and estimates of producer’s accuracy (PA), user’s accuracy (UA), and overall accuracy (OA) with 95% confidence intervals was used to evaluate the accuracy of our rubber plantation map in 2015 [23,34]. The error-adjusted matrix was a statistically robust and transparent approach for assessing accuracy, a method, which has recently become common practice [40,41,42].
The accuracy of the establishment year map of rubber plantations was evaluated using ROIs at both the pixel and plantation scale. Each ROI (polygon boundary) was assigned an independent establishment year as rubber trees were planted simultaneously. However, each ROI contained many pixels (30 m spatial resolution), and those pixels may have the same, or very closely estimated establishment year when the algorithm performs well. We compared estimated and observed establishment year for all the ROI pixels (pixel scale, ignoring plantation boundary). We also calculated mean estimated establishment year for each ROI (plantation scale, processing unit was plantation), and then calculated the mean and standard deviation of the mean estimated establishment year group by year. The group mean and standard deviation of observed and estimated establishment year of rubber plantations were plotted.
We assessed the accuracy of the pre-conversion land cover map using all random ROI data, which were visually interpreted with Google Earth VHR imagery and time series Landsat imagery. Olofsson’s error-adjusted matrix was built and PA, UA, and OA for the pre-conversion land cover map was reported.

2.6. Spatial and Areal Analysis of Plantation Establishment Year and Pre-Conversion Land Covers

We generated annual maps of the establishment year of rubber plantations and plotted a histogram of the observed and estimated rubber plantation area since 1987. We analyzed the age structure of existing rubber plantations in 2015 by dividing the stand age into groups of <5, 5–10, 10–15, 15–20, 20–25, and >25 years. The area and proportion of rubber plantations in each age group were explored. We also divided the island elevation into groups of 0–50, 50–100, 100–200, 200–300, 300–400, 400–600, >600 m, and plotted a histogram to explore the elevation distribution of plantation establishment at five-year intervals (<1990, 1991–1995, 1996–2000, 2000–2005, and >2005). Furthermore, the elevation and slope variation of plantation establishment since 1986 were explored annually. We calculated and plotted the annual and total area of rubber plantations converted from evergreen forests, old rubber plantations, and cropland since 1988.

3. Results

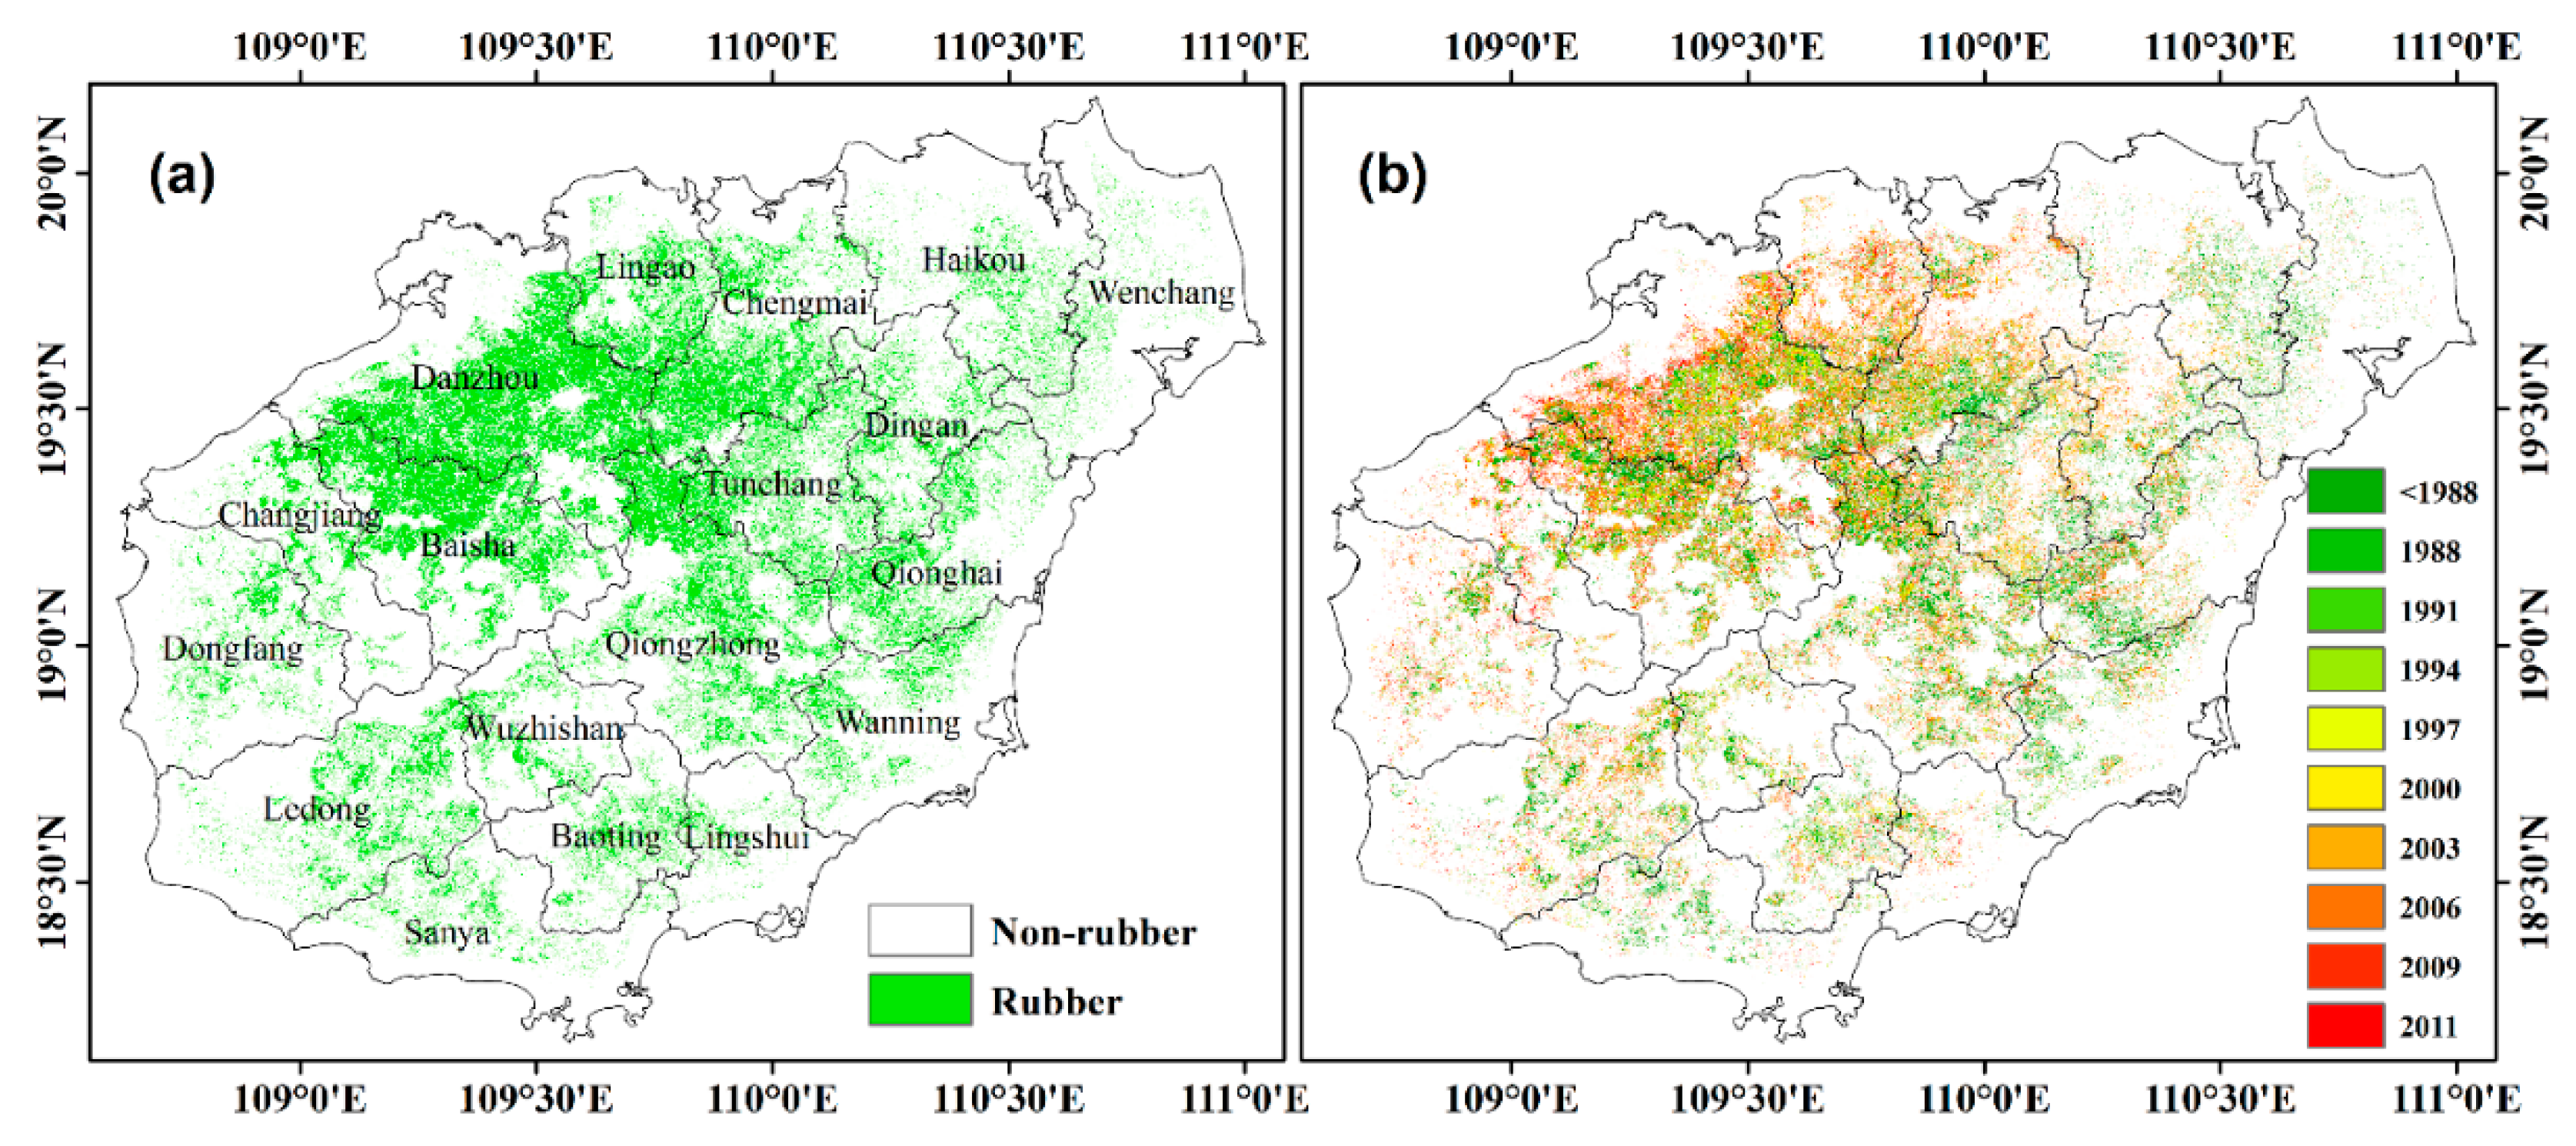
3.1. Rubber Plantation Map and Accuracy Assessment

The spatial distribution of rubber plantations in 2015 on Hainan Island is presented in Figure 6a. Rubber plantations are mainly located in the western, northern, and east-central regions. The densest rubber plantations are in Danzhou City and its surrounding regions, which comprise the largest natural rubber production base on Hainan Island.
The PA, UA, and OA for the resultant map of rubber plantations were 95.18% (±0.16%), 88.20% (±0.29%), and 96.99% (±0.07%) when validated with ground reference data (Table S2). The total mapped area of rubber plantations in 2015 was 5.83 × 10⁵ ha, and the adjusted area was (6.30 ± 0.04) × 105 ha.

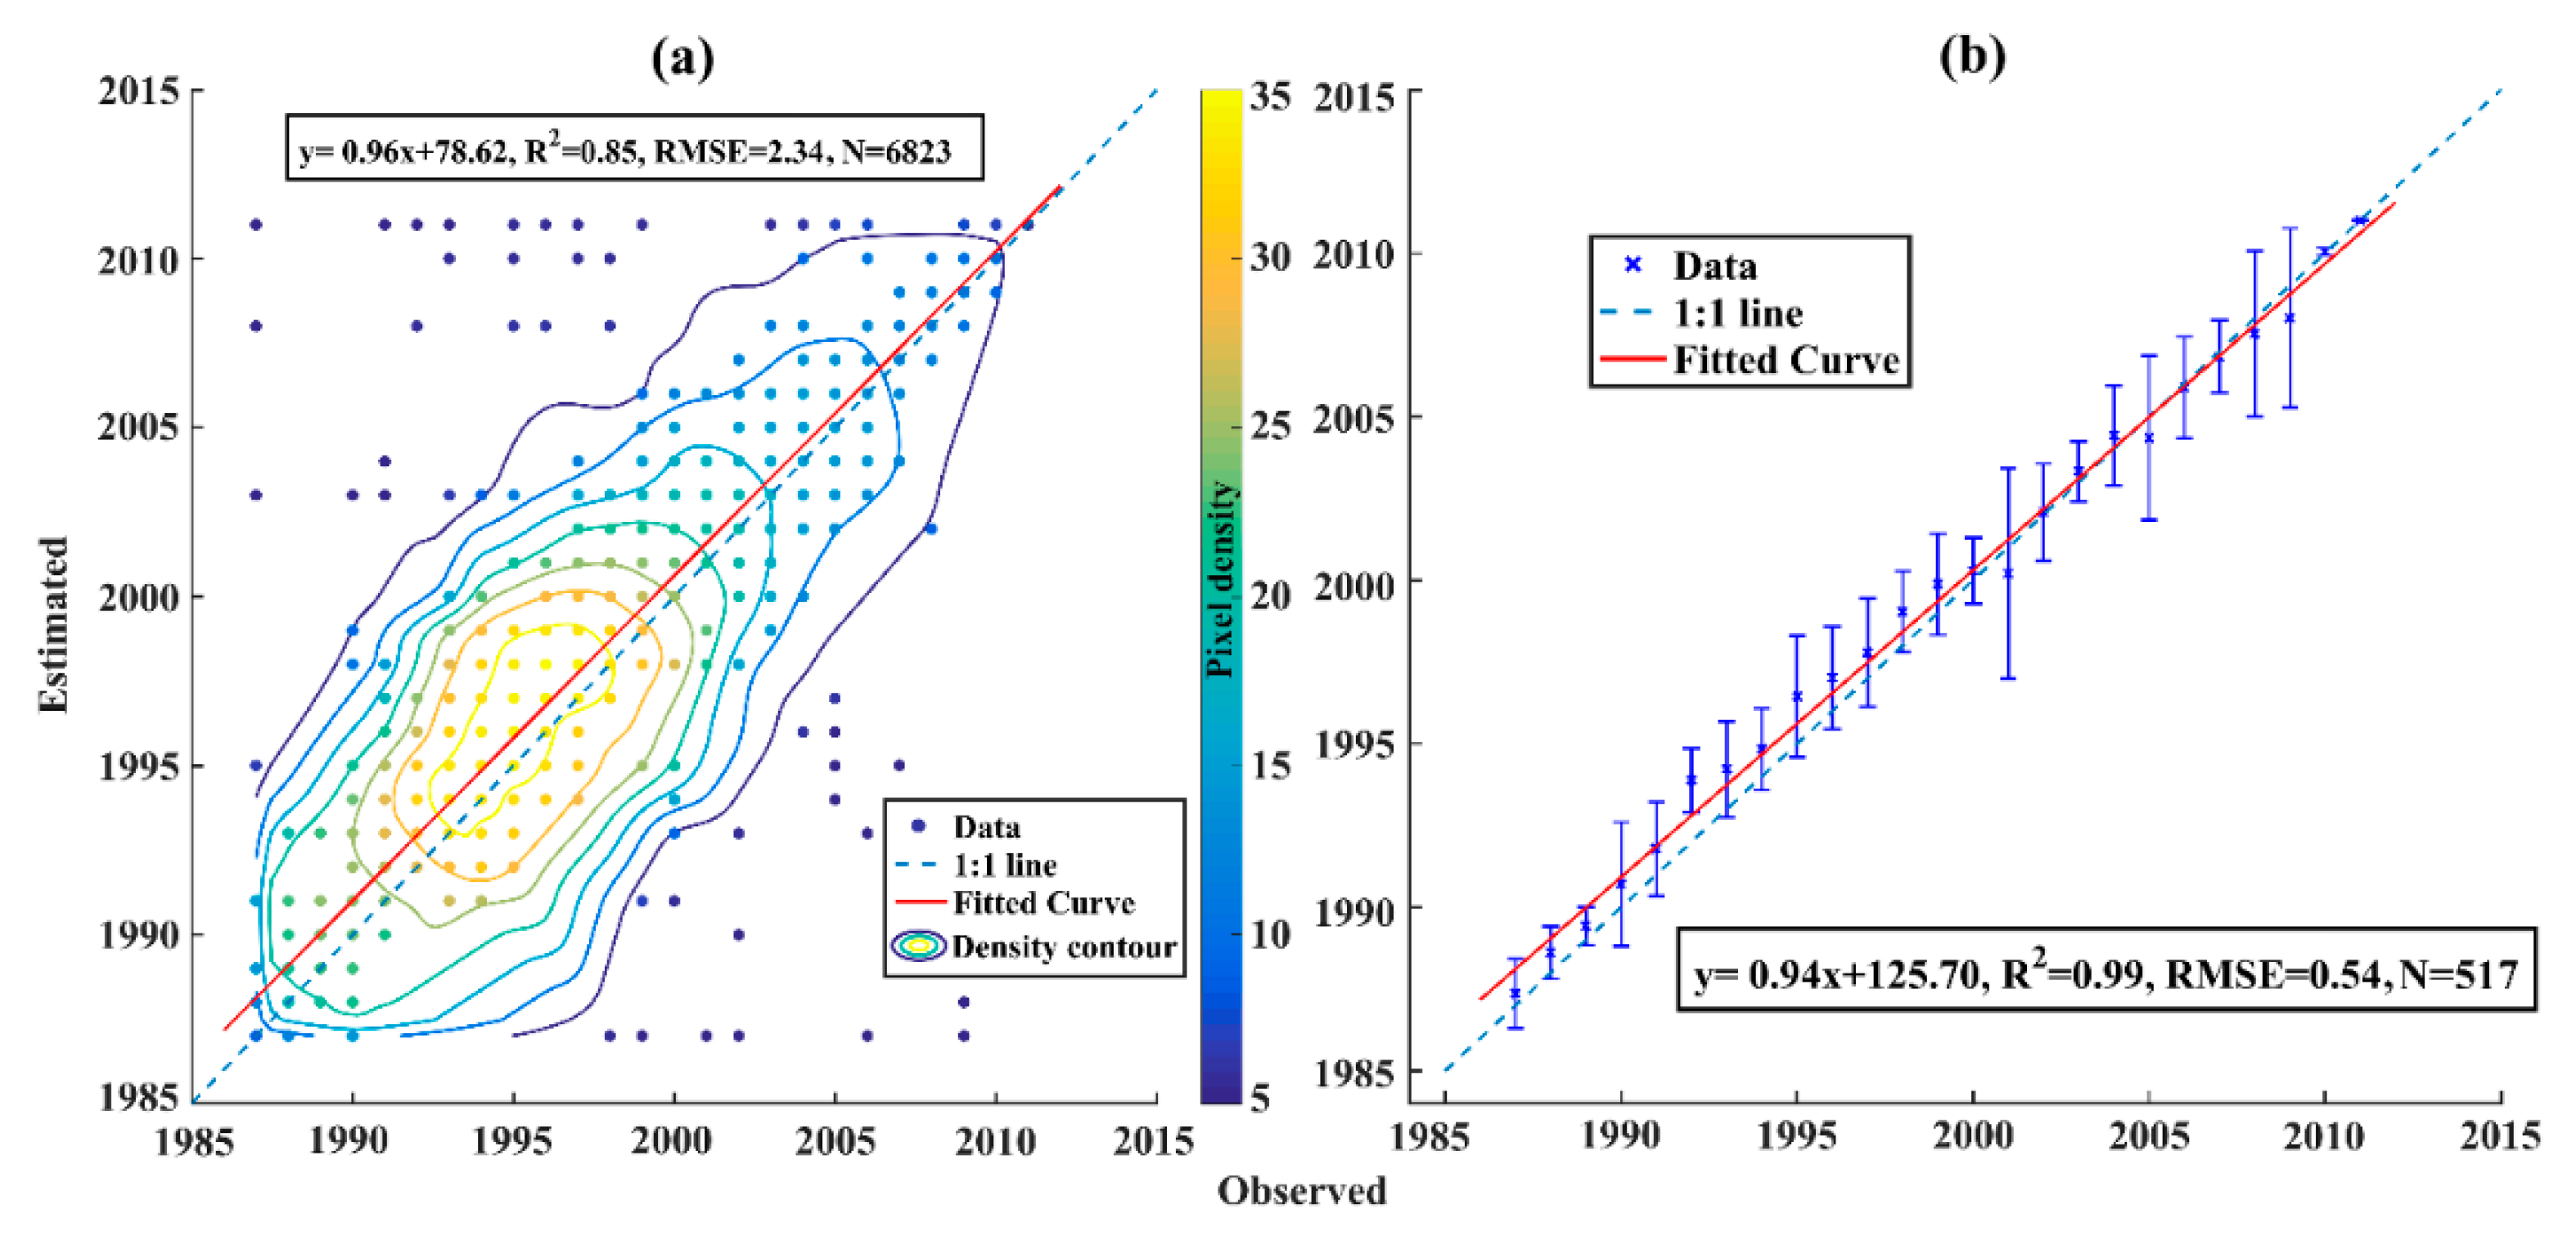
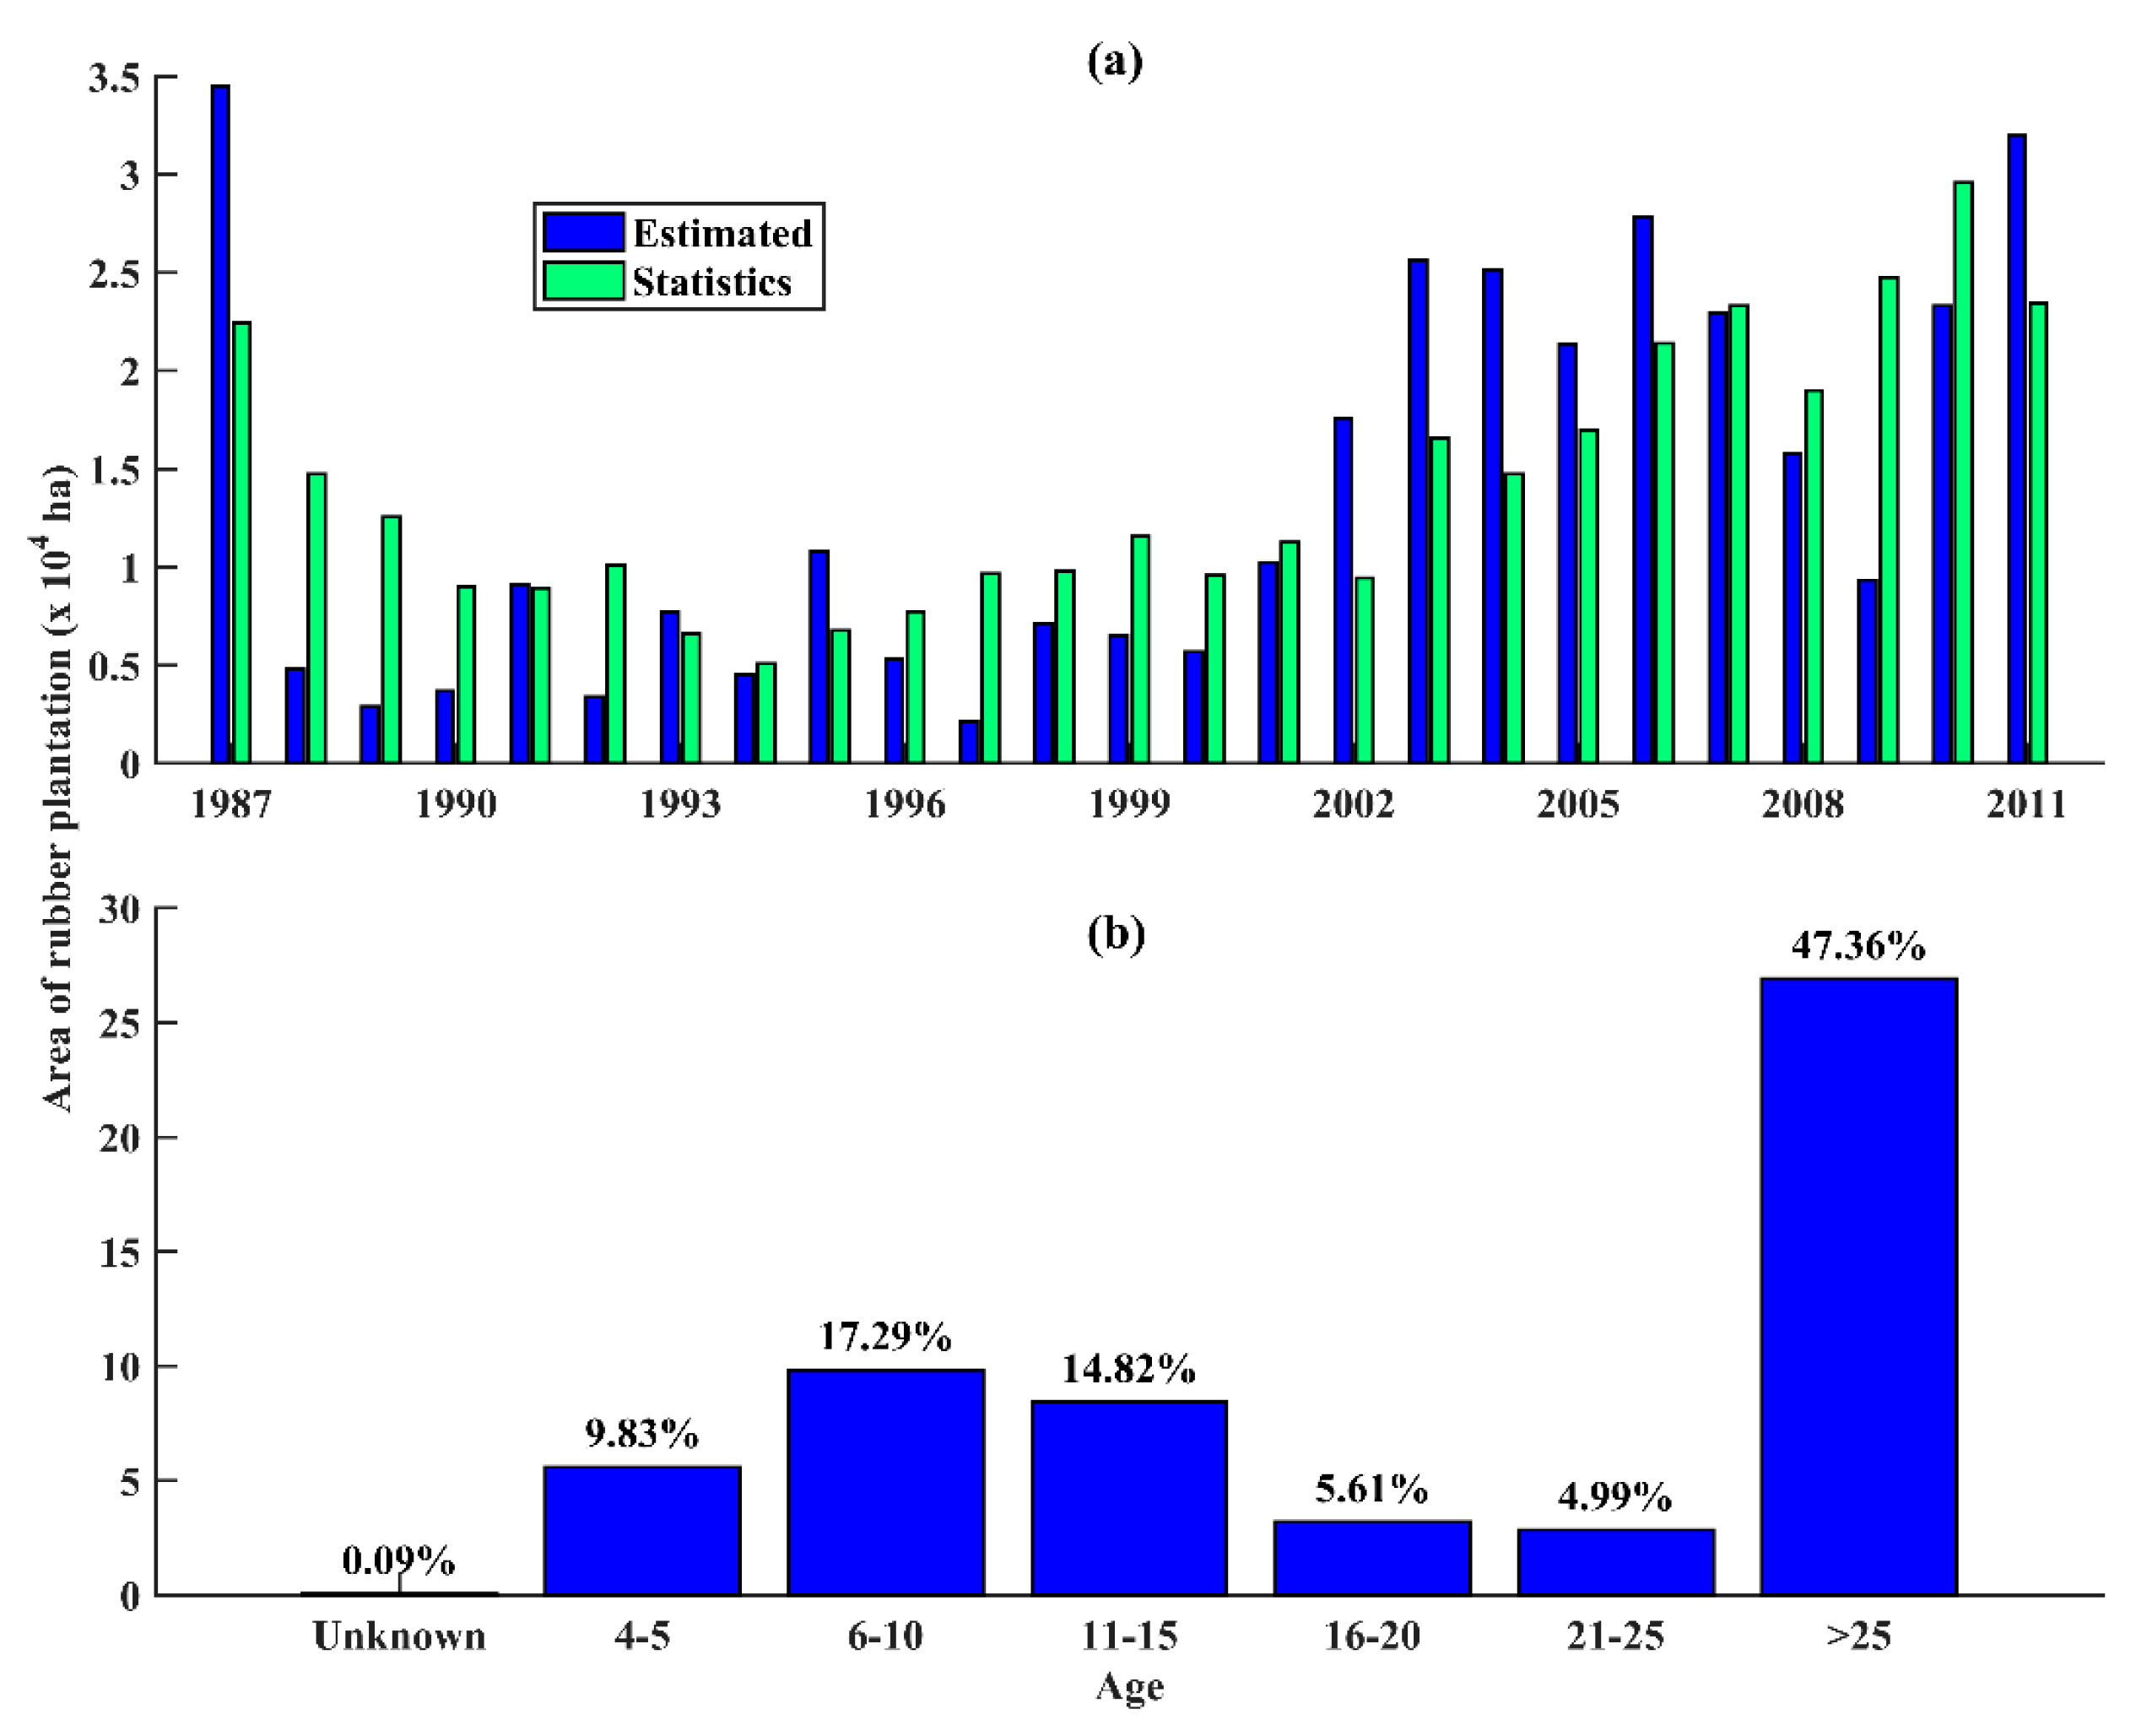
3.2. Establishment Year Map of Rubber Plantations and Accuracy Assessment

The establishment year of rubber plantations on Hainan Island is shown in Figure 6b. Many rubber plantations have been established across the island since 2000, especially after 2003. New rubber plantations were mainly concentrated in the northwest and northern regions such as Baisha County, Danzhou City, Lingao County, and Chengmai County. Old rubber plantations established before 1995 were mainly distributed in the central western regions, like Qiongzhong and Tunchang County, and along the coastal strip from south to northeast.
Estimated and observed establishment year of rubber plantations with all ROI pixels is presented in Figure 7a. Pixel density (plotting based on the number of pixels which have same observed and estimated establishment year) is shown in different colors, and contours are pixel density boundary (jointed points with equal pixel density). Pixels clustered along the 1:1 line have hotter colors, and pixel density contours are mostly symmetrical to the 1:1 line. The R2 and RMSE of the observed against estimated establishment year is 0.85 and 2.34 years, respectively. However, a few pixels are scattered far from the 1:1 line. At the plantation scale (Figure 7b), the mean estimated establishment year of rubber plantations against the observed year are closely distributed along the 1:1 line. The R2 of the fitted line is 0.99, and the RMSE is 0.54 years. Slight underestimation was observed for the old rubber plantations that was established prior to 2000.
At the annual scale, the estimated area of newly established rubber plantations by our map is close to the estimates provided by agricultural census data (Figure 8a). However, there were a few years (1987–1990, 1992, 1997, and 2009) in which there were large differences between our area estimate and the agricultural census.

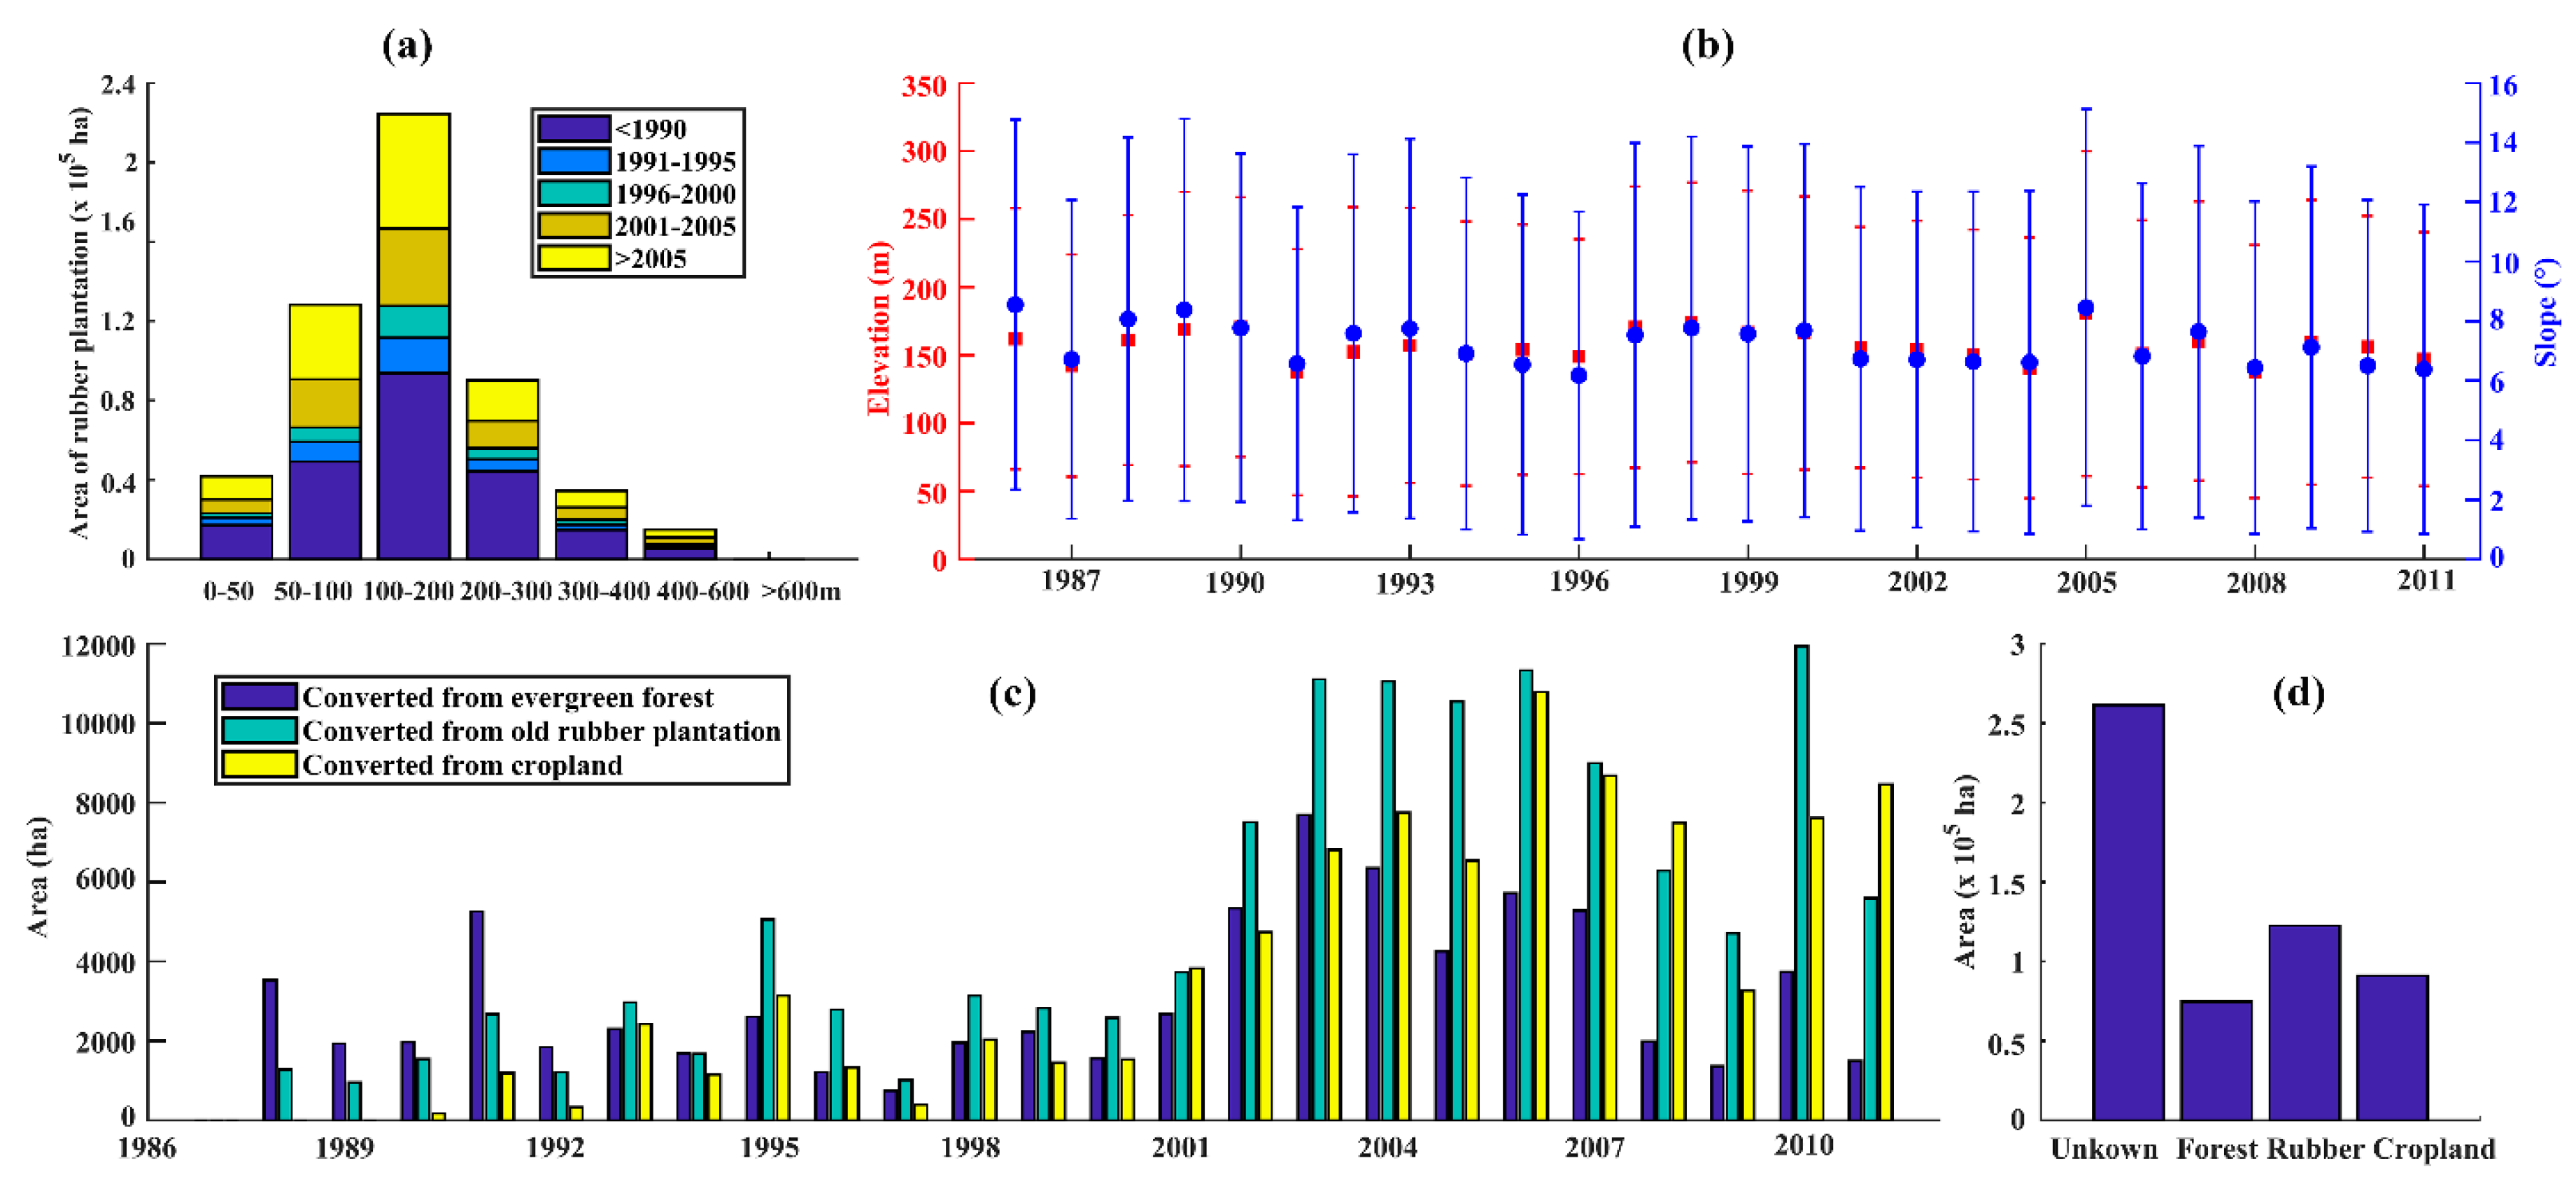
3.3. Spatial-Temporal Distribution of Rubber Plantation Expansion on Hainan Island

At the end of 2015, rubber plantations on Hainan Island with stand ages of 4–5, 6–10, 11–15, 16–20, 21–25, and >25 years accounted for 9.83% (55,867 ha), 17.29% (98,301 ha), 14.82% (84,261 ha), 5.61% (31,909 ha), 4.99% (28,389 ha), and 47.36% (269,174 ha) of the total area, respectively (Figure 8b). About 0.09% (497 ha) of rubber plantations failed to estimate their establishment years.
On Hainan Island, rubber plantations were mainly distributed at elevations less than 400 m AMSL and most were established before 1990 or after 2000 (Figure 9a). The average elevation of rubber plantations established after 1986 was about 150 m AMSL, and the standard deviation of elevation was about 100 m (Figure 9b). The average slope of rubber plantations was about 7°, and the standard deviation of slope was about 5°. In the past 30 years, no significant variation in elevation and slope were found during rubber plantation expansion (Figure 9b).

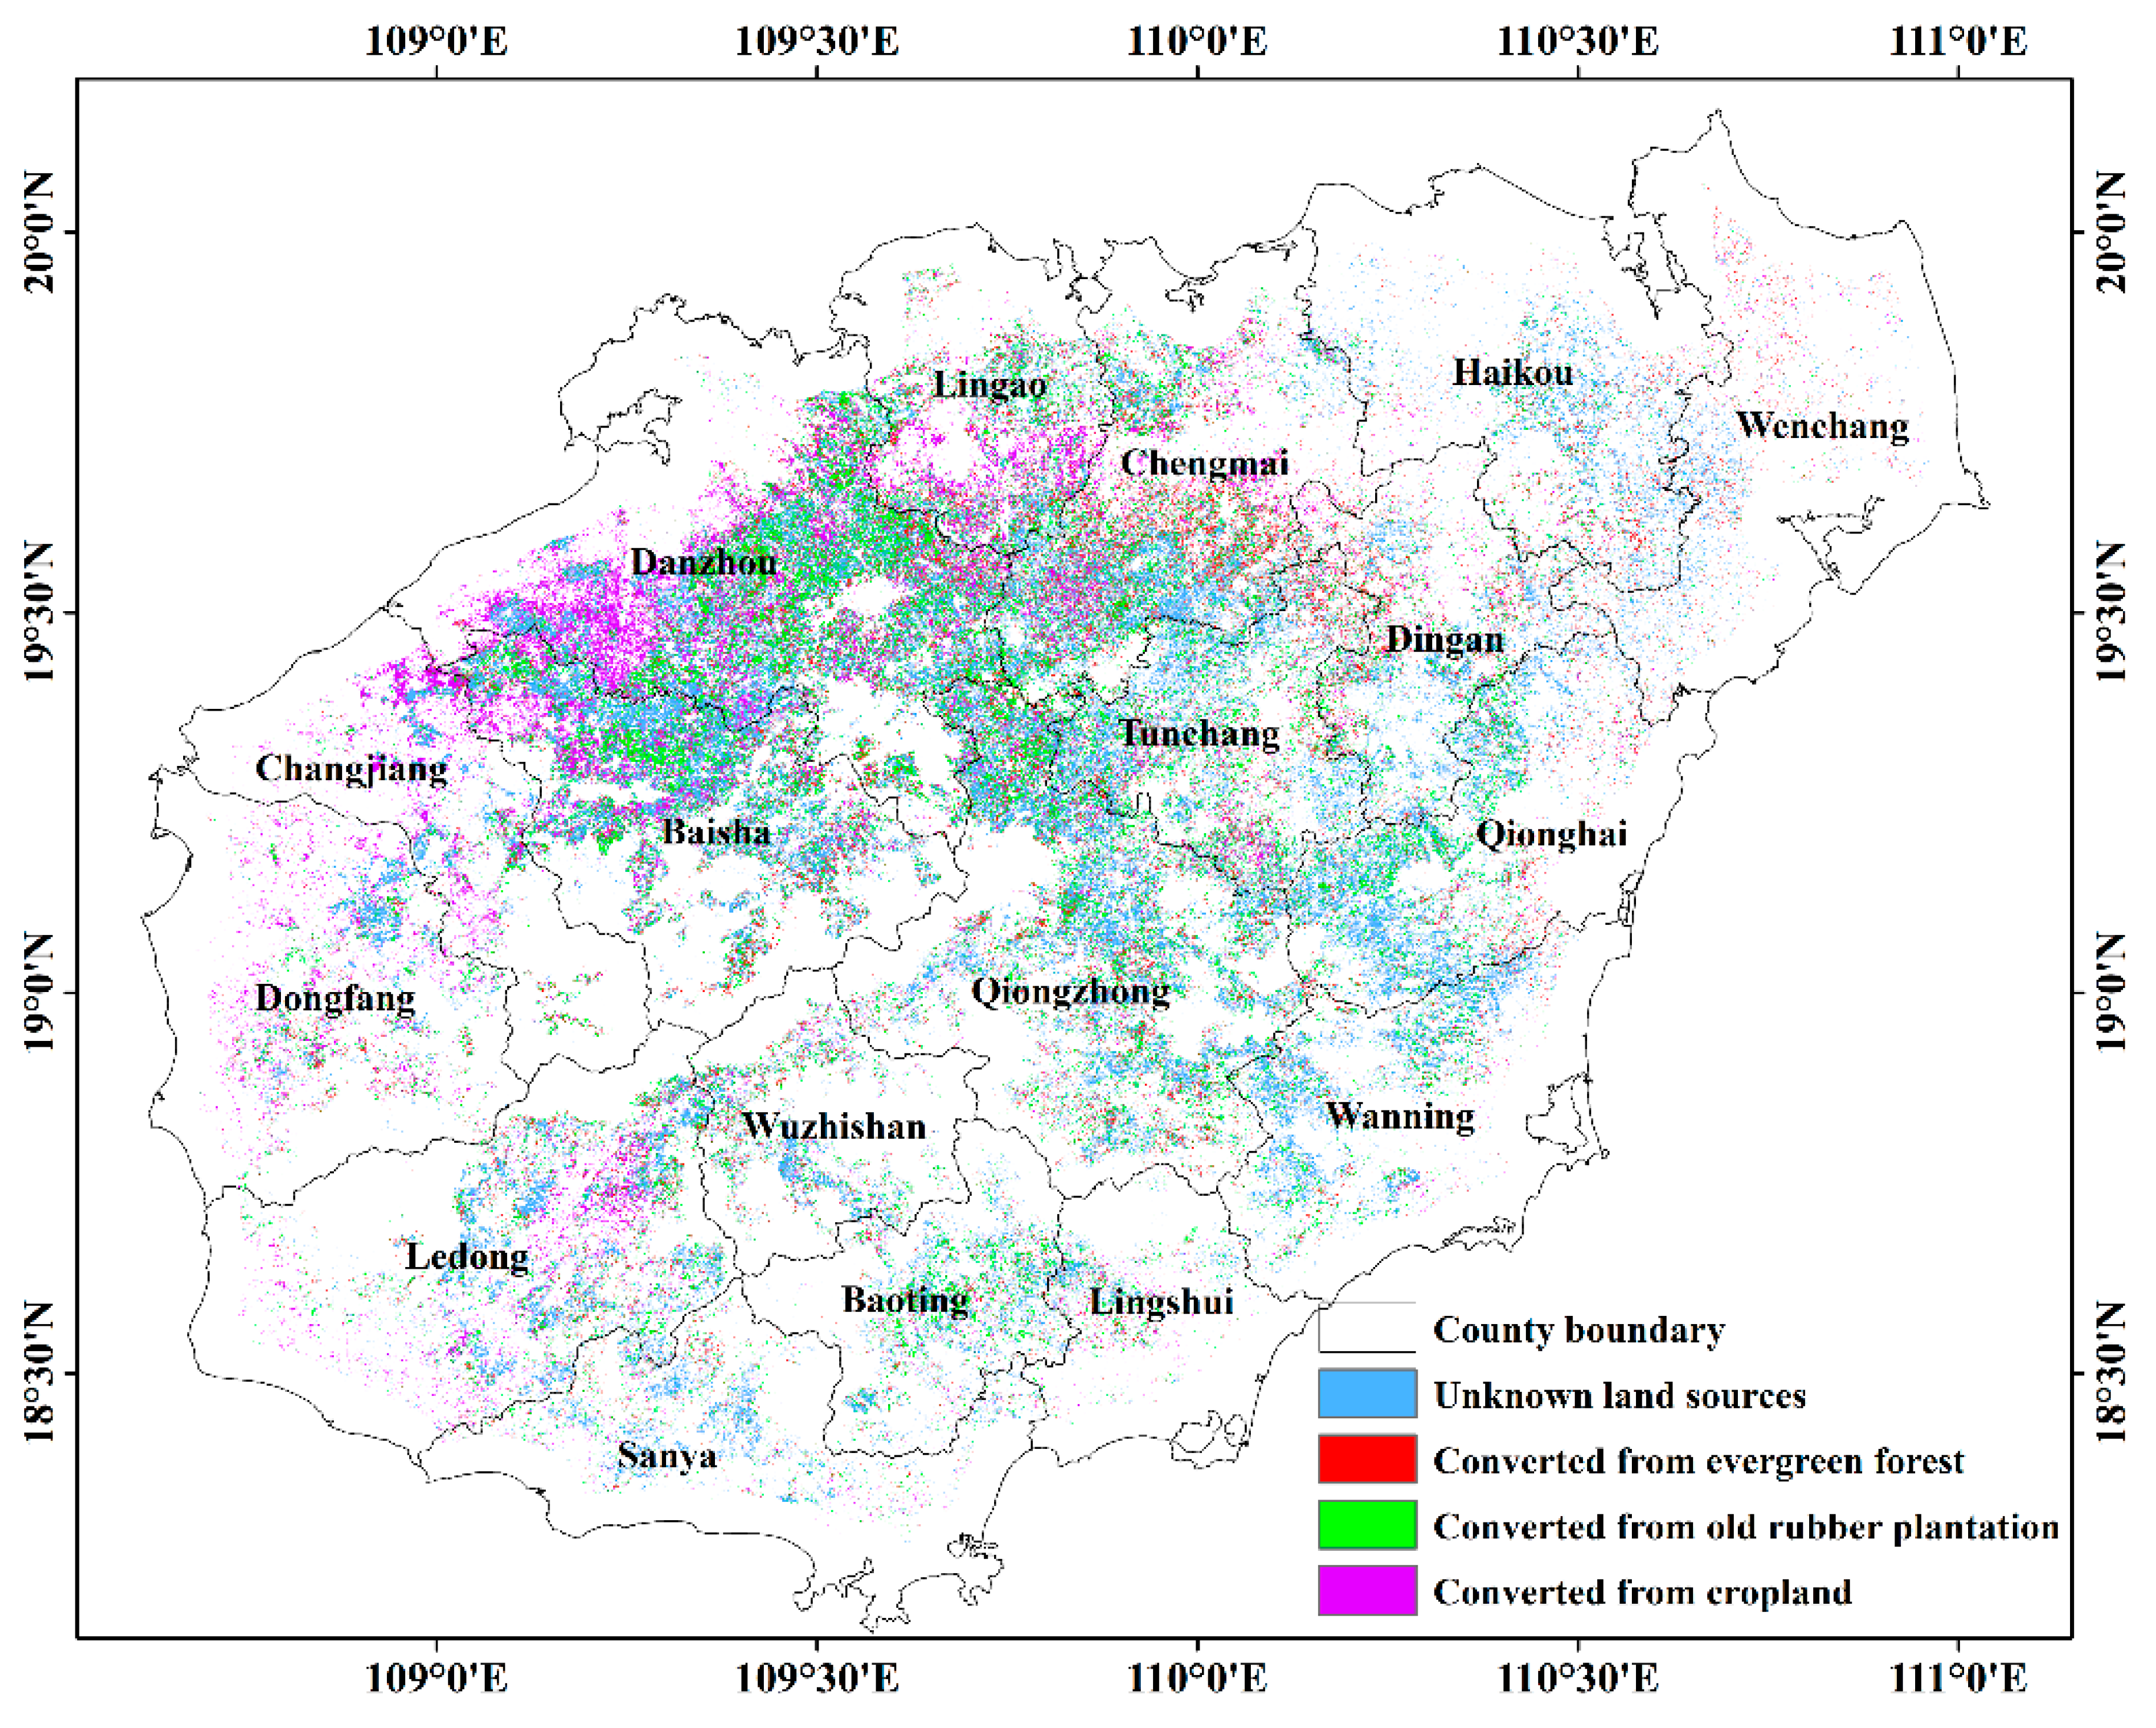
3.4. Pre-Conversion Land Covers of Rubber Plantations on Hainan Island

Before the 1990s, evergreen forests and old rubber plantations were the main land sources for new rubber plantations, with annual conversion area of >2000 and ~1000 ha, respectively (Figure 9c). The area of rubber plantations converted from old rubber plantations increased during the 1990s (>2000 ha), followed by evergreen forests and cropland. Since 2001, the area of newly-established rubber plantations increased substantially. Old rubber plantations continued to be the predominant pre-conversion land cover type for 2003–2007, and in 2010 were about 10,000 ha. During this period, cropland was the second largest pre-conversion land cover type, with average annual conversion area of ~8000 ha. There was a boom in the amount of evergreen forests converted to rubber plantations between 2002 and 2007, with an annual conversion area of ~6000 ha. However, the conversion area from evergreen forests decreased rapidly after 2007 (Figure 9c). The total mapped area of rubber plantations converted from old rubber plantations, cropland, and evergreen forests since 1988 were 1.26 × 10⁵, 0.95 × 10⁵, 0.68 × 10⁵ ha, and adjusted area were (1.32 ± 0.1) × 105, (0.96 ± 0.1) × 105, (0.61 ± 0.1) × 105 ha, respectively (Figure 9d).
The PA, UA, and OA of the pre-conversion land cover map were >86.60% (±0.05%), >84.21% (±0.07%), and >88.60% (±0.03%), respectively (Table S3). Rubber plantations converted from cropland were densely distributed in the northwest and northern regions, specifically in Danzhou City and Changjiang, Baisha, Lingao, and Chengmai Counties (Figure 10). In addition, we found that many scattered rubber plantations in the western region (Dongfang City and Ledong County) were previously cropland. Rubber plantations converted from old rubber plantations were mainly located in the northwest (e.g., Baisha County and Danzhou City) and northern-central regions (e.g., Qiongzhong, Tunchang, and Chengmai Counties) (Figure 10). In Baoting County, Qionghai City, and Wanning City we also found that many rubber plantations were established on old rubber plantations (Figure 10). Rubber plantations converted from evergreen forests were mainly distributed in Chengmai County, near the boundary between Dingan and Tunchang Counties, and in the interior mountainous area. However, these evergreen forests were relatively sparsely distributed. We did not observe any large hotspots where evergreen forests were converted to rubber plantations.

4. Discussion

4.1. Data and Algorithm for Identifying the Establishment Year of Rubber Plantations

Establishment year (stand age) of rubber plantations can be estimated by field interview, measuring the height of the tapping line, or reviewing the records/statistical data of local and national forestry departments. Compared with mapping using remote sensing, these approaches are difficult to frequently execute at large scales [25]. Remote sensing is a suitable technique to estimate the establishment year of rubber plantations at large scale, fine spatial resolution, and with an annual frequency. When mapped through remote sensing, the amount of satellite imagery was a very important factor. Most previous studies attempted to estimate the stand age (establishment year) of rubber plantations with a limited number of satellite images, such as single/mosaic optical images [11,15,19] or multi-temporal images [1] (Table 2). The accuracy of estimated stand age was susceptible to the image quality, acquisition time, and the information contained in the images. Here we used all Landsat TM/ETM+/OLI images that were available (1981 scenes; ~500 scenes per path/row), substantially more than the number of Landsat images used in the studies by Kou and Xiao (226 images per path/row) and Beckschäfer (276 images per path/row), (Table 2). Our establishment year map of rubber plantation in 2015 achieved high accuracy (R2 = 0.85/0.99, RMSE = 2.34/0.54 years at the pixel/plantation scale) by using time series Landsat images, which were also illustrated by several previous studies [10,20,43,44,45,46].
Unlike statistical models and imagery classification, which assumed a good relationship between spectral/structural features of the plantation canopy and stand age, our algorithm was built upon the understanding of physical land cover change with dense time series Landsat images, including exposed bare soil and the linear increase of canopy closure from rubber seedlings to maturity. We used LSWI < 0/0.1 to identify bare soil, which has been proposed to identify the establishment year of rubber plantations [10,20]. Kou and Xiao used the first year when LSWILeafoff_min < 0 as the establishment year, but this condition may occur during litter fall (defoliation), a period which usually has negative LSWI [23] and may, thus, introduce uncertainty for rubber plantations converted from cropland (Figure 5d,e). Beckschäfer improved Kou and Xiao’s algorithm by detecting the last year in which LSWILeafon_min < 0 as the plantation establishment year, and reached a RMSE of 2.5 years in Xishuangbanna, Yunnan Province, China. Beckschäfer’s algorithm reduced the uncertainties raised from defoliation around February and for plantations which were converted from cropland.
However, we found that solely using the last year in which LSWILeafon_min < 0 may underestimate the stand age of rubber plantations by 1–4 years (Figure 11), mainly due to intercropping (e.g., banana and peanut) and weed-eradication management practices (clearing or using herbicide) (Figure 12a,b). The exposed bare soil or dry vegetation by intensive intercropping or weeding would affect LSWI significantly. Beckschäfer did not observe this uncertainty because validation plantations came from visual interpretation via Landsat or Google Earth VHR imagery, while most of our validation data came from historical records from Hainan State Farm or field interviews. In addition, establishment years obtained from the last year in which LSWILeafon_min < 0 may be affected by severe disasters, such as typhoon and drought, which are prevalent in non-traditional rubber cultivation regions, such as China (Figure 12c,d) [11]. We additionally introduced a biophysical parameter, specifically, the slope of LSWIleafon_avg against the year during the non-production period, to capture the canopy change from seedling to mature plantation and, therefore, reduced the uncertainties from severe natural disasters, intercropping, and weeding. The mean estimated establishment year of rubber plantations was closely distributed along the 1:1 line (Figure 7b) and mean RMSE was reduced to 2.34/0.54 year at the pixel/plantation scale. Compared with Beckschäfer, we improved the algorithm in three ways: (1) reduced underestimation caused by intercropping and weeding; (2) used slope of LSWIleafon_avg against the year as a canopy change factor to reduce the commission error, which had been increased by severe disasters, such as typhoon, drought, and cold injury; and (3) excluded newly-established rubber plantations (here we excluded plantations <4 years). Some studies try to map rubber plantations at very early stages (e.g., ≤2, 2–4; 1–3 year age groups) [1]. However, these rubber plantations are difficult to identify accurately, even with Google Earth VHR imagery. Both spectral and structural features of these early rubber plantations are determined by weeds, shrubs, intercropping crops, or bare soil rather than rubber seedlings themselves (Figure 12a).

4.2. Uncertainties for Mapping Plantation Establishment Year and Pre-Conversion Land Covers

Fragmented landscapes: The fragmented landscape and complex topography in the tropics makes classification challenging [47]. About 25% of Hainan Island is mountainous with elevation greater than 500 m, and the remainder includes lowlands, hills, terraces, and plains which are favorable for agricultural development. The landscape in the low elevation regions is often fragmented into small patches of different land use and land cover types (Figure 12e). Severely fragmented landscapes are not conducive to the precise identification of rubber plantation and affect our ability to determine the establishment year of rubber plantations. We failed to estimate the establishment year of a few rubber plantations (about 1%), mainly due to uncertainties in classification.
Limitation in cloud-free satellite imagery and level of data product: Although we used the entire Landsat archive in our study, cloud-free imagery was severely limited in some years, especially before 2000 when only Landsat TM was available. Cloud-free satellite images during the RDF period (January to March) were important for generating the rubber plantation base map [23] (later used for identifying the establishment year) and tracking pre-conversion land covers. The short RDF period and frequent presence of cirrus cloud cover in tropical regions [27,48] made it difficult to generate an accurate rubber base map and to identify the pre-conversion land cover. In addition, we used Collection 1 TOA reflectance data instead of Collection 1 SR data, as the latter was not yet ready in the GEE platform at the beginning of this study. The TOA reflectance data is affected by atmospheric scattering and absorption [49], and the usage of higher level product of Collection 1 SR data may improve mapping accuracy.
Weeding management and intercropping: Bare soil was exposed during plantation establishment, but vegetation, like grasses and shrubs, recover quickly because of the favorable tropical climate (Figure 12a). Therefore, weeding (manual or herbicidal removal) is a mandatory management practice during rubber seedling establishment. In addition, intercropping (e.g., banana, pineapple, sugarcane, and peanuts) in the open canopy of early rubber plantations (usually less than four years) on relatively flat terrain is an important source of income for farmers during the non-production period (Figure 12b). The LSWILeafon_min, SLSWI, and the ability to estimate establishment year of rubber plantations were influenced by management intensity, crops, and the availability of cloud-free Landsat data around the date of human-related disturbances.
Severe natural disasters: Rubber trees always experience several natural disasters during their economic life cycle (~30 years) in China. Typhoon, cold injury, and droughts often hit Hainan Island and Yunnan Province [11]. For example, Hainan Island experienced one of its most severe droughts between September 2004 and July 2005, which was followed by the strongest super typhoon since 1974 on 25 September 2005 (Darry) [50] and a severe cold spell in 2008 [51]. Severe typhoons will harm the canopy (Figure 12c) while drought and disease can delay phenology or cause leaves to shed (Figure 12d). Such disasters will affect LSWI significantly (Figure S5). Therefore, it is better to avoid using satellite images acquired during these periods. Figure S6 shows a serious overestimation of new rubber plantations established in 2004 and 2005 when images acquired during severe drought and post-typhoon were used. However, overestimation was relieved when excluding these images (by only using images on DOY of 90–304 for 2004, and DOY of 120–268 for 2005) (Figure 6d).

4.3. The Spatial-Temporal Dynamic of Rubber Plantations on Hainan Island

The second rapid expansion of rubber plantations on Hainan Island began in the early 1980s, when the old rubber plantations established in the 1950s need to be updated and China started its Reform and Opening policy [52]. That was the main reason for about half of the old rubber plantations on Hainan Island by the end of 2015 (Figure 6b). We found these old rubber plantations were mainly distributed in the central western regions and along the coastal strip from south to northeast (Figure 6b). Unfortunately, we could not accurately obtain their stand age because the earliest Landsat TM imagery on Hainan Island available starts in 1987. During the 1990s, rubber plantations on Hainan Island grew at a very low and stable speed [53] (Figure 8a). During the early 2000s, rubber plantations expanded sharply because of the rapid rise of the natural rubber price, where the average annual price increased from ~$1200/ton in 2002 to the highest of ~$5500/ton in 2011 [54]. Since the southeastern coast is often hit by typhoons [11,55], newly-established rubber plantations were no longer expanding in these areas. Instead, they were concentrated in the northwestern region with good weather conditions and light typhoon disasters (Figure 6b).
In the past 30 years, the pre-conversion land cover for new rubber plantations changed greatly. Before the early 1990s, evergreen forests were the predominant land cover for new rubber plantations. The forest inventory in 1987 showed that the tropical natural forest fell from 863,000 ha in 1954 to 385,000 ha. Vast demand for timber, rubber, and tropical crops were the main factors leading to forest loss [56]. Therefore, the unknown pre-conversion land cover shown in Figure 9d was most likely evergreen forest. With the foundation of Hainan Province in 1988 (previously an administrative district of Guangdong Province) and strengthened governmental protection of tropical forest [56], the conversion of evergreen forests to rubber plantations fell significantly in the 1990s (Figure 9c). The area of rubber plantations converted from evergreen forests increased sharply from 2001 to 2007, which can be explained by the rapid increase in the price of natural rubber (Figure 9c) and development of privately-owned rubber plantations [52]. Stimulated by the natural rubber price, smallholders are more likely to convert evergreen natural forests and secondary forests into rubber plantations. However, forest conversion decreased significantly after 2007 because of conservation policies, such as the ‘forest eco-compensation mechanism’ in 2005 [57].
Old rubber plantations have always been an important land source for new rubber plantations on Hainan Island, even before 2000 (Figure 9c). Large-scale commercial rubber tree plantations began in the 1950s, so some of them were replanted with rubber trees after a 25–30 years life cycle. The sharp increase in the area of rubber plantations converted from old rubber plantations in the 2000s (Figure 9c, increased about 2 × 10⁵ ha, one third of the total area) can be explained by the rapid rise of the natural rubber price and the replacement of old, less-productive rubber plantations which were established after China’s Reform and Opening up in 1978.
The large area of rubber plantations converted from cropland since 2000 can be explained by the rapid development of privately-owned rubber plantations. Statistical data indicated that the area of privately-owned rubber plantations on Hainan Island exceeded the amount of state-owned rubber plantations for the first time in 2009 [54]. Smallholders were more likely to convert their cropland to rubber plantations because of strengthening ecological protection policies and forested lands were unsuitable for conversion to rubber plantations. A direct consequence for this conversion was the increasing complexity and fragmentation of the rubber plantation landscape (Figure 12e).
There was no significant variation in altitude and slope during rubber plantation expansion on Hainan Island in the past 30 years (Figure 9b). The average altitude of rubber plantations was about 150-m AMSL and the mean slope was about 7°. This phenomenon can be explained by the fact that most mountainous regions where rubber plantations are suitable (recommended less than 350-m AMSL) have already been extensively converted to rubber plantations prior to 1990 [56] (Figure 9c). The large area of rubber plantations converted from cropland may offset the trend of having more rubber plantations at higher elevation and steeper slope regions (Figure 9c), since cropland usually have relative flat terrain and are distributed in the low elevation regions. In addition, new rubber plantations converted from old rubber plantations are unlikely to change the pattern of elevation and the slope of rubber plantations.
The expansion pattern of rubber plantations on Hainan Island was quite different from that of Xishuangbanna in Yunnan Province, another important natural rubber production base in China. The area of rubber plantations in Xishuangbanna doubled from 2002 to 2010 [4]. The common practice for rubber plantation expansion in Xishuangbanna was to clear-cut evergreen forests on entire mountainsides and then contour ledges were built for rubber trees (Figure S7). Previous studies indicated that the mean elevation of rubber plantations established in Xishuangbanna before ~2005 was around 800 m, but after ~2005 mean elevation increased to a peak of 980 m in 2013 [10] and the plantations were being established at high elevations of >1200 m AMSL and on steeper terrain [4]. Unlike the complex, fragmented landscape on Hainan Island, it is easier to detect and estimate the establishment year of rubber plantations when mountainsides are clear-cut.

5. Conclusions

Establishment year (or stand age) of rubber plantations is an important parameter for practical management and ecological assessment. In this study, we developed new algorithms to estimate the establishment year of rubber plantations and identify the pre-conversion land cover types with high frequency time-series Landsat data. By applying these algorithms on Hainan Island, we produced a rubber plantation map in 2015 (OA > 97%), and identified the plantation establishment year (R2 = 0.85/0.99, and RMSE = 2.34/0.54 years at pixel/plantation scale) and pre-conversion land cover types (evergreen forests, old rubber plantations, and cropland) since 1987 at annual temporal resolution (OA > 88%). The resultant map indicates that rubber plantations on Hainan Island have increased significantly since 2000. The increased plantations were mainly concentrated in the northwest and northern regions and were predominately converted from old rubber plantations and cropland. From a longer time scale, the expansion of rubber plantations on Hainan Island since 1987 predominantly occurred on the fragmented lowlands owned by smallholders, and not towards regions of high elevation and steep slopes. The resultant maps of rubber plantations, establishment year, and pre-conversion land cover are useful for sustainable plantation management and ecological assessment, and the methodology has the potential to be applied to other regions using the GEE platform.

Supplementary Materials

The following are available online at https://www.mdpi.com/2072-4292/10/8/1240/s1, Figure S1. Percentage and count of annual cloud-free pixel statistics based on images acquired in rubber leaf-on season (April–December); Figure S2. Statistical information of stand age for 522 rubber plantations on Hainan Island that used for age map accuracy assessment; Figure S3. Separability of forest and rubber plantations based on LSWIRDF_min and LSWIRDF_Stdev which are composited from Landsat collection 1 TOA reflectance data acquired during the RDF period (January–March) of 2014 and 2015. LSWIRDF_min < 0.1 and LSWIRDF_Stdev > 0.08 was selected for discriminating rubber plantations from the forest base map; Figure S4. FGreenness of rubber plantations established in different years. Field data of rubber plantations established after 1990 come from the five rubber plantations established in 1990, 1995, 2000, 2005, and 2010, respectively. Different pre-conversion land covers for five rubber plantations established after 1990 degrade FGreenness value; Figure S5. Demonstration of a rubber plantation (109.44171E, 19.50666N) affected by the severe Typhoon Darry in 2005: (a) VHR satellite imagery of rubber plantation recovered from typhoon. The VHR imagery was acquired in 21 December 2012, and (b) NDVI/EVI/LSWI time series in 2005. LSWI decreased significantly after Typhoon Darry hit Hainan Island in 26 September 2005 (DOY = 268); Figure S6. Overestimation of rubber plantations established in 2004 and 2005 due to images acquired in the periods of severe drought (1 November 2004 to 1 May 2005) and post-hurricane (26 September 2005 to 31 December 2005) were used; Figure S7. Typical landscape of rubber plantations established in Xishuangbanna, Yunnan Province. Forests on the whole mountain were cleared and then a contour ledge was built to plant rubber trees; Table S1. Statistical information of slope (SLSWI), LSWILeafon_avg, and LSWILeafon_min based on rubber plantations established in 1990, 1995, 2000, 2005, and 2010, respectively; Table S2. Accuracy assessment of the 2015 rubber plantation map on Hainan Island using ground reference data; Table S3. Accuracy assessment of the pre-conversion land cover map of rubber plantations on Hainan Island using random ground reference data.

Author Contributions

Conceptualization: B.C., X.X., and G.X.; methodology: B.C., X.X., J.D., and W.K.; software: B.C.; validation: B.C.; formal analysis: B.C. and X.X; investigation: B.C., J.M., Q.L. and J.C.; resources: Q.L. and J.C.; data curation: B.C., and X.X.; writing—original draft preparation: B.C.; Writing—review and editing: B.C, X.X., R.D., H.Y., T.Y., and J.D.; visualization: B.C., and W.K.; supervision: X.X., Z.W., W.L., and G.X.; project administration: X.X. and Z.W.; funding acquisition: B.C., X.X., W.K., and Z.W.. All authors commented on the manuscript.

Funding

This research was funded in part by National Natural Science Foundation of China (41701510, 41571408, 31770591, 31760181, and 31400493), Hainan Provincial Department of Science and Technology under Grant (ZDKJ2016021), Earmarked Fund for China Agriculture Research System (CARS-33-ZP3 and CARS-33-ZP1), and the China Postdoctoral Science Foundation (2016M601823).

Acknowledgments

We thank the U.S Geological Survey (USGS) EROS Data Center and JAXA for their satellite data, and Feng an from Rubber Research Institute, CATAS for providing drought rubber plantation photos.

Conflicts of Interest

The authors declare no conflict of interest, and the funders had no role in the design of the study; in the collection, analyses, or interpretation of data; in the writing of the manuscript, and in the decision to publish the results.

References

  1. Li, Z.; Fox, J.M. Mapping rubber tree growth in mainland Southeast Asia using time-series MODIS 250 m NDVI and statistical data. Appl. Geogr. 2012, 32, 420–432. [Google Scholar] [CrossRef]
  2. Food and Agriculture Organization of the United Nations. 2017. Available online: http://www.fao.org/faostat/en/#data/QC (accessed on 13 June 2018).
  3. Global Forest Resources Assessment (FRA) 2010 Main Report. Available online: http://www.fao.org/3/a-i1757e.pdf (accessed on 13 June 2018).
  4. Chen, H.; Yi, Z.F.; Schmidt-Vogt, D.; Ahrends, A.; Beckschafer, P.; Kleinn, C.; Ranjitkar, S.; Xu, J. Pushing the Limits: The Pattern and Dynamics of Rubber Monoculture Expansion in Xishuangbanna, SW China. PLoS ONE 2016, 11. [Google Scholar] [CrossRef] [PubMed]
  5. Ahrends, A.; Hollingsworth, P.M.; Ziegler, A.D.; Fox, J.M.; Chen, H.; Su, Y.; Xu, J. Current trends of rubber plantation expansion may threaten biodiversity and livelihoods. Glob. Environ. Chang. 2015, 34, 48–58. [Google Scholar] [CrossRef]
  6. Blagodatsky, S.; Xu, J.; Cadisch, G. Carbon balance of rubber (Hevea brasiliensis) plantations: A review of uncertainties at plot, landscape and production level. Agric. Ecosyst. Environ. 2016, 221, 8–19. [Google Scholar] [CrossRef]
  7. Yang, X.; Blagodatsky, S.; Liu, F.; Becksch Fer, P.; Xu, J.; Cadisch, G. Rubber tree allometry, biomass partitioning and carbon stocks in mountainous landscapes of sub-tropical China. For. Ecol. Manag. 2017, 404, 84–99. [Google Scholar] [CrossRef]
  8. Fox, J.; Castella, J.; Ziegler, A.D. Swidden, rubber and carbon: Can REDD+ work for people and the environment in Montane Mainland Southeast Asia? Glob. Environ. Chang. 2014, 29, 318–326. [Google Scholar] [CrossRef] [Green Version]
  9. Fujiki, S.; Okada, K.; Nishio, S.; Kitayama, K. Estimation of the stand ages of tropical secondary forests after shifting cultivation based on the combination of WorldView-2 and time-series Landsat images. ISPRS J. Photogramm. Remote Sens. 2016, 119, 280–293. [Google Scholar] [CrossRef]
  10. Beckschäfer, P. Obtaining rubber plantation age information from very dense Landsat TM&ETM+ time series data and pixel-based image compositing. Remote Sens. Environ. 2017, 196, 89–100. [Google Scholar]
  11. Chen, B.; Cao, J.; Wang, J.; Wu, Z.; Tao, Z.; Chen, J.; Yang, C.; Xie, G. Estimation of rubber stand age in typhoon and chilling injury afflicted area with Landsat TM data: A case study in Hainan Island, China. For. Ecol. Manag. 2012, 274, 222–230. [Google Scholar] [CrossRef]
  12. Dibs, H.; Idrees, M.O.; Alsalhin, G.B.A. Hierarchical classification approach for mapping rubber tree growth using per-pixel and object-oriented classifiers with SPOT-5 imagery. Egypt. J. Remote Sens. Space Sci. 2017, 20, 21–30. [Google Scholar] [CrossRef]
  13. Li, Z.; Fox, J.M. Rubber Tree Distribution Mapping in Northeast Thailand. Int. J. Geosci. 2011, 2, 573–584. [Google Scholar] [CrossRef]
  14. Razak, J.; Shariff, A.; Ahmad, N.B.; Sameen, M.I. Mapping rubber trees based on phenological analysis of Landsat time series data-sets. Geoacarto Int. 2018, 33. [Google Scholar] [CrossRef]
  15. Suratman, M.N.; Bull, G.Q.; Leckie, D.G.; Lemay, V.M.; Marshall, P.L.; Mispan, M.R. Prediction models for estimating the area, volume, and age of rubber (Hevea brasiliensis) plantations in Malaysia using Landsat TM data. Int. For. Rev. 2004, 6, 1–12. [Google Scholar] [CrossRef]
  16. Liu, X.; Feng, Z.; Jiang, L.; Zhang, J. Rubber plantation in Xishuangbanna: Remote sensing identification and digital mapping. Resour. Sci. 2012, 34, 1769–1780. [Google Scholar]
  17. Koedsin, W.; Huete, A. Mapping Rubber Tree Stand Age Using Pléiades Satellite Imagery: A Case Study in Thalang District, Phuket, Thailand. Eng. J. 2015, 19, 45–56. [Google Scholar] [CrossRef]
  18. Charoenjit, K.; Zuddas, P.; Allemand, P.; Pattanakiat, S.; Pachana, K. Estimation of biomass and carbon stock in Para rubber plantations using object-based classification from Thaichote satellite data in Eastern Thailand. J. Appl. Remote Sens. 2015, 9. [Google Scholar] [CrossRef]
  19. Trisasongko, B.H. Mapping stand age of rubber plantation using ALOS-2 polarimetric SAR data. Eur. J. Remote Sens. 2017, 50, 64–76. [Google Scholar] [CrossRef] [Green Version]
  20. Kou, W.; Xiao, X.; Dong, J.; Gan, S.; Zhai, D.; Zhang, G.; Qin, Y.; Li, L. Mapping Deciduous Rubber Plantation Areas and Stand Ages with PALSAR and Landsat Images. Remote Sens. 2015, 7, 1048–1073. [Google Scholar] [CrossRef] [Green Version]
  21. Chen, B.; Xie, G.; Wang, J.; Wu, Z.; Cao, J. Estimation of rubber stand age using statistical and artificial neutral network approaches with Landsat TM data. Chin. J. Trop. Crops 2012, 33, 182–188. [Google Scholar]
  22. Qi, D.; Zhou, J.; Xie, G.; Wu, Z. Optimizing Tapping-Tree Density of Rubber (Hevea brasiliensis) Plantations in South China. Small-Scale For. 2016, 15, 61–72. [Google Scholar] [CrossRef]
  23. Chen, B.; Li, X.; Xiao, X.; Zhao, B.; Dong, J.; Kou, W.; Qin, Y.; Yang, C.; Wu, Z.; Sun, R.; et al. Mapping tropical forests and deciduous rubber plantations in Hainan Island, China by integrating PALSAR 25-m and multi-temporal Landsat images. Int. J. Appl. Earth Obs. Geoinf. 2016, 50, 117–130. [Google Scholar] [CrossRef]
  24. Chen, B.; Wu, Z.; Yang, C.; Qi, D.; Li, X.; Lan, G. Monthly dynamic of leaf area index of rubber plantation in Danzhou, Hainan Island, China. Chin. J. Trop. Agric. 2015, 35, 1–6. [Google Scholar]
  25. Hainan Statistical Yearbook. 2015. Available online: http://tongji.cnki.net/kns55/Navi/YearBook.aspx?id=N2016010173&floor=1 (accessed on 23 April 2016).
  26. Liu, J.; Kuang, W.; Zhang, Z.; Xu, X.; Qin, Y.; Ning, J.; Zhou, W.; Zhang, S.; Li, R.; Yan, C.; et al. Spatiotemporal characteristics, patterns and causes of land use changes in China since the late 1980s. J. Geogr. Sci. 2014, 24, 195–210. [Google Scholar] [CrossRef]
  27. Zhu, Z.; Wang, S.; Woodcock, C.E. Improvement and expansion of the Fmask algorithm: cloud, cloud shadow, and snow detection for Landsats 4–7, 8, and Sentinel 2 images. Remote Sens. Environ. 2015, 159, 269–277. [Google Scholar] [CrossRef]
  28. Zhu, Z.; Woodcock, C.E.; Rogan, J.; Kellndorfer, J. Assessment of spectral, polarimetric, temporal, and spatial dimensions for urban and peri-urban land cover classification using Landsat and SAR data. Remote Sens. Environ. 2012, 117, 72–82. [Google Scholar] [CrossRef]
  29. Tucker, C.J. Red and photographic infrared linear combinations for monitoring vegetation. Remote Sens. Environ. 1979, 8, 127–150. [Google Scholar] [CrossRef] [Green Version]
  30. Huete, A.; Didan, K.; Miura, T.; Rodriguez, E.P.; Gao, X.; Ferreira, L.G. Overview of the radiometric and biophysical performance of the MODIS vegetation indices. Remote Sens. Environ. 2002, 83, 195–213. [Google Scholar] [CrossRef]
  31. Gao, B. NDWI—A normalized difference water index for remote sensing of vegetation liquid water from space. Remote Sens. Environ. 1996, 58, 257–266. [Google Scholar] [CrossRef]
  32. Xiao, X.; Boles, S.; Liu, J.; Zhuang, D.; Liu, M. Characterization of forest types in Northeastern China, using multi-temporal SPOT-4 VEGETATION sensor data. Remote Sens. Environ. 2002, 82, 335–348. [Google Scholar] [CrossRef] [Green Version]
  33. Xiao, X.; Biradar, C.M.; Czarnecki, C.; Alabi, T.; Keller, M. A Simple Algorithm for Large-Scale Mapping of Evergreen Forests in Tropical America, Africa and Asia. Remote Sens. 2009, 1, 355–374. [Google Scholar] [CrossRef] [Green Version]
  34. Chen, B.; Xiao, X.; Ye, H.; Ma, J.; Russell, D.; Li, X.; Zhao, B.; Wu, Z.; Sun, R.; Dong, J.; et al. Mapping forest and their spatial-temporal changes from 2007 to 2015 in tropical Hainan Island by integrating ALOS/ALOS-2 L-band SAR and Landsat optical images. IEEE J. Sel. Trop. Appl. Earth Obs. Remote Sens. 2018, 11, 852–867. [Google Scholar] [CrossRef]
  35. Dong, J.; Xiao, X.; Chen, B.; Torbick, N.; Jin, C.; Zhang, G.; Biradara, C. Mapping deciduous rubber plantations through integration of PALSAR and multi-temporal Landsat imagery. Remote Sens. Environ. 2013, 134, 392–402. [Google Scholar] [CrossRef]
  36. Dong, J.; Xiao, X.; Sheldon, S.; Biradar, C.; Xie, G. Mapping tropical forests and rubber plantations in complex landscapes by integrating PALSAR and MODIS imagery. ISPRS J. Photogramm. Remote Sens. 2012, 74, 20–33. [Google Scholar] [CrossRef]
  37. Global 25m Resolution PALSAR-2/PALSAR Mosaic and Forest/Non-Forest Map (FNF) Dataset Description. 2017. Available online: http://www.eorc.jaxa.jp/ALOS/en/palsar_fnf/DatasetDescription_PALSAR2_Mosaic_FNF_revH.pdf (accessed on 15 May 2018).
  38. Xiao, X.; Boles, S.; Liu, J.; Zhuang, D.; Frolking, S.; Li, C.; Salas, W.; Moore, B. Mapping paddy rice agriculture in southern China using multi-temporal MODIS images. Remote Sens. Environ. 2005, 95, 480–492. [Google Scholar] [CrossRef]
  39. Chen, B.; Xiao, X.; Li, X.; Pan, L.; Doughty, R.; Ma, J.; Dong, J.; Qin, Y.; Zhao, B.; Wu, Z.; et al. A mangrove forest map of China in 2015: Analysis of time series Landsat 7/8 and Sentinel-1A imagery in Google Earth Engine cloud computing platform. ISPRS J. Photogramm. Remote Sens. 2017, 131, 104–120. [Google Scholar] [CrossRef]
  40. Olofsson, P.; Foody, G.M.; Herold, M.; Stehman, S.V.; Woodcock, C.E.; Wulder, M.A. Good practices for estimating area and assessing accuracy of land change. Remote Sens. Environ. 2014, 148, 42–57. [Google Scholar] [CrossRef] [Green Version]
  41. Jeon, S.B.; Olofsson, P.; Woodcock, C.E. Land use change in New England: a reversal of the forest transition. J. Land Use Sci. 2012, 9, 105–130. [Google Scholar] [CrossRef]
  42. Olofsson, P.; Foody, G.M.; Stehman, S.V.; Woodcock, C.E. Making better use of accuracy data in land change studies: Estimating accuracy and area and quantifying uncertainty using stratified estimation. Remote Sens. Environ. 2013, 129, 122–131. [Google Scholar] [CrossRef]
  43. Dong, J.; Xiao, X.; Menarguez, M.A.; Zhang, G.; Qin, Y.; Thau, D.; Biradar, C.; Moore, B. Mapping paddy rice planting area in northeastern Asia with Landsat 8 images, phenology-based algorithm and Google Earth Engine. Remote Sens. Environ. 2016, 185, 142–154. [Google Scholar] [CrossRef] [PubMed] [Green Version]
  44. Reiche, J.; Verbesselt, J.; Hoekman, D.; Herold, M. Fusing Landsat and SAR time series to detect deforestation in the tropics. Remote Sens. Environ. 2015, 156, 276–293. [Google Scholar] [CrossRef]
  45. Zhou, Y.; Xiao, X.; Qin, Y.; Dong, J.; Zhang, G.; Kou, W.; Jin, C.; Wang, J.; Li, X. Mapping paddy rice planting area in rice-wetland coexistent areas through analysis of Landsat 8 OLI and MODIS images. Int. J. Appl. Earth Obs. Geoinf. 2016, 46, 1–12. [Google Scholar] [CrossRef] [PubMed] [Green Version]
  46. Hermosilla, T.; Wulder, M.A.; White, J.C.; Coops, N.C.; Hobart, G.W. Regional detection, characterization, and attribution of annual forest change from 1984 to 2012 using Landsat-derived time-series metrics. Remote Sens. Environ. 2015, 170, 121–132. [Google Scholar] [CrossRef]
  47. Vaglio Laurin, G.; Liesenberg, V.; Chen, Q.; Guerriero, L.; Del Frate, F.; Bartolini, A.; Coomes, D.; Wilebore, B.; Lindsell, J.; Valentini, R. Optical and SAR sensor synergies for forest and land cover mapping in a tropical site in West Africa. Int. J. Appl. Earth Obs. Geoinf. 2013, 21, 7–16. [Google Scholar] [CrossRef]
  48. Watmough, G.R.; Atkinson, P.M.; Hutton, C.W. A combined spectral and object-based approach to transparent cloud removal in an operational setting for Landsat ETM+. Int. J. Appl. Earth Obs. Geoinf. 2011, 13, 220–227. [Google Scholar] [CrossRef]
  49. Huang, C.; Goward, S.N.; Masek, J.G.; Thomas, N.; Zhu, Z.; Vogelmann, J.E. An automated approach for reconstructing recent forest disturbance history using dense Landsat time series stacks. Remote Sens. Environ. 2010, 114, 183–198. [Google Scholar] [CrossRef]
  50. Yu, W.; Zhang, M.; Mai, Q.; Jiang, J. Damage of Typhoon Damrey to the Rubber Industry in Hainan State Farm Bureau and Its Countermeasures for Future Development. Chin. J. Trop. Agric. 2006, 26, 41–43. [Google Scholar]
  51. Kan, L.; Xie, G.; Tao, Z.; Yang, L.; Cui, Z. Analysis on rubber tree cold injury in 2007/2008 winter in Hainan. Chin. Agric. Sci. Bull. 2009, 10, 251–257. [Google Scholar]
  52. Hainan State Farm (HSF). Technique Manual of Rubber Cultivation for Hainan State Farm; Hainan State Farm (HSF): Haikou, China, 2007. [Google Scholar]
  53. Hainan Statistical Yearbook. 2010. Available online: http://tongji.cnki.net/kns55/Navi/YearBook.aspx?id=N2010110036&floor=1 (accessed on 5 May 2018).
  54. Mo, Y. Production and marketing of nature rubber in 2009 and market forecast in 2010. Chin. Trop. Agric. 2010, 33, 12–15. [Google Scholar]
  55. Liu, S.; Zhang, J.; Cai, D.; Tian, G.; Zhang, G.; Zou, H. Spatial-temporal characteristics of rubber typhoon disaster in Hainan Island. Guangdong Agric. Sci. 2015, 42, 132–135. [Google Scholar]
  56. Huang, J. Study on sustainable management of tropical forest in Hainan Island. Master’s Thesis, Chinese Academy of Forestry, Beijing, China, 2006. [Google Scholar]
  57. Li, F.; Chen, H. Analysis on Socia-economic impact of forest eco-compensation mechanism in Hainan Province. Chin. Popul. Resour. Environ. 2007, 6, 113–118. [Google Scholar]
Figure 1. Location and topography of Hainan Island overlaid with ground reference data which was used for generating maps and accuracy assessments for maps of (a) rubber plantation in 2015; (b) establishment year; and (c) pre-conversion land covers.
Remotesensing 10 01240 g001
Figure 2. Statistical information of Landsat TM/ETM+/OLI imagery on Hainan Island during 1987 and 2015. Statistical data was conducted by (a) path/row; (b) month; and (c) sensors.
Remotesensing 10 01240 g002
Figure 3. Workflow of mapping the establishment year of rubber plantations and pre-conversion land cover types.
Remotesensing 10 01240 g003
Figure 4. Illustration of (a) rubber plantation in Google Earth VHR imagery and (b) it’s temporal profile of mean and minimum NDVI, EVI, and LSWI from annual composited Landsat images acquired in leaf-on period. This rubber plantation was on an experimental farm of the Chinese Academy of Tropical Agricultural Science (CATAS), and new rubber plantations were established after removing the old rubber trees in 2001.
Remotesensing 10 01240 g004
Figure 5. Temporal profile analysis of LSWILeafon_avg and LSWILeafon_min for five rubber plantations established in (a) 1990; (b) 1995; (c) 2000; (d) 2005; and (e) 2010, respectively. Linear fitting of LSWILeafon_avg against year in non-production period in each rubber plantation are in red. Error bars indicate the standard deviation of LSWILeafon_avg and LSWILeafon_min. Rubber plantations of (d,e) were converted from cropland, while (ac) were converted from evergreen forests or old rubber plantations.
Remotesensing 10 01240 g005
Figure 6. Spatial distribution of (a) rubber plantations in 2015 and (b) their establishment year on Hainan Island.
Remotesensing 10 01240 g006
Figure 7. Accuracy assessment of the establishment year map of rubber plantations: (a) scatter plot of the estimated against observed establishment year of rubber plantations at the pixel scale, and (b) error bar plot of mean estimated against observed establishment year of rubber plantations. Contours in (a) were plotted based on the number of pixels which have same observed and estimated establishment year, and error bar in (b) means ± 1 standard deviation.
Remotesensing 10 01240 g007
Figure 8. Statistical information on establishment year of rubber plantations in 2015: (a) the annual area of rubber plantations from our map (estimated) against agriculture census (statistics) since 1987, and (b) the age structure of rubber plantations in 2015 on Hainan Island presented in area and percent mode.
Remotesensing 10 01240 g008
Figure 9. The elevation, slope distribution, and pre-conversion land cover of rubber plantations on Hainan Island: (a) elevation distribution of rubber plantations with establishment year; (b) elevation and slope change of establishment year of rubber plantation since 1986; (c) pre-conversion land covers by year since 1988; and (d) area of different pre-conversion land cover for all rubber plantations in 2015.
Remotesensing 10 01240 g009
Figure 10. Spatial distribution of land sources of rubber plantations on Hainan Island.
Remotesensing 10 01240 g010
Figure 11. Illustration of underestimating the establishment year of rubber plantations by using LSWIleafon_min only.
Remotesensing 10 01240 g011
Figure 12. Uncertainties in mapping the establishment year of rubber plantations: (a) seedling rubber plantation established in 2016, where most vegetation was cleared for green manuring; (b) rubber plantation established in 2013 and intercropped with peanut, where the bare soil background appeared when harvesting peanuts; (c) plantation destroyed by super typhoon Rammasun in Wenchang City in 2014; (d) drought-afflicted plantation taken in Guangba State Farm, Dongfang County in 2010; and (d) typical tropical fragmented landscape (around 19.86377°N, 109.74850°E) from Google Earth VHR imagery acquired on 15 April 2016 in Lingao County. Rubber plantations are shown in sea green. Photos of (a,b) were taken at the experimental farm managed by the Chinese Academy of Tropical Agricultural Sciences (CATAS) on 7 July 2017.
Remotesensing 10 01240 g012
Table 1. Selected peer-reviewed references related to remote sensing estimates the stand age of rubber plantations.
ApproachAlgorithmOpticalSAROptical+SAR
VHR/HRMRCR
Statistical ModelsRegressionCharoenjit and Zuddas (2015)Chen and Cao (2012); Suratman and Bull (2004); Chen et al. (2012)
Others * Razak and Shariff (2017); Chen et al. (2012)
Image ClassificationSupervisedKoedsin and Huete (2015)Li and Fox (2011)Li and Fox (2012)Trisasongko (2017)
ObjectedChen and Yi (2016)LIU et al. (2012)
Hybrid Dibs and Idrees (2017)
LULCC DetectionDecision Tree Beckschäfer (2017) Kou and Xiao (2015)
* VHR: very high-resolution imagery; HR: high-resolution imagery; MR: moderate-resolution imagery; CR: coarse-resolution imagery; SAR: synthetic aperture radar; LULCC: Land use and Land cover change; Others: include artificial neural network and leaf area index histograms.
Table 2. Comparison of peer-reviewed studies for estimating establishment year (stand age) of rubber plantations.
SensorMethodNimages/NPathRowAge ResolutionAccuracyLocationReferences
PALSAR-2Image classification1/13–8, >8OA = 44–67%West Java, IndonesiaTrisasongko (2017)
SPOT-5Image classification1/1≤7, 7–25, >25OA = 81–97%Selangor, MalaysiaDibs and Idrees (2017)
RapidEyeImage classificaiton48/48≤6, >6-Xishuangbanna, ChinaChen and Yi (2016)
TMStatistical model1/1-RMSE = 3.7–5.3 yearsHainan, ChinaChen et al. (2012)
TMStatistical model1/1-RMSE = 5.96 yearsHainan, ChinaChen and Cao (2012)
TMStatistical model1/1-RMSE = 6.4–8.2 yearsSelangor, MalaysiaSuratman and Bull (2004)
PléiadesImage classification1/1≤7, 7–15, >15OA = 94–97%Phuket, ThailandKoedsin and Huete (2015)
ThaichoteStatistical model1/1≤12, 12–18, >18-Rayong, ThailandCharoenjit and Zuddas (2015)
TMImage classification11/11≤2, 2–4, >4-Phuket, ThailandLi and Fox (2011)
TM/ETM+, MODISImage classification6/3(46) #≤10, >10OA = 85.2%Xishuangbanna, ChinaLIU et al. (2012)
TM/ETM+Image classification29/1≤6, >6OA = 79%Selangor, MalaysiaRazak and Shariff (2017)
MODISImage classification29/4≤4, >4OA = 97–98%Southeast AsiaLi and Fox (2012)
TM/ETM+, PALSARLULCC detection226/1(1) #≤5, 5–10, >10OA = 85%Xishuangbanna, ChinaKou and Xiao (2015)
TM/ETM+LULCC detection276/1AnnualRMSE = 2.5 yearsXishuangbanna, ChinaBeckschäfer (2017)
TM/ETM+/OLILULCC-and biophysical-based1981/4AnnualR2 = 0.85/0.99, RMSE = 2.34/0.54 yearsHainan Island, ChinaThis study
#. Number in bracket is the number of images for MODIS and PALSAR, respectively.

