Using Multi-Spectral UAV Imagery to Extract Tree Crop Structural Properties and Assess Pruning Effects


1
Water Desalination and Reuse Center, King Abdullah University of Science and Technology, Al Jazri Building West, Thuwal 23955-6900, Saudi Arabia
2
Remote Sensing Research Centre, School of Earth and Environmental Sciences, The University of Queensland, St Lucia, QLD 4072, Australia
3
Ministry of Agrarian and Spatial Planning, National Land Agency, Jalan H. Agus Salim 58, Jakarta Pusat 10350, Indonesia
*
Author to whom correspondence should be addressed.
Remote Sens. 2018, 10(6), 854; https://doi.org/10.3390/rs10060854
Submission received: 15 April 2018
/
Revised: 24 May 2018
/
Accepted: 25 May 2018
/
Published: 1 June 2018
(This article belongs to the Special Issue Estimation of Crop Phenotyping Traits using Unmanned Ground Vehicle and Unmanned Aerial Vehicle Imagery)
Abstract
:Unmanned aerial vehicles (UAV) provide an unprecedented capacity to monitor the development and dynamics of tree growth and structure through time. It is generally thought that the pruning of tree crops encourages new growth, has a positive effect on fruiting, makes fruit-picking easier, and may increase yield, as it increases light interception and tree crown surface area. To establish the response of pruning in an orchard of lychee trees, an assessment of changes in tree structure, i.e., tree crown perimeter, width, height, area and Plant Projective Cover (PPC), was undertaken using multi-spectral UAV imagery collected before and after a pruning event. While tree crown perimeter, width and area could be derived directly from the delineated tree crowns, height was estimated from a produced canopy height model and PPC was most accurately predicted based on the NIR band. Pre- and post-pruning results showed significant differences in all measured tree structural parameters, including an average decrease in tree crown perimeter of 1.94 m, tree crown width of 0.57 m, tree crown height of 0.62 m, tree crown area of 3.5 m2, and PPC of 14.8%. In order to provide guidance on data collection protocols for orchard management, the impact of flying height variations was also examined, offering some insight into the influence of scale and the scalability of this UAV-based approach for larger orchards. The different flying heights (i.e., 30, 50 and 70 m) produced similar measurements of tree crown width and PPC, while tree crown perimeter, area and height measurements decreased with increasing flying height. Overall, these results illustrate that routine collection of multi-spectral UAV imagery can provide a means of assessing pruning effects on changes in tree structure in commercial orchards, and highlight the importance of collecting imagery with consistent flight configurations, as varying flying heights may cause changes to tree structural measurements.
1. Introduction
In order to increase the production of any agricultural system, activities such as crop monitoring for assessing growth, stresses, pests, fertiliser, water, nutrient condition and irrigation are all required [1,2]. In addition to this, post-harvesting handling, such as tree pruning, has also been shown to be beneficial for enhancing yields [3]. Pruning includes cutting and trimming of branches, and as such it affects the structural attributes of tree crops. Pruning of fruit trees promotes new growth [4], makes manual fruit-picking easier, and increases light interception, which is important for fruit quality [5,6]. Tree pruning has also been shown to have implications for crop harvest and nutrition, pest and disease control, soil protection and irrigation strategies [7]. Increasing flowering, fruit colour, soluble solids concentrations and flower bud formation, and decreasing titratable acid content are other benefits linked to pruning of fruit trees [3,8,9,10].
However, tree pruning is a costly practice, especially if done using manual labour, which is usually the case for small orchards [11]. Often, tree crown reduction goals are set to optimise pruning [12], but the assessment to determine whether these goals have been achieved is generally based on manual measurement or empirical models, which are time-consuming and potentially inconsistent [4]. Hence, there is a need for more efficient and consistent tree crop pruning monitoring strategies that can be applied in a consistent manner at the orchard level.
Remote sensing is ideally suited for monitoring tasks and has the capability of providing multi-temporal information on tree structure, and changes in these, over time [13]. However, as many orchards are relatively small (1–50 ha) [8], the use of high spatial resolution satellite and airborne imagery quickly becomes cost-prohibitive [14]. The rapid development of Unmanned Aerial Vehicles (UAVs) and miniaturised sensors in the last decade is now offering an alternative to more traditional satellite and airborne-based remote sensing [15,16]. This is largely due to the fact that UAVs are light-weight, low-cost, suitable for autonomous data collection, and highly deployable, allowing remotely sensed imagery to be collected at any time for smaller areas (<1 km2), even in cloudy conditions [4]. However, limiting factors include high wind speeds, rain and spatial coverage, when operating UAVs.
The mapping of tree structural parameters such as tree height and crown size provides key indicators for plant growth, biomass, yield, as well as for assessing pruning practices [4,17,18]. As high spatial resolution imagery is required for assessing the structure of individual tree crowns, UAV imagery is ideally suited for this task. UAV imagery has been used in many different agricultural settings [14], but only to a limited extent for tree crops. For instance, measurements of plant height is a common UAV application because of the ability to produce photogrammetrically derived Digital Surface Models (DSM) from Structure-from-Motion of overlapping photos with different view angles of the same feature [4,19]. Plant height can be used to model biomass, which is crucial information for predicting crop yield [20,21,22].
Most UAV-based tree crop mapping applications have focused on olive trees [4,19,23,24,25]. These studies, which all achieved high correlations between field and image derived structural parameters, focused on deriving chlorophyll and leaf area index using a six-band multi-spectral Tetracam [23], and map tree height, crown diameter, volume and area using RGB and multi-spectral imagery [4,19,24,25]. Jimenez-Brenes et al. [4] used UAV-based RGB imagery to map tree position, projected crown area, height and volume of olive trees before, after and one year after pruning. Tree crown structure was assessed for trees subjected to three different kinds of pruning techniques, i.e., mechanical, adapted and traditional. It was found that trees subjected to more aggressive pruning experienced much more subsequent vegetative development for the three studied pruning techniques.
In forestry applications, local maxima identification techniques have been used for identification and delineation of individual tree crowns [26,27,28], and these techniques have also been applied successfully by [18] using UAV imagery for assessing tree height and crown diameter. Recently, segmentation approaches and geographic object-based image analysis (GEOBIA) of high spatial resolution imagery have become the preferred means for delineating individual tree crowns, due to the additional information available in the classification/delineation process in terms of shape, context, class-related and multi-scale information [29,30,31,32,33]. Because of the suitability of GEOBIA for information derivation from high spatial resolution imagery [34], several UAV-based studies have recently started to incorporate GEOBIA into their image processing workflow [4,17,18,25,35,36,37]. Diaz-Varela et al. [24] used an object-based supervised classification and the Classification and Regression Tree (CART) algorithm for delineating olive trees. Torres-Sanchez et al. [25] developed a simple object-based mapping approach based on thresholding olive tree crown DSM values in relation to neighbouring ground for tree crown delineation. The object-based mapping approach developed by [4] was based on that in [25]. This new approach relied heavily on the generated DSM for identifying the tree crown boundaries. However, as photogrammetrically point cloud generated DSMs often do not align perfectly with tree crown edges, as shown in this research, incorrect measurements of crown area and volume may be obtained if these edges are not adjusted based on spectral information. In addition, Jimenez-Brenes et al. [4] reported that only 80% (512) of the trees within the orchard were correctly photo-reconstructed on the three image dates, which highlights the need to include spectral information as well in the object-based tree crown delineation process rather than heavily relying on the generated DSM.
There is scant literature on the use of UAVs for mapping the influence of pruning on tree crop structural development and change [4]. Existing research has only focused on olive trees, which are spectrally and structurally different from other tree crops such as lychee, citrus, mango, macadamia, and avocado [4,25]. Hence, existing methods for mapping structure and pruning effects based on olive trees may not be feasible for other tree crops. To expand upon this lack, this research paper explores a novel and innovative approach to assess changes in tree structure, i.e., tree crown perimeter, width, height, area and Plant Projective Cover (PPC), using multi-spectral UAV derived imagery collected before and after pruning. To do this, we focus our study on the analysis of a commercial lychee orchard in eastern Australia. As no UAV-based mapping of lychee tree structure and pruning was identified in the literature, and as lychee trees are spectrally and structurally different to olive trees, this research provides new insight into the mapping of tree crops.
An object-based tree crown delineation approach is introduced, representing an additional novelty that addresses limitations of other UAV-based studies e.g., [4,25], which relied heavily on the use of a DSM for tree crown delineation. This research shows that these existing approaches are not feasible for lychee tree crown delineation and a novel approach incorporating spectral and context information is introduced. The approach also addresses the issue outlined by [25] of mapping trees with overlapping crowns. Also, additional tree crop structural parameters are mapped, i.e., crown perimeter and plant projective cover compared with [4,24,25]. Given the lack of any systematic evaluation of how UAV-based data acquisition configurations, including varying flying heights, affect image derived information extraction of tree structure, a secondary objective was to assess any variations in the results as a function of various flying heights (30 m/4.1 cm Ground Sampling Distance (GSD), 50 m/6.5 cm GSD and 70 m/8.8 cm GSD).
2. Study Area
The study was undertaken across a private lychee orchard located 25 km southeast of Brisbane, Australia (Figure 1). The lychee trees belong to the Kwai May Pink cultivar and were between 15 and 17 years of age, excluding 10 newly replanted trees. Trees were planted approximately 4 m apart, in seven rows of 27 trees. The area has an elevation of 150 m above mean sea level and an average monthly mean temperature ranging from 15.1 °C to 26.0 °C, and an average annual rainfall of 1079 mm [38]. The orchard, consisting of 189 lychee trees, is surrounded by eucalypt forest.
3. Materials and Methods
3.1. Field Data
Field-based measurements of tree height, crown width, crown perimeter and PPC from 89 out of the 189 lychee trees were collected on 4 March 2017. Tree height was measured as the distance from the ground to the top of the tree crown, using a retractable measuring staff. Crown perimeter was measured using a tape measure surrounding the widest part of the tree crown. Tree crown width was measured with a tape measure along the widest axis of each tree. For measuring PPC, four representative photos were taken underneath each of the 89 trees looking straight up. The photos were taken close to the ground and approximately half way between the tree trunk and the edge of the tree crown perimeter. These photos were analysed to determine PPC, i.e., the vertically projected fraction of leaves and branches in relation to sky. Measurements of PPC were derived using a program written in IDL® [39] to convert vertical digital photos to measurements of PPC based on the principle described by [40]. The derived PPC values of the four photos for each tree were then averaged to determine a representative PPC measure for each tree crown.
3.2. UAV Data and Pre-Processing
UAV multi-spectral (green: 530–570 nm; red: 640–680 nm; red edge: 730–740 nm; and Near Infrared (NIR): 770–810 nm) imagery was collected via a Parrot Sequoia sensor mounted to a 3DR Solo quadcopter for the lychee orchard on 11 February 2017 (pre-pruning) and 4 March 2017 (post-pruning). Pruning of the lychee trees took place on 23 February. According to the grower, minimal tree growth was observed between the first data capture and the time of pruning, and between the time of pruning and the second data capture, hence making the time interval of the data captures appropriate for the assessment of tree structural changes caused by pruning. The Tower Beta Android application was used to autonomously collect imagery acquired with 80% sidelap and 85% forward overlap, at heights above ground level of 30, 50 and 70 m, producing 360, 278, and 202 photos per band, respectively. The sidelap of 80% was set by the Tower Beta application, while the 85% forward overlap was achieved at a flight speed of 5 m/s and images collected at set intervals of 0.8, 1.4 and 1.9 s for the 30, 50 and 70 m flying heights, respectively. A minimum flying height of 30 m was set to avoid collision with adjacent eucalypt trees. A maximum height of 70 m was selected due to flight restrictions caused by low-flying aircrafts on approach to a nearby local aerodrome.
The Parrot Sequoia imagery was processed in Pix4Dmapper Pro (Pix4D, Lausanne, Switzerland) to produce an orthomosaic, a DSM and a DTM for each of the six flights, i.e., two collection dates at three different heights. The DSM was created based on the generated point cloud and the inverse distance-weighted interpolation method in Pix4Dmapper Pro. The DTM was generated using the automatic function in Pix4Dmapper Pro that uses the raster DSM and computes a classification mask of features above ground to generate a raster DTM based on ground features only. The DTM GSD was set to five times the GSD of the orthomosaic, as recommended by Pix4D. A canopy height model (CHM) was produced by subtracting the DTM from the DSM. The three flying heights produced orthomosaics with GSDs of approximately 4.1 cm, 6.5 cm and 8.8 cm, respectively.
To ensure an accurate georectification of retrieved imagery, 10 AeroPoints were evenly spaced within the study area and used for geo-referencing of the imagery and for improving the Structure-from-Motion 3D model in Pix4Dmapper Pro (Figure 2). These AeroPoint units are Global Navigation Satellite System-enabled ground control points, 54 cm × 54 cm × 3.5 cm in size, designed specifically for the geo-referencing of UAV imagery. The coordinate location of each AeroPoint was recorded for more than 3 h, automatically uploaded after the flights using a mobile phone hotspot, and subsequently post-processed using the proprietary Propeller® Post Processed Kinematic network correction based on their nearest base station, located 16.8 km from the study site. Reported and independently tested geometric accuracies of the AeroPoints are within 2 cm [41].
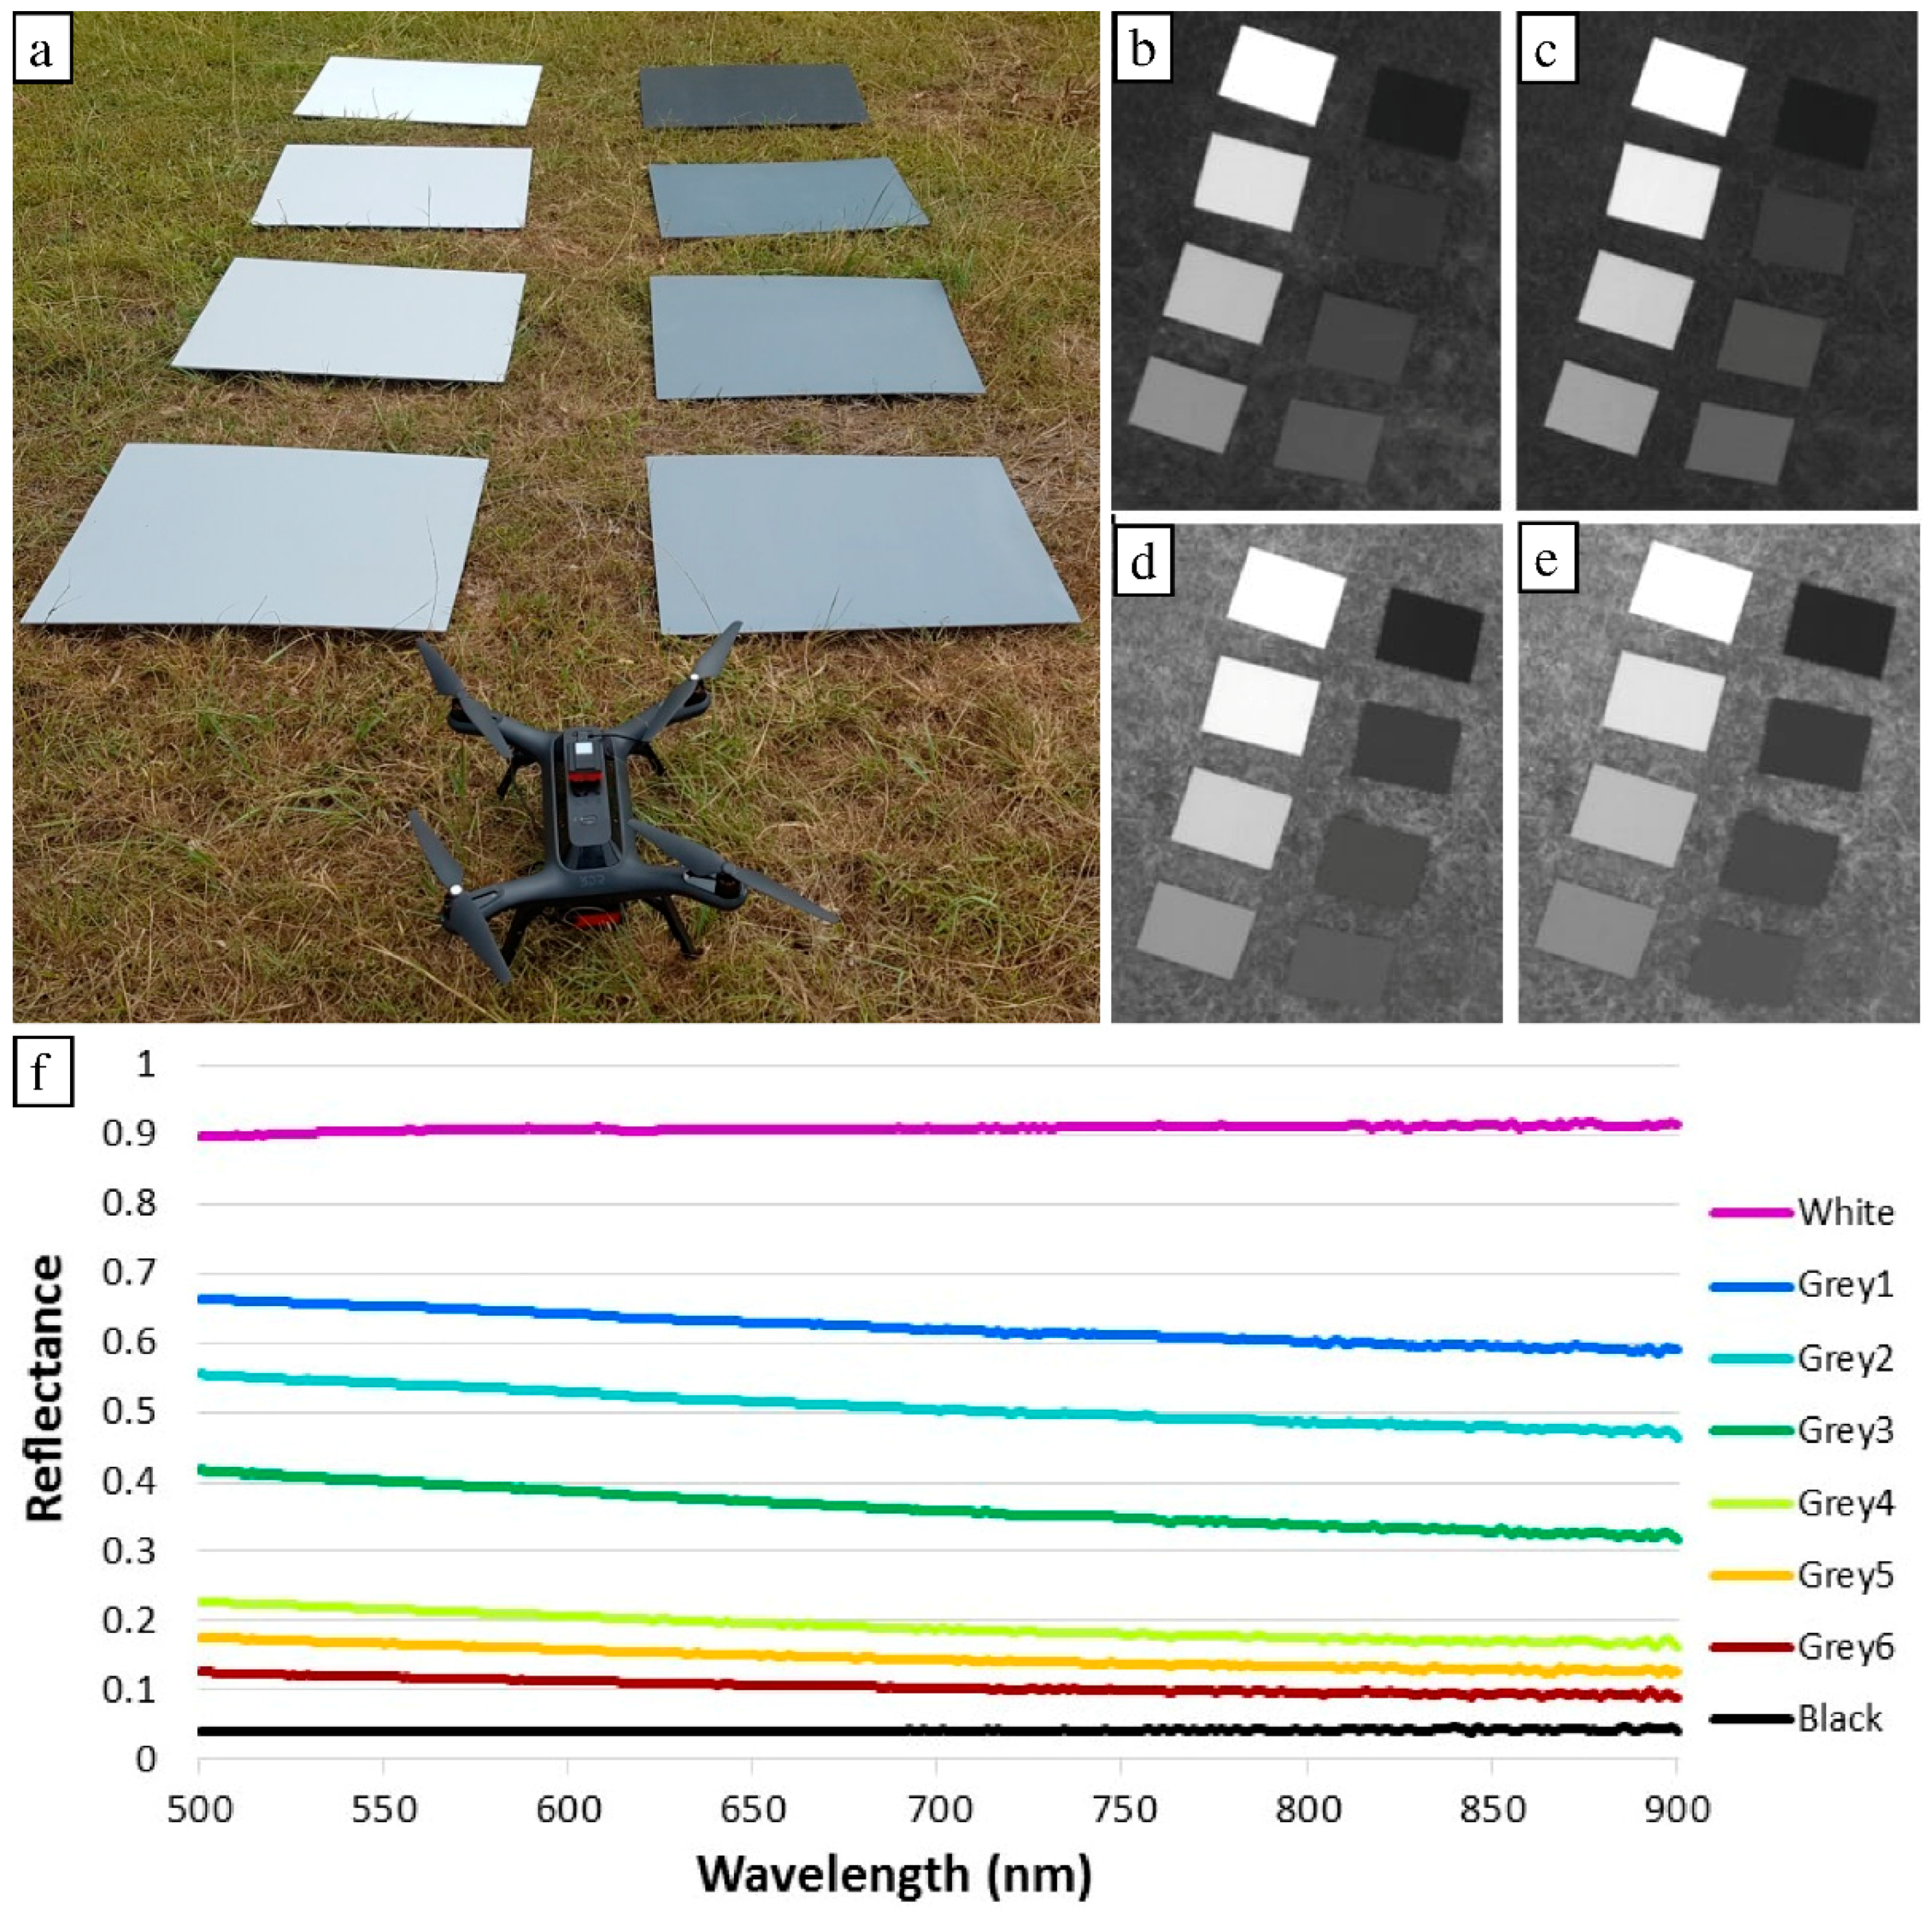
Eight radiometric calibration targets were produced using Masonite boards painted with three coats of matt Dulux Wash and Wear paint in white, six scales of grey and in black [42]. The reflectance values of the eight targets were measured with an ASD FieldSpec 3 spectrometer (Figure 3) and confirmed to be near Lambertian. The RMSE of reflectance (scaled from 0 to 100%) ranged from 0.12% to 0.88%, between 500 and 850 nm, corresponding to the spectral range of the Parrot Sequoia sensor, based on spectrometer measurements obtained at 13 different angles, i.e., at nadir and at approximately 15°, 30° and 45° off-nadir angles viewed from north, south, east and west. Off-nadir view angles beyond 45° were not assessed, as the Parrot Sequoia sensor has vertical and horizontal field of views of 48.5° and 61.9°, respectively. Hence, the 45° off-nadir angle of the field spectrometer was well within the Parrot Sequoia sensor field of view, while still allowing for wind-induced pitch, roll and yaw effects during each flight mission. Based on the relationship between the field derived spectrometer measurements, matched to each of the four spectral Parrot Sequoia bands, and the digital numbers of the eight radiometric calibration targets within the orthorectified multi-spectral imagery, the digital numbers were converted to at-surface reflectance using an empirical line correction in the ENVI 5.3 software (Harris Geospatial, Broomfield, CO, USA) [43].
3.3. Geographic Object-Based Image Analysis
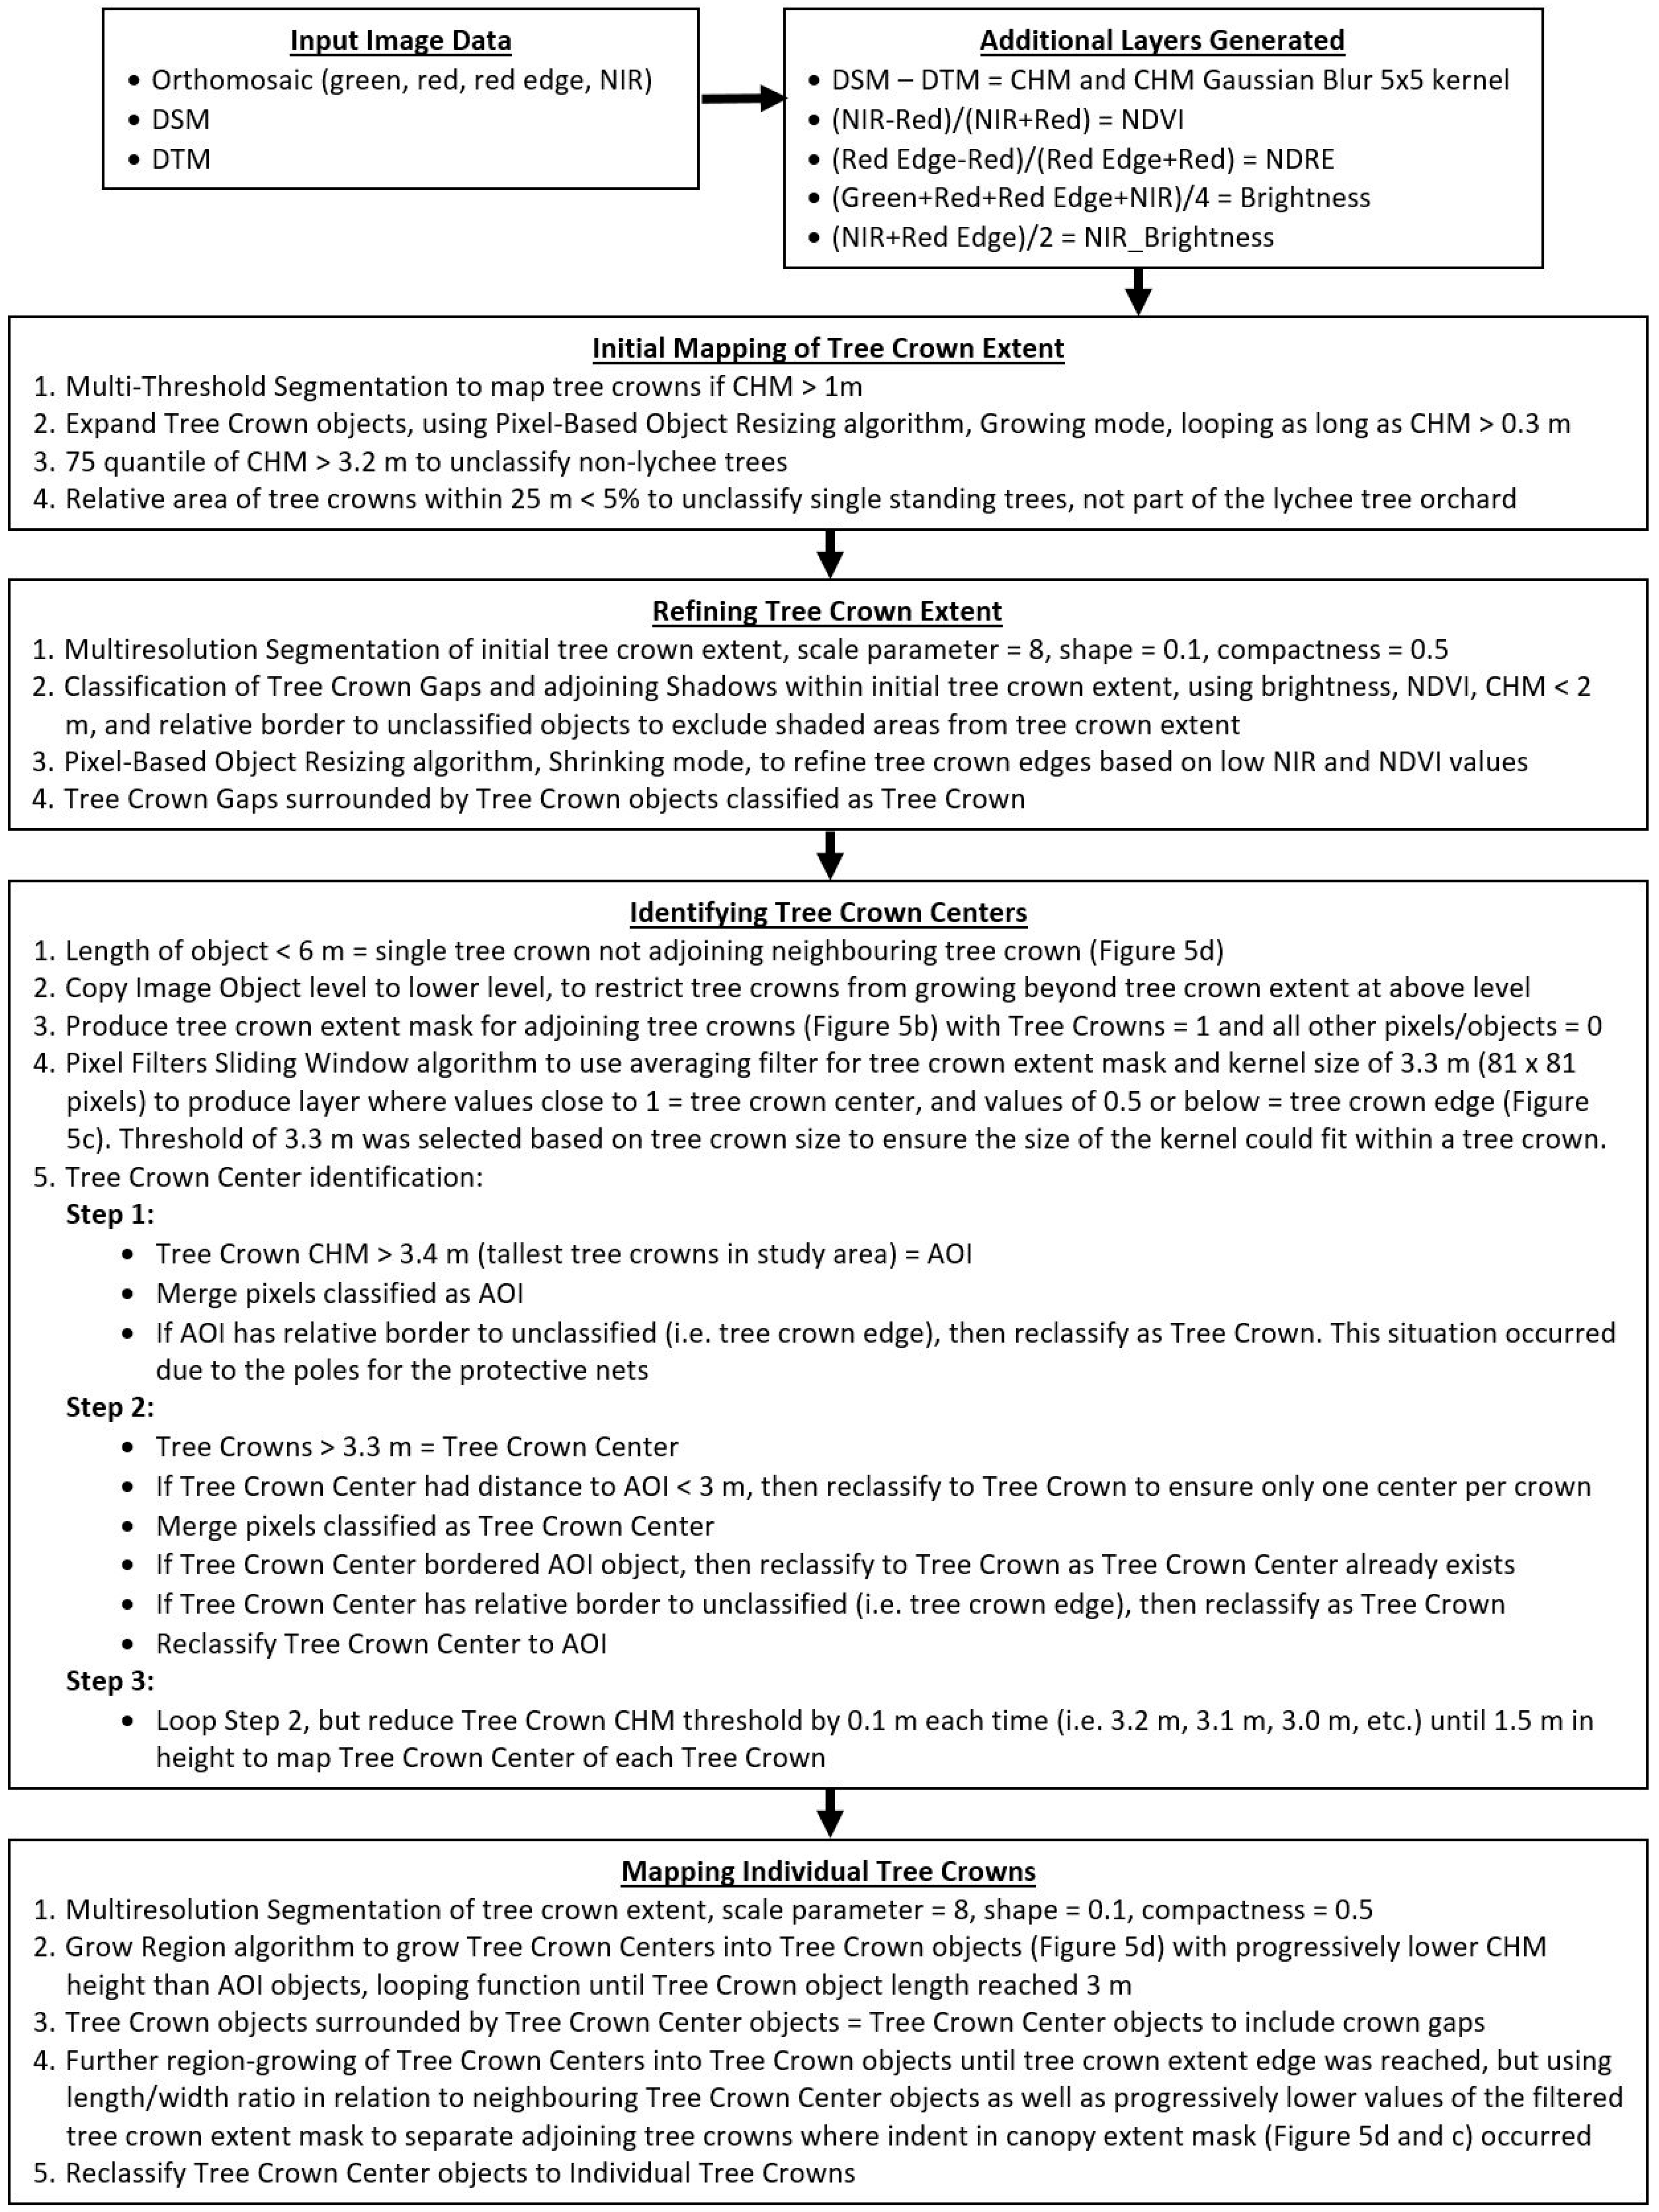
GEOBIA and the eCognition Developer 9.2 software (Trimble, Munich, Germany) were used to automatically delineate the individual tree crowns based on the CHM and the multi-spectral orthomosaic. An object-based mapping approach was deemed most suitable because of the small pixel size in relation to the tree objects being mapped [34]. A detailed flowchart of the GEOBIA processing steps is presented in Figure 4. Tree crowns were initially identified for those areas in the CHM >1 m. Tree crown objects were then grown outwards based on progressively lower CHM thresholds. The tree crown edges were adjusted based on spectral information. Once the tree crown extent had been mapped, the approximate tree crown centre of each tree was identified based on the CHM by searching for local maxima within the mapped tree extent. To avoid having multiple local maxima within a single tree crown, only the highest CHM value within a radius of 3 m was considered. Subsequently, these tree crown centres were grown outwards as long as the tree crown height decreased and until the length of each tree crown object reached 3 m. A mean filter was used to smooth the CHM for this region-growing step in order to avoid issues due to variations in tree crown height caused by irregular branches increasing tree height within parts of individual tree crowns [18,33].
Next, various class-related context information was used to refine the delineation of individual tree crowns. For example, in some cases, single tall branches created local high points in the smoothed CHM, which made the region-growing algorithm grow around the local high points. In those cases, where excluded objects within the mapped tree extent were surrounded by objects classified as a single tree crown, these objects were then classified as part of the single tree crown. Also, edges of trees were expanded to include the full extent of the mapped tree extent without the requirement of having progressively lower CHM values. Unclassified objects appearing in between two neighbouring adjoining tree crows were assigned to a respective tree crown based on the length-width ratio of these individual tree crowns and the values of the filtered canopy extent mask. A tree crown having a smaller length-width ratio than its neighbouring and adjoining tree crown was allowed to grow into the remaining unclassified objects between the two tree crowns as long as the filtered canopy extent mask values of the unclassified objects were decreasing. Using the filtered canopy extent mask assumed that an indent in the canopy extent mask would occur between each adjoining tree crown (Figure 5). A looping function was used to progressively assess the length-width ratio of the neighbouring and adjoining tree crowns to increase the likelihood of objects being assigned to the tree crown they belonged to. These assumptions were not required for the post-pruned trees, as neighbouring tree crowns did not adjoin in most cases.
The 89 field-assessed tree crowns, representing the post-pruning condition, were manually delineated from the orthomosaic for validating the automatically delineated tree crown areas at the three different flying heights. The approach suggested by [44] and applied by [25] was used to assess the classification accuracy based on three classes, i.e., correctly mapped, omission error, and commission error in terms of object area.
3.4. Tree Crown Parameter Extraction
Based on the delineated tree crowns, a measure of their perimeter, area, width and height could automatically be derived in the eCognition Developer software. The image-derived parameters were directly related to the corresponding field measurements of perimeter and tree crown width. However, tree crown area was not measured in the field, but was included for the assessment, comparing pre- and post-pruning structure. Although the maximum tree height was measured in the field, the 90th percentile of tree crown height was extracted at the individual tree crown object level to remove potential effects of the poles next to some of the trees, which are used for placing protective nets over the trees (Figure 1). These poles were taller than the trees and hence had to be removed from the image-based estimates of height. Using the 90th percentile of tree crown height addressed this problem, and as the tree tops were fairly flat, it did not significantly lower the image derived tree height measurements.
The spectral bands, derived vegetation indices, and co-occurrence texture measures were used to assess the correlation with the field photo derived PPC measurements. The spectral bands included the green, red, red edge and NIR bands. Derived vegetation indices included the NDVI, the Normalized Difference Red Edge Index (NDRE), the average brightness of all four spectral bands, and the average brightness of the red edge and NIR bands. Texture is the frequency of tonal change in an image. Second-order statistics derived from image spatial grey level co-occurrence matrix (GLCM) texture measures assume that information in an image is contained in the overall or average spatial relationship between pixel values (grey tones) [45,46,47]. The co-occurrence texture measures were calculated at the individual tree crown object level in the eCognition Developer software and included the Homogeneity, Contrast, Dissimilarity and Standard Deviation co-occurrence texture measures based on all four spectral bands [48]. All of these object variables were extracted for the 89 field assessed trees as a shapefile and combined with the field-based measurements. PPC measurements were derived based on the best performing relationship with image extracted parameters for the post-pruned tree crowns. This relationship was used to convert the pre-pruning image into a map of PPC. For the comparison of pre- and post-pruning tree structure, the image derived maps with the optimal results in terms of flying height/GSD were used, including all 189 mapped trees.
4. Results and Discussion
The results proved the importance of the tree crown delineation process, as this process enabled the extraction of tree structural parameters used to assess changes before and after pruning at the individual tree crown level. This also enabled an evaluation and comparison of the results derived from the UAV flights undertaken at three different flying heights.
4.1. Tree Crown Delineation
Since the derivation of tree structural parameters such as crown perimeter, area and width rely on the accuracy of the tree crown definition, the automated delineation of these using GEOBIA is a key step. As in other studies [4,18,22,25], the CHM was required for identifying individual tree crown centres and determining where the edges of two adjoining tree crowns were. However, in previous studies [25] adjoining tree crowns, forming a hedgerow, have proven problematic to delineate. In this study, this problem was solved by using the length-width ratio of the tree crowns and the filtered tree crown extent mask, which were found to be essential for determining which objects, occurring between adjoining trees, belonged to which tree crowns. This was particularly the case for the pre-pruned tree crowns. Post-pruning, most of the tree crowns did not adjoin, and hence fewer assumptions had to be made to determine what objects belonged to each individual tree crown (Figure 6).
For tree crown delineations based on the imagery collected for the pre- and post-pruned lychee trees, all 189 lychee trees within the orchard were correctly identified. To achieve this accuracy, it was essential not only to rely on the CHM, but also to adjust tree crown edges based on the optical bands, as the tree crown borders often do not align with the DSM/CHM height information (Figure 7). Hence, while other eCognition Developer-based approaches may have been computationally simpler to implement [4], such an approach would not have produced accurate results when applied to this research study. The accuracy assessment of the 89 manually delineated tree crowns investigated here showed that, on average, 96.5% of their area corresponded to that of the automatically delineated tree crowns, with an average error of omission of 1.4% and average error of commission of 2.2% (for the data set collected at 30 m flying height). The error of omission was reduced to 1.2% and 0.7%, while the error of commission increased to 2.4% and 3.1% for the data sets collected at 50 m and 70 m flying height, respectively (Table 1). These results are well within reported tree crown delineation accuracies achieved using LiDAR data [49]. The slightly larger error of commission observed as a function of increased flying height was attributed to the larger GSD and how the corresponding DSMs were calculated, essentially resulting in the inclusion of an additional edge pixel surrounding the tree crowns with a GSD of 8.8 cm (70 m flying height) compared to the manually delineated tree crowns (Figure 6). This is a common characteristic when increasing the GSD for tree crown delineation [28].
4.2. Mapping of Tree Structure
In addition to tree crown area, perimeter and width could be directly derived based on the delineated tree crowns. Tree crown perimeter measurements decreased slightly with increasing flying height due to the larger GSD, producing a smoother crown edge delineation that was less affected by irregular branches along the tree crown edges. Flying at 70 m produced the highest R2 value of 0.95 (n = 89) and the lowest RMSE of 3.42 m for mapping tree crown perimeter, as the smoothing of the tree crown delineation caused by the larger GSD corresponded to the way field-based measurements of perimeter were obtained. Tree crown perimeter was overestimated in all cases and the RMSE varied from 3.42 m to 4.57 m. Although the larger GSD of 8.8 cm (70 m flying height) produced a smoother outline of the tree crowns, corresponding to the way the field measurements were derived, an additional edge pixel surrounding the tree crowns with a GSD of 8.8 cm was still included, causing an overestimation of the perimeter (Figure 8). The different flying heights produced similar measurements of tree crown width with R2 values of 0.90–0.93 (n = 89) and a RMSE of 0.62–0.65 m (Figure 8).
With increasing flying height, image derived measurements of tree crown height were increasingly underestimated. For the three CHMs produced at the three different flying heights, a less accurate DTM and an overall lowering of the DSM height of tree crowns occurred with increasing flying height. The highest R2 value of 0.78 (with an RMSE of 0.19 m) was produced at a flying height of 30 m for estimating tree height. At flying heights of 50 and 70 m, the R2 value decreased to 0.61 and 0.59, with an RMSE of 0.25 m and 0.36 m, respectively (Figure 8). The RMSEs are similar to those reported by [19,25], who also assessed the effects of spatial resolution on DSM generation and tree height quantification using UAV imagery, but for olive trees. In [19], the tested pixel sizes were 5, 20, 25, 30, 35, 40, and 50 cm, and it was found that a significant decrease in R2 values and increase in RMSE occurred at pixel sizes larger than 30 cm. However, those pixel values were derived from resampling of UAV imagery collected at the same flying height as opposed to our study where three different flying heights were used. A change of flying height will affect the viewing geometry of the study area and hence the ability to reconstruct objects 3-dimensionally. At lower flying heights, more extreme view angles of ground objects (in our case lychee trees) are achieved, producing a larger parallax effect [50]. The reduced effect of parallax at 70 m flying height may have caused the observed lowering of the DSM tree height. Also, the decrease in image spatial resolution with increased flying height may have caused local high points, e.g., from single tree branches, to be missed in the point cloud generation used for the DSM construction.
While different growing conditions, i.e., different lychee tree varieties, climatic conditions, and pruning strategies, may influence the results and hence should be tested in future studies, tree age and height are the main differences likely to be encountered between different orchards in our particular study region. Ten of the lychee trees were younger, and hence smaller, than the remaining 179 trees at this study site. Assessing only those 10 trees, it can be seen in Table 2 that the RMSE of their height was higher than those in Figure 8, which was based on all 89 field assessed trees. This indicates that the height for shorter and smaller trees was less accurately mapped, and in all cases, height was underestimated. This is similar to the findings of [25], where underestimation of tree height occurred for shorter trees. Tree crown width and perimeter on the other hand were mapped with significantly lower RMSE for the 10 younger trees. As these trees were smaller and hence had a smaller perimeter, there was a shorter distance along which the boundary line of the automatic tree crown delineation could appear irregular, due to branches and other tree structural characteristics. This, and the absence of any adjoining tree crowns due to the smaller crowns, also caused the width to be more accurately mapped. This indicates that tree crown height may be less accurately mapped for younger and shorter trees, while tree crown width and perimeter may in fact be mapped with higher accuracies for smaller trees.
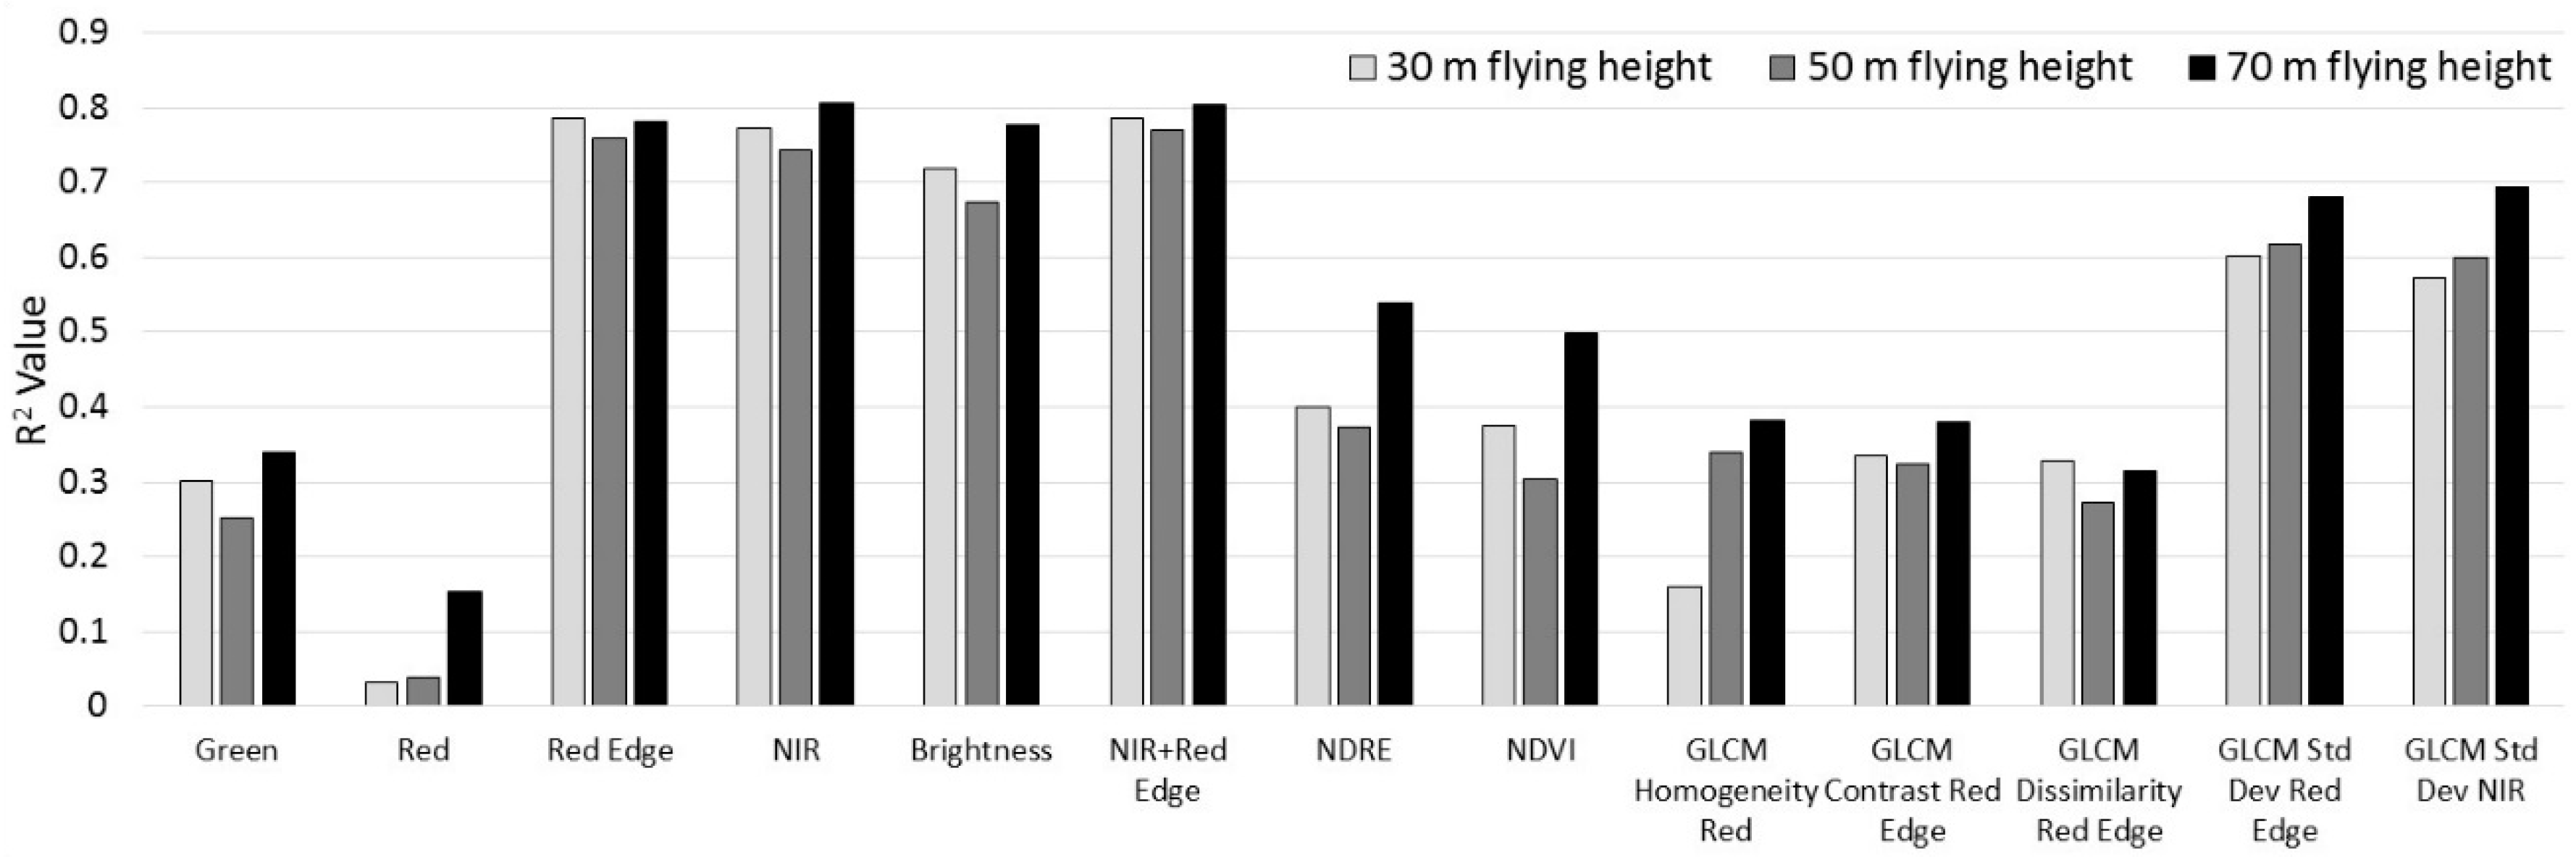
The highest R2 values for estimating PPC were achieved using the red edge (R2 = 0.79–0.81, n = 89) and NIR (R2 = 0.78–0.82, n = 89) bands, with the data collected at 70 m producing a slightly higher positive correlation. The red band showed a poor correlation with PPC (R2 = 0.04–0.15, n = 89), due to little variation in red reflectance values in response to different PPC measurements. Hence, spectral vegetation indices such as the NDVI and NDRE only produced R2 values between 0.30 and 0.54. Using the co-occurrence texture measure of standard deviation of the red edge and NIR bands, R2 values between 0.57 and 0.70 were achieved (Figure 9). Co-occurrence texture measures have been used successfully in other studies to assess vegetation structure and measurements of PPC [48,51]. At the tree crown level, higher R2 values for mapping PPC were obtained in most cases for the imagery collected at 70 m height (8.8 cm GSD). In terms of the co-occurrence texture measures, this may have been due to noise reduction caused by the larger GSD, while the GSD of 8.8 cm still preserved useful within-tree crown texture information [52,53].
To estimate PPC of the pre-pruned tree crowns, for which no field data were collected, the best-fit equations between the post-pruned field derived PPC and the spectral bands, indices and texture measures were applied to the pre-pruned imagery to assess if these provided a realistic representation of PPC (Figure 10). The NIR band was found most useful for predicting PPC from the pre-pruning image, based on a visual assessment of the tree crowns and their within-tree crown gaps. The NDVI showed little variation in estimated PPC, most likely because of saturation issues [54]. The use of the red edge band significantly overestimated PPC for many of the tree crowns. Using the texture measures for estimating PPC provided unrealistically large PPC variation and in many cases significantly underestimated PPC based on expectation (Figure 10).
4.3. Pre- and Post-Pruning Tree Structure Comparison
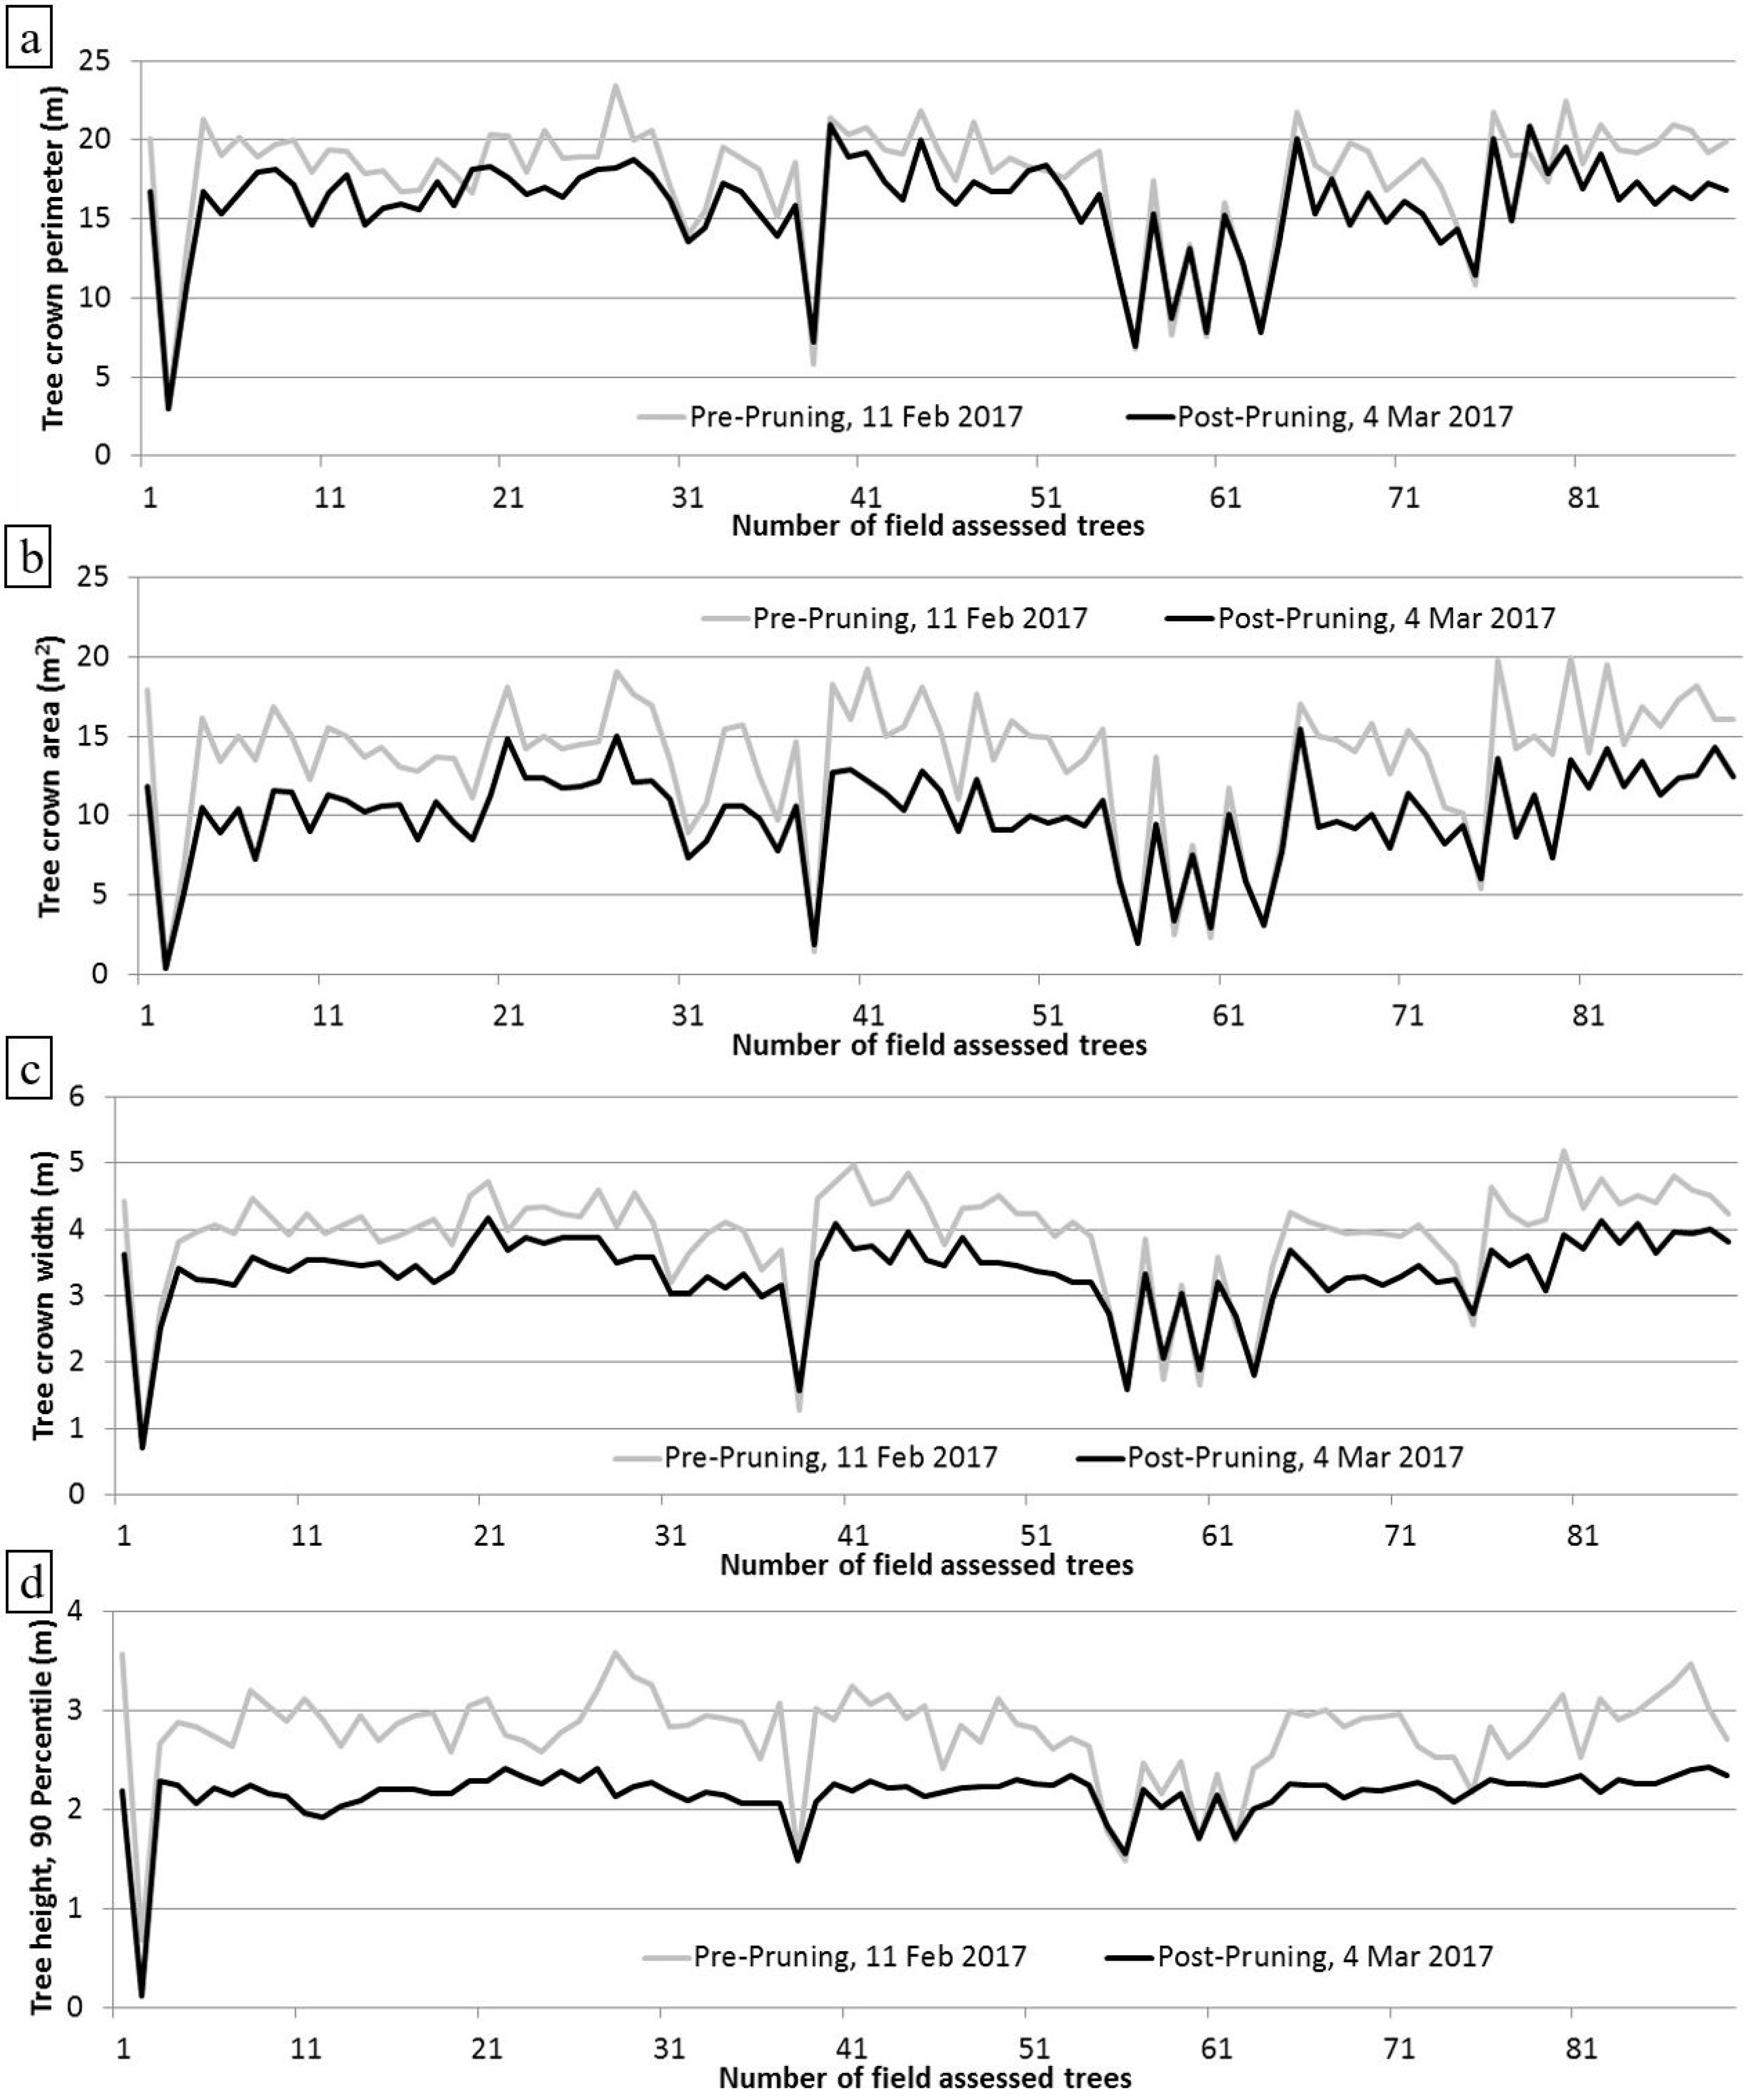
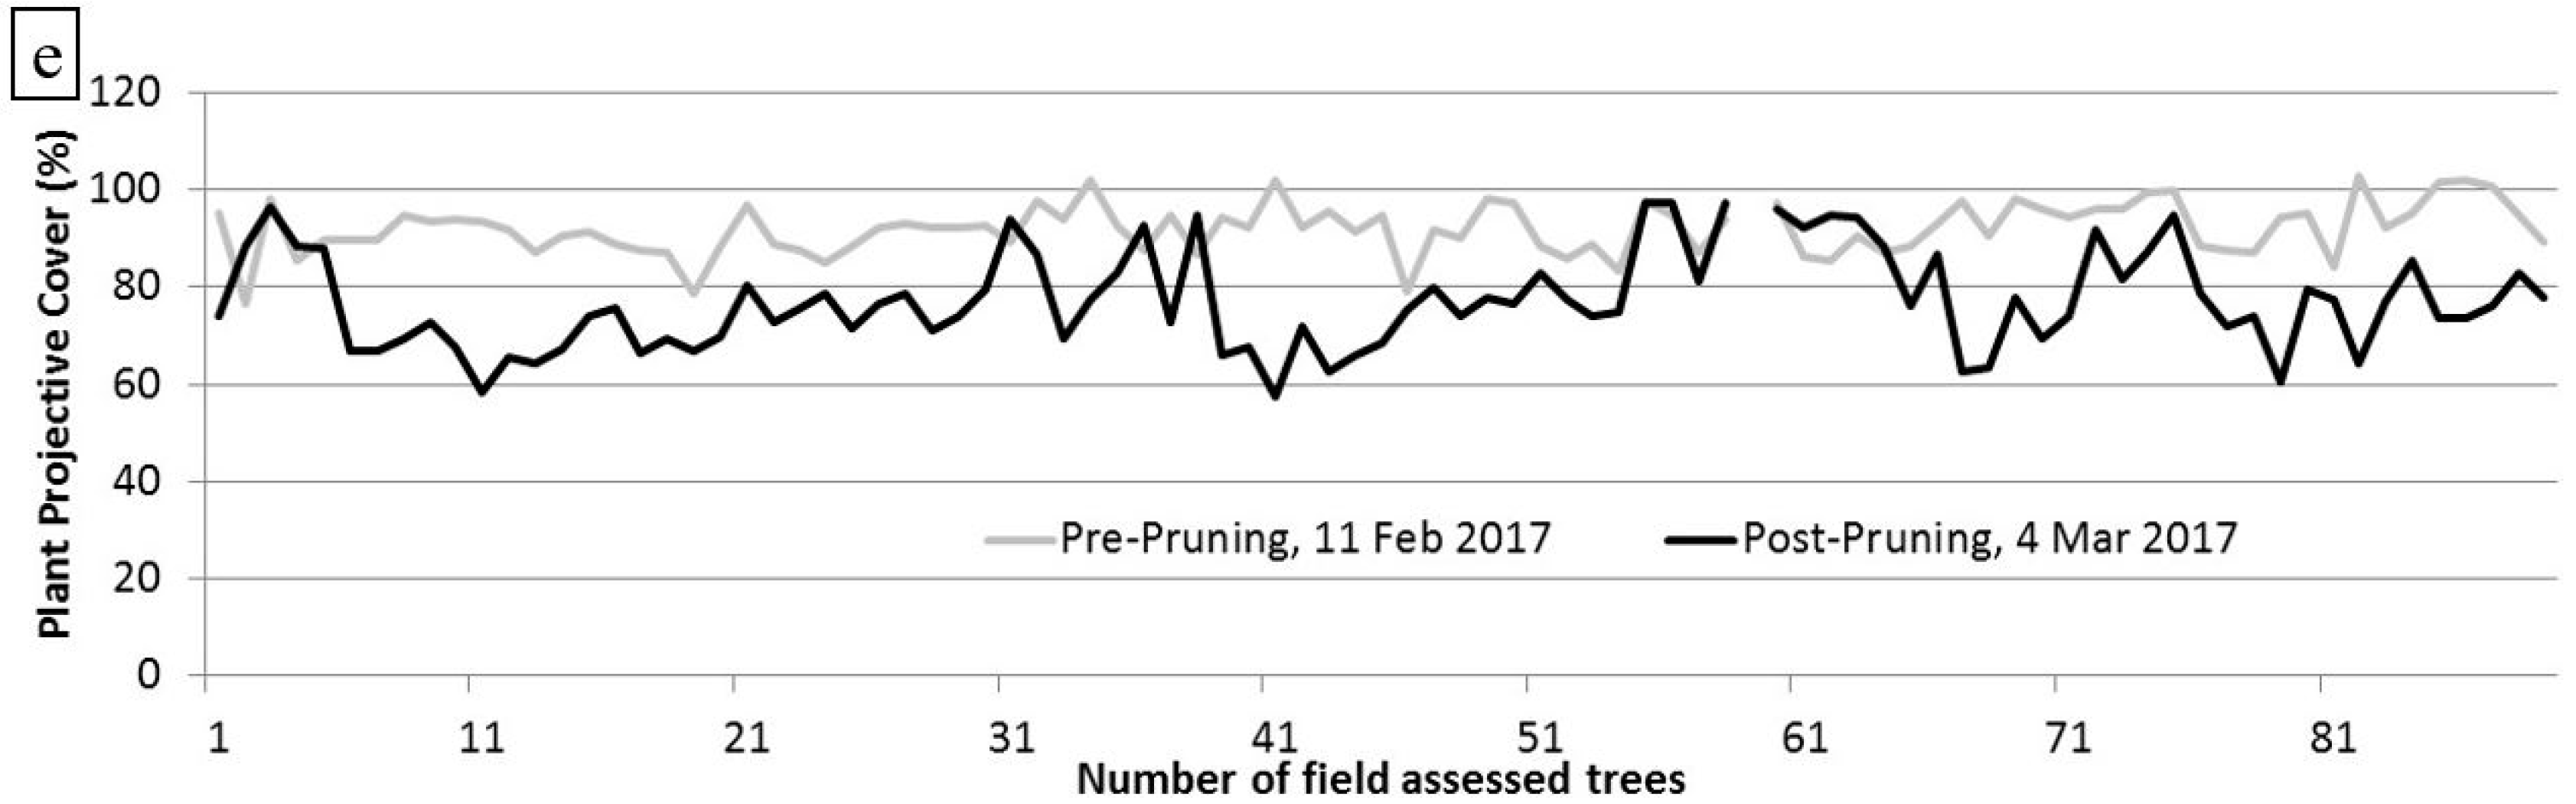
The mapping of tree structural parameters before and after pruning enabled an assessment of the impact of the pruning effects. A significant decrease in the average value of the tree structural parameters was observed for the 189 trees within the orchard between pre- and post-pruning. Decreases in the tree crown perimeter (1.94 m; 10.9%), area (3.49 m2; 25.9%), width (0.567 m; 14.7%), 90th percentile tree crown height (0.616 m; 22.3%) and PPC (14.8%) were established (Figure 11 and Figure 12). According to [12], the recommended thinning size of a lychee tree is between 15% and 25% from its initial size. Hence, the pruning results based on all 189 mapped trees showed good agreement with the recommendation. In most cases (179 out of 189 trees), a decrease was observed in the tree structural measurements for the individual tree crowns. However, some of the smaller and newly planted lychee trees (10 out of 189 trees) were not pruned, and hence the structural measurements stayed the same or slightly increased (Figure 12).
Although this research only covered a study site of limited extent, it should be acknowledged that this is the very nature of multi-rotor UAV-based mapping studies because of limited battery life and hence flying time. Despite this, UAV-based studies still provide many benefits and invaluable applications, including: (1) very detailed mapping at ultra-high spatial resolution; (2) information that can be used to scale between field and satellite data; (3) demonstration of methodologies that can be utilized elsewhere; (4) cost-effective time-series acquisition of imagery; (5) consistency in data acquisition and assessment; and (6) quick and flexible means of deriving information on crop phenotyping traits for assessment with short turn-around time and for retrospective analysis. These benefits and the potential of UAV-based imagery to be used effectively for crop phenotyping have been highlighted in several studies [55,56,57].
4.4. Effects of Flying Height Differences
The impact of flying height variations offers insight into the influence of scale and the scalability of this UAV-based approach to determine its applicability to larger orchards. Differences in flying height only affected the comparison of pre- and post-pruning tree structure slightly (Figure 13a). Tree crown height differences were highest when the images were collected at a 30 m height compared to 50 and 70 m height. A flying height of 30 m produced the most accurate height estimates, given that the produced DSM and DTM were less accurate when collected at increasing flying heights. The measurements of area and perimeter decreased with increasing flying height because of the increasing GSD, which made the automatically derived object perimeter smoother, and hence smaller, despite the added tree crown edge pixels for the imagery collected at 70 m height that was discussed above. This also caused the differences in mapped area and perimeter to decrease as a function of flying height, because of the smaller range in values in these parameters at larger GSDs. The tree crown width measurements derived at different flying heights were similar, showing a slight decrease as the flying height (and hence the GSD) increased, which also caused the differences before and after pruning to slightly decrease with increasing flying height (Figure 13a).
PPC was generally most accurately estimated based on the imagery collected at 70 m, although the average PPC difference was similar for all three flying heights (Figure 13b). However, at a flying height of 70 m, the average minimum and maximum differences were highest. Normally, at increasing GSDs, you would expect less spectral variability, i.e., a smaller range of pixel values within individual tree crown objects, because of spectral averaging of pixels covering a larger area [52]. This was attributed to the larger GSD, which may have caused mixed pixels along the edges of the delineated tree crowns. These mixed pixels may have included parts of the shaded areas caused by tree shadows on the one side of the trees and parts of the sunlit green grass on the other side of some of the trees.
There are clear management advantages to flying a UAV at a height of 70 m compared to 30 m, as it is possible to cover a larger area in a single flight or to reduce the flying time for covering a set area. Completing a flight mission more quickly also means that the risk of cloud shadow contamination is reduced. Although doing this resulted in an increase in GSD from 4.1 cm to 8.8 cm and resulted in a compromise in tree height estimates using the Parrot Sequoia imagery, the mapping results of the vegetation structural parameters were not significantly affected. The acquisition of imagery with a GSD of 8.8 cm compared with 4.1 cm will also reduce the size of the image data set more than fourfold, which will subsequently decrease the image processing time. Torres-Sanchez et al. [25] mapped tree structural parameters of olive trees from UAV imagery collected at 50 and 100 m above ground level and only observed small reductions in their predicted mapping accuracies, while significantly reducing the time of flight, the image orthomosaic processing and the GEOBIA, with total required time being reduced from 47 min to 13 min and from 5 h 15 min to 1 h 8 min for their multi-spectral and RGB imagery, respectively. Hence, in terms of verifying the results of a pruning strategy on an orchard, there will likely be more efficiencies in choosing a flying height of 70 m, without loss of fidelity. Developing UAV-based mapping and monitoring approaches for assessment of tree crop structure is also important for other types of tree crops, including mango, avocado and macadamia trees, as these parameters can provide information to help growers in the further production and delivery chain. This can ensure growers have enough personnel and equipment for fruit picking, have the right storage facilities, have a suitable number of cartons for packaging, and can organise the means for transport and delivery [58].
5. Conclusions
Characterizing the impacts of pruning on tree structural parameters is required to inform and enhance the management of orchards and improve crop productivity. We present an innovative and novel approach that exploits multi-spectral UAV imagery to measure tree structural differences pre- and post-pruning, and apply this to a small commercial lychee orchard. The developed GEOBIA approach was found to be particularly useful for delineating individual tree crowns and deriving object shape and spectral and textural information for correlation with field-based measurements of tree structure. It was also found that existing GEOBIA approaches designed for tree crown delineation of olive trees were not feasible for delineation of lychee tree crops and required additional spectral and context information. Mapping tree structure and pruning effects may hence require specialized approaches to be applied for different tree crops. The multi-spectral imagery was found to accurately assess pre- and post-pruning tree crown structure, including tree crown perimeter, area, width, height and PPC. Tree crown perimeter was most accurately mapped at a flying height of 70 m, while tree crown width measurements were similar at all three flying heights. Tree height was most accurately mapped at a 30 m flying height, as larger flying heights affected the accuracy of the derived DSM and DTM. Imagery collected at 70 m height produced slightly higher correlation with field measured PPC for most predictor variables.
These results highlight that despite the compromise in accuracy of tree height estimates (0.1936 m RMSE as opposed to 0.3568 m), a flying height of 70 m may be the best choice for assessing pre- and post-pruning tree structural differences to gain efficiency in terms of flight duration, area coverage, and image processing time, without losing a significant amount of information. As an additional benefit, the proposed UAV-based approach is likely to reduce costs (compared with manual assessment) and increase consistency compared to traditional field-based estimates. Future research should focus on collecting and analysing similar data for other orchard sites and for trees grown under different conditions, e.g., different tree ages, tree varieties, climatic conditions, and pruning strategies, to test if the developed approach can be applied more generally and the results remain consistent with broader application.
Author Contributions
K.J. and T.R. conceived and designed and performed the experiments; K.J., T.R. and M.F.M. analyzed the data and wrote the paper.
Funding
This research was partly funded by SPIRIT BAPPENAS-World Bank grant number IBRD No. 8010-IND.
Acknowledgments
This work was supported by the SPIRIT BAPPENAS-World Bank under Loan Agreement (IBRD No. 8010-IND). Thanks to Paul Thorne, the lychee grower and owner of the lychee orchard, for help in the field and for allowing us access to the study site. We would like to acknowledge the Remote Sensing Research Centre in the School of Earth and Environmental Sciences at the University of Queensland, Brisbane, Australia for use of software facilities. Matthew McCabe was supported by the King Abdullah University of Science and Technology.
Conflicts of Interest
The authors declare no conflict of interest.
References
- Atzberger, C. Advances in remote sensing of agriculture: Context description, existing operational monitoring systems and major information needs. Remote Sens. 2013, 5, 949–981. [Google Scholar] [CrossRef]
- Me, C.Y.; Balasundram, S.K.; Hanif, A.H.M. Detecting and monitoring plant nutrient stress using remote sensing approaches: A review. Asian J. Plant Sci. 2017, 16, 1–8. [Google Scholar]
- Ikinci, A. Influence of pre- and postharvest summer pruning on the growth, yield, fruit quality, and carbohydrate content of early season peach cultivars. Sci. World J. 2014. [Google Scholar] [CrossRef] [PubMed]
- Jimenez-Brenes, F.M.; Lopez-Granados, F.; de Castro, A.I.; Torres-Sanchez, J.; Serrano, N.; Pena, J.M. Quantifying pruning impacts on olive tree architecture and annual canopy growth by using UAV based 3D modelling. Plant Methods 2017, 13, 55. [Google Scholar] [CrossRef] [PubMed]
- Rosell, J.; Sanz, R. A review of methods and applications of the geometric characterization of tree crops in agricultural activities. Comput. Electron. Agric. 2012, 81, 124–141. [Google Scholar] [CrossRef]
- Sinoquet, H.; Stephan, J.; Sonohat, G.; Lauri, P.É.; Monney, P. Simple equations to estimate light interception by isolated trees from canopy structure features: Assessment with three-dimensional digitized apple trees. New Phytol. 2007, 175, 94–106. [Google Scholar] [CrossRef] [PubMed]
- Connor, D.J.; Gomez del Campo, M.; Rousseaux, M.C.; Searles, P.S. Structure management and productivity of hedgerow olive orchards: A review. Sci. Hortic. 2014, 169, 71–93. [Google Scholar] [CrossRef]
- Menzel, C. Lychee production in Australia. In Lychee Production in the Asia-Pacific Region, 1st ed.; Papademetriou, M.K., Dent, F.J., Eds.; RAP Publication 2002/04; Food and Agriculture Organization of the United Nations, Regional Office for Asia and the Pacific: Bangkok, Thailand, 2002. [Google Scholar]
- Day, K.R.; Dejong, T.M.; Hewitt, A.A. Postharvest summer pruning of “Firebrite” nectarine trees. HortScience 1989, 24, 238–240. [Google Scholar]
- Miller, S.S. Regrowth, flowering and fruit quality of “delicious” apple trees as influenced by pruning treatments. J. Am. Soc. Hortic. Sci. 1982, 107, 975–978. [Google Scholar]
- Ferguson, L.; Glozer, K.; Crisosto, C.; Rosa, U.A.; Castro-Garcia, S.; Fichtner, E.J.; Guinard, J.X.; Le, S.M.; Krueger, W.H.; Miles, J.A.; et al. Improving canopy contact olive harvester efficiency with mechanical pruning. Acta Hortic. 2012, 965, 83–87. [Google Scholar] [CrossRef]
- Campbell, T.P.; Diczbalis, Y. Pruning to Meet Your Lychee Goals: A Report for the Rural Industries Research and Development Corporation; Rural Industries Research and Development Corporation: Barton, Australia, 2001. [Google Scholar]
- Lu, D.; Mausel, P.; Brondizio, E.; Moran, E. Change detection techniques. Int. J. Remote Sens. 2004, 25, 2365–2407. [Google Scholar] [CrossRef]
- Zhang, C.; Kovacs, J. The application of small Unmanned Aerial Systems for precision agriculture: A review. Precis. Agric. 2012, 13, 693–712. [Google Scholar] [CrossRef]
- Bagheri, N. Development of a high-resolution aerial remote-sensing system for precision agriculture. Int. J. Remote Sens. 2017, 38, 2053–2065. [Google Scholar] [CrossRef]
- McCabe, M.F.; Rodell, M.; Alsdorf, D.E.; Miralles, D.G.; Uijlenjhoet, R.; Wagner, W.; Lucieer, A.; Houborg, R.; Verhoest, N.E.C.; Franz, T.E.; et al. The future of earth observation in hydrology. Hydrol. Earth Syst. Sci. 2017, 21, 3879–3914. [Google Scholar] [CrossRef]
- Kang, J.; Wang, L.; Chen, F.; Nui, Z. Identifying tree crown areas in undulating eucaluptus plantations using JSEG multi-scale segmentation and unmanned aerial vehicle near-infrared imagery. Int. J. Remote Sens. 2017, 38, 2296–2312. [Google Scholar] [CrossRef]
- Panagiotidis, D.; Abdollahnejad, A.; Surový, P.; Chiteculo, V. Determining tree height and crown diameter from high-resolution UAV imagery. Int. J. Remote Sens. 2017, 38, 2392–2410. [Google Scholar] [CrossRef]
- Zarco-Tejada, P.J.; Diaz-Varela, R.; Angileri, V.; Loudjani, E. Tree height quantification using very high resolution imagery acquired from an unmanned aerial vehicle (UAV) and automatic 3D photo-reconstruction methods. Eur. J. Agron. 2014, 55, 89–99. [Google Scholar] [CrossRef]
- Bendig, J.; Yu, K.; Aasen, H.; Bolten, A.; Bennertz, S.; Broscheit, J.; Gnyp, M.L.; Bareth, G. Combining UAV-based plant height from crop surface models, visible, and near infrared vegetation indices for biomass monitoring in barley. Geoinformation 2015, 38, 79–87. [Google Scholar] [CrossRef]
- Oerke, E.-C.; Gerhards, R.; Menz, G.; Sikora, R.A. Precision Crop Protection—The Challenge and Use of Heterogeneity; Springer: Dordrecht, The Netherlands, 2010. [Google Scholar]
- Matese, A.; Di Gennaro, S.F.; Berton, A. Assessment of a canopy height model (CHM) in a vineyard using UAV-based multispectral imaging. Int. J. Remote Sens. 2017, 38, 2150–2160. [Google Scholar] [CrossRef]
- Berni, J.A.J.; Zarco-Tejada, P.J.; Suarez, L.; Fereres, E. Thermal and narrowband multispectral remote sensing for vegetation monitoring from an unmanned aerial vehicle. IEEE Trans. Geosci. Remote Sens. 2009, 47, 722–738. [Google Scholar] [CrossRef] [Green Version]
- Diaz-Varela, R.A.; de la Rosa, R.; Leon, L.; Zarco-Tejada, P.J. High-resolution airborne UAV imagery to assess olive tree crown parameters using 3D photo reconstruction: Application in breeding trials. Remote Sens. 2015, 7, 4213–4232. [Google Scholar] [CrossRef]
- Torres-Sanchez, J.; Lopez-Granados, F.; Serrano, N.; Arquero, O.; Pena, J.M. High-throughput 3-D monitoring of agricultural-tree plantations with Unmanned Aerial Vehicle (UAV) technology. PLoS ONE 2015. [Google Scholar] [CrossRef] [PubMed]
- Koch, B.; Heyder, U.; Weinacker, H. Detection of individual tree crowns in airborne Lidar data. Photogramm. Eng. Remote Sens. 2006, 72, 357–363. [Google Scholar] [CrossRef]
- Leckie, D.; Gougeon, F.; Hill, D.; Quinn, R.; Armstrong, L.; Shreenan, R. Combined high-density lidar and multispectral imagery for individual tree crown analysis. Can. J. Remote Sens. 2003, 29, 633–649. [Google Scholar] [CrossRef]
- Pouliot, D.A.; King, D.J.; Bell, F.W.; Pitt, D.G. Automated tree crown detection and delineation in high-resolution digital camera imagery of coniferous forest regeneration. Remote Sens. Environ. 2002, 82, 322–334. [Google Scholar] [CrossRef]
- Bunting, P.; Lucas, R. The delineation of tree crowns in Australian mixed species forests using hyperspectral Compact Airborne Spectrographic Imager (CASI) data. Remote Sens. Environ. 2006, 101, 230–248. [Google Scholar] [CrossRef]
- Johansen, K.; Bartolo, R.; Phinn, S. Special Feature—Geographic object-based image analysis. J. Spat. Sci. 2010, 55, 3–7. [Google Scholar] [CrossRef]
- Johansen, K.; Sohlbach, M.; Sullivan, B.; Stringer, S.; Peasley, D.; Phinn, S. Mapping banana plants from high spatial resolution orthophotos to facilitate eradication of Banana Bunchy Top Virus. Remote Sens. 2014, 6, 8261–8286. [Google Scholar] [CrossRef]
- Kamal, M.; Phinn, S.; Johansen, K. Object-based approach for multi-scale mangrove composition mapping using multi-resolution image datasets. Remote Sens. 2015, 7, 4753–4783. [Google Scholar] [CrossRef]
- Kee, Y.; Quackenbush, L.J. A review of methods for automatic individual tree-crown detection and delineation from passive remote sensing. Int. J. Remote Sens. 2011, 32, 4725–4747. [Google Scholar] [CrossRef]
- Blaschke, T. Object Based Image Analysis for Remote Sensing. ISPRS J. Photogramm. Remote Sens. 2010, 65, 2–16. [Google Scholar] [CrossRef]
- Laliberte, A.S.; Herrick, J.E.; Rango, A.; Winters, C. Acquisition, orthorectification, and object-based classification of unmanned aerial vehicle (UAV) imagery for rangeland monitoring. Photogramm. Eng. Remote Sens. 2010, 76, 611–672. [Google Scholar] [CrossRef]
- Ma, L.; Cheng, L.; Li, M.; Liu, Y.; Ma, X. Training set size, scale, and features in Geographic Object-Based Image Analysis of very high resolution unmanned aerial vehicle imagery. ISPRS J. Photogramm. Remote Sens. 2015, 102, 14–27. [Google Scholar] [CrossRef]
- Torres-Sanchez, J.; Lopez-Granados, F.; Pena, J.M. An automatic object-based method for optimal thresholding in UAV images: Application for vegetation detection in herbaceous crops. Comput. Electron. Agric. 2015, 114, 43–52. [Google Scholar] [CrossRef]
- Bureau of Meteorology. Climate Statistics for Australian Locations. Available online: www.bom.gov.au/climate/averages/tables/cw_040854.shtml (accessed on 19 March 2018).
- Scarth, P. A Methodology for Scaling Biophysical Models. Ph.D. Thesis, The University of Queensland, Brisbane, Australia, 2003. [Google Scholar]
- Van Gardingen, P.R.; Jackson, G.E.; Hernandez-Daumas, S.; Russel, G.; Sharp, L. Leaf area index estimates obtained for clumped canopies using hemispherical photography. Agric. For. Meteorol. 1999, 94, 243–257. [Google Scholar] [CrossRef]
- Propeller. AeroPoints. Available online: https://www.propelleraero.com/aeropoints/ (accessed on 19 March 2018).
- Wang, C.; Myint, S.W. A simplified empirical line method of radiometric calibration for small Unmanned Aircraft Systems-based remote sensing. IEEE J. Sel. Top. Appl. Earth Obs. Remote Sens. 2015, 8, 1876–1885. [Google Scholar] [CrossRef]
- Ahmed, O.S.; Shemrock, A.; Chabot, D.; Dillon, C.; Williams, G.; Wasson, R.; Franklin, S.E. Hierarchical land cover and vegetation classification using multispectral data acquired from an unmanned aerial vehicle. Int. J. Remote Sens. 2017, 38, 2037–2052. [Google Scholar] [CrossRef]
- Zhan, Q.; Molenaar, M.; Tempfli, K.; Shi, W. Quality assessment for geo-spatial objectis derived from remotely sensed data. Int. J. Remote Sens. 2005, 26, 2953–2974. [Google Scholar] [CrossRef]
- Franklin, S.E.; Maudie, A.J.; Lavigne, M.B. Using spatial co-occurrence texture to increase forest structure and species composition classification accuracy. Photogramm. Eng. Remote Sens. 2001, 67, 849–855. [Google Scholar]
- Haralick, R.M.; Shanmugan, K.; Dinstein, I. Textural features for image classification. IEEE Trans. Syst. Man Cybern. 1973, 3, 610–621. [Google Scholar] [CrossRef]
- Clausi, D.A. An analysis of co-occurrence texture statistics as a function of grey level quantization. Can. J. Remote Sens. 2002, 28, 45–62. [Google Scholar] [CrossRef]
- Johansen, K.; Coops, N.C.; Gergel, S.E.; Stange, Y. Application of high spatial resolution satellite imagery for riparian and forest ecosystem classification. Remote Sens. Environ. 2007, 110, 29–44. [Google Scholar] [CrossRef]
- Kaartinen, H.; Hyyppa, J.; Yu, X.; Vastaranta, M.; Hyyppa, H.; Kukko, A.; Holopainen, M.; Heipke, C.; Hirschmugl, M.; Morsdorf, F.; et al. An international comparison of individual tree detection and extraction using airborne laser scanning. Remote Sens. 2012, 4, 950–974. [Google Scholar] [CrossRef] [Green Version]
- Lillesand, T.; Kiefer, R.W.; Chipman, J. Remote Sensing and Image Interpretation, 7th ed.; Wiley: Hoboken, NJ, USA, 2015. [Google Scholar]
- Johansen, K.; Phinn, S. Mapping structural parameters and species composition of riparian vegetation using IKONOS and Landsat ETM+ data in Australian tropical savannahs. Photogramm. Eng. Remote Sens. 2006, 72, 71–80. [Google Scholar] [CrossRef]
- Puissant, A.; Hirsch, J.; Weber, C. The utility of texture analysis to improve per-pixel classification for high to very high spatial resolution imagery. Int. J. Remote Sens. 2005, 26, 733–745. [Google Scholar] [CrossRef]
- Woodcock, C.E.; Strahler, A.H. The factor of scale in remote sensing. Remote Sens. Environ. 1987, 21, 311–332. [Google Scholar] [CrossRef]
- Gu, Y.; Wulie, B.K.; Howard, D.M.; Phuyal, K.P.; Ji, L. NDVI saturation adjustment: A new approach for improving cropland performance estimates in the Greater Platte River Basin, USA. Ecol. Indic. 2013, 30, 1–6. [Google Scholar] [CrossRef]
- Anderson, K.; Gaston, K. Lightweight unmanned aerial vehicles will revolutionize spatial ecology. Front. Ecol. Environ. 2013, 11, 138–146. [Google Scholar] [CrossRef]
- Pajares, G. Overview and current status of remote sensing applications based on unmanned aerial vehicles (UAVs). Photogramm. Eng. Remote Sens. 2015, 81, 281–329. [Google Scholar] [CrossRef]
- Yang, G.; Liu, J.; Zhao, C.; Li, Z.; Huang, Y.; Yu, H.; Xu, B.; Yang, X.; Zhu, D.; Zhang, X.; et al. Unmanned aerial vehicle remote sensing for field-based crop phenotyping: Current status and perspectives. Front. Plant Sci. 2017, 8, 1111. [Google Scholar] [CrossRef] [PubMed]
- Robson, A.; Rahman, M.M.; Muir, J. Using WorldView satellite imagery to map yield in avocado (Persea Americana): A case study in Bundaberg, Australia. Remote Sens. 2017, 9, 1223. [Google Scholar] [CrossRef]
Figure 1.
(a) Study area location (yellow dot) approximately 25 km southeast of Brisbane; (b) overview photo of study site; and (c) field photo of the lychee trees and poles used for protective nets to cover the trees. Location: 27°37′49′′S; 153°10′58′′E.
Figure 1.
(a) Study area location (yellow dot) approximately 25 km southeast of Brisbane; (b) overview photo of study site; and (c) field photo of the lychee trees and poles used for protective nets to cover the trees. Location: 27°37′49′′S; 153°10′58′′E.

Figure 2.
(a) Distribution and (b) in situ field photo of AeroPoints used for geo-referencing of the UAV imagery. Location: 27°37′49′′S; 153°10′58′′E.
Figure 2.
(a) Distribution and (b) in situ field photo of AeroPoints used for geo-referencing of the UAV imagery. Location: 27°37′49′′S; 153°10′58′′E.

Figure 3.
(a) Eight radiometric calibration targets and the 3DR Solo quadcopter; (b) green band; (c) red band; (d) red edge band; (e) NIR band; and (f) corresponding reflectance signatures between 500 and 900 nm of the eight targets, ranging in colour from white to black with six grey scale levels.
Figure 3.
(a) Eight radiometric calibration targets and the 3DR Solo quadcopter; (b) green band; (c) red band; (d) red edge band; (e) NIR band; and (f) corresponding reflectance signatures between 500 and 900 nm of the eight targets, ranging in colour from white to black with six grey scale levels.

Figure 4.
Flowchart of GEOBIA processing routine to map individual tree crowns.

Figure 5.
(a) False colour (Green, Red, NIR) image of pre-pruned lychee trees; (b) tree crown extent map; (c) tree crown extent map exposed to averaging filter with kernel size of 81 × 81 pixels; and (d) single tree crowns and tree crown centres being grown into tree crowns.
Figure 5.
(a) False colour (Green, Red, NIR) image of pre-pruned lychee trees; (b) tree crown extent map; (c) tree crown extent map exposed to averaging filter with kernel size of 81 × 81 pixels; and (d) single tree crowns and tree crown centres being grown into tree crowns.

Figure 6.
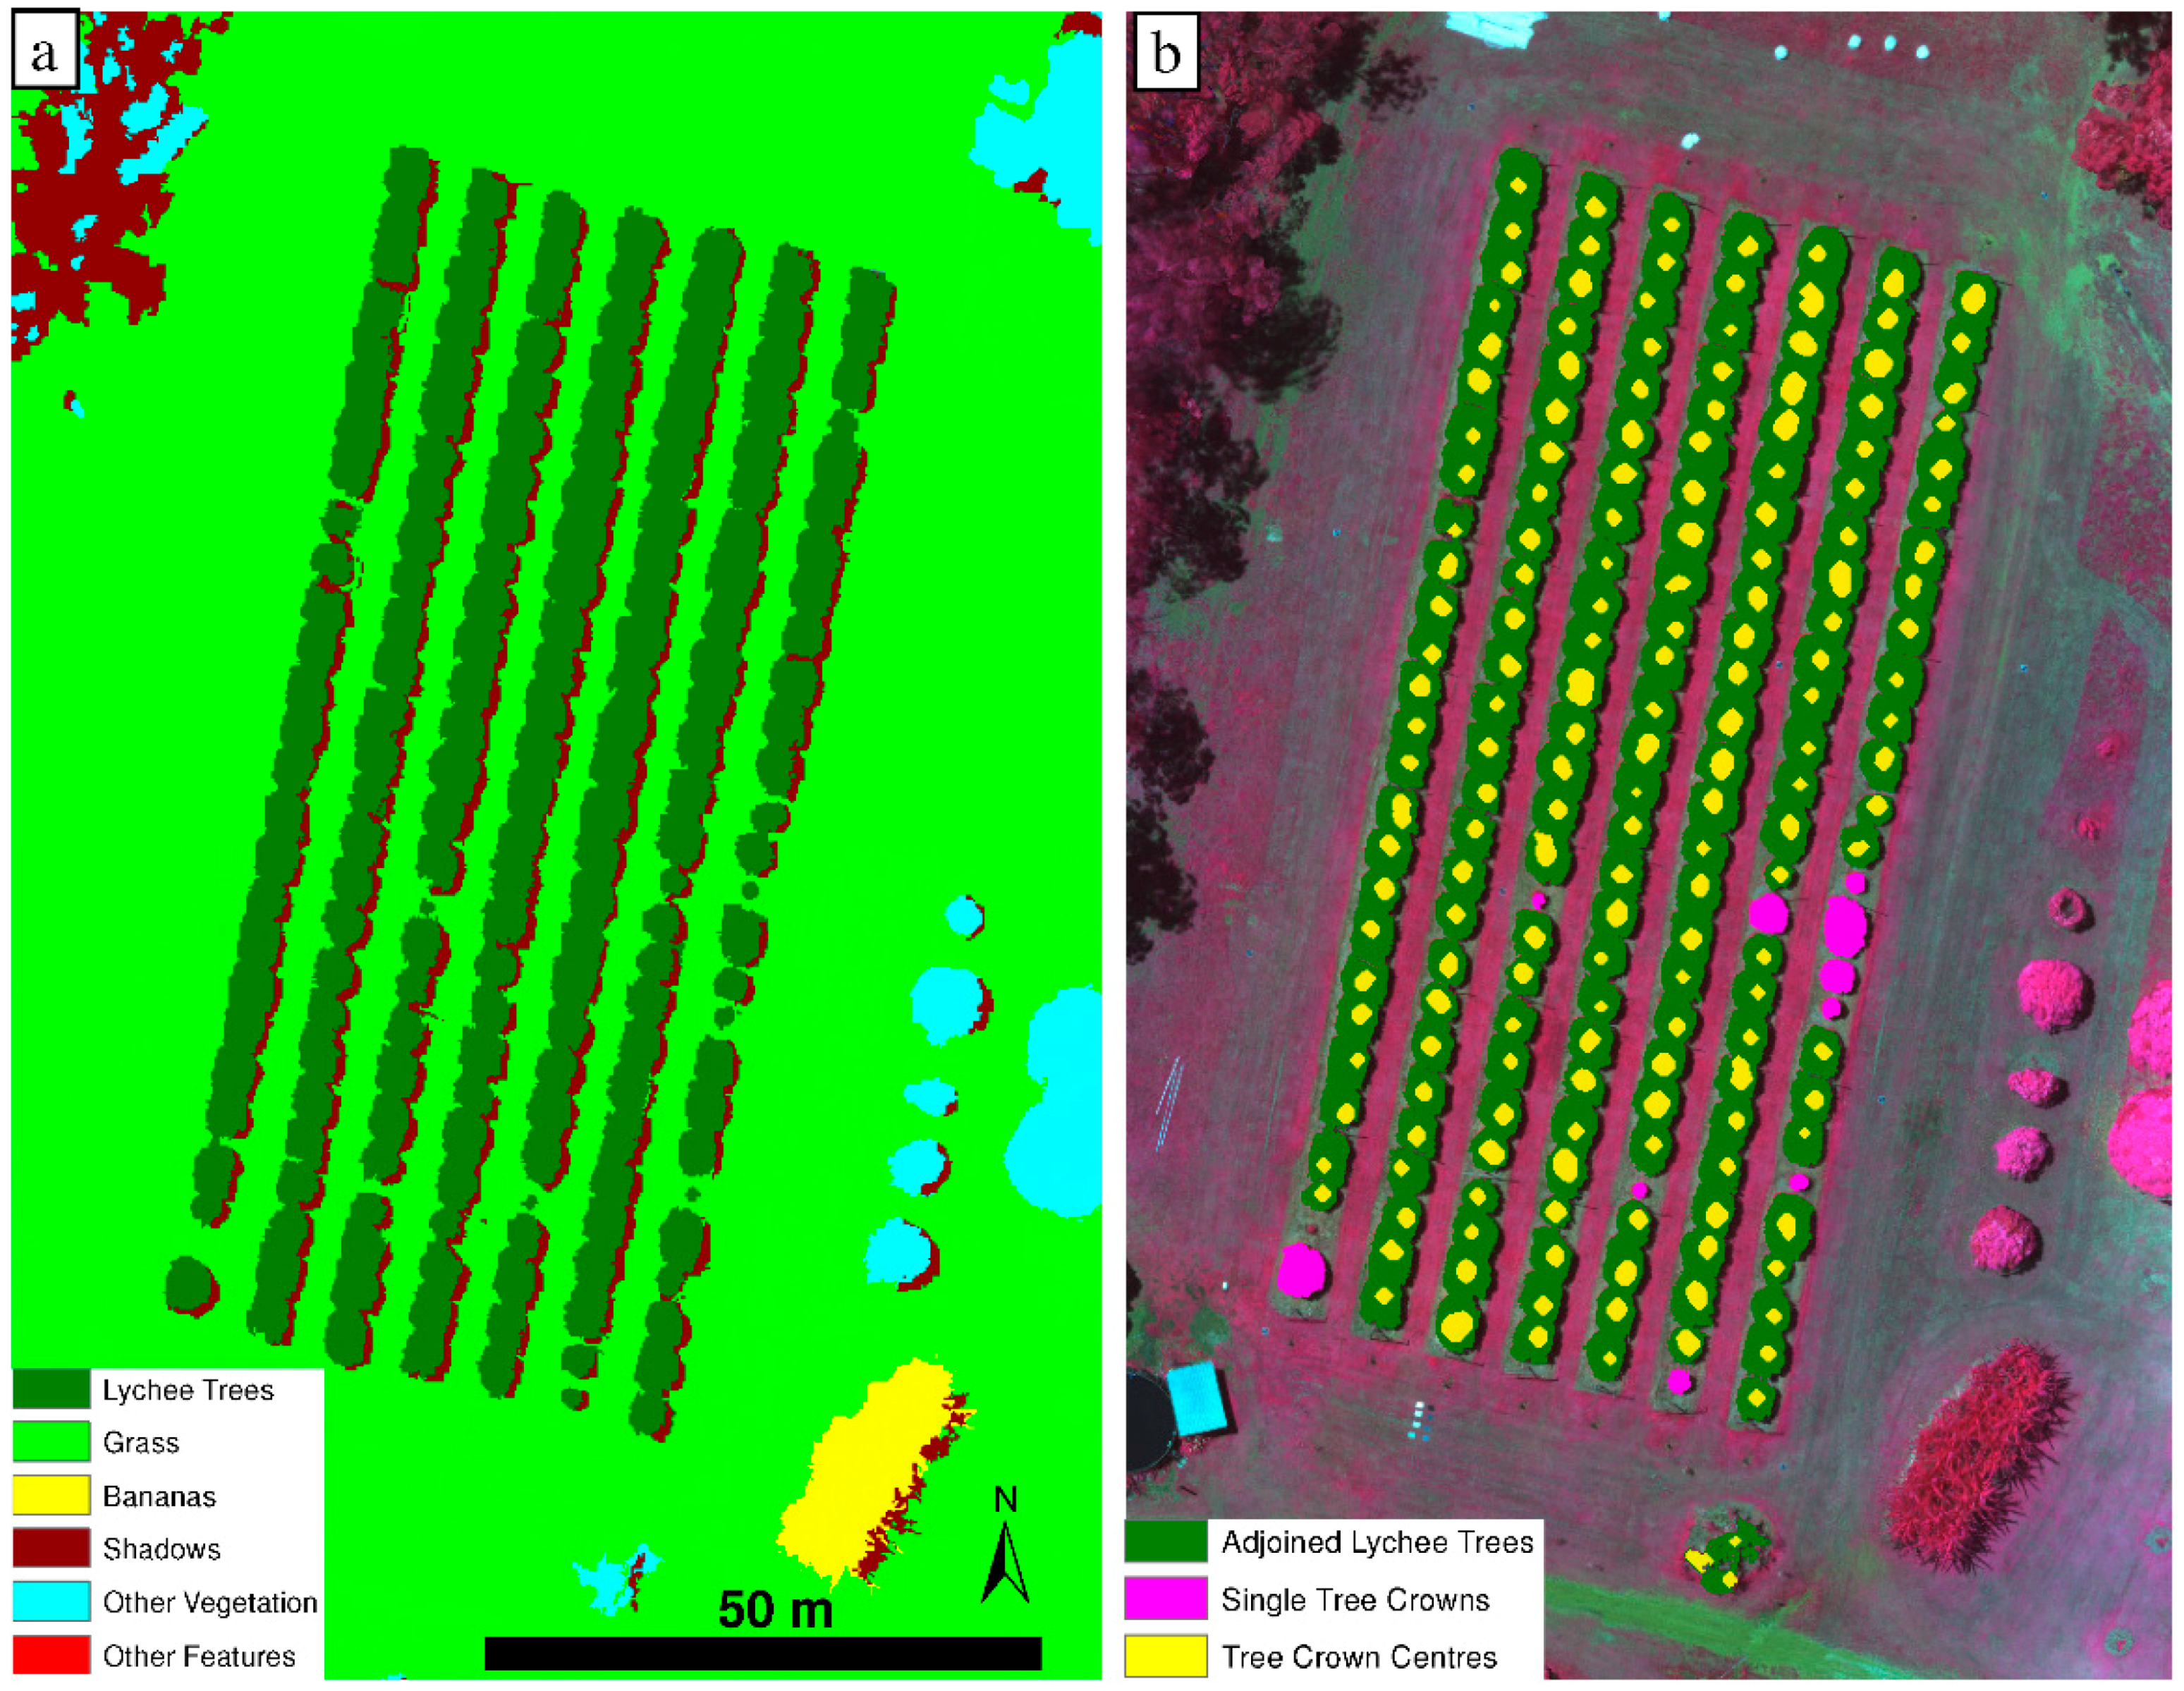
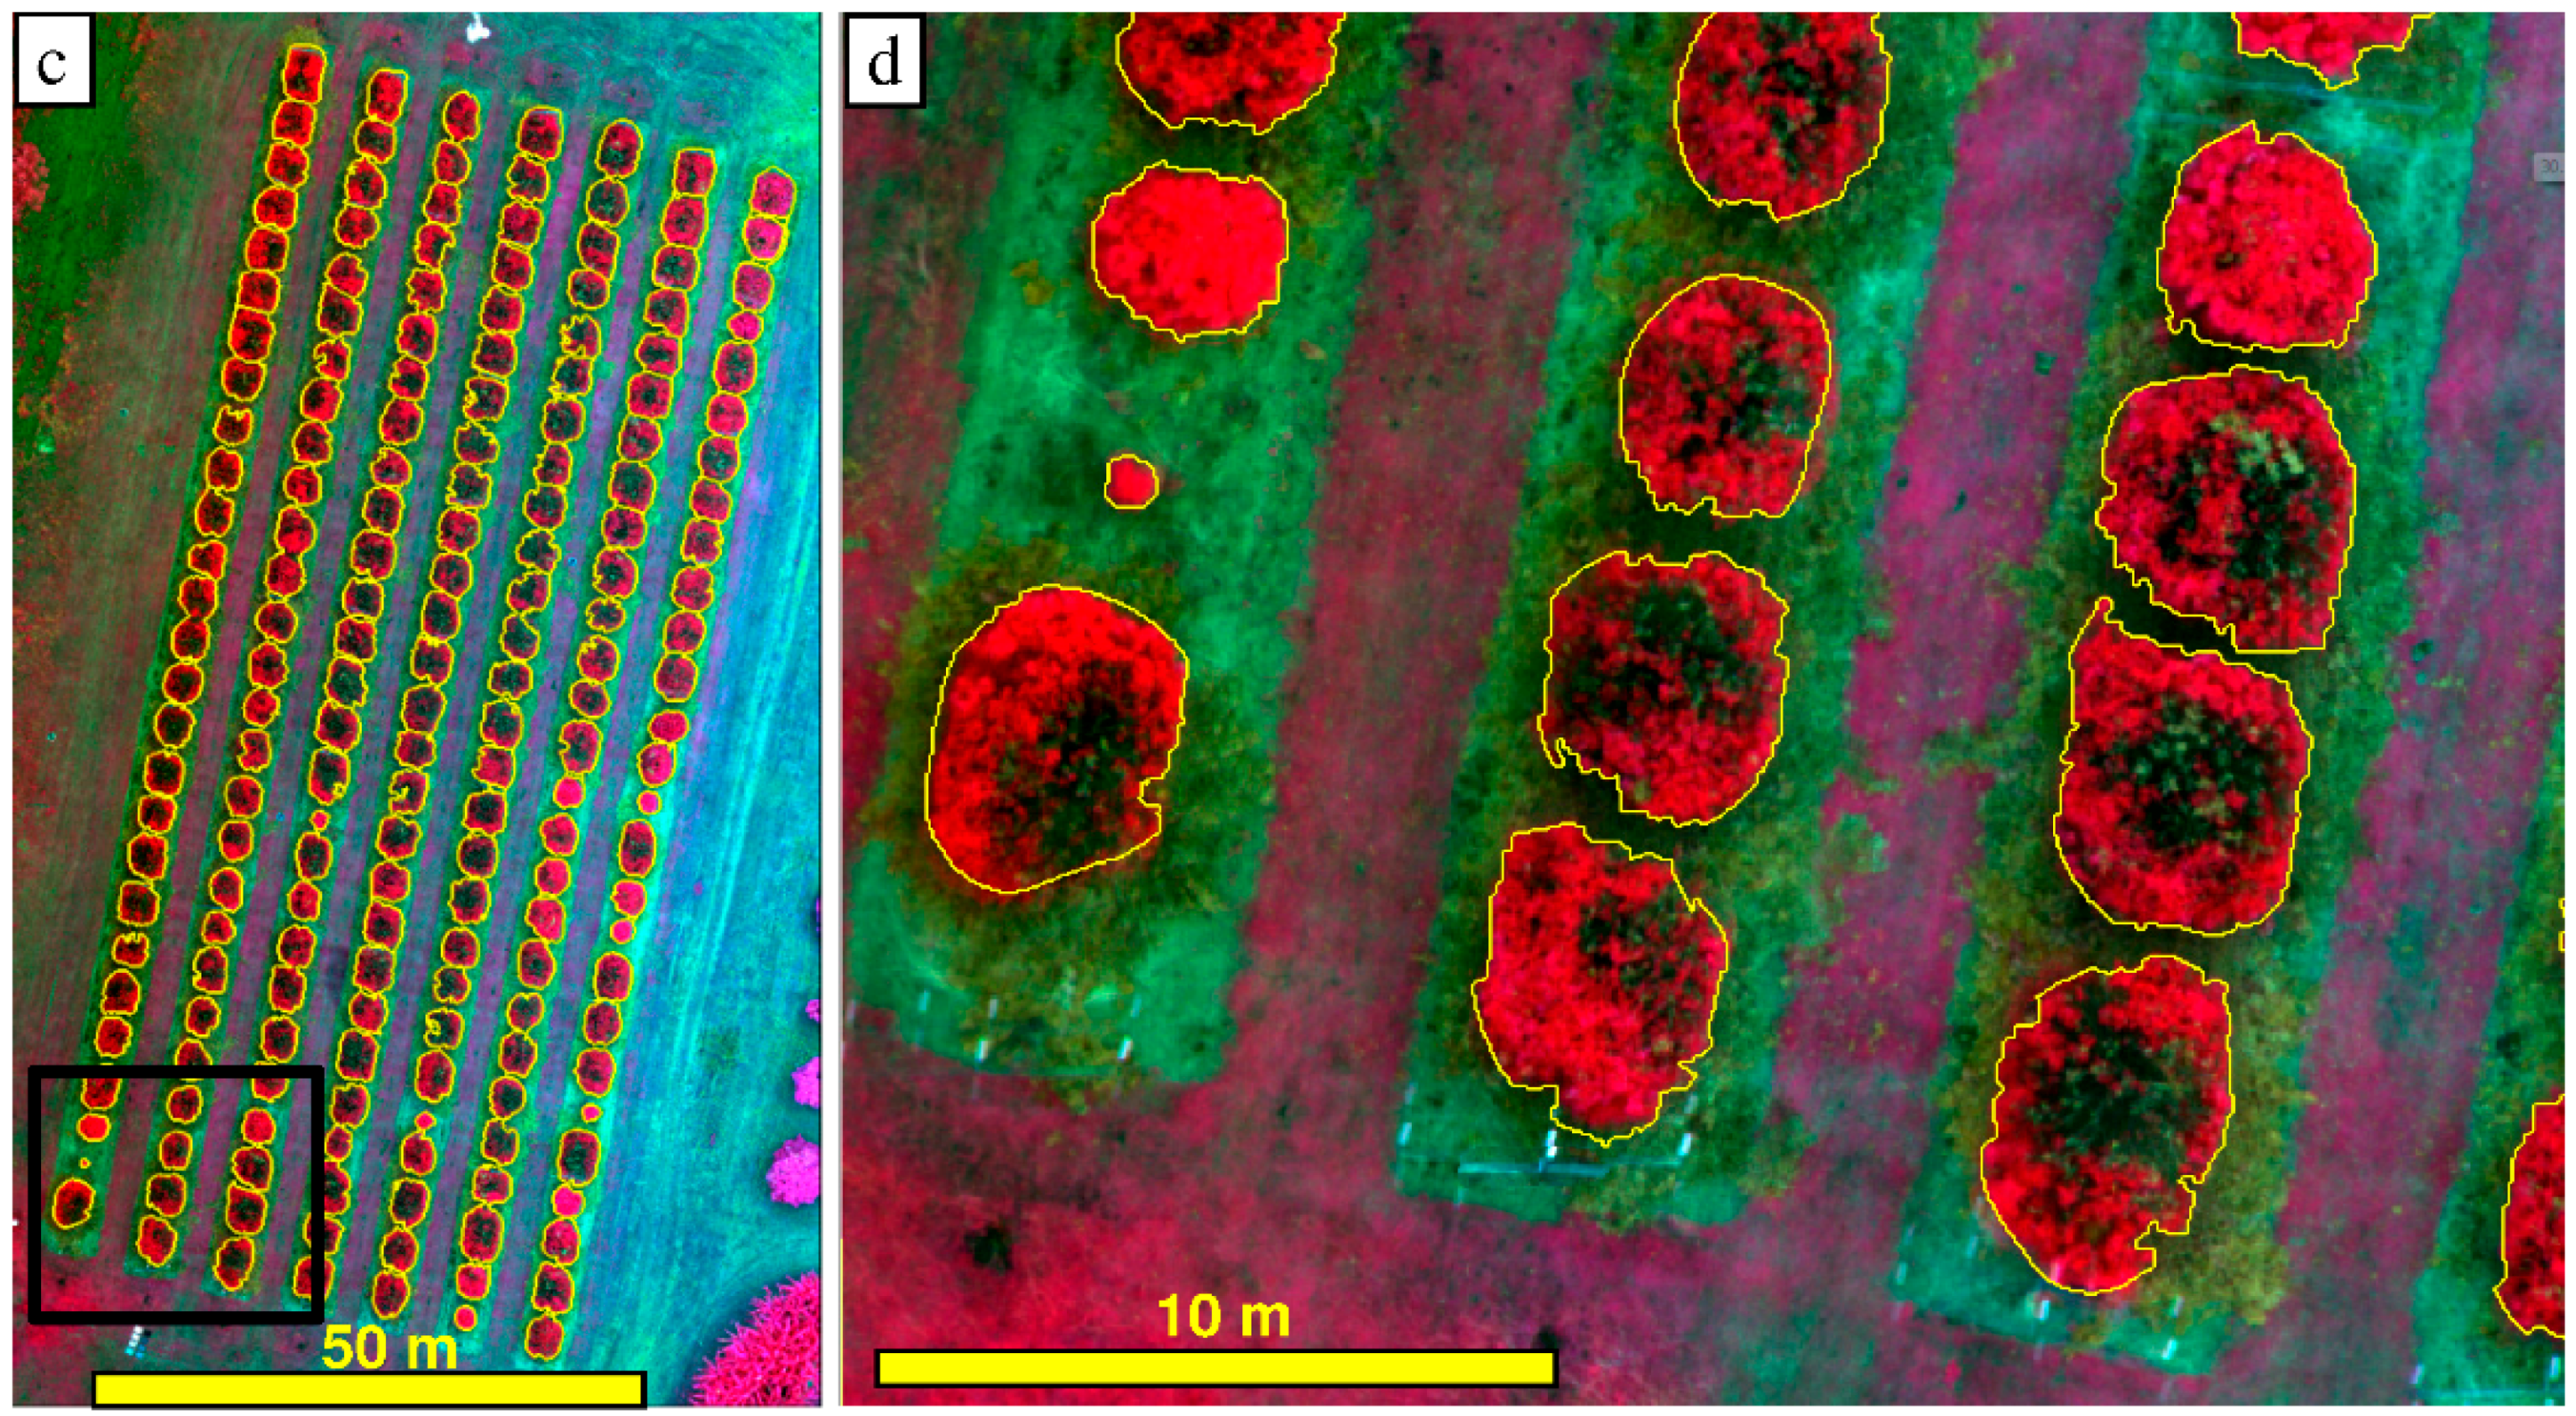
(a) Land-cover map showing the mapped extent of pruned lychee trees and other land-cover classes eliminated from further analysis to focus purely on the mapped lychee trees; (b) identification of tree crown centres and single tree crowns not adjoining neighbouring tree crowns; (c,d) results of the lychee tree crown delineation (yellow outlines) produced using GEOBIA. Location: 27°37′49′′S; 153°10′58′′E.
Figure 6.
(a) Land-cover map showing the mapped extent of pruned lychee trees and other land-cover classes eliminated from further analysis to focus purely on the mapped lychee trees; (b) identification of tree crown centres and single tree crowns not adjoining neighbouring tree crowns; (c,d) results of the lychee tree crown delineation (yellow outlines) produced using GEOBIA. Location: 27°37′49′′S; 153°10′58′′E.


Figure 7.
(a) False colour (NIR, Red, Green) orthomosaic; and (b) corresponding CHM of lychee trees pre-pruning, including the GEOBIA delineation result (yellow outlines).
Figure 7.
(a) False colour (NIR, Red, Green) orthomosaic; and (b) corresponding CHM of lychee trees pre-pruning, including the GEOBIA delineation result (yellow outlines).

Figure 8.
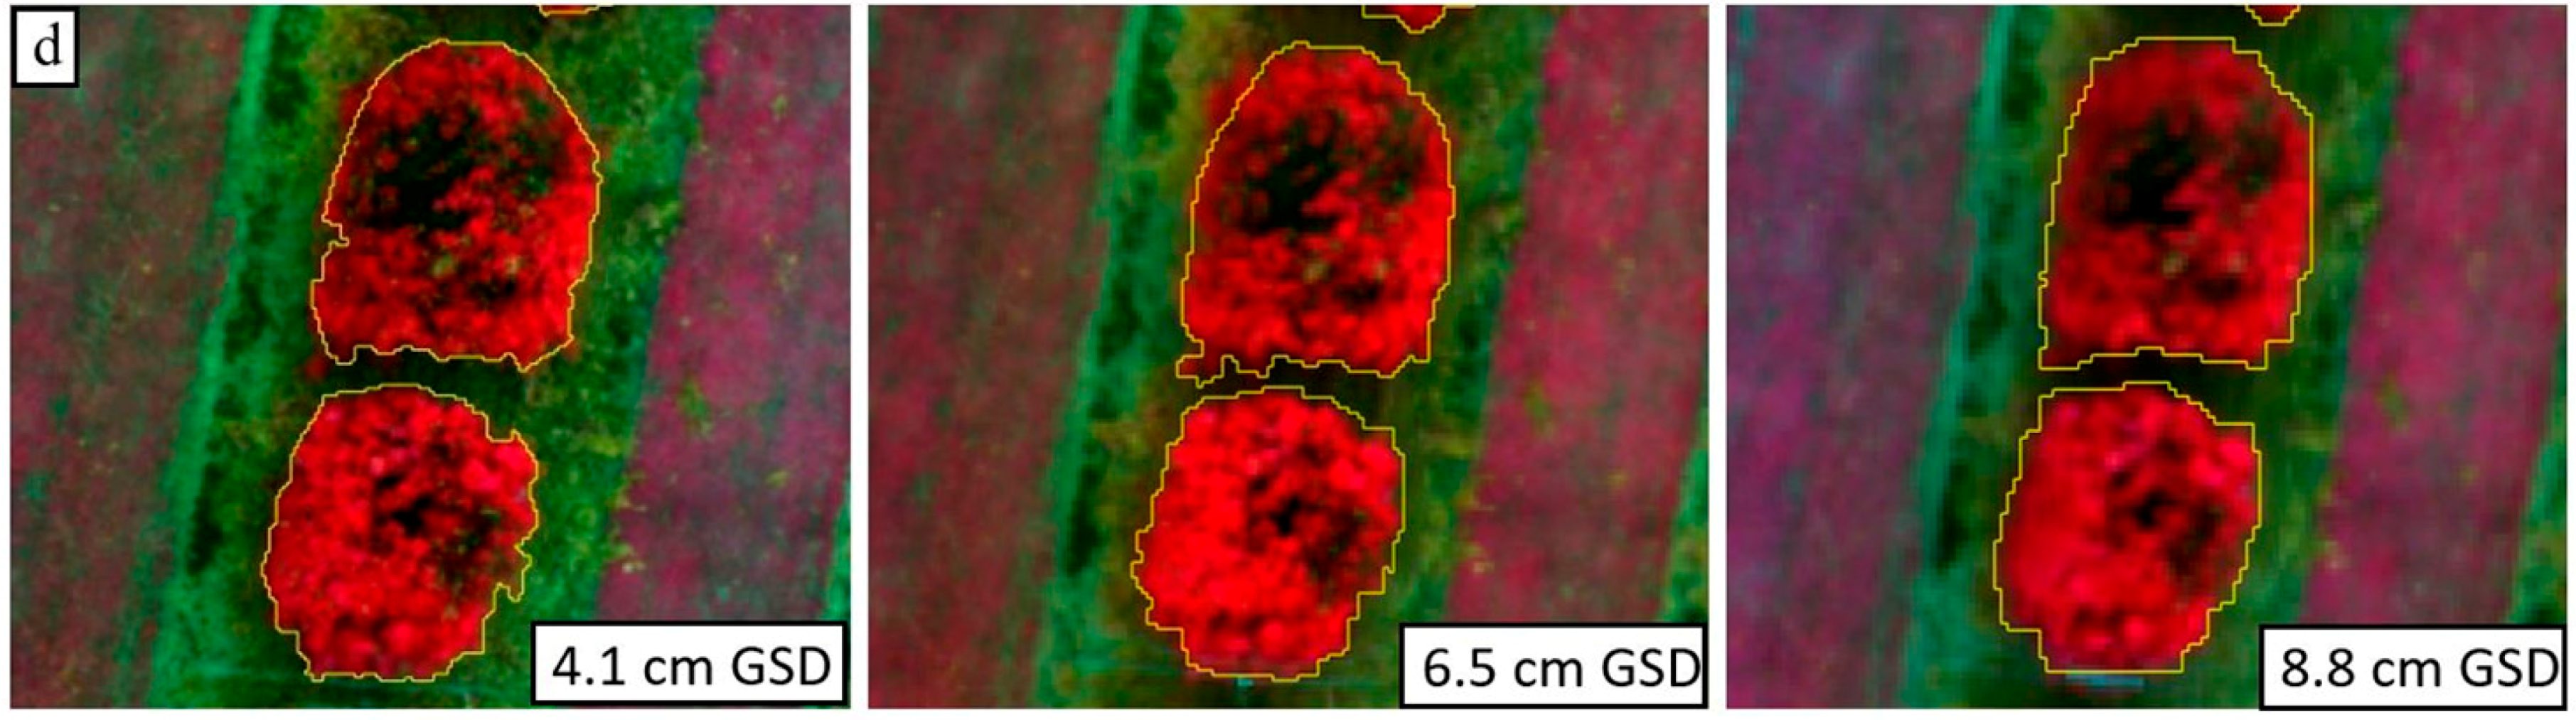
Relationships between field- and image-derived (a) tree crown width; (b) height and (c) perimeter; and (d) depiction of how the increasing GSD affected the delineation of the pruned lychee tree crowns.
Figure 8.
Relationships between field- and image-derived (a) tree crown width; (b) height and (c) perimeter; and (d) depiction of how the increasing GSD affected the delineation of the pruned lychee tree crowns.


Figure 9.
R2 values based on the positive relationships between field measured PPC and image derived spectral bands, indices and texture measures produced from imagery collected at 30, 50 and 70 m flying height.
Figure 9.
R2 values based on the positive relationships between field measured PPC and image derived spectral bands, indices and texture measures produced from imagery collected at 30, 50 and 70 m flying height.

Figure 10.
Estimated PPC of the 89 pre-pruned tree crowns for which PPC was measured post-pruning. PPC for the pre-pruned tree crowns was estimated using the best-fit equations based on the post-pruned image and field data.
Figure 10.
Estimated PPC of the 89 pre-pruned tree crowns for which PPC was measured post-pruning. PPC for the pre-pruned tree crowns was estimated using the best-fit equations based on the post-pruned image and field data.

Figure 11.
Pre- and post-pruning differences in minimum, Q1, median, Q3 and maximum values for the 189 mapped lychee trees for tree crown perimeter, area, width, 90th percentile height, and PPC measured from the UAV imagery collected at 30 m height.
Figure 11.
Pre- and post-pruning differences in minimum, Q1, median, Q3 and maximum values for the 189 mapped lychee trees for tree crown perimeter, area, width, 90th percentile height, and PPC measured from the UAV imagery collected at 30 m height.

Figure 12.
Pre- and post-pruning differences for the 89 field assessed lychee trees for (a) tree crown perimeter; (b) tree crown area; (c) tree crown width; (d) 90th percentile tree crown height; and (e) PPC measured from the UAV imagery collected at 30 m height.
Figure 12.
Pre- and post-pruning differences for the 89 field assessed lychee trees for (a) tree crown perimeter; (b) tree crown area; (c) tree crown width; (d) 90th percentile tree crown height; and (e) PPC measured from the UAV imagery collected at 30 m height.


Figure 13.
(a) Pre- and post-pruning differences for the 189 field assessed lychee trees for the 90th percentile tree crown height, area, perimeter, width; and (b) PPC, as a function of flying height.
Figure 13.
(a) Pre- and post-pruning differences for the 189 field assessed lychee trees for the 90th percentile tree crown height, area, perimeter, width; and (b) PPC, as a function of flying height.


Table 1.
Overall, user and producer accuracies of the GEOBIA tree crown delineation assessed against manual delineation of 89 lychee trees.
Table 1.
Overall, user and producer accuracies of the GEOBIA tree crown delineation assessed against manual delineation of 89 lychee trees.
| Flying Height (m) | Overall (%) | User (%) | Producer (%) |
|---|---|---|---|
| 30 | 96.5 | 97.8 | 98.6 |
| 50 | 96.4 | 97.6 | 98.8 |
| 70 | 96.2 | 96.9 | 99.3 |
Table 2.
Root Mean Square Errors of mapped lychee tree crown height (90 percentile), width and perimeter for the 10 youngest trees assessed against field data, post-pruning.
Table 2.
Root Mean Square Errors of mapped lychee tree crown height (90 percentile), width and perimeter for the 10 youngest trees assessed against field data, post-pruning.
| Flying Height (m) | Tree Height (m) | Crown Width (m) | Crown Perimeter (m) |
|---|---|---|---|
| 30 | 0.3860 | 0.2280 | 2.5105 |
| 50 | 0.3934 | 0.2839 | 2.6700 |
| 70 | 0.6374 | 0.2604 | 2.3672 |
© 2018 by the authors. Licensee MDPI, Basel, Switzerland. This article is an open access article distributed under the terms and conditions of the Creative Commons Attribution (CC BY) license (http://creativecommons.org/licenses/by/4.0/).
Share and Cite
MDPI and ACS Style
Johansen, K.; Raharjo, T.; McCabe, M.F. Using Multi-Spectral UAV Imagery to Extract Tree Crop Structural Properties and Assess Pruning Effects. Remote Sens. 2018, 10, 854. https://doi.org/10.3390/rs10060854
AMA Style
Johansen K, Raharjo T, McCabe MF. Using Multi-Spectral UAV Imagery to Extract Tree Crop Structural Properties and Assess Pruning Effects. Remote Sensing. 2018; 10(6):854. https://doi.org/10.3390/rs10060854
Chicago/Turabian StyleJohansen, Kasper, Tri Raharjo, and Matthew F. McCabe. 2018. "Using Multi-Spectral UAV Imagery to Extract Tree Crop Structural Properties and Assess Pruning Effects" Remote Sensing 10, no. 6: 854. https://doi.org/10.3390/rs10060854
Note that from the first issue of 2016, this journal uses article numbers instead of page numbers. See further details here.