A Human Settlement Composite Index (HSCI) Derived from Nighttime Luminosity Associated with Imperviousness and Vegetation Indexes


1
State Key Laboratory of Resources and Environmental Information System, Institute of Geographical Sciences and Natural Resources Research, Chinese Academy of Sciences, Beijing 100101, China
2
State Key Laboratory of Remote Sensing Science, Institute of Remote Sensing and Digital Earth, Chinese Academy of Sciences, Beijing 100012, China
3
University of Chinese Academy of Sciences, Beijing 100049, China
4
Information Science Academy, China Electronics Technology Group Corporation, Beijing 100081, China
5
Department of Mathematics & Statistics, College of Art and Science, Boston University, Boston, MA 02215, USA
6
Jiangsu Center for Collaborative Innovation in Geographical Information Resource Development and Application, Nanjing 210023, China
*
Authors to whom correspondence should be addressed.
Remote Sens. 2018, 10(3), 455; https://doi.org/10.3390/rs10030455
Submission received: 13 February 2018
/
Revised: 2 March 2018
/
Accepted: 10 March 2018
/
Published: 14 March 2018
Abstract
:Satellite-derived nighttime light data have been increasingly used for studying urbanization and socioeconomic dynamics, because there are notable quantitative relationships between anthropogenic nocturnal radiance and the degree of human activity over time and space at different scales. When considering the visible impacts of saturation and over-glow effects from original nighttime light images, several composite indexes, which mainly include the introduction of vegetation index, have been studied to improve the application of nighttime light data for investigating the spatial patterns in human settlements. To overcome the shortcomings of previous composite indexes, especially in areas of highly intensified human activity, such as urban, non-man-made surfaces, and low density human activity, such as in rural residential sites, we propose a new human settlement composite index (HSCI). The establishment of this proposed HSCI is based on a combination of three different remote sensing datasets: nighttime light brightness (derived from the Defense Meteorological Satellite Program, DMSP), the normalized difference vegetation index (NDVI, derived from the Moderate Resolution Imaging Spectroradiometer, MODIS), and the percent impervious surface area (PISA, derived from the GlobeLand30 land cover and land use dataset produced from Landsat data). We defined the calculation of HSCI as the arithmetic mean of the normalized difference urban index and normalized difference imperviousness index with respect to both the magnitude of socioeconomic activity and the distribution of artificial surface across human settlement, respectively. Analysis results clearly demonstrate the utility of HSCI in delineating spatial patterns for different kinds of human settlement, particularly for identifying non-man-made surfaces in urbanized areas, various densities of human activities in peripheral areas and small human settlements in rural and remote areas. Our method and findings provide an effective way to investigate human settlements with a nighttime brightness-based composite index, as well as valuable insights into further studies of the composite index related to nocturnal luminosity data.
1. Introduction
Owing to the significant quantitative relations between nighttime light radiance (NTL) and several demographic and socioeconomic parameters over time and space, satellite-derived anthropogenic nocturnal luminosity data are used increasingly for estimating human activity related to urban expansion and socioeconomic development [1,2,3,4,5,6,7]. This data was previously provided by the Defense Meteorological Satellite Program (DMSP) [8] and is currently being derived from the Visible Infrared Imaging Radiometer Suite (VIIRS) on the Suomi National Polar-orbiting Partnership satellite (Suomi-NPP) [9,10,11,12,13,14,15,16]. Although there are some limitations in the spatial resolution, diffusion and saturation effects in comparison with VIIRS data, the long-term archive of DMSP nighttime light data is still an irreplaceable data source due to globally consistent observations for the development of human settlements and socioeconomic dynamics [17,18,19,20,21]. Nighttime light data generally have a notable advantage for investigating the total degree of human activity at the regional and country levels based on the positive and monotonic response of observed NTL to corresponding socioeconomic variables. However, using remotely sensed nocturnal radiance data to identify and characterize human settlements spatially remains a major challenge because of the lack of texture information for artificial lighting objects in current nighttime light images [22,23]. Therefore, previous studies of nighttime light data-based urbanization typically used land cover data to evaluate the accuracy of extracting nocturnal brightness signals in response to urbanized land spatial expansion. Some studies used the land cover map as a reference for partitioning the NTL local threshold algorithm for the delineation of urban extent based on nighttime light images [24,25,26,27,28]. In practice, there exists spatially conspicuous differences between nighttime light signals and visible or infrared remote sensing data across human settlements; the former is affected by artificial lighting sources at night and the latter is determined by the spatial arrangement of constructed facilities, vegetation, water bodies and other landscape objects [29]. Hence, for integration into a comprehensive index that reflects both the degree of human activity and characteristics of the land surface across human settlements, it is advantageous to use nighttime light data and other remote sensing images [30,31].
In recent studies, the normalized difference vegetation index (NDVI) has been used to improve DMSP by reducing the saturation effect of NTL and enhancing the spatial details of human settlements due to the negative relation between the vegetation index and urban impervious surface. A representative instance is that Lu et al. [32] proposed a human settlement index (HSI) by combing MODIS derived NDVI and DMSP to extract the distribution of residential sites, as follows:
where DMSP is normalized and NDVI is composed of MODIS products over the growing season using the maximum value composite method. Theoretically, for a given site in a human settlement, a large HSI value generally indicates locally intensified human activity, whereas the DMSP shows an increase in NTL and MODIS data show a decline in NDVI. When comparing results with high spatial resolution Landsat ETM+ data suggested that composited HSI can characterize the patterns of human settlement better than using only DMSP or NDVI. A practical problem for the application of HSI is that when DMSP NTL approaches zero in the dim light areas, HSI is mainly determined by NDVI. Thus, the estimated value of HSI for bare soil or water bodies with small NDVI values could be potentially higher than those in suburban or township areas. In particular, urban water bodies with low NDVI values and relatively high NTL values due to the over-glow effect of nighttime light signals could make a high HSI value even larger than those in central urban areas.
In particular, Zhang et al. [33] found that NDVI and radiance calibrated DMSP show a significant negative correlation in those areas where digital NTL reaches a saturated value. Hence, they developed a vegetation adjusted NTL urban index (VANUI) to reduce the saturation effect of DMSP, particularly for central urban areas:
where DMSP is normalized, and NDVI is the annual average used to reduce the seasonal and inter-annual fluctuations. Because the term of () typically reverses the spatial fluctuations in NDVI along the urban-rural gradient, VANUI can efficiently enhance the nighttime light signals in detail for central urban areas, as well as suppress nighttime radiances in the periphery of urban lands. However, VANUI still remains a challenge to use for areas like urban water bodies due to locally indistinguishable nighttime lights, which are primarily contributed by neighborhood activities. Liu et al. [34] proposed a normalized urban area composite index (NUACI), in which the normalized difference water index (NDWI) and enhanced vegetation index (EVI) are involved to eliminate the impact of water bodies when mapping impervious surface areas. The information regarding the magnitude of human activity are likely to be reduced for emphasizing impervious surfaces, and the calculation of NUACI could vary with the size and form of urban lands.
The primary objective of the present study is to develop a human settlement composite index (HSCI) for spatially delineating the patterns of human settlement to overcome the abovementioned limitations of previous composite indexes. An additional aim in this study is to improve the capability of nighttime light data for investigating human activity, with a more detailed look at combined artificial lighting signals and land cover information. HSCI is derived from DMSP nighttime light images in association with MODIS NDVI data and Landsat-derived percent impervious surface area (PISA) data. The HSCI origin will be explained in detail based on distinctive feature analyses of DMSP data and other two remote sensing datasets. The utility of HSCI for investigating human settlements will be demonstrated with comparisons of previous indexes at both local and regional scales.
2. Materials and Methods
2.1. DMSP Nighttime Luminosity Data
Annual cloud-free composited stable DMSP nighttime light products in 2010 (downloaded from https://ngdc.noaa.gov/eog/dmsp.html) was used for the study of HSCI and the demonstration of its application to match corresponding impervious surface area data. Original DMSP images consist of a 30 by 30 arc-second (approximately 1 by 1 km at the equator) gridded cell-based nocturnal luminosity, ranging from a digital number of 0 to 63 under the WGS84 coordinate reference system.
It is well documented that there exists over-glow (blooming or diffusion) and saturation effects from nighttime lighting in DMSP imagery [29,35,36]. The former is largely attributed to the low resolution of the sensors and the influence of the adjacent gird cells. The latter is because of the limited capability of the 6-bit quantization sensors, in which the high density nighttime brightness in areas with high density human activity generally exceeds the sensors’ collection range in a high-gain regime. Both of the effects can markedly affect the application of DMSP data for spatially characterizing human settlements.
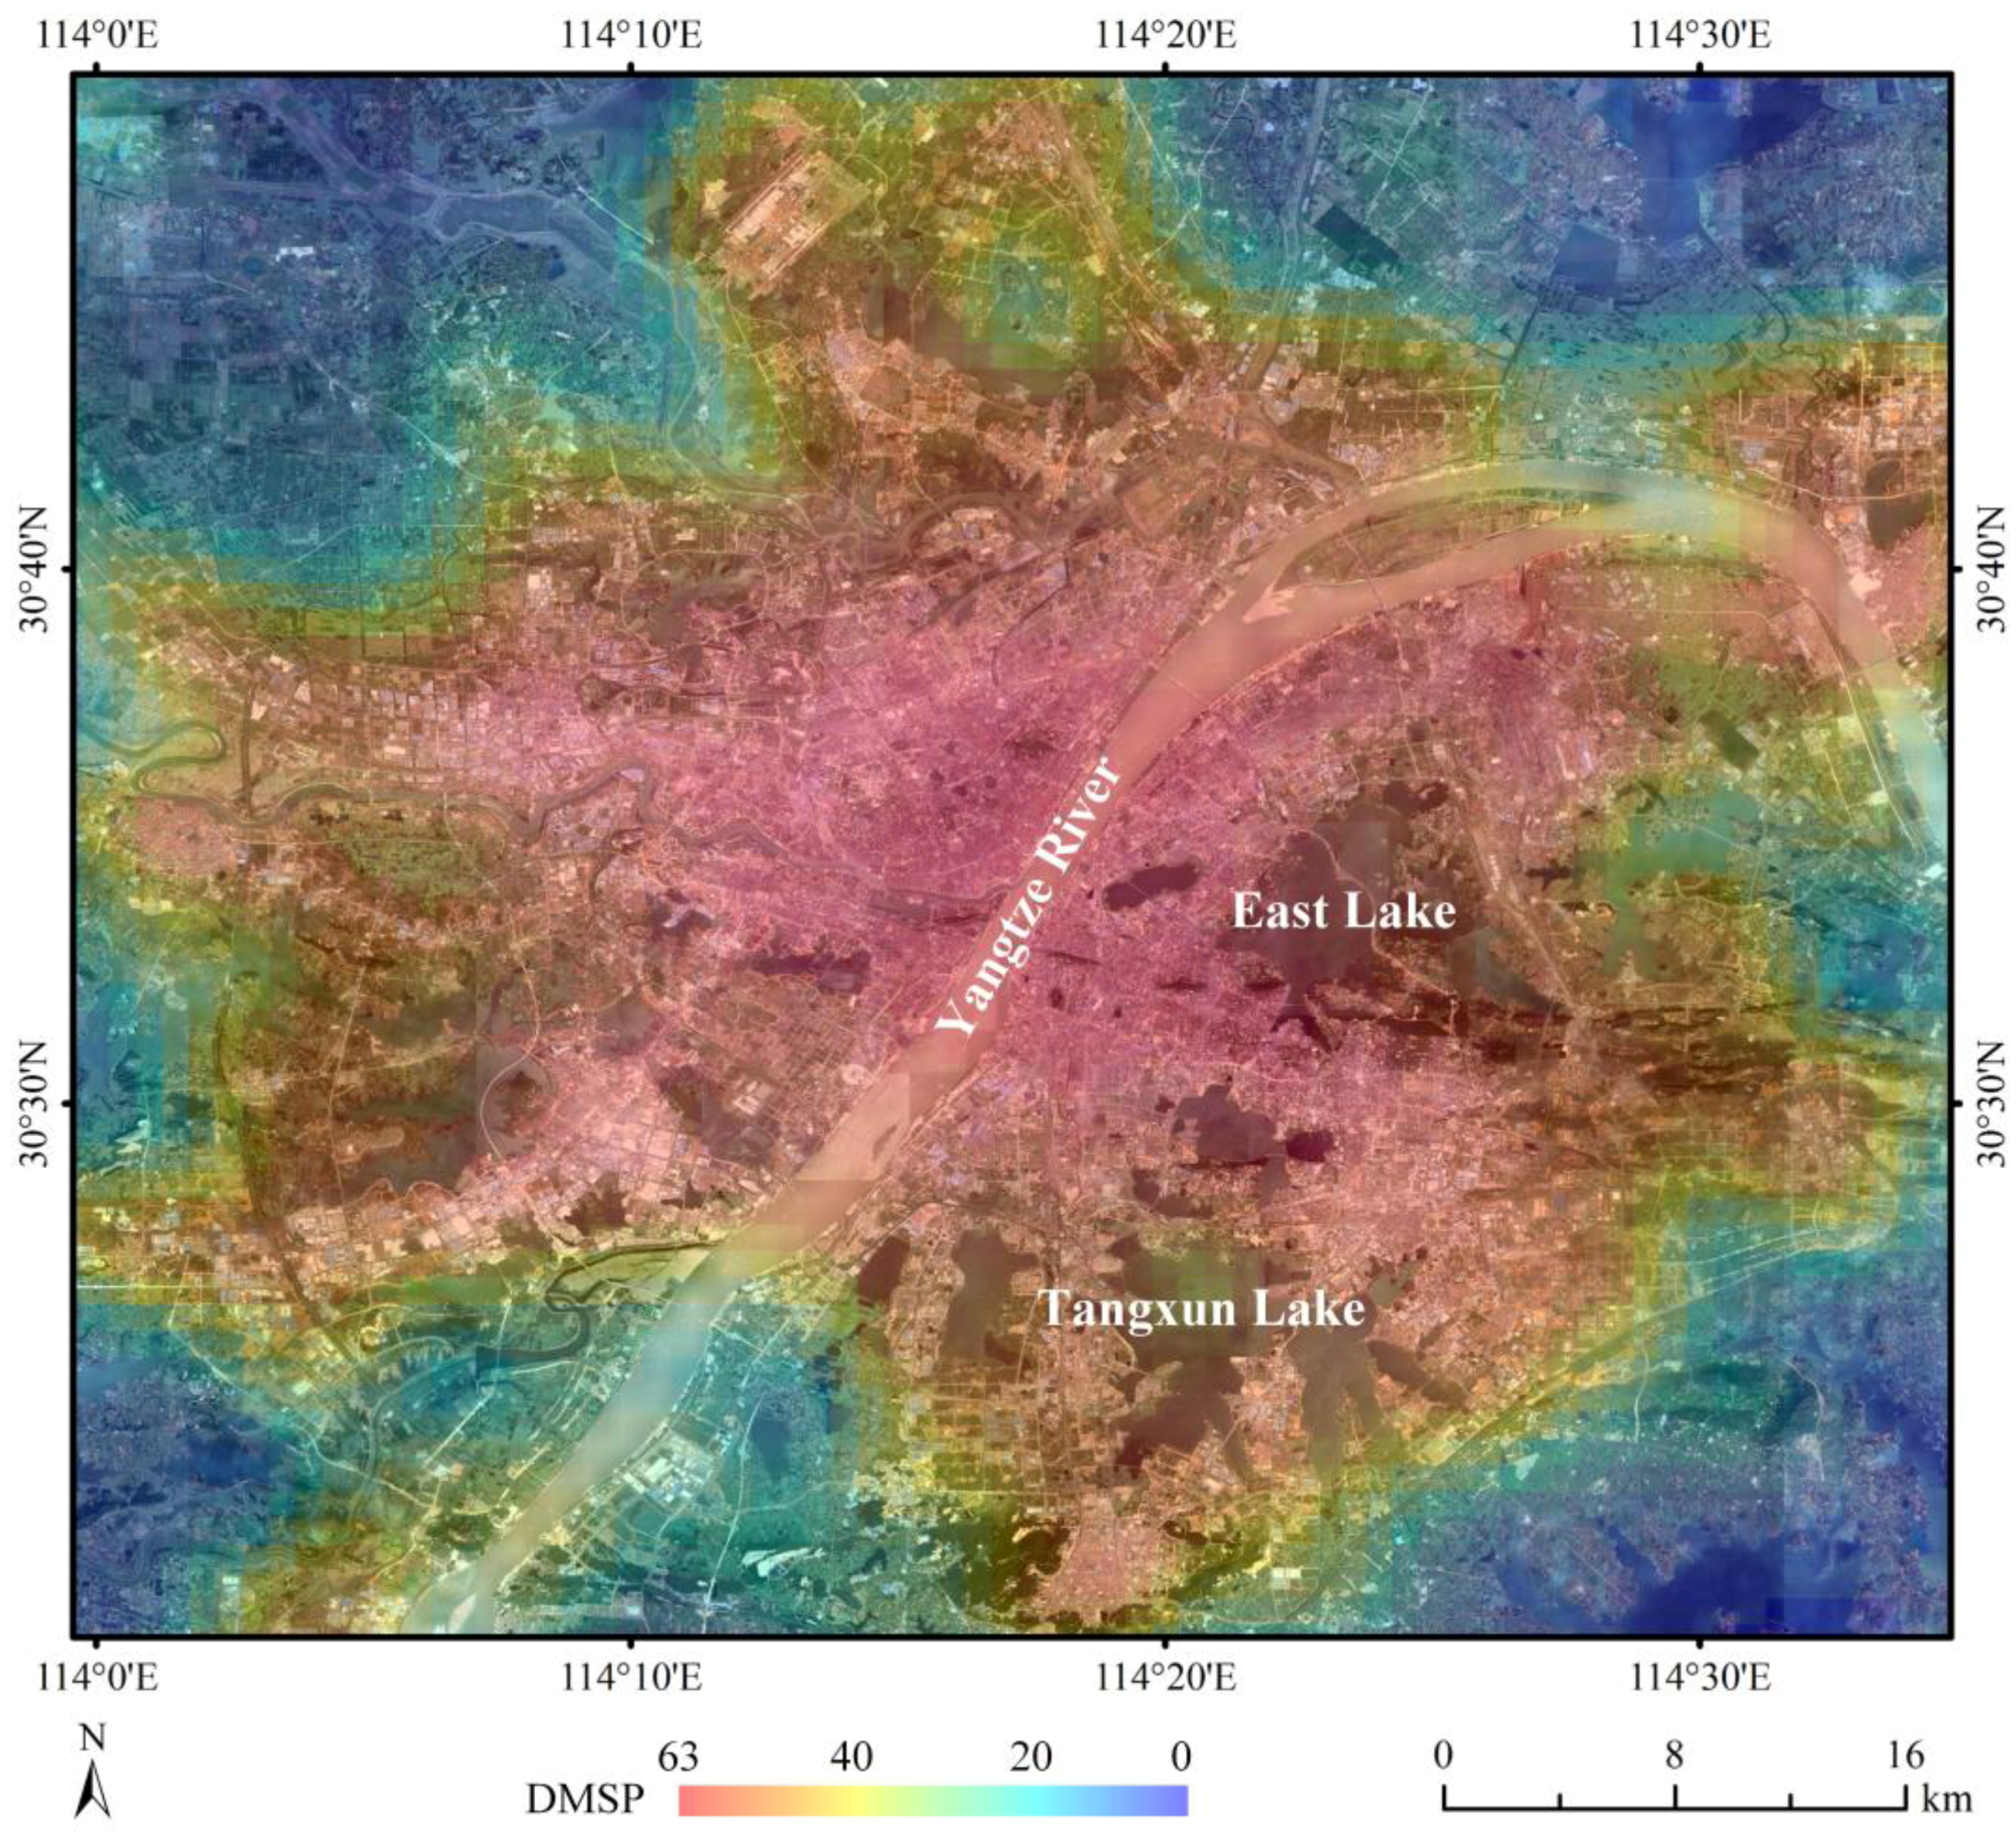
Figure 1 illustrates the diffusion effect by overlaying a translucent DMSP image on a Google Earth image for Wuhan. Empirically, we can find that most of the city’s impervious surfaces are spatially distributed within the red-highlighted area, which generally indicates intensified human activity. However, some red-highlighted areas that are located in the periphery of the city and yellow-highlighted areas with DN > 40 still contain lots of farmlands and woodlands. These findings imply that these lands are lit by the diffused nighttime lights and cannot be connected to the degree of socioeconomic activity. Moreover, the Yangtze River and inland lakes located in the urbanized land area are also lit by the neighborhood nighttime lighting sources. In practice, these areas are completely indistinguishable from nighttime light images due to the over-glow effect directly causing false urbanized pixels, which would result in an overestimate of urbanized lands and a loss of detailed human settlement information.
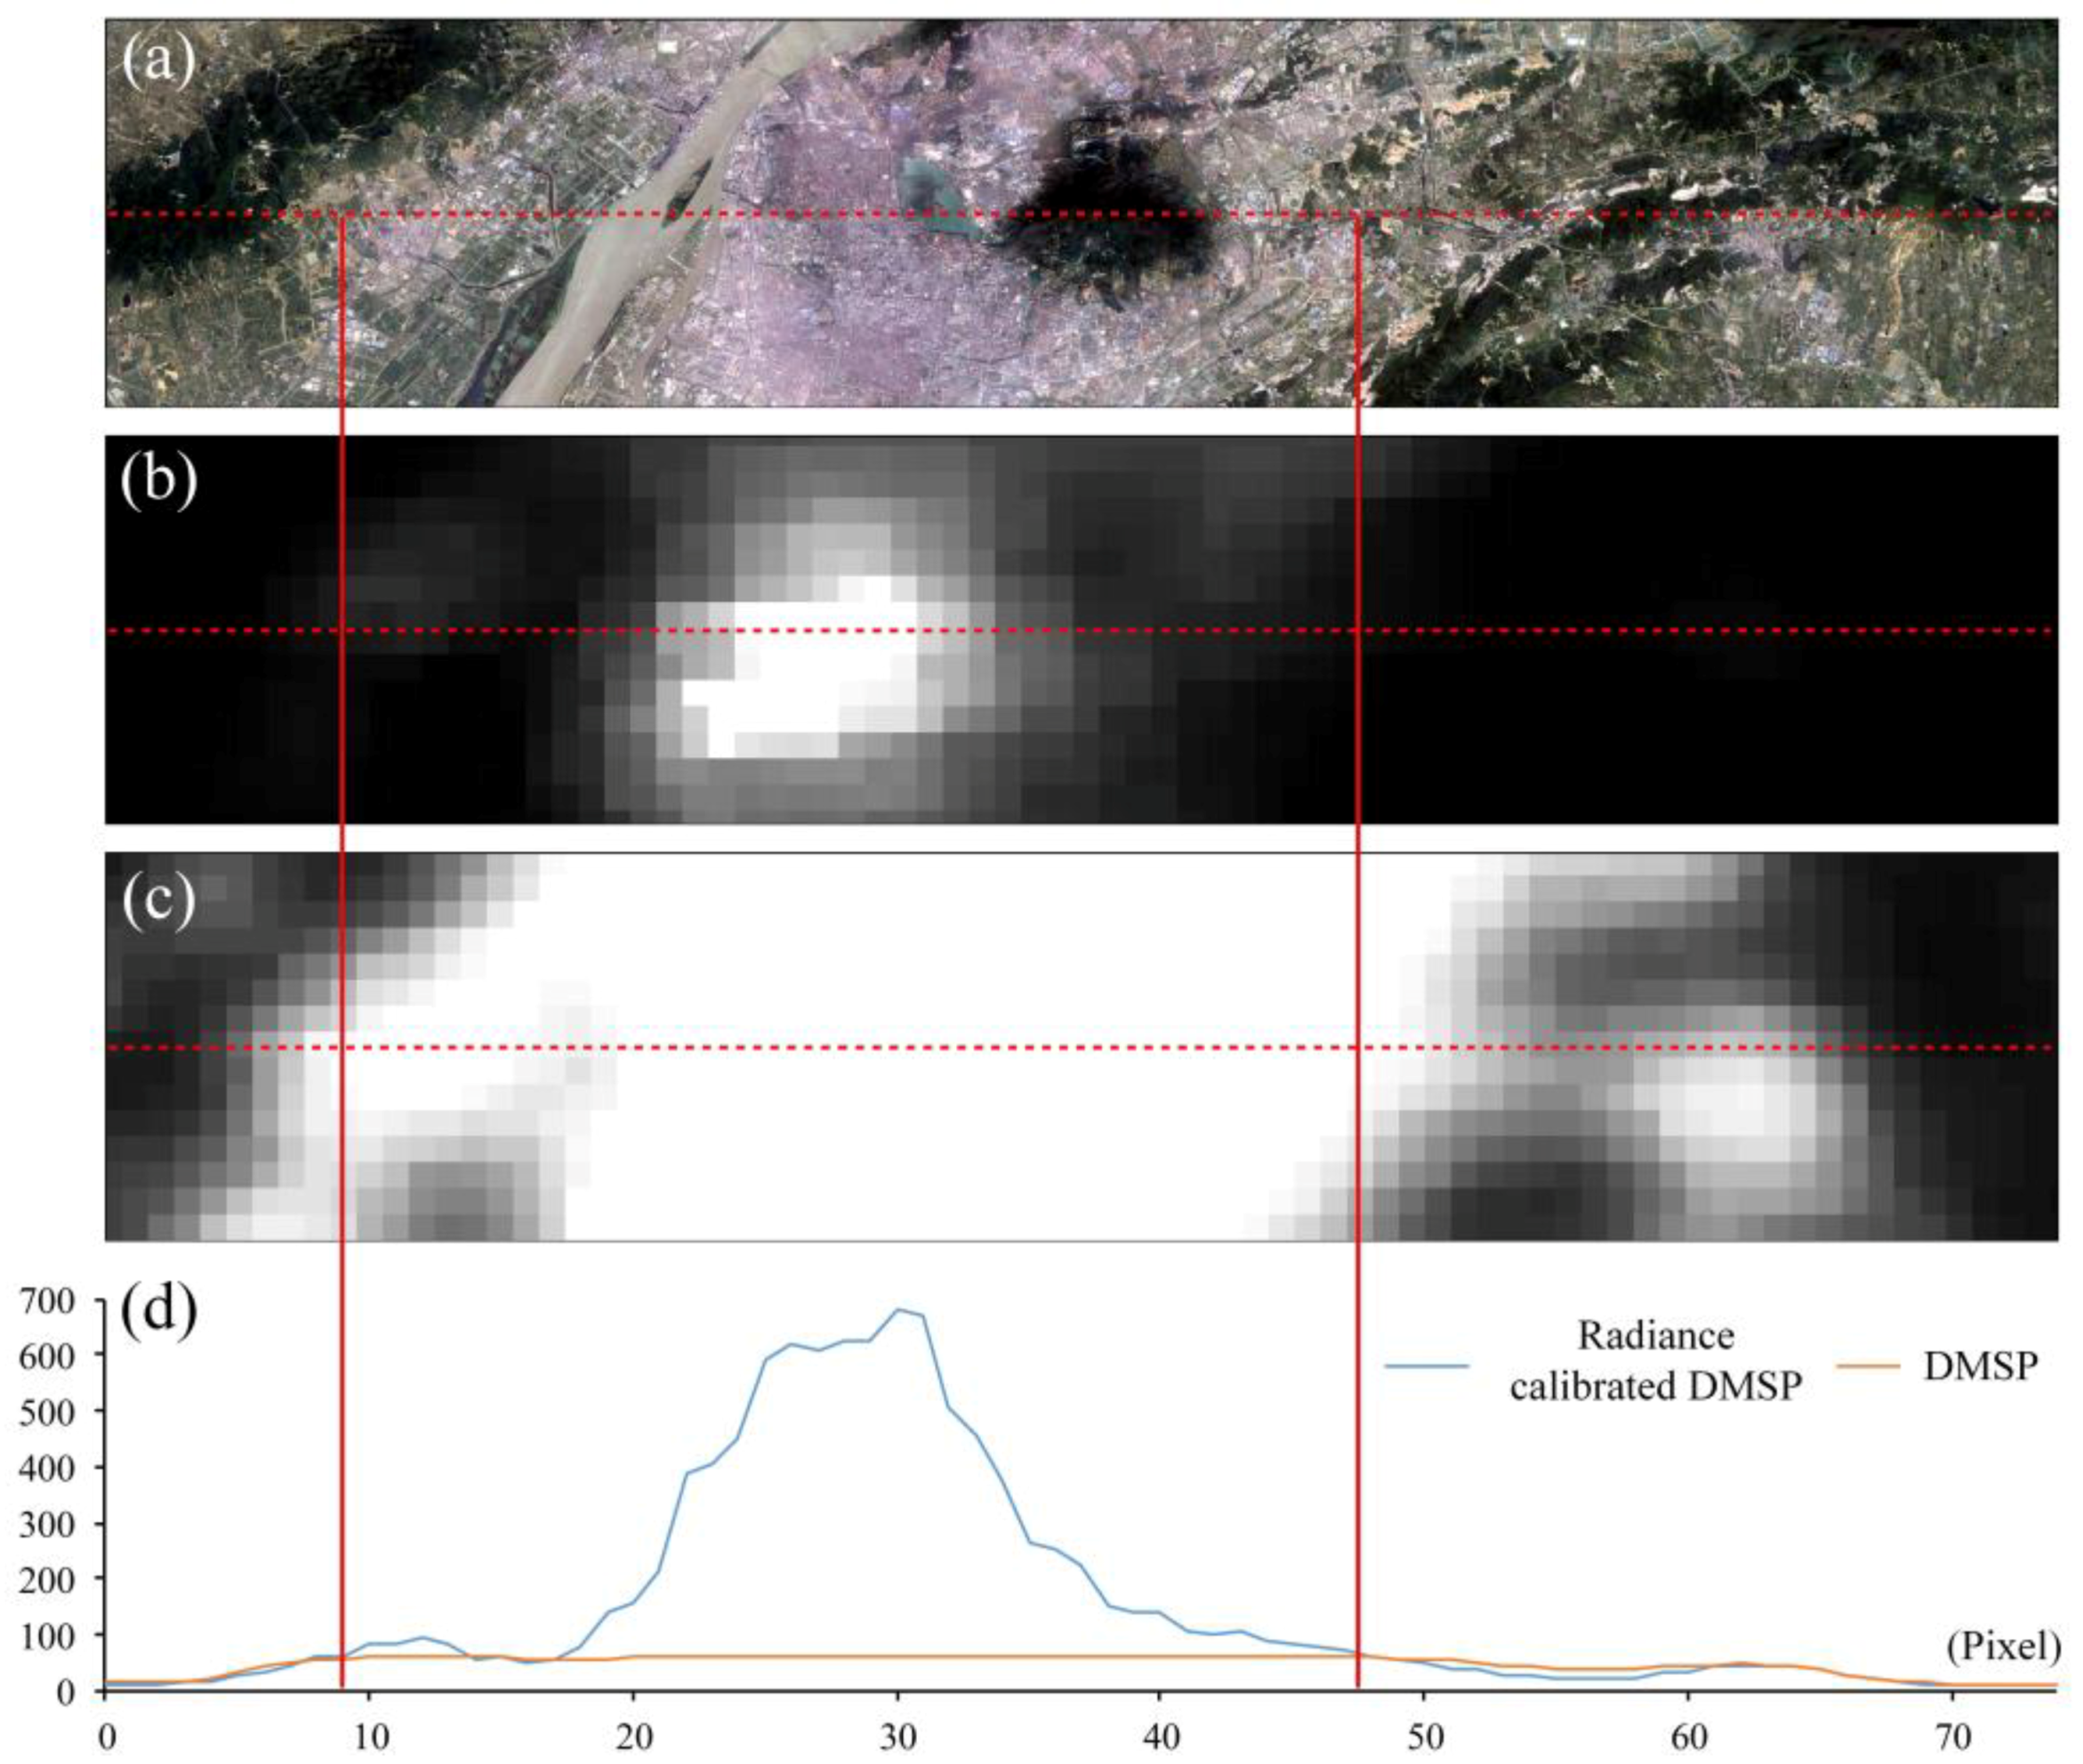
The saturation effect in the DMSP images is demonstrated in Figure 2 through a longitudinal cross-section comparison in Nanjing. The radiance calibrated NTL indicates that there are conspicuous fluctuations in nightlight brightness surrounding the urban center in response to spatial variations of human activity. Moreover, the reduced local NTL differences in the original DMSP images, which are crucially important for identifying various human activities across the settlement, can markedly impact the utility of nighttime light data.
Despite these shortcomings, long-term DMSP data time series still play an irreplaceable role in relative studies due to the globally consistent and timely observations of diverse human activities with significantly quantitative connections to several variables of urbanization and socioeconomic dynamics. Therefore, using ancillary data with spatially explicit information regarding land covers to enhance the heterogeneity of NTL, responding to diverse degrees of human activity over inter and intra-urban lands is desirable for further applications of DMSP nighttime light images.
2.2. Vegetation Index Data
NDVI data that were used in this study are derived from MODIS land data products. Monthly NDVI data at 1 km spatial resolution were obtained using daily NDVI data based on the maximum value composite method [37]. To reduce the effect of seasonal and monthly variations in NDVI across the whole country, we used the average monthly NDVI over the growth period (from May to October) for the subsequent calculation of the human settlement composite index (HSCI). It is well documented that the NDVI value for water bodies is typically a smaller positive or negative value [38], and bare soils generally range from about 0.2–0.3. Owing to the complex component materials, there is no a fixed range of NDVI for urbanized lands. In general, NDVI is usually low and decreases as the proportion of impervious surface increases. NDVI values among urbanized lands, bare lands, and water bodies are relatively close, and thus, these lands are quite difficult to distinguish in mixed pixels. Therefore, we should pay attention to this problem during the construction of HSCI, in which NDVI is used to improve DMSP nighttime lighting signals.
2.3. Impervious Surface Area Data
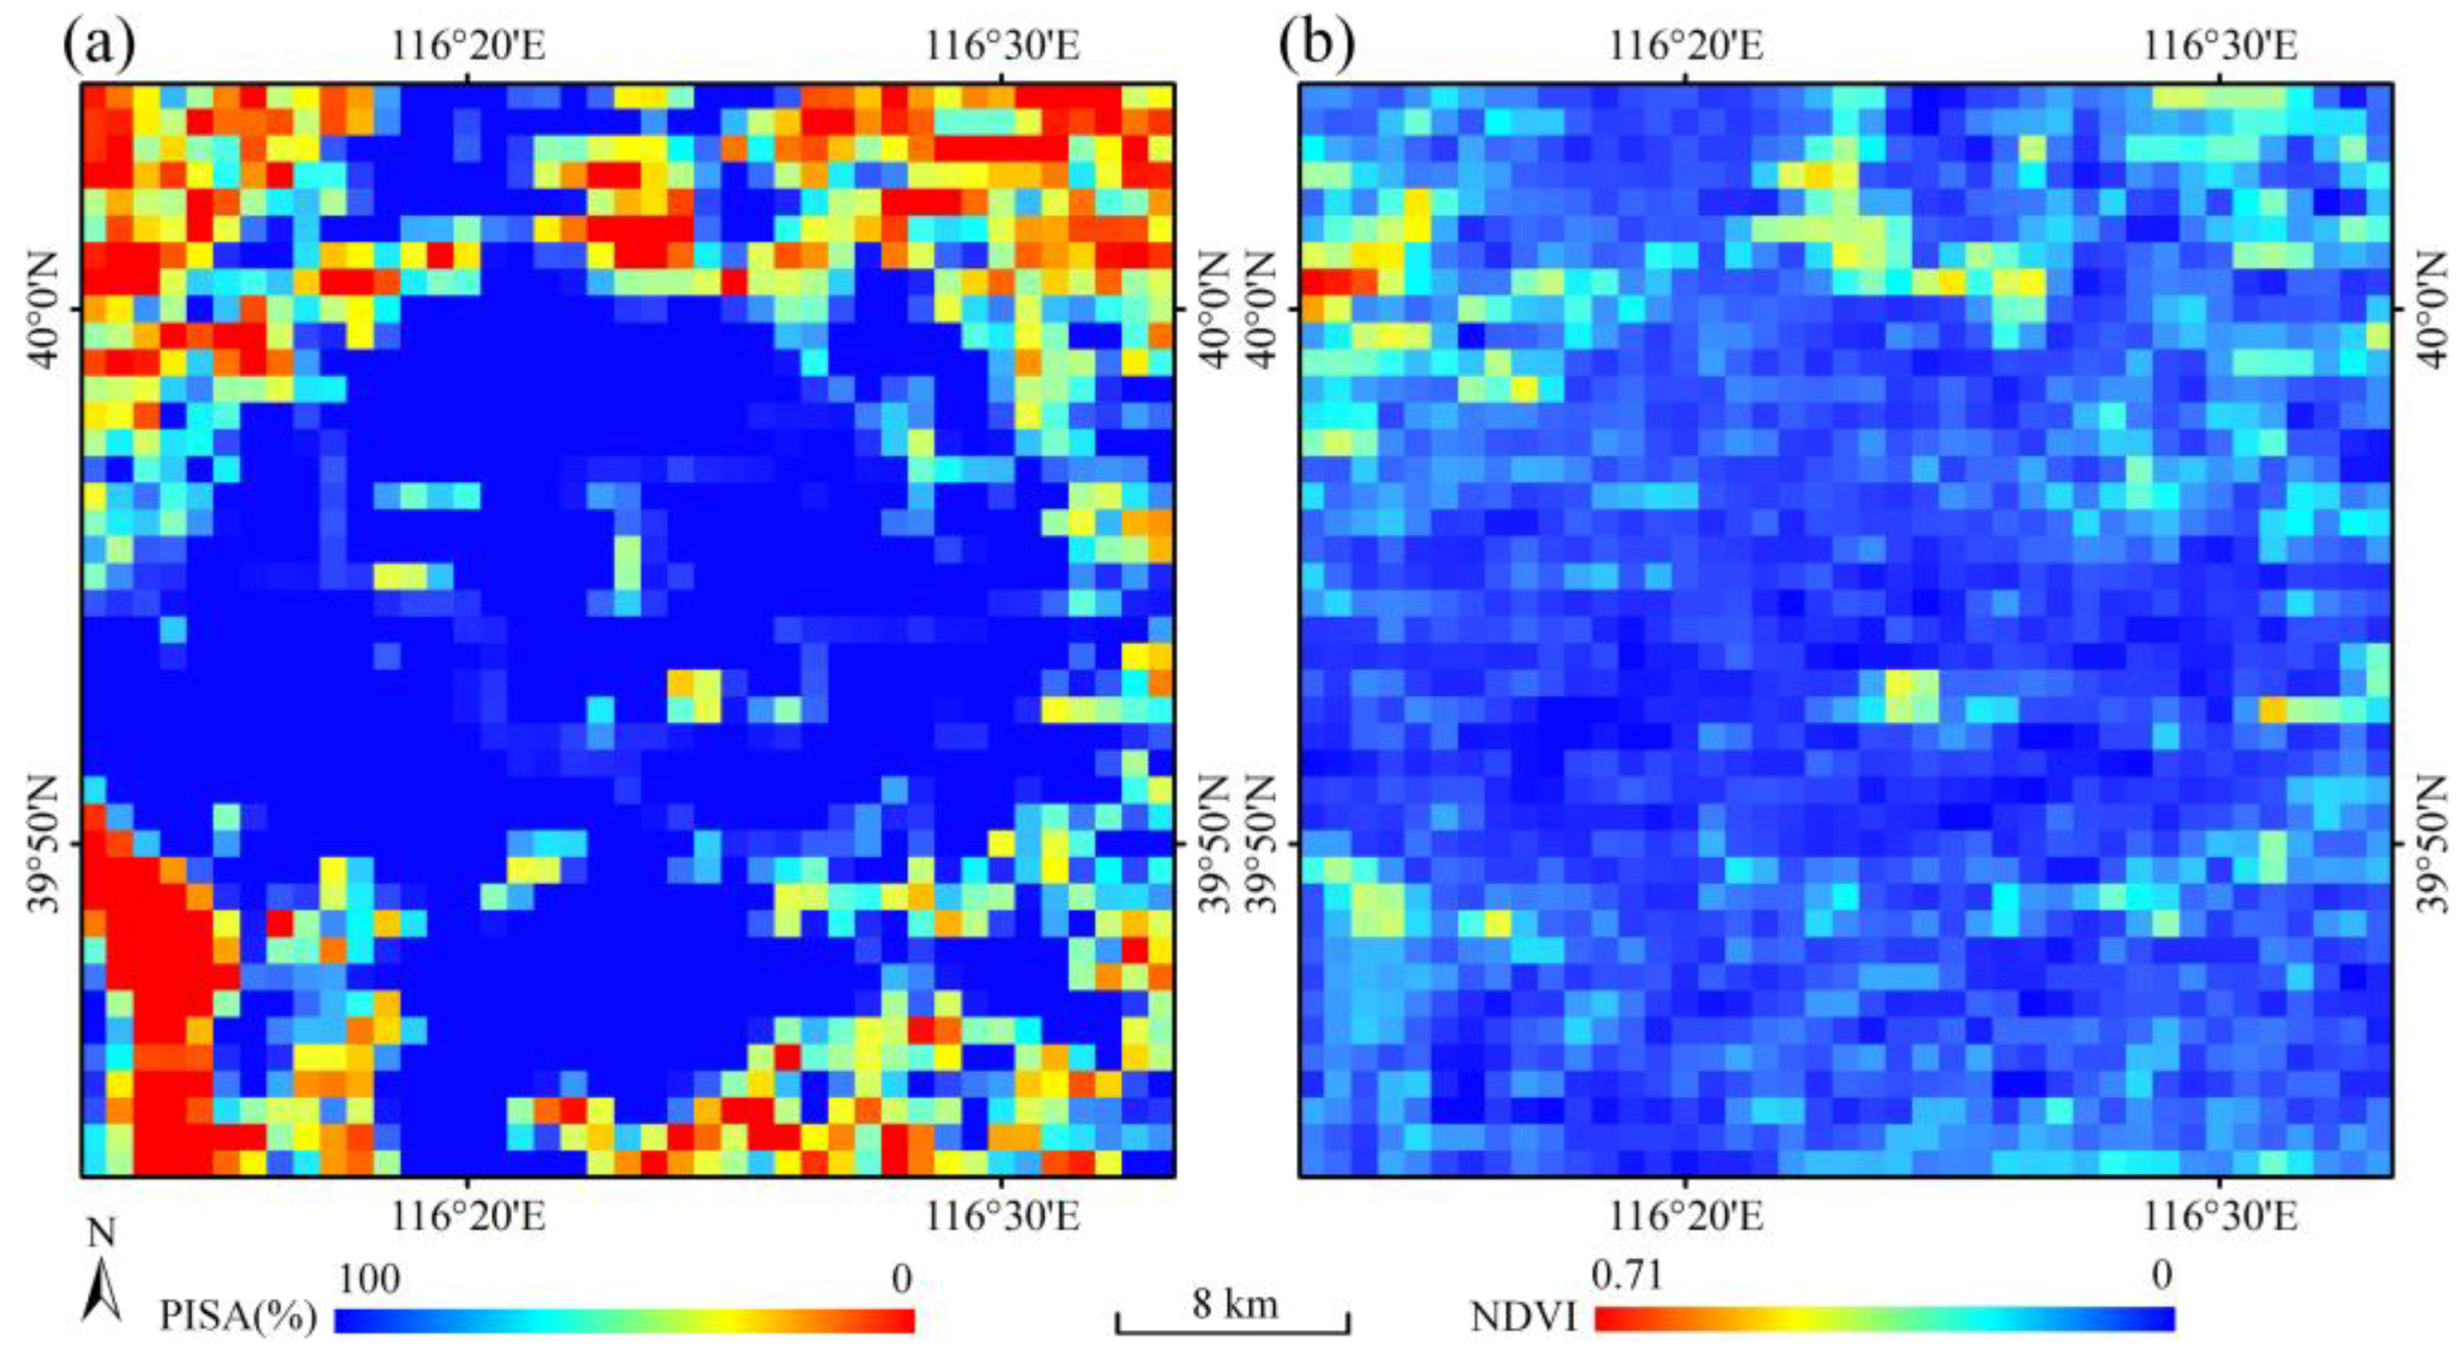
To overcome the abovementioned difficulties and to increase the utility of HSCI in investigations of human settlements with diverse features of land cover and human activity, we introduce impervious surface area data in the human settlement composite index computation. The percent impervious surface area (PISA) data are derived from GlobeLand30 land cover and land use datasets with 30 m spatial resolution from Landsat Thematic Mapper (TM) and Enhanced Thematic Mapper Plus (ETM+) images [39], in which man-made surfaces include roads, roofs, parking lots, and other artificial surfaces (available at http://globallandcover.com/GLC30Download/index.aspx). Although PISA can provide a quantitative estimate for the degree of anthropogenic disturbance in land cover related to socioeconomic activities [40,41], there remains the saturation effect, which is especially apparent in urbanized areas with high densities of human activity. Figure 3a shows that the distribution of nearly saturated PISA around the central area of Beijing forms an approximately homogeneous region, in which differences in the degree of local human activity are not shown by PISA. In contrast, NDVI signals show conspicuous variations across the same region (see Figure 3b), and hence, this can provide correction information to saturated DMSP signals. The major utility of impervious surface area data for HSCI is that less impervious or non-impervious surface areas can be explicitly identified in PISA images, which are typically less distinguishable in both the NDVI and DMSP images. The combination of three different kinds of remote sensing derived datasets with distinct features should benefit the human settlement composite index utility for characterizing human settlements.
2.4. The Calculation of Human Settlement Composite Index (HSCI)
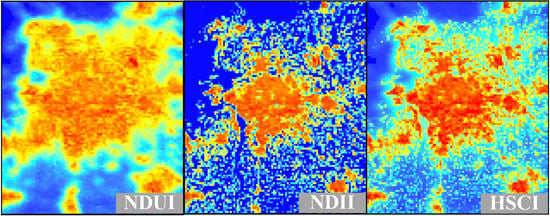
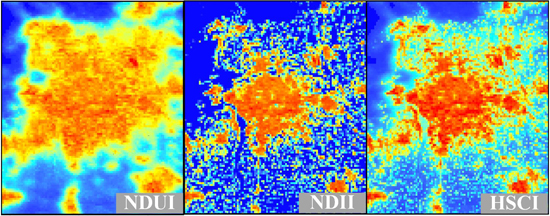
Considering the concerns regarding different kinds of data sources, which was addressed above, the construction of HSCI is based on the combination of normalized DMSP, NDVI and PISA. The calculation of HSCI starts with the normalized difference urban index (NDUI) proposed by Zhang et al. [31] as follows:
To introduce impervious surface area to HSCI, we further construct the normalized difference imperviousness index (NDII) as follows:
Thus, HSCI is obtained by averaging NDUI and NDII:
Substituting Equations (3) and (4) into Equation (5) yields the following:
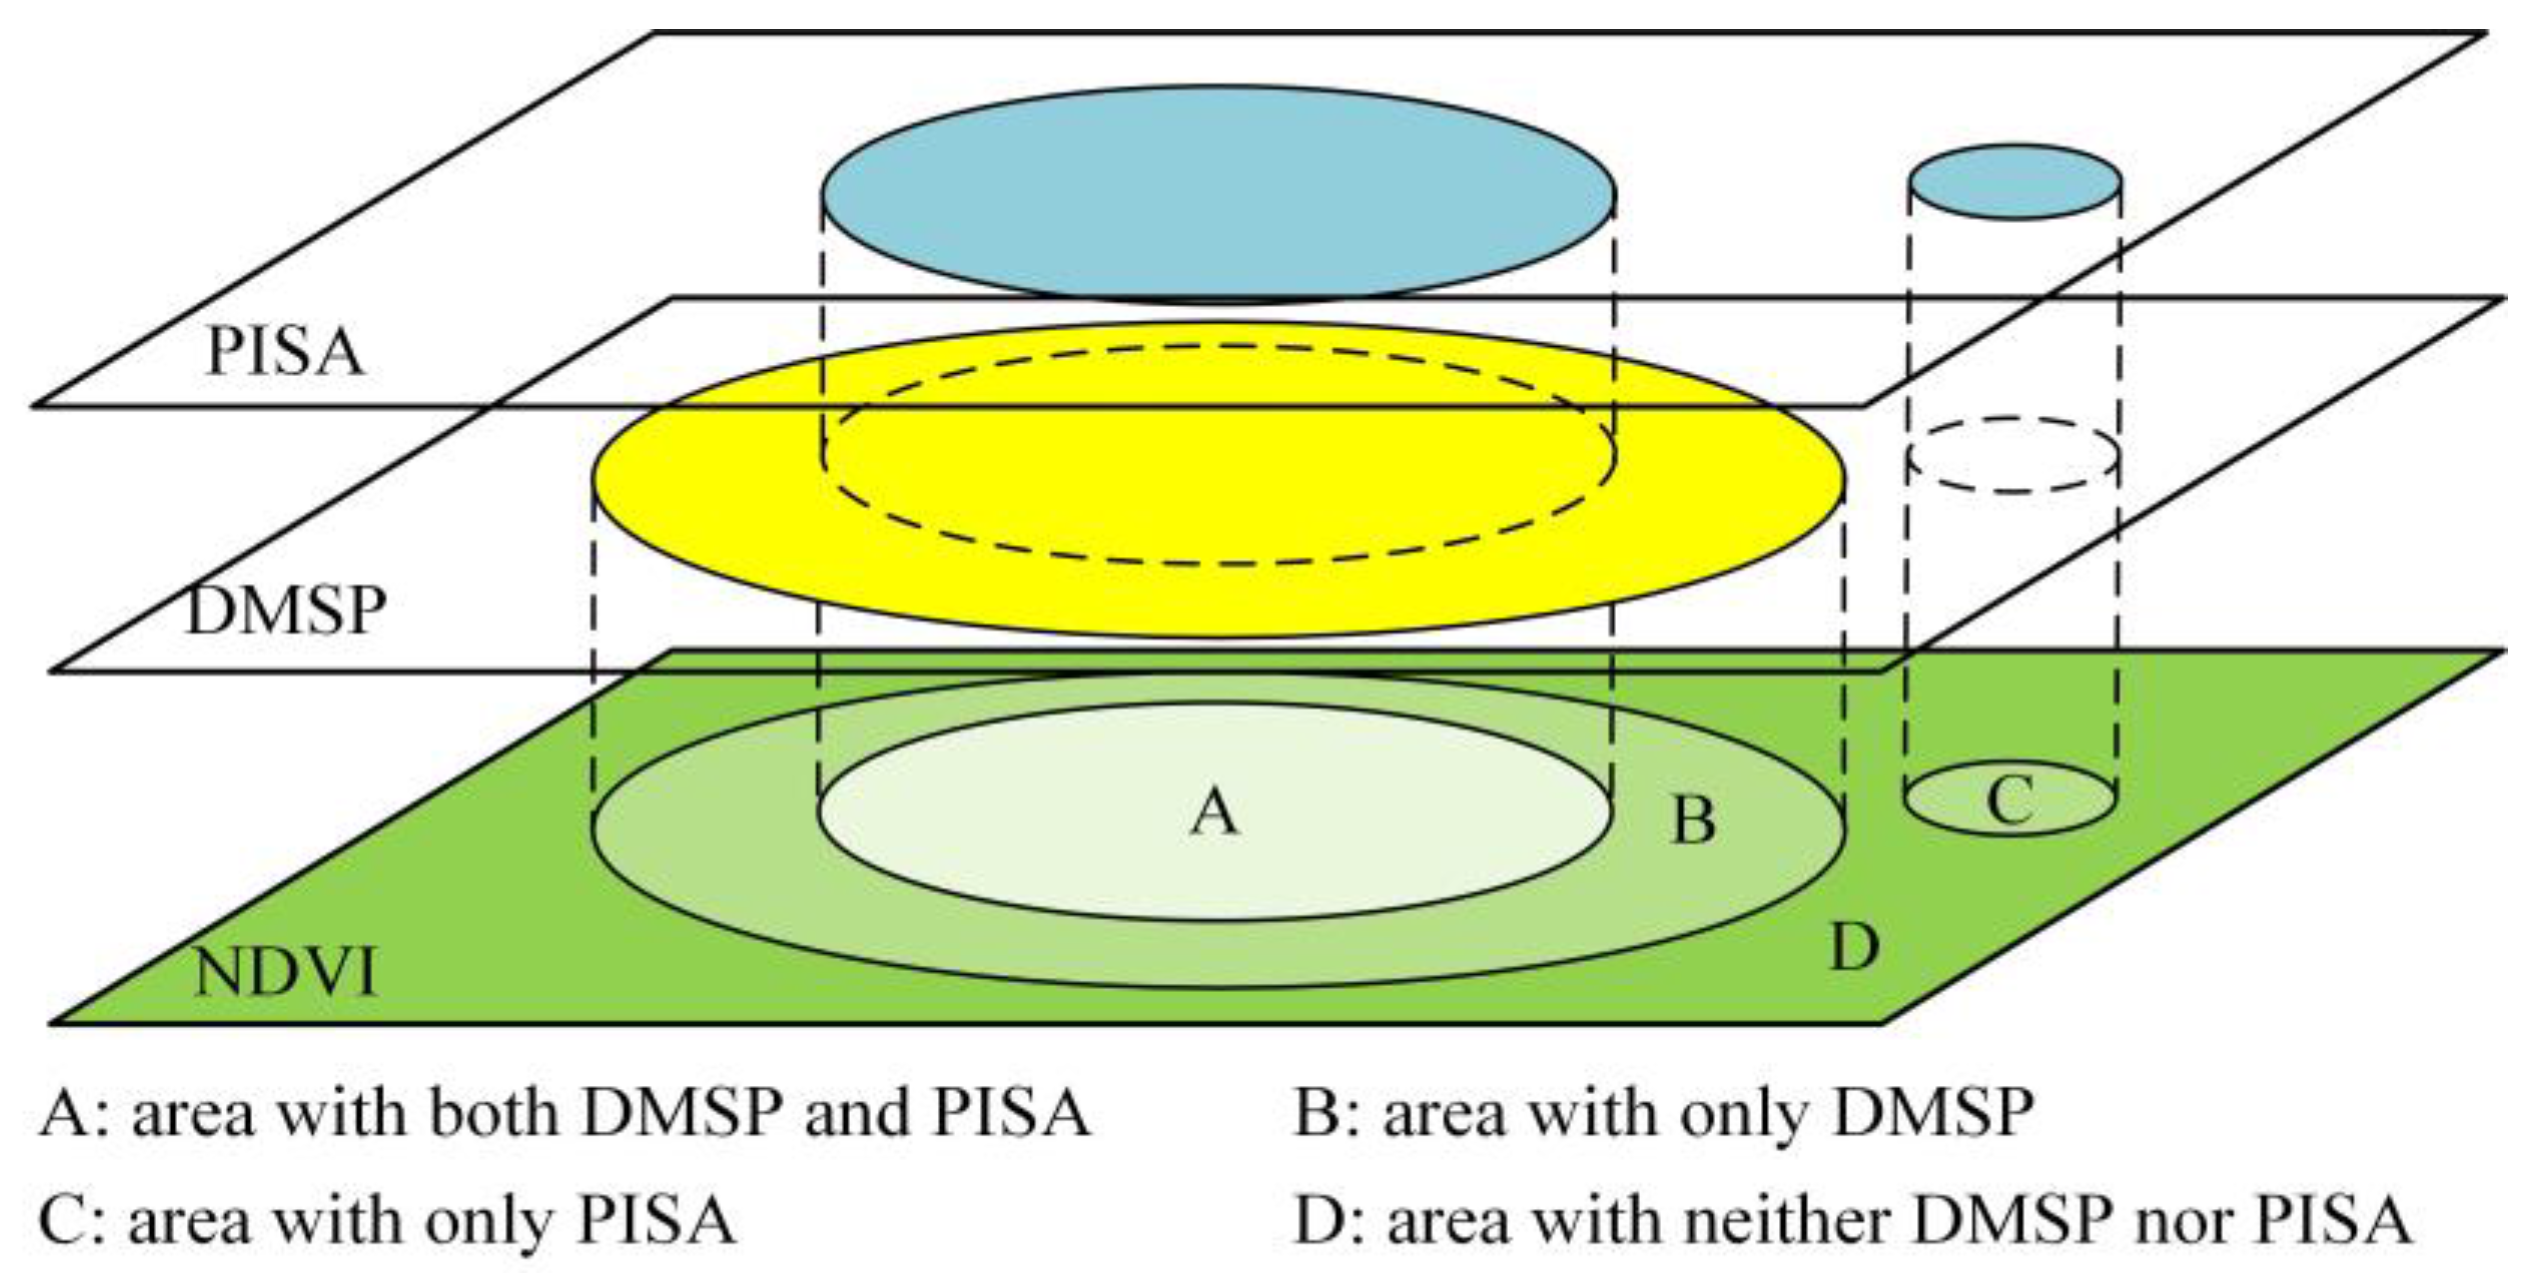
Here, HSCI is normalized into [0, 1] from the original range of [−1, 1] for convenience in subsequent analyses. In general, HSCI is positively correlated with both DMSP and PISA, it is and negatively correlated with NDVI. By incorporating the vegetation index and impervious surface data into the nighttime brightness, HSCI can offer notable improvements in the delineation of human settlements, which mainly include the reduced diffusion effect, declined saturation effect, enhanced heterogeneity of multi-sourced signals, and increased capability of water bodies and bare lands, especially for the central area of the city. Figure 4 illustrates the theoretical features of HSCI for different types of land areas, which mainly include the following: (1) for type A, which consists of both lighting and impervious surfaces and appears to occur in urbanized areas, HSCI will trend toward 1 with rapidly decreased NDVI; (2) for type B, which has lighting signals, no impervious surface and is usually linked to peripheral areas of the city or water bodies, negative NDII (nearly −1) can suppress the lighting diffusion of DMSP after being averaged with NDUI, and thus, HSCI typically ranges from 0 to 0.5 for such areas; (3) for type C, which has an impervious surface, no or less lighting signals and is commonly located in rural areas with low densities of human activity, negative NDUI and NDII can result in relatively lower HSCI when compared to those areas with the same PISA in urbanized lands; and, (4) for type D, which does not have a lighting signal or impervious surface area and appears to occur in remote lands with much less human disturbance, the HSCI value is expected to be approximately zero.
3. Results and Discussion
3.1. Fundamental Characteristics of HSCI
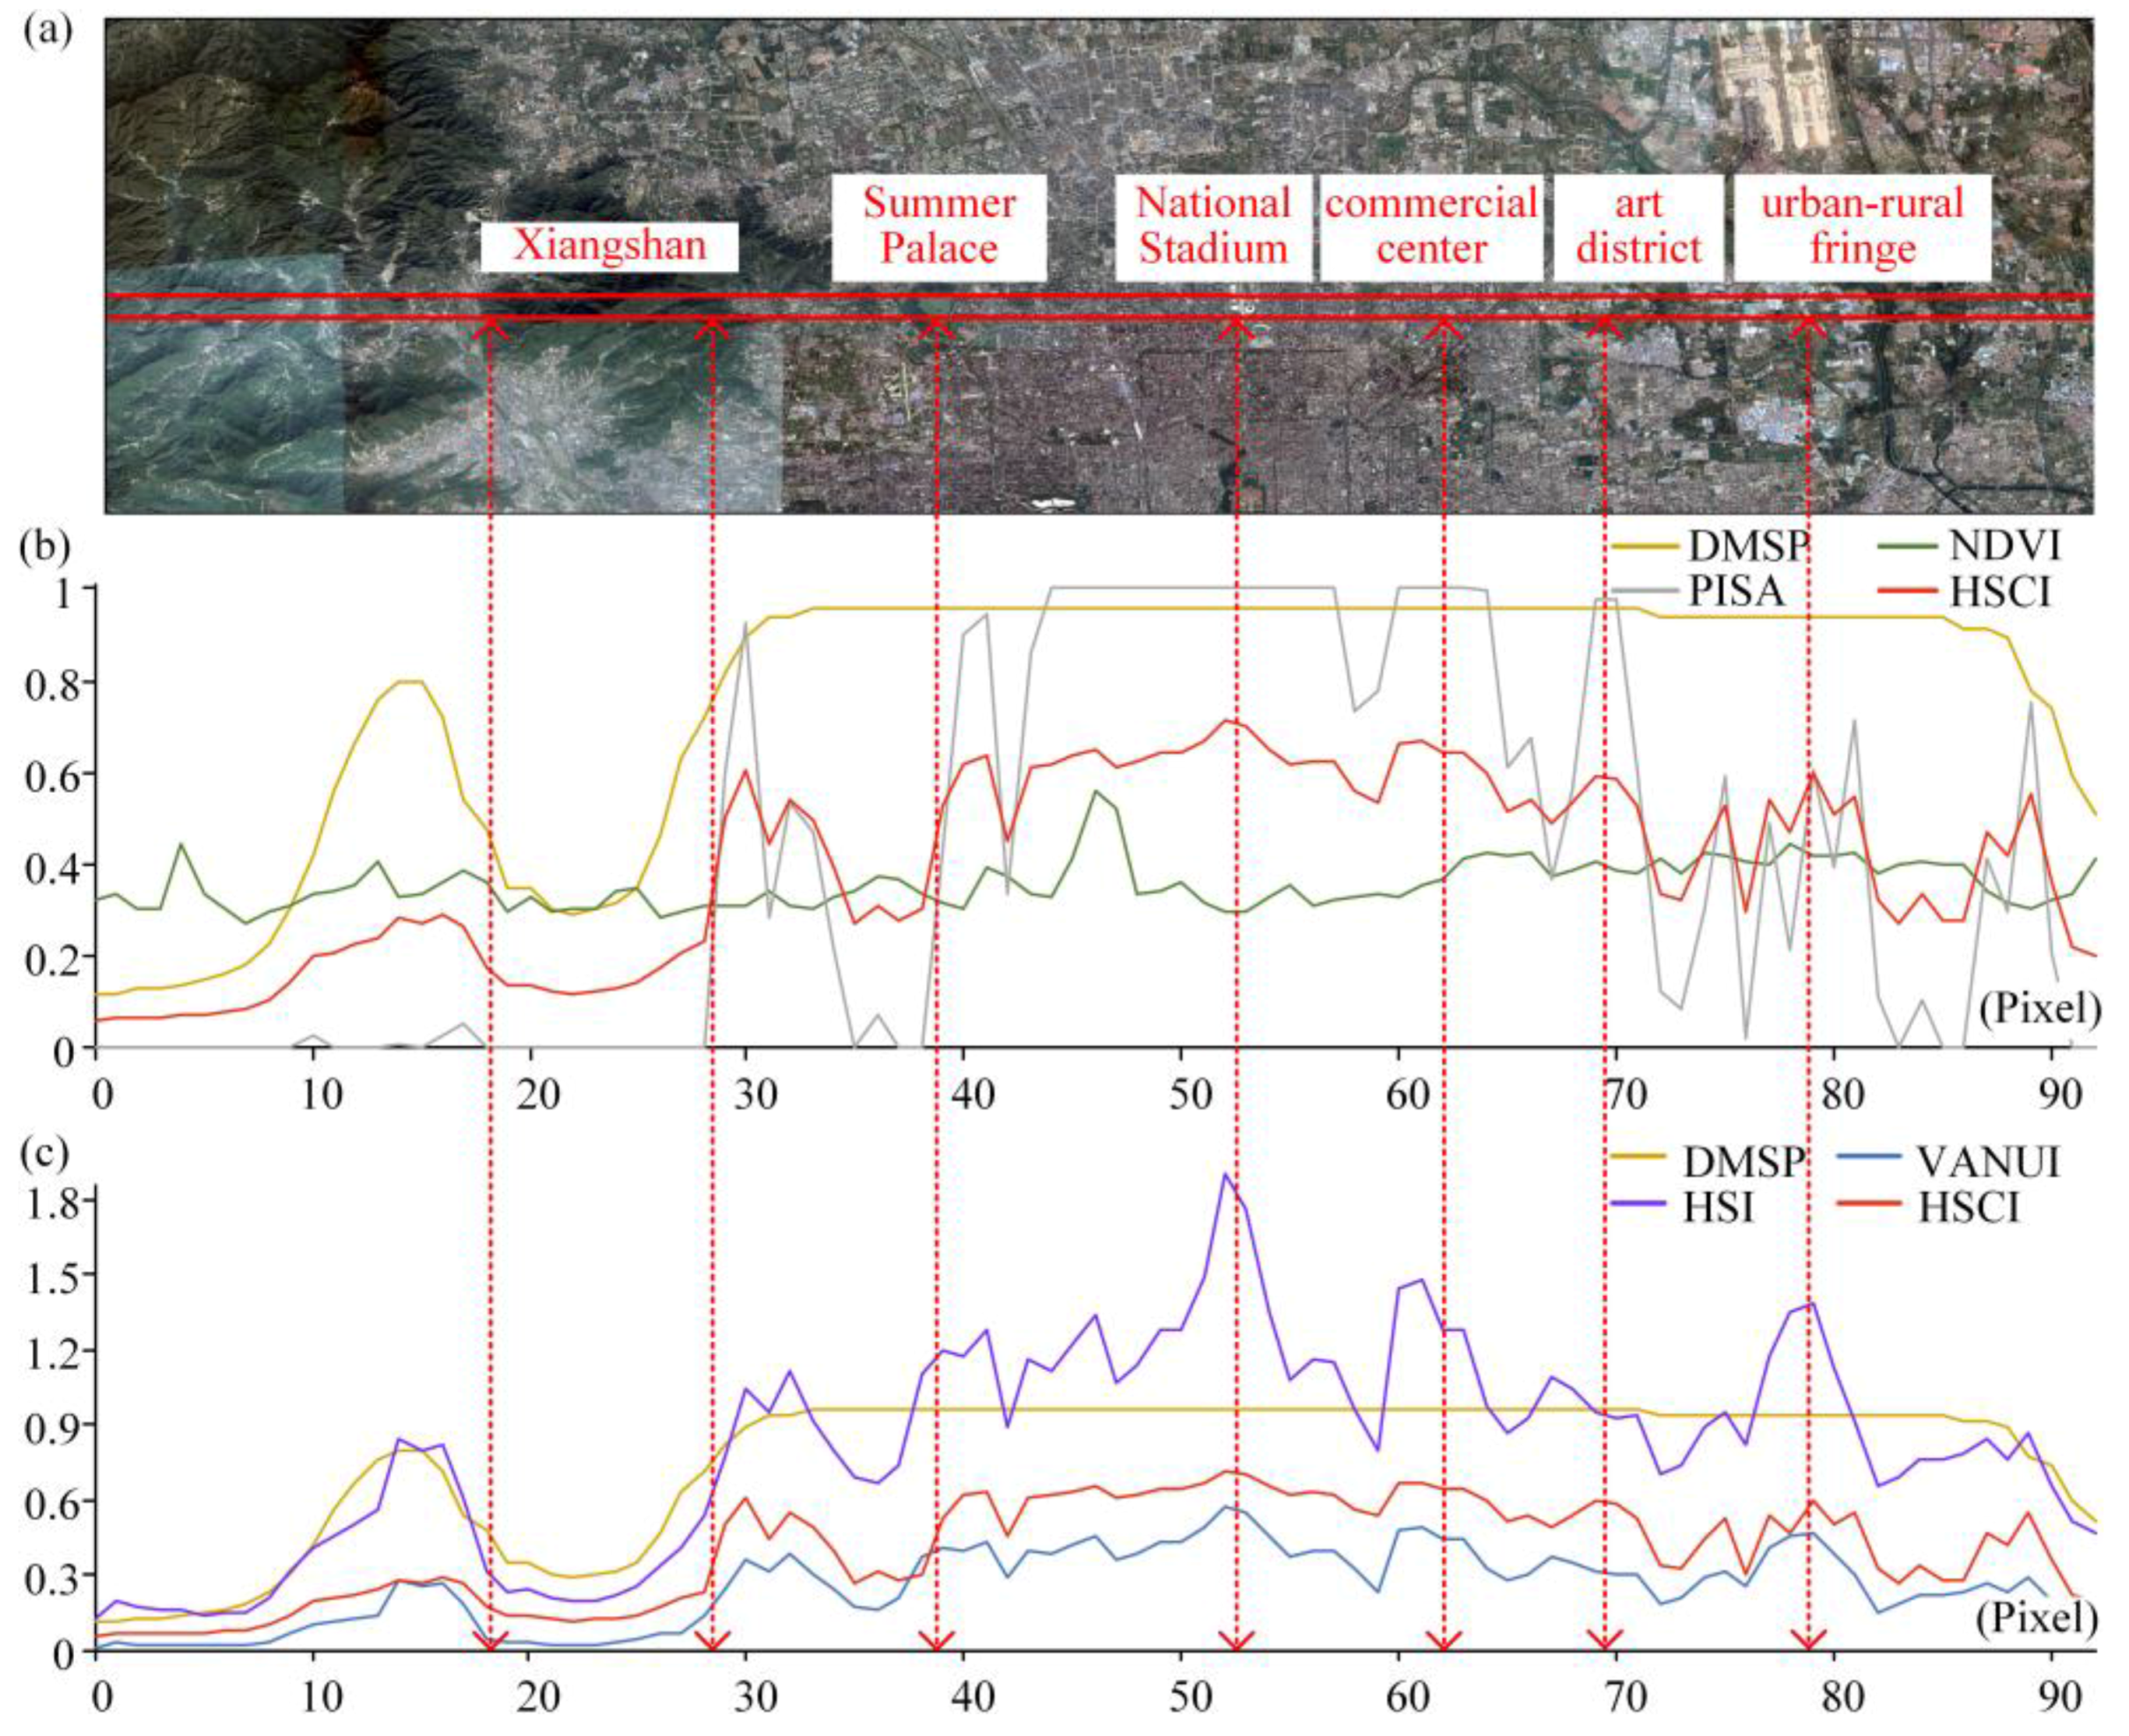
Human settlement refers to communities inhabited by human beings, and ranges from urban, township, village, and any place where human beings live and work. To examine the utility of HSCI for spatially delineating the patterns of human settlement, two typical DMSP and NDVI derived indexes, HSI (Equation (1)) and VANUI (Equation (2)), are involved in a comparative analysis. Figure 5 exhibits pixel-level fluctuations in original signals (DMSP, NDVI, and PISA) and three composite indexes (HSCI, HIS, and VANUI) along a longitudinal transect in Beijing. This longitudinal transect is representative of diverse land covers and different degrees of socioeconomic activities across the urban-rural gradient (Figure 5a).
As shown in Figure 5b, saturated DMSP lighting signals from Xiangshan to the east urban-rural fringe cannot be used for distinguishing the degree of socioeconomic activities in these areas. The value of PISA changes more drastically throughout the longitudinal transects, and it shows a marked drop near the Summer Palace, golf course, and green belt, respectively. NDVI signals with spatial fluctuations could be employed to compensate for the deficiencies in both DMSP and PISA in HSCI. In parts of urbanized areas with saturated DMSP signals, PISA can be used to portray the local differences in the density of human settlements in HSCI. While both DMSP and PISA signals reach the maximum value in urbanized areas, local changes in relatively high HSCI are mainly determined by fluctuations in NDVI, which likely occur around the high density human activity area of the National Stadium. Under the effect of PISA, there are two small peaks in HSCI values near the commercial center and art district (labeled in Figure 5a), both of which are in urbanized areas and have experienced extremely high density human activities locally. In the urban-rural fringe, HSCI decreases and greatly fluctuates, which reflects the fact that the urbanization activities in these areas are intense, and the development is unbalanced. Moreover, HSCI shows conspicuously local fluctuations in the urban-rural fringe, which could imply a clumped distribution of dense human activity in the urban-rural transition zone. Overall, the HSCI index combined three different kinds of remotely sensed data in order to maintain the spatial trends in the DMSP signals in the urban periphery and rural areas, as well as to improve the saturation effect of DMSP signals in urbanized areas.
By comparing HSCI with VANUI and HSI (see Figure 5c), we find distinct similarities and differences among these three indexes for delineating patterns of human settlement. Although different in the calculation, VANUI and HIS commonly show a similar trend along the longitudinal transect, owing to the joint effect of NDVI and DMSP. By contrast, HSCI can present more detailed observations of human settlement than VANUI and HSI due to the introduction of PISA signals, such as around the Summer Palace and art district. Furthermore, HSI might overestimate the magnitude of human activity if the NDVI signal approaches zero (e.g., the area around the National Stadium), and an underestimation could be generated by VANUI, while NDVI is relatively high, especially in the urban-rural fringe, due to the lack of man-made surface information in both composite indexes.
3.2. HSCI-Based Spatial Delineations of Human Settlements
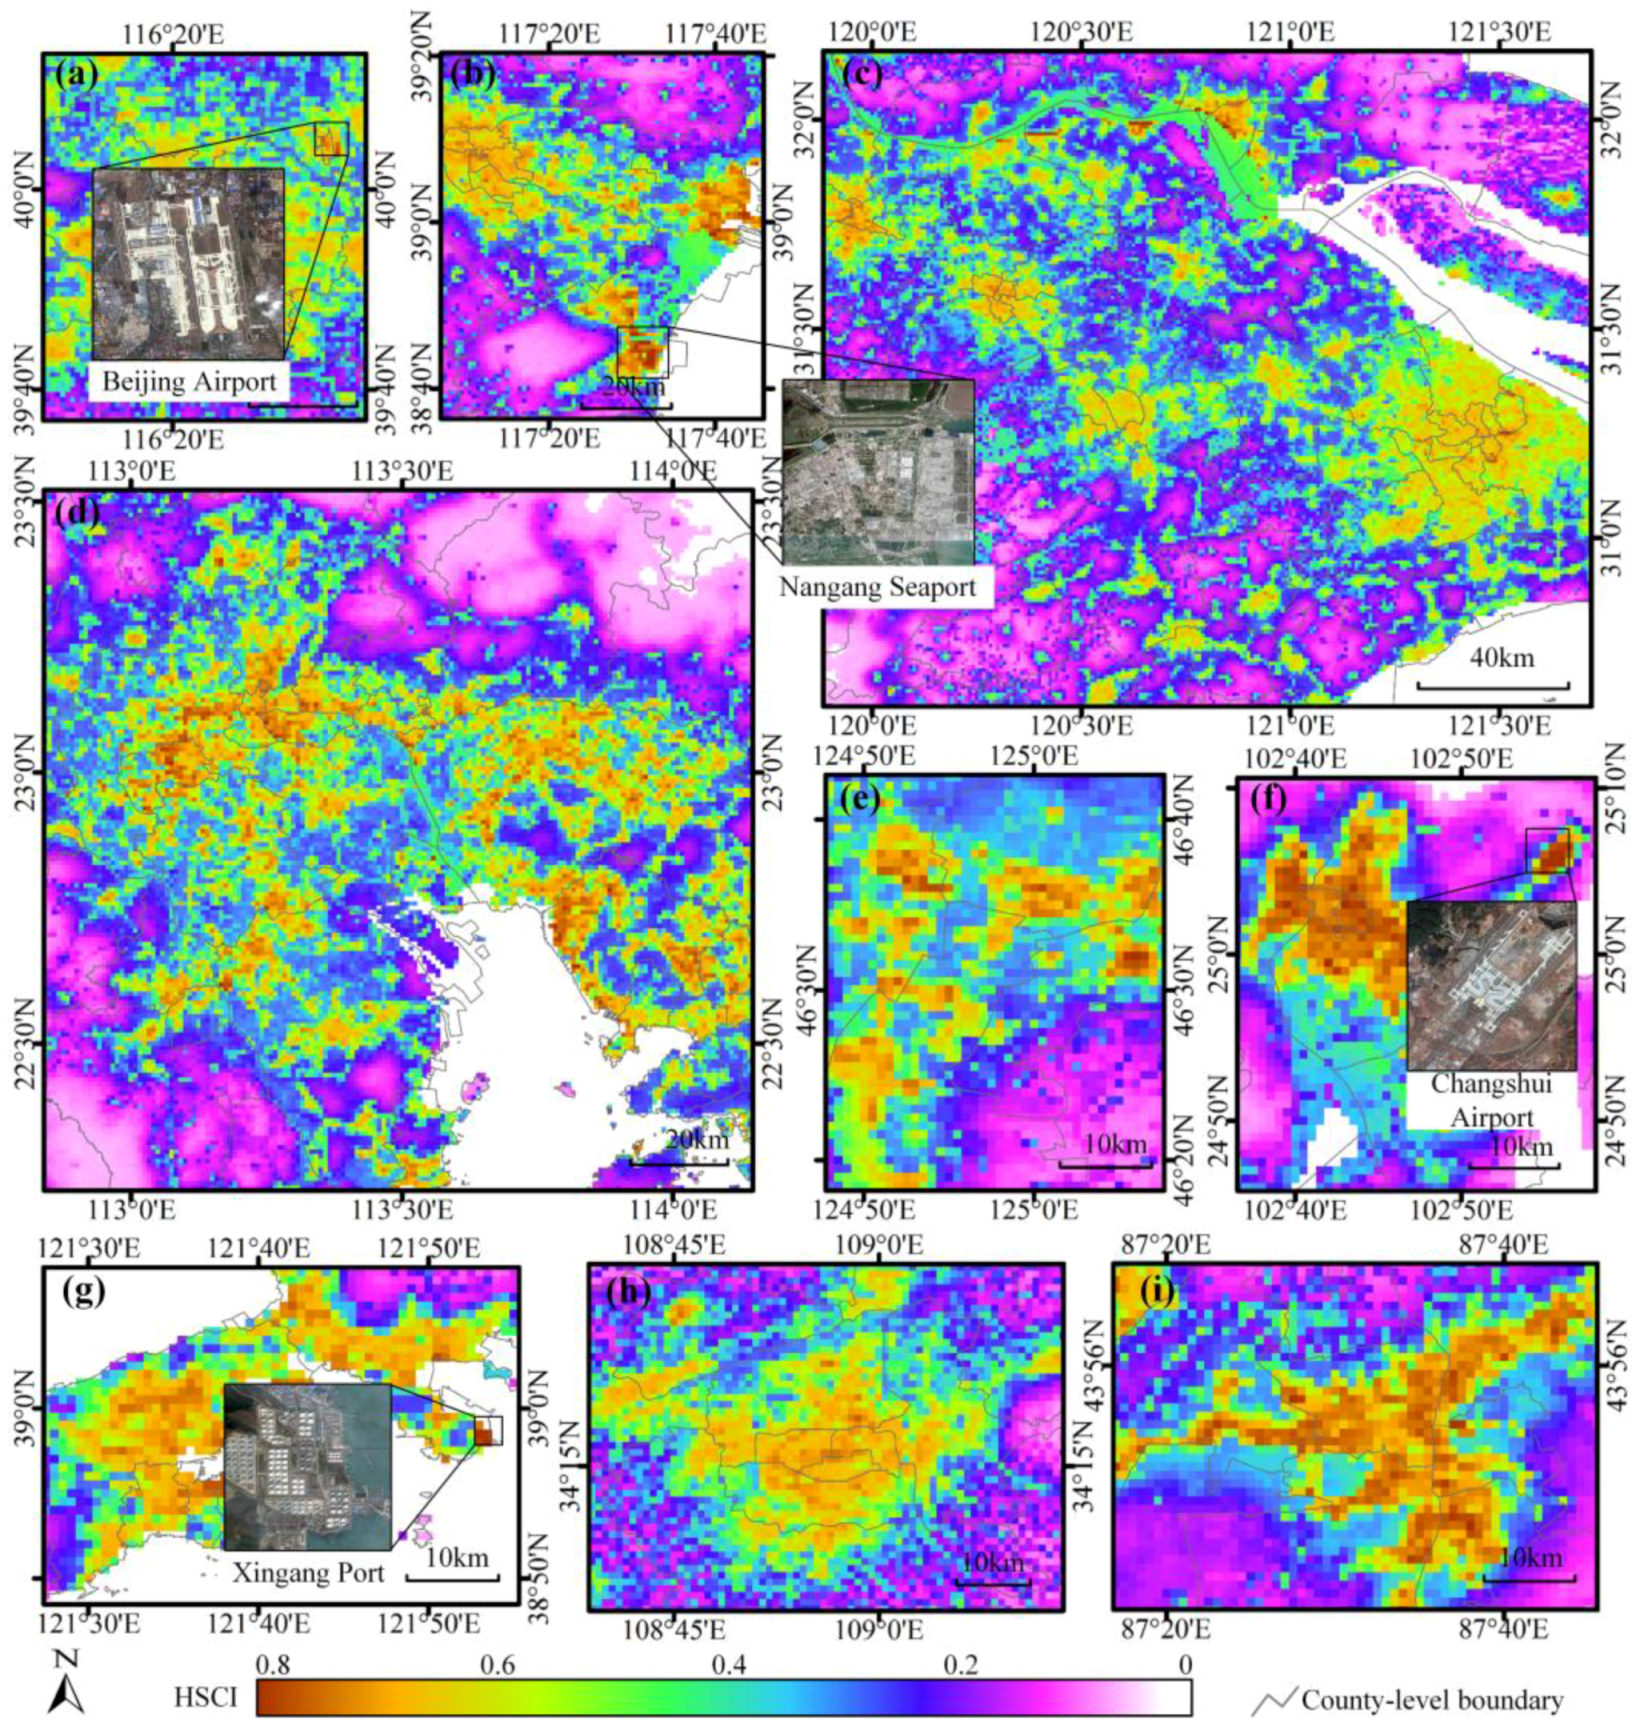
Figure 6 shows the spatial distribution of HSCI-based delineations of human settlements across seven individual cities and two urban agglomerations. This figure demonstrates that HSCI can provide us with more detailed quantitative observations of diverse anthropogenic activities across human settlements. At the fine scale, it is generally not possible to identify individual locations with highly intensified human activity, such as airports and seaports, from the original DMSP signals due to the saturation effect. As shown in Figure 6, the HSCI values in these areas are markedly high and conspicuously different from adjacent locations because of the dual correction of NDVI and PISA signals. At the local scale, we can use HSCI to distinguish and separate non-artificial land covers (e.g., water bodies, vegetated lands, and bare areas), which can be affected originally by the over-glow effect of nighttime radiances from human settlements, and hence, we can obtain a clear image of the spatial distribution of diverse human activities. At the regional scale, HSCI-based representations of human settlements provide a more efficient means of intra-regional characterization and inter-regional comparison of the patterns of metropolitan areas and urban agglomeration with spatially detailed delineations. For example, as the two largest conurbations in China, the Yangtze River Delta and the Pearl River Delta show different spatial patterns of urbanization: the former shows a regionally multi-center urban development process, and the latter shows an intra-regionally connected urbanized areas. At the country scale, the estimated value of HSCI for the same degree of human activity might be slightly lower in the eastern region of China than in the western region due to an increased vegetation index in the east. Obviously, this problem is inevitable for all of the composite indexes with corrections based on vegetation index. When compared with other indexes using NDVI as the improvement factor, the inter-regional deviation can be partially compensated by PISA signals in HSCI.
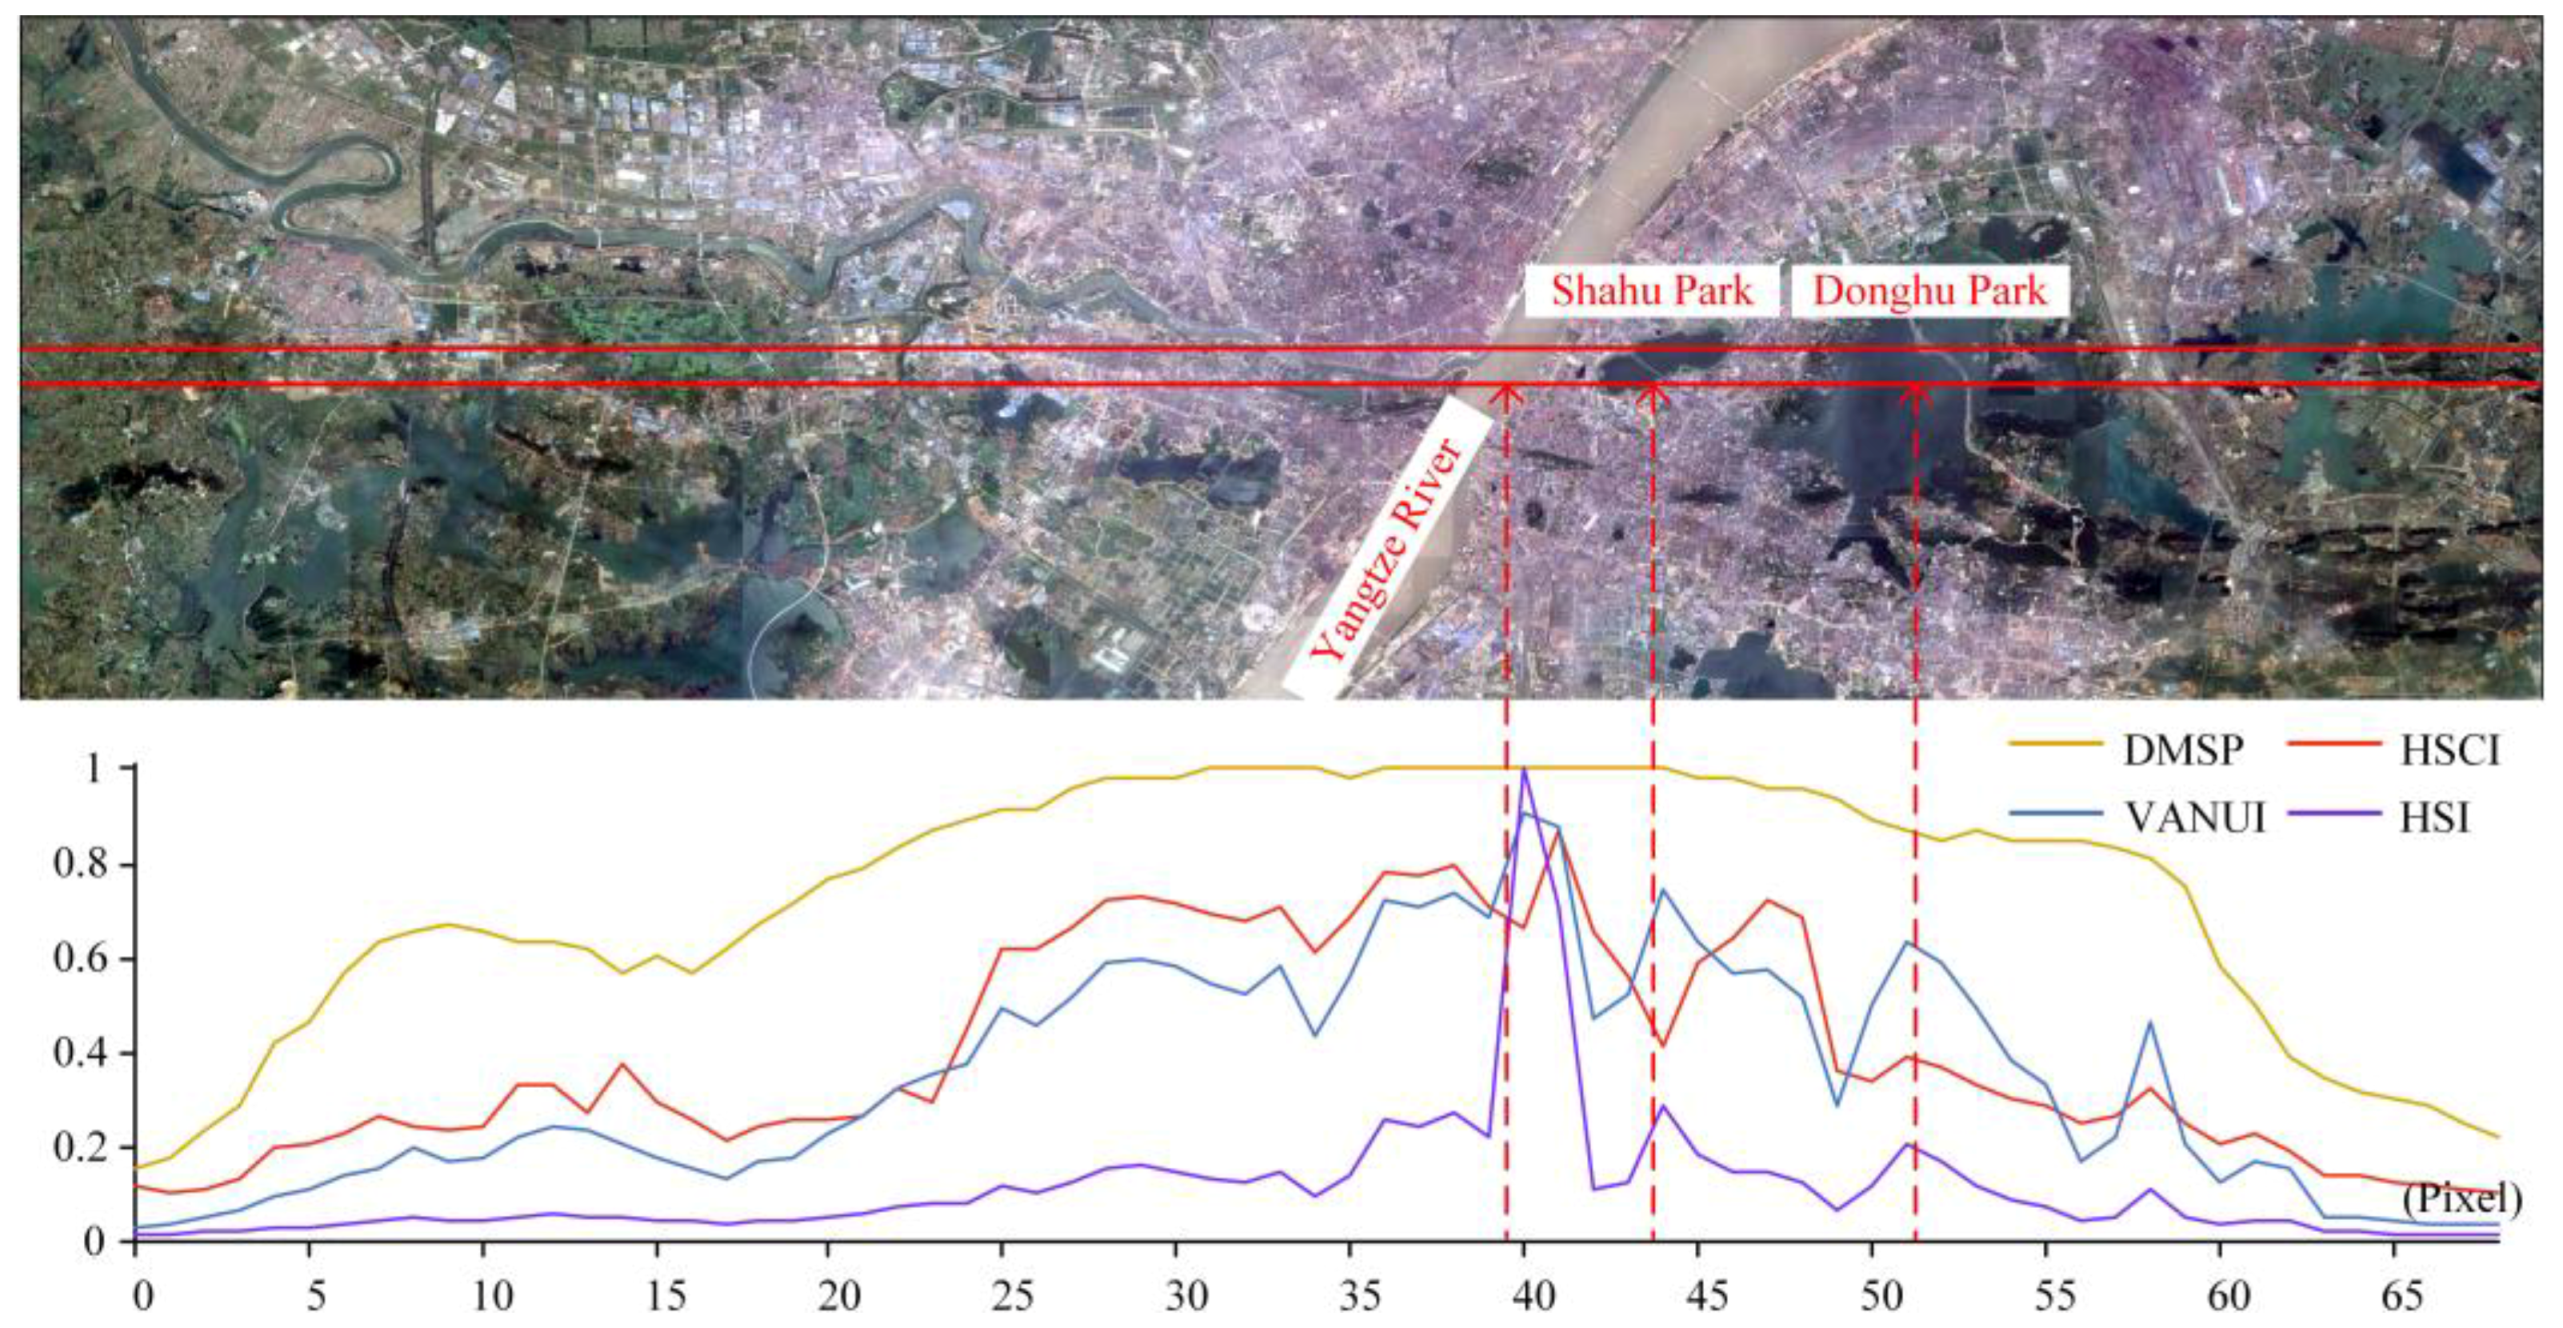
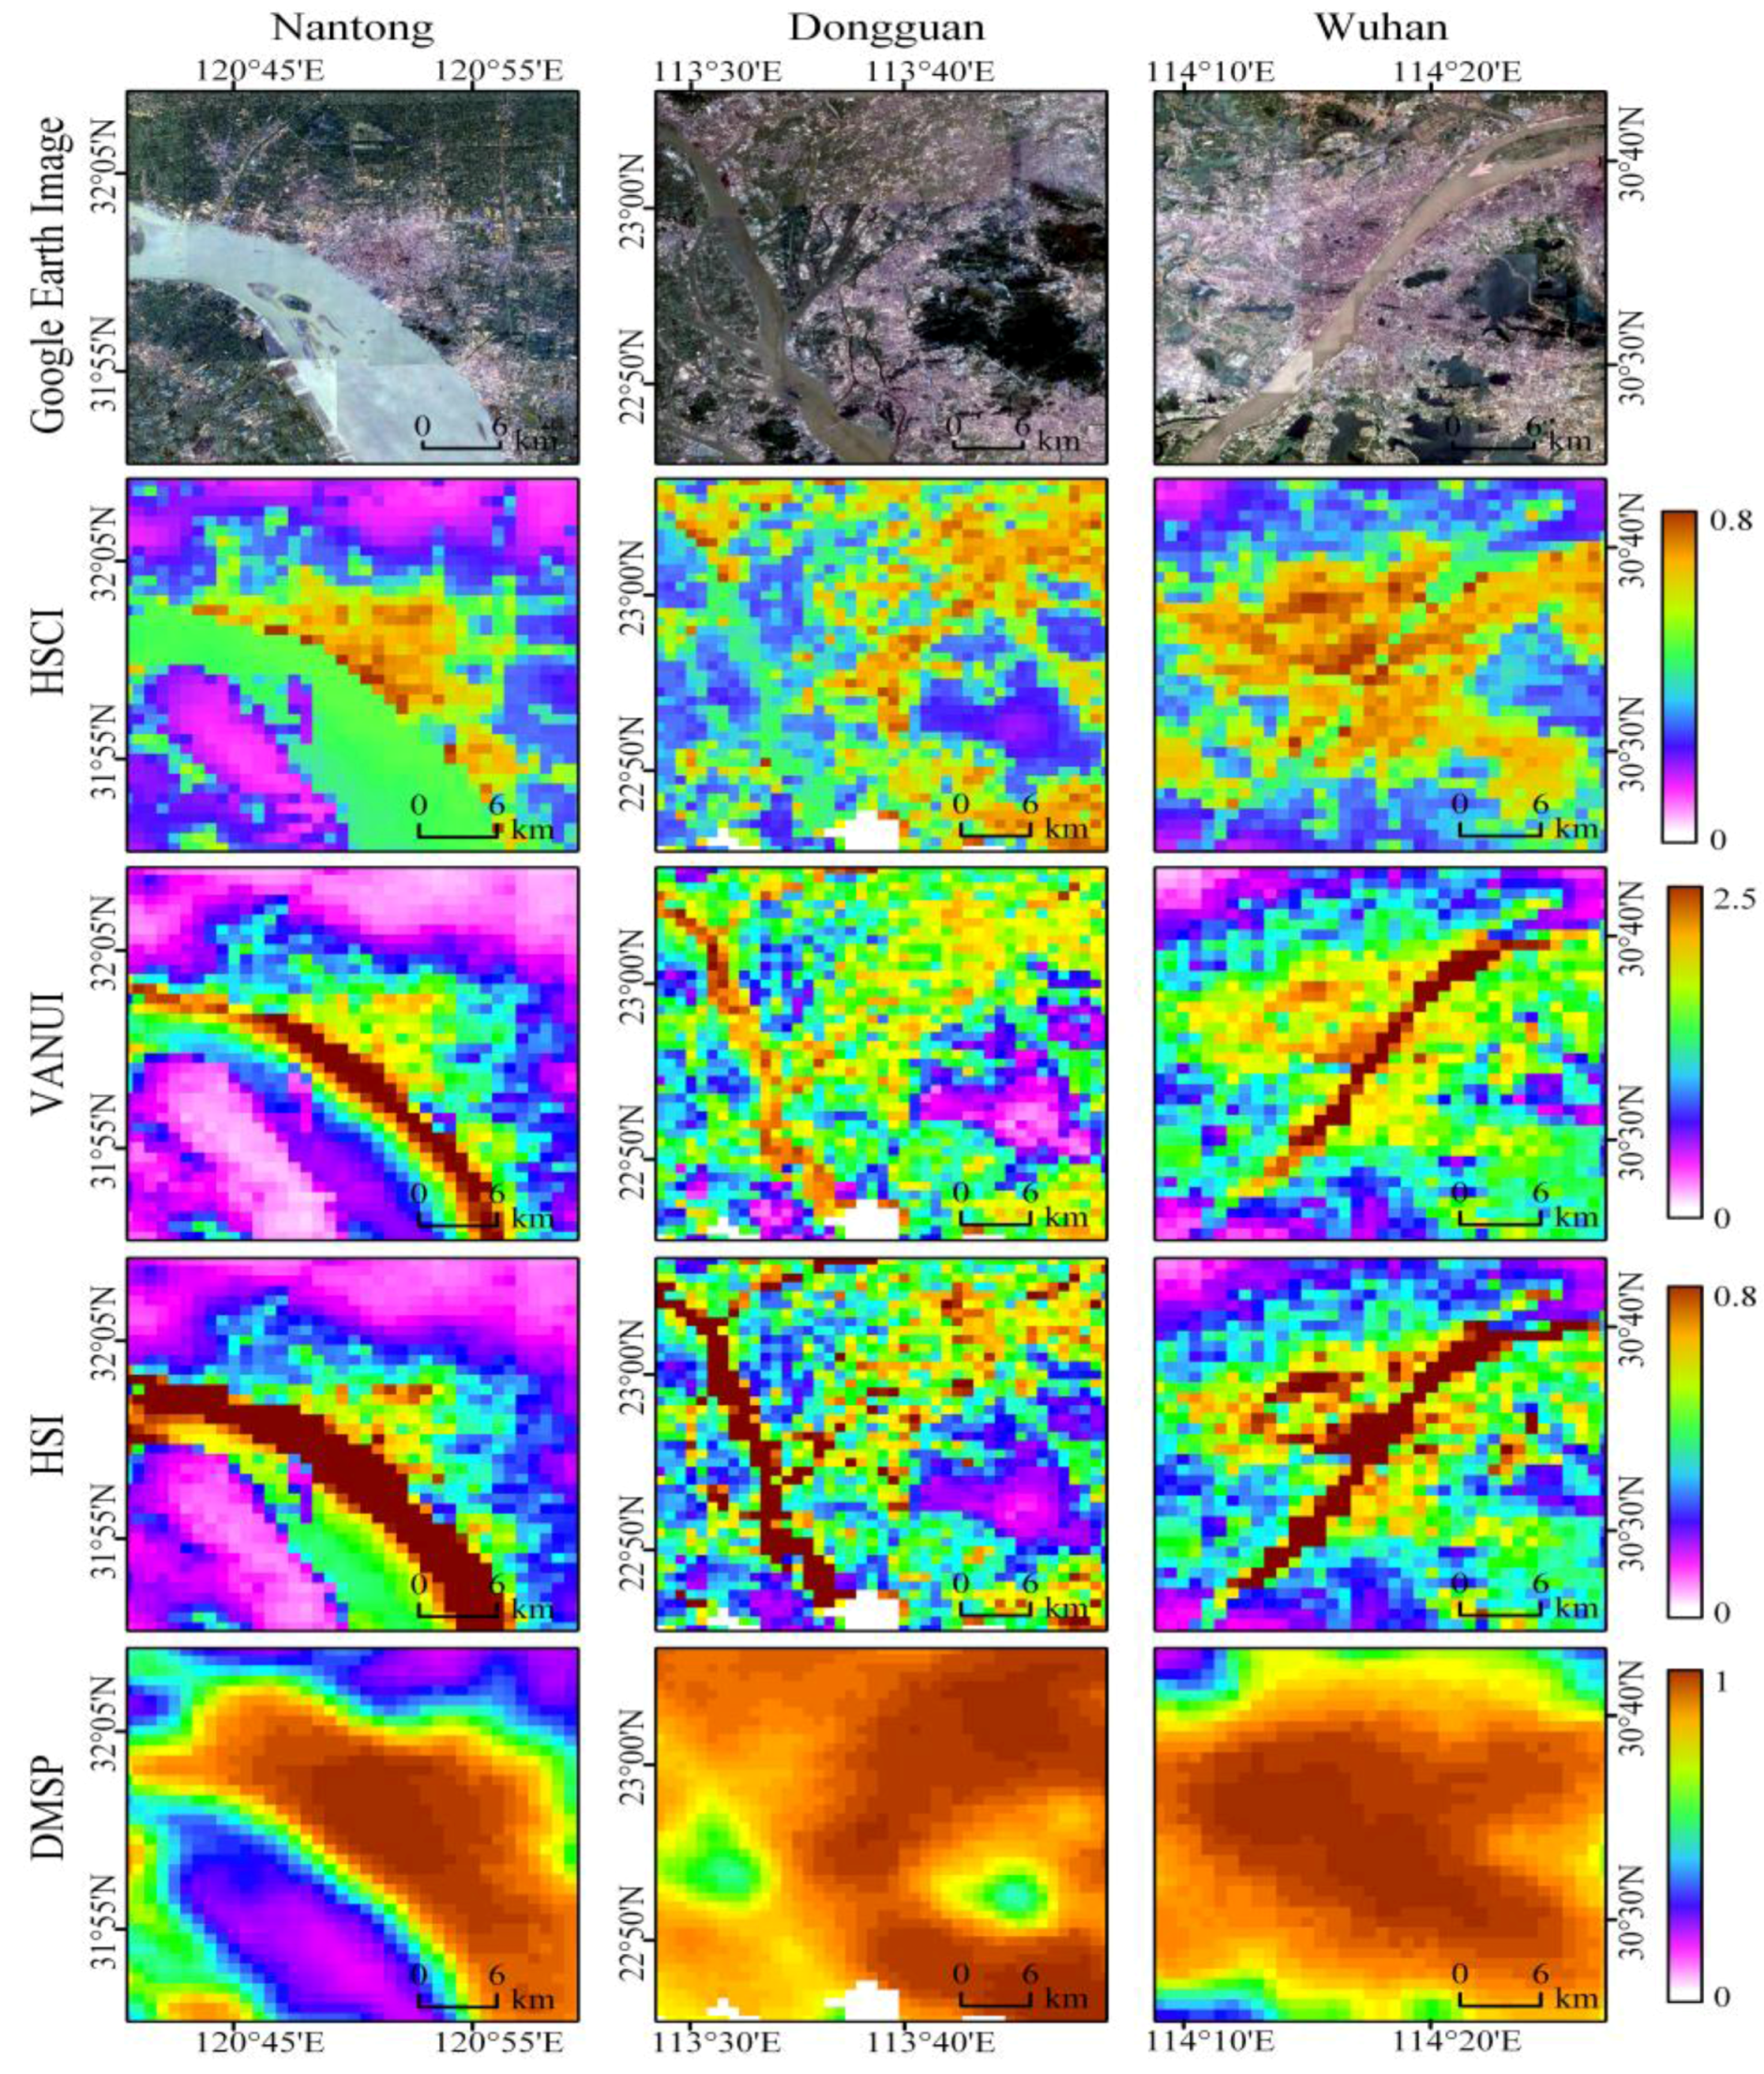
3.3. The Urban Water Body Response of HSCI
Water bodies within the city, which are generally lit by surrounding lighted areas due to the diffusion effect of the original DMSP signals, can significantly impact the nightlight derived estimate for both the total degree and spatial distribution of socioeconomic activities. As has been discussed previously, composite indexes based on DMSP and NDVI generally yield abnormally large values for urban water bodies, in which NDVI usually approaches 0. In these areas, the value of HSCI-based estimation is limited to the range of [0, 0.5], under the effect of PISA signals. As exemplified by Wuhan, in which the Yangtze River passes through and several lakes are scattered near the city center (Figure 7), HSCI shows a distinct drop across the three water bodies along the longitudinal transect, whereas both VANUI and HSI show conspicuously abnormal values, which are even larger than for neighboring man-made surfaces. To further verify the utility of HSCI for outlining urban water bodies, a comparative analysis is conducted spatially across three typical waterfront cities, including Nantong, Dongguan, and Wuhan, which is represented in Figure 8. Overall, both indexes VANUI and HSI commonly yield large anomalies across almost all water bodies in the three cities. In contrast, the response of HSCI to urban water bodies is maintained in the normal range, and hence would have less impact on investigations of socioeconomic activities across human settlements at both the local and city levels.
3.4. HSCI-Based Spatial Delineations of Rural Settlements
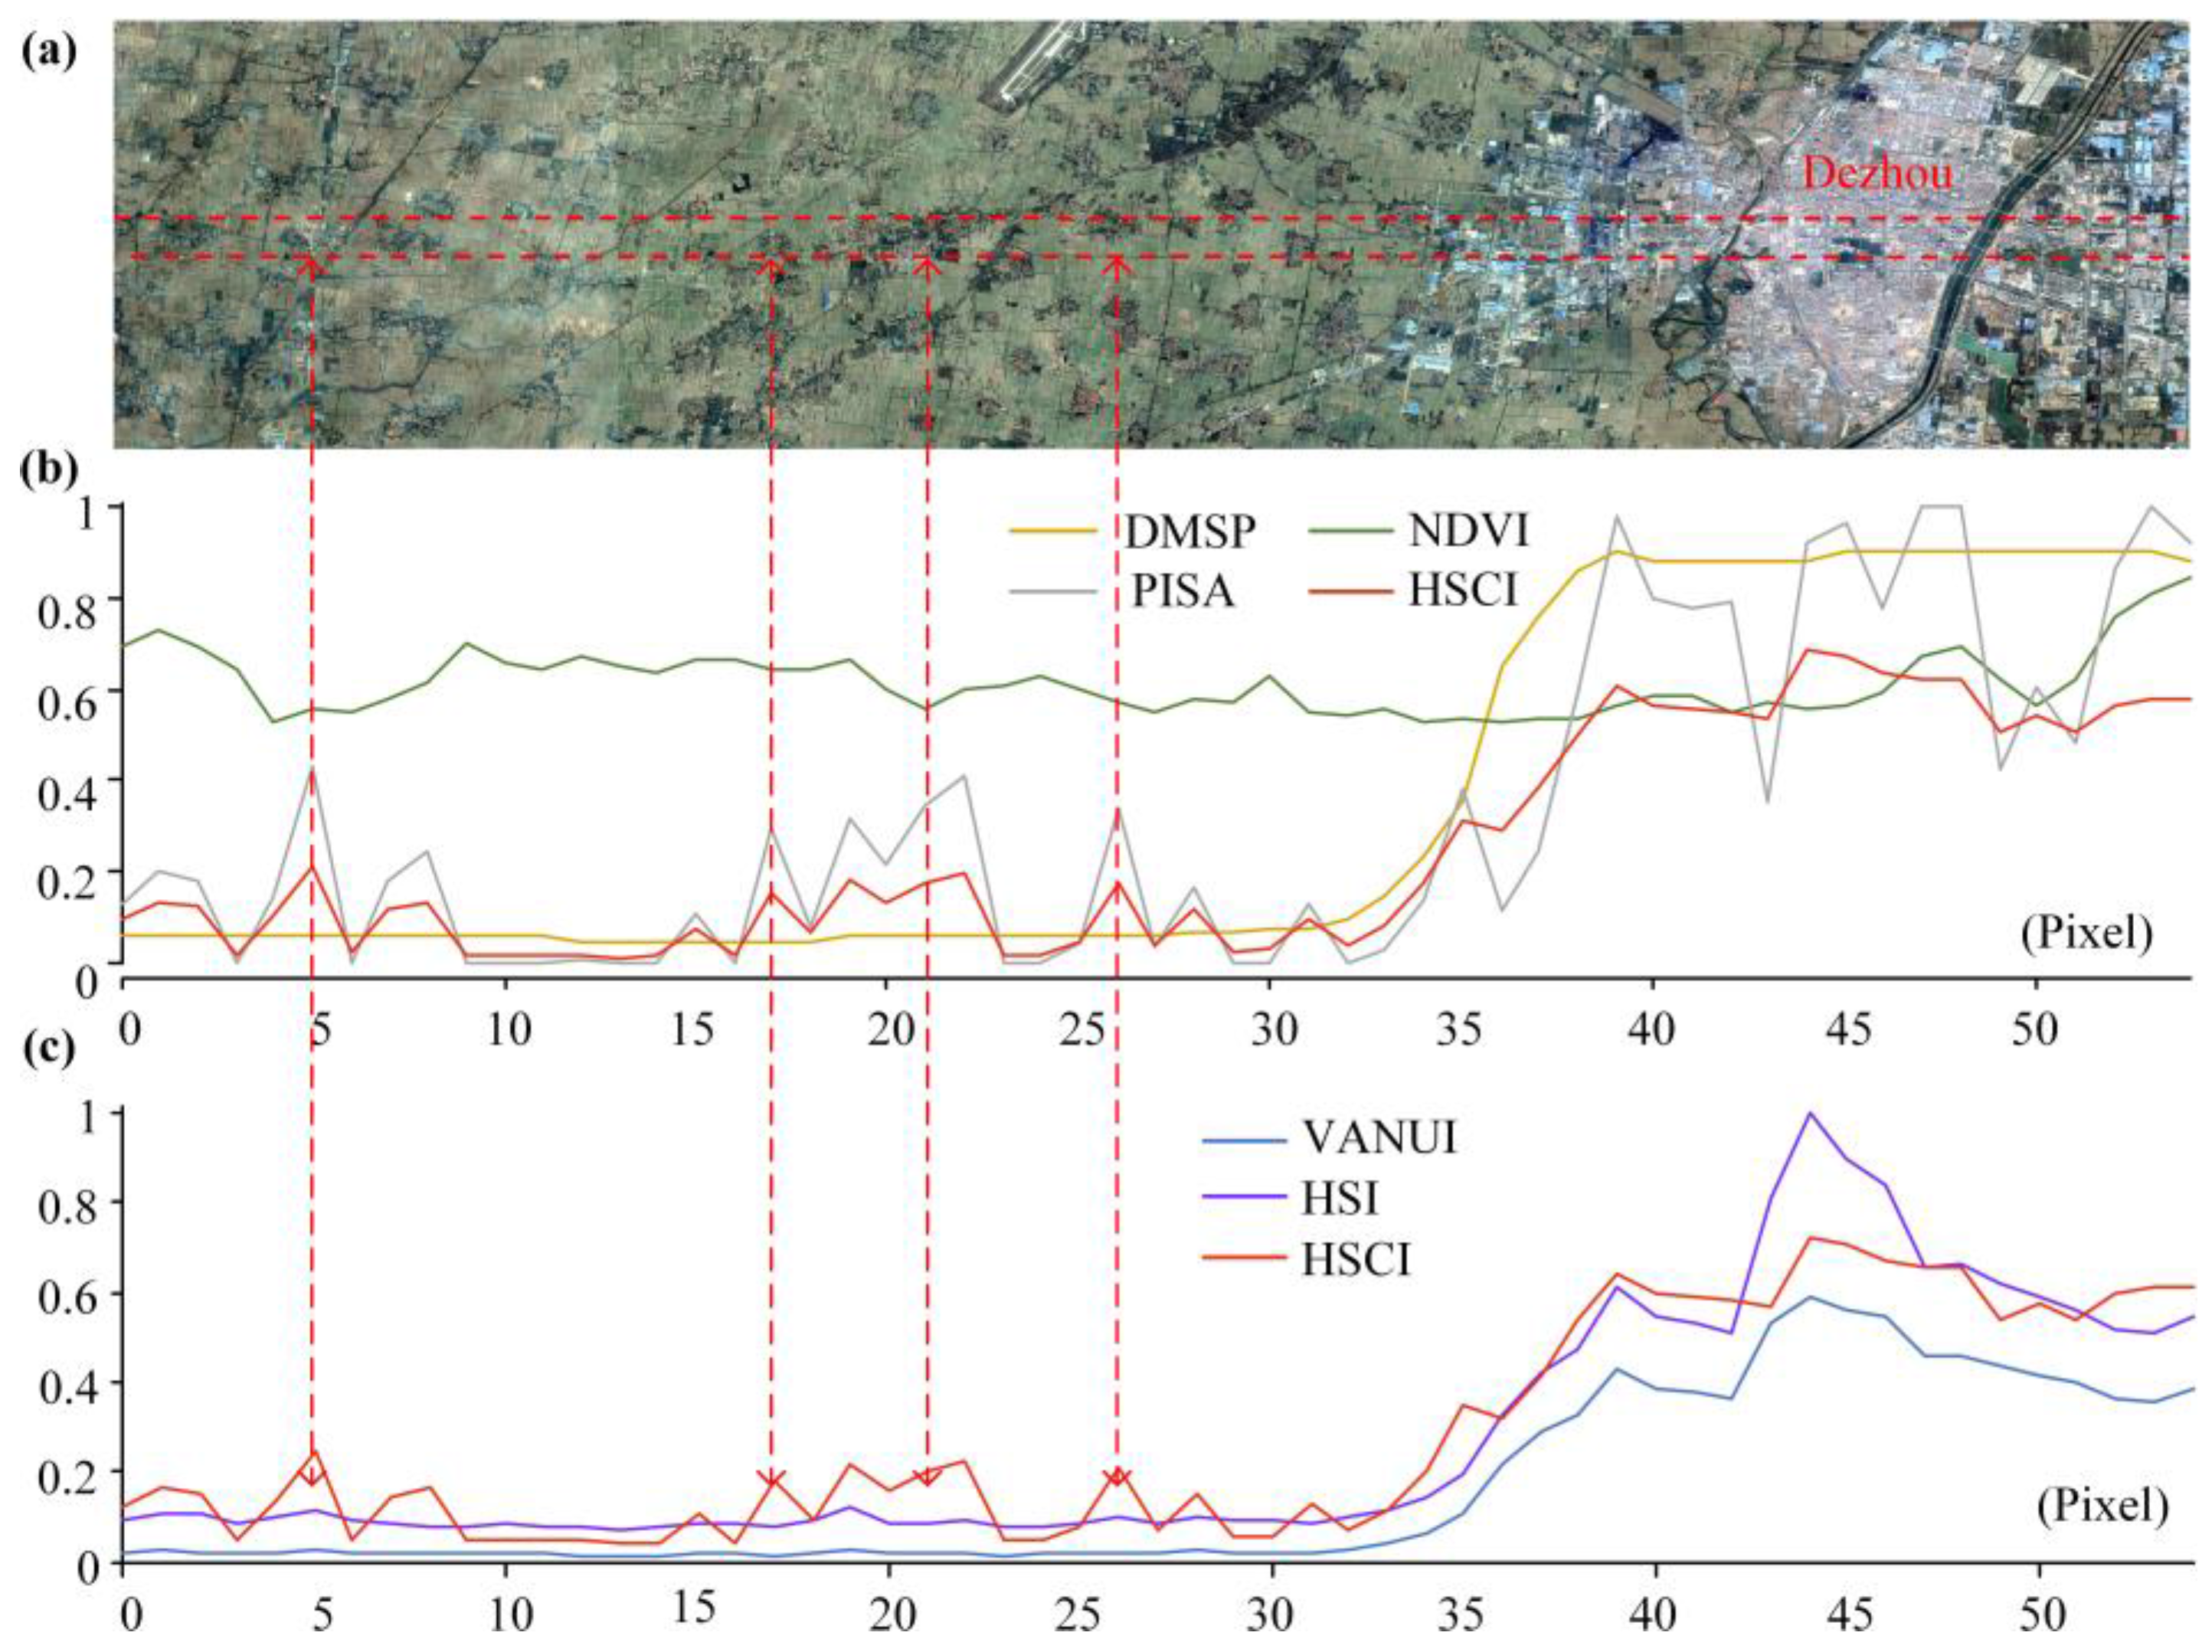
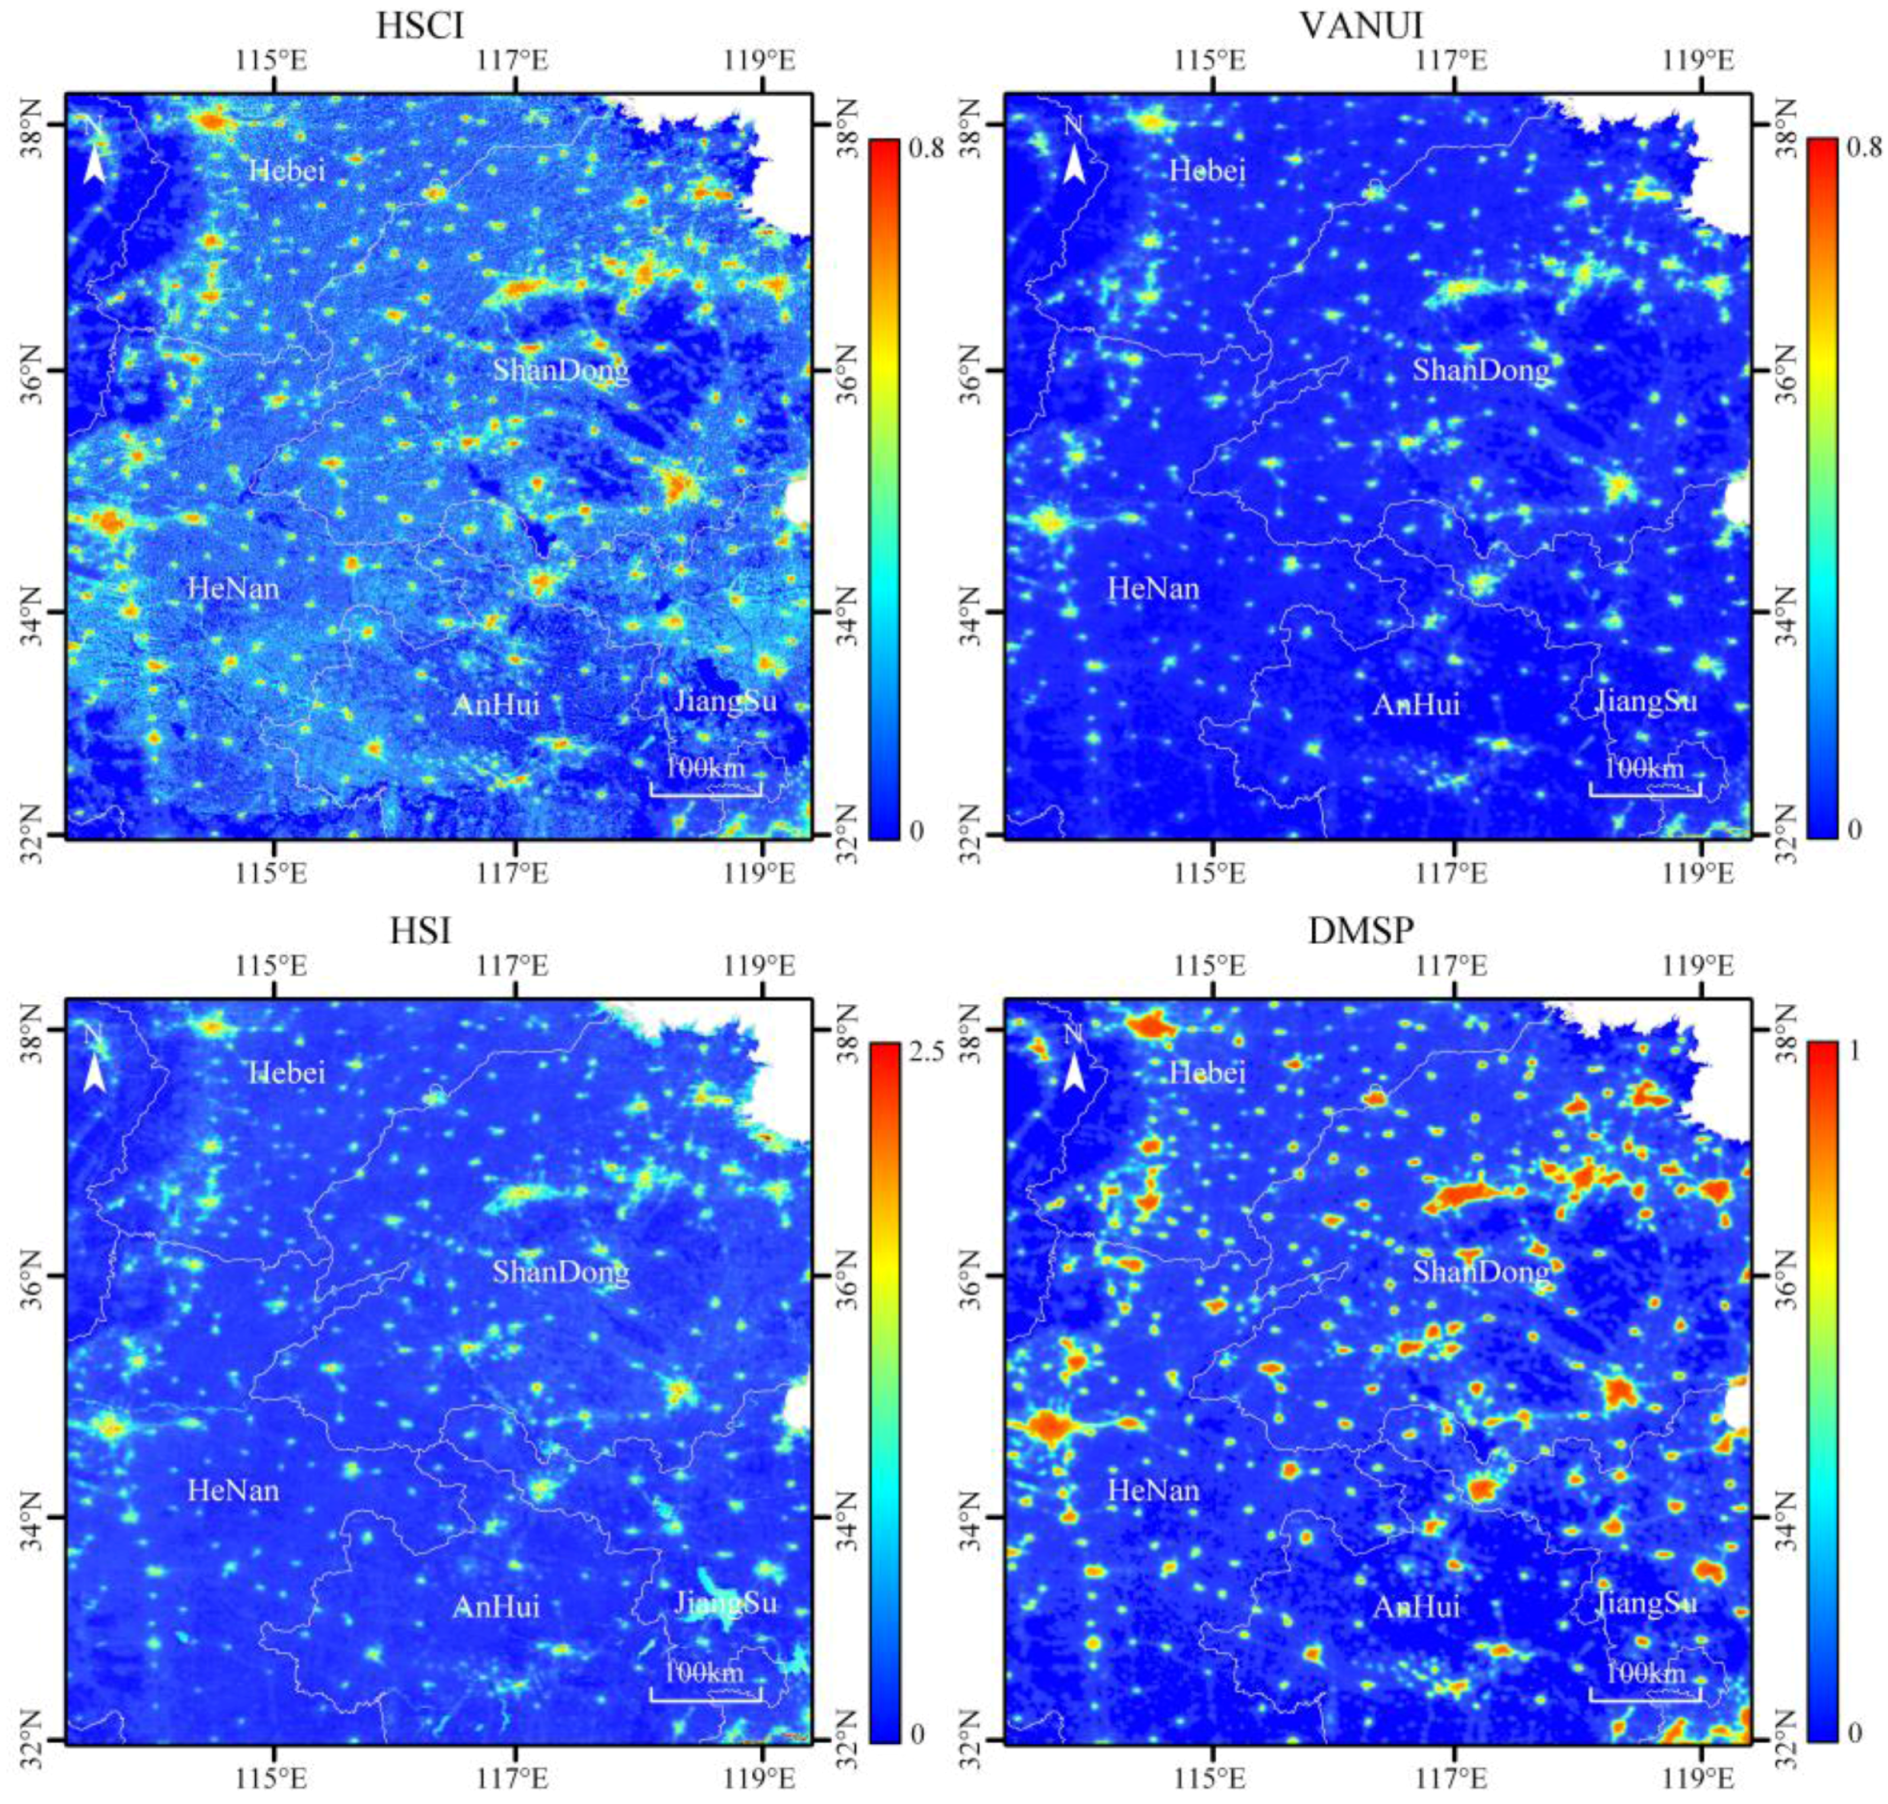
Rural settlements, including small towns and villages, have typically been excluded from previous studies regarding nighttime brightness-based investigations of human settlements because of dim lighting signals in the original DMSP images. Figure 9 shows the spatial changes in three kinds of remote sensing signals and HSCI along a longitudinal transect across the rural area neighboring the western side of Dezhou. From this figure, the DMSP brightness stays nearly constant over the rural area, and thus, it cannot be used to distinguish and separate rural residential sites from ambient croplands. HSCI appears to have the most conspicuous response signals over rural settlements in comparison with VANUI and HSI (see Figure 10), and HSCI keeps the value lower than in urbanized areas and the rural-urban transition zone. These findings indicate the potential applicability and efficiency of HSCI for portraying a small-sized human settlement. The utility of HSCI is also demonstrated in Figure 10, in which numerous rural settlements spreading all over mid-eastern China have been explicitly represented by HSCI-based estimates for the degree of human activity. In contrast, both VANUI and HSI show only limited improvement based on the original DMSP data for delineating these small- sized human settlements.
4. Conclusions
Ranging in size from village to city and distributed widely across the Earth, human settlements play a crucial role in anthropogenic environmental alterations, especially in continuously increasing urban areas with high densities of human activity. Thus, understanding the patterns of human settlement and dynamics of human-dominated landscapes is increasingly important for a range of issues, such as planning, resource conservation, and sustainability. Investigations of human settlements address the spatial distribution and expansion of man-made surfaces, as well as quantitative estimates of the magnitude of human activity. Owing to notable relationships between artificial nocturnal brightness and several demographic and socioeconomic variables, satellite-derived nighttime light images have been extensively used to estimate urbanization and socioeconomic dynamics. In practice, it is typically difficult to obtain a spatially explicit delineation for human settlements by directly using nighttime light data because of saturation and over-glow, particularly for DMSP nightlight signals. Hence, vegetation index (typically NDVI) data have been introduced into composite indexes to reduce the impact of the effects of DMSP signals, as well as to improve the utility of the composite index in the spatial delineation of human settlements. Despite the notable improvement in the delineation of urbanized lands, DMSP and NDVI derived composite indexes still have some limitations, especially for urban water bodies, bare lands, and rural residential sites, which is due to indistinguishable signals from both DMSP and NDVI in those areas because of ambient features.
In the present study, we developed a human settlement composite index, HSCI, by combining DMSP nighttime radiance, MODIS NDVI signal, and the percent impervious surface PISA data for delineating the spatial patterns of human settlement. HSCI is defined as the arithmetic mean of the normalized difference urban index and normalized difference imperviousness index. The primary goal of HSCI aims at the improvement of the composite index for investigating non-man-made surfaces in urbanized areas, various density human settlements in peripheral areas and scattered human settlements in rural areas. Overall, the spatial profile of HSCI is determined mainly by DMSP and PISA, with reduced saturation and increased variations in the human activity contributed by NDVI signals. In urbanized areas, one notable advantage of HSCI is that it can distinctly highlight the saturated areas with high densities of human activity (e.g., airports, seaports, and commercial centers) and can identify non-man-made surfaces (e.g., water bodies, greens and parks). HSCI can assess the comparative degree of human activity in water bodies and other urban lands of the city, while other indexes such as VANUI and HSI show unexpected high values. In suburban areas, which are conspicuously affected by the diffusion effect of original DMSP signals and usually consist of artificial surfaces, arable land, woodland, and other types of land covers, HSCI can greatly reduce the diffusion effect and clearly depict the local variations in the magnitude of human activity along the urban-rural gradient. In rural areas, scattered human settlements are hardly captured by DMSP data only due to dim nighttime lighting signals. When incorporated with PISA and NDVI, HSCI can distinctly identify small-sized human settlements from ambient signals. Moreover, the value of HSCI approaches zero for remote and wild lands with neither nightlight radiances lighting nor impervious surface signals.
In addition, HSCI in western areas might be slightly higher than in the eastern regions due to inter-regional variations in NDVI signals. The performance of other vegetation indexes for the potential improvement of a composite index should be investigated in further studies. Also, although recently obtained VIIRS images have a relatively high resolution and fewer saturation effects of nighttime light signals, this data still faces the challenge of the over-glow effect and lack of explicit texture information for identifying man-made surfaces and portraying the patterns of human settlement. As demonstrated by HSCI, the composite index derived from multiple remotely sensed data sources can provide an efficient way to improve the application of VIIRS nighttime light data in studies of demographic and socioeconomic dynamics across diverse human settlements in a spatially explicit manner.
Acknowledgments
This study was funded by the Key Research Program of Frontier Science, Chinese Academy of Sciences (No. QYZDY-SSW-DQC007), the National Natural Science Foundation of China (No. 41771418, 41421001), the National Science and Technology Key Project (No. 2016YFB0502301) and the National Key Basic Research Program of China (No. 2015CB954101).
Author Contributions
T.M. and T.X. conceived and designed the study; T.X. and L.H. performed the data processing; T.X., L.H. and A.Z. analyzed the data; T.M., T.X. and L.H. wrote the paper.
Conflicts of Interest
The authors declare no conflict of interest.
References
- Elvidge, C.; Baugh, K.; Kihn, E.; Kroehl, H.; Davis, E.; Davis, C. Relation between satellite observed visible-near infrared emissions, population, economic activity and electric power consumption. Int. J. Remote Sens. 1997, 18, 1373–1379. [Google Scholar] [CrossRef]
- Doll, C.; Muller, J.; Morley, J. Mapping regional economic activity from night-time light satellite imagery. Ecol. Econ. 2006, 57, 75–92. [Google Scholar] [CrossRef]
- Ghosh, T.; Powell, R.L.; Elvidge, C.D.; Baugh, K.E.; Sutton, P.C.; Anderson, S. Shedding light on the global distribution of economic activity. Open Geogr. J. 2010, 3, 148–161. [Google Scholar]
- Zhang, Q.; Seto, K.C. Mapping urbanization dynamics at regional and global scales using multi-temporal DMSP/OLS nighttime light data. Remote Sens. Environ. 2011, 115, 2320–2329. [Google Scholar] [CrossRef]
- Chen, X.; Nordhaus, W.D. Using luminosity data as a proxy for economic statistics. Proc. Natl. Acad. Sci. USA 2011, 108, 8589–8594. [Google Scholar] [CrossRef] [PubMed]
- Xu, T.; Ma, T.; Zhou, C.; Zhou, Y. Characterizing spatio-temporal dynamics of urbanization in China using time series of DMSP/OLS night light data. Remote Sens. 2014, 6, 7708–7731. [Google Scholar] [CrossRef]
- Li, X.; Ge, L.; Chen, X. Detecting Zimbabwe’s decadal economic decline using nighttime light imagery. Remote Sens. 2013, 5, 4551–4570. [Google Scholar] [CrossRef]
- Huang, Q.; Yang, X.; Gao, B.; Yang, Y.; Zhao, Y. Application of DMSP/OLS nighttime light images: A meta-analysis and a systematic literature review. Remote Sens. 2014, 6, 6844–6866. [Google Scholar] [CrossRef]
- Li, X.; Xu, H.; Chen, X.; Li, C. Potential of NPP-VIIRS nighttime light imagery for modeling the regional economy of China. Remote Sens. 2013, 5, 3057–3081. [Google Scholar] [CrossRef]
- Elvidge, C.D.; Baugh, K.E.; Zhizhin, M.; Hsu, F.-C. Why VIIRS data are superior to DMSP for mapping nighttime lights. Proc. Asia-Pac. Adv. Netw. 2013, 35, 62–69. [Google Scholar] [CrossRef]
- Shi, K.; Yu, B.; Huang, Y.; Hu, Y.; Yin, B.; Chen, Z.; Chen, L.; Wu, J. Evaluating the ability of NPP-VIIRS nighttime light data to estimate the gross domestic product and the electric power consumption of China at multiple scales: A comparison with DMSP-OLS data. Remote Sens. 2014, 6, 1705–1724. [Google Scholar] [CrossRef]
- Shi, K.; Huang, C.; Yu, B.; Yin, B.; Huang, Y.; Wu, J. Evaluation of NPP–VIIRS night-time light composite data for extracting built–up urban areas. Remote Sens. Lett. 2014, 5, 358–366. [Google Scholar] [CrossRef]
- Ma, T.; Zhou, C.; Tao, P.; Haynie, S.; Fan, J. Responses of Suomi-NPP VIIRS-derived nighttime lights to socioeconomic activity in China’s cities. Remote Sens. Lett. 2014, 5, 165–174. [Google Scholar] [CrossRef]
- Yu, B.; Shi, K.; Hu, Y.; Huang, C.; Chen, Z.; Wu, J. Poverty evaluation using NPP-VIIRS nighttime light composite data at the county level in China. IEEE J. Sel. Top. Appl. Earth Obs. Remote Sens. 2015, 8, 1217–1229. [Google Scholar] [CrossRef]
- Dou, Y.; Liu, Z.; He, C.; Yue, H. Urban land extraction using VIIRS nighttime light data: An evaluation of three popular methods. Remote Sens. 2017, 9, 175. [Google Scholar] [CrossRef]
- Levin, N. The impact of seasonal changes on observed nighttime brightness from 2014 to 2015 monthly VIIRS DNB composites. Remote Sens. Environ. 2017, 193, 150–164. [Google Scholar] [CrossRef]
- Small, C.; Pozzi, F.; Elvidge, C.D. Spatial analysis of global urban extent from DMSP/OLS night lights. Remote Sens. Environ. 2005, 96, 277–291. [Google Scholar] [CrossRef]
- Zhou, Y.; Ma, T.; Zhou, C.; Xu, T. Nighttime light derived assessment of regional inequality of socioeconomic development in China. Remote Sens. 2015, 7, 1242–1262. [Google Scholar] [CrossRef]
- Small, C.; Elvidge, C.; Balk, D.; Montgomery, M. Spatial scaling of stable night lights. Remote Sens. Environ. 2011, 115, 269–280. [Google Scholar] [CrossRef]
- Ma, T.; Zhou, Y.; Zhou, C.; Haynie, S.; Pei, T.; Xu, T. Night-time light derived estimation of spatio-temporal characteristics of urbanization dynamics using DMSP/OLS satellite data. Remote Sens. Environ. 2015, 158, 453–464. [Google Scholar] [CrossRef]
- Amaral, S.; Câmara, G.; Monteiro, A.M.V.; Quintanilha, J.A.; Elvidge, C.D. Estimating population and energy consumption in Brazilian Amazonia using DMSP night-time satellite data. Comput. Environ. Urban Syst. 2005, 29, 179–195. [Google Scholar] [CrossRef]
- Sutton, P.C. A scale-adjusted measure of “urban sprawl” using nighttime satellite imagery. Remote Sens. Environ. 2003, 86, 353–369. [Google Scholar] [CrossRef]
- Elvidge, C.D.; Keith, D.M.; Tuttle, B.T.; Baugh, K.E. Spectral identification of lighting type and character. Sensors 2010, 10, 3961–3988. [Google Scholar] [CrossRef] [PubMed]
- Cao, X.; Chen, J.; Imura, H.; Higashi, O. A SVM-based method to extract urban areas from DMSP-OLS and SPOT VGT data. Remote Sens. Environ. 2009, 113, 2205–2209. [Google Scholar] [CrossRef]
- Henderson, M.; Yeh, E.T.; Gong, P.; Elvidge, C.; Baugh, K. Validation of urban boundaries derived from global night-time satellite imagery. Int. J. Remote Sens. 2003, 24, 595–609. [Google Scholar] [CrossRef]
- Zhou, Y.; Smith, S.J.; Elvidge, C.D.; Zhao, K.; Thomson, A.; Imhoff, M. A cluster-based method to map urban area from DMSP/OLS nightlights. Remote Sens. Environ. 2014, 147, 173–185. [Google Scholar] [CrossRef]
- Xie, Y.; Weng, Q. Updating urban extents with nighttime light imagery by using an object-based thresholding method. Remote Sens. Environ. 2016, 187, 1–13. [Google Scholar] [CrossRef]
- Liu, Z.; He, C.; Zhang, Q.; Huang, Q.; Yang, Y. Extracting the dynamics of urban expansion in China using DMSP/OLS nighttime light data from 1992 to 2008. Landsc. Urban Plan. 2012, 106, 62–72. [Google Scholar] [CrossRef]
- Elvidge, C.; Baugh, K.; Dietz, J.; Bland, T.; Sutton, P.; Kroehl, H. Radiance calibration of DMSP-OLS low light imaging data of human settlements. Remote Sens. Environ. 1999, 68, 77–88. [Google Scholar] [CrossRef]
- Elvidge, C.; Baugh, K.; Anderson, S.; Sutton, P.; Ghosh, T. The night light development index (NLDI): A spatially explicit measure of human development from satellite. Soc. Geogr. 2012, 7, 23–35. [Google Scholar] [CrossRef]
- Zhang, Q.; Li, B.; Thau, D.; Moore, R. Building a better urban picture: Combining day and night remote sensing imagery. Remote Sens. 2015, 7, 11887–11913. [Google Scholar] [CrossRef]
- Lu, D.; Tian, H.; Zhou, G.; Ge, H. Regional mapping of human settlements in southeastern China with multisensor remotely sensed data. Remote Sens. Environ. 2008, 112, 3668–3679. [Google Scholar] [CrossRef]
- Zhang, Q.; Schaaf, C.; Seto, K.C. The vegetation adjusted NTL urban index: A new approach to reduce saturation and increase variation in nighttime luminosity. Remote Sens. Environ. 2013, 129, 32–41. [Google Scholar] [CrossRef]
- Liu, X.; Hu, G.; Ai, B.; Li, X.; Shi, Q. A normalized urban areas composite index (NUACI) based on combination of DMSP-OLS and MODIS for mapping impervious surface area. Remote Sens. 2015, 7, 17168–17189. [Google Scholar] [CrossRef]
- Letu, H.; Hara, M.; Yagi, H.; Naoki, K.; Tana, G.; Nishio, F.; Shuhei, O. Estimating energy consumption from night-time DMPS/OLS imagery after correcting for saturation effects. Int. J. Remote Sens. 2010, 31, 4443–4458. [Google Scholar] [CrossRef]
- Letu, H.; Hara, M.; Tana, G.; Nishio, F. A saturated light correction method for DMSP/OLS nighttime satellite imagery. IEEE Trans. Geosci. Remote Sens. 2012, 50, 389–396. [Google Scholar] [CrossRef]
- Friedl, M.; McIver, D.; Hodges, J.; Zhang, X.; Muchoney, D.; Strahler, A.; Woodcock, C.; Gopal, S.; Schneider, A.; Cooper, A. Global land cover mapping from MODIS: Algorithms and early results. Remote Sens. Environ. 2002, 83, 287–302. [Google Scholar] [CrossRef]
- Ganguly, S.; Friedl, M.; Tan, B.; Zhang, X.; Verma, M. Land surface phenology from MODIS: Characterization of the Collection 5 global land cover dynamics product. Remote Sens. Environ. 2010, 114, 1805–1816. [Google Scholar] [CrossRef]
- Chen, J.; Chen, J.; Liao, A.; Cao, X.; Chen, L.; Chen, X.; He, C.; Han, G.; Peng, S.; Lu, M.; et al. Global land cover mapping at 30 m resolution: A POK-based operational approach. ISPRS J. Photogram. Remote Sens. 2014, 103, 7–27. [Google Scholar] [CrossRef]
- Sexton, J.; Song, X.; Huang, C.; Channan, S.; Baker, M.; Townshend, J. Urban growth of the Washington, DC–Baltimore, MD metropolitan region from 1984 to 2010 by annual, Landsat-based estimates of impervious cover. Remote Sens. Environ. 2013, 129, 42–53. [Google Scholar] [CrossRef]
- Song, X.; Sexton, J.; Huang, C.; Channan, S.; Townshend, J. Characterizing the magnitude, timing and duration of urban growth from time series of Landsat-based estimates of impervious cover. Remote Sens. Environ. 2016, 175, 1–13. [Google Scholar] [CrossRef]
Figure 1.
Original Defense Meteorological Satellite Program (DMSP) nighttime light image overlaid on Google Earth image for Wuhan.
Figure 1.
Original Defense Meteorological Satellite Program (DMSP) nighttime light image overlaid on Google Earth image for Wuhan.

Figure 2.
Longitudinal profiles of nighttime light signals across Nanjing. (a) Google Earth image; (b) Radiance calibrated DMSP nightlight image; (c) Original DMSP nightlight image; and, (d) Quantitative comparisons of radiance calibrated DMSP nightlight brightness and original DMSP signals.
Figure 2.
Longitudinal profiles of nighttime light signals across Nanjing. (a) Google Earth image; (b) Radiance calibrated DMSP nightlight image; (c) Original DMSP nightlight image; and, (d) Quantitative comparisons of radiance calibrated DMSP nightlight brightness and original DMSP signals.

Figure 3.
A comparison of spatial distributions using (a) percent impervious surface area (PISA) and (b) normalized difference vegetation index (NDVI) over the urbanized areas in Beijing.
Figure 3.
A comparison of spatial distributions using (a) percent impervious surface area (PISA) and (b) normalized difference vegetation index (NDVI) over the urbanized areas in Beijing.

Figure 4.
Schematic illustrations of human settlement composite index (HSCI) features for different types of areas.
Figure 4.
Schematic illustrations of human settlement composite index (HSCI) features for different types of areas.

Figure 5.
(a) Google Earth image covering part of Beijing, (b) Longitudinal profiles of DMSP (normalized), NDVI, PISA, and HSCI signals; (c) Longitudinal profiles of DMSP (normalized), VANUI, human settlement index (HSI), and HSCI values.
Figure 5.
(a) Google Earth image covering part of Beijing, (b) Longitudinal profiles of DMSP (normalized), NDVI, PISA, and HSCI signals; (c) Longitudinal profiles of DMSP (normalized), VANUI, human settlement index (HSI), and HSCI values.

Figure 6.
Spatial patterns of HSCI-based human settlements across different regions in China. (a) Beijing; (b) Tianjin; (c) Yangtze River Delta; (d) Pearl River Delta; (e) Daqing; (f) Kunming; (g) Dalian; (h) Xi’an; and, (i) Urumqi.
Figure 6.
Spatial patterns of HSCI-based human settlements across different regions in China. (a) Beijing; (b) Tianjin; (c) Yangtze River Delta; (d) Pearl River Delta; (e) Daqing; (f) Kunming; (g) Dalian; (h) Xi’an; and, (i) Urumqi.

Figure 7.
Longitudinal transects of DMSP (normalized), HSCI, vegetation adjusted NTL urban index (VANUI), and HSI across Wuhan.
Figure 7.
Longitudinal transects of DMSP (normalized), HSCI, vegetation adjusted NTL urban index (VANUI), and HSI across Wuhan.

Figure 8.
Comparisons of HSCI, VANUI, and HSI signals for urban water bodies in three cities.

Figure 9.
Rural settlement area neighboring the western side of Dezhou. (a) Google Earth image; (b) longitudinal profiles of DMSP (normalized), NDVI, PISA, and HSCI; and, (c) longitudinal profiles of VANUI, HSI, and HSCI.
Figure 9.
Rural settlement area neighboring the western side of Dezhou. (a) Google Earth image; (b) longitudinal profiles of DMSP (normalized), NDVI, PISA, and HSCI; and, (c) longitudinal profiles of VANUI, HSI, and HSCI.

Figure 10.
Spatial patterns of human settlements (most are villages and small townships) in mid-eastern China, which are delineated by HSCI, VANUI, HSI, and original DMSP (normalized) signals, respectively.
Figure 10.
Spatial patterns of human settlements (most are villages and small townships) in mid-eastern China, which are delineated by HSCI, VANUI, HSI, and original DMSP (normalized) signals, respectively.

© 2018 by the authors. Licensee MDPI, Basel, Switzerland. This article is an open access article distributed under the terms and conditions of the Creative Commons Attribution (CC BY) license (http://creativecommons.org/licenses/by/4.0/).
Share and Cite
MDPI and ACS Style
Ma, T.; Xu, T.; Huang, L.; Zhou, A. A Human Settlement Composite Index (HSCI) Derived from Nighttime Luminosity Associated with Imperviousness and Vegetation Indexes. Remote Sens. 2018, 10, 455. https://doi.org/10.3390/rs10030455
AMA Style
Ma T, Xu T, Huang L, Zhou A. A Human Settlement Composite Index (HSCI) Derived from Nighttime Luminosity Associated with Imperviousness and Vegetation Indexes. Remote Sensing. 2018; 10(3):455. https://doi.org/10.3390/rs10030455
Chicago/Turabian StyleMa, Ting, Tao Xu, Lin Huang, and Alicia Zhou. 2018. "A Human Settlement Composite Index (HSCI) Derived from Nighttime Luminosity Associated with Imperviousness and Vegetation Indexes" Remote Sensing 10, no. 3: 455. https://doi.org/10.3390/rs10030455
Note that from the first issue of 2016, this journal uses article numbers instead of page numbers. See further details here.