Article

Variable Selection Algorithm for a Mixture of Poisson Regression for Handling Overdispersion in Claims Frequency Modeling Using Telematics Car Driving Data

1
School of Mathematics and Statistics, The University of Sydney, Sydney, NSW 2006, Australia
2
Discipline of Business Analytics, The University of Sydney, Sydney, NSW 2006, Australia
3
Actuarial Resreach Center, University of Haifa, Haifa 3498838, Israel
4
Efi Arazi School of Computer Science, Reichman University, Herzliya 4610101, Israel
*
Author to whom correspondence should be addressed.
Risks 2022, 10(4), 83; https://doi.org/10.3390/risks10040083
Submission received: 5 February 2022 / Revised: 12 March 2022 / Accepted: 24 March 2022 / Published: 12 April 2022

Abstract

:
In automobile insurance, it is common to adopt a Poisson regression model to predict the number of claims as part of the actuarial pricing process. The Poisson assumption can rarely be justified, often due to overdispersion, and alternative modeling is often considered, typically zero-inflated models, which are special cases of finite mixture distributions. Finite mixture regression modeling of telematics data is challenging to implement since the huge number of covariates computationally prohibits the essential variable selection needed to attain a model with desirable predictive power devoid of overfitting. This paper aims at devising an algorithm that can carry the task of variable selection in the presence of a large number of covariates. This is achieved by generating sub-samples of the data corresponding to each component of the Poisson mixture, and wherein variable selection is applied following the enhancement of the Poisson assumption by means of controlling the number of zero claims. The resulting algorithm is assessed by measuring the out-of-sample AUC (Area Under the Curve), a Machine Learning tool for quantifying predictive power. Finally, the application of the algorithm is demonstrated by using data of claim history and telematics data describing driving behavior. It transpires that unlike alternative algorithms related to Poisson regression, the proposed algorithm is both implementable and enjoys an improved AUC (0.71). The proposed algorithm allows more accurate pricing in an era where telematics data is used for automobile insurance.

1. Introduction

In an article entitled “Why auto insurance rates are likely to increase in 2020” (https://www.valuepenguin.com/auto-insurance-rate-increase-2020, accessed on 14 January 2019), the combined loss ratio of the largest ten insurance companies offering auto insurance in the US in 2018 was stated as 101.3. Namely, on average, these companies incurred more in losses and expenses than they earned in premiums. Two methodological pitfalls can explain this, as we now outline:
a. Insufficient explanatory variables, or covariates, resulting in excessive unexplained heterogeneity (often called unexplained variability). The covariates are the main classification variables used for pricing. For example, in automobile insurance, these are, typically, as follows: driver’s age, gender, claim history of the principal driver, driving license date, vehicle kind and place of residence. These variables are then used to segment the portfolio into classes so that all individuals belonging to a class pay the same premium. If, as is most often the case, such classes lack homogeneity, those individuals generating smaller risk make up for riskier ones.
b. Fitting the wrong model. It is broadly agreed that adopting an improper model inevitably corrupts the pricing process, resulting in financial losses due to enhanced risk to the company or inferior competitiveness. The most common counting distribution is the Poisson, even though it can be entirely improper for two reasons: i. The underlying distribution is unrelated to the Poisson. ii. The distribution is an overdispersed Poisson, i.e., suffering from an excess of zeros. This high frequency of zeros may reflect that some insureds make little use of their vehicle, are safe drivers, or do not wish to claim to avoid increasing their premium. This excess implies that the variance is greater than the mean, which contradicts the assumed expected equality between the mean and the variance in the Poisson model.
The paper proposes replacing the standard Poisson regression model with a more versatile mixture of Poisson regression to address the two reasons outlined above. Unfortunately, existing computer packages for such a model cannot handle many explanatory variables and often do not offer any variable selection options. The paper aims to suggest and study an algorithm for variable selection for a mixture Poisson regression model that relies on FLEXMIX, a freely available package in the R computing library, which is computationally feasible. We aim to explore whether the proposed algorithm is computationally feasible and produces superior results than those generated by a Poisson regression model.
The paper is organized as follows: Section 2 provides a literature review and focuses on finite mixture Poisson regression as a predictive model and the difficulties in implementing this model to such data. A proposed novel subset selection algorithm is outlined in Section 3. Section 4 provides a discussion of an experimental study demonstrating the algorithm’s benefits, and conclusions are given in Section 5.

2. Literature Survey

2.1. A General Review

The inherent cross-subsidy is a serious cause for the lack of profit of insurers. A desirable risk classification aims to improve the insured pure premium prediction, thus reducing cross-subsidy between the high and low insured risks (see Zahi (2021) and Duan et al. (2018) for further details). To reduce the unexplained heterogeneity and the potential cross-subsidy, additional covariates need to be incorporated into the pricing process. These can be obtained from telematics systems supplying car driving data which can differentiate drivers based on their driving behavior, mileage driven and time and place of journeys taken. Evidence that telematics data could eliminate cross-subsidies is reported in Tselentis et al. (2017). The resulting improvement in automobile insurance pricing by using this type of data has been recently discussed in Ayuso et al. (2019) and Guillen et al. (2019). See Siami et al. (2020) for methods of extracting driving behavior using telematics data.
Attempts to move from the simple Poisson model to the negative binomial model Dionne and Vanasse (1992) offered an only partial remedy to overdispersion. To account for the excess of zeros, generalizations of the Poisson model have been reported. Lambert (1992) introduced the zero-inflated Poisson regression model and, since then, there has been an influx of applications of zero-inflated regression models based on a variety of distributions. A comprehensive discussion of these models is given in Winkelmann (2008). Flynn (2009) compared the Poisson and negative Binomial models to the zero-inflated models, and Sarul and Sahin (2015) compared Poisson Models and zero-inflated models. Most of these studies fitted the Poisson or negative binomial regression models assuming a Generalized Linear Model (GLM ) framework. An attempts to fit such models to telematics data using the Generalized Additive Model (GAM) is reported in Verbelen et al. (2018).
The important role of finite mixture models in statistical and actuarial analysis is underscored by the ever-growing rate at which articles on the application of mixture models appear in the literature since the publication of the monograph by Everitt and Hand (1981) four decades ago. For solid background on finite mixture models, see Titterington et al. (1985); McLachlan and Peel (2004); Fruhwirth-Schnatter et al. (2019) and Karlis (2019). For a review paper, see McLachlan et al. (2019). As finite mixture distribution generalizes zero-inflated models, one would expect that the former would benefit the pricing process more than the latter, primarily as a departure from the Poisson distribution can also be rooted in reasons other than an excess of zeros. As Park and Lord (2009) and Bermúdez et al. (2020) show, a finite mixture of Poisson or negative binomial regression models is particularly useful for insurance count data collected from heterogeneous populations.
In the search for an optimal pricing model, one typically needs to employ a procedure for variable selection, which can be challenging as stated by Yin et al. (2020), “all-subset selection methods suffer from expensive computational costs”. This is particularly challenging when the number of explanatory variables is very large, as in the case of telematics data. Moreover, when the model is mixture-based, this challenge becomes much more complex. For discussions of variable selections in finite mixture of regression models see Khalili and Chen (2007); Khalili et al. (2011); Devijver (2015); Ormoz and Eskandari (2016); Tang and Karunamuni (2018), and Dai et al. (2019).

2.2. A Review of Mixture Poisson Regression Models and Subset Covariate Selection

Finite mixture of regression models is justified under the assumption that the underlying population is heterogeneous, comprising of different risk groups (which we interchangeably refer to as groups or classes) or when existing standard counting distributions (like Poisson or negative binomial) fail to fit the data for any other reasons. This is justified since, as McLachlan et al. (2019) put it, mixture distributions are widely used to provide computationally convenient representations for modeling complex distributions.
Let the number of claims Y be the random variable of interest, whose distribution is given by the k-component finite mixture model, which takes the form
P ( y | π , θ 1 , , θ k ) = j = 1 k π j P ( y θ j ) ,
where P ( ) is a frequency distribution, which is assumed to be Poisson and the π j s , π j [ 0 , 1 ] , j = 1 k π j = 1 , are the mixing proportions, indicating the probability an insured belongs to risk group j . Without a loss of generality, we assume that k = 2 and that there are p covariates x j T = ( x j , 1 , , x j , p ) such that log ( θ j ) = x j T β j , where β j is a p-vector of regression coefficients used to predict future claims. For the sake of simplifying notation, we do not indicate the exposure which could vary from one insured to another, and unless necessary, suppress the index i denoting a particular insured.
In this paper, the underlying assumption is that P ( y θ j ) = e θ j θ j y y ! , namely, that the count distribution for group j is Poisson with mean θ j . We note that the mean and variance of a two-component Poisson mixture are, respectively, j π θ j and j π ( θ j + θ j 2 ) [ j π θ j ] 2 , a blessed departure from the restrictive equality of mean and variance of the Poisson distribution. See Park et al. (2014, 2016) for applications of such mixtures in modeling vehicle crash data and Brown et al. (2015) for modeling experience rating with Poisson mixtures. A seemingly different model is the zero-inflated Poisson (ZIP) model Wagh and Kamalja (2018), a 2-parameter Poisson-based model, which assumes an atom of probability at zero. ZIP, which has attracted a lot of attention in the literature, has the following structure:
P ( y | π , θ ) = π + ( 1 π ) e θ , y = 0 ( 1 π ) e θ θ y y ! , y > 0 .
Clearly, it is a special case of the Poisson mixture model described above. When considering a mixture of Poisson distributions, we assume a 3-parameter counting distribution that allows considerably more fitting flexibility than the ZIP, a 2-parameter model, focusing on an inflated probability atom at zero. The literature abounds with papers suggesting other modifications to the Poisson model. These include compound frequency and the hurdle models, both with respect to the Poisson and the negative binomial distribution (which is not discussed in this paper). See Yip and Yau (2005); Boucher et al. (2007); Denuit et al. (2007); Cameron and Trivedi (2013); Muoka et al. (2016), and Zamzuri et al. (2018) for more details and references on various alternative models.
The fitting of the model to data, aiming to best predict the number of future claims, requires finding the subset of covariates serving this purpose and estimating the corresponding betas. For a general discussion of variable selection in regression, see Miller (2002), for selection of variables for automobile insurance rating, see Stroiński and Currie (1989) and for variable selection in finite mixture of regression models, see Khalili and Chen (2007), where it is emphasized that in the application of a finite mixture of regression models, when often many covariates are used, their contributions to the response variable vary from one component of the mixture model to another, which creates a complex variable selection problem. Moreover, in their experience, existing methods, such as the Akaike information criterion (AIC) and the Bayes information criterion (BIC), are computationally expensive as the number of covariates and components in the mixture model increases.
In general, subset selection algorithms are founded on measures of performance, and these can be distinguished between in-sample and out-of-sample approaches. The former typically minimizes information criteria like the AIC and the BIC, and the latter would often choose to maximize the area under the curve (AUC), which is in line with modern Data Science philosophy, see Serrano et al. (2010) and de Figueiredo et al. (2018). AUC, as a measure of model predictive power Xu and Suzuki (2013), is the outcome of receiver operating characteristic (ROC) curve analysis Wixted et al. (2017), which plots the true positive rate against the false-positive rate of a binary classifier (claim vs. no claim). We note that while AUC was initially being used for dichotomous variables, adaptation to non-dichotomous variables has been reported in the literature following the monograph of Krzanowski and Hand (2009). See also Barrio et al. (2017). For recent applications of AUC for the GLM and zero-inflated models, see Ren and Kuan (2020) and Jiang et al. (2021). In order to use the AUC as a criterion for variable selection, one needs an efficient and computationally friendly tool for fitting a mixture regression model. Unfortunately, we observe several significant difficulties rooted in the inability of existing algorithms to model a large number of covariates. FLEXMIX, for example, a popular R-package for mixture regression models (see Leisch (2004); Grun and Leisch (2007) and Gruen et al. (2019)), has no option for variable selection, so a dedicated program has to be created to enhance its abilities. This becomes almost infeasible since FLEXMIX tends to stop or fail to converge in the presence of a large number of covariates. This shortcoming is exacerbated by any attempt to harness FLEXMIX for subset selection routine due to the large number of model fittings required in order to reach a desirable subset. For a report of difficulties using FLEXMIX, see Steinmetz (2015). When we attempted to find the best subset of covariates using the telematics data described in Section 4 by a forward stepwise approach that maximizes the AUC, the program crushed multiple times and eventually ran for a prohibitively long time, which made it impractical. The following section proposes an algorithm, which combines the usage of AIC, AUC and FLEXMIX, aimed at facilitating variable selection for mixture Poisson regression, thus enhancing predictive power and improving pricing.

3. An Algorithm for Subset Covariate Selection

The essence of the proposed novel algorithm is as follows: it fits an initial mixture model, which allows a tentative splitting of a portfolio into classes of safe and risky drivers based on their probabilities to belong to a class. Once such a tentative split is at hand, traditional fast Poisson regression analysis can be carried out, identifying variables of importance in these two groups. These variables (of the two classes) are then combined to fit a new mixture Poisson regression which generates a new split and so forth. At each cycle, the prediction power of the mixture model is measured by the area under the curve (AUC) and the model with the highest AUC is the one to be adopted. We now outline the algorithm.
Step 0—Mixture justification:
Test whether a Poisson mixture is a justified model compared to a Poisson model. Proceed only if the Poisson hypothesis is rejected.
Step 1—Data preparation:
Split the data into a training set for model building and a test set for model testing. Traditionally the proportion of the sets are 70% and 30%, respectively. Let N denote the number of observations (drivers) in the training set.
Step 2—Initial variable selection (Note that steps 2–7 are carried out on the training set):
Fit a Poisson regression model using the GLM package and carry a forward selection of variables using AIC.
Step 3—Fitting a mixture Poisson regression model:
π e θ 1 i θ 1 i y i y i ! + ( 1 π ) e θ 2 i θ 2 i y i y i ! , i = 1 , , N ,
allows us to estimate, per each individual in the data set, the mean of each of the Poisson distributions comprising the mixture, θ 1 i , θ 2 i , as a function of the selected features, ( θ j i = e x j i T β ^ j ) .
Step 4—Probabilistic allocation of observations to the two classes:
Step 4.1: The posterior probability that individual i belongs to class 1 (safe drivers, say) is given by
P ( i Class   1 | Data ) = π e θ 1 i θ 1 i y i y i ! π e θ 1 i θ 1 i y i y i ! + ( 1 π ) e θ 2 i θ 2 i y i y i ! .
Clearly, P ( i ∈ Class 2|Data) = 1 P ( i ∈ Class 1|Data). Randomly assign each individual to class 1 or class 2 using the posterior distribution in (4). At the end of this step, we have two sub-samples, one for each class, of sizes N 1 , N 2 , with non-zero claims n 1 and n 2 , respectively.
Step 4.2: Estimate the mean of each class by the weighted averages θ j = i y i P ( i ∈ Class j|Data), j = 1 , 2 . This way, the number of claims allocated to a class is weighted up or down by the probability of belonging to that class. For example, a driver who made more than one claim and has a high probability of belonging to class 2 (risky group), will contribute most of the information to class 2 and not to class 1.
Note the difference between θ j and θ j i . The former is the estimated mean of class j in a Poisson mixture model, and the latter is the mean of individual i in class j as estimated by a mixture Poisson regression model.
Step 5—Poisson enhancement:
Since each sample is likely to violate the Poisson assumption due to overdispersion (excess of zeros), the following procedure is designed to enhance the Poisson distribution by adjusting the number of zeros and reducing the group sizes to N 1 , N 2 , respectively. To establish N j we note that for j = 1 , 2 , the probability of a non-zero claim is 1 e θ j and hence the expected group size ought to be N j = n j 1 e θ j and, therefore, the expected number of zeros is given by N j e θ j . Group j , ( j = 1 , 2 ) , is now restructured to consist of the n j drivers who made at least one claim plus N j e θ j drivers who made no claims, to be randomly selected from the N j n j non-claimants in the group.
Step 6—Variable selection in each group:
Step 6.1: Now that each group is distributed as pseudo Poisson in the sense that the actual number of zeros is related to the probability of zeros, variable selection is to be carried out, on each group separately, by running an AIC-based forward selection Poisson regression (available in standard GLM programs) and the selected variables are to be noted.
Step 6.2: Since steps 4–5 involved random selections, steps 4–6.1 will be repeated numerous times (1000 in this study). In order to establish a score for each variable, starting with a zero score, the score of each selected variable will increase by the value of the inverse of the AIC of each iteration. At the end of this process, the final score will be a function of the number of times a variable is chosen and the strength of the model containing the variable, as measured by the inverse of AIC.
Step 7—Variable selection for a mixture model:
Take top-scored variables from the two groups (we simply took the top 20% from each). Given the partial overlap between the top variables in the two groups, the number of candidate variables for selection at this stage is typically reduced to a significantly smaller number, which FLEXMIX can now handle. Using these candidate variables, carry forward selection for a Poisson mixture model based on AUC using FLEXMIX.
Step 8—Model evaluation:
Assess the quality of the model by evaluating its AUC using the test set.
Step 9—Repetition:
Repeat steps 3–8 numerous times and pick the model whose AUC is the largest. Note that the model chosen in Step 7 serves as an input to step 3 in every iteration.
The algorithm suggested here can be modified to carry variable selection for a mixture of negative binomial regression model. This will not be discussed in this paper.

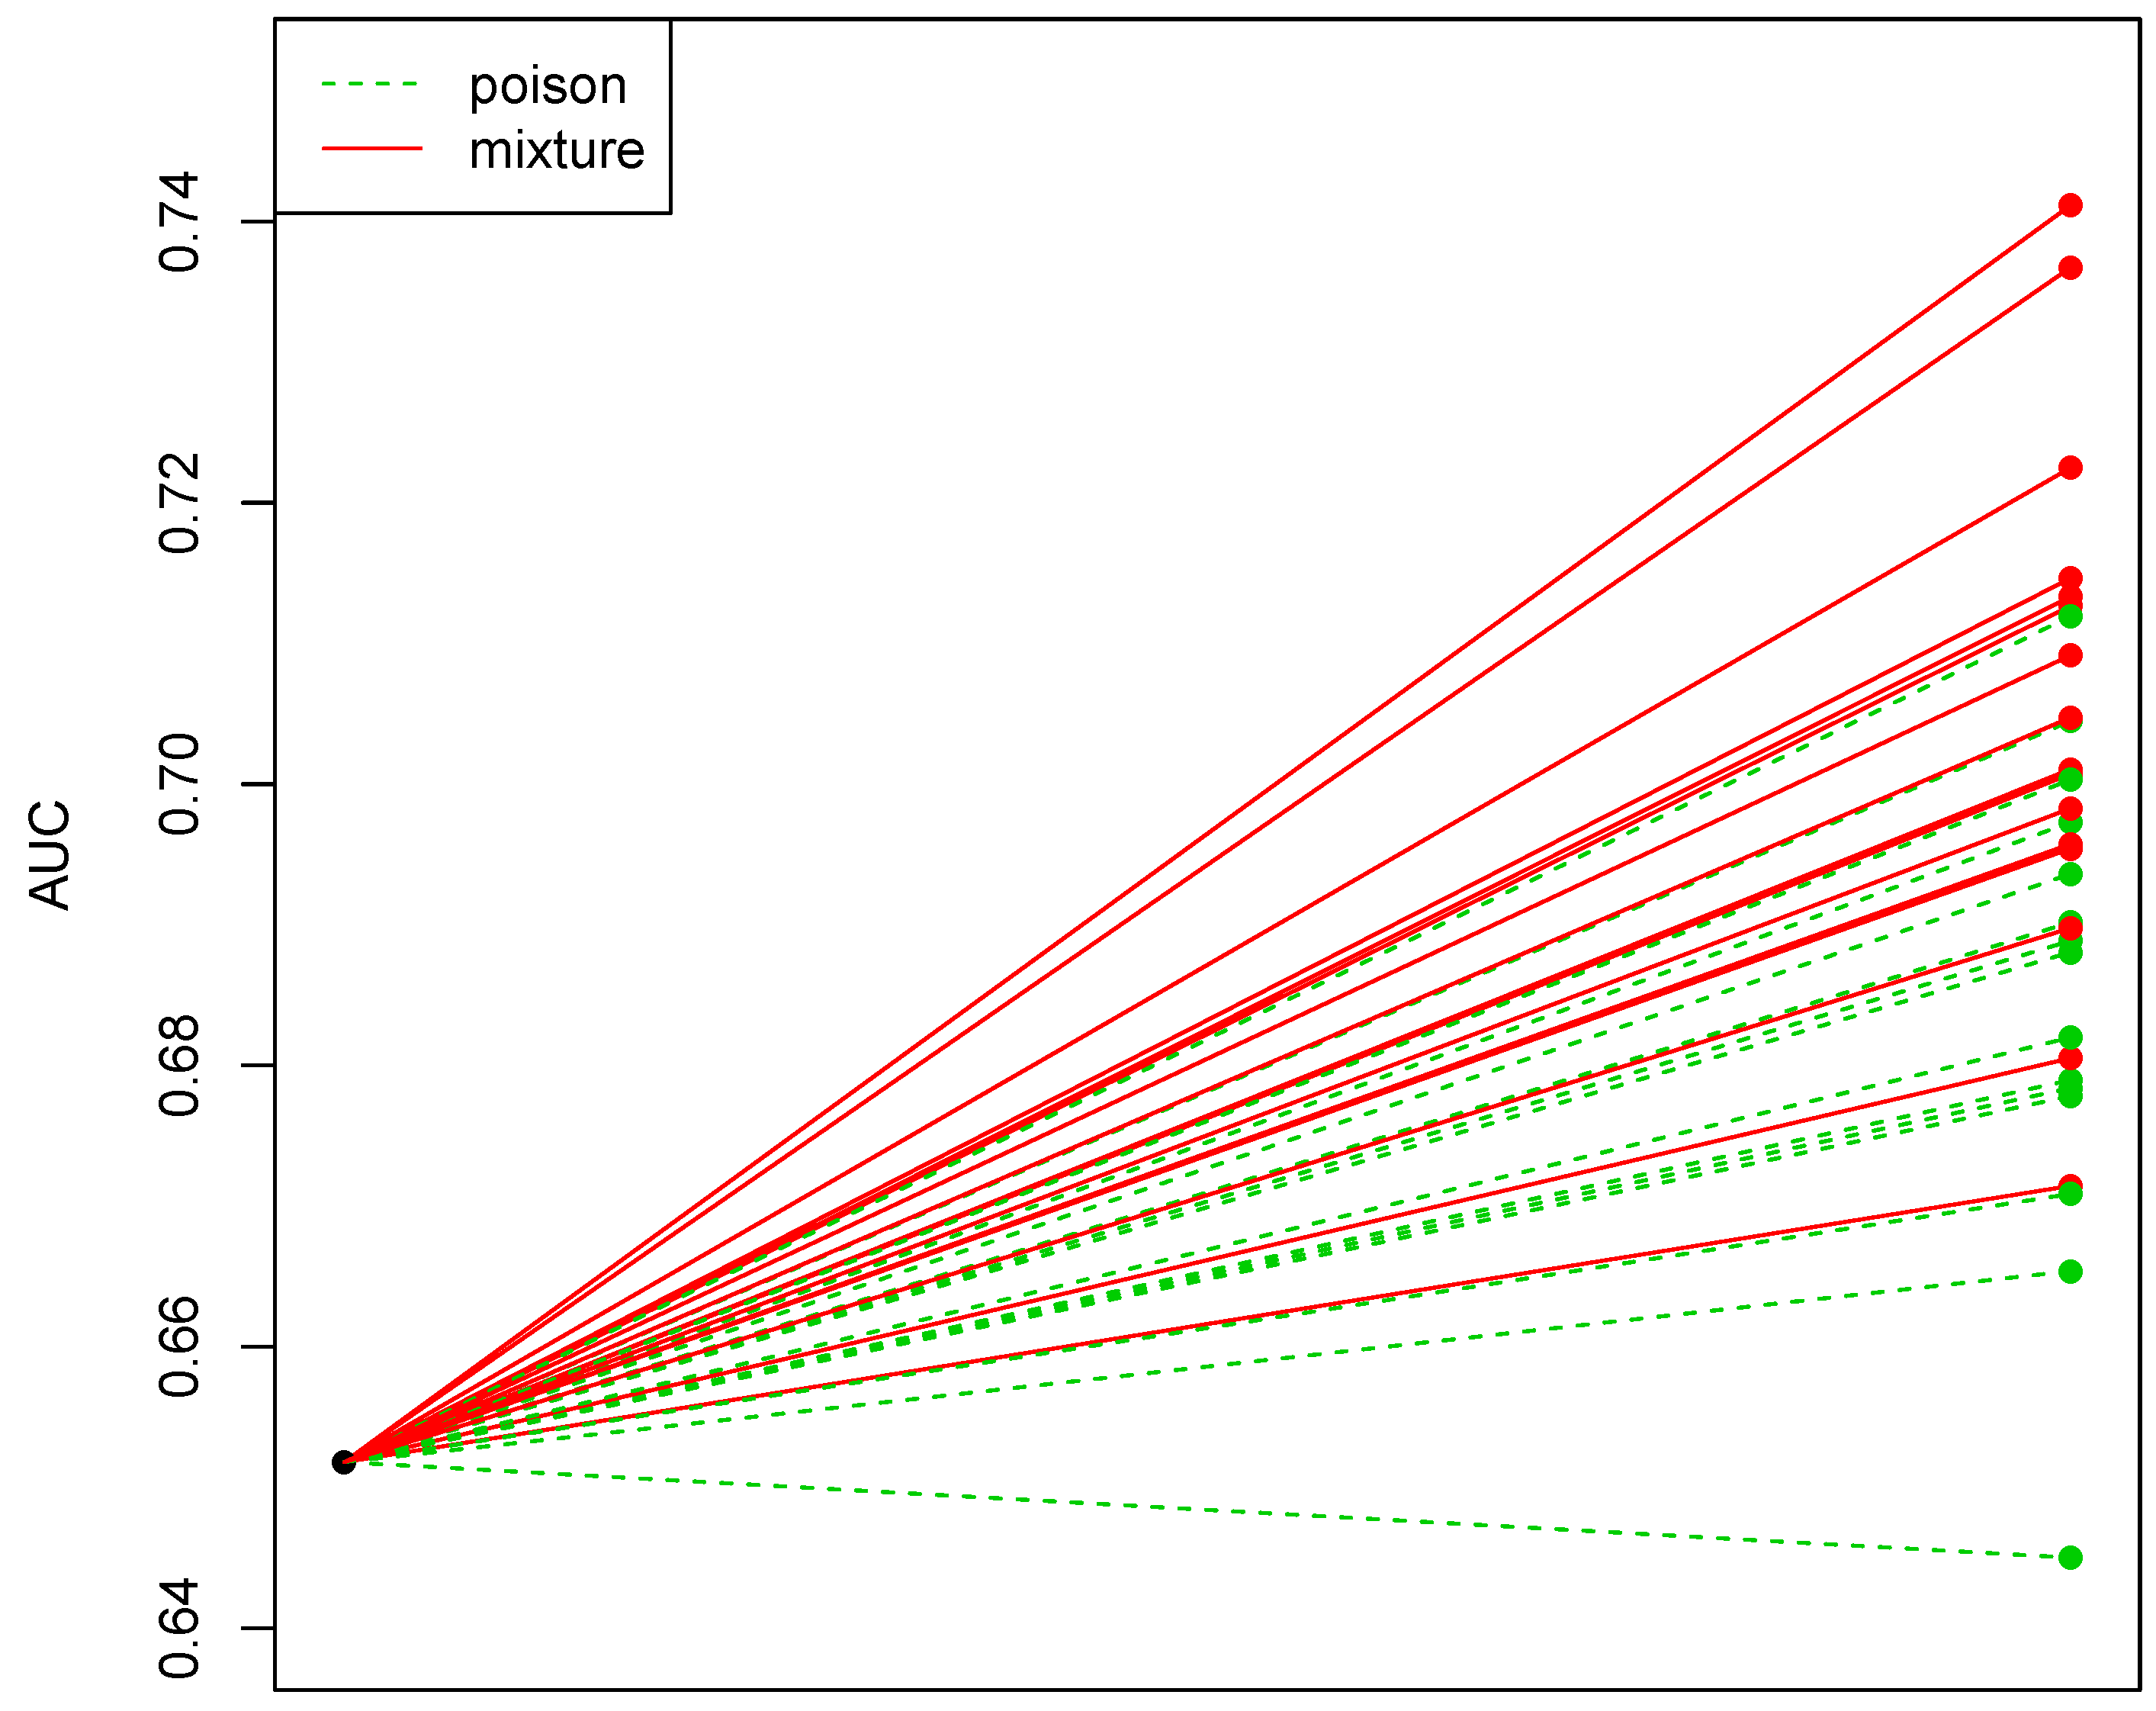
4. Discussion of Experimental Results

This section aims to report the results of an experiment in which the algorithm is applied to real telematics data and compare the results to the traditional Poisson regression model. As typical of telematics data sets, the data set at our disposal is characterized by a large number of covariates. There are 72 such variables, extracting driving behavioral information on 1128 drivers (i.e., the dataset comprises 72 columns and 1128 raws). These variables map acceleration patterns during driving and from a complete stop, right and left turning patterns, and the nature of breaking—both to slow down and to a full stop. In addition, the data indicates proximity to a junction, time of day and day of the week. The exposure of drivers, given in terms of time insured, ranges from 0.5 to 5 years, with 86.7%—zero claims, 7.9%—one claim and 5.4%—more than one claim, mostly two claims. The mean and variance of the number of claims per annum are 0.206 and 0.345, respectively, reflecting the inadequacy of the Poisson distribution, for which both the mean and the variance are expected to be similar.
We now study the goodness-of-fit of both Poisson and Poisson mixture to the data. Testing the assumption of Poisson distribution yields a Chi-square statistic of 108 with p-value < 1 × 10⁻¹⁷; hence, the assumption of Poisson is rejected outright. We further tested the null hypothesis of a Poisson distribution against an alternative hypothesis of a mixture using the Vuong test Vuong (1989), which proved to be smaller than 1 × 10 5 .
Now that the superiority of the Poisson mixture is established, pricing is to be based on the mixture Poisson regression model. Using the R package FLEXMIX to estimate the parameters of the Poisson mixture, we obtain 0.75P(0.0000043) + 0.25P(0.05), where P( θ ) denotes a Poisson distribution with mean θ . This mixture distribution thus describes a heterogeneous portfolio comprising two groups (25%&75%) with respective θ s of (0.05, 0.0000043).
Practicing actuaries are happy to use existing computer packages and commonly assume a simple Poisson regression model, rooted in the GLM framework, for which there are ample routines for variable selection. For the sake of comparison, we fitted a standard Poisson regression model (using AIC criterion for variable selection). This resulted in AUC = 0.652, which is only regarded as “fair”. Note that a random classifier that lacks any modeling would generate AUC = 0.5 and that the closer the AUC to 1, the more powerful the prediction model is. For a model to be “good” or beyond, the AUC should be 0.7 or above (see Bekkar et al. (2013) for more details). Our experience with claim modeling using complex telematics datasets suggests that the Poisson regression model typically seldom goes beyond the “fair” result. We note that due to its random component, each complete algorithmic run would generate a different set of selected covariates and hence a different AUC. When the algorithm was executed multiple times the mean AUC rose from 0.652 to an improved average value of 0.71. In order to get a fuller picture, we ran the algorithm several times and, after each run, evaluated the AUC of the mixture Poisson regression model and a simple Poisson regression model that borrows the subgroup of variables suggested by the algorithm. Figure 1 describes the AUC for Poisson and mixture Poisson regression models. It is evident that, although some overlap, the average AUC of the mixture Poisson model (in red) significantly surpassed that of the Poisson model (in green). Furthermore, the performance of the Poisson models, where the variable selection is based on the algorithm, is better than that of a Poisson regression model where the variables are selected by traditional AIC-based GLM routine (AUC = 0.652). We can now rank the three optional procedures discussed here. The least powerful tool is the conventional Poisson regression model where the variables are selected by traditional AIC-based GLM routine. Improved results are obtained when a Poisson regression model is fitted and the proposed algorithm chooses the variables. The best results are obtained when the algorithm is fully implemented, fitting a mixture regression model and using the proposed variable selection. Clearly, one can always start with less demanding options and only if it fails to perform well move to a more demanding one. The superiority of the mixture model is clearly demonstrated graphically: of the many runs of the algorithm, not only the best performance is that of the mixture model, but most of the runs of the mixture model defeat those of the non-mixture model, even when the latter is allowed the benefit from the variable selection process of the former.

5. Conclusions

Modeling claim data has long been a challenge due to the limited availability of frequency distributions and the difficulty of adequately fitting a distribution to claim data. This is also true in the case of an excessive number of zeros, or overdispersion, which makes the Poisson (or negative binomial) regression model unsuitable for predicting future claims. Despite its shortcoming and the costly prediction errors it generates, many actuaries still use this model since relying on available statistical packages is easy to implement and regarded as a standard practice in the industry. In addition, the very limited number of traditional covariates used in automobile insurance pricing and the mounting in-group heterogeneity that goes with it result in additional financial losses due to the inevitable cross-subsidy. Telematics data, which can supplement traditional variables with information on where, when, and how a car is driven, can considerably reduce this problem at a cost. The increase in covariates presents a risk of overfitting unless an efficient variable selection is adopted. This task, however, is almost computationally infeasible when the number of covariates is very large and when an attempt is made to adopt a more versatile model, as the mixture model suggested here. Such a model is justified since finite mixtures are useful for describing distributions of an entirely unknown form Van Dijk (2009) and can thus offer an approximate counting distribution when standard distributions fail, while representing a zero-inflated-type model as a special case. This paper has devised a novel algorithm to carry out the variable selection for a Poisson mixture model in a practical manner that is computationally feasible. We note that the model can easily be adapted to a negative binomial mixture model and that no similar algorithm has been reported in the literature. The numerical experiment with real telematics data carried out to assess the proposed algorithm quality clearly demonstrates that the new algorithm exhibited superior predictive power (AUC = 0.71) than a traditional GLM variable selection of Poisson regression. This improvement is due to the distributional flexibility of the mixture distribution and the impact of the variables selected by the algorithm. While the cons of algorithms are non-trivial implementation and the need for fine-tuning, the pros are the ability to incorporate telematics data and improve pricing. Perhaps a good course of action is to start with the Poisson (or negative binomial) regression model or a zero inflated model and if variable selection fails or predictive power is insufficient, opt for the proposed algorithm, which currently offers an improved predictive power and a unique solution to variable selection in fitting a Poisson regression model in the presence of a considerable number of covariates.

Author Contributions

Conceptualization, J.S.K.C., S.T.B.C., U.M., A.S. and V.S.; Methodology, J.S.K.C., S.T.B.C., U.M., A.S. and V.S.; Writing-original draft, J.S.K.C., S.T.B.C., U.M., A.S. and V.S. All authors have read and agreed to the published version of the manuscript.

Funding

The Society of Actuaries’ Committee on Knowledge and Extension Research (CKER) and the Casualty Actuarial Society (CAS).

Institutional Review Board Statement

Not applicable.

Informed Consent Statement

Not applicable.

Data Availability Statement

Not applicable.

Acknowledgments

The authors thank three anonymous reviewers whose suggestions helped improve and clarify this manuscript and gratefully acknowledge financial support of The Society of Actuaries’ Committee on Knowledge and Extension Research (CKER) and the Casualty Actuarial Society (CAS). ©2022 Society of Actuaries and Casualty Actuarial Society.

Conflicts of Interest

The authors declare no conflict of interest.

References

  1. Ayuso, Mercedes, Montserrat Guillen, and Jens Perch Nielsen. 2019. Improving automobile insurance ratemaking using telematics: Incorporating mileage and driver behaviour data. Transportation 46: 735–52. [Google Scholar] [CrossRef] [Green Version]
  2. Barrio, Irantzu, Inmaculada Arostegui, María-Xose Rodríguez-Álvarez, and Jose-María Quintana. 2017. A new approach to categorising continuous variables in prediction models: Proposal and validation. Statistical Methods in Medical Research 26: 2586–602. [Google Scholar] [CrossRef] [PubMed]
  3. Bekkar, Mohamed, Hassiba K. Djemaa, and Taklit A. Alitouche. 2013. Evaluation measures for models assessment over imbalanced data sets. Journal of Information Engineering and Applications 3: 27–38. [Google Scholar]
  4. Bermúdez, Lluis, Dimitris Karlis, and Isabel Morillo. 2020. Modeling Unobserved Heterogeneity in Claim Counts Using Finite Mixture Models. Risks 8: 10. [Google Scholar] [CrossRef] [Green Version]
  5. Brown, Garfield O., Steve Brooks, and Winston Buckley. 2015. Experience rating with Poisson mixtures. Annals of Actuarial Science 9: 304–21. [Google Scholar] [CrossRef] [Green Version]
  6. Boucher, Jean-Philippe, Michel Denuit, Montserrat Guillén, and Philip Morrison. 2007. Risk classification for claim counts: A comparative analysis of various zeroinflated mixed Poisson and hurdle models. North American Actuarial Journal 11: 110–31. [Google Scholar] [CrossRef] [Green Version]
  7. Cameron, A. Colin, and Pravin K. Trivedi. 2013. Regression Analysis of Count Data. Cambridge: Cambridge University Press, vol. 53. [Google Scholar]
  8. Dai, Lin, Junhui Yin, Zhengfen Xie, and Liucang Wu. 2019. Robust variable selection in finite mixture of regression models using the t distribution. Communications in Statistics-Theory and Methods 48: 5370–86. [Google Scholar] [CrossRef]
  9. Denuit, Michel, Xavier Maréchal, Sandra Pitrebois, and Jean-Francois F. Walhin. 2007. Actuarial Modeling of Claim Counts: Risk Classification, Credibility and Bonus-Malus Systems. Hoboken: John Wiley & Sons. [Google Scholar]
  10. Devijver, Emilie. 2015. Finite mixture regression: A sparse variable selection by model selection for clustering. Electronic Journal of Statistics 9: 2642–74. [Google Scholar] [CrossRef]
  11. Dionne, Georges, and Charles Vanasse. 1992. Automobile insurance ratemaking in the presence of asymmetrical information. Journal of Applied Econometrics 7: 149–65. [Google Scholar] [CrossRef]
  12. Duan, Zhenmin, Yonglian Chang, Qi Wang, Tianyao Chen, and Qing Zhao. 2018. A logistic regression based auto insurance rate-making model designed for the insurance rate reform. International Journal of Financial Studies 6: 18. [Google Scholar] [CrossRef] [Green Version]
  13. de Figueiredo, Miguel, Christophe B. Y. Cordella, Delphine J. R. Bouveresse, Xavier Archer, Jean-Marc Bégué, and Douglas N. Rutledge. 2018. A variable selection method for multiclass classification problems using two-class ROC analysis. Chemometrics and Intelligent Laboratory Systems 177: 35–46. [Google Scholar] [CrossRef] [Green Version]
  14. Everitt, Brian S., and David J. Hand. 1981. Finite Mixture Distributions. London: Chapman and Hall. [Google Scholar]
  15. Flynn, Mathew. 2009. More Flexible GLMs Zero-Inflated Models and Hybrid Models. Casualty Actuarial Society E-Forum, 148–224. Available online: https://www.casact.org/pubs/forum/09wforum/flynn_francis.pdf (accessed on 20 March 2021).
  16. Fruhwirth-Schnatter, Sylvia, Gilles Celeux, and Christian P. Robert. 2019. Handbook of Mixture Analysis. London: Chapman and Hall/CRC. [Google Scholar]
  17. Gruen, Bettina, Friedrich Leisch, Deepayan Sarkar, Frederic Mortier, Nicolas Picard, and Maintainer Bettina Gruen. 2019. Package ‘Flexmix’. Available online: https://mran.microsoft.com/snapshot/2016-06-0/web/packages/flexmix/index.html (accessed on 22 June 2016).
  18. Grun, Bettina, and Friedrich Leisch. 2007. FlexMix: An R Package for Finite Mixture Modeling. Available online: https://cran.r-project.org/web/packages/flexmix/vignettes/flexmix-intro.pdf (accessed on 22 March 2021).
  19. Guillen, Montserrat, Jens Perch Nielsen, Mercedes Ayuso, and Ana M. Pérez-Marín. 2019. The use of telematics devices to improve automobile insurance rates. Risk Analysis 39: 662–72. [Google Scholar] [CrossRef] [PubMed]
  20. Jiang, Shuang, Guanghua Xiao, Andrew Y. Koh, Jiwoong Kim, Qiwei Li, and Xiaowei Zhan. 2021. A Bayesian zero-inflated negative binomial regression model for the integrative analysis of microbiome data. Biostatistics 22: 522–40. [Google Scholar] [CrossRef] [PubMed] [Green Version]
  21. Karlis, Dimitris. 2019. Mixture modeling of Discrete Data. In Handbook of Mixture Analysis. London: Chapman and Hall/CRC, pp. 193–218. [Google Scholar]
  22. Khalili, Abbas, and Jiahua Chen. 2007. Variable selection in finite mixture of regression models. Journal of the American Statistical Association 102: 1025–38. [Google Scholar] [CrossRef] [Green Version]
  23. Khalili, Abbas, Jiahua Chen, and Shili Lin. 2011. Feature selection in finite mixture of sparse normal linear models in high-dimensional feature space. Biostatistics 12: 156–72. [Google Scholar] [CrossRef] [Green Version]
  24. Krzanowski, Wojtek J., and David J. Hand. 2009. ROC Curves for Continuous Data. Boca Raton: CRC Press. [Google Scholar]
  25. Lambert, Diane. 1992. Zero-inflated Poisson regression, with an application to defects in manufacturing. Technometrics 34: 1–14. [Google Scholar] [CrossRef]
  26. Leisch, Friedrich. 2004. Flexmix: A General Framework for Finite Mixture Models and Latent Glass Regression in R. Available online: https://ro.uow.edu.au/cgi/viewcontent.cgi?article=1489&context=buspapers (accessed on 18 October 2004).
  27. McLachlan, Geoffrey J., and David Peel. 2004. Finite Mixture Models. Hoboken: John Wiley & Sons. [Google Scholar]
  28. McLachlan, Geoffrey J., Sharon X. Lee, and Suren I. Rathnayake. 2019. Finite mixture models. Annual Review of Statistics and Its Application 6: 355–78. [Google Scholar] [CrossRef]
  29. Miller, Alan. 2002. Subset Selection in Regression. London: Chapman and Hall/CRC. [Google Scholar]
  30. Muoka, Alexander Kasyoki, Oscar Owino Ngesa, and Anthony Gichuhi Waititu. 2016. Statistical models for count data. Science Journal of Applied Mathematics and Statistics 4: 256–62. [Google Scholar] [CrossRef] [Green Version]
  31. Ormoz, Ehsan, and Farzad Eskandari. 2016. Variable selection in finite mixture of semi-parametric regression models. Communications in Statistics-Theory and Methods 45: 695–711. [Google Scholar] [CrossRef]
  32. Park, Byung-Jung, and Dominique Lord. 2009. Application of finite mixture models for vehicle crash data analysis. Accident Analysis and Prevention 41: 683–91. [Google Scholar] [CrossRef] [PubMed] [Green Version]
  33. Park, Byung-Jung, Dominique Lord, and Chungwon Lee. 2014. Finite mixture modeling for vehicle crash data with application to hotspot identification. Accident Analysis & Prevention 71: 319–26. [Google Scholar]
  34. Park, Byung-Jung, Dominique Lord, and Lingtao Wu. 2016. Finite mixture modeling approach for developing crash modification factors in highway safety analysis. Accident Analysis & Prevention 97: 274–87. [Google Scholar]
  35. Ren, Xu, and Pei-Fen Kuan. 2020. Negative binomial additive model for RNA-Seq data analysis. BMC Bioinformatics 21: 171. [Google Scholar] [CrossRef] [PubMed]
  36. Sarul, Latife Sinem, and Serap Sahin. 2015. An application of claim frequency data using zero inflated and hurdle models in general insurance. Journal of Business Economics and Finance 4: 732–43. [Google Scholar] [CrossRef] [Green Version]
  37. Serrano, Antonio J., Emilio Soria Olivas, Jose D. Martín-Guerrero, Rafael Magdalena, and Juan Gomez-Sanchis. 2010. Feature selection using roc curves on classification problems. Paper presented at IEEE 2010 International Joint Conference on Neural Networks (IJCNN), Barcelona, Spain, July 18–23; pp. 1–6. [Google Scholar]
  38. Siami, Mohammad, Mohsen Naderpour, and Jie Lu. 2020. A Mobile Telematics Pattern Recognition Framework for Driving Behavior Extraction. IEEE Transactions on Intelligent Transportation Systems 22: 1459–72. [Google Scholar] [CrossRef]
  39. Steinmetz, Holger. 2015. Problems with the Flexmix-Package in R for Using Mixture Regression Models. Available online: https://www.researchgate.net/post/Problems_with_the_flexmix-package_in_R_for_using_mixture_regression_models (accessed on 7 May 2015).
  40. Stroiński, Krzysztof J., and Iain D. Currie. 1989. Selection of variables for automobile insurance rating. Insurance: Mathematics and Economics 8: 35–46. [Google Scholar] [CrossRef]
  41. Tang, Qingguo, and Rohana J. Karunamuni. 2018. Robust variable selection for finite mixture regression models. Annals of the Institute of Statistical Mathematics 70: 489–521. [Google Scholar] [CrossRef]
  42. Titterington, D. Michael, Adrian F. M. Smith, and Udi E. Makov. 1985. Statistical Analysis of Finite Mixture Distributions. Chichester: John Wiley & Sons Ltd. [Google Scholar]
  43. Tselentis, Dimitrios I., George Yannis, and Eleni I. Vlahogianni. 2017. Innovative motor insurance schemes: A review of current practices and emerging challenges. Accident Analysis & Prevention 98: 139–48. [Google Scholar]
  44. Van Dijk, B. 2009. Essays on Finite Mixture Models (No. 458). Tinbergen Institute Research Series; Amsterdam: Tinbergen Institute. [Google Scholar]
  45. Verbelen, Roel, Katrien Antonio, and Gerda Claeskens. 2018. Unravelling the predictive power of telematics data in car insurance pricing. Journal of the Royal Statistical Society: Series C (Applied Statistics) 67: 1275–304. [Google Scholar] [CrossRef] [Green Version]
  46. Vuong, Quang H. 1989. Likelihood ratio tests for model selection and non-nested hypotheses. Econometrica: Journal of the Econometric Society 57: 307–33. [Google Scholar] [CrossRef] [Green Version]
  47. Wagh, Yogita S., and Kirtee K. Kamalja. 2018. Zero-inflated models and estimation in zero-inflated Poisson distribution. Communications in Statistics-Simulation and Computation 47: 2248–65. [Google Scholar] [CrossRef]
  48. Winkelmann, Rainer. 2008. Econometric Analysis of Count Data, 5th ed. Berlin: Springer. [Google Scholar]
  49. Wixted, John T., Laura Mickes, Stacy A. Wetmore, Scott D. Gronlund, and Jeffrey S. Neuschatz. 2017. ROC analysis in theory and practice. Journal of Applied Research in Memory and Cognition 6: 343–51. [Google Scholar] [CrossRef]
  50. Xu, Jian-Wu, and Kenji Suzuki. 2013. Max-AUC feature selection in computer-aided detection of polyps in CT colonography. IEEE Journal of Biomedical and Health Informatics 18: 585–93. [Google Scholar] [CrossRef] [PubMed] [Green Version]
  51. Yin, Junhui, Liucang Wu, and Lin Dai. 2020. Variable selection in finite mixture of regression models using the skew-normal distribution. Journal of Applied Statistics 47: 2941–60. [Google Scholar] [CrossRef]
  52. Yip, Karen C. H., and Kelvin K. W. Yau. 2005. On modeling claim frequency data in general insurance with extra zeros. Insurance: Mathematics and Economics 36: 153–63. [Google Scholar] [CrossRef]
  53. Zahi, Jamal. 2021. Non-life insurance ratemaking techniques. International Journal of Accounting. Finance, Auditing, Management and Economics 2: 344–61. [Google Scholar]
  54. Zamzuri, Zamira Hasanah, Mohd Syafiq Sapuan, and Kamarulzaman Ibrahim. 2018. The Extra Zeros in Traffic Accident Data: A Study on the Mixture of Discrete Distributions. Sains Malaysiana 47: 1931–40. [Google Scholar] [CrossRef]
Figure 1. Impact of the algorithm on the AUC.
Risks 10 00083 g001
Publisher’s Note: MDPI stays neutral with regard to jurisdictional claims in published maps and institutional affiliations.

