Implications of Land-Grabbing on the Ecological Balance of Brazil
by

Luca Coscieme
1,*, 
Valentina Niccolucci
2,
Biagio F. Giannetti
3,4,
Federico M. Pulselli
2,
Nadia Marchettini
2 and
Paul C. Sutton
5
1
Department of Zoology, School of Natural Sciences, Trinity College, D02 PN40 Dublin 2, Ireland
2
Ecodynamics Group, Department of Physical Sciences, Earth and Environment, University of Siena, 53100 Siena, Italy
3
Post-Graduation Program in Production Engineering, Paulista University, São Paulo 04026-002, Brazil
4
State Key Joint Laboratory of Environment Simulation and Pollution Control, School of Environment, Beijing Normal University, Beijing 100875, China
5
Department of Geography and the Environment, University of Denver, Denver, CO 80210, USA
*
Author to whom correspondence should be addressed.
Resources 2018, 7(3), 44; https://doi.org/10.3390/resources7030044
Submission received: 25 May 2018
/
Revised: 19 July 2018
/
Accepted: 27 July 2018
/
Published: 31 July 2018
(This article belongs to the Special Issue Ecological Footprint Assessment for Resources Management)
Abstract
:In the global free-market, natural resource scarcity and opportunities for preserving the local environment are fostering international purchasing of large extensions of land, mainly for agricultural use. These land transactions often involve land cover change (i.e., through deforestation) or a shift from extensive or traditional to intensive agricultural practices. In Brazil, the land appropriation by foreign investors (i.e., the so-called “land-grabbing”) is affecting natural capital availability for local communities to a different extent in the very different territorial entities. At the same time, Brazilian investors are purchasing land in other countries. Ecological footprint accounting is one appropriate lens that can be employed to visualize the aggregated effect of natural capital appropriation and use. The aim of this paper is to provide a first estimate on the effect of land-grabbing on the ecological balance of Brazil through calculating the biocapacity embodied in purchased lands in the different states of Brazil. The results show that Brazil is losing between 9 to 9.3 million global hectares (on a gross basis, or a net total of 7.7 to 8.6 million of global hectares) of its biocapacity due to land-grabbing, when considering respectively a “cropland to cropland” (i.e., no land-cover change) and a “total deforestation” scenario. This represents a minimum estimate, highlighting the need for further land-grabbing data collection at the subnational scale. This analysis can be replicated for other countries of the world, adjusting their ecological balance by considering the biocapacity embodied in international transactions of land.
1. Introduction
Natural resource scarcity alters global trade dynamics with local and global environmental and socio-economic repercussions [1,2]. Inequalities between and within countries and the rules of the global market are shaping a geography where rich investors acquire resources located in low-income countries or regions [3,4,5]. This regards a vast range of resources, from fossil to nuclear fuels, to rare earths and metals used in the high-tech and mobile phone industry. It also regards one very basic natural resource, i.e., land, purchased in large extensions mostly for agricultural purposes, but also for forestry and energy purposes [6,7].
The number of transnational land deals from countries or corporations peaked in 2008, in the aftermath of the global economic crisis [8]. The fast increasing trend alerted the environmental and social science community, as well as the civil society [9]. These investments in land often occur without consulting or sharing the benefits with current land users and local communities, which is why they are commonly referred to as “land-grabbing” by the media, international organization reports, and in the scientific literature [10,11,12].
Despite the fact that foreign investments in land could potentially create job opportunities, help develop infrastructures, and increase commodity production, land-grabbing is much more often associated with unsustainable agricultural practices, environmental impacts, and the violation of human rights [8]. During the last few years, it has been largely discussed if and how it should be limited or regulated through global governance [13]. Further research is needed to fully understand its consequences in terms of food security and biodiversity conservation [14,15]. There are concerns that the ultimate socio-economic effect of land-grabbing is widening the gap between the global rich and the global poor [16].
Several studies have demonstrated that the main driver of land-grabbing is affluence, to the extent that actual land availability and land distribution at the global scale are of less importance [17,18]. However, while market data make clear that “land-grabbers” are investors from high-income countries, the geography of the “land-grabbed” is more complex, involving aspects such as within-country inequalities and levels of corruption.
Brazil represents an exemplary case study to understand this complexity, being a megadiverse country containing the largest rainforest on Earth, and being, at the same time, an active buyer and seller of land to foreign investors. Inequalities in income and natural resource distribution among the states of Brazil are so prominent that they cannot be ignored as potentially important factors driving foreign investments [19,20]. As a consequence, the most relevant scale to understand land-grabbing dynamics in Brazil is the subnational scale, while analysis at the national scale refers to a highly heterogeneous socio-ecological and economic system.
Despite most land purchasing involving agricultural use, the purchased land is not necessarily cultivated before the acquisition and is the result of land-use change through, for example, deforestation [21]. When this occurs, a diversity of nature’s contributions to people is lost, especially if monocultures are then implanted [22,23]. Many of these contributions and resources embodied in the land are not captured by transaction prices, which are thus a poor measure to understand how the interlinked global network of land transactions is affecting the allocation and redistribution of natural resources at a global scale and within countries.
The Ecological Footprint accounting is a proxy widely used to address one core question: how much of the biosphere’s regenerative capacity does a human demand? Through the Biocapacity indicator, it also gives a measure of the biosphere’s regenerative capacity on a yearly basis (supply). In concept, this framework is able to provide remarkable information on worldwide natural resource provision and consumption [24,25]. By converting the ecological assets into the related ecosystem services provided [26], Biocapacity captures both the land extension and the regenerative capacity of each country of the world. This enables cross-country comparisons and provides insights into the bioproductivity exchanged through land transaction.
The aim of this paper is to present an ordered inventory of international land trade, involving Brazil and its states. Furthermore, we will examine the ecological balance of Brazil, with particular reference to the Biocapacity traded (i.e., sold or purchased) through land grabbing, by using data at the subnational scale.
2. Materials and Methods
2.1. Land-Grabbing Data
Since 2008, information on international land purchasing, such as the investor’s country of origin, the amount of money involved in the transaction, the country where the land is located, and the intended final land use, have been collected by several organizations and made publicly available (e.g., through the GRAIN database http://www.grain.org). However, data mostly refer to the national scale, with very few databases allowing downscaling or providing the exact location of the land purchased.
The Land Matrix database is one of the few providing land deals information at the local scale (http://landmatrix.org; last accessed November, 2017). In the Land Matrix database, land deals are classified by target country and for each deal with Brazil as the target country, we extracted the following information: (1) investor country; (2) intention of investment; (3) intended size (area); and (4) location of the land (i.e., in which one of the states of Brazil the land is physically located). The Land Matrix database is constantly changing and is expected to become more accurate over time. Data reliability is affected by the inherent lack of transparency regarding land deals information. This is particularly relevant in countries where negotiations and decisions on land deals do not take place in the public realm. Furthermore, data is provided by multiple sources and a range of different government actors are responsible for approving different kinds of land deals. Therefore, even official data sources in the same country can vary.
According to Rulli et al. [8], Brazil is the third most grabbed country in the world, with a grabbed area of 22.55 × 10⁵ ha, equal to 5% of the total global grabbed land in the world and 3.3% of Brazil’s cultivated land. Our results confirm this general picture, although the estimation of the extent of the total grabbed area is quite different, mainly due to the different scale considered in our study (i.e., subnational versus the national scale considered in Rulli et al. [8]), and because of the dynamic nature of the database used.
2.2. Biocapacity
The Ecological Footprint is a resource-based accounting methodology with a consumer-based perspective. It provides two core metrics, the Ecological Footprint (EF) and the Biocapacity (BC), as proxies to appraise the demand on, and the supply of, natural resources and ecosystem services, respectively [24,25,26,27,28,29,30]. The EF and the BC are both quantified in terms of global hectares (gha), which is a biologically productive hectare with world average biological productivity, for a given year [25,27,29]. The global hectare is needed to account for the different productivity of land types and to allow cross country comparison. The conversion of physical hectares into global hectares is possible through two scaling factors that are able to capture differences between (i) the local and world-average productivity of a land type (yield factor) and (ii) the productivity of each land type and the world average productivity of all the biologically productive land types (equivalence factor) [31].
In this paper, we focus in particular on the BC accounting to evaluate the embedded biological capacity of the areas traded. Once the extension (A, expressed in ha) of a physical area of an i-land type involved in international transaction is available, the conversion in BC (measured in gha) is possible, according to Equation (1) [25,29,31]:
where:
- -
- i represents the land type, i.e., cropland, pasture, fishing ground, forest, and built up.
- -
- YF is the Yield Factor, i.e., the land specific factor that reflects the relative productivity of national (N) and world average hectares of a given land use type (i). Each country (N), in each year, has a set of yield factors for each land use type (i);
- -
- EQF is the Equivalence Factor, i.e., the factor able to account for the relative productivity of world average hectares of different land use types (i). EQF is specific for land type (i) and not for country. So for each year, there is a unique set of equivalence factors.
The values of EQF and YF were extracted from the database released by the Global Footprint Network (GFN) for the reference year 2013 [32].
The Ecological Footprint method captures snapshots of the ecological balance by comparing BC vs EF [25,27,28,33]. When this balance is positive (BC > EF), a country runs an ecological reserve, i.e., it has an ecological reserve because the resources and ecosystem services produced are more abundant than those consumed. On the contrary, when the balance is negative (BC < EF), a country runs an ecological deficit.
Every year, the GFN makes available the results of National Footprint Accounts for most of the world’s countries, producing a worldwide overview on ecological creditors and debtors [34]. The calculations are mainly based on United Nations data sets, as well as those provided by the Food and Agriculture Organization, United Nations Commodity Trade Statistics Database, and International Energy Agency [28].
3. Results and Discussion
3.1. Land-Grabbing in Brazil
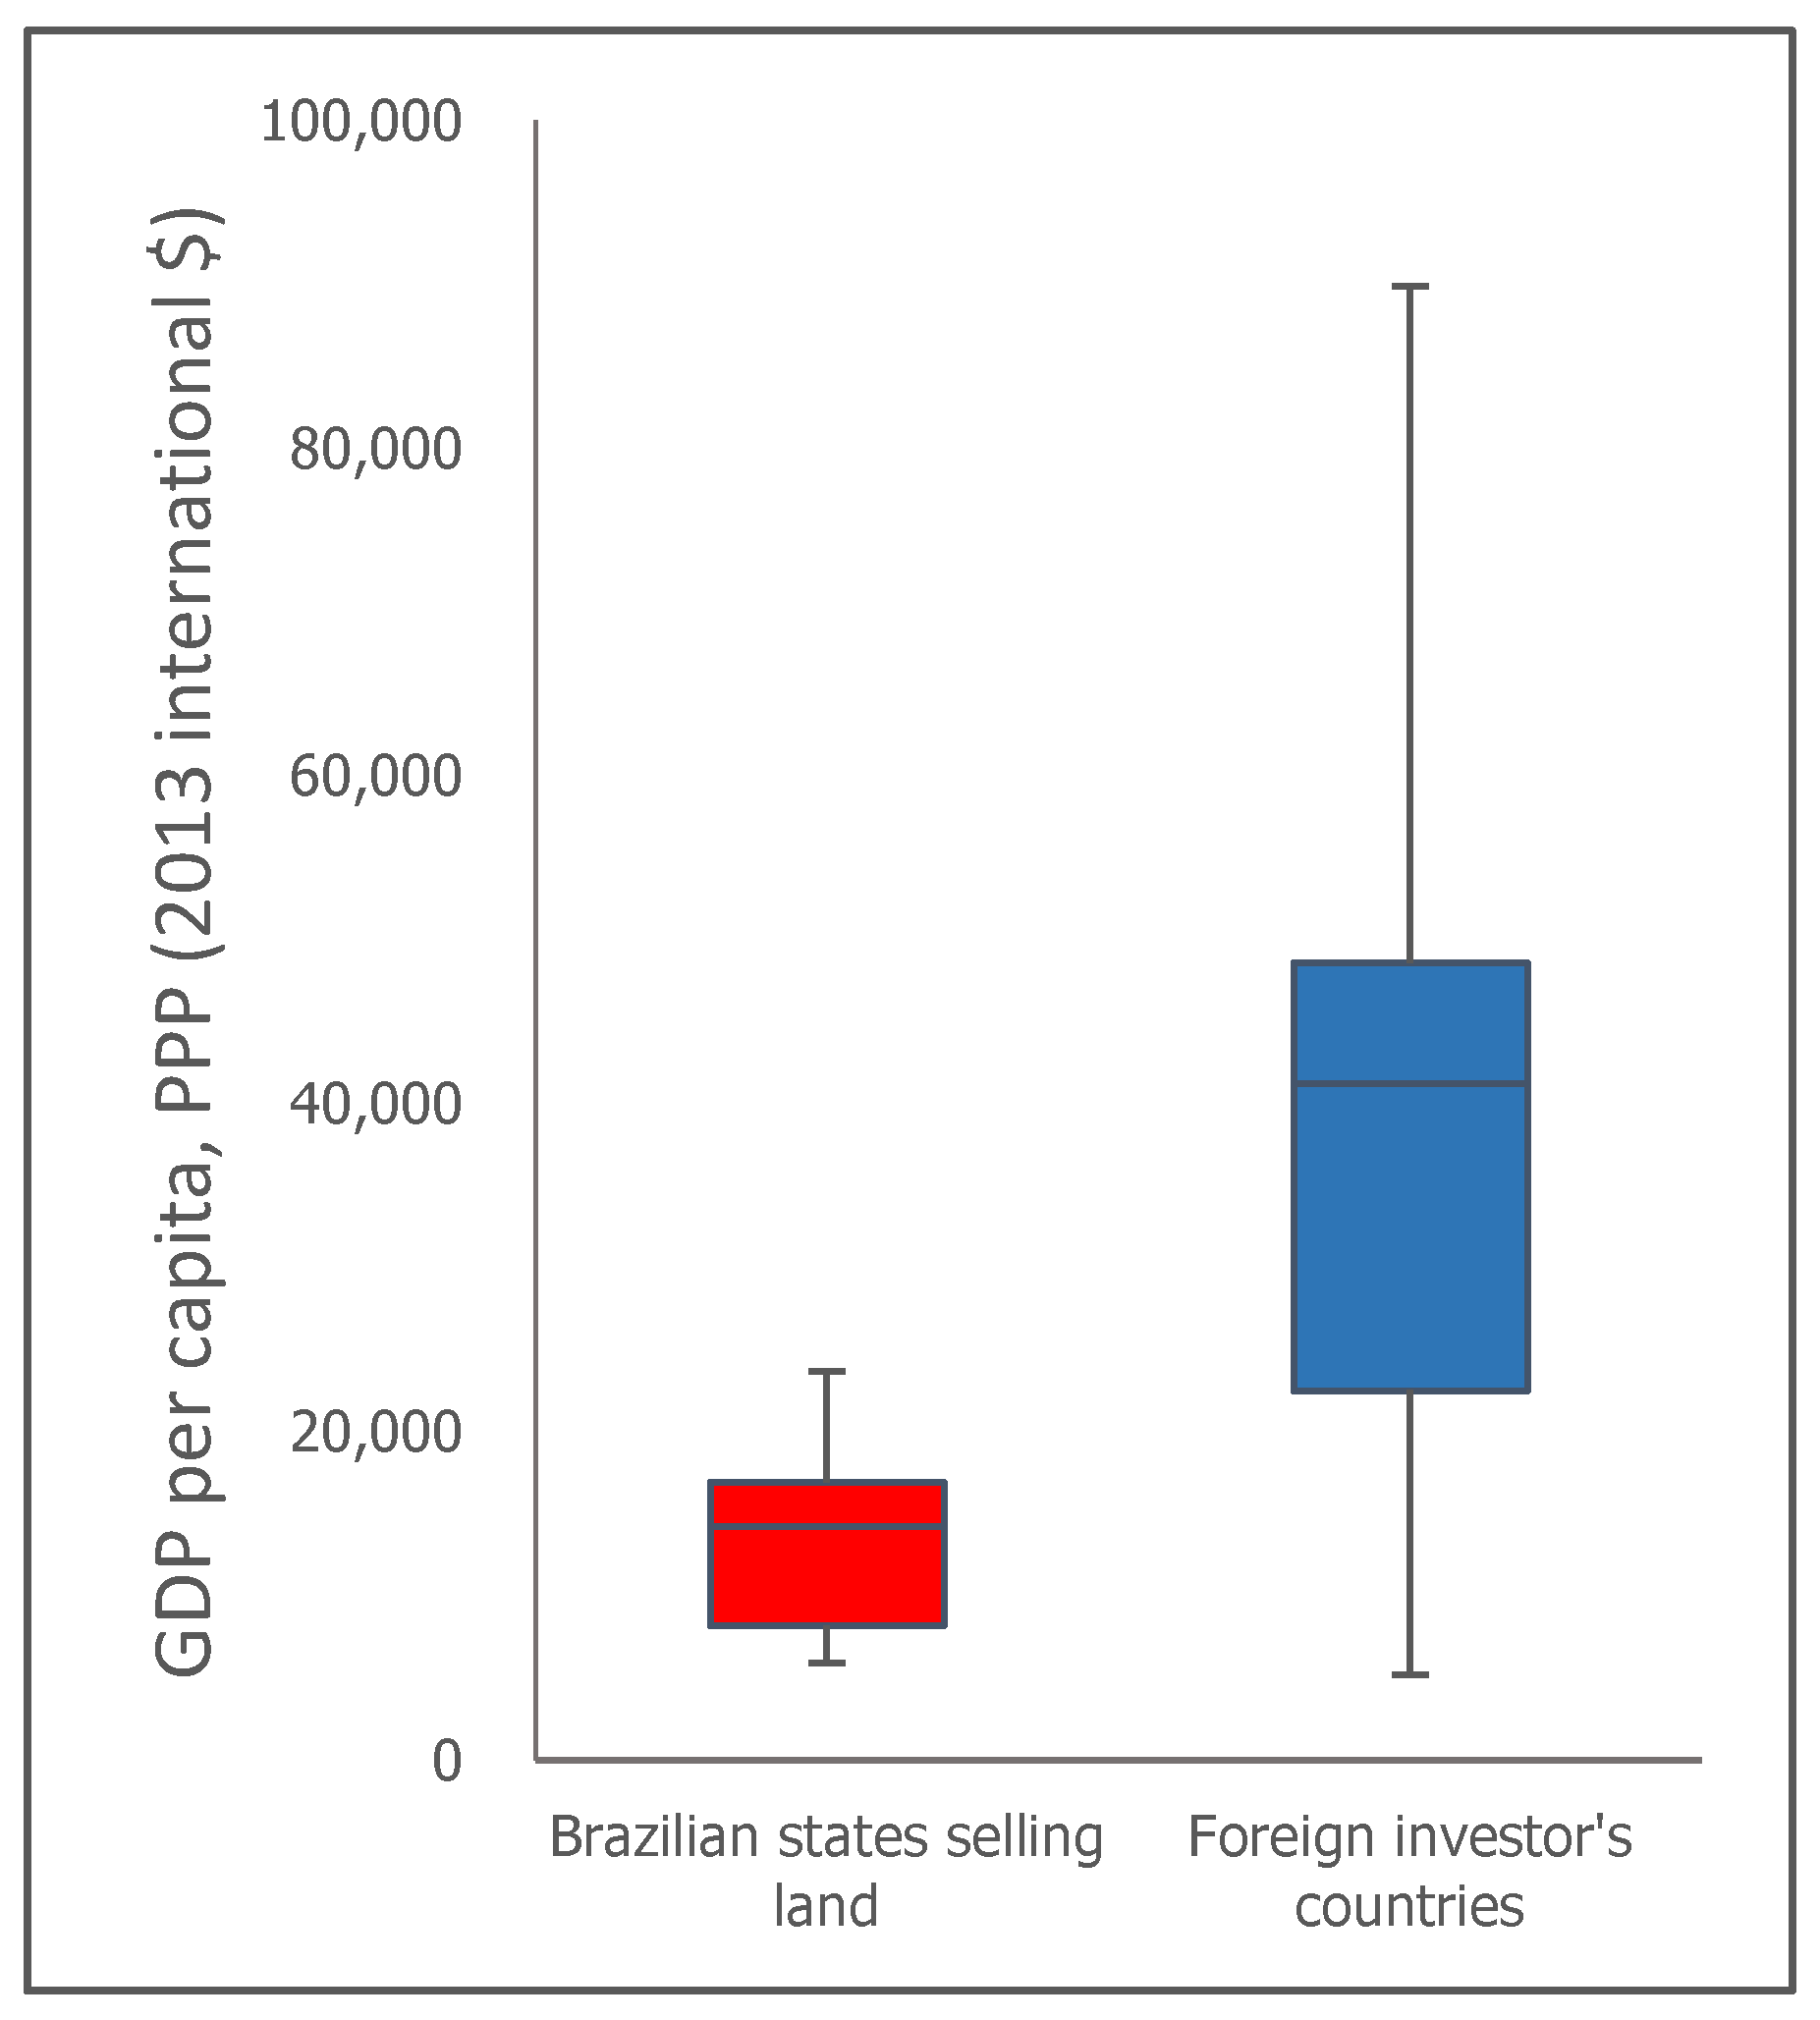
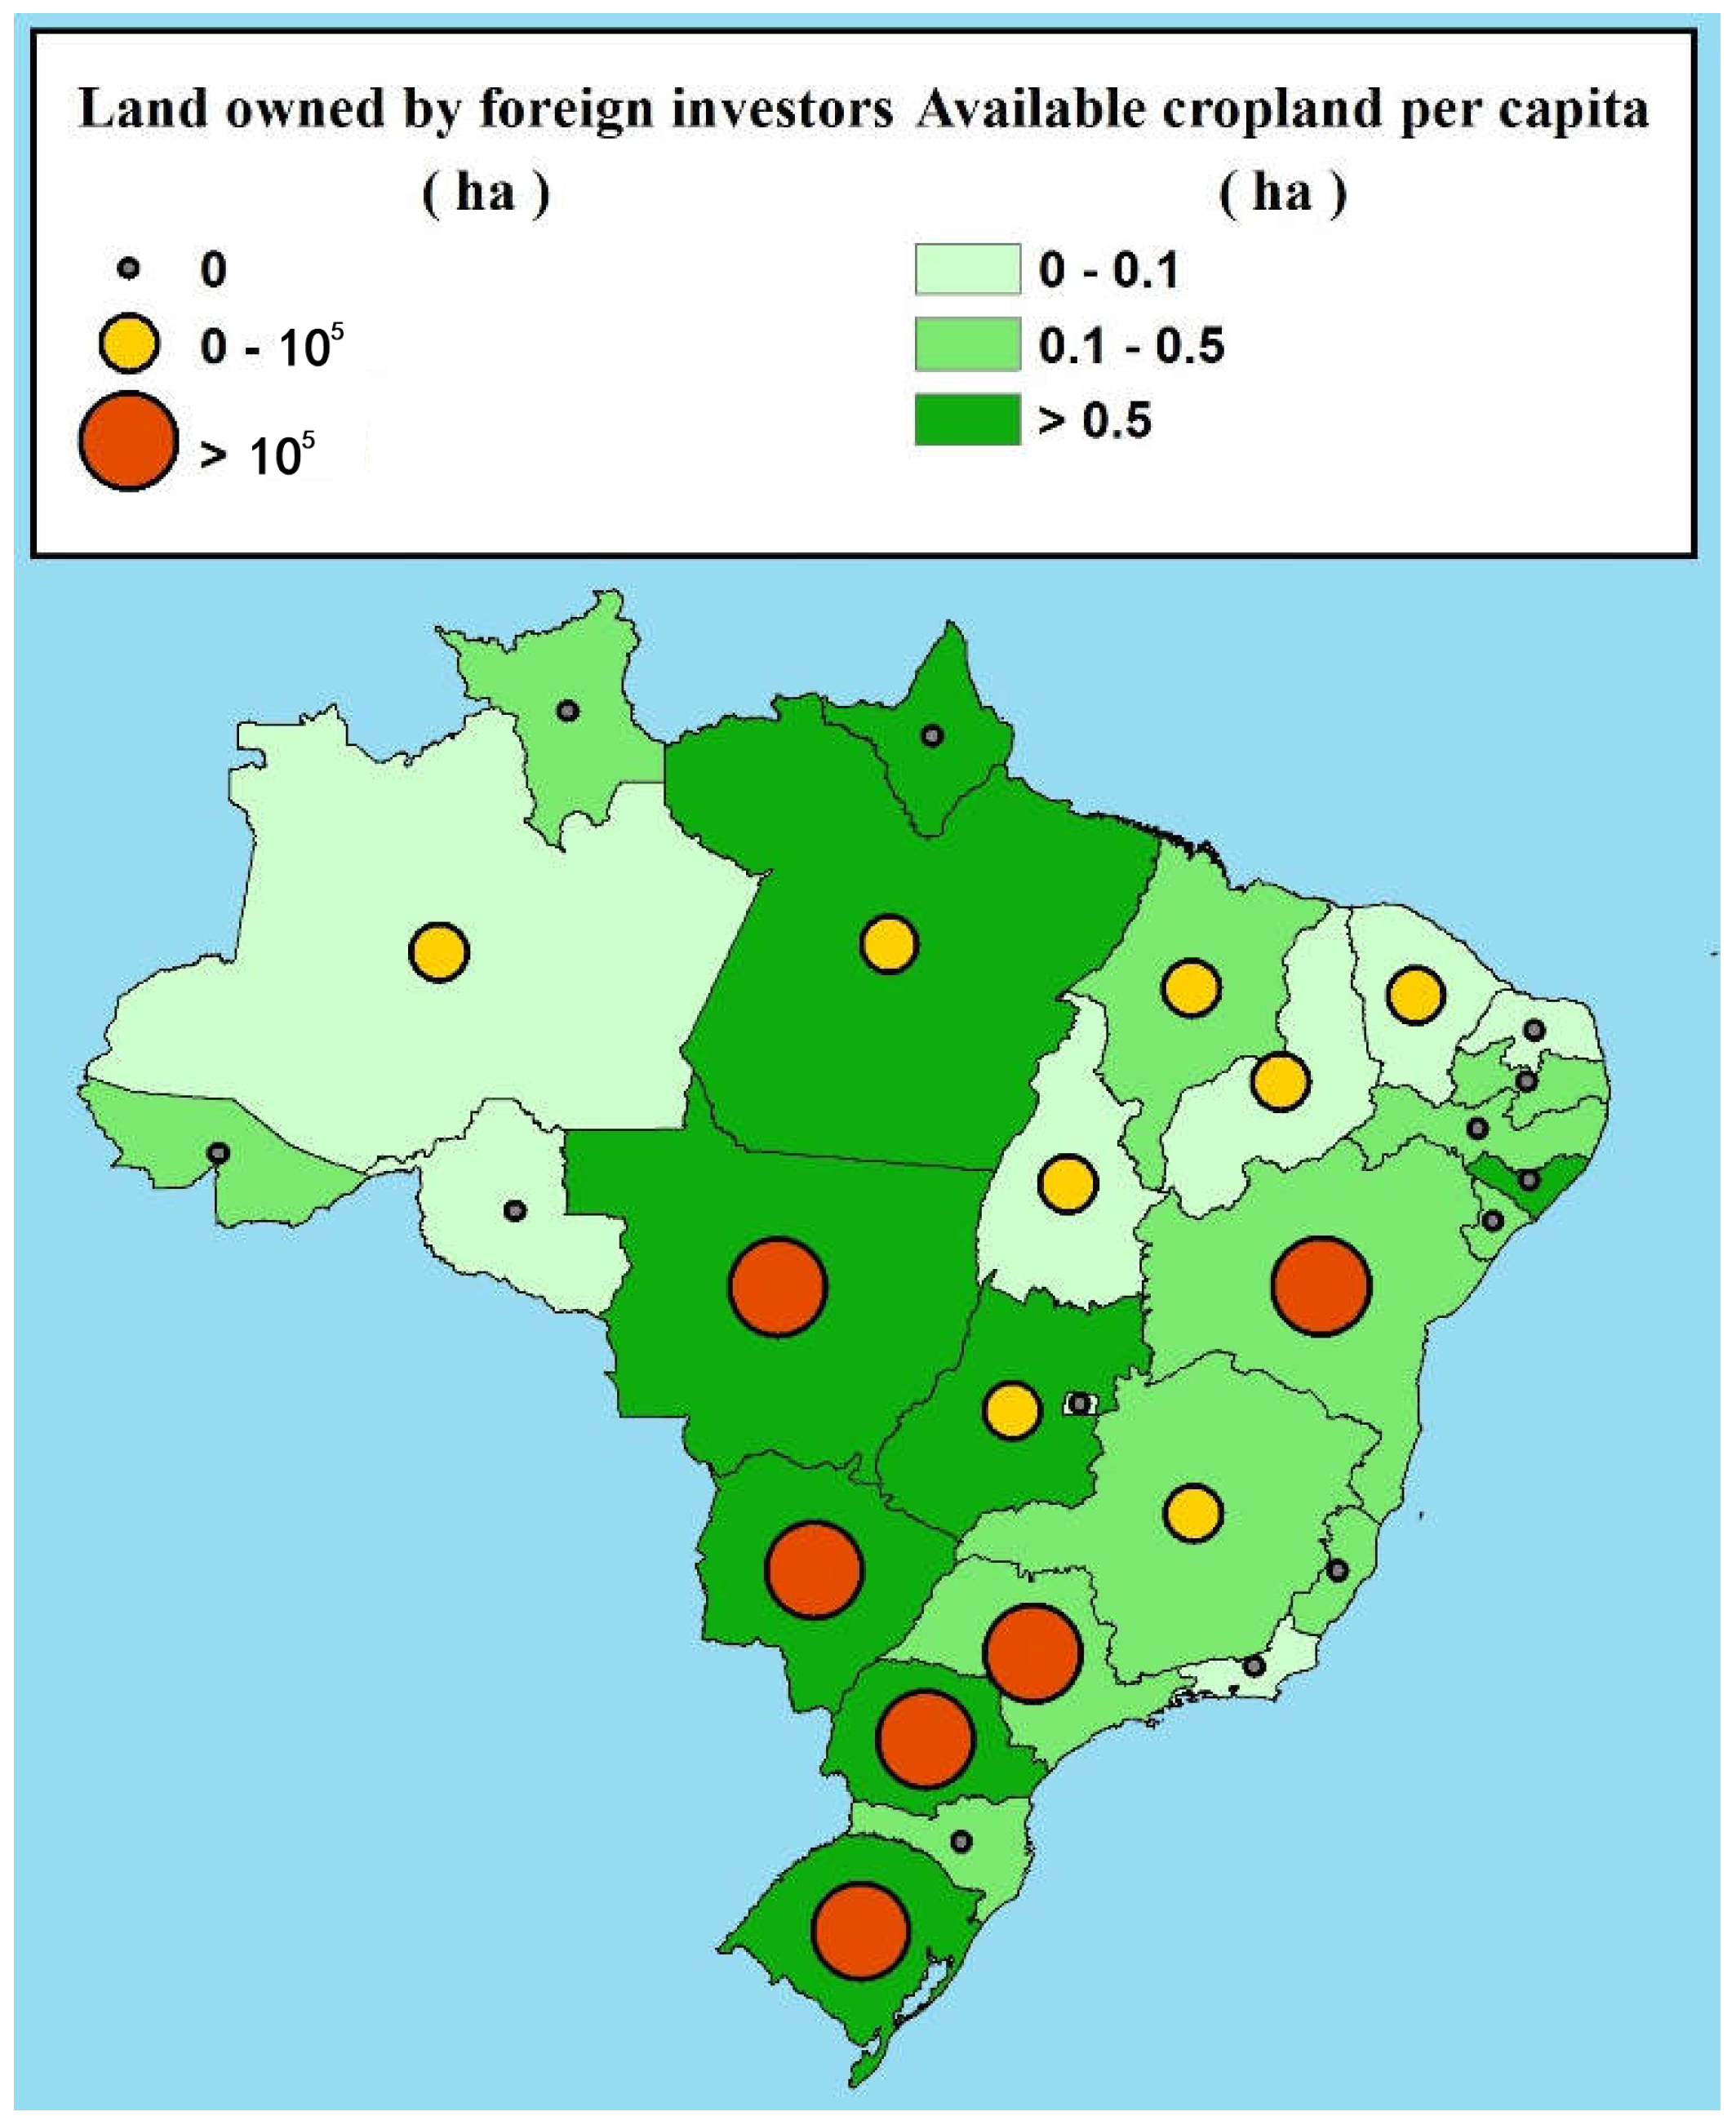
Brazil is a net land-grabbed country. A minimum estimate of the extension of land owned by foreign investors is on the scale of 34,000 km2 in 14 of the 27 states of Brazil. From the available dataset, the largest investor country is the Netherlands, while Brazilian investors are buying land located in Paraguay and Uruguay, mostly, with a total extent of 3600 km2 owned by Brazilian investors in nine foreign countries (Table 1). The results confirm that land-grabbing is occurring in states of Brazil with a lower income than the investor countries (Figure 1). They also show that transactions of land can occur in states with low land availability per capita (Figure 2), such as São Paulo.
Some of the lowest income states in Brazil are substantially affected by land-grabbing, such as Piauí, Tocantins, and Maranhão. These states are at the same time characterized by a low availability of agricultural land per capita (Figure 2) and are thus particularly vulnerable to the negative effects of land-grabbing that could limit the access to scarce resources for local communities.
Local communities in areas of the world with low economic performances tend to rely more directly upon nature’s contributions to people for their well-being [35]. In these contexts, land ownership and access to services have to be carefully managed. Foreign investors may promote types of farming that can be different from traditional practices or subsistence agriculture and may have no poverty-reduction impacts. Agricultural practices involving improved access to land and water for the local communities have indeed been proven as powerful practices for reducing poverty and enhancing food security [36]. Local or foreign investments in the implementation of smallholder farmer agricultural landscapes should be encouraged, particularly in low-income states with low cropland per capita [37].
3.2. The Effect of Land-Grabbing on the Ecological Balance of Brazil
According to the latest National Footprint Accounts [33], Brazil is at the top of the total BC rank per country with 1.8 Ggha (G is for 109), followed by China (1.4 Ggha) and the USA (1.1 Ggha). The BC composition is mainly dominated by forest (75%), followed by cropland (11%) and grazing land (11%). Since 1961, the BC of Brazil has followed a constant trend, with a slight increase [32].
On the other hand, the total EF of Brazil is around 0.6 Ggha [33]: this describes a condition of ecological reserve (+1.2 Ggha). However, the ecological reserve trend of Brazil is alarming: in the last 60 years, the ecological reserve per capita diminished by around 20%. Furthermore, the Brazilian population has grown by around 170% in the same period. Now, each Brazilian has an average of 9 gha as BC and requires 3.1 gha as EF. The ecological balance of Brazil is affected by land acquisition by foreign investors and by possible consequent land-use change.
Brazil is a net “exporter” of BC [18]. Foreign investors own more than 9 million global hectares in Brazil (Table 2), which equates to 0.5% of the total BC, a minimum estimate due to the limitations of the available datasets on transnational land deals when only considering data at the subnational level. The BC loss of Brazil through land-grabbing is probably much higher, reaching up to more than 64 million global hectares, around 4% of the total BC, but equal to the 30% of the BC provided by cropland in Brazil [18].
The account of BC loss returns different values if considering the land owned as already been used as cropland, or if considering it as forest. In the case of Brazil, if we consider a “total deforestation” scenario where all the land purchased by foreign investors was forested and is cleared for agricultural purposes, the amount of biocapacity loss goes up to 9.3 million global hectares, or 3% more than if considering the land as cropland before the transaction, in a “cropland to cropland” scenario.
The same consideration does not hold for land purchased by Brazilian investors abroad. In this case, the BC gain of Brazil is 47% higher if we consider the acquired land as cropland than if we consider the land as forest (Table 3). This is explained by the fact that forest in Brazil is much more productive than in all the foreign countries where Brazil is investing in land. This is confirmed by the YF values: Brazil has the highest factor for forest land with respect to the other countries involved in land transactions (YFforest of Brazil is 2.10, while YFforest of, for example, Paraguay is 1.75). At the same time, cropland productivity in some of these countries is higher than in Brazil (YFcropland of Brazil is 1.05), particularly in Paraguay and Uruguay (YFcropland equal to 1.87 and 1.31, respectively), which is where most of the land purchased abroad by Brazilian investors is located.
This suggests that, from a natural resource productivity viewpoint, a successful strategy for Brazil would be to preserve its highly productive forests, limiting or prohibiting transactions which involve deforestation and land use change of forested land. This very same strategy is also successful in terms of biodiversity and indigenous culture conservation and in the context of climate change, leaving open options (to be pondered) for implementing compensation payments from major greenhouse gas emitting countries or companies.
The results presented in this paper are highly dependent on data availability and quality. However, they provide a first overall picture of the effects of land-grabbing on the ecological balance of Brazil, also allocating grabbed land among the states of Brazil. Future developments of this approach include performing a similar analysis for other countries in the world, refining the case of Brazil when more accurate and complete data become available, and assessing the value of nature’s contributions to people traded through land-grabbing.
4. Conclusions
Brazil is a megadiverse country with the world’s highest biocapacity available per person, the largest rainforest on Earth, and incredibly valuable ecosystems such as the Amazon River and the Pantanal. However, the per capita ecological reserve of Brazil has declined by 20% in the last 60 years, according to ecological footprint accounting. In order for this value to be sustained over time, natural capital in Brazil needs to be protected to some extent through conservation policies, ensuring the option of local land management practices and accessibility to land by local and indigenous communities [38]. Within the current context of climate change and increasing scarcity of natural resources, Brazil could re-consider regulation and management of land owned by foreign investors, in particular restricting any investment that involves land-use change of its highly bio-productive forests.
Using land-grabbing data at the subnational scale allows a more detailed understanding of the international trade of land in countries characterized by substantial inequalities among different territorial entities. Diversity in resource availability influences the relative importance of preserving certain land-uses in specific territories, e.g., characterized by scarce cropland per capita. We found that Brazil is a net seller of land to foreign investors from high-income countries. This selling of land is influencing the ecological balance of Brazil, diminishing its biocapacity by 7.7 to 8.6 million global hectares.
However, data on land-grabbing at the subnational level is still lacking and provides only a partial picture of the overall transactions tacking place.
The ecological footprint accounting offers a geographical perspective on what is lost and acquired through land purchasing, in terms of extensions and biological productivity, thus expanding evaluations of land-grabbing and its impacts beyond mere considerations of areas or transaction prices. The calculation of the biocapacity involved in the transaction of land is informative for policy making, allowing for the identification of highly productive or scarce land uses that should be preserved locally.
Author Contributions
All the authors equally contributed to the conceptualization, methodology and writing of the manuscript.
Funding
L.C. is funded by an IRC/Marie Skłodowska-Curie CAROLINE Postdoctoral Fellowship (IRC-CLNE/2017/567).
Conflicts of Interest
The authors declare no conflict of interest.
References
- Ripple, W.J.; Wolf, C.; Newsome, T.M.; Galetti, M.; Alamgir, M.; Crist, E.; Mahmoud, M.I.; Laurance, W.F. World scientists’ warning to humanity: A second notice. BioScience 2017, 67, 1026–1028. [Google Scholar] [CrossRef]
- Watts, J. Land Degradation Threatens Human Well-Being, Major Report Warns. Available online: https://www.theguardian.com/environment/2018/mar/26 (accessed on 1 May 2018).
- Nesme, T.; Roques, S.; Metson, G.S.; Bennett, E.M. The surprisingly small but increasing role of international agricultural trade on the European Union’s dependence on mineral phosphorus fertilizer. Environ. Res. Lett. 2016, 11, 025003. [Google Scholar] [CrossRef]
- Scherer, L.; Pfister, S. Global biodiversity loss by freshwater consumption and eutrophication from Swiss food consumption. Environ. Sci. Technol. 2016, 50, 7019–7028. [Google Scholar] [CrossRef] [PubMed]
- Dell’Angelo, J.; Rulli, M.C.; D’Odorico, P. The global water grabbing syndrome. Ecol. Econ. 2018, 143, 276–285. [Google Scholar] [CrossRef]
- Scheidel, A.; Sorman, A.H. Energy transitions and the global land rush: Ultimate drivers and persistent consequences. Glob. Environ. Chang. 2012, 22, 588–595. [Google Scholar] [CrossRef]
- Gabay, M.; Alam, M. Community forestry and its mitigation potential in the Anthropocene: The importance of land tenure governance and the threat of privatization. For. Policy Econ. 2017, 79, 26–35. [Google Scholar] [CrossRef]
- Rulli, M.C.; Saviori, A.; D’Odorico, P. Global land and water grabbing. Proc. Natl. Acad. Sci. USA 2013, 110, 892–897. [Google Scholar] [CrossRef] [PubMed] [Green Version]
- The Economist. Buying Farmland Abroad: Outsourcing’s Third Wave. Available online: http://www.economist.com/node/13692889 (accessed on 1 May 2018).
- International Land Coalition (ILC). Global Assembly 2011. Available online: www.landcoalition.org/about-us/aom2011/tiranadeclaration (accessed on 1 May 2018).
- Rulli, M.C.; D’Odorico, P. Food appropriation through large scale land acquisitions. Environ. Res. Lett. 2014, 9, 064030. [Google Scholar] [CrossRef]
- Vendergeten, E.; Azadi, H.; Teklemariam, G.D.; Nyssen, J.; Witlox, F.; Vanhaute, E. Agricultural outsourcing or land grabbing: A meta-analysis. Landsc. Ecol. 2016, 31, 1395–1417. [Google Scholar] [CrossRef]
- Margulis, M.E.; McKeon, N.; Borras, S.M., Jr. Land grabbing and global governance: Critical perspectives. Globalizations 2013, 10, 1–23. [Google Scholar] [CrossRef]
- Ambalam, K. Food sovereignty in the era of land grabbing: An African perspective. J. Sustain. Dev. 2014, 7, 121–132. [Google Scholar] [CrossRef]
- Hules, M.; Singh, S.J. India’s land grab deals in Ethiopia: Food security or global politics? Land Use Policy 2014, 60, 343–351. [Google Scholar] [CrossRef]
- Carmody, P. The New Scramble for Africa; Polity Press: Cambridge, UK, 2016. [Google Scholar]
- Weinzettel, J.; Hertwich, E.G.; Peters, G.P.; Steen-Olsen, K.; Galli, A. Affluence drives the global displacement of land use. Glob. Environ. Chang. 2013, 23, 433–438. [Google Scholar] [CrossRef]
- Coscieme, L.; Pulselli, F.M.; Niccolucci, V.; Patrizi, N.; Sutton, P.C. Accounting for “land-grabbing” from a biocapacity viewpoint. Sci. Total Environ. 2016, 539, 551–559. [Google Scholar] [CrossRef] [PubMed]
- Bucciferro, J.R. The economic geography of race in the New World: Brazil, 1500–2000. Econ. Hist. Rev. 2017, 70, 1103–1130. [Google Scholar] [CrossRef]
- Fontes, M.P.F.; Fontes, R.M.O.; Carneiro, P.A.S. Land suitability, water balance and agricultural technology as a geographic-technological index to support regional planning and economic studies. Land Use Policy 2009, 26, 589–598. [Google Scholar] [CrossRef]
- Davis, K.F.; Yu, K.; Rulli, M.C.; Pichdara, L.; D’Odorico, P. Accelerated deforestation driven by large-scale land acquisitions in Cambodia. Nat. Geosci. 2015, 8, 772–775. [Google Scholar] [CrossRef]
- Kennedy, C.M.; Lonsdorf, E.; Neel, M.C.; Williams, N.M.; Ricketts, T.H.; Winfree, R.; Bommarco, R.; Brittain, C.; Burley, A.L.; Cariveau, D.; et al. A global quantitative synthesis of local and landscape effects on wild bee pollinators in agroecosystems. Ecol. Lett. 2013, 16, 584–599. [Google Scholar] [CrossRef] [PubMed] [Green Version]
- Schuler, L.J.; Bugmann, H.; Snell, R.S. From monocultures to mixed-species forests: Is tree diversity key for providing ecosystem services at the landscape scale? Landsc. Ecol. 2017, 32, 1499–1516. [Google Scholar] [CrossRef]
- Rees, W.E. Ecological footprints and appropriated carrying capacity: What urban economics leaves out. Environ. Urban. 1992, 4, 121–130. [Google Scholar] [CrossRef]
- Wackernagel, M.; Rees, W.E. Our Ecological Footprint: Reducing Human Impact on the Earth, 1st ed.; New Society Publishers: Gabriola Island, BC, Canada, 1996. [Google Scholar]
- Mancini, M.S.; Galli, A.; Coscieme, L.; Niccolucci, V.; Lin, D.; Pulselli, F.M.; Bastianoni, S.; Marchettini, N. Exploring ecosystem services assessment through ecological footprint accounting. Ecosyst. Serv. 2018, 30, 228–235. [Google Scholar] [CrossRef]
- Monfreda, C.; Wackernagel, M.; Deumling, D. Establishing national natural capital accounts based on detailed ecological footprint and biological capacity assessments. Land Use Policy 2004, 21, 231–246. [Google Scholar] [CrossRef]
- Borucke, M.; Moore, D.; Cranston, G.; Gracey, K.; Katsunori, I.; Larson, J.; Lazarus, E.; Morales, J.C.M.; Wackernagel, M.; Galli, A. Accounting for demand and supply of the biosphere’s regenerative capacity: The National Footprint Accounts’ underlying methodology and framework. Ecol. Indic. 2013, 24, 518–533. [Google Scholar] [CrossRef]
- Bastianoni, S.; Niccolucci, V.; Neri, E.; Cranston, G.; Galli, A.; Wackernagel, M. Sustainable development: Ecological footprint as accounting tool. In Encyclopedia of Environmental Management; Taylor and Francis: New York, NY, USA, 2013; pp. 2467–2481. [Google Scholar]
- Wackernagel, M.; Rees, W.E. Perceptual and structural barriers to investing in natural capital: Economics from an ecological footprint perspective. Ecol. Econ. 1997, 20, 3–24. [Google Scholar] [CrossRef]
- Galli, A.; Kitzes, J.; Wermer, P.; Wackernagel, M.; Niccolucci, V.; Tiezzi, E. An exploration of the mathematics behind the ecological footprint. Int. J. Ecodyn. 2007, 2, 250–257. [Google Scholar] [CrossRef]
- Global Footprint Network (GFN). National Footprint Accounts, 2017th ed.; Global Footprint Network: Oakland, CA, USA, 2017; Available online: http://data.footprintnetwork.org (accessed on 1 May 2018).
- Niccolucci, V.; Tiezzi, E.; Pulselli, F.M.; Capineri, C. Biocapacity vs. ecological footprint of world regions: A geopolitical interpretation. Ecol. Indic. 2012, 16, 23–30. [Google Scholar] [CrossRef]
- Lin, D.; Hanscom, L.; Martindill, J.; Borucke, M.; Cohen, L.; Galli, A.; Lazarus, E.; Zokai, G.; Iha, K.; Eaton, D.; et al. Working Guidebook to the National Footprint Accounts, 2016th ed.; Global Footprint Network: Oakland, CA, USA, 2016. [Google Scholar]
- Fisher, J.A.; Patenaude, G.; Giri, K.; Lewis, K.; Meir, P.; Pinho, P.; Rounsevell, M.D.; Williams, M. Understanding the relationships between ecosystem services and poverty alleviation: A conceptual framework. Ecosyst. Serv. 2014, 7, 34–45. [Google Scholar] [CrossRef]
- De Schutter, O. How not to think of land-grabbing: Three critiques of large-scale investments in farmland. J. Peasant Stud. 2011, 38, 249–279. [Google Scholar] [CrossRef]
- Tscharntke, T.; Clough, T.; Wanger, T.C.; Jackson, L.; Motzke, I.; Perfecto, I.; Vandermeer, J.; Whitbread, A. Global food security, biodiversity conservation and the future of agricultural intensification. Biol. Conserv. 2012, 151, 53–59. [Google Scholar] [CrossRef]
- Börner, J.; Wunder, S.; Wertz-Kanounnikoff, S.; Tito, M.R.; Pereira, L.; Nascimento, N. Direct conservation payments in the Brazilian Amazon: Scope and equity implications. Ecol. Econ. 2010, 69, 1272–1282. [Google Scholar] [CrossRef]
Figure 1.
Distribution of Gross Domestic Product (GDP) per capita at purchasing power parity (PPP) rates in the states of Brazil where land is purchased by foreign investors and in the foreign investor’s countries.
Figure 1.
Distribution of Gross Domestic Product (GDP) per capita at purchasing power parity (PPP) rates in the states of Brazil where land is purchased by foreign investors and in the foreign investor’s countries.

Figure 2.
Land owned by foreign investors and available cropland per capita in the states of Brazil. Cropland data are from the Brazilian Institute of Geography and Statistics (IBGE; http://www.ibge.gov.br; last accessed November 2017). Land-grabbing data are from http://landmatrix.org; last accessed November 2017.


Table 1.
Largest foreign investor countries (column 1) and total area owned (column 2) in Brazil. Location and extension of land owned by Brazilian investors (column 3 and 4). Location and extension of land owned by foreign investors in Brazil (column 5 and 6). Percentage of the total state area owned by foreign investors (column 7). Source: http://landmatrix.org; last accessed November, 2017.
| Foreign Investor’s Countries Owning Land in Brazil | Total Area Owned (km2) | Location of Foreign Land Owned by Brazil’s Investors | Total Area Owned (km2) | Location of Land-Grabbed Areas in the States of Brazil | Total Area Owned (km2) | % of Total State Area |
|---|---|---|---|---|---|---|
| Netherlands | 11,860 | Paraguay | 1613 | São Paulo | 15,909 | 6.41 |
| Argentina | 4987 | Uruguay | 1000 | Mato Grosso | 5571 | 0.62 |
| U.S.A. | 3972 | Angola | 390 | Bahia | 4461 | 0.79 |
| Finland | 2957 | Colombia | 130 | Mato Grosso do Sul | 1953 | 0.55 |
| Japan | 2636 | Sudan | 120 | Paraná | 1850 | 0.93 |
| Chile | 2083 | Peru | 115 | Rio Grande do Sul | 1608 | 0.57 |
| Australia | 2000 | Mozambique | 90 | Piauí | 574 | 0.23 |
| Canada | 1252 | Ghana | 87 | Minas Gerais | 562 | 0.10 |
| India | 780 | Nicaragua | 77 | Pará | 488 | 0.04 |
| U.K. | 700 | Maranhão | 424 | 0.13 | ||
| Portugal | 368 | Amazonas | 400 | 0.03 | ||
| China | 212 | Goiás | 221 | 0.07 | ||
| Qatar | 169 | Tocantins | 174 | 0.06 | ||
| Germany | 65 | Ceará | 12 | 0.01 | ||
| Hong Kong | 46 | |||||
| Bermuda | 46 | |||||
| Switzerland | 46 | |||||
| Cayman Islands | 12 | |||||
| France | 10 | |||||
| New Zealand | 8 | |||||
| TOTALS | 34,209 | 3622 | 34,209 |
Table 2.
Largest foreign investor countries (column 1) and biocapacity uptake in Brazil and in the states of Brazil considering a no land-use change “cropland to cropland” and a “total deforestation” scenario (column 2, 3 and 5, 6). Source: http://landmatrix.org; last accessed November, 2017.
Table 2.
Largest foreign investor countries (column 1) and biocapacity uptake in Brazil and in the states of Brazil considering a no land-use change “cropland to cropland” and a “total deforestation” scenario (column 2, 3 and 5, 6). Source: http://landmatrix.org; last accessed November, 2017.
| Foreign Investor’s Countries Owning Land in Brazil | Biocapacity (104 gha) | Location of Land-Grabbed Areas in the States of Brazil | Biocapacity (104 gha) | ||
|---|---|---|---|---|---|
| “Cropland to Cropland” | “Total Deforestation” | “Cropland to Cropland” | “Total Deforestation” | ||
| Netherlands | 313.52 | 322.67 | São Paulo | 420.55 | 432.82 |
| Argentina | 131.83 | 135.68 | Mato Grosso | 147.27 | 151.56 |
| U.S.A. | 105 | 108.07 | Bahia | 117.91 | 121.35 |
| Finland | 78.17 | 80.45 | Mato Grosso do Sul | 51.62 | 53.13 |
| Japan | 69.7 | 71.74 | Paraná | 48.9 | 50.33 |
| Chile | 55.06 | 56.67 | Rio Grande do Sul | 42.5 | 43.74 |
| Australia | 52.87 | 54.41 | Piauí | 15.18 | 15.63 |
| Canada | 33.09 | 34.06 | Minas Gerais | 14.87 | 15.31 |
| India | 20.62 | 21.22 | Pará | 12.9 | 13.27 |
| U.K. | 18.50 | 19.04 | Maranhão | 11.21 | 11.54 |
| Portugal | 9.73 | 10.01 | Amazonas | 10.57 | 10.88 |
| China | 5.6 | 5.76 | Goiás | 5.85 | 6.02 |
| Qatar | 4.47 | 4.6 | Tocantins | 4.6 | 4.73 |
| Germany | 1.72 | 1.77 | Ceará | 0.32 | 0.33 |
| Hong Kong | 1.21 | 1.24 | |||
| Bermuda | 1.21 | 1.24 | |||
| Switzerland | 1.21 | 1.24 | |||
| Cayman Islands | 0.32 | 0.33 | |||
| France | 0.26 | 0.27 | |||
| New Zealand | 0.21 | 0.22 | |||
| TOTALS | 904.32 | 930.7 | TOTALS | 904.32 | 930.7 |
Table 3.
Location of foreign land owned by Brazilian investors (column 1) and biocapacity uptake considering a no land-use change “cropland to cropland” and a “total deforestation” scenario (column 2 and 3). Source: http://landmatrix.org; last accessed November 2017.
Table 3.
Location of foreign land owned by Brazilian investors (column 1) and biocapacity uptake considering a no land-use change “cropland to cropland” and a “total deforestation” scenario (column 2 and 3). Source: http://landmatrix.org; last accessed November 2017.
| Location of Foreign Land Owned by Brazil’s Investors | Biocapacity (104 gha) | |
|---|---|---|
| “Cropland to Cropland” | “Total Deforestation” | |
| Paraguay | 76.04 | 36.56 |
| Uruguay | 33.23 | 23.23 |
| Angola | 5.32 | 0.88 |
| Colombia | 4.13 | 2.21 |
| Sudan | 0.99 | 0.68 |
| Peru | 2.16 | 1.3 |
| Mozambique | 0.82 | 0.35 |
| Ghana | 1.93 | 0.68 |
| Nicaragua | 1.05 | 1.09 |
| TOTALS | 125.71 | 67.03 |
© 2018 by the authors. Licensee MDPI, Basel, Switzerland. This article is an open access article distributed under the terms and conditions of the Creative Commons Attribution (CC BY) license (http://creativecommons.org/licenses/by/4.0/).
Share and Cite
MDPI and ACS Style
Coscieme, L.; Niccolucci, V.; Giannetti, B.F.; Pulselli, F.M.; Marchettini, N.; Sutton, P.C. Implications of Land-Grabbing on the Ecological Balance of Brazil. Resources 2018, 7, 44. https://doi.org/10.3390/resources7030044
AMA Style
Coscieme L, Niccolucci V, Giannetti BF, Pulselli FM, Marchettini N, Sutton PC. Implications of Land-Grabbing on the Ecological Balance of Brazil. Resources. 2018; 7(3):44. https://doi.org/10.3390/resources7030044
Chicago/Turabian StyleCoscieme, Luca, Valentina Niccolucci, Biagio F. Giannetti, Federico M. Pulselli, Nadia Marchettini, and Paul C. Sutton. 2018. "Implications of Land-Grabbing on the Ecological Balance of Brazil" Resources 7, no. 3: 44. https://doi.org/10.3390/resources7030044
Note that from the first issue of 2016, this journal uses article numbers instead of page numbers. See further details here.