Article

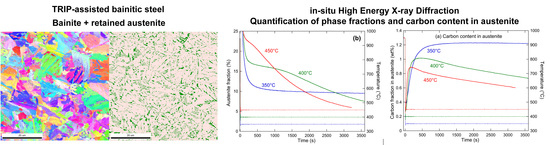
In-Situ Characterization by High-Energy X-ray Diffraction of the Phase Transformations Leading to Transformation-Induced Plasticity-Aided Bainitic Steel

1
Université Grenoble Alpes, CNRS, Grenoble INP, SIMaP, F-38000 Grenoble, France
2
ArcelorMittal Maizières Research, Voie Romaine, BP30320, 57283 Maizières-lès-Metz, France
*
Author to whom correspondence should be addressed.
Quantum Beam Sci. 2019, 3(4), 25; https://doi.org/10.3390/qubs3040025
Submission received: 13 November 2019 / Revised: 3 December 2019 / Accepted: 10 December 2019 / Published: 12 December 2019
(This article belongs to the Special Issue Microstructural and Phase Transformations in Materials)

Abstract

:
The phase transformations occurring during the heat treatments leading to transformation-induced plasticity (TRIP)-aided bainitic steel have been investigated in-situ by high-energy X-ray diffraction (HEXRD) conducted with synchrotron light at 90 keV. Direct microstructure characterization has been performed by electron microscopy using electron backscatter diffraction and orientation and phase mapping in a transmission electron microscope. HEXRD data allow the quantification of the evolution of the austenite phase fraction with the heat treatments, as well as its carbon content and the fraction of carbides, from the lattice parameter evolution. It is shown that different combinations of austenite fraction and carbon content can be reached by adjusting the heat treatment temperature.

Graphical Abstract

1. Introduction

In the last decade, a tremendous effort has been applied to developing advanced high-strength steels (AHSSs), offering a good combination of tensile strength and ductility [1]. The so-called third-generation AHSS offers such combinations with relatively low amounts of alloying elements, which is an advantage both in terms of processability and cost [2,3]. This combination of strength and ductility relies on the transformation-induced plasticity (TRIP) effect, where metastable austenite transforms during deformation into martensite, thereby offering a high-strain hardening rate at large strains, which is key to postpone ductile failure.
The critical parameters that enable this TRIP effect to take place are thus the fraction of austenite in the steel, which will be able to transform during deformation, and its stability [4], influenced by many factors such as its size [5], morphology, or composition, and, particularly [6], its carbon content [7,8,9,10]. Other parameters include the microstructure of ferrite (bainitic, martensitic), the overall microstructure scale and morphology [11], and the presence of secondary phases (carbides).
Processing the steel in order to optimize the austenite fraction and stability has been the subject of intensive research. The quenching and partitioning (Q and P) process relies on partitioning the carbon trapped in martensite to the retained austenite [12,13,14]. Other strategies have been proposed such as TRIP-aided bainite [15,16,17], which does not necessitate a short, low-temperature heat treatment below the martensite start temperature (Ms) and may thus be easier to implement.
It is of great interest, but also complex, to follow the phase transformations that occur during the different processing steps leading to the final microstructure. As the phases are subject to transformation upon cooling to room temperature, in-situ studies are particularly appropriate. Along with high-resolution dilatometry, in-situ diffraction is particularly suitable to follow phase transformations in steel. Neutron diffraction, which offers a very high penetration depth, has been used occasionally to monitor phase transformations in such steels [18]. However, synchrotron-high-energy X-ray diffraction (HEXRD) equally offers a high penetration depth (several mm at an X-ray energy close to 100 keV), with the additional advantages of a very high time resolution (below 1 s), and a large number of available diffraction peaks (due to the small wavelength) [19]. Therefore, this technique has been increasingly used to study, e.g., austenitization, bainitic transformation, Q and P processing, or the TRIP effect during tensile loading [20,21,22,23,24,25,26,27]. In addition to the fraction of phases that can be obtained by Rietveld refinement, HEXRD can provide information on the carbon content of the phases through the precise measurement of the lattice parameters, which is of paramount importance when studying processes leading to the TRIP effect.
The present paper aims to present an in-situ HEXRD study of the phase fractions and carbon distribution during the processing of a TRIP-aided bainitic steel. This HEXRD is complemented by a multi-scale characterization of the microstructure provided by a combination of electron backscatter diffraction (EBSD) and transmission electron microscopy using automated crystal orientation mapping (TEM-ACOM) coupled to analytical mapping.

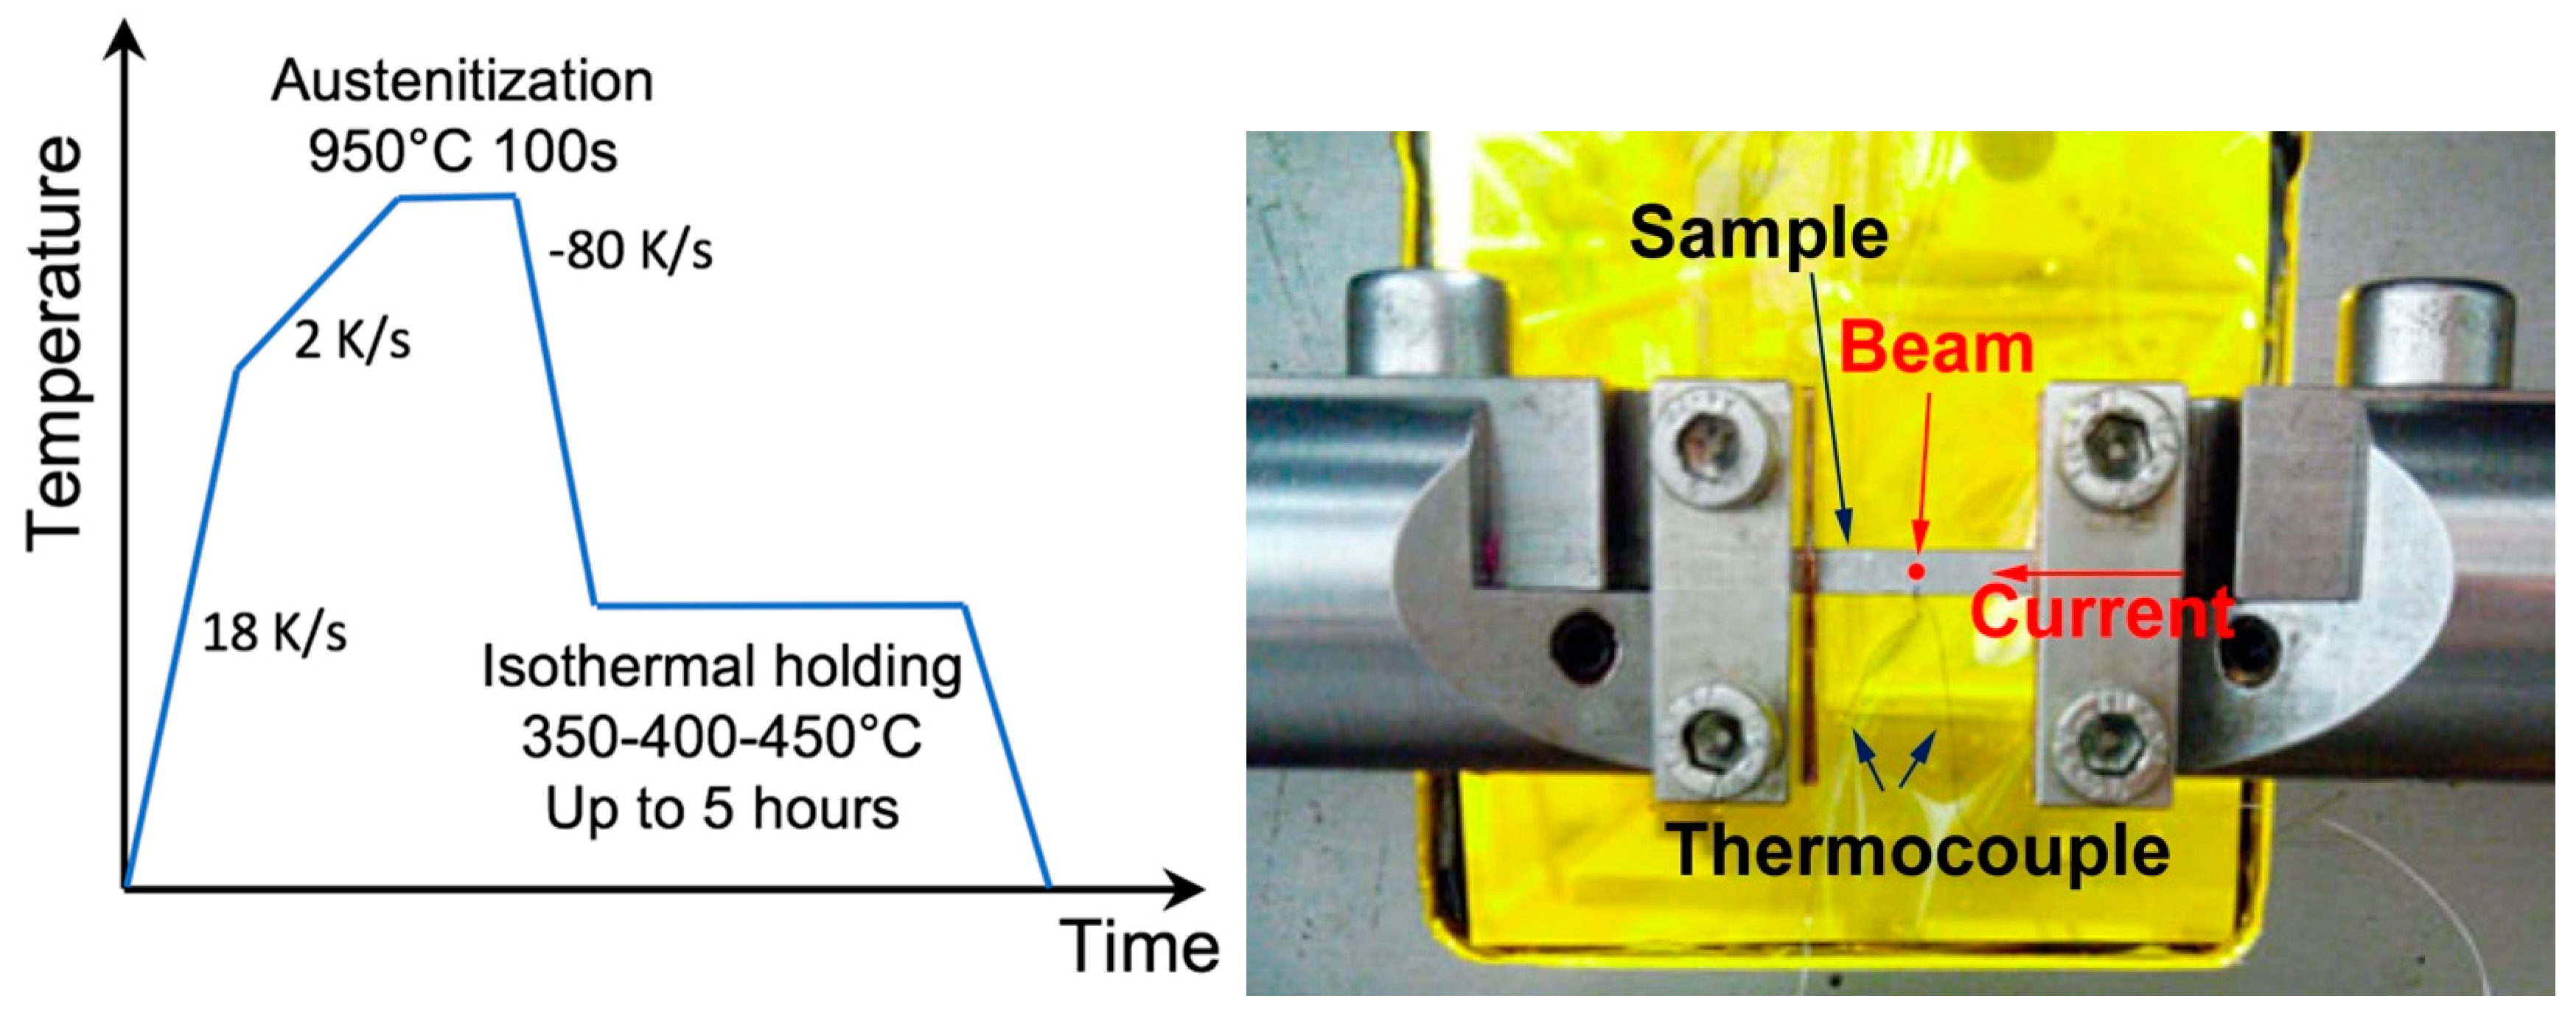
2. Materials and Methods

The steel was provided by ArcelorMittal Research and had a composition of 0.244% C, 2% Mn, and 1.57% Si (all in wt.%). The as-received state resulted from hot rolling and coiling, followed by isothermal heat treatment at 550 °C and by cold rolling. The studied thermal treatment, shown in Figure 1, was the final one consisting first of an austenitization at 950 °C for 100 s. Heating to the austenitization temperature was performed at a rate of 18 K·s−1 from room temperature to 600 °C, and at a rate of 2 K·s−1 from 600 °C to 950 °C. Austenitization holding was followed by a quench with an initial cooling rate of 80 K·s−1 to the isothermal holding temperatures. Three holding temperatures were investigated, namely, 350 °C, 400 °C, and 450 °C. Dilatometry experiments showed that the martensite-start temperature of this steel is about 370 °C. Samples for microstructure examinations were heat-treated in an instrumented dilatometer Bärh DIL 805, using the same heat treatment as that of the in-situ experiments described below with the exception of the cooling rates, which were fixed at 100 K·s−1.
Electron backscatter diffraction (EBSD) observations were performed on a scanning electron microscope (SEM) Zeiss Ultra 55 using a field emission gun source and an EDAX CCD Hikari Pro (600 pts/s) camera. Data were collected and analyzed using OIM analysis software.
The HEXRD experiments were carried out at the European Synchrotron Radiation Facility (ESRF) on the ID11 beamline. An X-ray energy of 90 keV was used. In-situ heat treatments were performed using an Instron Electro-Thermal Mechanical Testing (ETMT) device, where the sample placed in water-cooled grips is heated by Joule heating (see Figure 1). The samples had a total length of 40 mm, width of 4 mm, and thickness of 1 mm. This being a transmission experiment, the diffraction signal was analyzed after being transmitted through the whole thickness of the specimens. The temperature was monitored by a type-S thermocouple welded on the sample, whose exact position with respect to the X-ray beam was precisely adjusted by scanning the sample before each experiment. One difficulty of Joule heating is the possible influence of the applied electrical field on the thermocouple measurements, which can lead to a bias in the temperature measurement. To estimate the importance of this bias, we followed the temperature evolution when the current was instantaneously stopped in two instances: At the end of austenitization (beginning of quench) and at the end of isothermal holding (second quench, to room temperature). The bias was estimated by back-extrapolating the temperature (without current) to the isothermal plateau and comparing the back-extrapolated temperature to the set temperature. In all cases presented here, the bias was of the order of 5 K and was thus neglected for the following analysis. The mechanical control of the ETMT was used in load control with a small load (20 N) so that changes in the sample length due to thermal contraction and phase transformations could be compensated stress-free. Annealing was performed under argon flow to limit oxidizing and decarburization.
The Debye–Scherrer rings were recorded with a 0.25 s exposure by a Frelon 21 camera with a resolution of 2048 × 2048 pixels, placed at a distance of 332 mm from the sample, giving access to a maximum 2θ angle of approximately 11°. After calibration of the detector position and angles by a cerium oxide crystal powder, the 2D images were radially integrated to provide 1D diffractograms using ESRF’s fit2d program. The diffractograms were then analyzed by Rietveld refinement using the FullProf software to extract the proportion of the main phases (austenite and ferrite) and their lattice parameters.
Transmission electron microscopy (TEM) in standard bright-field/dark-field imaging was performed on a JEOL 3010 instrument, with a LaB6 source working at 300 kV. Scanning transmission electron microscopy (STEM) imaging, energy-dispersive spectroscopy (EDS) chemical analysis, and automated phase and orientation mapping (ACOM) was performed on a JEOL 2100F instrument, with an FEG source working at 200 kV. Disks, taken at ¼ thickness from the dilatometry samples, were prepared by polishing down to 60–100 μm, and thinned by electro-polishing using a Struers TenuPol-5 with a double jet and an applied voltage from 25 to 38 V using a bath of 950 mL butoxyethanol 2, 100 mL methanol, and 500 mL perchloric acid (65% pure) working at 14 °C. Samples were then rinsed in several successive ethanol baths and stored under vacuum to limit oxidation before observation.
ACOM measurements were realized using the ASTAR module including the DigiSTAR precession system [28]. Although precession significantly improves the quality of diffraction pattern indexing, it is particularly tricky to use with magnetic samples. Thus, the precession angle, initially set at 1.2°, was limited to 0.6° or removed completely in some cases where monitoring the beam was too difficult.

3. Results

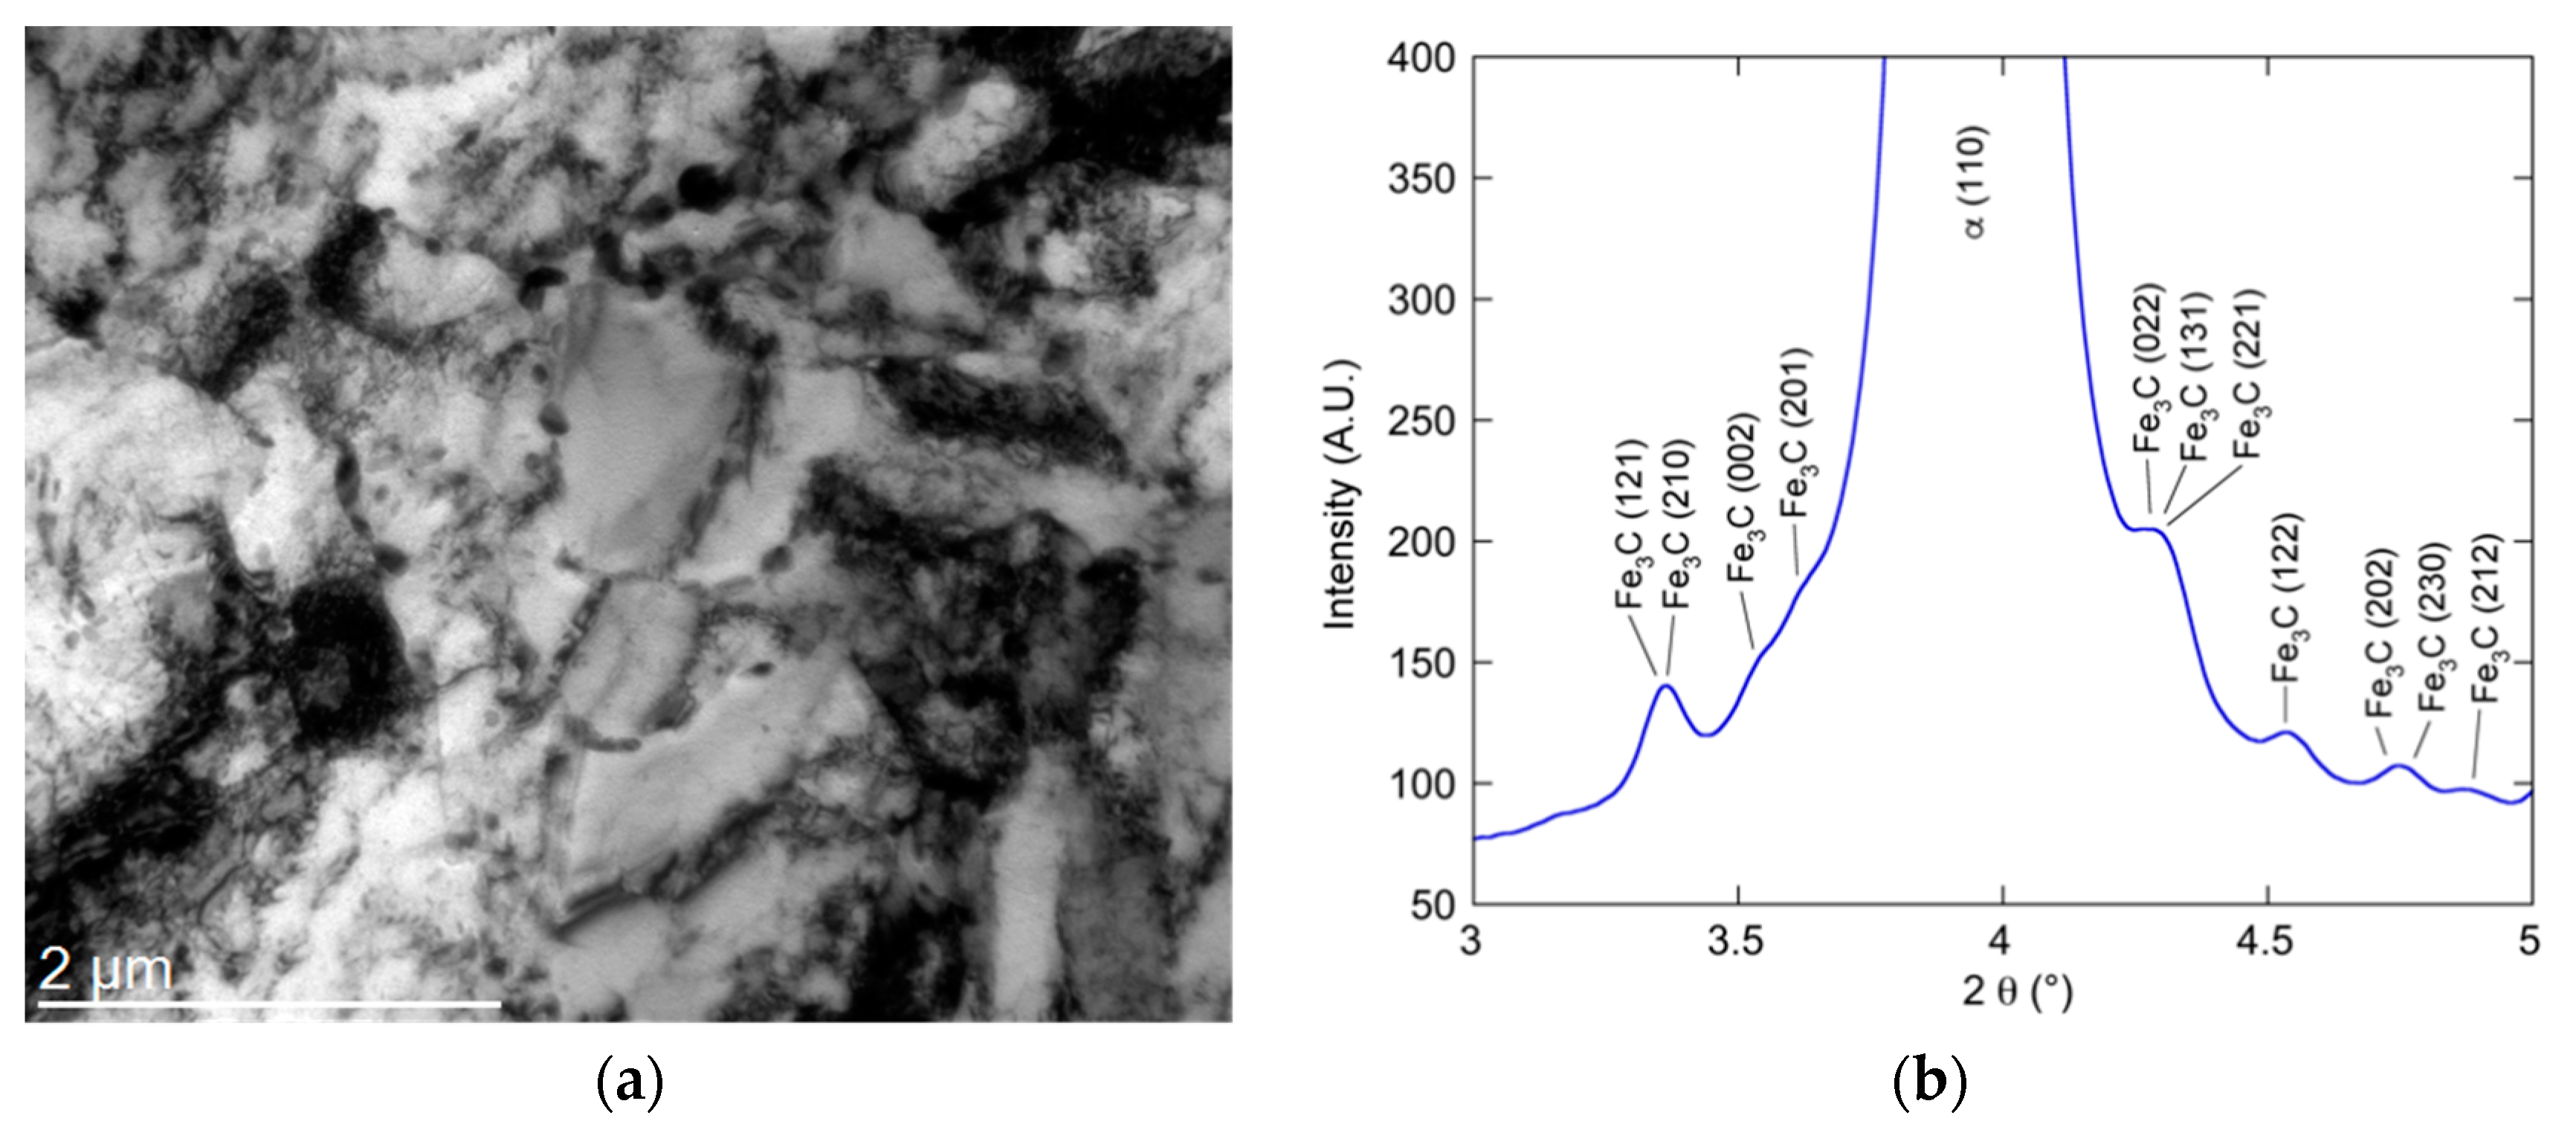
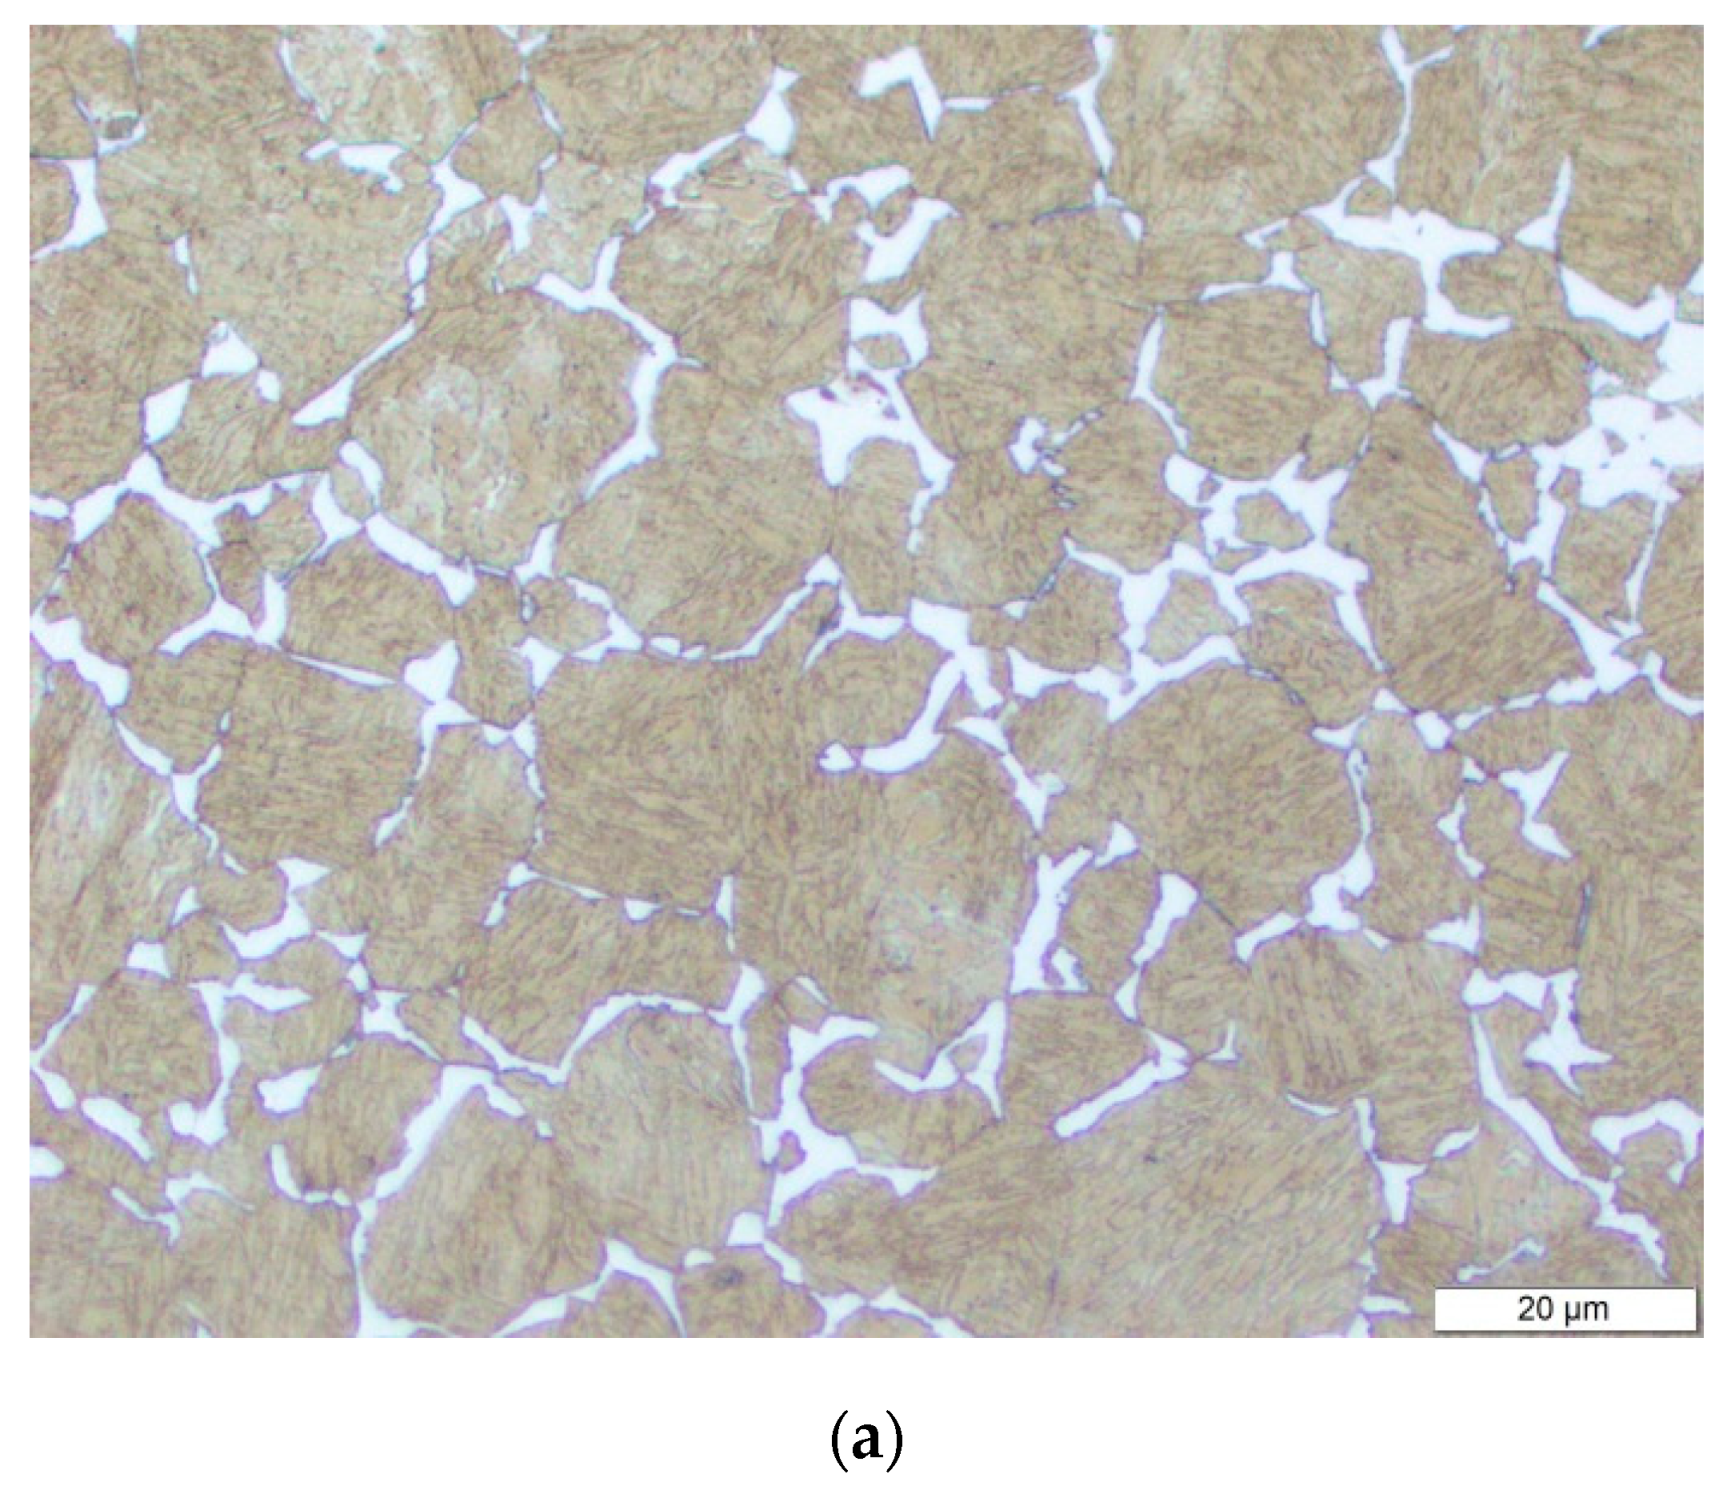
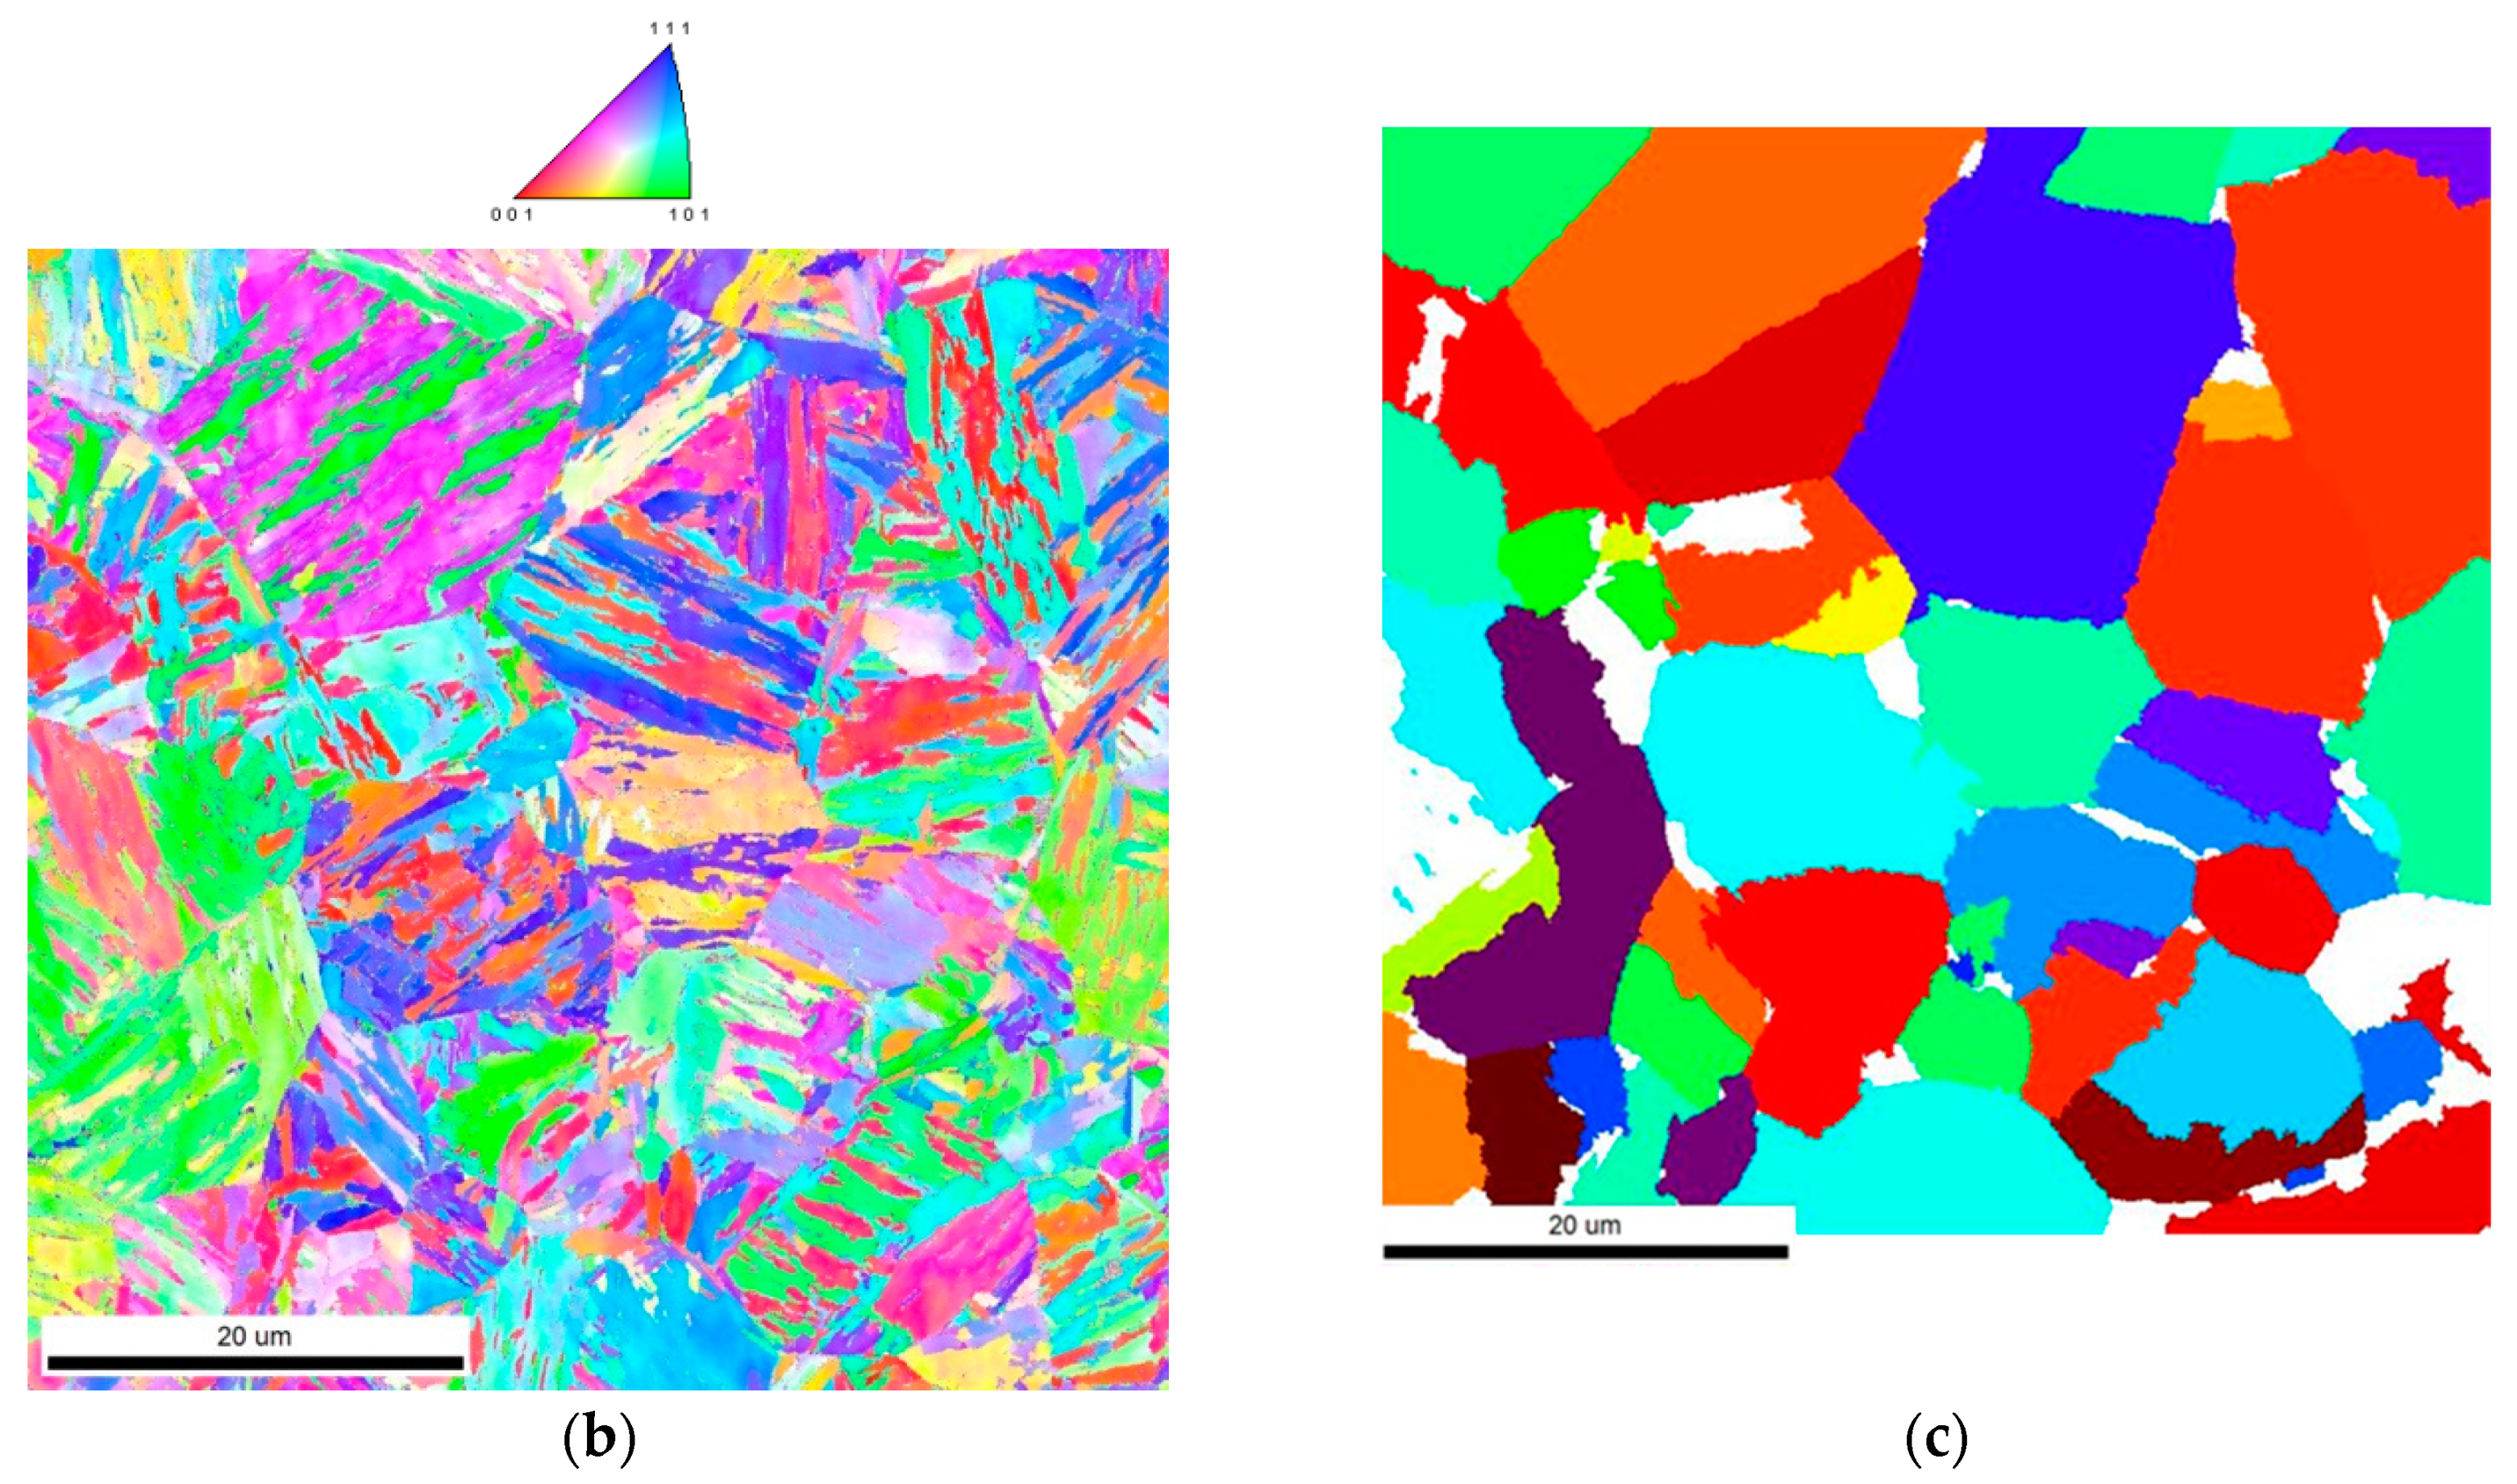
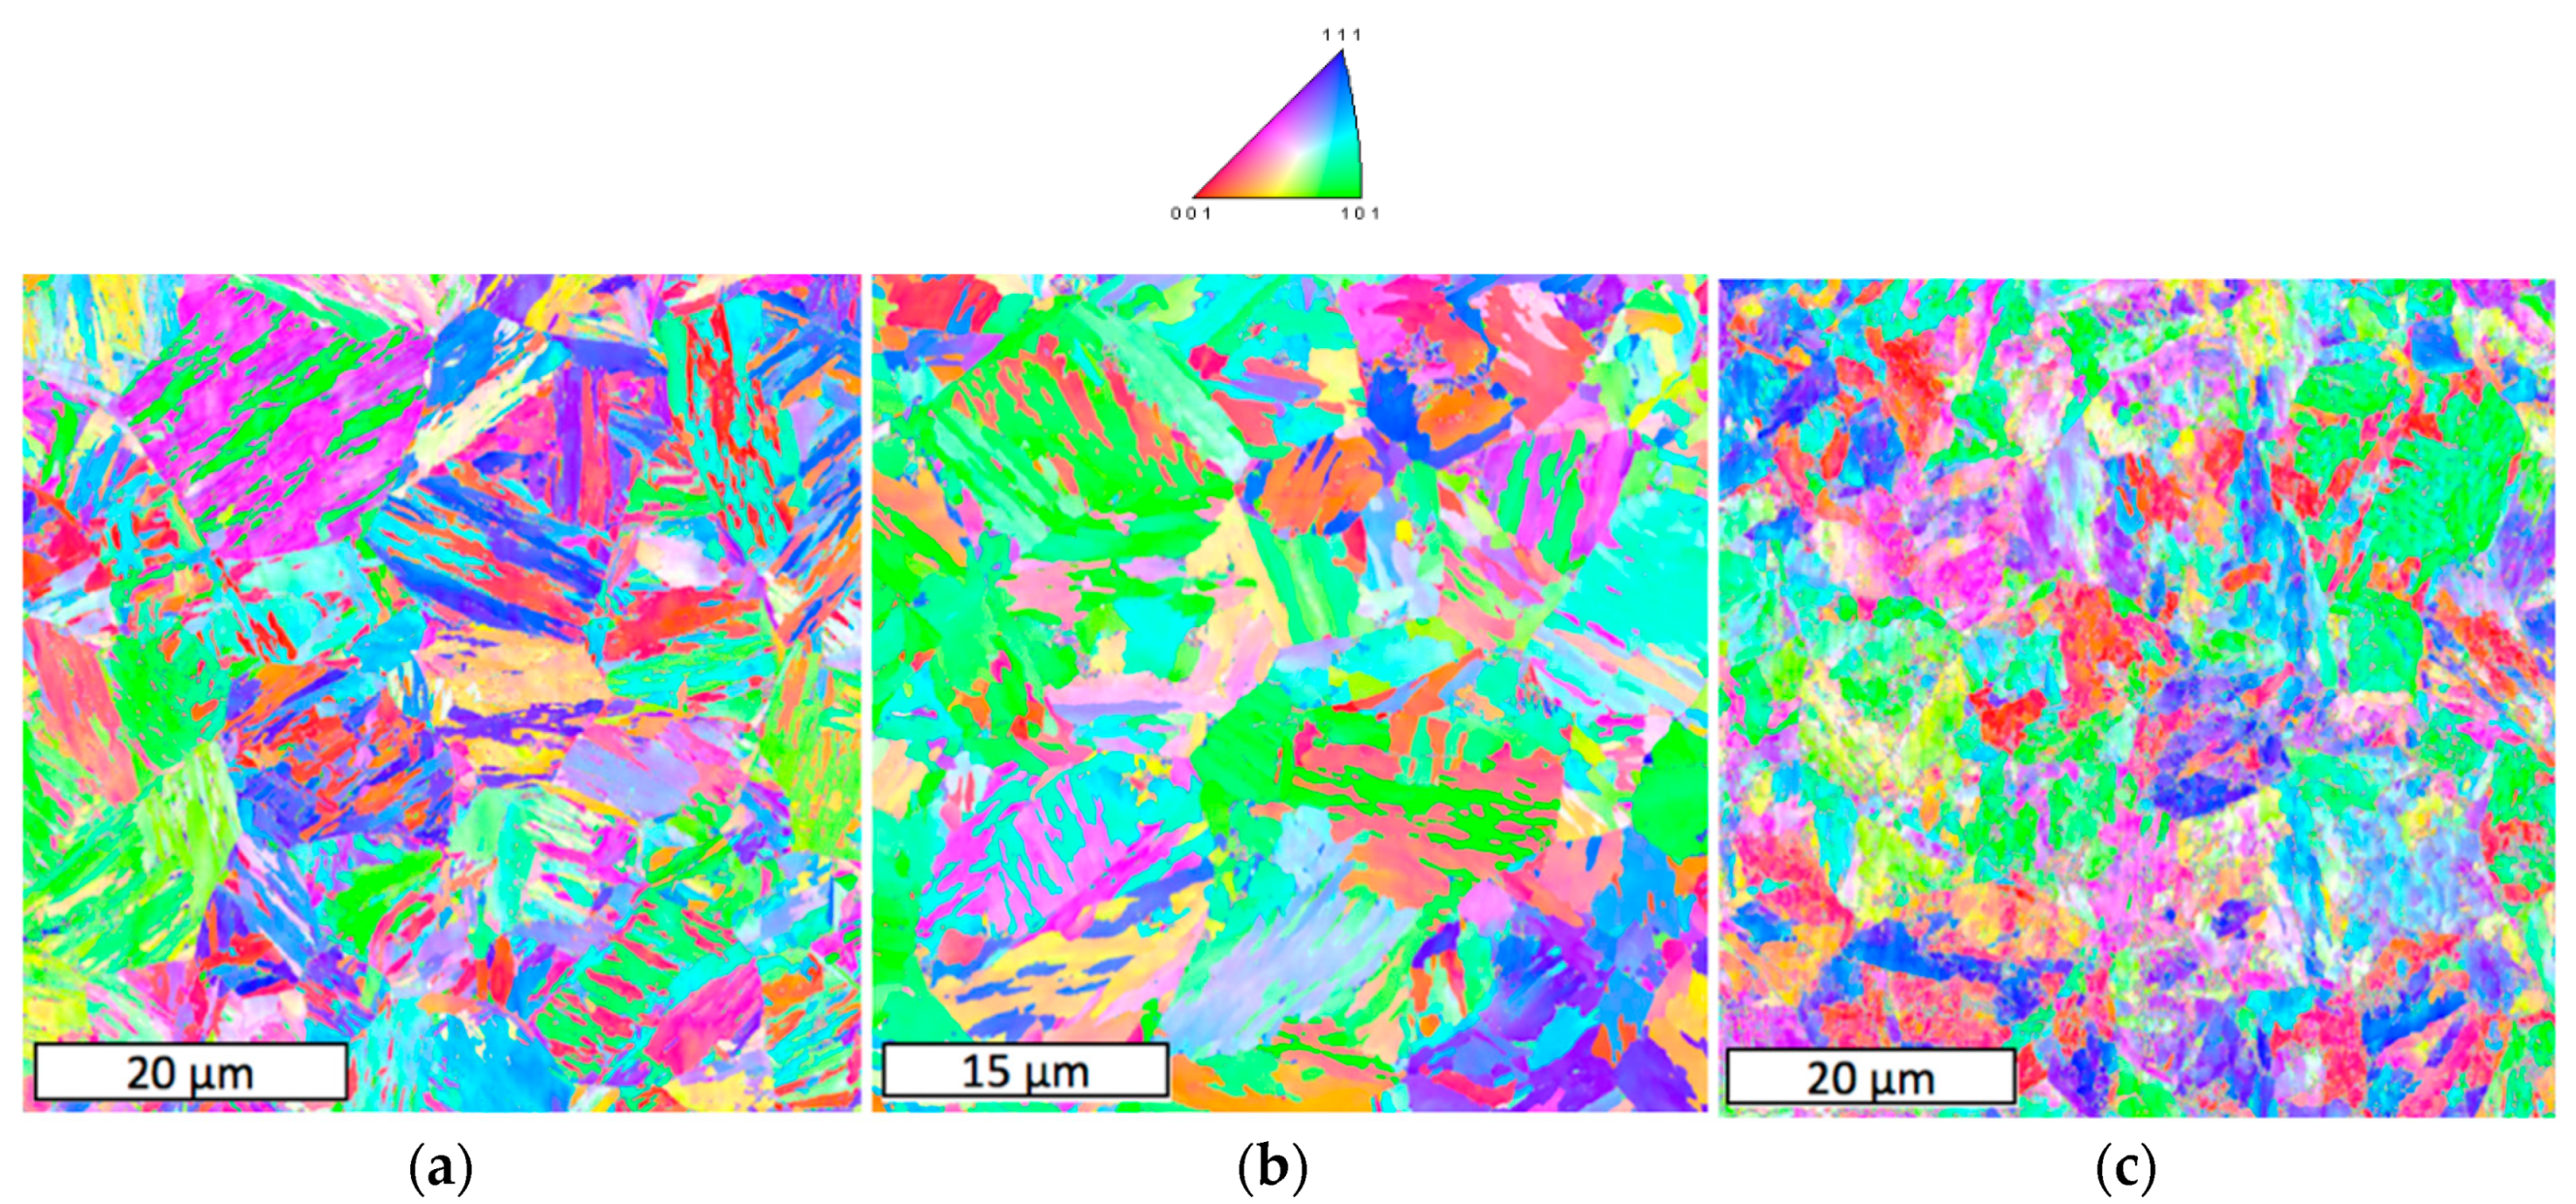
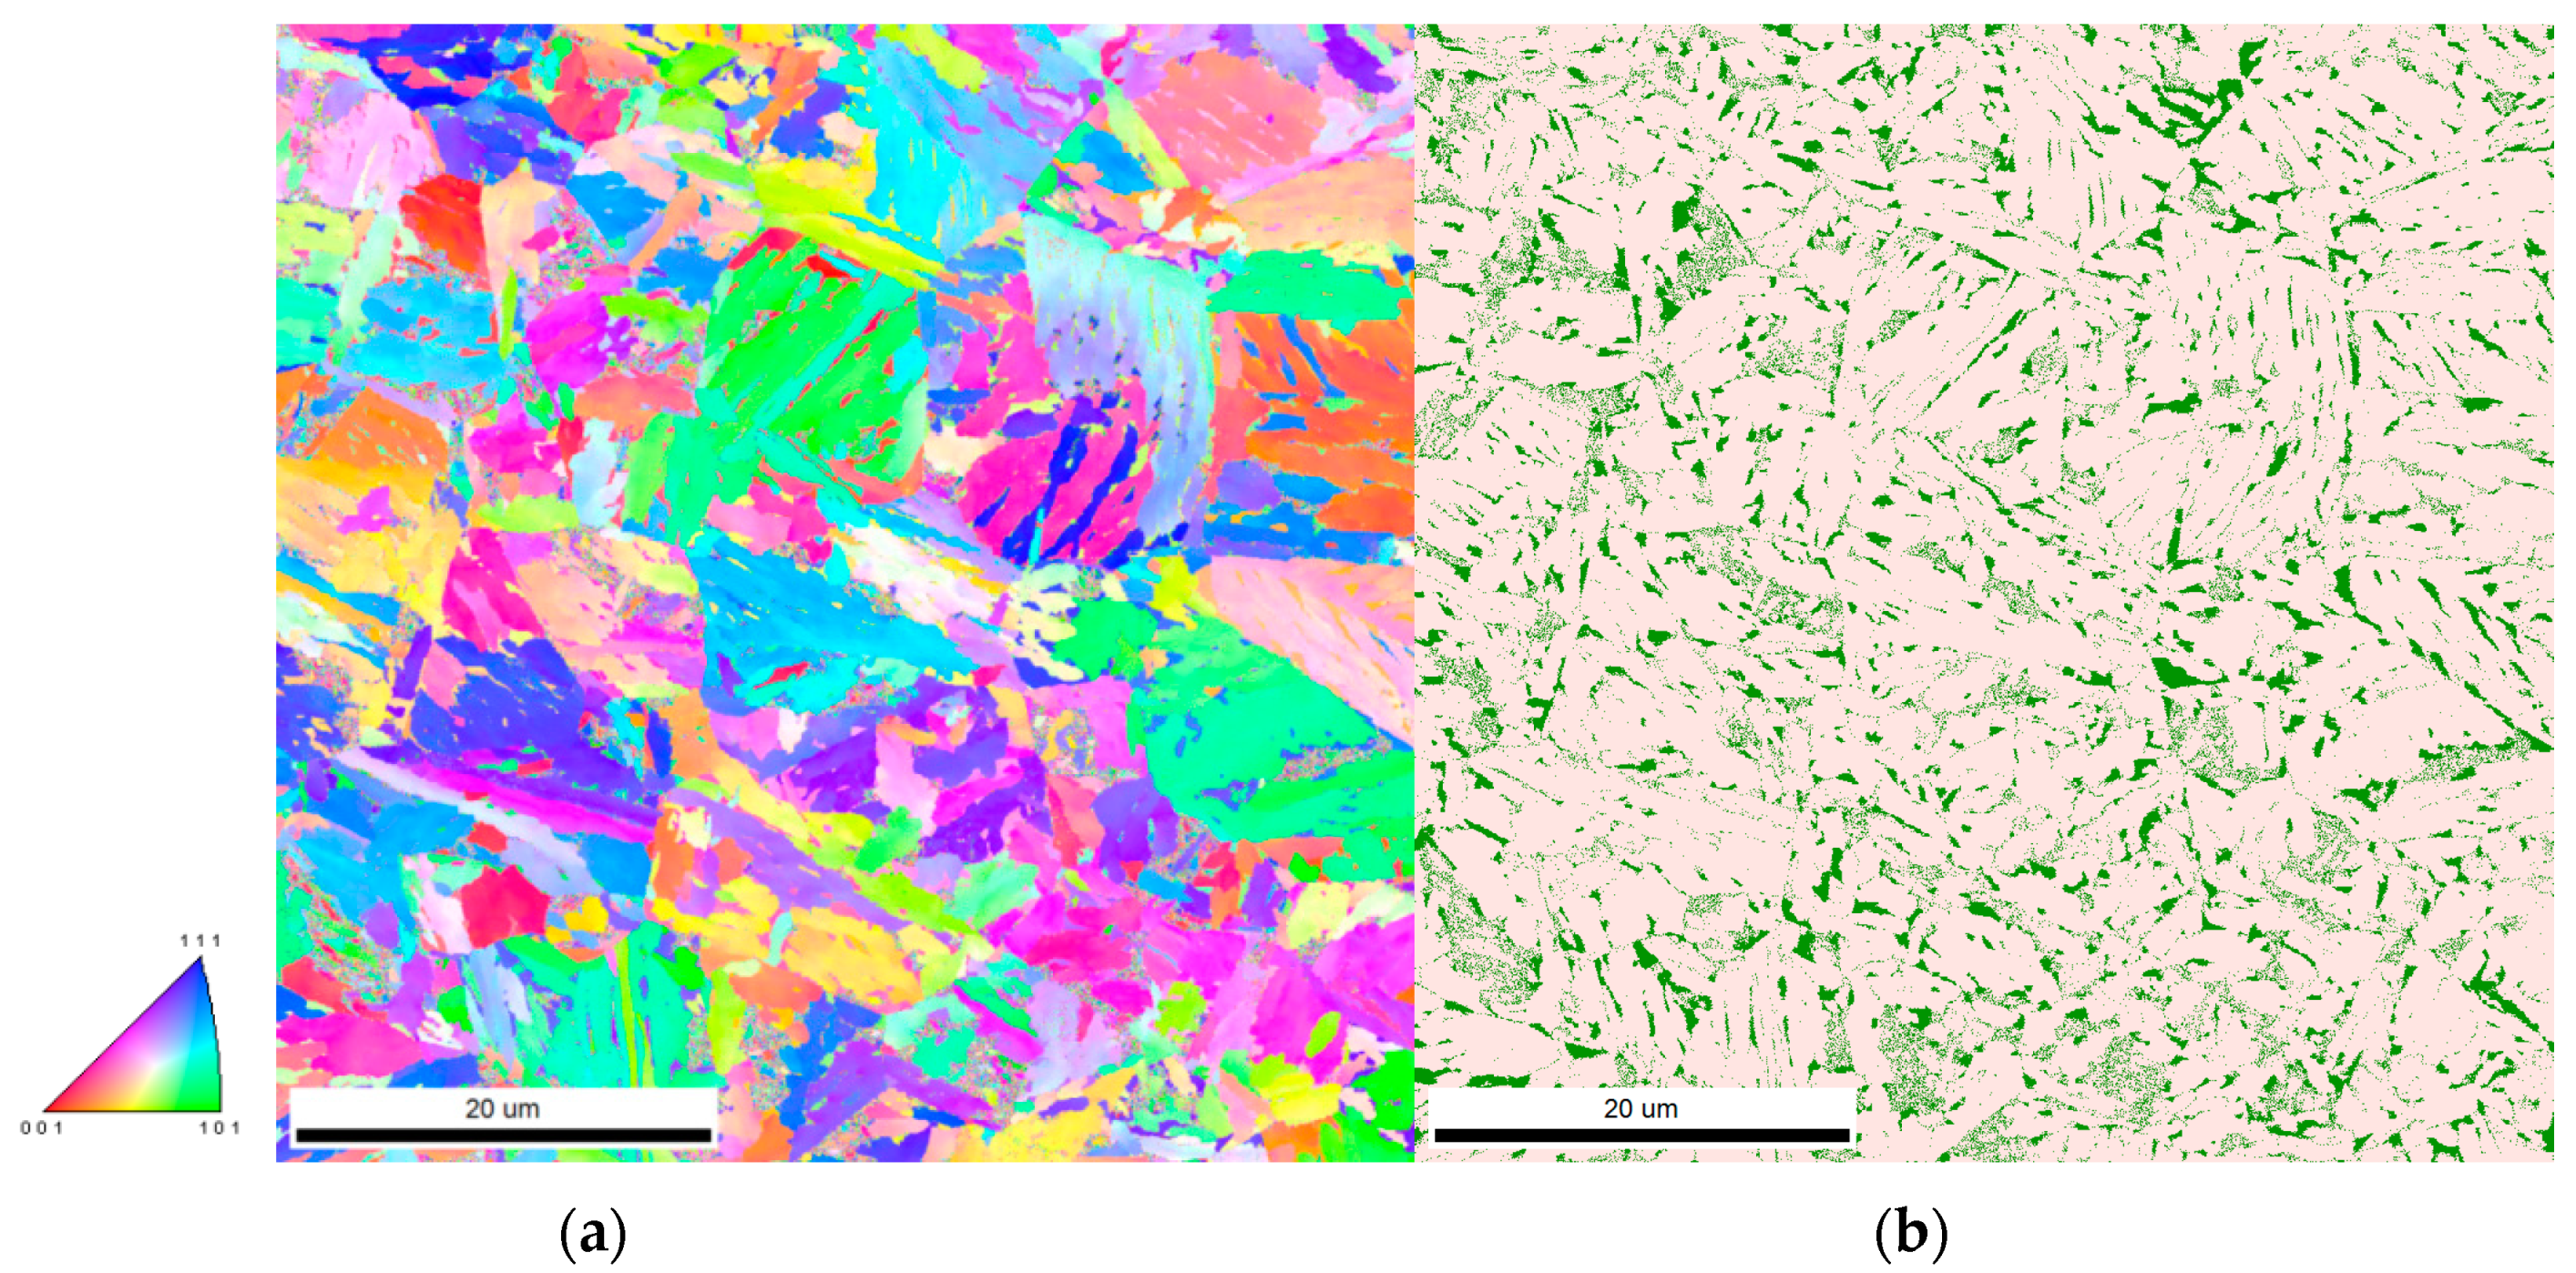
3.1. Initial Microstructure

The initial state studied here consists of a material subjected to hot rolling, coiling, and then isothermal treatment at an intermediate temperature, which should leave the material close to an equilibrium microstructure. Figure 2a shows a bright-field micrograph, and Figure 2b a section of the HEXRD diffractogram around the (110) peak of ferrite. From these figures, it is possible to conclude that the alloy consists of ferrite and cementite particles, whose sizes are typically of the order of a few tens of nanometers. This initial microstructure is subsequently subjected to cold rolling before the austenitization heat treatment.

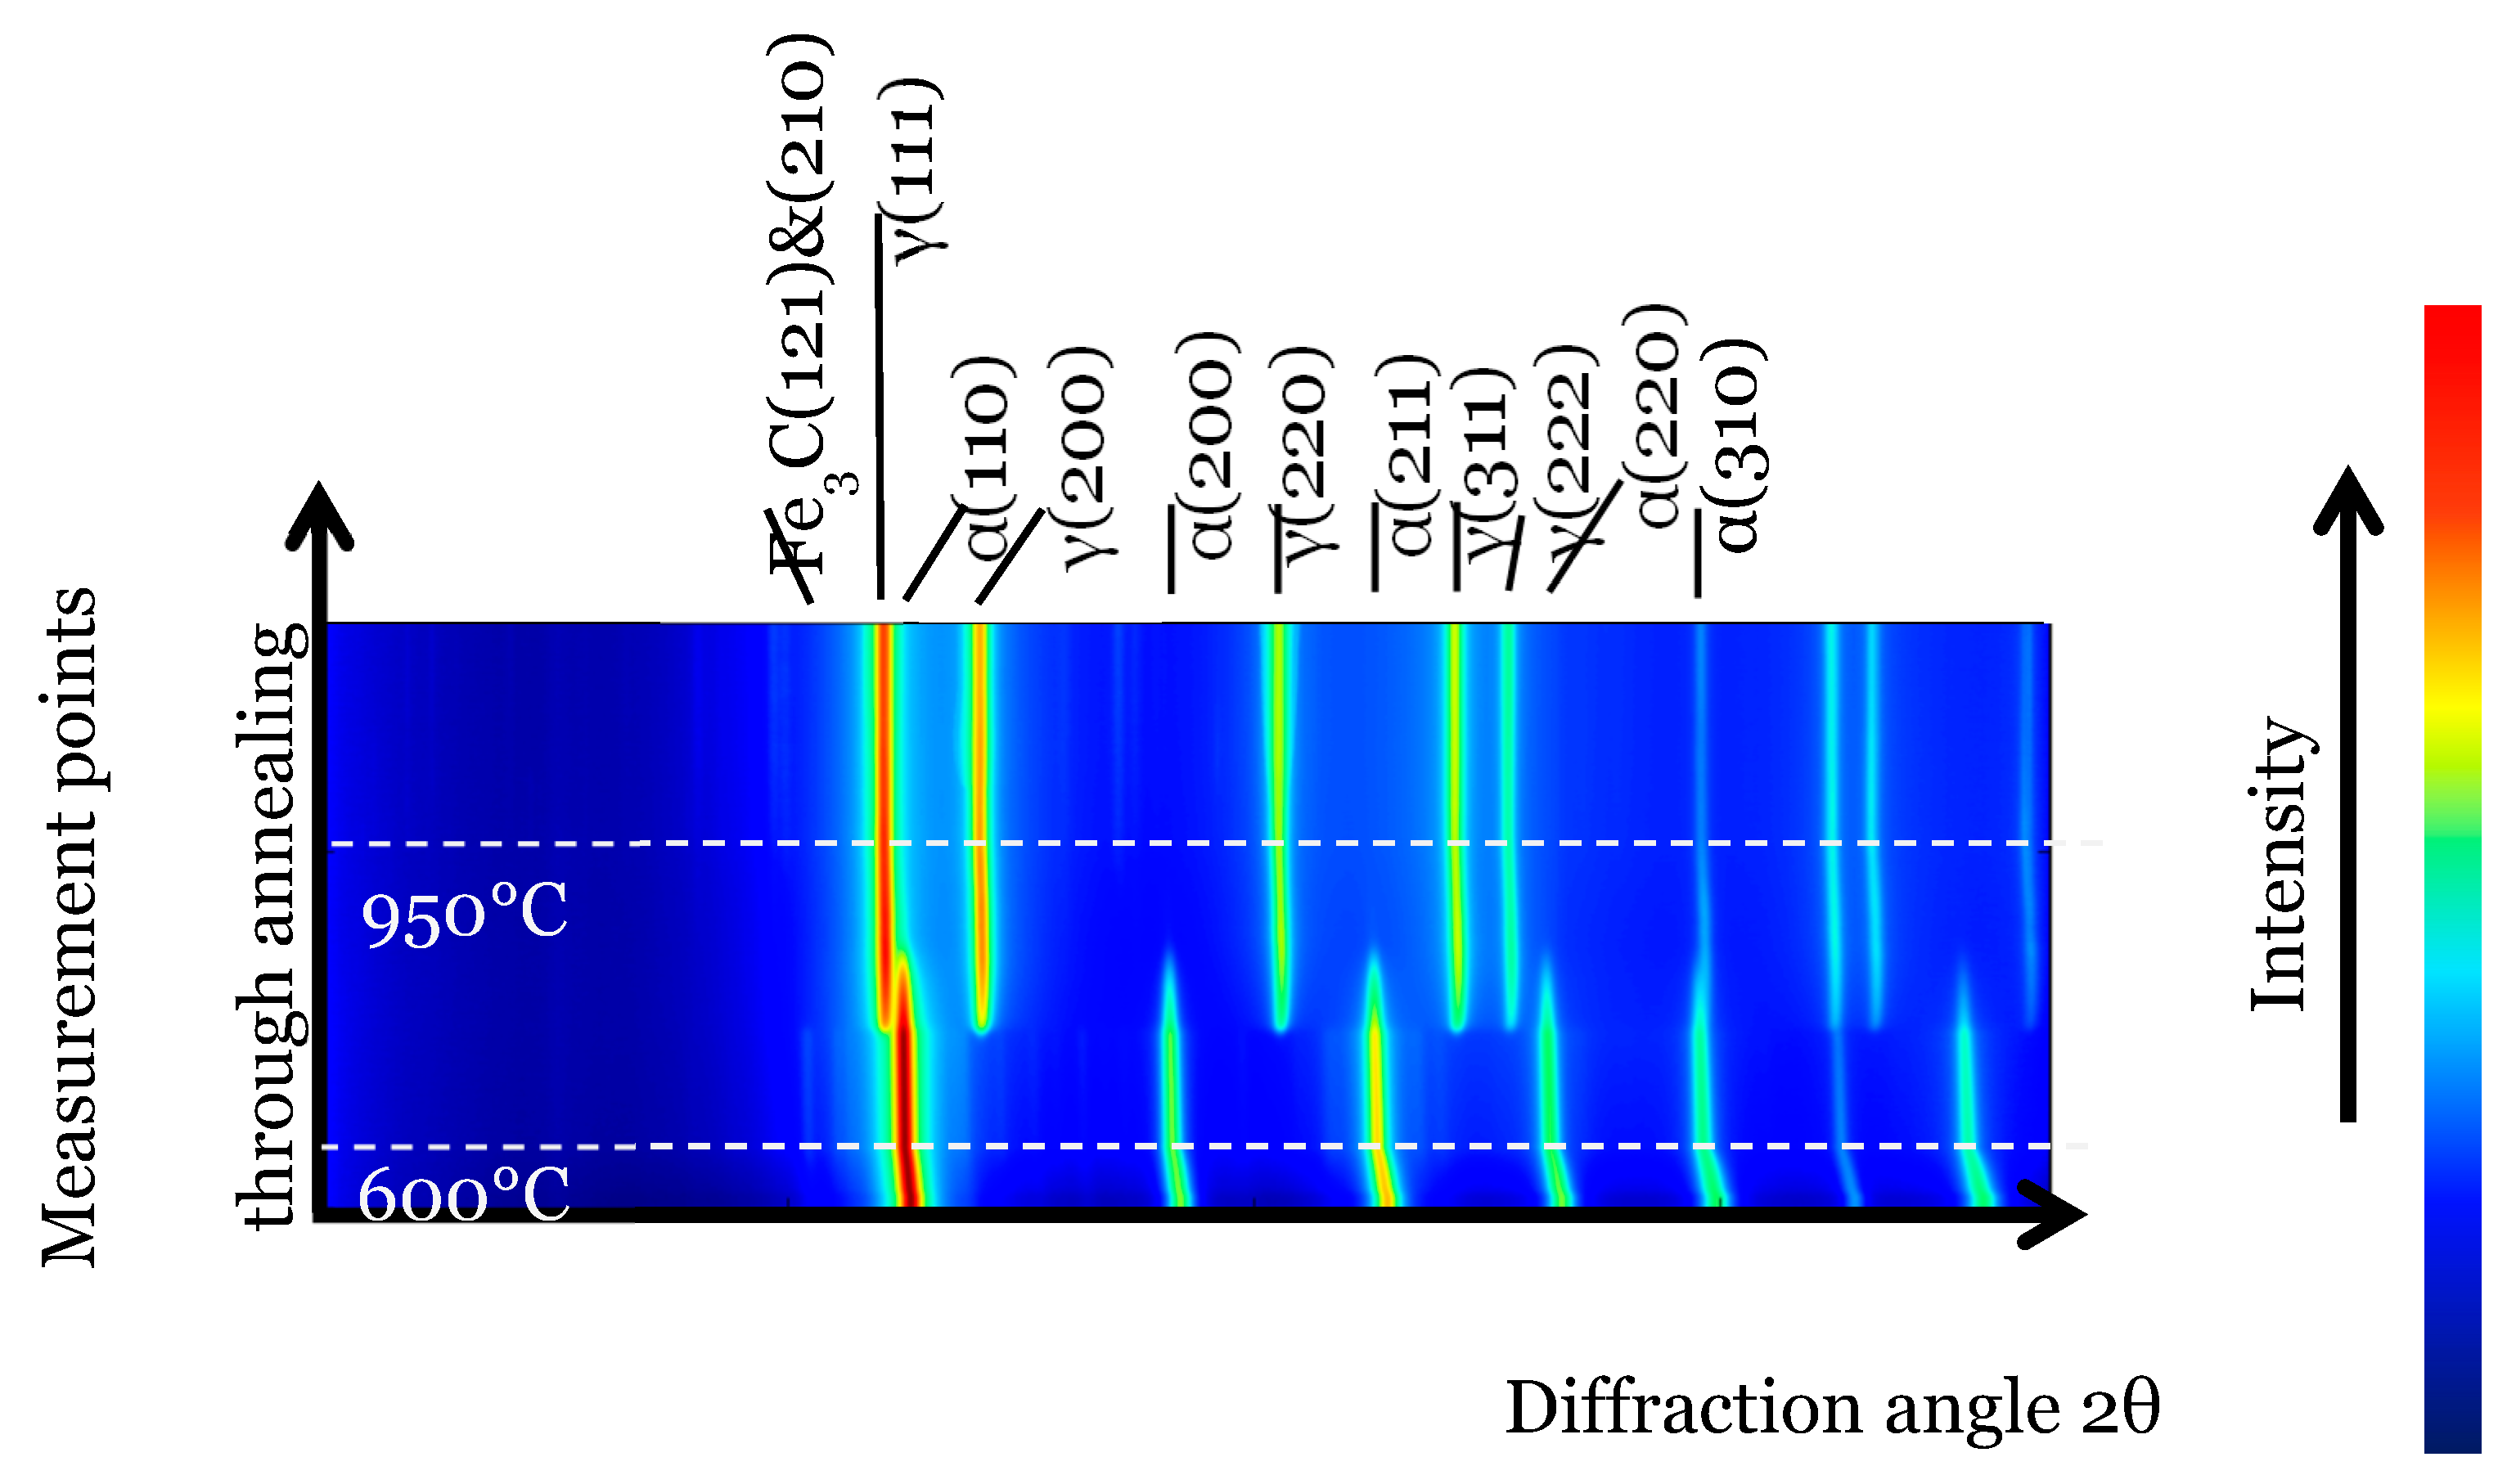
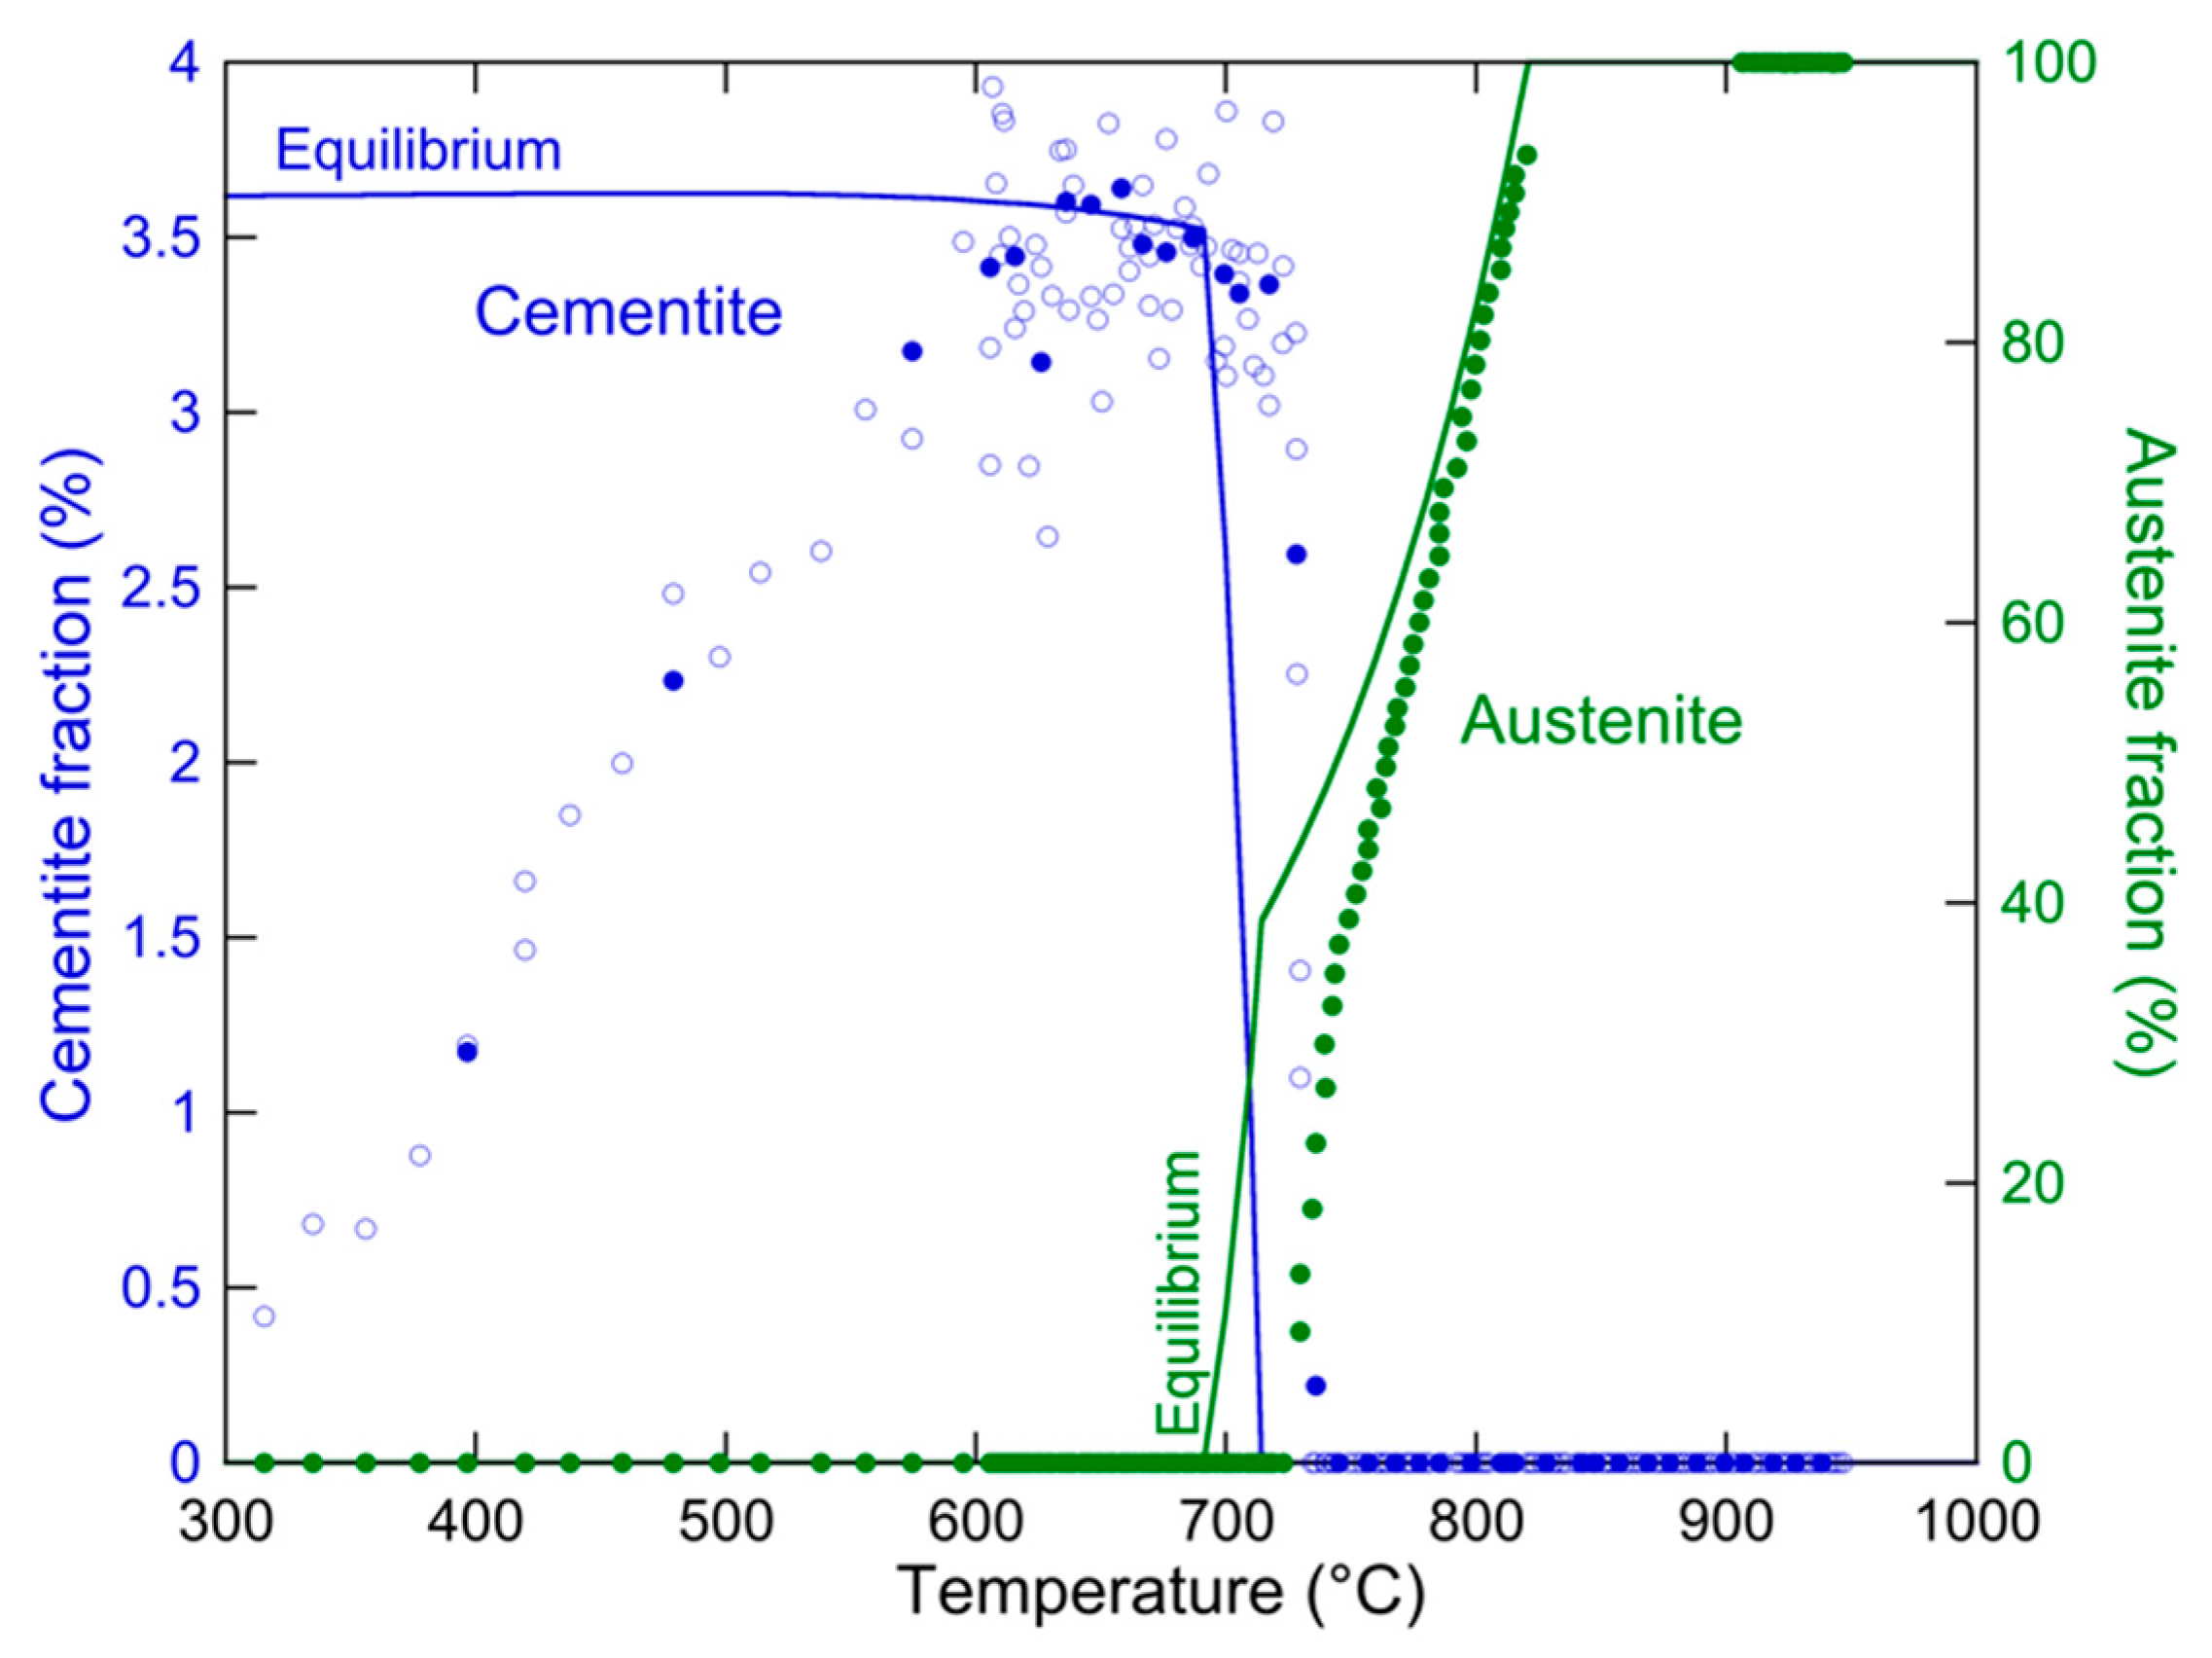
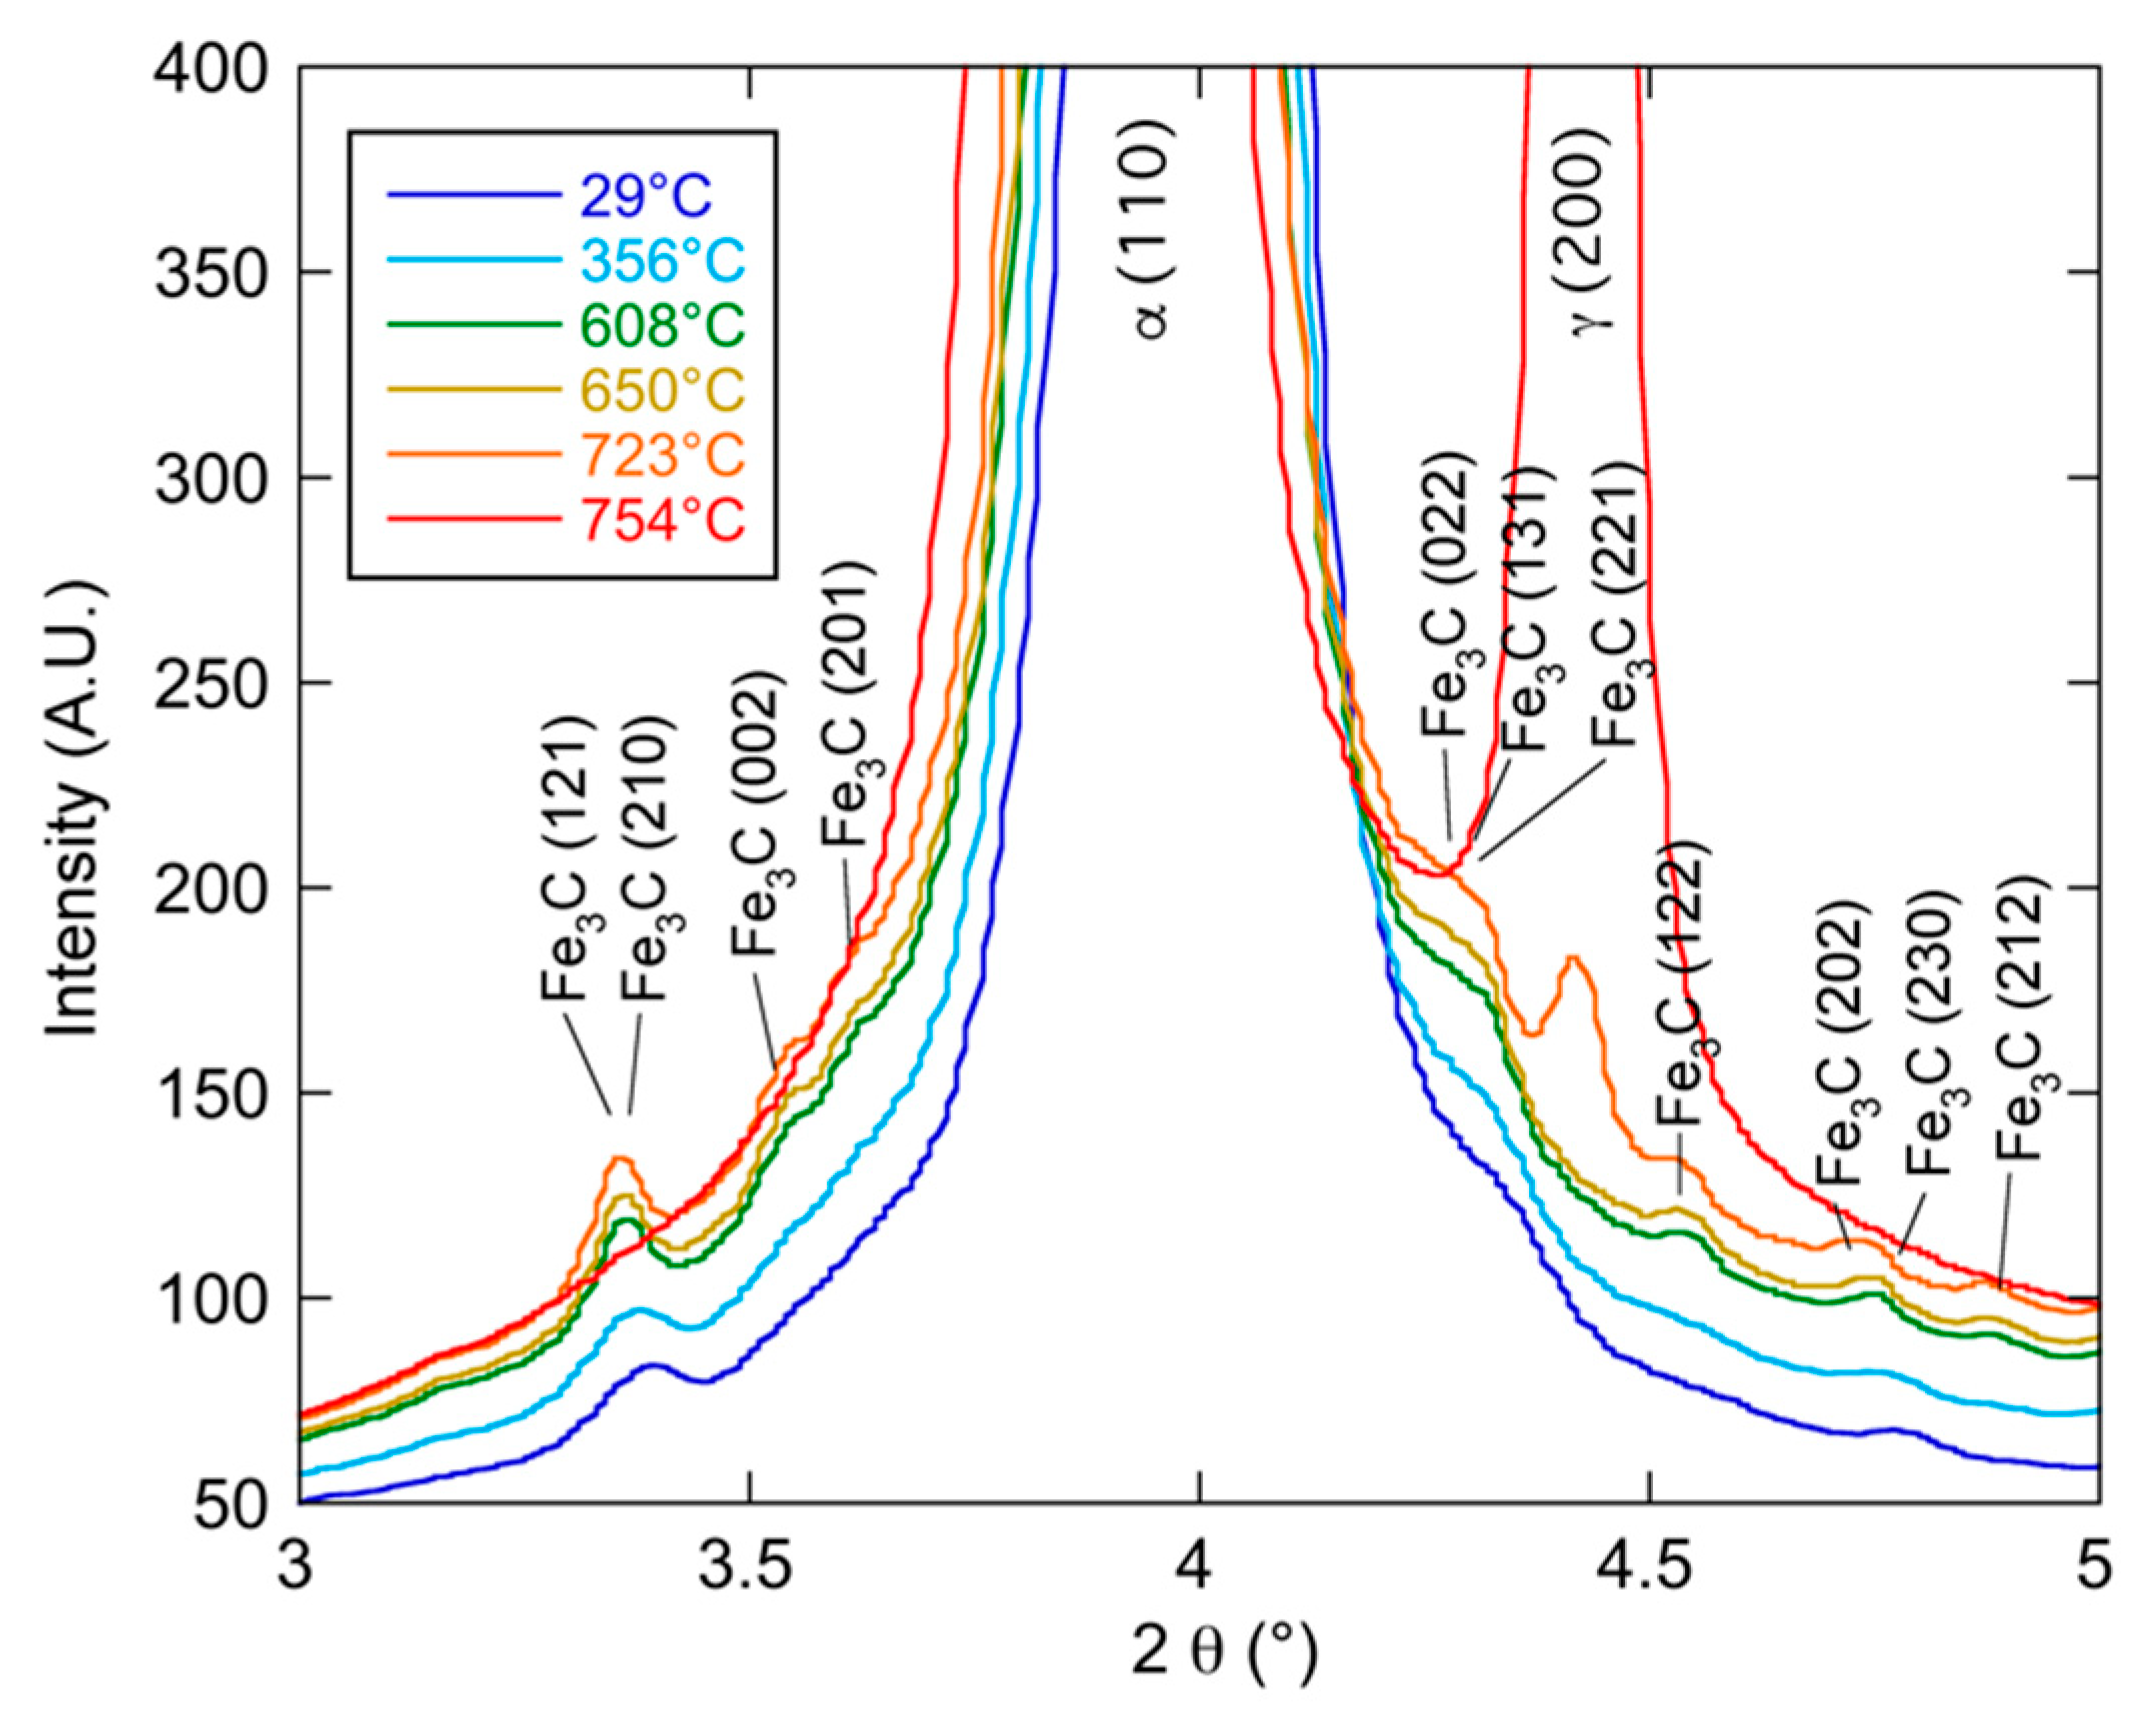
3.2. Austenitization

During austenitization, in-situ HEXRD measurements enable the following of the evolution of the phases present. Figure 3 presents stacks of diffractograms during heating from room temperature to the austenitization temperature (950 °C). The main diffraction peaks, associated with ferrite and austenite, evidence the phase transformation that occurs at around 700 °C. The cementite diffraction peaks are more faintly visible and disappear concurrently to the dissolution of ferrite and formation of austenite.
To quantitatively measure the phase fractions from this data, the diffractograms have been evaluated by Rietveld refinement using FullProf while considering only austenite and ferrite (as the very low fraction of cementite did not allow it to be taken into account). In parallel, the cementite fraction has been evaluated by peak integration on the (123) peak of cementite. To convert this relative evolution into an absolute fraction, it has been assumed that the maximum measured value corresponds to the equilibrium fraction of cementite. Figure 4 shows the evolution of austenite and cementite fractions during the heating treatment to the austenitization temperature, along with the equilibrium fractions determined by Thermo-calc ® software using the TCFE9 database.
Initially, the austenite rapidly forms concurrently to the cementite dissolution, thereby absorbing the released carbon. When the cementite has fully dissolved, the austenite fraction is approximately 40% and then increases more slowly until full austenitization a little above 800 °C. When compared to the equilibrium, the evolution of cementite and austenite fractions is shifted by about 30 °C. This difference can be attributed to the presence of Mn in cementite, detected by TEM-EDS in agreement with the literature [29,30,31]. More surprising is the low fraction of cementite measured at the early stages of the austenitization treatment (below 600 °C). This is further illustrated in Figure 5, which shows a section of the diffractograms around the (110) peak of ferrite during heating. The cementite peaks are observed to first grow before disappearing. As it is likely that cementite is present in the as-cold rolled material, the most likely explanation is that the cementite particles from the initial microstructure are fragmented or deformed during cold rolling to a sufficiently small size that makes their detection by XRD difficult.
At the end of the austenitization, it is of interest to evaluate the austenite grain size before the bainitic transformation as it may influence the transformation kinetics. This evaluation has been performed by two means. First, the austenitized material has been quenched to the inter-critical temperature (710 °C), kept for 10 min at this temperature, and quenched to room temperature. The resulting microstructure consists of ferrite grains along the former austenite grain boundaries, and a martensitic microstructure in the core of these former austenitic grains, enabling to observe after etching the austenite grain structure by optical microscopy. Figure 6a shows such a microstructure, evidencing an austenite grain size distribution ranging between 2 and 50 µm, with a measured mean grain size of 11.7 µm.
Secondly, the final microstructure after the bainitic transformation performed at 350 °C has been revealed by EBSD, as shown in Figure 6b. The bainite lath families are clearly visible. Due to the orientation relationships prevailing during the phase transformation, the orientation of former austenite grains can be obtained by inverse analysis. This evaluation has been realized using the ARPGE software [32] and results in a color map where different colors correspond to different former austenite grains (Figure 6c). Although the resulting micrograph corresponds to an area too small to be fully representative, it correlates well with the optical micrograph of Figure 6a, thus confirming the austenite grain size distribution.

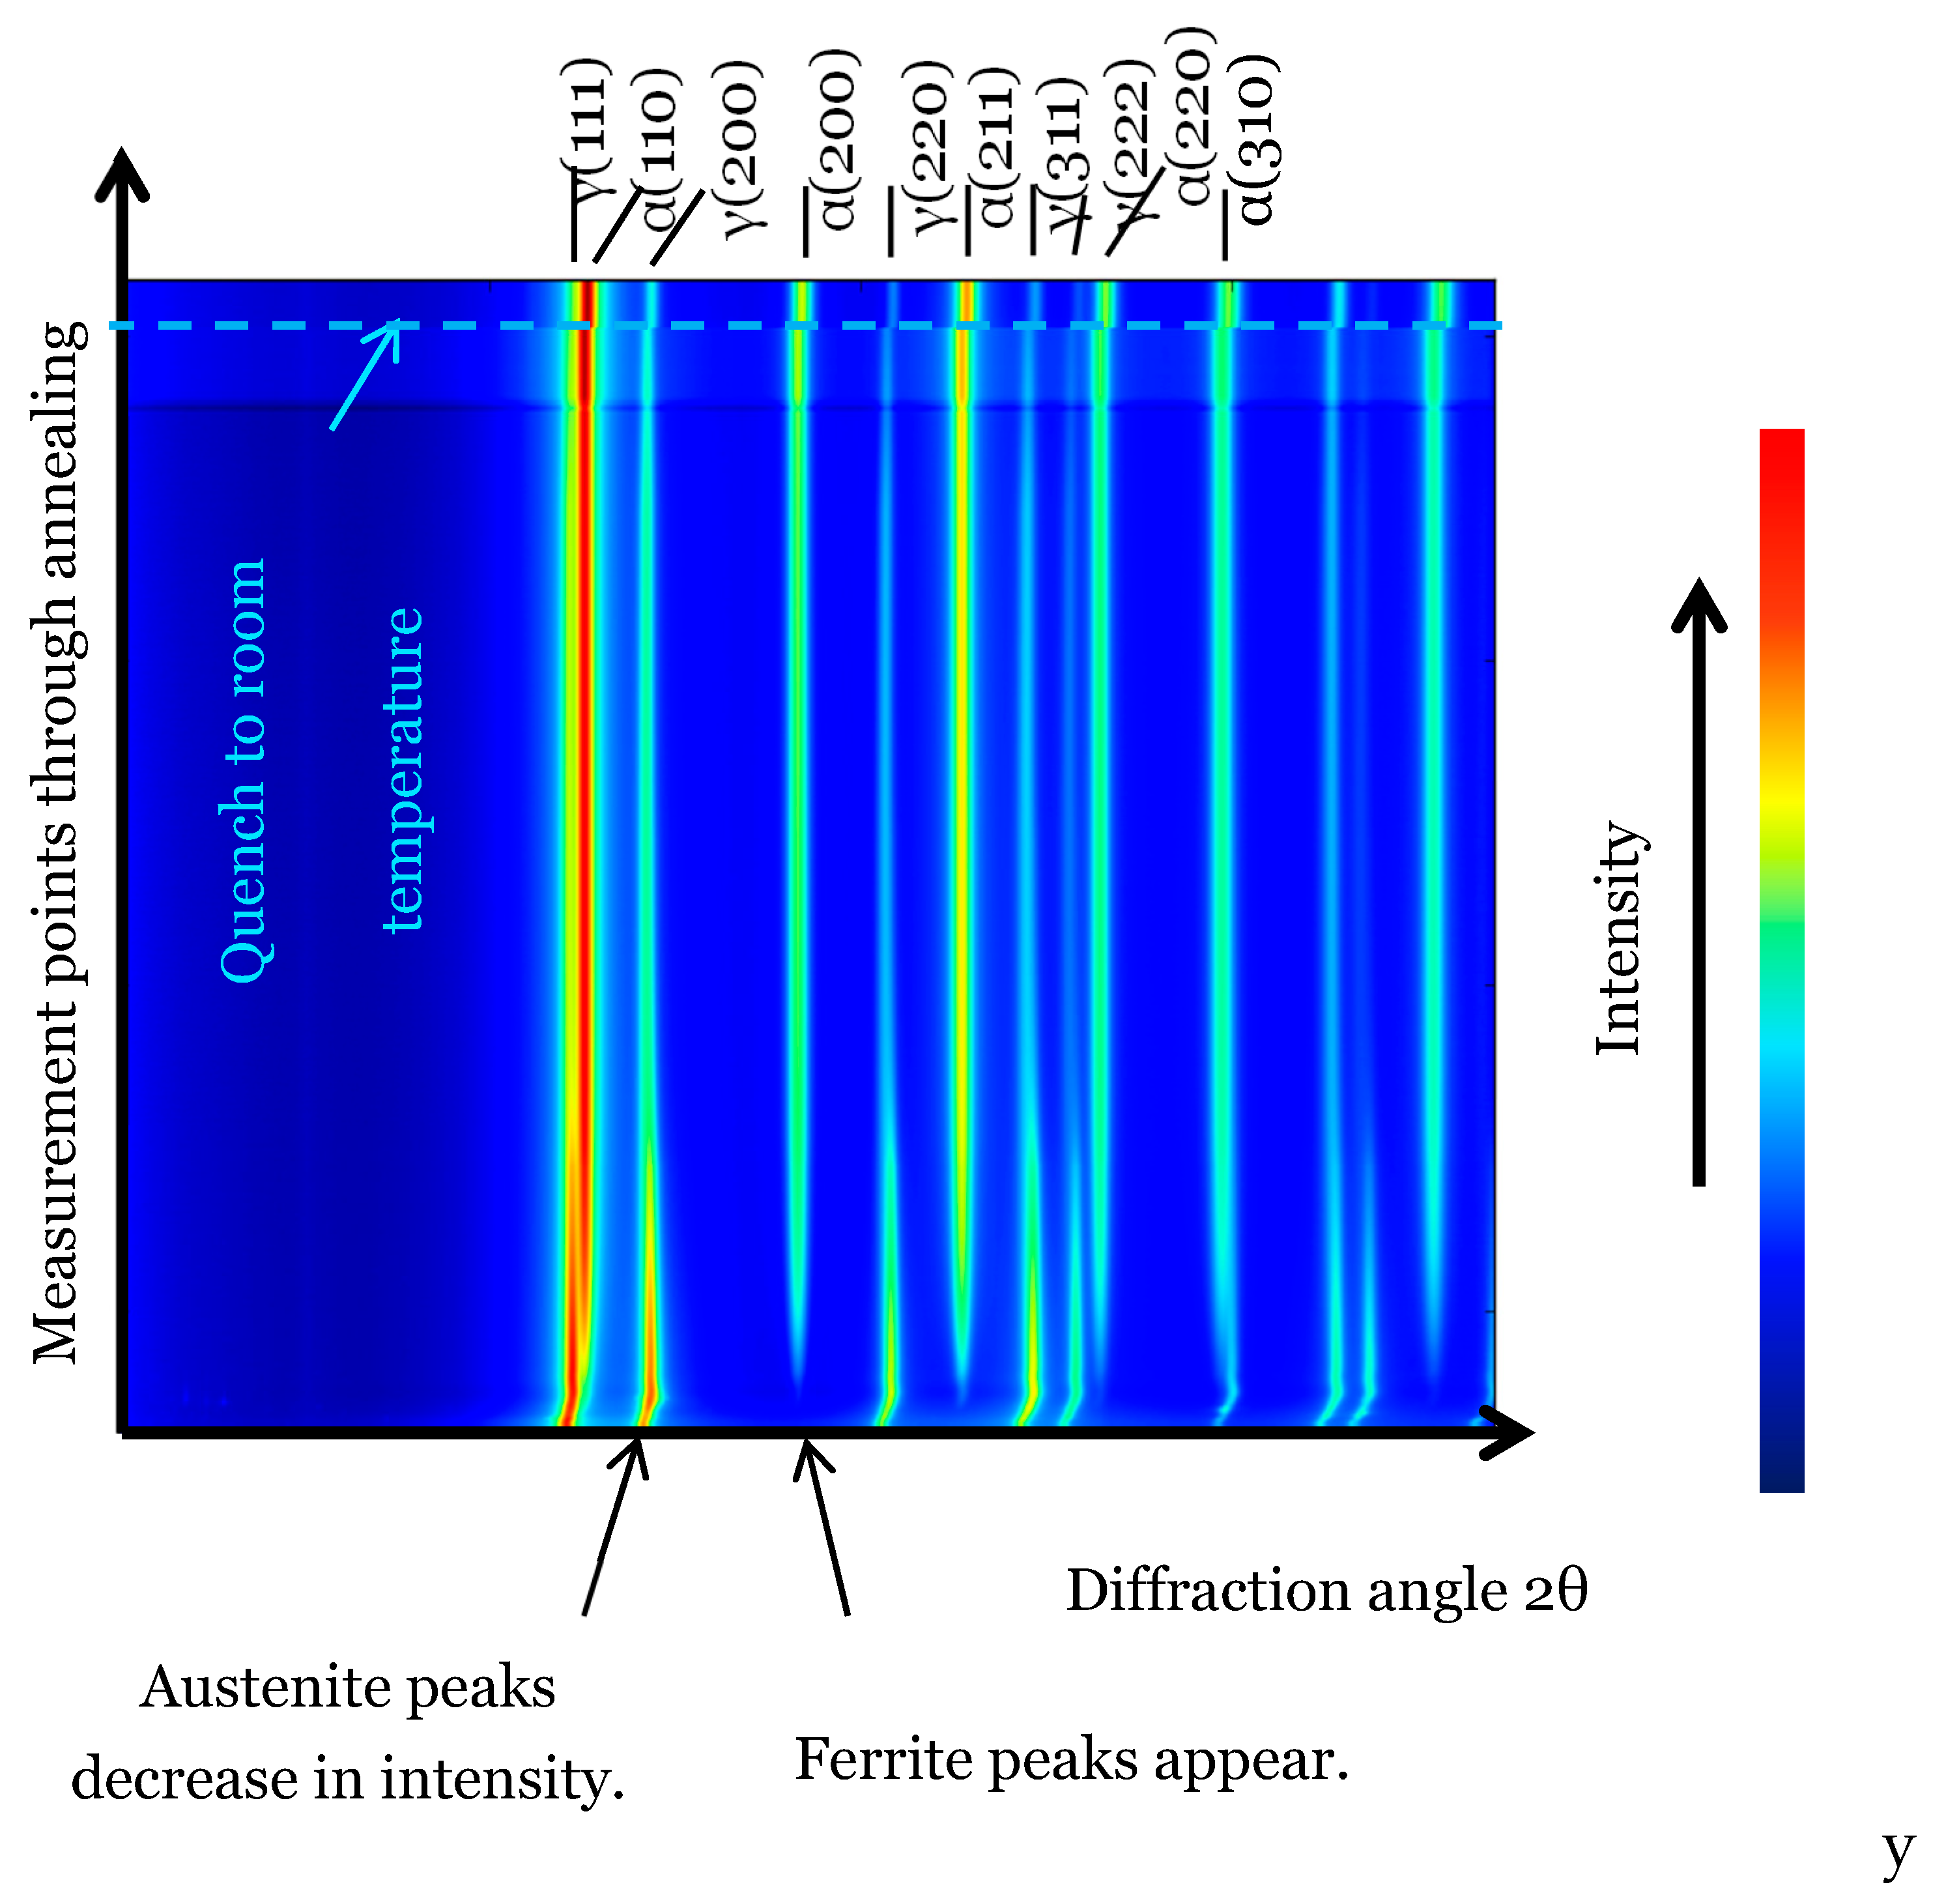
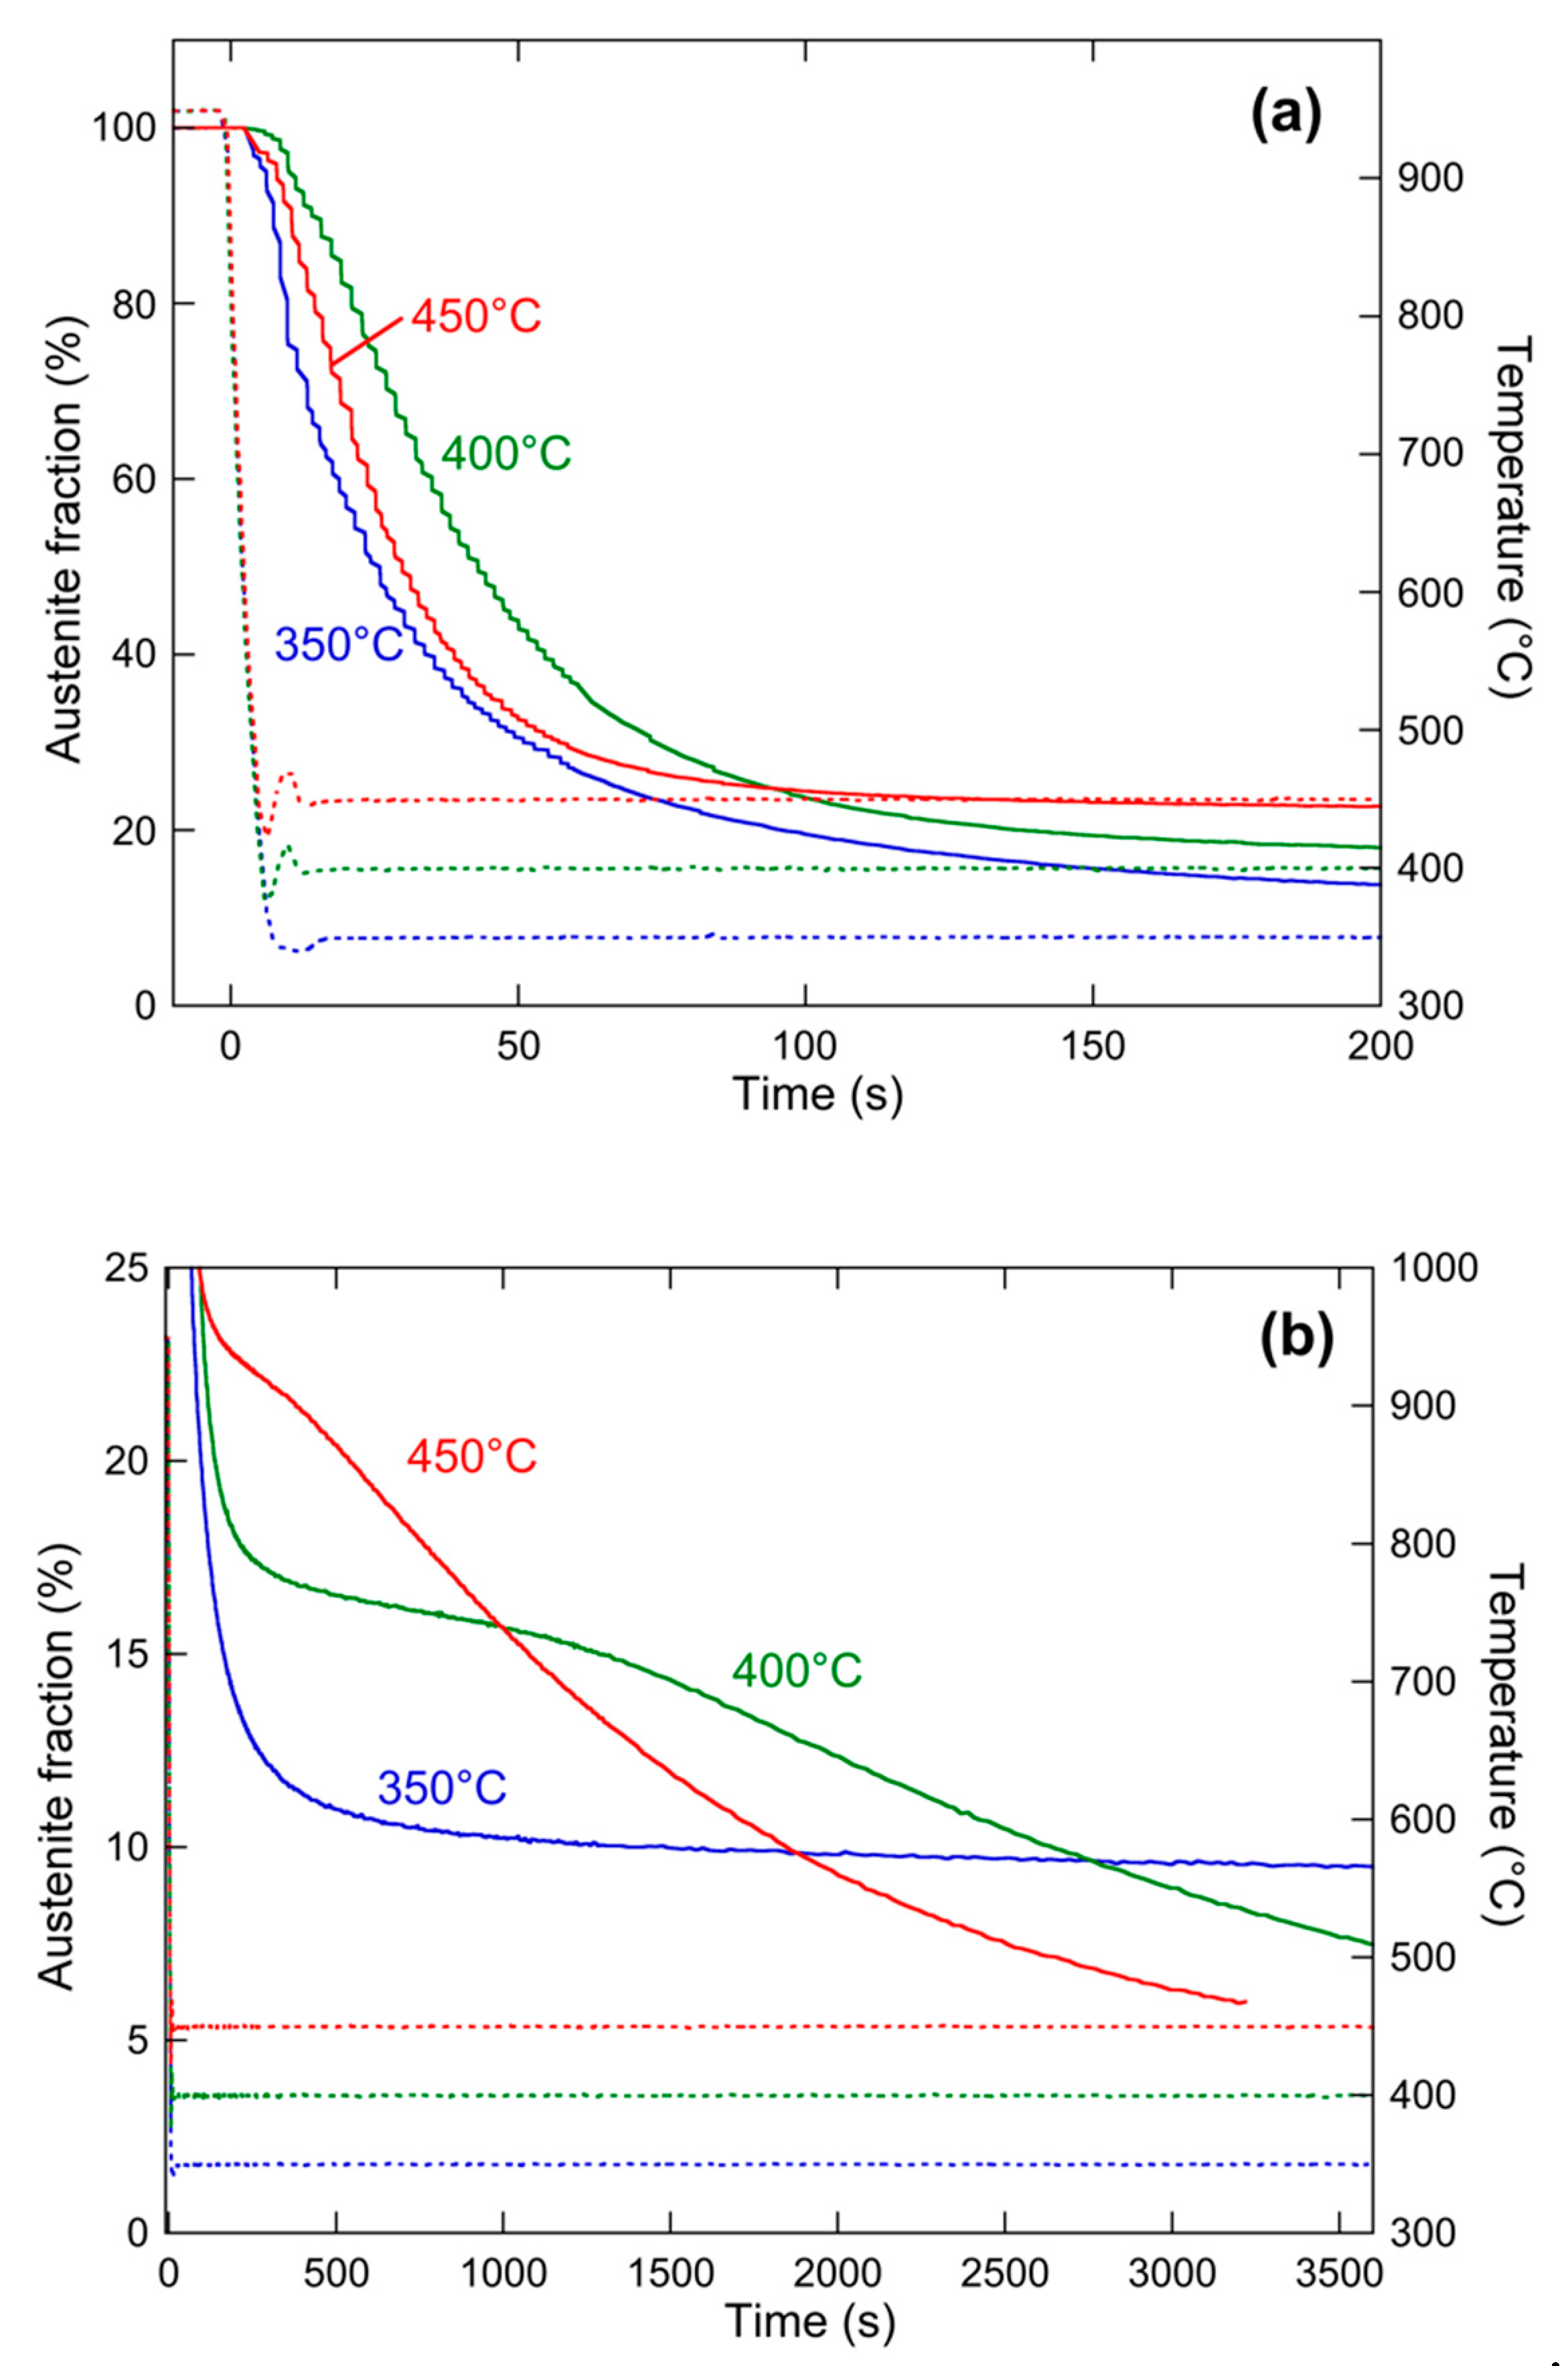
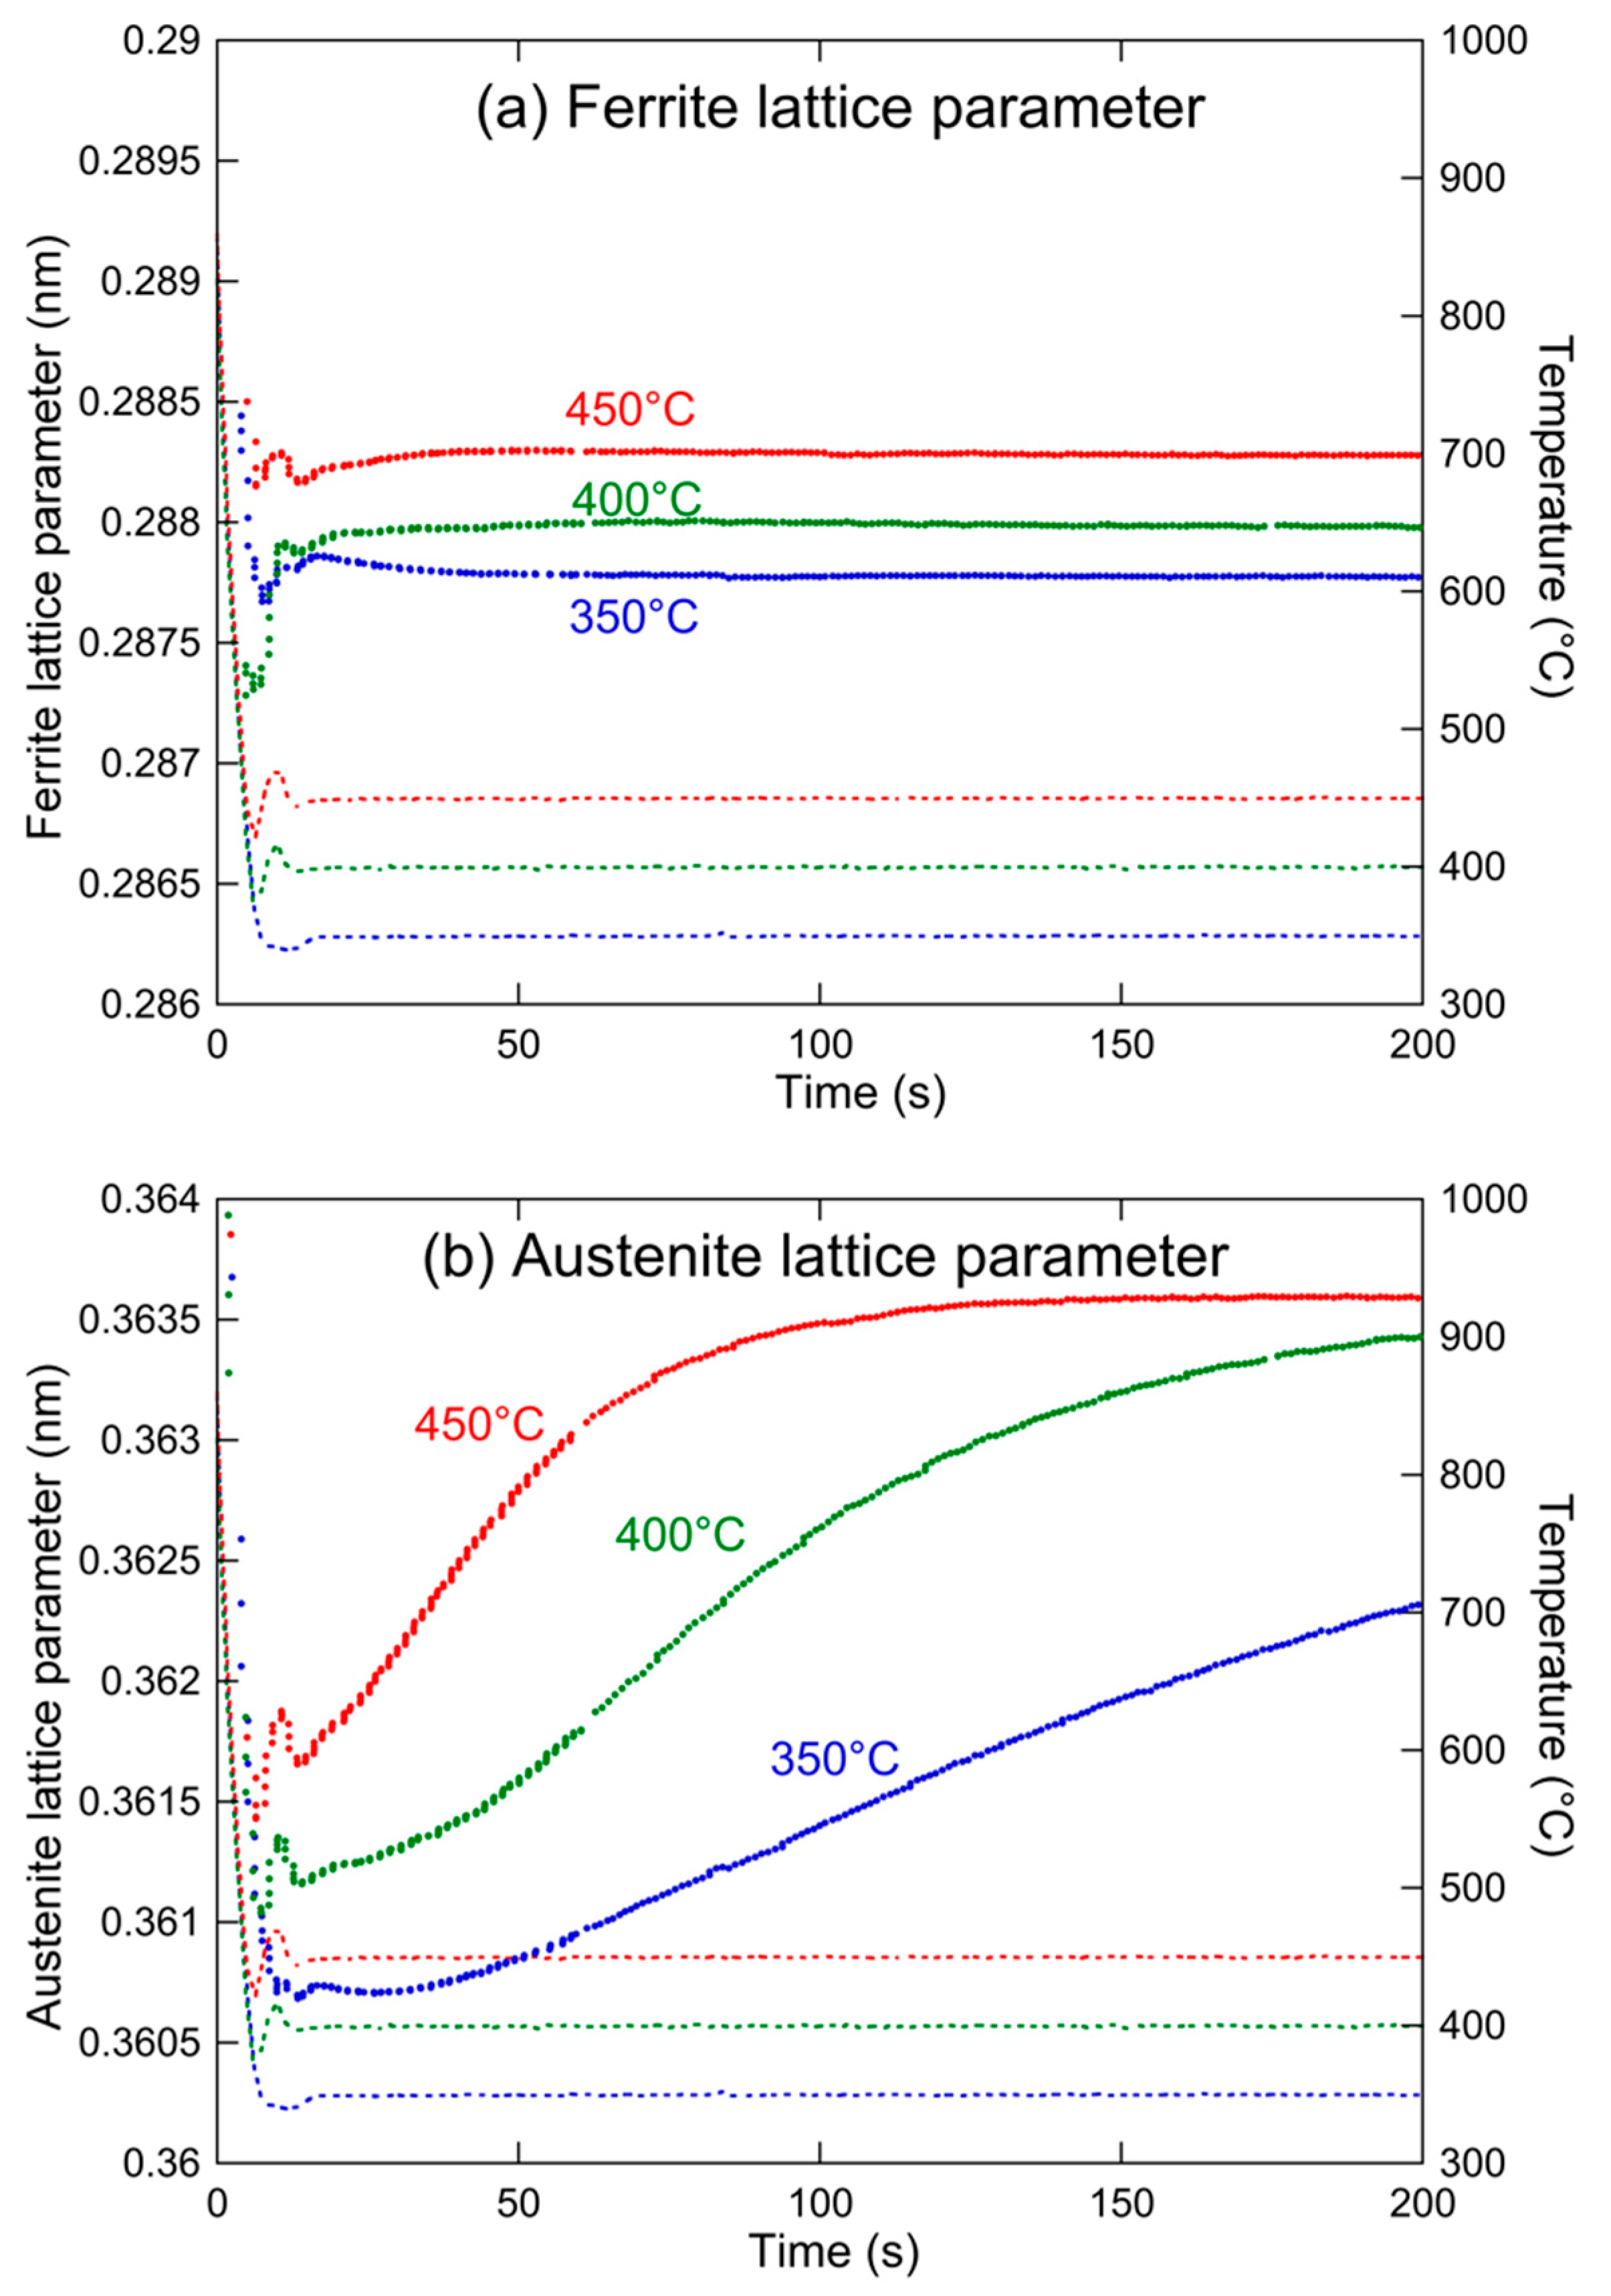
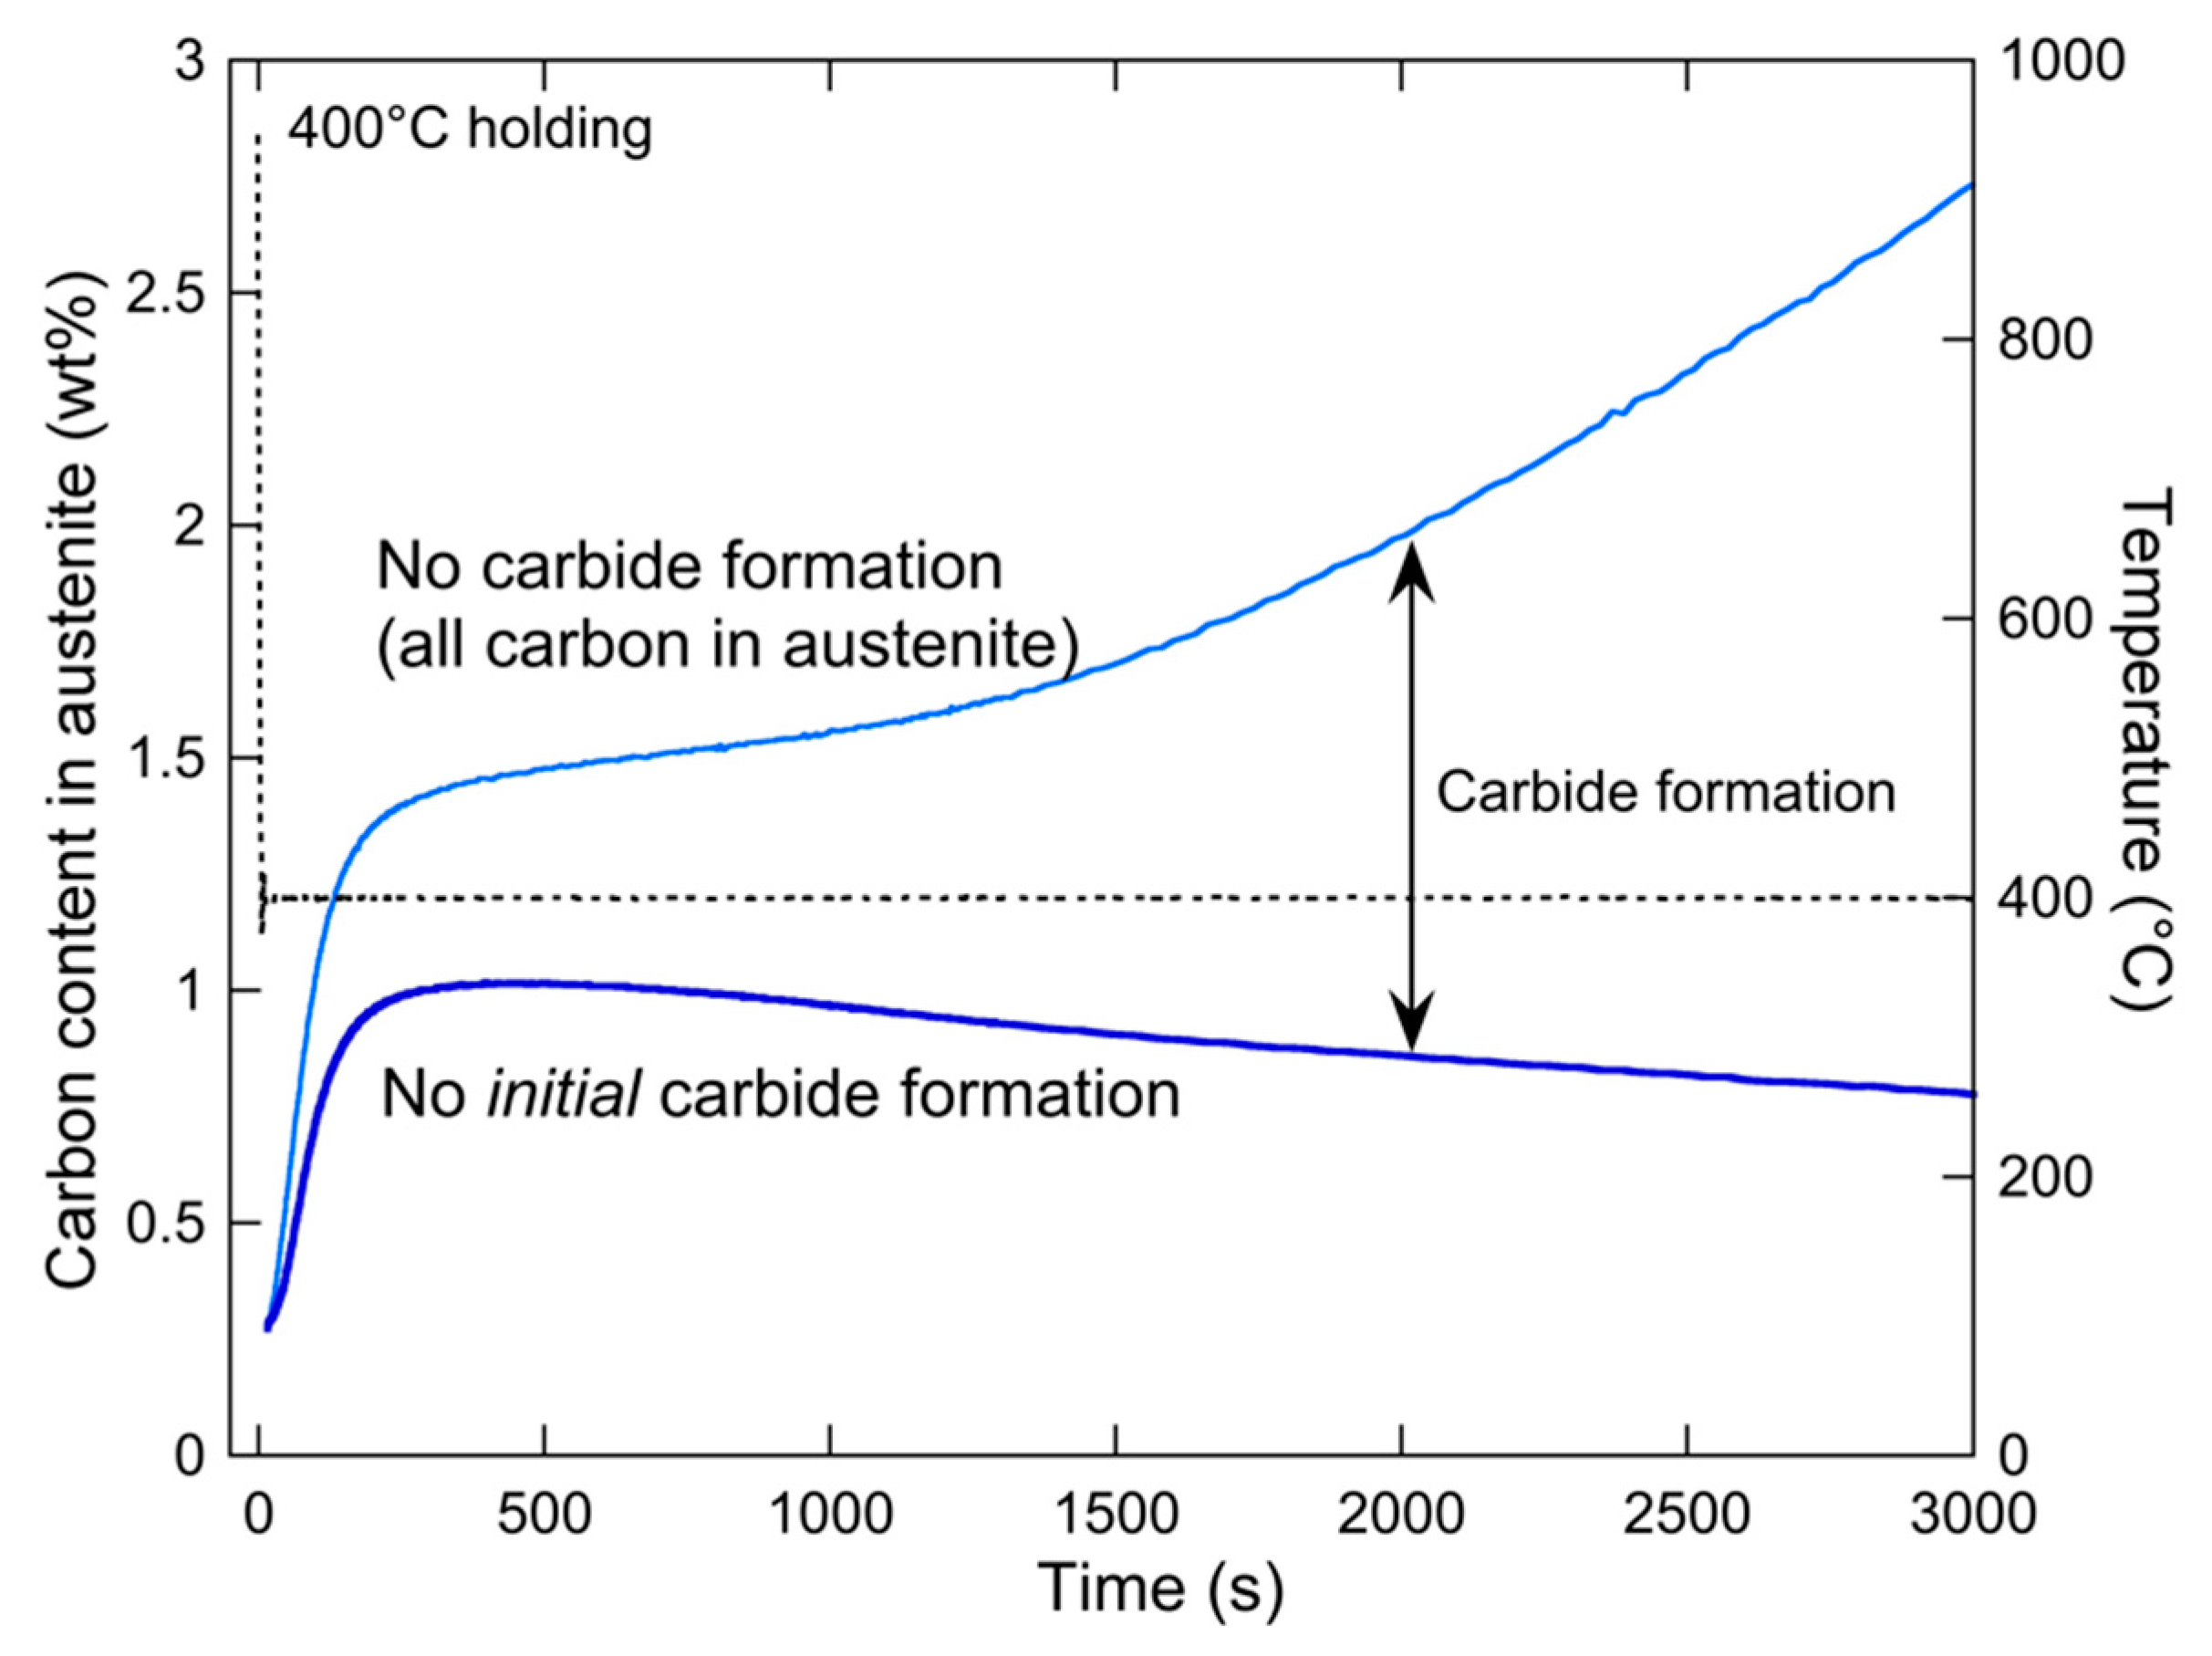
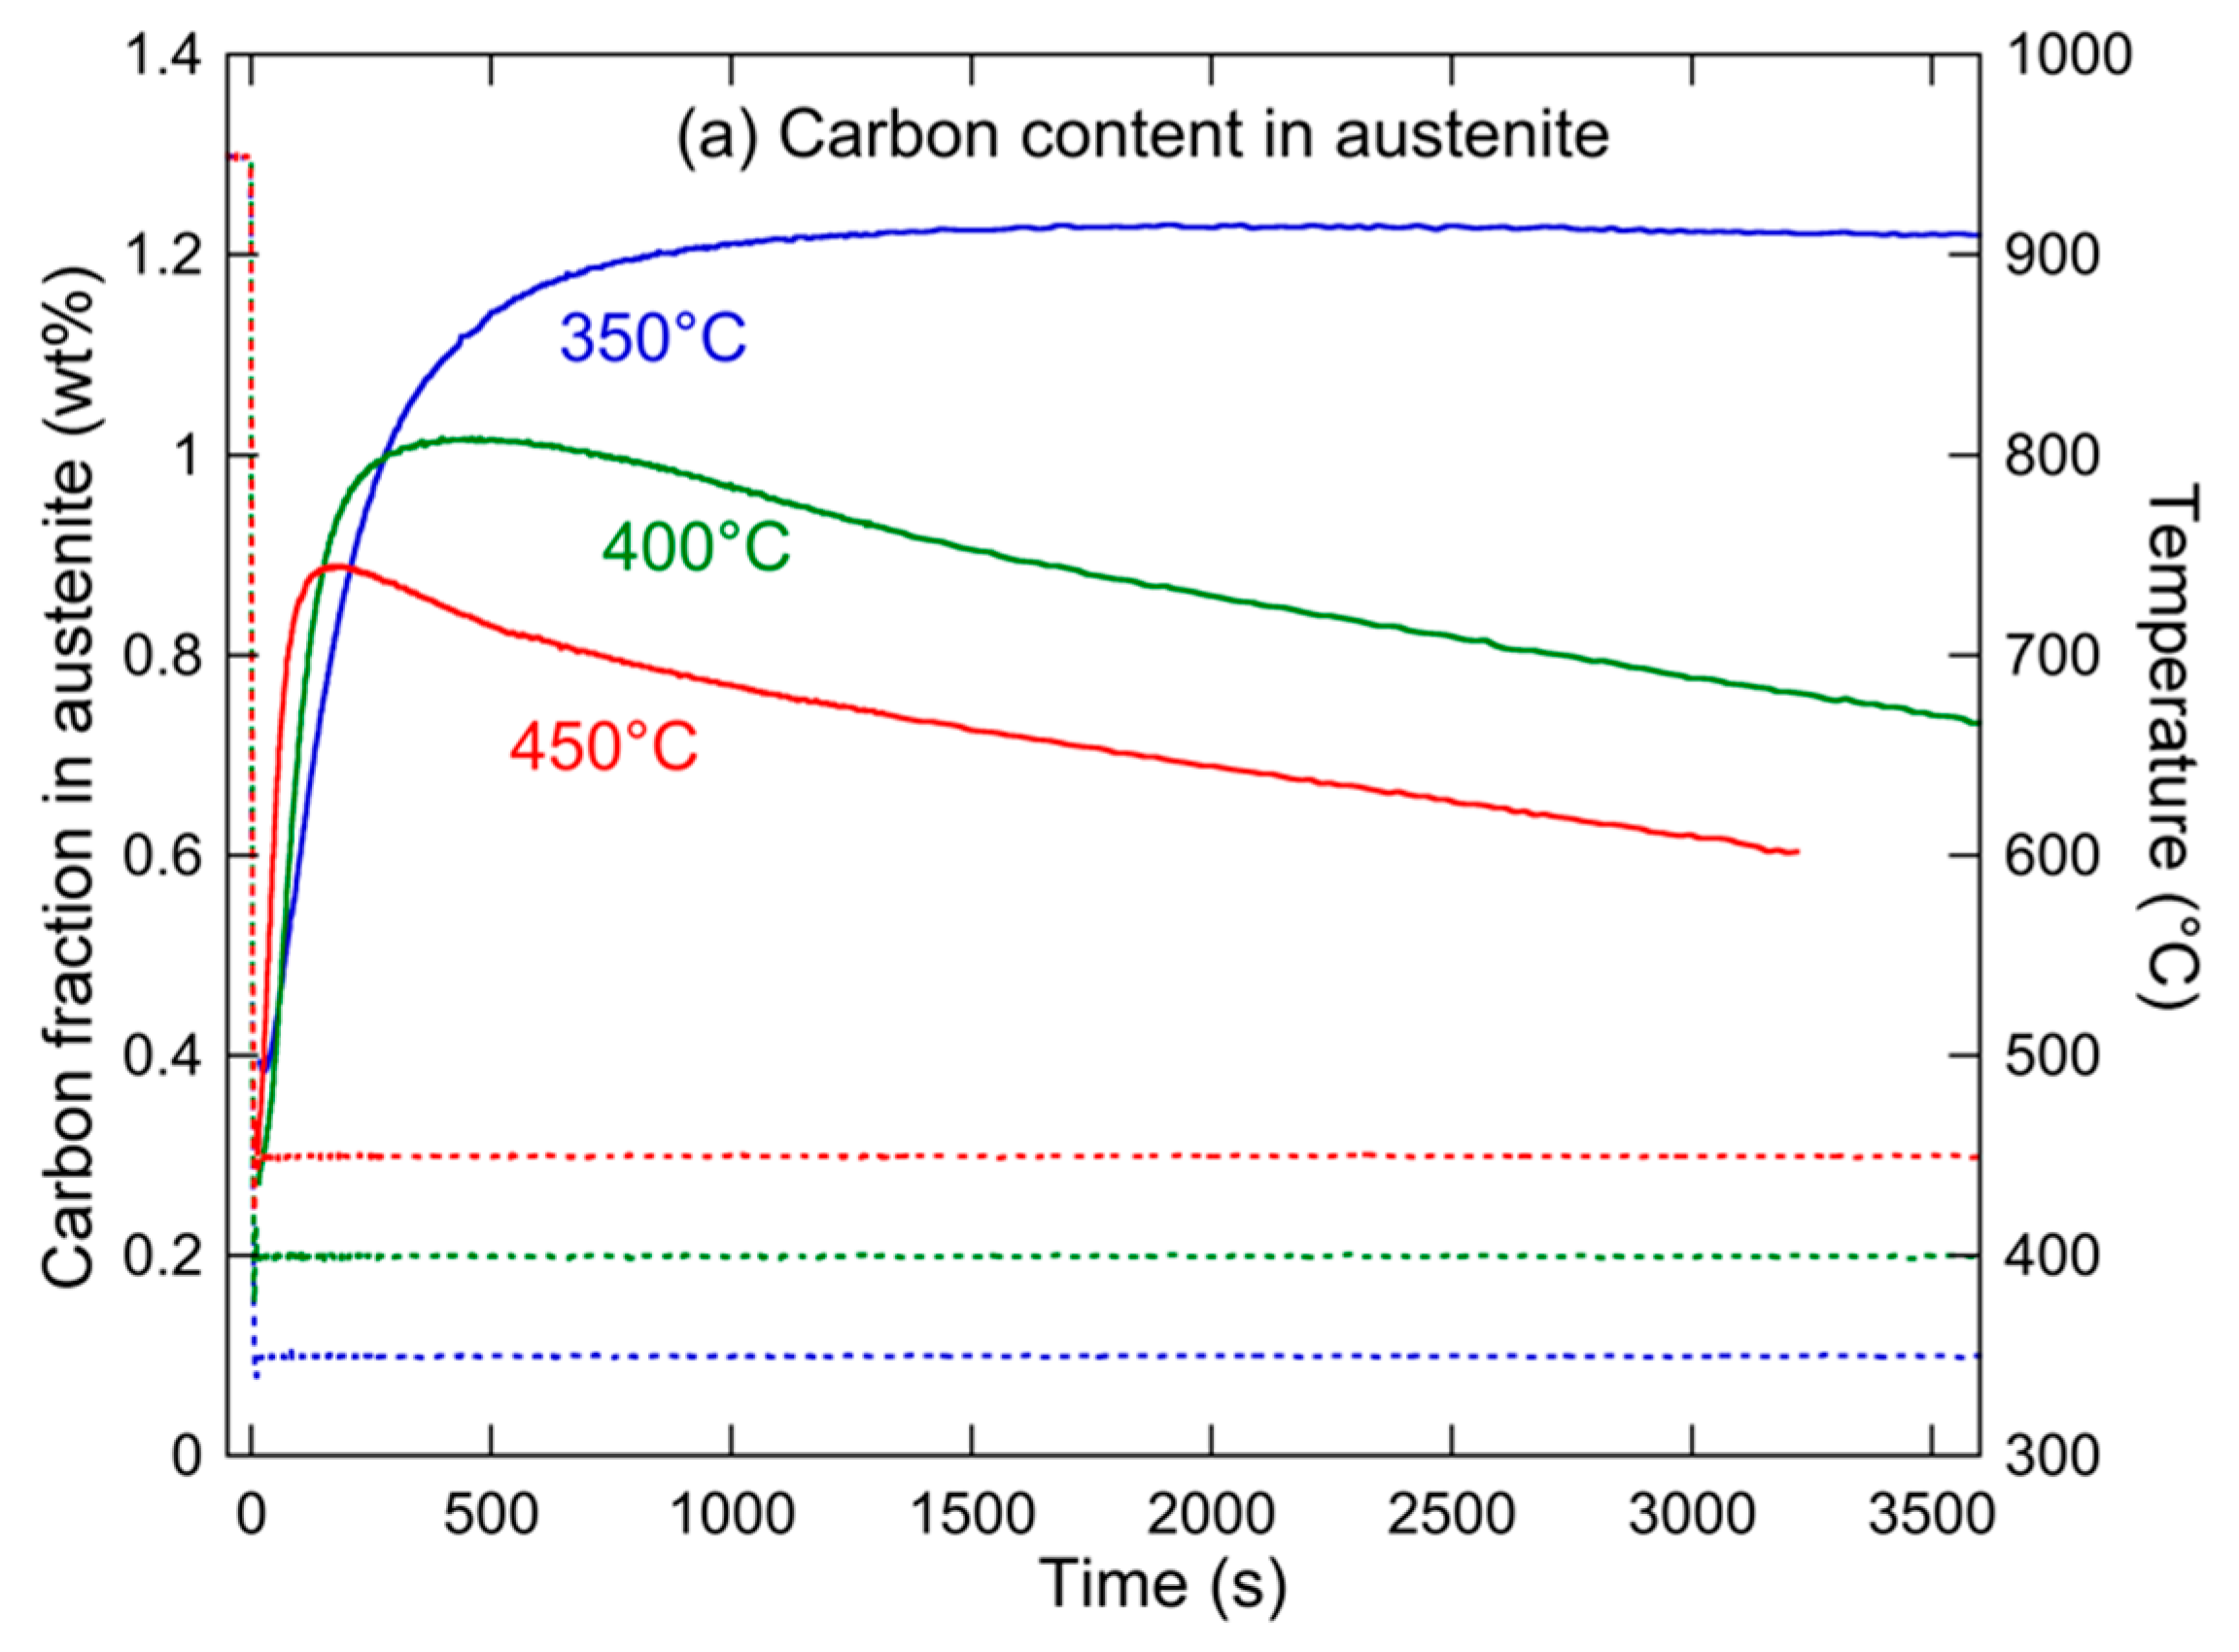
3.3. Bainitic Transformation

The most critical heat treatment step is the bainitic treatment, which provides the final microstructure, consisting of a bainitic microstructure with retained austenite stabilized by carbon. The silicon content is expected to inhibit the formation of carbides during bainitic transformation [7,33,34,35], in order to keep it available for the carbon enrichment of austenite. Within the framework of this TRIP-assisted bainite process, one should remain above the martensite start temperature (Ms) to avoid a martensitic transformation. The measured Ms of this steel is 370 °C. However, the choice was made to study a transformation temperature slightly below this temperature (350 °C), because the finite cooling rate to the holding temperature results in a small amount of transformation, so even at 350 °C, only a negligible amount of martensitic transformation was detected from complementary dilatometry experiments. Two other temperatures were studied, namely, 400 and 450 °C.
Figure 7 shows EBSD maps of the alloy when subjected to 1 h holding at the three temperatures. When the holding temperature increases, the bainitic transformation is observed to transition to a more granular form. However, the overall microstructure scale is quite similar at the three temperatures.
The presence of retained austenite can be first examined by microscopy. Figure 8 shows the distribution of the austenite phase determined on an EBSD map for 2 min holding at 450 °C. This map clearly evidences that the retained austenite is located preferentially at the former austenite grain boundaries and at the inter-lath boundaries of bainite.
At a finer scale, TEM-ASTAR mapping also allows the phase distribution to be identified. Figure 9 shows a virtual bright-field map after annealing for 60 min at 450 °C. After such a long annealing at high temperature, it can be expected that little retained austenite is present, and that the carbon has been redistributed in carbides. The phase map (Figure 9b) shows that a small amount of austenite is still present, and that in other places, it has actually transformed to cementite. In both cases, austenite and cementite are present at lath boundaries. Additionally, EDS mapping has been performed in the same area, and the distribution of Mn is shown in Figure 9c. This map shows that the cementite formed by the decomposition of the retained austenite is rich in Mn.
The evolution of phases during the bainitic heat treatment has been monitored in-situ by HEXRD. Figure 10 shows qualitatively the evolution of the diffraction data during this heat treatment. The diffractogram stack evidences the decrease in austenite peak intensity and the increase in ferrite peak intensity, reflecting the advancement in the bainitic reaction, which is, however, incomplete during the time investigated here. A shift in the austenite peak position to lower angles can also be detected qualitatively, and it will be more precisely analyzed in the following.
Figure 11 shows the evolution of the fraction of austenite, determined by Rietveld refinement of the HEXRD diffractograms using the FullProf software, during the heat treatments at 350, 400, and 450 °C. Figure 11a shows the evolution at short holding times and high austenite fractions, while Figure 11b shows the evolution at long holding times and low austenite fractions.
If we first concentrate on the initial bainitic transformation (before the transformation stasis), Figure 11a shows that the kinetics of this transformation depends only marginally on temperature. The 400 °C transformation is slowest, and the 350 and 450 °C transformations are similar. This particular behavior may be, in part, due to the change in bainite morphology as a function of temperature, where the more elongated bainite at 350 °C may favor a faster transformation rate.
The behavior at longer times is much more interesting. After about 2 min of holding, the material experiences a transformation stasis at all three temperatures. The higher the temperature, the higher the austenite fraction at the stasis, and the shorter the duration of the stasis. Namely, at 350 °C, the material stabilizes at an austenite fraction of 10% for the complete transformation time investigated, while at 450 °C, the stasis, which occurs at more than 20% austenite, lasts about 200 s before a drastic decrease in the austenite fraction (Figure 11b). Consequently, at short ageing times, the highest temperature presents the highest retained austenite, while at long ageing times, the reverse is observed.
The measured austenite fraction during in-situ heat treatments is not intrinsically stable upon cooling to room temperature and subsequent material life. The important parameter to monitor for this aspect is the carbon content of austenite, which can be followed by the evolution of its lattice parameter.
The lattice parameters of ferrite and austenite during the holding treatments at the three temperatures, as determined by FullProf fitting of the HEXRD diffractograms, are shown in Figure 12. As soon as the temperature is stabilized, the lattice parameter of ferrite is almost constant. This is a good indication that little supersaturation of carbon is present in bainite during the transformation. In the following, we will neglect the amount of carbon present in the ferritic phase. The evolution of the lattice parameter of austenite is much more pronounced, with a strong increase during the early holding times, indicating that the carbon content of austenite is increasing at this stage.
In order to obtain the carbon content of austenite from the austenite lattice parameter, a few hypotheses need to be made. In the absence of elastic stress in austenite, the variation in the austenite lattice parameter d a γ (in Ångstrom) can be related to the variation in austenite carbon content d C γ (in weight percent) with a well-established relationship [20]:
d a γ ( Å ) = 0.033 d C γ   ( w t % ) .
Such an absence of stress can be hypothesized based on two facts: First, there is no martensitic transformation in the range of heat treatments investigated. Secondly, there is no significant variation in the ferrite lattice parameter.
To obtain the carbon content in austenite in absolute values, an additional hypothesis needs to be made. As the cooling rate before the isothermal holding is very fast, and as the alloy contains Si to retard the formation of carbides, we will assume that no carbides are formed at the start of isothermal holding and neglect the carbon present in ferrite, so the carbon content of austenite at this stage is fixed by the mass conservation and is thus directly linked to the austenite phase fraction (close to 100% but slightly lower due to a phase transformation already started) and nominal carbon content of the alloy. In this case, it is possible to calculate the lattice parameter of austenite at the holding temperature corresponding to the alloy’s nominal carbon content C n o m i n a l from the lattice parameter at the beginning of the holding treatment a γ , i n i t i a l and from the austenite fraction at the same point F γ , i n i t i a l :
a n o m = a γ , i n i t i a l 0.033 C n o m i n a l ( 1 F γ , i n i t i a l 1 ) .
From this “nominal lattice parameter” a n o m , used as a reference in Equation (1), the carbon content C γ in austenite with the isothermal holding can then be calculated straightforwardly as a function of the acquired lattice parameter a γ :
C γ = a γ a n o m 0.033 + C nominal .
This evolution is shown in Figure 13 for the 400 °C holding. After the initial increase at short holding times, it is apparent that the carbon content of austenite decreases, which can be related to the formation of cementite, as evidenced by the TEM observations of Figure 9. Applying the carbon mass balance (still neglecting the carbon content in ferrite) makes it possible to calculate, from the measured austenite phase fraction F γ , the carbon content C γ that would be in austenite if all the carbon of the alloy was in austenite:
C γ = C nominal F γ .
This parameter is also shown in Figure 12. By definition, it is equal to the former parameter at the start of holding (due to the hypothesis of the absence of carbides) and then progressively diverges. As expected, the largest divergence happens when the carbon content of austenite decreases, confirming that this decrease is related to the formation of carbides. The difference between the two curves of Figure 13 is the carbon content present out of austenite, and therefore, within carbides. Following this parameter is of course of considerable interest.
Figure 14 shows the evolution of these two parameters, namely, the carbon content in austenite and the carbon content in carbides, for the three holding heat treatments. At 350 °C, the austenite is richest in carbon, although the fraction of carbides is initially highest. This apparent contradiction is actually related to the lowest austenite fraction at short ageing times. When the holding temperature is increased, the initial fraction of carbides decreases, while the kinetics of carbide formation during holding drastically increases, resulting in a lower carbon content at long holding times. Although a full understanding of this behavior would need modelling, one can propose a tentative interpretation as follows.
We have evidenced that the bainitic transformation kinetics at short times hardly depends on temperature. However, the diffusivity of carbon does depend drastically on temperature, so during the initial transformation at 350 °C, it can be expected that the carbon cannot fully diffuse towards the remaining austenite, and thus forms carbides. Inversely, at 450 °C, the fast diffusion of carbon allows a faster enrichment of austenite, and little formation of carbides is required. At long ageing times, it is the diffusion of carbon out of austenite that controls the microstructure evolution. This diffusion is very slow at 350 °C, so the retained austenite does not evolve rapidly, either in fraction or in carbon content, while it is much faster at 450 °C, resulting in a rapid decrease in both austenite fraction and carbon content in austenite, with a corresponding increase in the carbon fraction within carbides. The behavior at 400 °C is intermediate.
From the application point of view, it is desirable to combine a high fraction of austenite with a high carbon content in this austenite (and therefore, a low carbide fraction). The evolution of this combination is described in Figure 15 for the three holding temperatures. Overall, each of the three temperatures leads to a different compromise, with a higher carbon content/lower austenite fraction at 350 °C, and the reverse at 450 °C. However, the higher ageing temperature seems more promising as it presents a larger time window with an interesting compromise, although this window corresponds to relatively short ageing times that may be delicate to control from an industrial point of view.

4. Conclusions

In this work, in-situ HEXRD measurements with a heat treatment leading to TRIP-assisted bainite have quantified the evolution of phase fractions and lattice parameters, these measurements being supplemented by electron microscopy observations.
During austenitization, the formation rate of austenite, as well as the dissolution rate of cementite, have been followed. A delay with respect to equilibrium has been found, likely due to the presence of Mn in the cementite that retards its dissolution.
During the bainitic treatment, the fraction of austenite decreases in two stages. The first corresponds to the bainitic transformation until a transformation stasis that strongly depends on the temperature. The second stage corresponds to the loss of carbon to carbides, whose kinetics is strongly thermally activated. Ageing at different temperatures allows reaching different combinations of fractions of the retained austenite and austenite carbon content.

Author Contributions

Data curation, G.R.; Investigation, Z.T.; Methodology, F.D.G.; Project administration, D.H.; Supervision, P.D. and A.D.

Acknowledgments

D. Obriot is thanked for help with ex-situ heat treatments, J. Clarenn is thanked for help with the grain size study and P. Barges is thanked for help with TEM observations. F. Robaut and Y. Moustapha-Rabault are thanked for help with EBSD measurements. The staff of ID11 and, particularly, T. Buslaps and J. Wright are thanked for help with the HEXRD experiments. G. Geandier is thanked for help with the Fullprof software. M. Véron is thanked for help with the ARPGE software.

Conflicts of Interest

The authors declare no conflict of interest.

References

  1. Schmitt, J.-H.; Iung, T. New developments of advanced high-strength steels for automotive applications. C. R. Phys. 2018, 19, 641–656. [Google Scholar] [CrossRef]
  2. Grajcar, A.; Kuziak, R.; Zalecki, W. Third generation of AHSS with increased fraction of retained austenite for the automotive industry. Arch. Civ. Mech. Eng. 2012, 12, 334–341. [Google Scholar] [CrossRef]
  3. Matlock, D.K.; Speer, J.G.; De Moor, E.; Gibbs, P.J. Recent developments in advanced high strength sheet steels for automotive applications: An overview. Jestech 2012, 15, 1–12. [Google Scholar]
  4. Huang, J.N.; Tang, Z.Y.; Ding, H.; Misra, R.D.K. The significant impact of phase fraction and austenite stability on the mechanical properties of a low-alloyed TRIP-aided steel: An insight into experimental analysis and predictions. Mater. Sci. Eng. A Struct. Mater. Prop. Microstruct. Process. 2019, 759, 40–46. [Google Scholar] [CrossRef]
  5. Lee, S.; Lee, S.-J.; De Cooman, B.C. Austenite stability of ultrafine-grained transformation-induced plasticity steel with Mn partitioning. Scr. Mater. 2011, 65, 225–228. [Google Scholar] [CrossRef]
  6. Wang, J.J.; van der Zwaag, S. Stabilization mechanisms of retained austenite in transformation-induced plasticity steel. Metall. Mater. Trans. A Phys. Metall. Mater. Sci. 2001, 32, 1527–1539. [Google Scholar] [CrossRef]
  7. Sakuma, Y.; Matsumura, O.; Takechi, H. Mechanical-properties and retained austenite in intercritically heat-treated bainite-transformed steel and their variation with Si and Mn additions. Metall. Trans. A Phys. Metall. Mater. Sci. 1991, 22, 489–498. [Google Scholar] [CrossRef]
  8. Reisner, G.; Werner, E.A.; Kerschbaummayr, P.; Papst, I.; Fischer, F.D. The modeling of retained austenite in low-alloyed TRIP steels. JOM J. Miner. Met. Mater. Soc. 1997, 49, 62–65. [Google Scholar] [CrossRef]
  9. Bai, D.Q.; Di Chiro, A.; Yue, S. Stability of retained austenite in a Nb microalloyed Mn-Si TRIP steel. In Proceedings International Conference on Microalloying Steels; RodriguezIbabe, J.M., Gutierrez, I., Lopez, B., Eds.; Trans Tech Publications Ltd: Stafa, Zurich, Switzerland, 1998; pp. 253–260. [Google Scholar]
  10. De Meyer, M.; Vanderschueren, D.; De Cooman, B.C. The influence of the substitution of Si by Al on the properties of cold rolled C-Mn-Si TRIP steels. ISIJ Int. 1999, 39, 813–822. [Google Scholar] [CrossRef]
  11. Timokhina, I.B.; Hodgson, P.D.; Pereloma, E.V. Effect of microstructure on the stability of retained austenite in transformation-induced-plasticity steels. Metall. Mater. Trans. A Phys. Metall. Mater. Sci. 2004, 35, 2331–2341. [Google Scholar] [CrossRef] [Green Version]
  12. Matlock, D.K.; Brautigam, V.E.; Speer, J.G. Application of the quenching and partitioning (Q&P) process to a medium-carbon, high-Si microalloyed bar steel. In Thermec 2003, Pts 1–5; Chandra, T., Torralba, J.M., Sakai, T., Eds.; Trans Tech Publications Ltd.: Zurich, Switzerland, 2003; pp. 1089–1094. [Google Scholar]
  13. Speer, J.; Matlock, D.K.; De Cooman, B.C.; Schroth, J.G. Carbon partitioning into austenite after martensite transformation. Acta Mater. 2003, 51, 2611–2622. [Google Scholar] [CrossRef]
  14. Speer, J.G.; Edmonds, D.V.; Rizzo, F.C.; Matlock, D.K. Partitioning of carbon from supersaturated plates of ferrite, with application to steel processing and fundamentals of the bainite transformation. Curr. Opin. Solid State Mater. Sci. 2004, 8, 219–237. [Google Scholar] [CrossRef]
  15. Bhattacharyya, T.; Singh, S.B.; Das, S.; Haldar, A.; Bhattacharjee, D. Development and characterisation of C-Mn-Al-Si-Nb TRIP aided steel. Mater. Sci. Eng. A Struct. Mater. Prop. Microstruct. Process. 2011, 528, 2394–2400. [Google Scholar] [CrossRef]
  16. De Cooman, B.C. Structure-properties relationship in TRIP steels containing carbide-free bainite. Curr. Opin. Solid State Mater. Sci. 2004, 8, 285–303. [Google Scholar] [CrossRef]
  17. Zhao, Z.Z.; Yin, H.X.; Zhao, A.M.; Gong, Z.Q.; He, J.G.; Tong, T.T.; Hu, H.J. The influence of the austempering temperature on the transformation behavior and properties of ultra-high-strength TRIP-aided bainitic-ferritic sheet steel. Mater. Sci. Eng. A Struct. Mater. Prop. Microstruct. Process. 2014, 613, 8–16. [Google Scholar] [CrossRef]
  18. Bigg, T.D.; Edmonds, D.V.; Eardley, E.S. Real-time structural analysis of quenching and partitioning (Q&P) in an experimental martensitic steel. J. Alloys Compd. 2013, 577, S695–S698. [Google Scholar] [CrossRef]
  19. Geandier, G.; Aeby-Gautier, E.; Settefrati, A.; Dehmas, M.; Appolaire, B. Study of diffusive transformations by high energy X-ray diffraction. C. R. Phys. 2012, 13, 257–267. [Google Scholar] [CrossRef]
  20. Allain, S.Y.P.; Geandier, G.; Hell, J.C.; Soler, M.; Danoix, F.; Goune, M. In-situ investigation of quenching and partitioning by high energy X-Ray diffraction experiments. Scr. Mater. 2017, 131, 15–18. [Google Scholar] [CrossRef]
  21. Allain, S.Y.P.; Geandier, G.; Hell, J.C.; Soler, M.; Danoix, F.; Goune, M. Effects of Q&P processing conditions on austenite carbon enrichment studied by in situ high-energy X-ray diffraction experiments. Metals 2017, 7, 232. [Google Scholar] [CrossRef] [Green Version]
  22. Allain, S.Y.P.; Gaudez, S.; Geandier, G.; Hell, J.C.; Goune, M.; Danoix, F.; Soler, M.; Aoued, S.; Poulon-Quintin, A. Internal stresses and carbon enrichment in austenite of Quenching and Partitioning steels from high energy X-ray diffraction experiments. Mater. Sci. Eng. A Struct. Mater. Prop. Microstruct. Process. 2018, 710, 245–250. [Google Scholar] [CrossRef] [Green Version]
  23. Blonde, R.; Jimenez-Melero, E.; Zhao, L.; Wright, J.P.; Bruck, E.; van der Zwaag, S.; van Dijk, N.H. High-energy X-ray diffraction study on the temperature-dependent mechanical stability of retained austenite in low-alloyed TRIP steels. Acta Mater. 2012, 60, 565–577. [Google Scholar] [CrossRef]
  24. Ebner, S.; Suppan, C.; Stark, A.; Schnitzer, R.; Hofer, C. Austenite decomposition and carbon partitioning during quenching and partitioning heat treatments studied via in-situ X-ray diffraction. Mater. Des. 2019, 178, 107862. [Google Scholar] [CrossRef]
  25. Rieger, T.; Herrmann, K.; Carmele, D.; Meyer, S.; Lippmann, T.; Stark, A.; Bleck, W.; Klemradt, U. ‘Quenching and Partitioning’—An in situ approach to characterize the process kinetics and the final microstructure of TRIP-assisted steel. Adv. Mater. Res. 2012, 409, 713–718. [Google Scholar] [CrossRef] [Green Version]
  26. Song, C.; Yu, H.; Lu, J.; Zhou, T.; Yang, S. Stress partitioning among ferrite, martensite and retained austenite of a TRIP-assisted multiphase steel: An in-situ high-energy X-ray diffraction study. Mater. Sci. Eng. A 2018, 726, 1–9. [Google Scholar] [CrossRef]
  27. Yan, K.; Liss, K.-D.; Timokhina, I.B.; Pereloma, E.V. In situ synchrotron X-ray diffraction studies of the effect of microstructure on tensile behavior and retained austenite stability of thermo-mechanically processed transformation induced plasticity steel. Mater. Sci. Eng. A 2016, 662, 185–197. [Google Scholar] [CrossRef] [Green Version]
  28. Rauch, E.F.; Veron, M. Automated crystal orientation and phase mapping in TEM. Mater. Charact. 2014, 98, 1–9. [Google Scholar] [CrossRef]
  29. Brahmi, A.; Borrelly, R. Manganese enrichment of cementite and solubility of carbon in low-carbon steels investigated by thermoelectric power measurements. Scr. Metall. Mater. 1995, 32. [Google Scholar] [CrossRef]
  30. Moreno, M.; Teixeira, J.; Ghanbaja, J.; Bonnet, F.; Allain, S. Evolution of cementite composition along the processing of cold-rolled and annealed Dual-Phase steels. Materialia 2019, 6, 100179. [Google Scholar] [CrossRef]
  31. Pereloma, E.V.; Timokhina, I.B.; Miller, M.K.; Hodgson, P.D. Three-dimensional atom probe analysis of solute distribution in thermomechanically processed TRIP steels. Acta Mater. 2007, 55, 2587–2598. [Google Scholar] [CrossRef]
  32. Cayron, C. ARPGE: A computer program to automatically reconstruct the parent grains from electron backscatter diffraction data. J. Appl. Crystallogr. 2007, 40, 1183–1188. [Google Scholar] [CrossRef] [Green Version]
  33. Bhadeshia, H.K.D.H.; Edmonds, D.V. Bainite transformation in a silicon steel. Metall. Mater. Trans. A Phys. Metall. Mater. Sci. 1979, 10, 895–907. [Google Scholar] [CrossRef]
  34. Kozeschnik, E.; Bhadeshia, H.K.D.H. Influence of silicon on cementite precipitation in steels. Mater. Sci. Technol. 2008, 24, 343–347. [Google Scholar] [CrossRef]
  35. Sandvik, B.P.J. The bainite reaction in Fe-Si-C alloys: The primary stage. Metall. Mater. Trans. A Phys. Metall. Mater. Sci. 1982, 13, 777–787. [Google Scholar] [CrossRef]
Figure 1. Left: Scheme of the heat treatment. Right: Image of the sample and beam positioning in the test rig.
Qubs 03 00025 g001
Figure 2. (a) TEM bright-field micrograph of reference alloy in the as-received state. Carbide particles are visible within the grains and at the grain boundaries. (b) Section of the high-resolution X-ray diffraction (HEXRD) diffractogram of reference samples in the as-received state showing the (110) peak of ferrite and some cementite peaks.
Qubs 03 00025 g002
Figure 3. Stacking of 1D diffractograms during austenitization. The horizontal axis represents the diffraction angle 2θ and the vertical axis the annealing time. Two representative lines are drawn when the sample temperature reaches 600 °C and 900 °C.
Qubs 03 00025 g003
Figure 4. Evolution of Cementite fraction (determined by peak integration) and austenite fraction (determined by Rietveld refinement) during heating to the austenitization treatment. Open circles correspond to single measurements of cementite fraction, while full circles are averages of the open circles, made on five measurements.
Qubs 03 00025 g004
Figure 5. HEXRD diffractograms at different temperatures during heating in the course of the austenitization heat treatment. Cementite peaks can be seen growing until they suddenly disappear while austenite appears.
Qubs 03 00025 g005
Figure 6. (a) Optical micrographs of samples thermally treated and etched to reveal a ferrite border at former austenite grain boundaries, after the austenitization heat treatment. (b) Electron backscatter diffraction (EBSD) map after quenching to 350 °C and 1 h holding, and corresponding IPF map; (c) austenite grain retrieved from the EBSD map in (b) using the ARPGE software, where the colors correspond to individual grains, while the white areas correspond to unreconstructed zones.
Qubs 03 00025 g006aQubs 03 00025 g006b
Figure 7. EBSD orientation maps after 1 h holding at (a) 350 °C; (b) 400 °C, and (c) 450 °C.
Qubs 03 00025 g007
Figure 8. (a) EBSD orientation map after 2 min holding at 450 °C; (b) phase map of the same area showing in green the austenite and in the background the ferrite phase.
Qubs 03 00025 g008
Figure 9. (a) Virtual bright-field STEM image after 60 min holding at 450 °C; (b) phase map obtained by automated crystal orientation mapping (ACOM) where the red phase is ferrite, the green phase is austenite, and the blue phase is cementite. (c) Mn distribution map of the same area obtained by EDS mapping, evidencing the correlation with the phase map.
Qubs 03 00025 g009
Figure 10. Stacking of HEXRD diffractograms during the quench from austenitization and subsequent annealing at 400 °C. The horizontal axis represents the diffraction angle 2θ and the vertical axis the annealing time.
Qubs 03 00025 g010
Figure 11. Evolution of austenite phase fraction (solid lines) and temperature (dashed lines) during the final annealing treatment. (a) Data at high austenite fractions and short holding times, (b) data at low austenite fractions and long holding times.
Qubs 03 00025 g011
Figure 12. Evolution of (a) ferrite and (b) austenite lattice parameters (solid lines) and temperature (dashed lines) during the final annealing treatment.
Qubs 03 00025 g012
Figure 13. Evolution of the carbon content in austenite under the hypothesis that no carbides are present at the beginning of the isothermal holding treatment at 400 °C (dark blue), and under the calculation of no carbides throughout the holding treatment, corresponding to all carbon within austenite (light blue). The difference between the two curves is used to monitor the carbon content out of austenite (and thus within carbides).
Qubs 03 00025 g013
Figure 14. Evolution of (a) carbon content in austenite and (b) overall carbon content of alloy that is contained in carbides (solid lines) and of temperature (dashed lines) during holding at 350, 400, and 450 °C.
Qubs 03 00025 g014aQubs 03 00025 g014b
Figure 15. Evolution of the compromise between carbon content in austenite and austenite phase fraction during the three holding treatments at 350, 400, and 450 °C.
Qubs 03 00025 g015

