
Simulation-Based Inference of Bayesian Hierarchical Models While Checking for Model Misspecification †


CNRS & Sorbonne Université, UMR 7095, Institut d’Astrophysique de Paris, 98 bis boulevard Arago, F-75014 Paris, France
†
Presented at the 41st International Workshop on Bayesian Inference and Maximum Entropy Methods in Science and Engineering, Paris, France, 18–22 July 2022.
Phys. Sci. Forum 2022, 5(1), 4; https://doi.org/10.3390/psf2022005004
Published: 2 November 2022
(This article belongs to the Proceedings of The 41st International Workshop on Bayesian Inference and Maximum Entropy Methods in Science and Engineering)
Abstract
:This paper presents recent methodological advances for performing simulation-based inference (SBI) of a general class of Bayesian hierarchical models (BHMs) while checking for model misspecification. Our approach is based on a two-step framework. First, the latent function that appears as a second layer of the BHM is inferred and used to diagnose possible model misspecification. Second, target parameters of the trusted model are inferred via SBI. Simulations used in the first step are recycled for score compression, which is necessary for the second step. As a proof of concept, we apply our framework to a prey–predator model built upon the Lotka–Volterra equations and involving complex observational processes.
1. Introduction
Model misspecification is a long-standing problem for Bayesian inference: when the model differs from the actual data-generating process, posteriors tend to be biased and/or overly concentrated. In this paper, we are interested the problem of model misspecification for a particular, but common, class of Bayesian hierarchical models (BHMs): those that involve a latent function, such as the primordial power spectrum in cosmology (e.g., [1]) or the population model in genetics (e.g., [2]).
Simulation-based inference (SBI) only provides the posterior of top-level target parameters and marginalizes over all other latent variables of the BHM. Alone, it is therefore unable to diagnose whether the model is misspecified. Key insights regarding the issue of model misspecification can usually be obtained from the posterior distribution of the latent function, as there often exists an independent theoretical understanding of its values. An approximate posterior for the latent function (a much higher-dimensional quantity than the target vector of parameters) can be obtained using selfi (simulator expansion for likelihood-free inference, [1]), an approach based on the likelihood of an alternative parametric model, constructed by linearizing model predictions around an expansion point.
This paper presents a framework that combines selfi and SBI while recycling the necessary simulations. The simulator is first linearized to obtain the selfi posterior of the latent function. Next, the same simulations are used for data compression to the score function (the gradient of the log-likelihood with respect to the parameters), and the final SBI posterior of target parameters is obtained.
2. Method
2.1. Bayesian Hierarchical Models with a Latent Function
In this paper, we assume a given BHM consisting of the following variables: (vector of N target parameters), (vector containing the values of the latent function at S support points), (data vector of P components), and (compressed data vector of size N). We typically expect target parameters, support points; P can be any number and as large as for complex data models. We further assume that and are linked by a deterministic function T, usually theoretically well-understood and numerically cheap. Therefore, the expensive and potentially misspecified part of the BHM is the probabilistic simulator linking the latent function to the data , . The deterministic compression step C linking to is discussed in Section 2.4.
2.2. Latent Function Inference with SELFI
The first part of the framework proposed in this paper is to infer the latent function conditional on observed data . This is an inference problem in high dimension (S, the number of support points for the latent function ), which means that usual SBI frameworks, allowing a general exploration of parameter space, will fail and that stronger assumptions are required. selfi [1] relies upon the simplification of the inference problem around an expansion point .
The first assumption is a Taylor expansion (linearization) of the mean data model around . Namely, if is the expectation value of , where are simulations of given (i.e., ), we assume that
where is the mean data model at the expansion point , and is the gradient of at the expansion point (for simplification, we note , where the gradient is taken with respect to ). The second assumption is that the (true) implicit likelihood of the problem is replaced by a Gaussian effective likelihood: with
where is the data covariance matrix at the expansion point .
The selfi framework is fully characterized by , , and , which, if unknown, can be evaluated through forward simulations only. The numerical computation requires simulations at the expansion point (to evaluate the empirical mean and empirical covariance matrix ), and simulations in each direction of parameter space (to evaluate the empirical gradient via first-order forward finite differences). The total is simulations; and should be of the order of the dimensionality of the data space P, giving a total cost of model evaluations.
To fully characterize the Bayesian problem, one requires a prior on , . Any prior can be used if one is ready to use numerical techniques to explore the posterior (such as standard Markov Chain Monte Carlo), using the linearized data model and Gaussian effective likelihood. However, a remarkable analytic result with selfi is that, if the prior is Gaussian with a mean equal to the expansion point , i.e.,
then the effective posterior is also Gaussian:
The posterior mean and covariance matrix are given by
(see [1] Appendix B, for a derivation). They are fully characterized by the expansion variables , , , and , as well as the prior covariance matrix .
2.3. Check for Model Misspecification
The selfi posterior can be used as a check for model misspecification. Visually checking the reconstructed and can yield interesting insights, especially if the latent function has some properties (such as an expected shape, periodicity, etc.) to which the data model may be sensitive if misspecified (see Section 4.2).
If a quantitative check for model misspecification is desired, we propose using the Mahalanobis distance between the reconstruction and the prior distribution , defined formally by
The value of for the selfi posterior mean can be compared to an ensemble of values of for simulated latent functions , where samples are drawn from the prior .
2.4. Score Compression and Simulation-Based Inference
Having checked the BHM for model misspecification, we now address the second part of the framework, aimed at inferring top-level parameters given observations. SBI is known to be difficult when the dimensionality of the data space P is high. For this reason, data compression is usually necessary. Data compression can be thought of as an additional layer at the bottom of the BHM, made of a deterministic function C acting on . In practical scenarios, data compression shall preserve as much information about as possible, meaning that compressed summaries shall be as close as possible to sufficient summary statistics of , i.e., .
Here, we propose to use score compression [3]. We make the assumption (for compression only, not for later inference) that is Gaussian distributed: where (see Equation (2)). The score function is the gradient of this log-likelihood with respect to the parameters at a fiducial point in parameter space. Using as fiducial point the values that generate the selfi expansion point (i.e., such that ), a quasi maximum-likelihood estimator for the parameters is , where the Fisher matrix and the gradient of the log-likelihood are evaluated at . Compression of to yields N compressed statistics that are optimal in the sense that they preserve the Fisher information content of the data [3].
In our case, the covariance matrix is assumed not to depend on parameters (), and the expression for is therefore
The Fisher matrix of the problem further takes a simple form:
We therefore need to evaluate
Importantly, in Equations (8)–(10), and have already been computed for latent function inference with selfi. The only missing quantity is the second matrix in the right-hand side of Equation (10), that is, , the gradient of T evaluated at . If unknown, its computation (e.g., via finite differences) does not require any more simulation of . It is usually easy, as there are only N directions in parameter space and T is the numerically cheap part of the BHM. We note that, because we have to calculate , we can easily get the Fisher–Rao distance between any simulated summaries and the observed summaries ,
which can be used by any non-parametric SBI method.
We specify a prior (typically peaking at or centered on , for consistency with the assumptions made for data compression). Having defined C, we now have a full BHM that maps (of dimension N) to compressed summaries (of size N) and has been checked for model misspecification for the part linking to . We can then proceed with SBI via usual techniques. These can include likelihood-free rejection sampling, but also more sophisticated techniques such as delfi (e.g., [4,5]) or bolfi (e.g., [6,7,8]).
3. Lotka–Volterra BHM
3.1. Lotka–Volterra Solver
The Lotka–Volterra equations describe the dynamics of an ecological system in which two species interact, as a pair of first-order non-linear differential equations:
where is the number of prey at time t, and is the number of predators at time t. The model is characterized by , a vector of four real parameters describing the interaction of the two species.
The initial conditions of the problem are assumed to be exactly known. Throughout the paper, timestepping and number of timesteps are fixed: for .
The expression T is an algorithm that numerically solves the ordinary differential equations. For simplicity, we choose an explicit Euler method: for all ,
The latent function is a concatenation of and evaluated at the timesteps of the problem. The corresponding vector is of size S.
3.2. Lotka–Volterra Observer
3.2.1. Full Data Model
To go from to , we assume a complex, probabilistic observational process of prey and predator populations, later referred to as “model A” and defined as follows.
Signal. The (unobserved) signal is a delayed and non-linearly perturbed observation of the true population function for species , modulated by some seasonal efficiency . Formally, , , and for ,
These equations involve two parameters: p accounts for hunts between and (temporarily making prey more likely to hide and predators more likely to be visible), and q accounts for the gregariousness of prey and independence of predators. The free functions and , valued in , describe how prey and predators are likely to be detectable at any time, accounting, for example, for seasonal variation (hibernation, migration).
Noise. The signal is subject to additive noise, giving a noisy signal , where the noise has two components:
- Demographic Gaussian noise with zero mean and variance proportional to the true underlying population, i.e., and . The parameter r gives the strength of demographic noise.
- Observational Gaussian noise that accounts for observer efficiency, coupling prey and predators such thatThe parameter s gives the overall amplitude of observational noise, and the parameter t controls the strength of the non-diagonal component (it should be chosen such that the covariance matrix appearing in Equation (18) is positive semi-definite).
Censoring. Finally, observed data are a censored and thresholded version of the noisy signal: for each timestep , , where is the maximum number of prey or predators that can be detected by the observer, and is a mask (taking either the value 0 or 1). Masked data points are discarded. The data vector is . It contains elements depending on the number of masked timesteps for each species z (formally, , where is a Kronecker delta symbol).
All of the free parameters (p, q, r, s, t, , ) and free functions (, , , ) appearing in the Lotka–Volterra observer data model described in this section are assumed known and fixed throughout the paper. Parameters used are , , , , , , .
3.2.2. Simplified Data Model
In this section, we introduce “model B”, a simplified (misspecified) data model linking to . Model B assumes that underlying functions are directly observed, i.e., . It omits observational noise, such that . In model B, parameters p, q, s, and t are not involved, and the value of r (strength of demographic noise) can be incorrect (we used ). Finally, model B fails to account for the thresholds: .
4. Results
In this section, we apply the two-step inference method described in Section 2 to the Lotka–Volterra BHM introduced in Section 3. We generate mock data from model A, using ground truth parameters . We assume that ground truth parameters are known a priori with a precision of approximately . Consistently, we choose a Gaussian prior with mean and diagonal covariance matrix .
4.1. Inference of Population Functions with SELFI
We first seek to reconstruct the latent population functions and , conditional on the data , using selfi. We choose as an expansion point the population functions simulated from the mean of the prior on , i.e., . We use and ; the computational workload is therefore a fixed number of simulations for each model. It is known a priori and perfectly parallel.
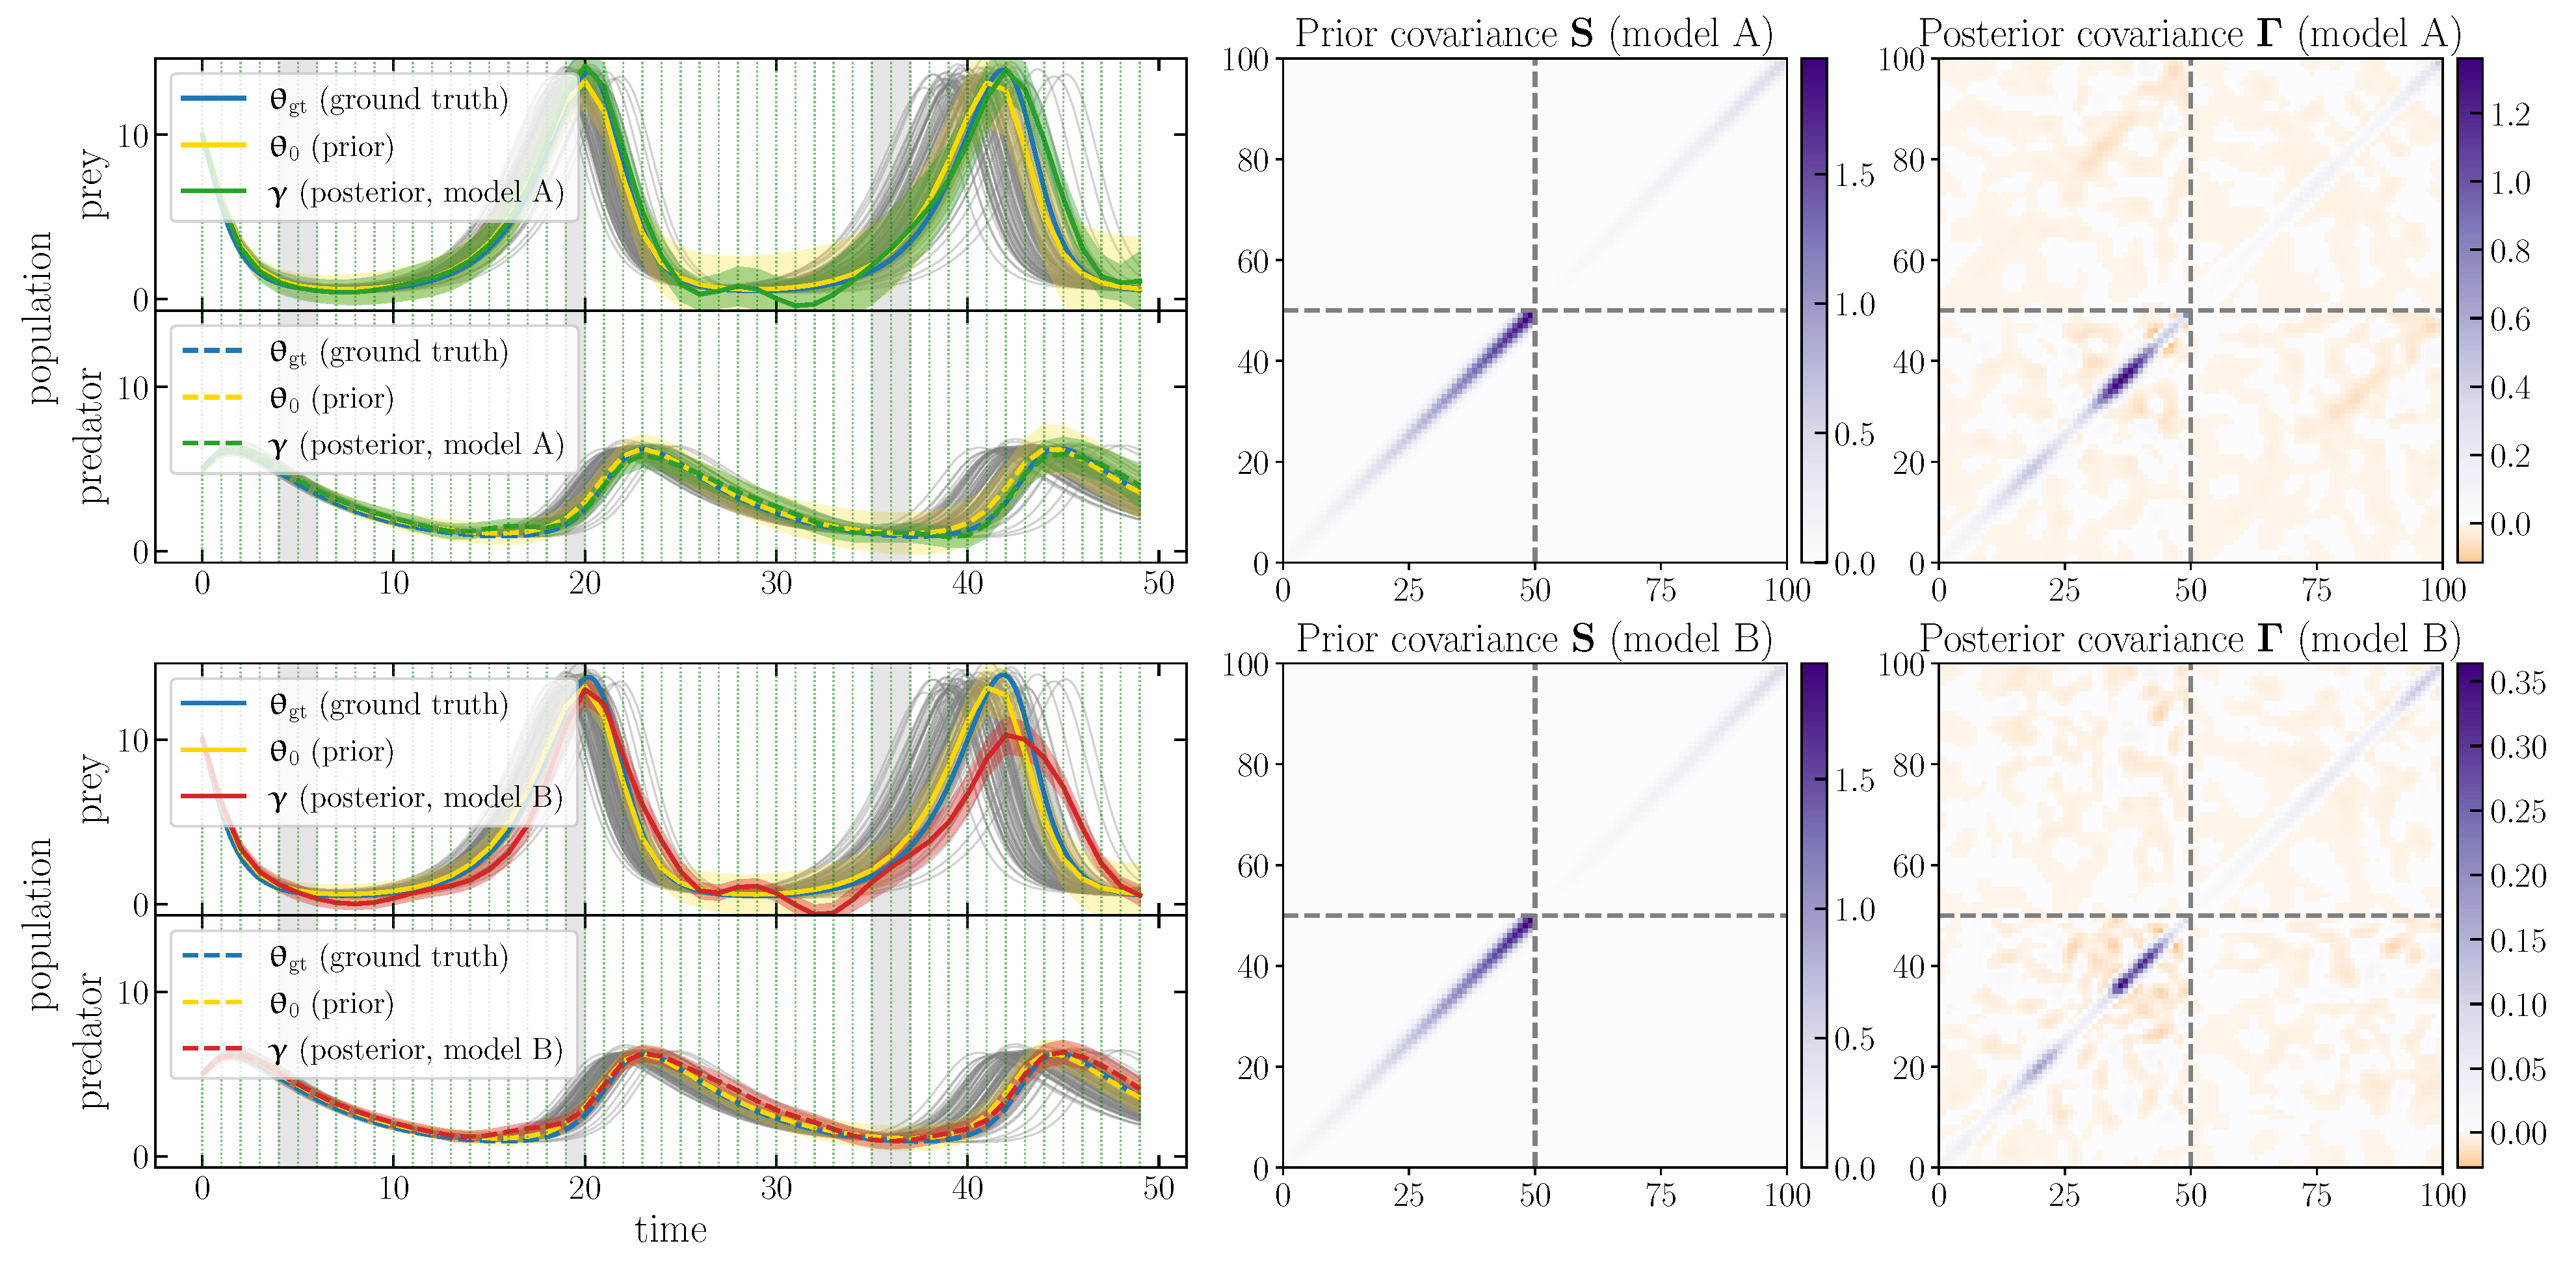
We adopt a Gaussian prior and combine it with the effective likelihood to obtain the selfi effective posterior . Figure 1 (left panels) shows the inferred population functions in comparison with the prior mean and expansion point and the ground truth . The figure shows credible regions for the prior and the posterior (i.e., and , respectively). The full posterior covariance matrix for each model is shown in the rightmost column of Figure 1.
4.2. Check for Model Misspecification
The inferred population functions allow us to check for model misspecification. From Figure 1, it is clear that model B fails to produce a plausible reconstruction of population functions: model B breaks the (pseudo-)periodicity of the predator population function , which is a property required by the model. In the bottom left-hand panels, the red lines differ in shape from fiducial functions (grey lines), and the credible intervals exclude the expansion point. On the contrary, with model A, the reconstructed population functions are consistent with the expansion point. The inference is unbiased, as the ground truth typically lies within the credible region of the reconstruction.
As a quantitative check, we compute the Mahalanobis distance between and (Equation (7)) for each model. We find that is much smaller for model A than for model B ( versus ). The numbers can be compared to the empirical mean among our set of fiducial populations functions, .
At this stage, we therefore consider that model B is excluded, and we proceed further with model A.
4.3. Score Compression
As T is numerically cheap, we get via sixth-order central finite differences around , then obtain using Equation (10). This does not require any further evaluation of the data model , as has already been computed.
4.4. Inference of Parameters Using Likelihood-Free Rejection Sampling
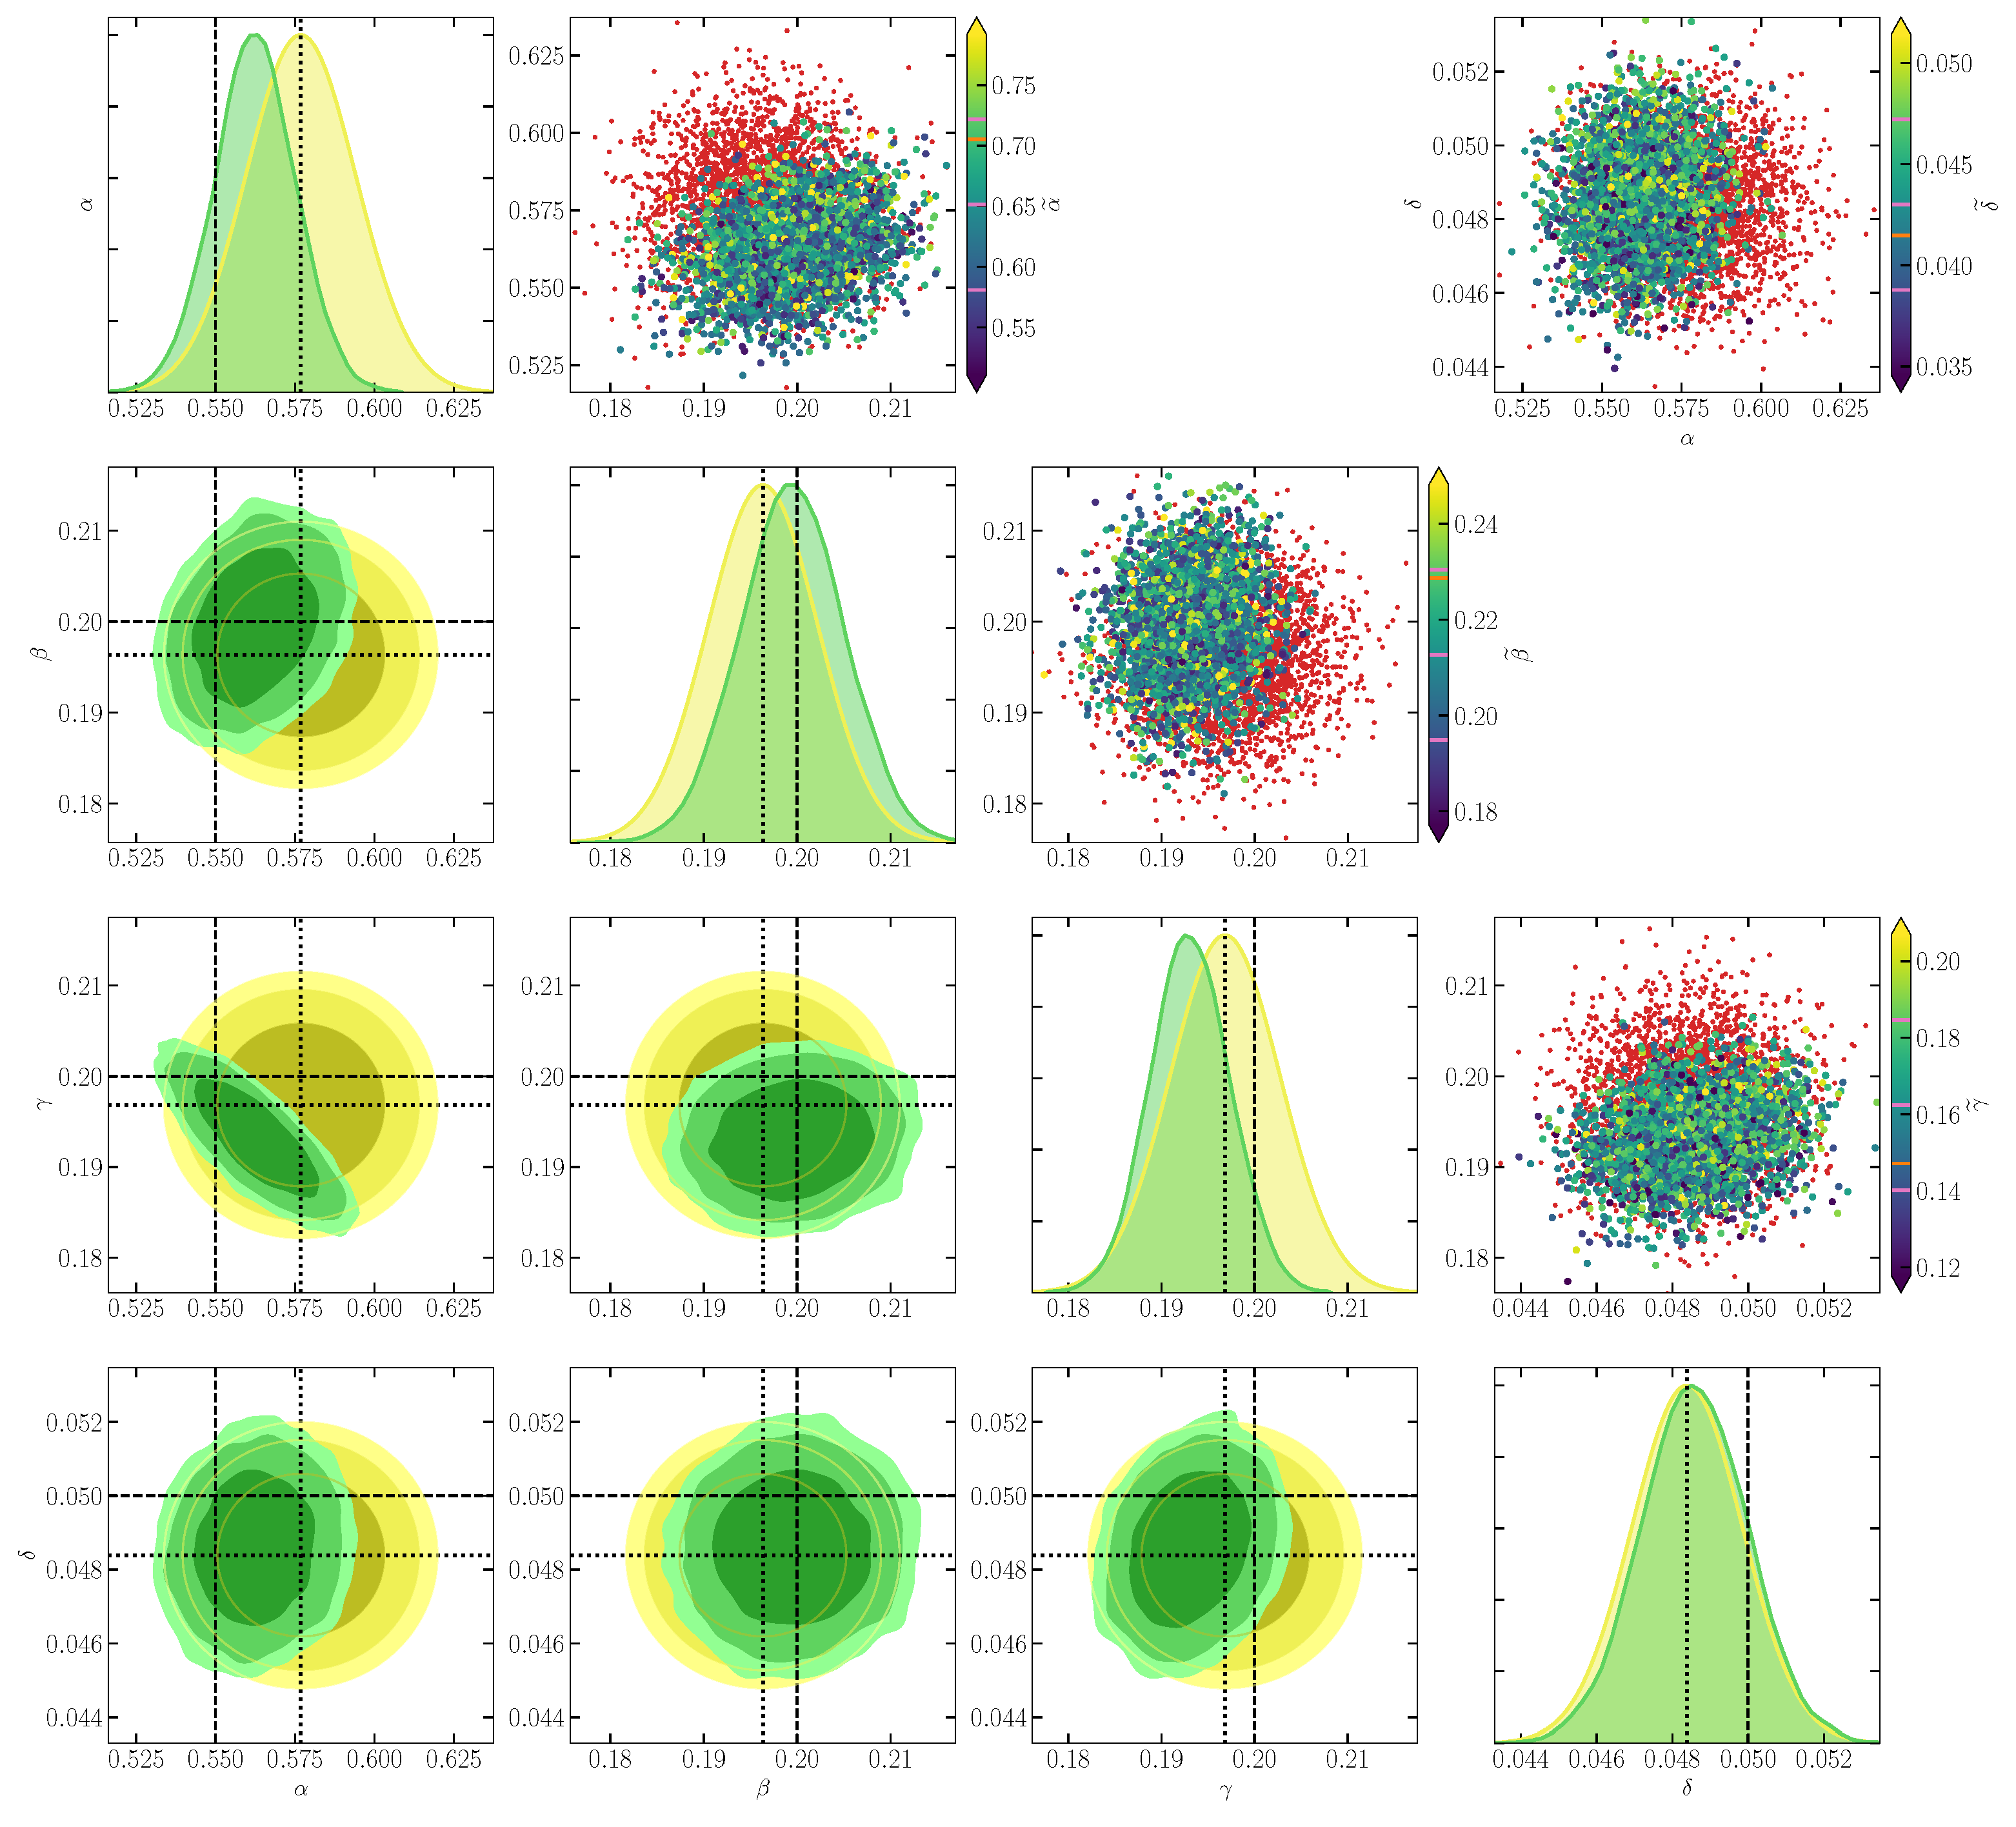
As a last step, we infer top-level parameters given compressed summaries . As the problem studied in this paper is sufficiently simple, we rely on the simplest solution for SBI, namely likelihood-free rejection sampling (sometimes also known as approximate Bayesian computation, e.g., [9]). To do so, we use the Fisher–Rao distance between simulated and observed , which comes naturally from score compression (see Equation (11)), and we set a threshold . We draw samples from the prior , simulate , then accept as a sample of if , and reject it otherwise.
In Figure 2, we find that the inference of top-level parameters is unbiased, with the ground truth (dashed lines) lying within the credible region of the posterior. We observe that the data correctly drive some features that are not built into the prior, for instance, the degeneracy between and , respectively, the reproduction rate of prey and the mortality rate of predators.
5. Conclusions
One of the biggest challenges in statistical data analysis is checking data models for misspecification, so as to obtain meaningful parameter inferences. In this work, we described a novel two-step simulation-based Bayesian approach, combining selfi and SBI, which can be used to tackle this issue for a large class of models. BHMs to which the approach can be applied involve a latent function depending on parameters and observed through a complex probabilistic process. They are ubiquitous, e.g., in astrophysics and ecology.
In this paper, we introduced a prey–predator model, consisting of a numerical solver of the Lotka–Volterra system of equations and of a complex observational process of population functions. As a proof of concept, we applied our technique to this model and to a simplified (misspecified) version of it. We demonstrated successful identification of the misspecified model and unbiased inference of the parameters of the correct model.
In conclusion, the method developed constitutes a computationally efficient and easily applicable framework to perform SBI of BHMs while checking for model misspecification. It allows one to infer the latent function as an intermediate product, then to perform score compression at no additional simulation cost. This study opens up a new avenue to increase the robustness and reliability of Bayesian data analysis using fully non-linear, simulator-based models.
Funding
This work was done within the Aquila Consortium (https://aquila-consortium.org, accessed on 31 October 2022).
Institutional Review Board Statement
Not applicable.
Informed Consent Statement
Not applicable.
Data Availability Statement
The code and data underlying this paper, as well as additional plots, have been made publicly available as part of the pyselfi code at https://pyselfi.florent-leclercq.eu (accessed on 31 October 2022).
Conflicts of Interest
The author declares no conflict of interest.
References
- Leclercq, F.; Enzi, W.; Jasche, J.; Heavens, A. Primordial power spectrum and cosmology from black-box galaxy surveys. Mon. Not. R. Astron. Soc. 2019, 490, 4237–4253. [Google Scholar] [CrossRef]
- Rousset, F. Inferences from Spatial Population Genetics. In Handbook of Statistical Genetics; John Wiley & Sons, Ltd.: London, UK, 2007; Chapter 28; pp. 945–979. [Google Scholar] [CrossRef]
- Alsing, J.; Wandelt, B. Generalized massive optimal data compression. Mon. Not. R. Astron. Soc. Lett. 2018, 476, L60–L64. [Google Scholar] [CrossRef] [Green Version]
- Papamakarios, G.; Murray, I. Fast ϵ-free Inference of Simulation Models with Bayesian Conditional Density Estimation. In Advances in Neural Information Processing Systems 29: Proceedings of the 30th International Conference on Neural Information Processing Systems, 5–10 December 2016, Barcelona, Spain; Curran Associates Inc.: Red Hook, NY, USA, 2016; pp. 1036–1044. [Google Scholar]
- Alsing, J.; Wandelt, B.; Feeney, S. Massive optimal data compression and density estimation for scalable, likelihood-free inference in cosmology. Mon. Not. R. Astron. Soc. 2018, 477, 2874–2885. [Google Scholar] [CrossRef] [Green Version]
- Gutmann, M.U.; Corander, J. Bayesian Optimization for Likelihood-Free Inference of Simulator-Based Statistical Models. J. Mach. Learn. Res. 2016, 17, 1–47. [Google Scholar]
- Leclercq, F. Bayesian optimization for likelihood-free cosmological inference. Phys. Rev. D 2018, 98, 063511. [Google Scholar] [CrossRef] [Green Version]
- Thomas, O.; Pesonen, H.; Sá-Leão, R.; de Lencastre, H.; Kaski, S.; Corander, J. Split-BOLFI for misspecification-robust likelihood free inference in high dimensions. arXiv, 2020; arXiv:2002.09377v1. [Google Scholar]
- Beaumont, M.A. Approximate Bayesian Computation. Annu. Rev. Stat. Its Appl. 2019, 6, 379–403. [Google Scholar] [CrossRef]
Figure 1.
selfi inference of the population function given the observed data , used as a check for model misspecification. Left panels: the prior mean and expansion point and the effective posterior mean are represented as yellow and green/red lines, respectively, with their credible intervals. For comparison, simulations with , and the ground truth are shown in grey and blue, respectively. Middle and right panels: the prior covariance matrix and the posterior covariance matrix , respectively. The first row corresponds to model A (see Section 3.2.1) and the second row to model B (see Section 3.2.2).

Figure 2.
Simulation-based inference of the Lotka–Volterra parameters given the compressed observed data . Plots in the lower corner show two-dimensional marginals of the prior (yellow contours) and of the SBI posterior (green contours), using a threshold on the Fisher–Rao distance between simulated and observed , . Contours show 1, 2, and credible regions. Plots on the diagonal show one-dimensional marginal distributions of the parameters, using the same color scheme. Dotted and dashed lines denote the position of the fiducial point for score compression and of the ground truth parameters , respectively. The scatter plots in the upper corner illustrate score compression for pairs of parameters. There, red dots represent some simulated samples. Larger dots show some accepted samples (i.e., for which ), with a color map corresponding to the value of one component of . In the color bars, pink lines denote the mean and scatter among accepted samples of the component of , and the orange line denotes its value in .

Publisher’s Note: MDPI stays neutral with regard to jurisdictional claims in published maps and institutional affiliations. |
© 2022 by the author. Licensee MDPI, Basel, Switzerland. This article is an open access article distributed under the terms and conditions of the Creative Commons Attribution (CC BY) license (https://creativecommons.org/licenses/by/4.0/).
Share and Cite
MDPI and ACS Style
Leclercq, F. Simulation-Based Inference of Bayesian Hierarchical Models While Checking for Model Misspecification. Phys. Sci. Forum 2022, 5, 4. https://doi.org/10.3390/psf2022005004
AMA Style
Leclercq F. Simulation-Based Inference of Bayesian Hierarchical Models While Checking for Model Misspecification. Physical Sciences Forum. 2022; 5(1):4. https://doi.org/10.3390/psf2022005004
Chicago/Turabian StyleLeclercq, Florent. 2022. "Simulation-Based Inference of Bayesian Hierarchical Models While Checking for Model Misspecification" Physical Sciences Forum 5, no. 1: 4. https://doi.org/10.3390/psf2022005004