1. Introduction
Determining a full S–N curve is a time-consuming and expensive task. Since numerous parameters influence fatigue properties, generating fatigue curves for every configuration is impractical. To speed up the fatigue life-mapping process, instead of using an empirical approach and only considering the number of cycles at rupture, fatigue mechanisms can be investigated. By understanding fatigue mechanisms and modelling them, qualitative predictions of parameters’ influences on fatigue life can be made. Some methods can even manage to quantitatively forecast lifespans, with detailed descriptions of fatigue mechanisms and indirect ways of monitoring them [
1].
To the authors’ knowledge, very few studies have been made on the fatigue mechanisms of ultra-high-tensile strength steel coated with tungsten carbide–cobalt–chrome. The S–N curve has been determined for high-tensile strength steel [
2,
3] and fracture scenarios have been studied for other substrates [
4] or other coatings [
5]. The fatigue behavior of a WC-CoCr coating on a 300M substrate has been studied [
6] and it has been found that two modes of coating rupture can exist: coating spalling (or delamination) or cracking, the kind of rupture depending on interface strength. Post-mortem analyses of fracture surfaces have been made for 1018 steel coated with WC-CoCr [
7], showing cracks in the coating passing through the interface and internal fatigue crack initiation.
This study intends to apply infrared (IR) measurements with optical microscopy of fracture surfaces and coating surfaces to investigate damage scenarios under cyclic loadings of a 300M steel coated with WC-CoCr by HVOF. The first harmonic amplitude is computed for bare and coated test coupons. Two other indicators (first harmonic phase shift and signal skewness) are also computed to monitor cracking in the coating. Post-mortem analyses by optical microscopy are made to validate the IR measurement results and investigate rupture scenarios.
2. Materials and Methods
2.1. Materials
An ultra-high-tensile strength steel (R
e ≈ 1600 MPa) [
8], 300M has good fatigue properties (σ
D ≈ 830 MPa, R = −1) [
9]. It is used in aerospace for landing gears to achieve resistance and lifespan requirements. To prevent wear and corrosion, a WC-CoCr coating is applied by high-velocity oxygen fuel (HVOF) [
10]. The burning of a fuel gas and oxygen heats up and speeds up a carrier gas in which WC-CoCr powder is introduced. The carrier gas is heated sufficiently to melt the CoCr matrix and, combined with the velocity, the WC-CoCr particles have enough energy to ensure their adhesion onto the substrate Prior coating, surfaces are shot peened to improve fatigue properties, and then grit blasted for adhesion purposes.
Bare and coated (subsequently referred to as HVOF) configurations are studied with cylindrical unnotched test coupons, Kt = 1, with a 50 mm2 cross-section and a 16 mm gauge length. Due to the elastic properties mismatch between 300M and WC-CoCr, the uniaxial load creates a heterogeneous multiaxial stress state. As the WC-CoCr elastic properties are incompletely described, the stress state cannot be calculated. To be able to compare configurations, and as tests are force-driven, a nominal uniaxial stress is considered for the HVOF configuration. This nominal uniaxial stress is computed by considering only the steel section; this is an acceptable hypothesis, as the coating section represents less than 10% of the whole section.
2.2. IR Measurements under Cyclic Loadings
Bare and HVOF test coupons were tested on an MTS 319.25 machine (MTS, Eden Prairie, MN, USA) with cyclic axial loads (R = −1) at a loading frequency of fr = 10 Hz. Stress amplitude was increased every 200 cycles from 0 to 0.59σ* on a bare test coupon and on a HVOF configuration from 0 until cracks were detected (at σ*). For every block of 200 cycles, the last 100 cycles were recorded with an InfraTec ImageIR® 10,300 camera (InfraTec, Dresden, Germany) at a frequency of 40 Hz. After detecting cracks by IR measurements, 2000 cycles at σ* amplitude were applied to reach a stabilization of the crack network, with IR measurements at 200 Hz between 500 and 600 cycles, 700 and 800 cycles, and 1900 and 2000 cycles. To enhance the accuracy of results, a high-emissivity paint was applied on test coupons prior to testing.
As the test coupons were loaded during the recording, displacements were noticeable on films. To provide better results, a pixel should correspond to a matter particle. A template-matching tracking motion algorithm was applied on four markers distributed on the test coupon ends. Then, a homography transform model, with a bilinear interpolation, was used to compensate the displacement of every pixel. As the radiometric balance is biased for an inclined surface relative to the camera direction and as the test coupons were cylindrical, films were cropped to maintain 50% of the visible surface of the gauge length (the surface was normal between −60° and +60° from the camera direction).
By monitoring 100 cycles at 10 Hz, the heat loss can be neglected and thus the temperature can be fitted with a sinus (the first harmonic) and an affine function (due to the intrinsic dissipation). To detect cracking, three indicators are computed on every pixel: the first harmonic amplitude and the phase shift by the lock-in method and the skewness with a statistic indicator.
2.3. Optical Microscopy
Optical microscopy was performed with a Keyence VHX-5000 equipped with VH-Z500R/W/T and VH-Z100R/W/T lenses (Keyence, Osaka, Japan) (numerical microscope with a magnification of ×500). As the test coupons used for the IR measurements did not break during the tests, the post-mortem analyses were made on another bare and two HVOF fatigue test coupons. Those test coupons were used for self-heating fatigue tests and were loaded with blocks of 20,000 cycles of increasing amplitude before rupture. Fatigue tests were performed on a ZwickRoell Amsler Vibrophore 50 kN machine (Taicang, China) at fr = 135 Hz and R = −1.
3. Results
3.1. Crack Detection
3.1.1. First Harmonic Amplitude
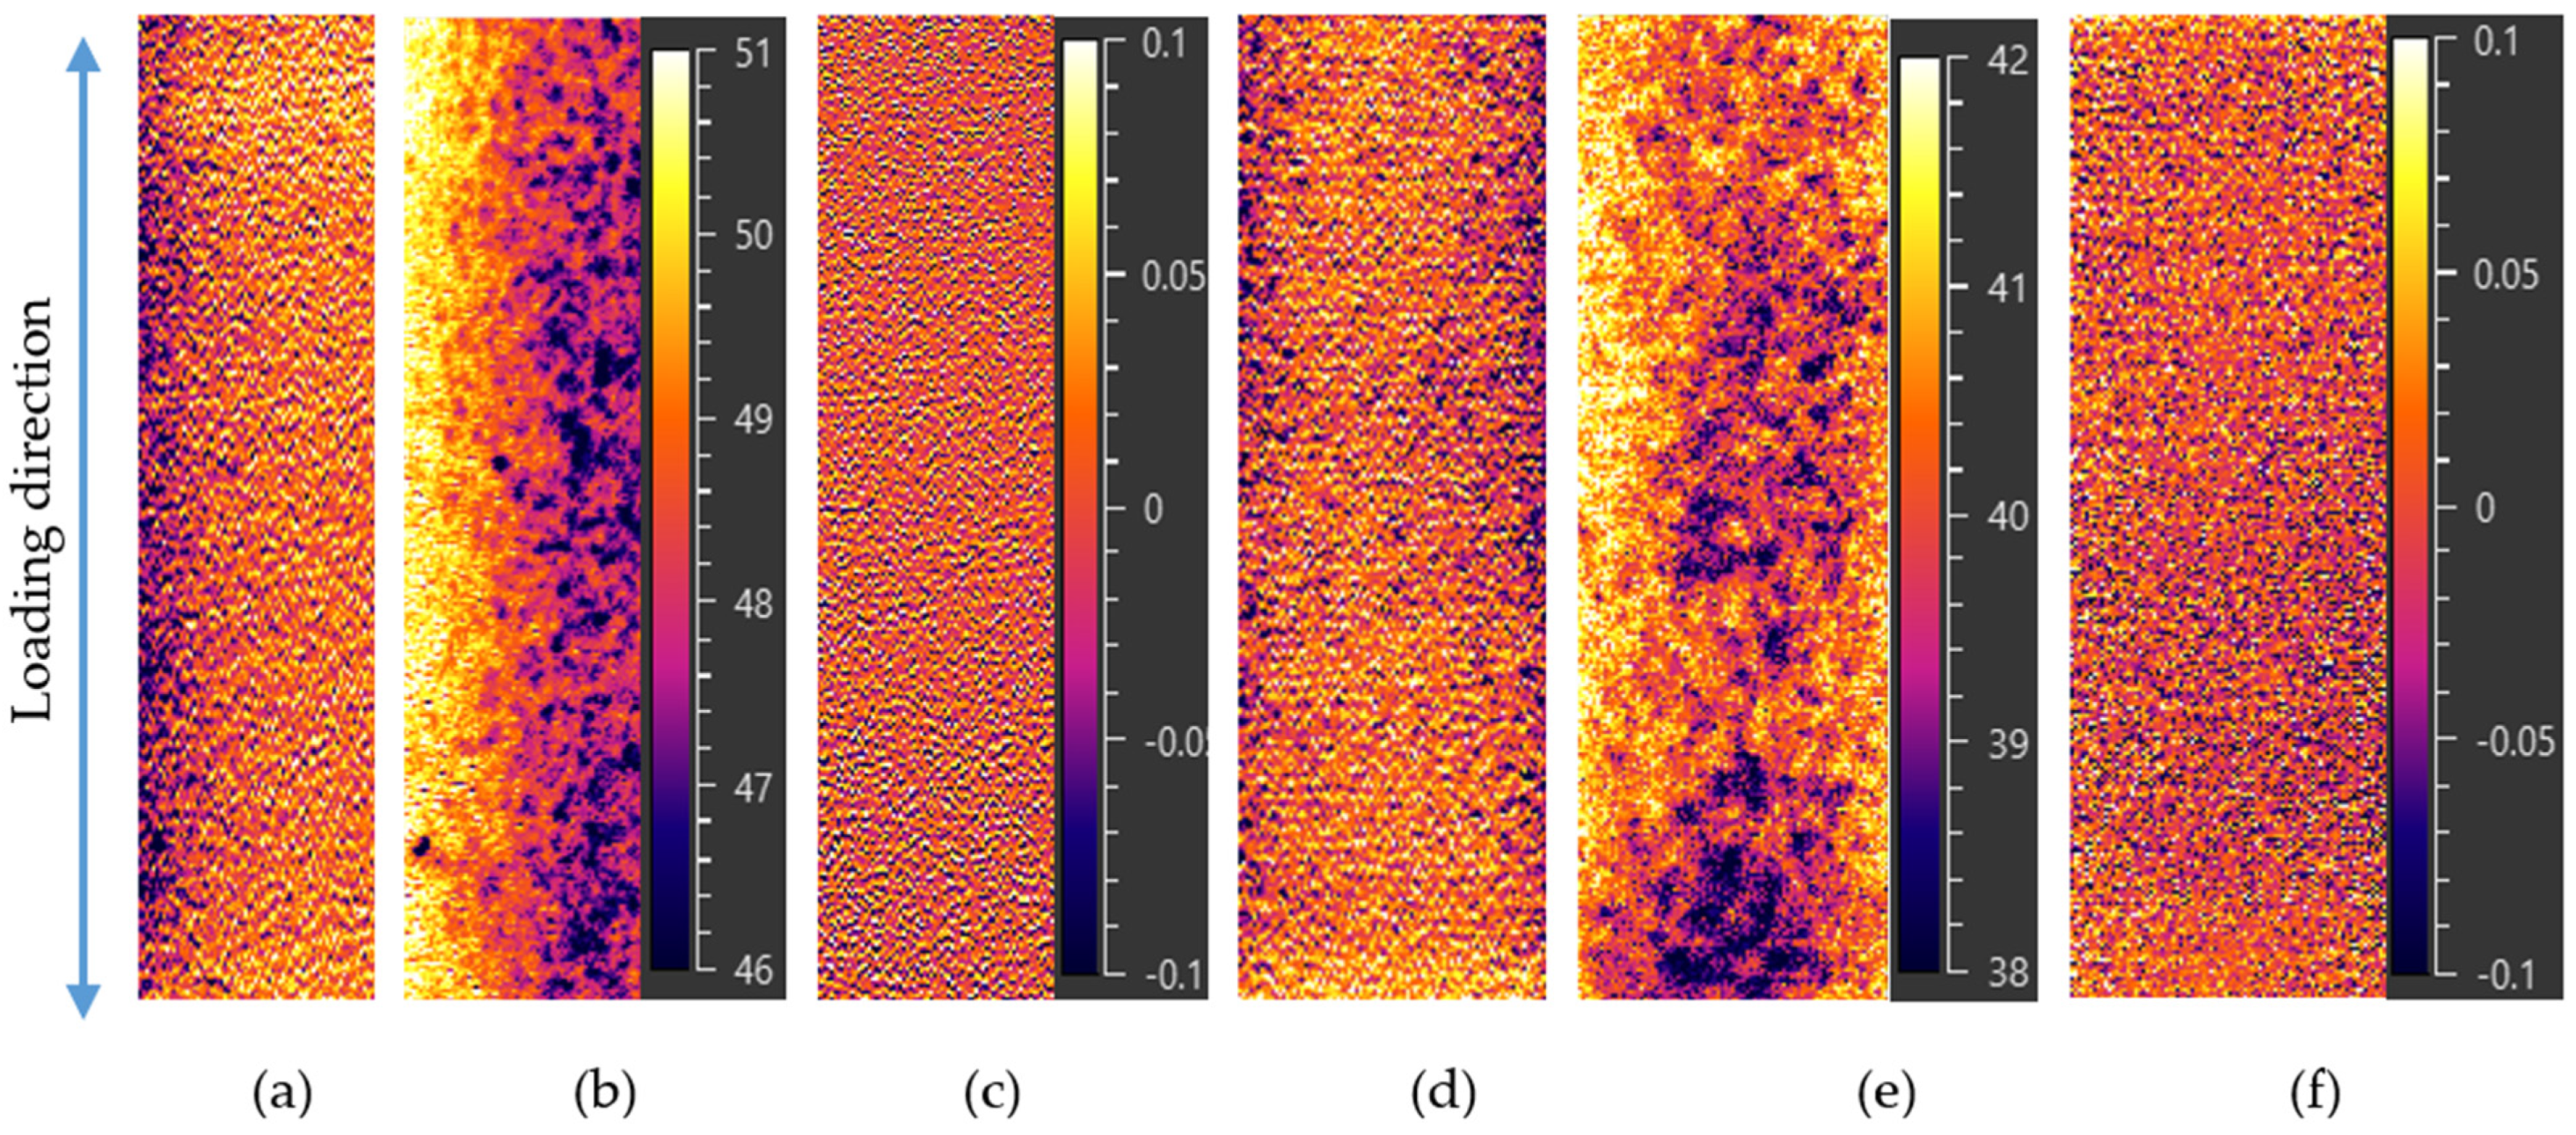
At low amplitude, for both tested configurations, IR measurements gave homogeneous amplitude and phase maps as well as a homogeneous map of skewness (with a mean value of 0) (
Figure 1). To compute the first harmonic amplitude, the amplitude mean value was considered. For both configurations, a linear relation between loading and thermal amplitude was noticeable for low loading amplitudes (
Figure 2). For the bare configuration, the test coupon and the stress field were homogeneous in the gauge section, so the first harmonic can be directly interpreted as the 300M thermo-elastic term (material parameters,
Table 1):
As the HVOF configuration was heterogeneous (300M substrate with a WC-CoCr coating) and the coating was very thin, the tests were not adiabatic. Thus, the temperature amplitude measured on the test coupon surface corresponded to an average of the coating and the steel thermo-elastic coupling due to the diffusion.
A slope of 0.91 mK·MPa
−1 was measured for the bare configuration, a slightly lower value than the thermo-elastic coupling term estimated with available material parameters (0.96 mK·MPa
−1, material parameters,
Table 1). It can be interpreted as the mean emissivity; even with the high-emissivity paint, it is slightly lower than 1. Moreover, the paint layer is not homogeneous, with gaps and extra thickness (noticeable with the first harmonic phase shift;
Figure 1b,e). A lower slope was measured for the HVOF configuration: 0.73 mK·MPa
−1. This can be explained by the lower thermo-elastic coupling term of WC-CoCr (0.80 mK·MPa
−1, material parameters,
Table 1) compared to 300M and the lower steel real stress due to the nominal axial stress.
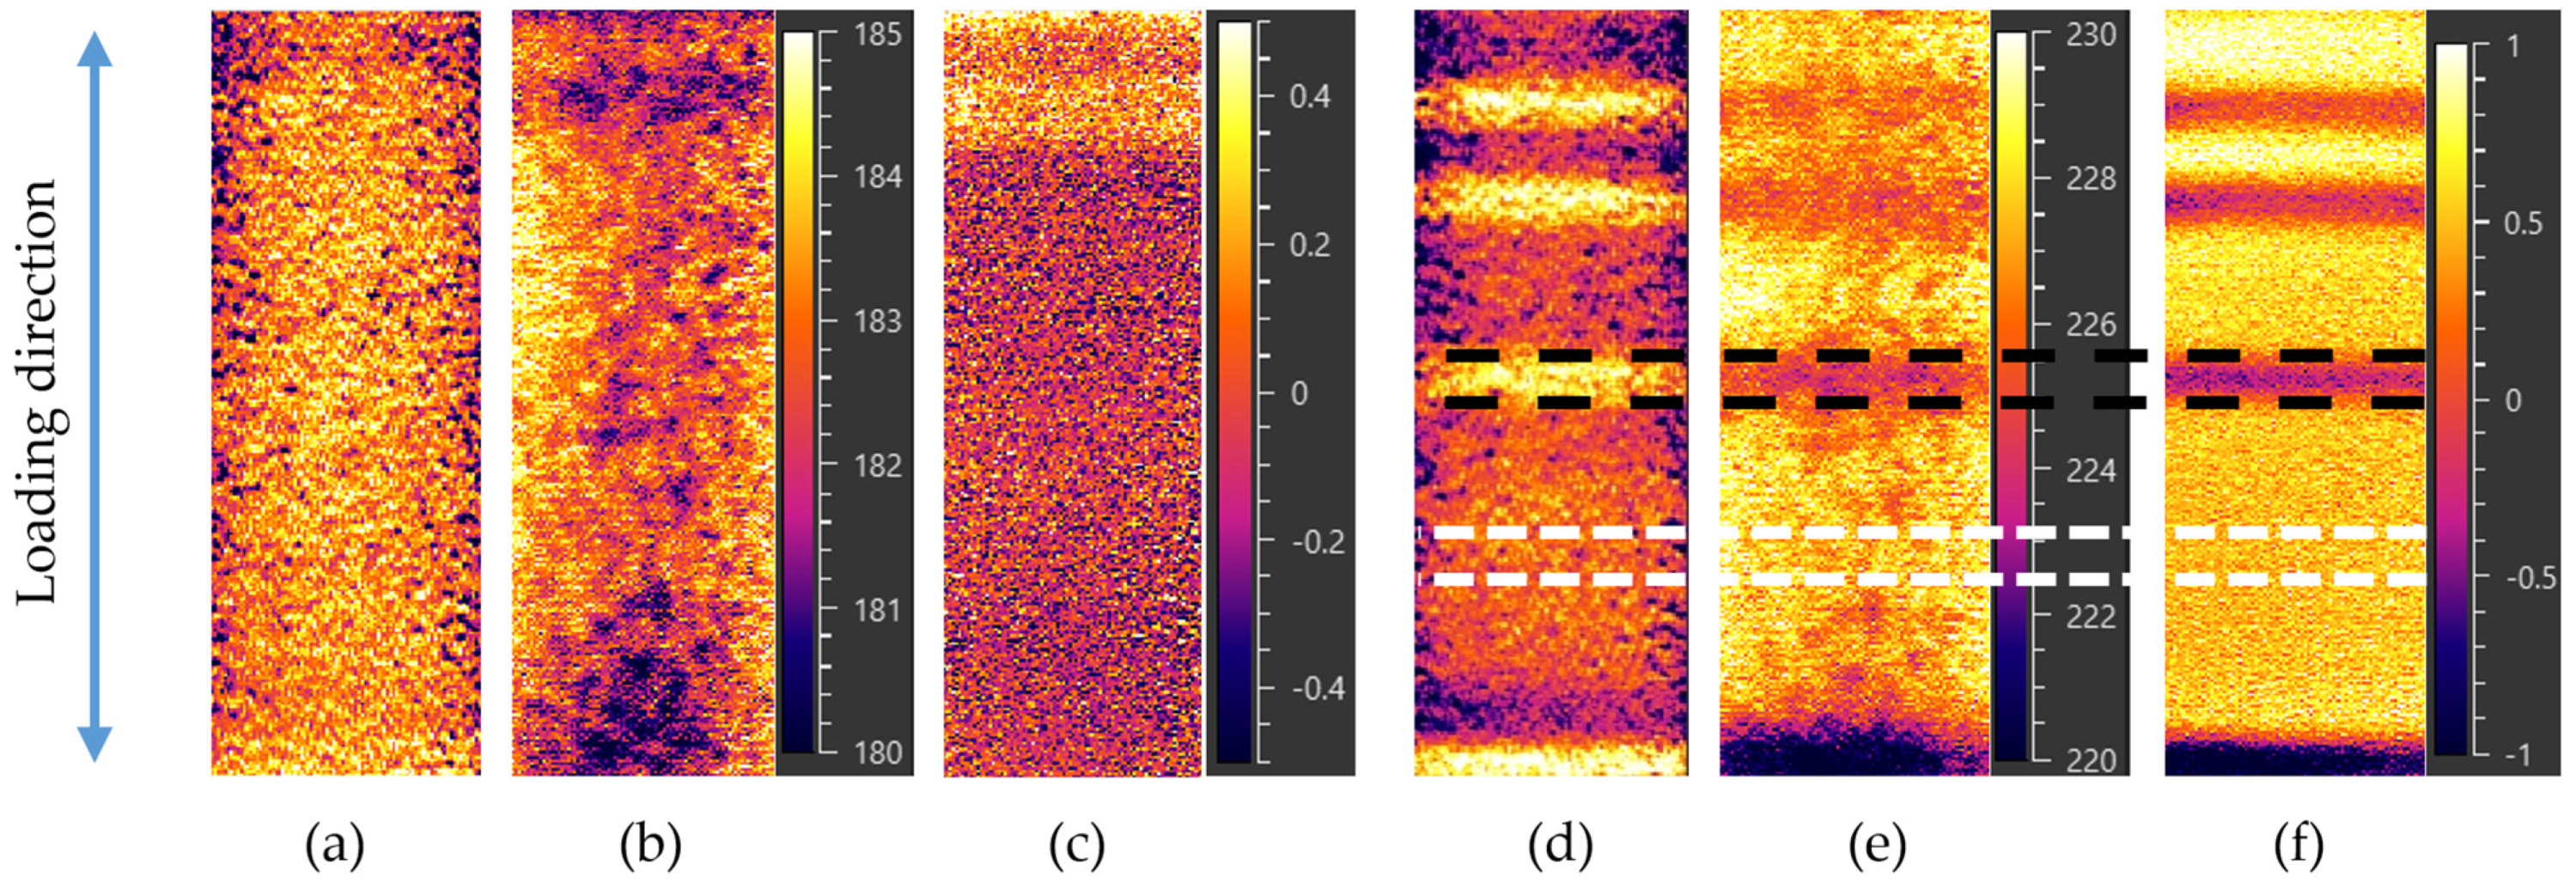
3.1.2. Crack Detection by IR Measurement
By gradually increasing loading amplitude, the coating cracking stress level was determined for the HVOF test coupon. At 0.94σ*, after 200 cycles, a first crack was detected with each indicator (
Figure 3a–c), which was confirmed at σ*, where four cracks were detected (
Figure 3d–f). A network of ring cracks parallel to the loading direction appeared to emerge. Skewness is the most sensitive indicator, so it is used preferentially, but the amplitude and phase shift of the first harmonic were also influenced.
As open cracks modify stress distributions by creating a free stress zone and a stress concentration near the crack tip, a first harmonic amplitude change was expected. Measurements showed an increase of 3% compared to an uncracked area (
Figure 3d). As the coating was known to be a brittle material with no plasticity, it was expected that cracks would propagate through the whole coating thickness. When cracks open, the coating becomes a capacitive layer and delays the thermal signal propagation from steel to the surface. This analysis was confirmed by measurements, as a phase shift was observed between cracked and uncracked areas (
Figure 3e).
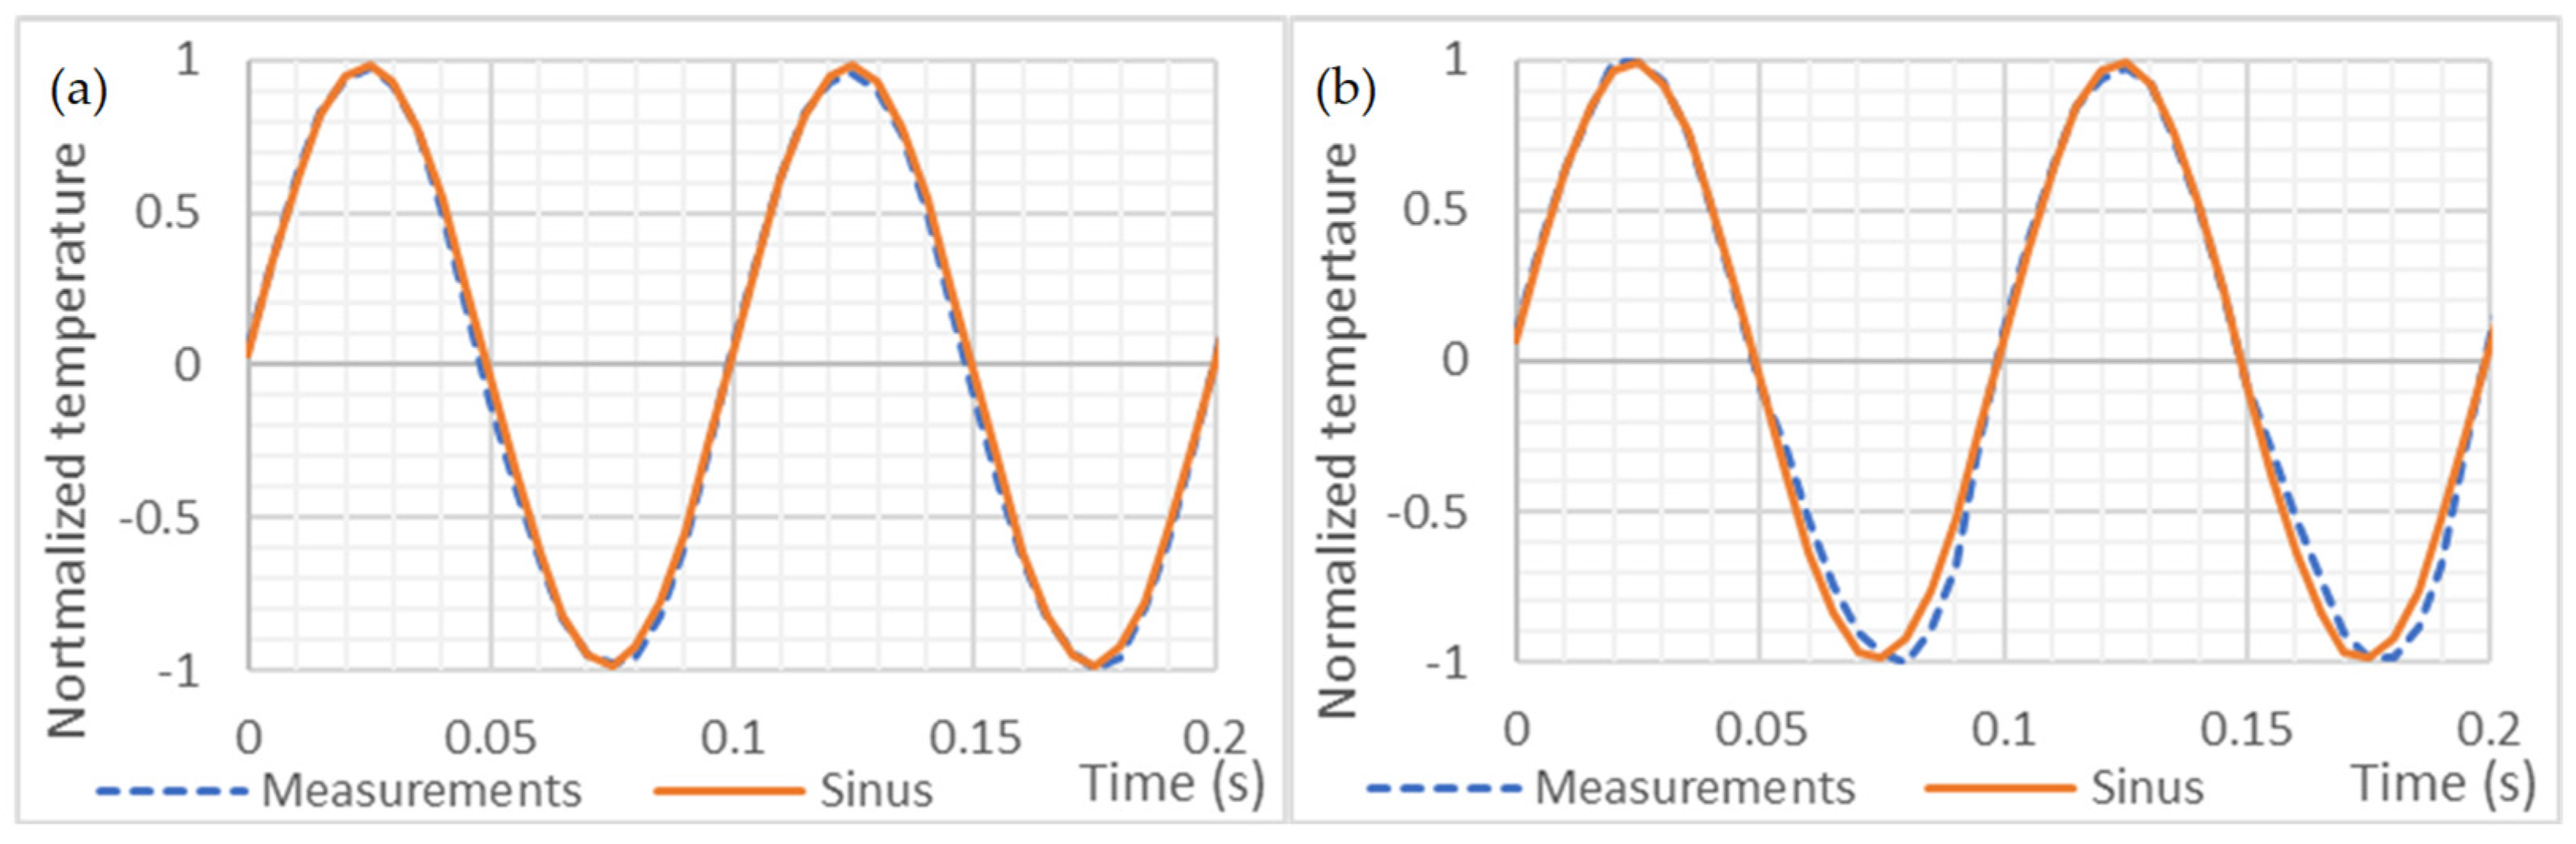
To understand the effect of cracks on skewness, temperature can be plotted on an uncracked (5-pixel height window between short dashed white lines) and on a cracked area (long dashed black lines) (
Figure 4a,b). To have enough points per cycle, IR acquisition frequency was set at 200 Hz. Before cracking, the thermal signal was well fitted by a sinus (
Figure 4a), whereas, after cracking, the lower part of the signal was distorted. This can be interpreted thus: for positive temperatures (compressive stress states), cracks are closed and so do not influence results; but for negative temperatures (tensile stress states), cracks open. The signal can be fitted by a sinus for positive temperatures and a phase-shift sinus for the lower part, with a transition between them (
Figure 4b). It can be noticed that the transition occurred only for negative temperatures, which shows a positive crack-opening stress (between +0.12σ* and +0.47σ*).
3.2. Crack Evolution
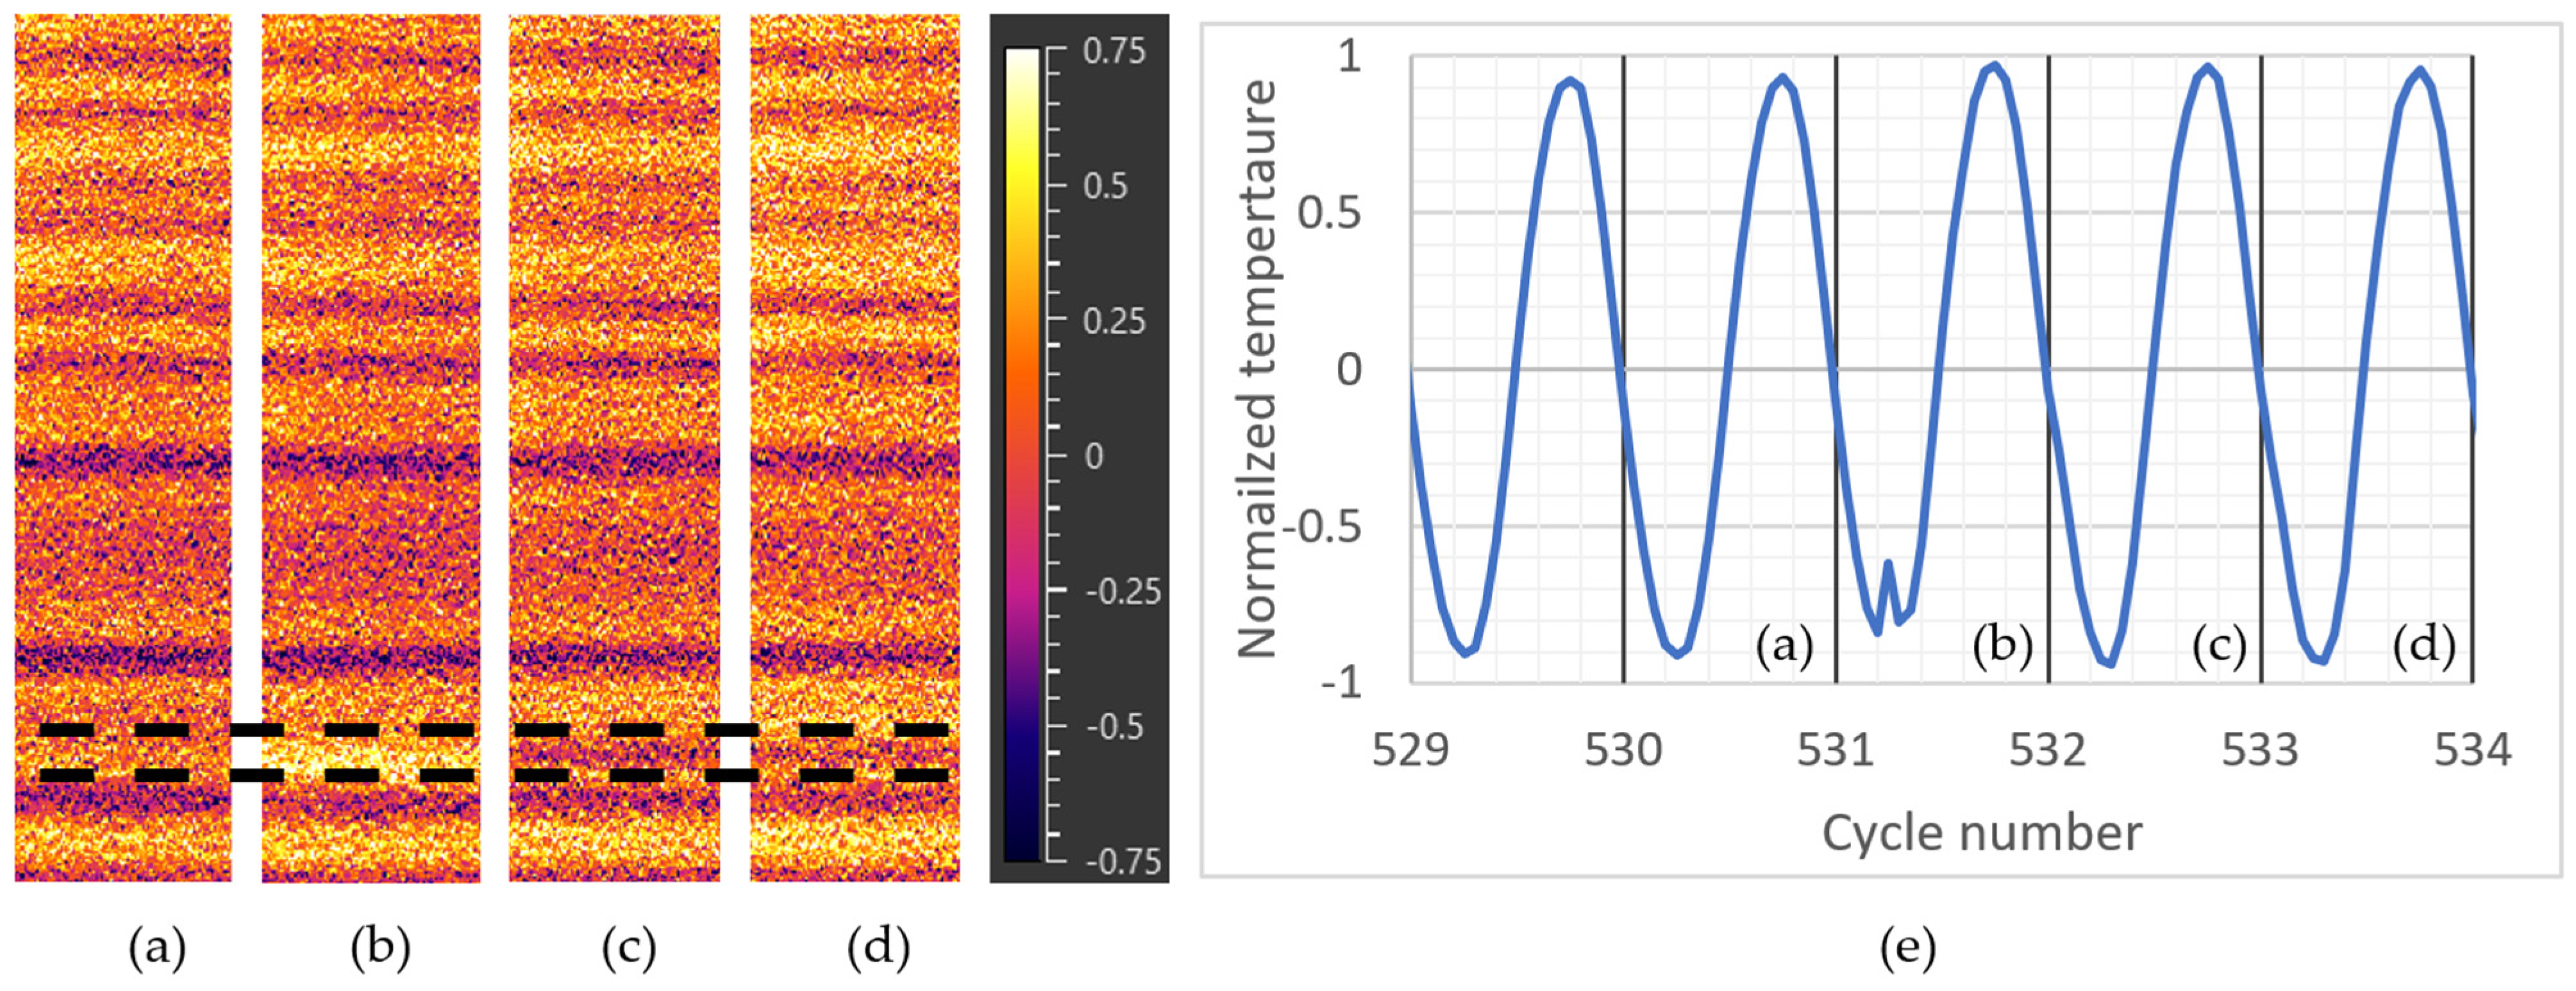
3.2.1. Network Evolution and Kinetics
By cycling at σ
a = σ*, the skewness maps show a quick stabilization of the crack network. A great increase in crack number between the previous block (
Figure 3f) and the first new one (
Figure 5a) was noticeable, whereas only two new cracks appeared between
Figure 5d and the last film (after 2000 cycles). At the end, a steady crack spacing of 1.5 mm (minimum of 1 mm, maximum of 3 mm) was measured.
With an acquisition frequency of 200 Hz for a 10 Hz mechanical loading, there were enough points to compute indicators for every cycle. By means of this, crack initiation and propagation could be monitored cycle by cycle. Between 500 and 600 cycles, a crack appeared in the film at the cycle n°31/32.
Figure 5 shows the skewness map computed for cycles n°30 (
Figure 5a), n°31 (
Figure 5b), n°32 (
Figure 5c), and n°33 (
Figure 5d). The mean temperature on a 5-pixel height window could be plotted (
Figure 5e): before cracking, there was no sign of initiation with a perfect sinus signal; at the maximum of the n°31 cycle, a crack initiated and propagated through the coating; after cracking, there was no sign of further evolution, with a distorted sinus signal. Therefore, the cracks seemed to have initiated and propagated through the coating during a single cycle, which is consistent with its brittle behavior.
3.2.2. Post-Mortem Microscopy Analysis
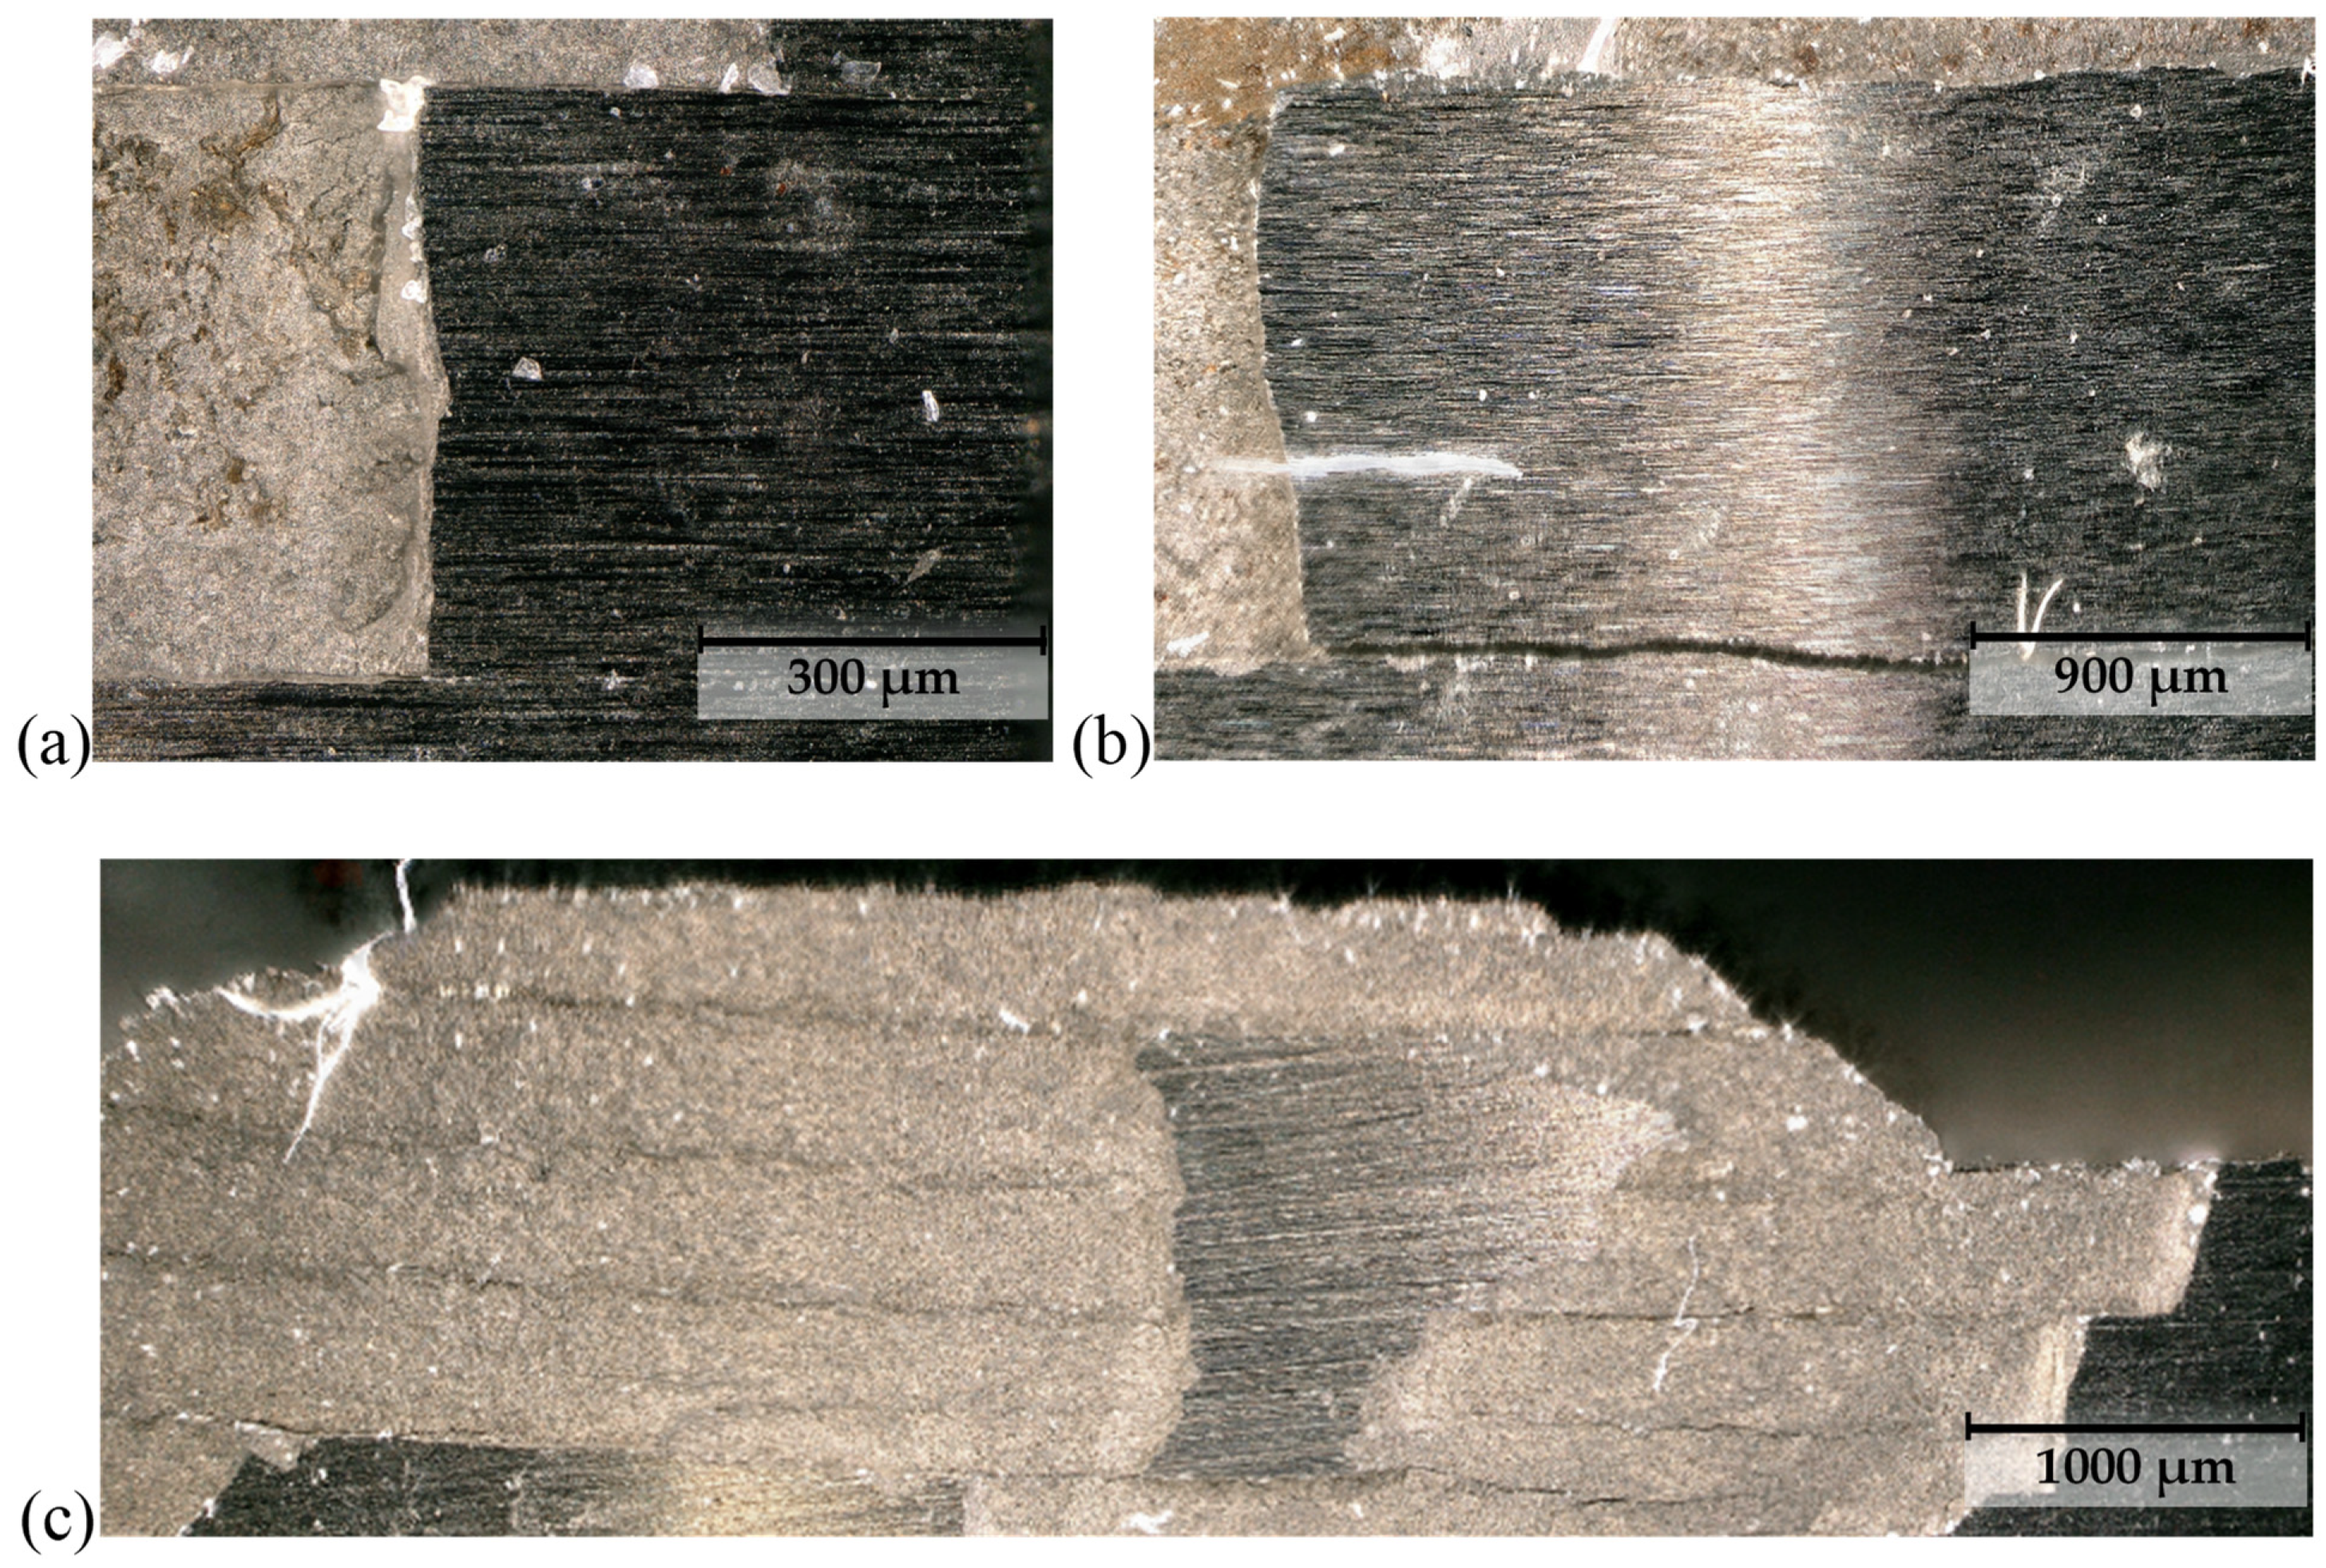
Fracture surfaces of bare (
Figure 6a) and two HVOF (
Figure 6b,c) test coupons were analyzed. For the bare configuration, the fracture mode seems to be a unique crack initiation at the surface that subsequently propagated through the bulk. For the HVOF configuration, multi-initiation at the interface occurred. Cracks are slowed down by the compressive residual stresses of the shot-peened area; however, when one reached the bulk, it would become predominant and cause the rupture of the test coupon.
The surface near the fracture of coated test coupons was observed. Parallel rings of cracks in the coating could be observed (
Figure 7a,b), corroborating the IR measurements. Moreover, where the coating delaminated, the crack rings seemed to go through the interface and propagate in the substrate (
Figure 7c). In addition, each fracture plane corresponded to a crack ring, so it can be assumed that what was observed at the fracture surface occurred at every crack ring. This suggests that each crack ring causes multi-initiation in steel all over the interface.
4. Discussion
It has been shown that crack spacing can be related to material properties and coating thickness [
6]. For the same substrate and coating, a thickness of 150 µm should lead to a mean crack spacing of ~500 µm.
Figure 7c is consistent (~700 µm spacing) with this literature value. Indeed, at σ
a = σ*, a regular crack network settled with a steady crack spacing. As the number of cracks seemed not to increase after 2000 cycles, the crack network was considered to have stabilized. However, for tests observed with IR, a significantly larger mean spacing was measured (1500 µm). As the test was interrupted before the rupture of the coupon, it seems that more cracks would have been expected to appear if the test coupon had lasted longer at σ* or a higher stress amplitude. The same reasoning can be applied for lower stress amplitudes: one crack was detected at 0.94σ* after 200 cycles but more may have appeared after more cycles. It cannot be excluded that cracks could initiate and propagate at lower stress amplitudes, so the coating cracking stress could have been overestimated.
As the three indicators (skewness, first harmonic amplitude, and phase shift) showed no signs before cracking and no evolution afterwards, the conclusion was drawn that cracks initiate and propagate through the coating thickness in a single cycle. However, the IR measurements cannot be used to determine where the cracks initiated (at the interface or at the surface), and no signs of cracks in the steel were found. The optical microscopic observation near the fracture surface showed a systematic crossing of cracks to steel. It can be assumed that crack rings could be found in the whole gauge length, but more observations are required to support this hypothesis. No kinetics of the crack propagation to and into the substrate was established. There was a gap between the IR measurements and the post-mortem microscopy, as only 2000 cycles occurred at σ* during IR monitoring compared to a rupture at ~105 cycles and higher stress amplitudes in the post-mortem. It is likely that the steel cracking occurs between these steps.
Optical microscopy also showed multi-initiation from the interface at the fracture surfaces, which seemed to correspond to a crack ring plane. Therefore, it is possible that multi-initiation occurs at every coating crack ring. IR monitoring until fracture and observation of axially cut test coupons at different steps of loadings could give clues as to the latter aspects.
5. Conclusions
Blocks of cyclic axial loadings (R = −1, fr = 10 Hz) of increasing amplitude were monitored by IR measurements. On a bare 300M steel test coupon, for lower amplitudes than the yield strength, a linear relation between measured thermal amplitude and loading amplitude was found, with a slightly lower slope than the one expected by thermo-elastic coupling due to an actual emissivity slightly lower than 1. On WC-CoCr HVOF-coated test coupons, before cracking, a similar relation correlated with a lower slope than the WC-CoCr thermo-elastic coupling term. By monitoring the first harmonic amplitude and phase and the signal skewness, cracks could be detected. Crack rings appeared with a steady spacing and these networks seemed to establish quickly (in less than 2000 cycles). With high-frequency acquisition, the distortion of the sinus signal by cracks—which created a capacitive layer when cracks were open—could be observed. This capacitive layer created a phase shift of the thermal signal for tensile loads compared to the thermal signal for compression. As no harbingers or evolutions after cracking were detected, it was concluded that cracks initiate and propagate through the coating in a single cycle.
Optical microscopy of test coupon outer surfaces near the fracture surfaces validated the existence of the crack rings. Furthermore, post-mortem analysis showed that a multi-initiation process occurred at the interface and propagated through the shot-peened area. When a crack reached the bulk, it became predominant and led to fracture. Observations of outer surfaces near the fracture surfaces showed a systematic crossing of the interface by the crack rings, which suggests that every coating crack ring leads to a multi-cracking of the substrate.
Author Contributions
P.L., S.C., M.D., M.S., C.D. significantly contributed in every step of the project. All authors have read and agreed to the published version of the manuscript.
Funding
This research received no external funding.
Institutional Review Board Statement
Not applicable.
Informed Consent Statement
Not applicable.
Data Availability Statement
Not applicable.
Acknowledgments
A part of this study belongs to the “Self-Heating” ANR-Safran-Naval Group research chair (grant no. ANR-20-CHIN-0002), involving Safran Companies, Naval Group, ENSTA Bretagne (IRDL), and Institut Pprime.
Conflicts of Interest
The authors declare no conflict of interest.
References
- Munier, R.; Doudard, C.; Calloch, S.; Weber, B. Determination of high cycle fatigue properties of a wide range of steel sheet grades from self-heating measurements. Int. J. Fatigue 2014, 63, 46–61. [Google Scholar] [CrossRef]
- Voorwald, H.J.C.; Souza, R.C.; Pigatin, W.L.; Cioffi, M.O.H. Evaluation of WC–17Co and WC–10Co–4Cr thermal spray coatings by HVOF on the fatigue and corrosion strength of AISI 4340 steel. Surf. Coat. Technol. 2005, 190, 155–164. [Google Scholar] [CrossRef]
- Nascimento, M.P.; Souza, R.C.; Miguel, I.M.; Voorwald, H.J.C. Effects of tungsten carbide thermal spray coating by HP/HVOF and hard chromium electroplating on AISI 4340 high strength steel. Surf. Coat. Technol. 2001, 138, 113–124. [Google Scholar] [CrossRef]
- Villalobos-Gutiérrez, C.J.; Gedler-Chacón, G.E.; La Barbera-Sosa, J.G.; Piñeiro, A.; Staia, M.H.; Lesage, J.; Chicot, D.; Mesmacque, G.; Puchi-Cabrera, E.S. Fatigue and corrosion fatigue behavior of an AA6063-T6 aluminum alloy coated with a WC–10Co–4Cr alloy deposited by HVOF thermal spraying. Surf. Coat. Technol. 2008, 202, 4572–4577. [Google Scholar] [CrossRef]
- La Barbera-Sosa, J.G.; Santana, Y.Y.; Villalobos-Gutiérrez, C.; Chicot, D.; Lesage, J.; Decoopman, X.; Iost, A.; Staia, M.H.; Puchi-Cabrera, E.S. Fatigue behavior of a structural steel coated with a WC–10Co–4Cr/Colmonoy 88 deposit by HVOF thermal spraying. Surf. Coat. Technol. 2013, 220, 248–256. [Google Scholar] [CrossRef]
- Gui, M.; Eybel, R.; Asselin, B.; Monerie-Moulin, F. Cracking and spalling behavior of HVOF thermally sprayed WC-Co-Cr coating in bend and axial fatigue tests. J. Mater. Eng. Perform. 2015, 24, 1347–1356. [Google Scholar] [CrossRef]
- Vackel, A.; Sampath, S. Fatigue behavior of thermal sprayed WC-CoCr- steel systems: Role of process and deposition parameters. Surf. Coat. Technol. 2017, 315, 408–416. [Google Scholar] [CrossRef]
- Aerospace Material Specification. Steel Bars, Forgings, and Tubing, 1.6Si–0.82Cr–1.8Ni–0.40Mo–0.08V (0.40–0.44C), Consumable Electrode Vacuum Remelted, Normalized and Tempered; AMS6257-F; Aerospace Material Specification: Warrendale, PA, USA, 2016. [Google Scholar]
- Xue, H.; Liu, P.; Chen, P.; Wang, J. Fatigue life assessment of a high strength steel 300M in the gigacycle regime. Theor. Appl. Mech. Lett. 2012, 2, 031006. [Google Scholar] [CrossRef]
- Ko, P.L.; Robertson, M.F. Wear characteristics of electrolytic hard chrome and thermal sprayed WC–10 Co–4 Cr coatings sliding against Al–Ni–bronze in air at 21 °C and at −40 °C. Wear 2002, 252, 880–893. [Google Scholar] [CrossRef]
- NeoNickel Technical Data Sheet, 300M/S155. Available online: https://www.neonickel.com/generate-alloy-pdf/?id=383 (accessed on 4 April 2022).
- Lefebvre, A.; Sinot, O.; Torrance, A.A.; Lipinski, P. Determination of the partition coefficient for the grinding of a hard WC-Co-Cr coating with a diamond wheel. Mach. Learn Sci. Technol. 2014, 18, 585–602. [Google Scholar] [CrossRef]
Figure 1.
Map of first harmonic amplitude (a,d), first harmonic phase shift (b,e), and skewness (c,f) for, respectively, the bare test coupon at σa = 0.59σ* and the HVOF test coupon at σa = 0.88σ*, computed for 100 cycles (fr = 10 Hz, R = −1).
Figure 1.
Map of first harmonic amplitude (a,d), first harmonic phase shift (b,e), and skewness (c,f) for, respectively, the bare test coupon at σa = 0.59σ* and the HVOF test coupon at σa = 0.88σ*, computed for 100 cycles (fr = 10 Hz, R = −1).
Figure 2.
Mean normalized first harmonic amplitude according to the normalized loading amplitude, computed for 100 cycles (fr = 10 Hz, R = −1).
Figure 2.
Mean normalized first harmonic amplitude according to the normalized loading amplitude, computed for 100 cycles (fr = 10 Hz, R = −1).
Figure 3.
Map of first harmonic amplitude (a,d), first harmonic phase shift (b,e) and skewness (c,f) for the HVOF configuration at, respectively, σa = 0.94σ* and at σa = σ*, computed for 100 cycles (fr = 10 Hz, R = −1).
Figure 3.
Map of first harmonic amplitude (a,d), first harmonic phase shift (b,e) and skewness (c,f) for the HVOF configuration at, respectively, σa = 0.94σ* and at σa = σ*, computed for 100 cycles (fr = 10 Hz, R = −1).
Figure 4.
Normalized temperature during two cycles for the HVOF test coupon on an uncracked area (a) and a cracked area (b), with a fitted sinus on the whole curve (a) and on the positive part of the curve (b), respectively (fr = 10 Hz, R = −1, σa = σ*).
Figure 4.
Normalized temperature during two cycles for the HVOF test coupon on an uncracked area (a) and a cracked area (b), with a fitted sinus on the whole curve (a) and on the positive part of the curve (b), respectively (fr = 10 Hz, R = −1, σa = σ*).
Figure 5.
Skewness maps computed for cycles n°30 (a), n°31 (b), n°32 (c), and n°33 (d), with the apparition of a new crack between the dashed lines and temperature evolution around the new crack (e) (fr = 10 Hz, R = −1, σa = σ*).
Figure 5.
Skewness maps computed for cycles n°30 (a), n°31 (b), n°32 (c), and n°33 (d), with the apparition of a new crack between the dashed lines and temperature evolution around the new crack (e) (fr = 10 Hz, R = −1, σa = σ*).
Figure 6.
Crack initiation sites as viewed via optical microscopy (×500) of bare (a), HVOF n°1 (b), and HVOF n°2 (c) test coupons after a self-heating test (short cyclic loading blocks of increasing amplitude, fr = 135 Hz, R = −1).
Figure 6.
Crack initiation sites as viewed via optical microscopy (×500) of bare (a), HVOF n°1 (b), and HVOF n°2 (c) test coupons after a self-heating test (short cyclic loading blocks of increasing amplitude, fr = 135 Hz, R = −1).
Figure 7.
Optical microscopy (×500) of test coupon surface near the fracture surface for the HVOF n°1 test coupon (a,b) and the HVOF n°2 test coupon (c) after a self-heating test (short cyclic loading blocks of increasing amplitude, fr = 135 Hz, R = −1).
Figure 7.
Optical microscopy (×500) of test coupon surface near the fracture surface for the HVOF n°1 test coupon (a,b) and the HVOF n°2 test coupon (c) after a self-heating test (short cyclic loading blocks of increasing amplitude, fr = 135 Hz, R = −1).
Table 1.
Material parameters for the thermo-elastic coupling term computation.
Table 1.
Material parameters for the thermo-elastic coupling term computation.
| Material | | | | |
|---|
Reference
Temperature | Coefficient of
Thermal Expansion | Density | Specific Heat |
|---|
| 300M | 298 | 11.34 [11] | 7.85 [11] | 448 [11] |
| WC-CoCr | 298 | 6 [7] | 13.9 [12] | 160 [12] |
| Publisher’s Note: MDPI stays neutral with regard to jurisdictional claims in published maps and institutional affiliations. |
© 2022 by the authors. Licensee MDPI, Basel, Switzerland. This article is an open access article distributed under the terms and conditions of the Creative Commons Attribution (CC BY) license (https://creativecommons.org/licenses/by/4.0/).


 ,
, 


