
Modeling and Simulation of an Industrial-Scale 525 MWth Petcoke Chemical Looping Combustion Power Plant
by
 , ,
, ,
Odile Vekemans
1,
Mahdi Yazdanpanah
2,
Florent Guillou
3,
Stéphane Bertholin
3 and
Benoit Haut
1,* 1
Transfers, Interfaces and Processes (TIPs), Université Libre de Bruxelles, Av. F.D. Roosevelt 50, C.P. 165/67, 1050 Brussels, Belgium
2
TotalEnergies, 92400 Paris La Défense, France
3
IFP Énergies Nouvelles, Rond-Point Échangeur de Solaize, 69360 Solaize, France
*
Author to whom correspondence should be addressed.
Processes 2023, 11(1), 211; https://doi.org/10.3390/pr11010211
Submission received: 21 November 2022
/
Revised: 14 December 2022
/
Accepted: 21 December 2022
/
Published: 9 January 2023
Abstract
:This paper presents the modeling and simulation of an industrial-scale chemical looping combustion (CLC) power plant, including all process units (reactors, flue gas treatment units, heat integration, steam cycle, and CO2 compression train). A model of a 525 MWth CLC power plant was built using a rigorous representation of the solid fuel and oxygen carrier. Petcoke was considered the main fuel of interest in this study, and it is compared with other solid fuels. The flue gas compositions obtained with the model show that cleanup units are mandatory to comply with CO2 quality requirements. High levels of flue gas treatment, including 97.1% deNOx and 99.4% deSOx, are needed to achieve typical specifications for captured CO2. This is mainly due to the high level of contaminants in the fuel, but also to the absence of nitrogen in the CLC flue gas, thus resulting in higher concentrations for all substances. The high level of flue gas treatment is thus one of the important challenges for solid fuel combustion in CLC. The overall CO2 capture efficiency of the plant is estimated to be as high as 94%. Regarding the energy balance, a process net efficiency of 38% is obtained. Comparing the results with other available technologies shows that CLC exhibits one of the highest net plant efficiencies and carbon capture rates. CLC is thus a promising technology to produce clean energy from solid fuels. Finally, based on a sensitivity analysis, it is shown that process efficiency is mainly affected by the design and performance of the CLC furnace, the steam injection rate in the fuel reactor, the char separation efficiency, and the excess oxygen in the air reactor.
1. Introduction
To keep global warming below the 2 °C target, carbon capture and sequestration (CCS) can help mitigate the greenhouse gases (GHG) emissions of fossil fuel combustion while transitioning to renewable energies. Carbon capture (CC) can take place in various ways during fossil fuel combustion. Available technologies are generally divided into three categories [1,2]. First, the CO2 can be separated from the other flue gas downstream components; this is called postcombustion CC. Second, a gasification of the primary fuel can be realized to produce hydrogen through a combination of partial combustion, reforming, and water–gas shifting, and the CO2 can be separated from the resulting stream; this is called precombustion CC. Third, the fuel can be burned with pure oxygen in an environment free of nitrogen, leading to CO2 mixed mainly with water; this is called oxy-fuel combustion. Chemical looping combustion (CLC) is an oxy-fuel combustion technology combining two bed reactors: the fuel reactor (FR) and the air reactor (AR). In CLC, a metal oxide (called the oxygen carrier, OC) is employed as a material providing the necessary oxygen for combustion in the fuel reactor. The reduced metal is then transferred to the air reactor and reoxidized in contact with air before being reintroduced back to the fuel reactor, thus completing the loop.
Chemical looping combustion is a technology that has drawn much attention in the past few years. Originally, the research dedicated to CLC focused on the use of gaseous fuels. However, in recent years, research activities have been reoriented towards solid fuel applications [3,4,5,6,7,8]. The modeling and optimization of the FR is an important area for the development of CLC [9,10]. Performance and improvement of OC is another area of focus [11,12]. CLC can produce energy in the form of heat and/or electricity with low carbon emissions from conventional fossil fuels. Regarding combustion of biomass, it permits energy production with negative carbon content (bioenergy with carbon capture and storage, BECCS) and thus captures CO2 indirectly from the atmosphere [13,14]. Switching from gas to solid fuels not only requires the FR to be adapted to handle a solid fuel injection, but also to handle the char produced by fuel devolatilization as well as the ashes remaining after the combustion. Because of the poor reactivity of the char to the OC, steam gasification of the char must be implemented in the FR prior to the oxidation of the gaseous components by the OC. This is referred to as in situ gasification CLC (iG-CLC). Furthermore, steam gasification being a slower process than volatiles oxidation by the OC, unreacted char at the exit of the FR must be recirculated back into the FR to avoid its combustion in the AR, thus resulting in reduced carbon capture efficiency.
It has been shown that, even with a lower fuel-S to SO2 conversion in CLC than in conventional combustion and with the absence of thermal-NO and prompt-NO formation, solid fuel CLC is still characterized by significant levels of SOx and NOx emissions [15,16,17] that require the use of deNOx and deSOx units to produce a CO2 stream suitable for geological storage or for reuse. This is mainly because the FR flue gas is nitrogen-free and, therefore, all gaseous species have much higher concentrations than in other techniques due to the reduction of the overall flue gas volume. Krzywanski et al. [18] have developed a modeling approach to predict NOx and SOx emissions from coal and biomass in different CLC combustion modes, including iG-CLC. The modeling results were validated against experimental results from a 5 kWth research unit.
Numerous studies have focused on the implementation and optimization of solid fuel combustion in the FR [19,20,21,22,23,24,25,26]. Zhou et al. [27] used the process simulation approach to model both the AR and FR to predict the CLC CO2 capture rate for various kinds of biomass fuels, and they also studied the influence of reactor temperatures on this capture rate. Process simulation was also used to evaluate high pressure CLC systems [28] and the use of a supercritical CO2 Brayton cycle to improve the overall electricity efficiency of CLC [29].
Development and industrialization of CLC technology needs process studies at the overall system level that integrates all unit operations, including feeding, reactor system, flue gas treatment, and steam cycle. Moreover, even if SOx and NOx emissions have been well-studied at the reactor level, there are few publications available on the application of flue gas treatment units to deal with these contaminants in the gas exiting the FR. This topic is very important, as captured CO2 in CLC must respect storage or utilization specifications for an industrial CCUS application.
This study presents a full process chain model and simulation of a 525 MWth CLC power plant fed with solid fuels. Petcoke is the main fuel of interest. Moreover, coal is also studied to give a reference for comparison with similar studies. Emphasis is put on the design of dedicated CLC reactors, the integration of flue gas cleanup units, and the optimization of the steam cycle. Finally, the parameters having a significant influence on the process efficiency are identified, and the sensitivity to these parameters is analyzed. This original global approach of the CLC technology allows this study to identify and address several key points required to evaluate the CLC technology with solid fuels and compare it with other available carbon capture technologies.
It is important to emphasize that within this global modeling approach, the model of the FR (general modeling principles, reaction paths, conversions, etc.) is based on results presented in previous works [24,25,26] and in the literature [15,16,30]. Regarding the other unit operations (flue gas cleanup units, steam cycle, etc.), the model is mainly based on the literature.
Generally, even if each element of the process model is properly referenced, the information is not given in full detail because the objective of this work is a process study and not a complete description or analysis of reaction or hydrodynamic models. Nevertheless, we believe that this does not prevent the article from reaching its main objective, which is to present a comprehensive analysis of a whole CLC power plant.
2. Case Study and Problem Statement
In this section, the CLC system analyzed in this study is presented. First, the process configuration is described. Then, the fuel and the oxygen carrier compositions are given. Finally, the reaction paths are detailed.
2.1. General Process Configuration
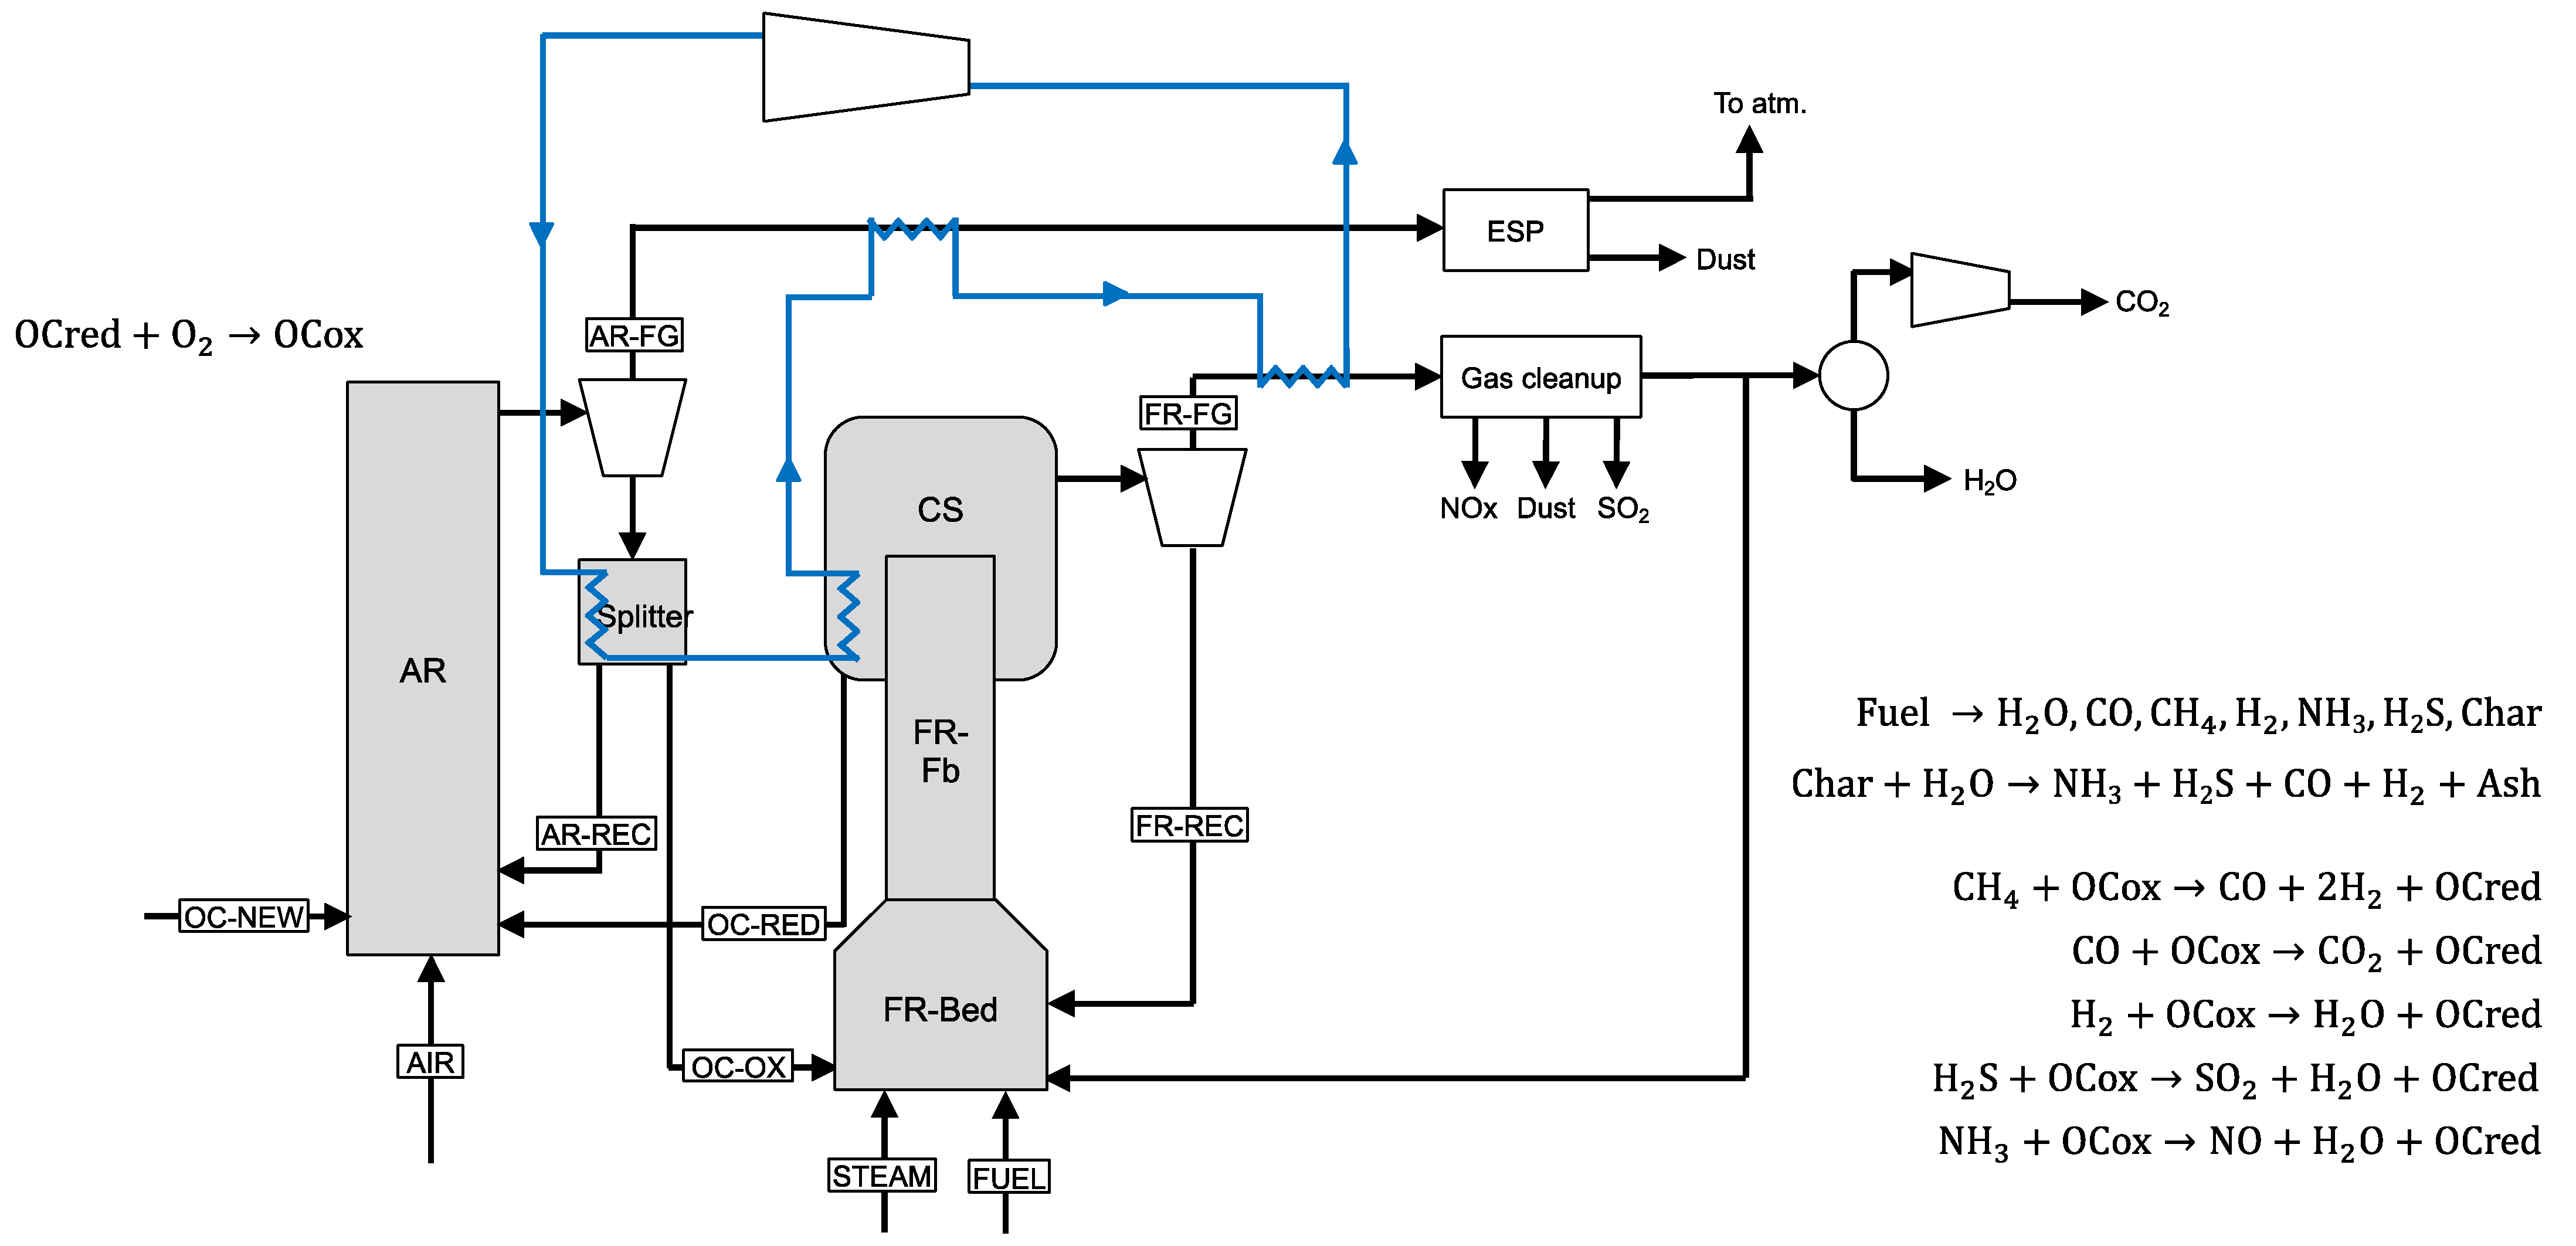
Chemical looping combustion is characterized by the decoupling of the air and the fuel injections, each of them introduced in a dedicated reactor (the air reactor, AR, and the fluid reactor, FR, respectively). To ensure oxygen transfer between the air and the fuel, metallic particles (OC), oxidized in contact with the air and reduced in the presence of the fuel, circulate between the reactors. The schematic representation of the solid fuel CLC process considered in this study and its associated reactions are given in Figure 1. Please note that the heat exchanges between the boiler feedwater (BFW) and the splitter, the carbon stripper, the flue gases, and the gas cleanup units are only schematically represented in this figure. They are fully detailed in Section 3.
In the AR, the oxidation of the OC in contact with air takes place. At the AR outlet, the OC is separated from the exhaust gas (AR-FG flux in Figure 1) with a cyclone. Then, it is either sent to the FR (OC-OX) or recycled to the AR (AR-REC) using a splitter.
In the FR, the fuel is first devolatilized. Then, the char particles are gasified by steam. The produced gases are oxidized by the OC. Steam gasification, being a slower process than volatiles oxidation by the OC, leaves a non-negligible part of the char not gasified, and the unreacted char at the exit of the FR must be recirculated. The carbon stripper (CS) at the apex of the FR separates the reduced OC from the ashes and unreacted char [31]. The reduced OC is sent back to the AR (OC-RED) while the unreacted char is recirculated to the bed of the FR (FR-REC) after being separated from the exhaust gas of the FR (FR-FG) with a cyclone. Because the CS separation efficiency is not 100%, some OC particles are sent to this cyclone while some char and ashes particles reach the AR (with the OC-RED flux). Since the amount of char reaching the AR greatly affects CO2 capture efficiency, the CS design is critical for the solid fuel CLC technology. In addition to the design of the CS itself, the CO2 capture efficiency is also largely dependent on the fuel conversion per pass, as it defines the amount of char reaching the CS. In the reactor configuration considered here, the FR design has two sections (FR-Bed and FR-Fb) to maximize the fuel conversion per pass, and the CS is situated at its top [32]. It should be noted that, in the case of biomass combustion, the CS may not be necessary thanks to the high volatile content of biomass. Finally, to reduce external gas injection in the unit, a part of the flue gas is recycled to the FR to contribute, with steam, to the fluidization of the solid material in this reactor.
To produce electricity, heat is extracted at several locations with boiler feedwater that is subsequently transferred to a steam cycle. As shown in Figure 1, heat is extracted from the AR and FR flue gas as well as from the CS and the splitter, the latter extraction allowing regulation of the temperature in the FR (see Section 3 for more details).
Fresh oxygen carrier (OC-NEW in Figure 1) is also injected in the AR to make up for OC losses through the cyclones.
The CO2 stream produced in the CLC process can have different end uses. Depending on the final purpose of the CO2, quality requirements can vary. Some typical quality requirements associated with storage and used in enhanced oil recovery (EOR) are given in Table 1. Since solid fuels contain sulfur and nitrogen, the CO2 stream exiting the FR needs to be cleaned to comply with these requirements. Because CO2 storage and reuse are still under investigation, these quality indications may vary from one site and one study to another. Once cleaned, the CO2 needs to be dried and compressed to reach a pressure adequate for transportation or reuse. The unit operations for gas cleanup and for CO2 compression included in the current model of the CLC plant are fully detailed and discussed in Section 3 of this paper.
2.2. Fuel and OC Compositions
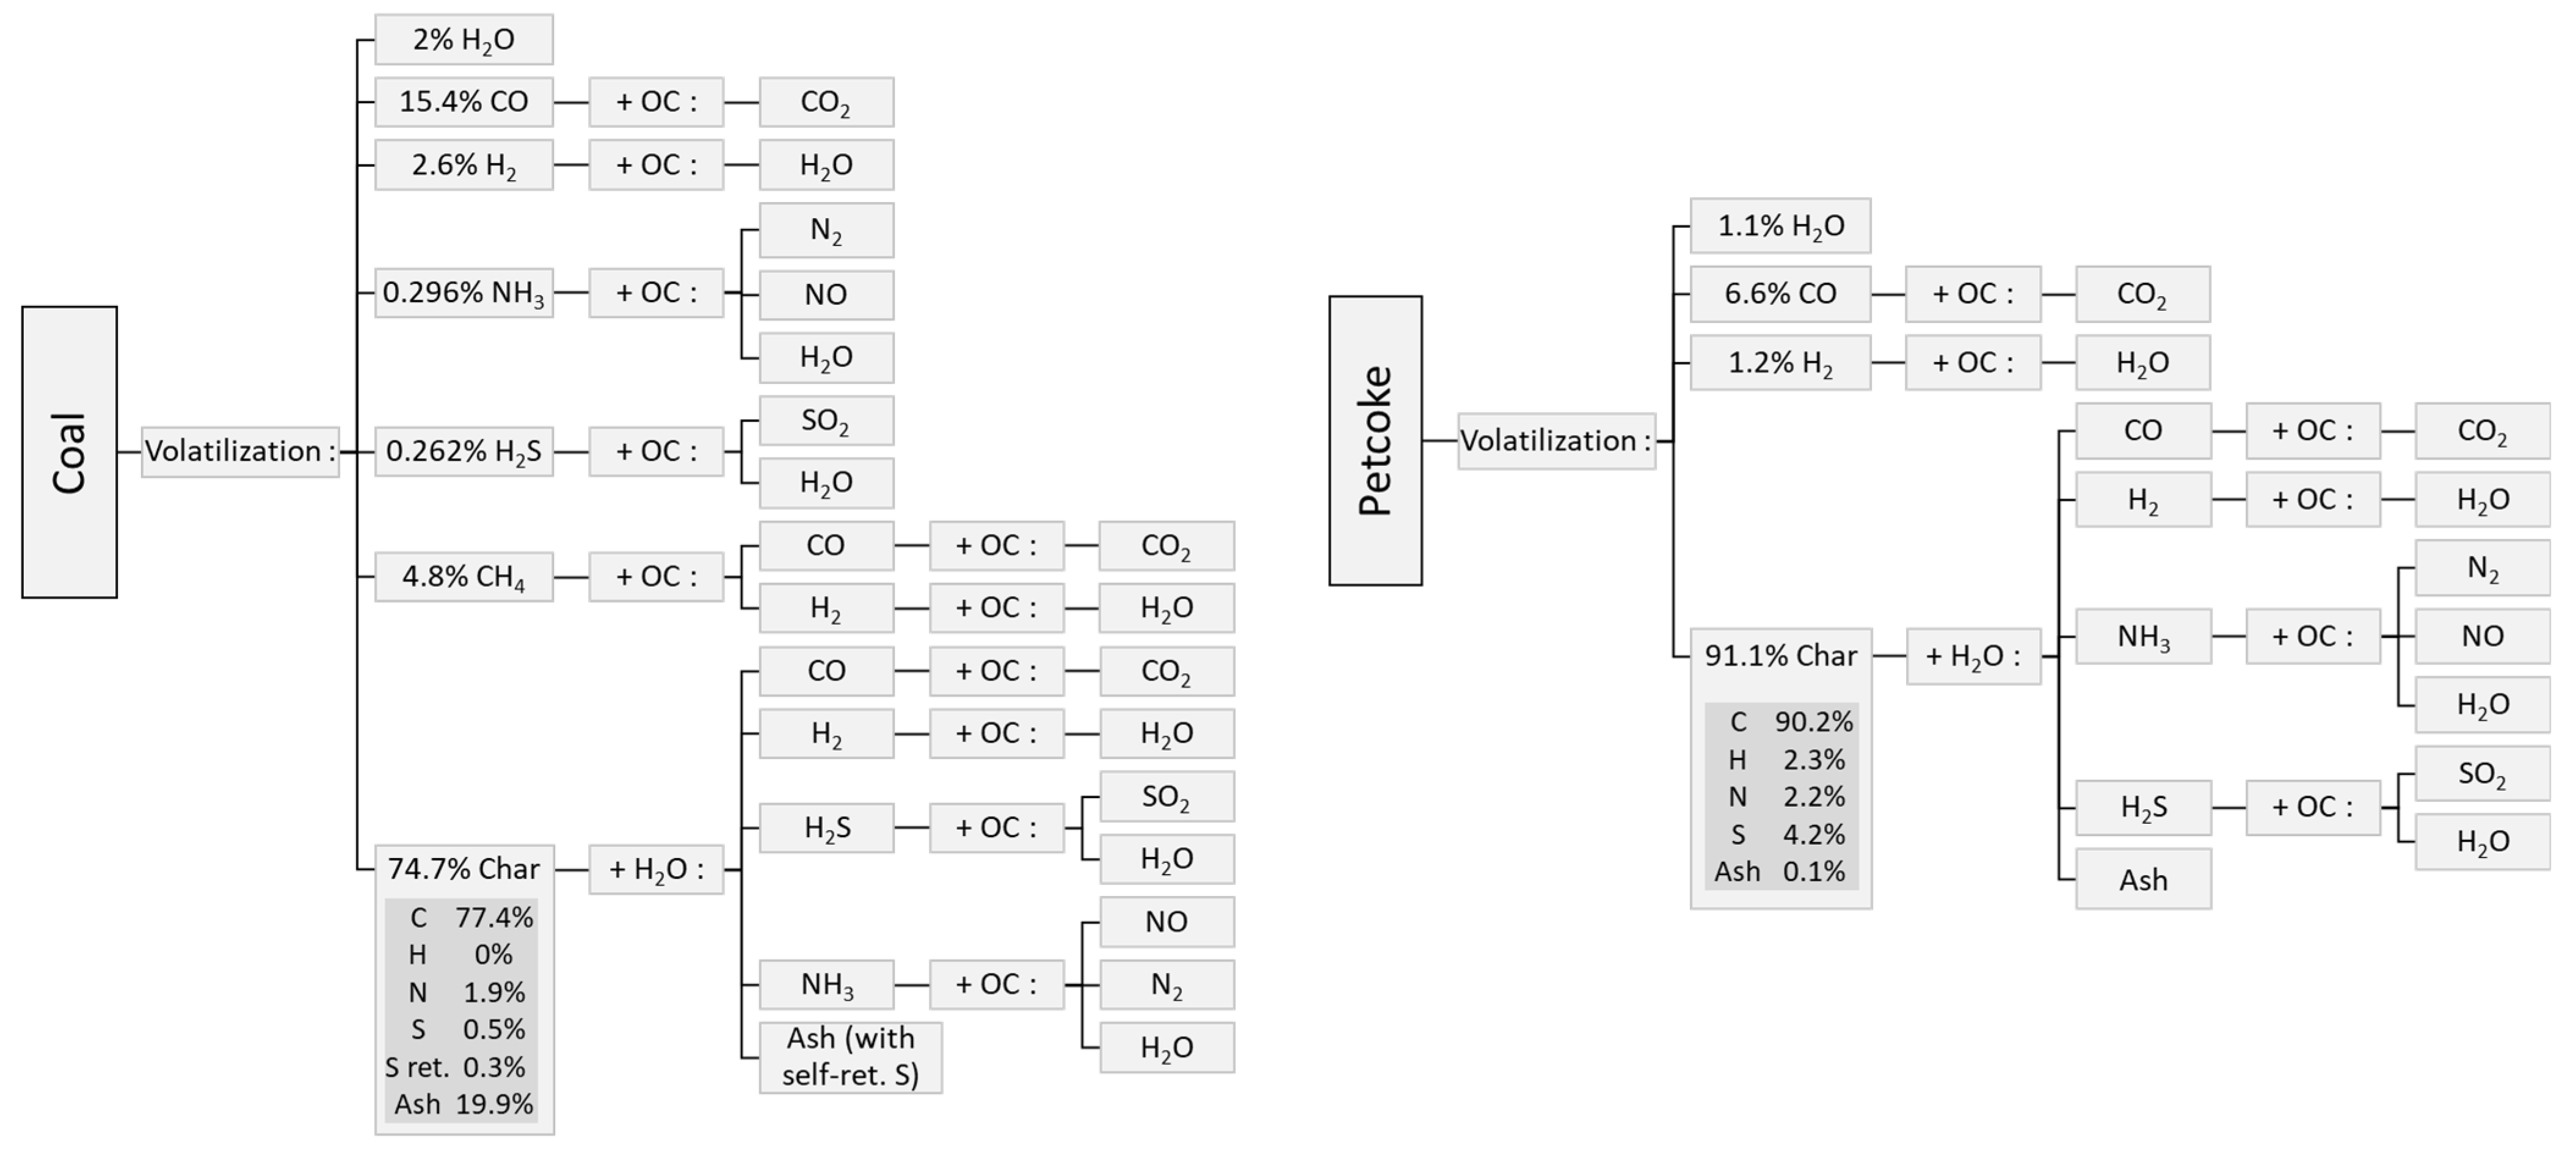
The compositions of the coal and petcoke considered in this study are given in Table 2. There are some major discrepancies in terms of volatile fractions, moisture, and ash fractions between these fuels. Their sulfur contents are also very different. The composition of the char has also been characterized and is given in Figure 2.
2.3. Fuel Reaction Paths
The reaction paths considered in the model of the FR for the coal and petcoke are given in Figure 2. As mentioned before, the solid fuel goes through a devolatilization step, and the resulting char is gasified with steam before the produced gaseous components react with the OC. Note that similar reaction pathways can be considered for biomass combustion.
The fraction of char formation after devolatilization and the composition of the gas resulting from this devolatilization were evaluated based each the fuel’s ultimate analysis (Table 2), the known composition of the char, and the reaction paths (Figure 2). The values obtained for the two fuels are given in Figure 2.
During char steam gasification, the sulfur can either be retained in the ashes (sulfur self-retention) or emitted in the gas phase as H2S before eventually forming SO2 when it reacts with the OC. Experimental studies with coal report that around 75% of the sulfur initially present in the coal is emitted in the gas phase during fuel devolatilization and char steam gasification [15,16]. This value of 75% is used in Section 4 to calculate the amount of sulfur in the coal that is ultimately emitted as SO2. Regarding petcoke, no sulfur self-retention is expected to take place due to the specific characteristics of the ashes generated by this fuel [38].
Regarding nitrogen in the fuel, several studies show that the NH3 emitted when the fuel is devolatilized and when the char is gasified is transformed into N2 or NO when it reacts with the OC. However, the reported fraction of nitrogen emitted as NO varies greatly from one study to another. Indeed, Mendiara et al. reported that 1% of the nitrogen in the fuel forms NO in an iG-CLC process [16]. However, on the other hand, they observed that 20% of the nitrogen is transformed into NO during chemical looping with oxygen uncoupling (CLOU) [17]. Linderholm et al. reported that 7% of the nitrogen in the fuel is transformed into NO [15]. In Section 4, the conservative hypothesis (i.e., worst case scenario) is made that 20% of the NH3 produced by the fuel devolatilization and the steam gasification of the char is transformed into NO by its reaction with the OC.
3. Process Model and Simulations
The process simulations were performed with Aspen Plus® (version 9). The complete flowsheet representation of the considered CLC power plant is shown in Figure 3.
The power plant is divided into four blocks in the current model: the CLC itself, the gas cleanup units, the CO2 compression train, and the steam cycle. Each of these blocks are detailed in this section. The aim of the current model is to calculate the flow rate, the composition, and the temperature of different streams in the process (including the inlet streams of fuel steam and air). Then, this model can be used for sensitivity analysis (see Section 4), process optimization, heat integration, and further design and economical evaluations. The simulated power plant had a capacity of 525 MWth with a captured CO2 quality based on the requirements for CO2-EOR.
3.1. CLC-Block
The FR and the CS are modeled by three reactors in series. First, it is assumed that the solid fuel goes through full volatilization (i.e., until only the char defined in Figure 2 remains). This volatilization is modeled by an RYield reactor using the data presented in Figure 2. The char is represented by a nonconventional component composed of C, H, N, S, and ash. In the next step, steam gasification of the char and the reactions with the OC are modeled in two RStoic reactors in series. The first reactor represents the reactions taking place in the FR, and the second one represents the reactions taking place in the CS. The conversion of the steam gasification of the char is fixed to 0.5 in the FR and to 0.1 in the CS, while the conversions of all other reactions are fixed to 1.
The AR is also modeled by an RStoic reactor. The extent of the OC oxidation by the air is fixed by the sizing of the OC loop (see below). The char particles reaching the AR with OC particles (OC-RED stream, see Figure 1), the amount of which depends on the efficiency of the CS, are then fully burned by air. This combustion leads to NO and SO2 in the AR flue gas.
The temperature at the outlet of the FR is set at 950 °C to have a good compromise between a need for high temperature to obtain sufficient conversions (and therefore residence times leading to reasonable reactor dimensions) and an upper limit to maintain conventional refractory technologies. A value of 3% is chosen to account for the heat loss of the reactor systems, as in [37]. The Aspen Plus® built-in thermodynamic database is used to evaluate the heat of each chemical reaction.
The streams’ separations that take place in the splitter, in the CS, and in the FR cyclone are modeled by a Separator, whereas the AR cyclone is modeled by a Ssplit unit. In Section 4, 2/3 of the OC is recycled to the AR by the splitter. The separation efficiencies of the cyclones and the CS are given in Table 4. Values using typical correlations from the literature are used for the cyclones [39,40]. The efficiency of the particle separation in the CS is based on experimental results [24]. As some oxygen carrier leaves the reactors with the flue gases via the cyclones, a makeup flow of OC (calculated by the model) is needed to keep a constant amount of OC in the process.
The parametric method used to evaluate the thermodynamic properties of the different streams in the CLC block is RK-SOAVE. Because of the presence of gas, oxygen carrier (modeled as a conventional solid), and of nonconventional solids (coal, petcoke, ash, etc.), the stream class MIXCINC is used. A large effort is thus made to properly represent the complexity of the solid fuels rather than use simplified approaches using elemental carbon.
3.1.1. Sizing of the Fuel Injection and OC Loop
Based on the fuel LHV and on the plant’s expected thermal power, the wet fuel injection flow rate, (kg/s), is evaluated as:
with Power being the expected thermal power of the simulated unit (as mentioned in the introduction, the value of 525 MWth is used in Section 4), LHVdb being the lower heating value of the fuel on a dry basis (MJ/kg), and being the fuel water content (wt. ar).
The oxygen consumption per unit of time in the FR and CS, , is equal to the mass flow rate of oxidized species at the inlet of the FR minus the mass flow rate of oxidized species at the outlet of the CS. Due to kinetic and mechanical stability-related reasons, only a fraction of the available oxygen in the OC is used in the FR. Thus, the OC is injected in excess in the FR. The extent of the OC excess is characterized by the parameter , which is called the actual oxygen transport capacity of the OC (kgO/kgOC). This parameter is defined as the product of two terms: , the oxygen transport capacity of the fully oxidized OC (kgO/kgOC, see Table 3) and , the OC conversion at the inlet of the FR minus the OC conversion at the outlet of the CS. The OC conversion in a given stream j, Xj, is defined as:
with being the mass flow rate of the OC in the stream (kg/s) and and being the mass flow rates of the same amount of OC when it is completely reduced and completely oxidized (kg/s), respectively.
, a known property of the OC, is equal to 0.0261 kgO/kgOC (see Table 3) for the selected oxygen carrier. Based on experimental results obtained on a 10 kWth unit [24], a value of 0.75 is set for , whereas the OC conversion at the inlet of the FR is fixed to 0.99.
The flow rate and the composition of the OC stream entering the FR (stream OC-OX in Figure 1) are linked to the oxygen consumption in the FR and the CS, as well as to the values of and of the OC conversion at the inlet of the FR. Because partially oxidized particles of Cu-based OC are composed of not only CuO and Cu (the oxygen transporting species) but also of Al2O3, the flow rate of each of these three components must be evaluated. In the model, they are calculated using the following equations:
with being the total mass of copper entering the FR per of unit time (in the form of Cu or CuO), being the mass fraction of elemental copper in the completely oxidized OC particles, being the mass flow rate (kg/s) of species entering the FR (stream OC-OX in Figure 1), being the OC conversion at the inlet of the FR, being the molar mass of species (kg/kmol), and being the kg of Al2O3 per kg of copper in the OC particle (kgAl2O3/kgCu).
At every iteration of the simulation by Aspen Plus®, the calculations made in the reactors defining the FR and the CS are used to evaluate . Then, based on the fixed values of and of the OC conversion at the inlet of the FR, the flow rate and the composition of the OC stream entering the FR are calculated to fix the expected conversion of the AR. Accordingly, the specification is met even in the presence of residual partially oxidized gaseous species in the flue gas and of char loss to the AR.
3.1.2. Inlet Streams
The air injection flow rate into the AR is calculated by the model based on a given O2 residual concentration at the outlet of the AR (a molar fraction of 0.2 is used in Section 4). As mentioned above, the fuel inlet flow rate in the FR is set by the plant’s expected power and the fuel’s lower heating value. The flow rate of steam into the FR is set to achieve full gasification of the char based on the stoichiometry described in Figure 2. As part of the heat integration effort described in Section 3.4, the steam is produced by heat extraction from the AR flue gas.
In the FR, the fuel is introduced at the ambient pressure and temperature (15 °C and 1.01 bar are used in Section 4). The steam is introduced at a temperature and pressure fixed by the user of the model. The values of 150 °C and 2.0 bar are used in Section 4. In the AR, the air and the new OC are introduced at the atmospheric temperature and at a fixed pressure of 1.3 bar. The pressure drops are calculated based on a previous experimental work [41].
3.2. Flue Gas Cleanup Units
In the current model, conventional flue gas treatment technologies are adapted to the CLC application and simulated. The expected quality of the AR and the FR flue gas are fixed by the user, and the model calculates the specificities of the cleanup units based on the defined specifications. In Section 4, the data given in Table 1 (DYNAMIS study, the maximum values are considered) are used regarding the requirements of the CO2 stream. Regarding the particulate matter (AR or FR flue gas), its maximum concentration in flue gas is set to 20 mg/Nm3dry,6%O2 at standard conditions (1 atm and 273.15 K) [42].
Concerning the AR flue gas, only particulate capture is considered in the model. Indeed, even if some char is burned in the AR, the calculation results show that it leads to NO and SO2 emissions below the maxima recommended by the 2010/75/EU directive (max of 200 mg/Nm3 for SO2 and 150 mg/Nm3 for NOx) [42]. Concerning the FR flue gas and particulate capture, deNOx and deSOx are considered in the following order: deNOx, particulate capture, and deSOx.
3.2.1. Dedusting Unit
The model calculations show that the cyclones (based on their efficiencies and as detailed in Section 4) are not sufficient to meet the required solid load limitations in the flue gases from the AR and the FR. Therefore, particulate capture devices must be installed to treat these flue gases. For new units that need to meet stringent capture levels with high reliability, the selection is typically limited to electrostatic precipitators (ESP) and fabric filters [43]. Fabric filters are used where high-efficiency particle collection is required. In the CLC case, however, in regard to the capture efficiency needed, electrostatic precipitators seem to suffice.
In the process model, an ESP represented by a Ssplit unit in Aspen Plus® is used for each of the two flue gases. The temperatures of the flue gas at the inlets of these two ESP are parameters whose values are fixed by the user. Consequently, the model computes the amounts of heat to be extracted in the upstream exchangers to reach these desired temperatures. From an energetic point of view, these temperatures must be as low as possible because a decrease in these temperatures corresponds to an increase of the energy extracted from the flue gases and, hence, provided to the steam cycle. On the other hand, because of the presence of SO2 in the FR flue gas, the temperature at the inlet of the ESP must be high enough to avoid acid condensation, which is damaging to the pipes. Consequently, the ESP inlet temperature for the FR flue gas is set to 180 °C in Section 4, the minimal temperature at which it is generally accepted in the power industry [44]. The ESP inlet temperature is set to 110 °C for the AR flue gas in Section 4, as almost no SOx are expected in the AR flue gas. Efficiencies of 99.9% and pressure drops of 0.025 bar are used for both the AR and the FR ESP [43,45].
3.2.2. Denitrification Unit
In conventional combustion plants, the two main technologies used for NOx capture are selective noncatalytic reduction (SNCR) and selective catalytic reduction (SCR). In both cases, aqueous ammonia or urea is injected in the conventional flue gas to reduce the NOx species, thus resulting in the following chemical reaction: NO + NH3 + 1/4 O2 → N2 + 3/2 H2O.
The typical capture efficiency of SNCR is between 30% and 70% [46]. In the presence of a catalyst, however, the capture can theoretically reach 100% even if it is rarely more than 90–95% [46,47]. The amount of NH3 injected is an important operating parameter as NH3 slip (i.e., NH3 passing through the reactor) can cause severe corrosion problems. Regarding the capture efficiency needed in the CLC case, SCR seems to be an adequate technology. However, this hypothesis must be validated by experimental tests because the FR flue gas does not contain free oxygen, which is needed in the conventional deNOx reaction scheme. Hence, to treat the FR flue gas of a CLC plant by SCR, oxygen must be supplied to the treatment unit. As shown in Figure 3, in this work, SCR is considered for deNOx of the FR flue gas and is modeled by an RStoic reactor with three inlets: the flue gas to be treated, aqueous ammonia and compressed air bringing the required O2. Before injection into the SCR reactor, the pressure of the air is increased in a compressor. The NO conversion in the RStoic reactor (i.e., the NOx capture efficiency) is calculated by the model such that the CO2 quality requirements regarding NOx are respected. Other specifications, such as the temperature (typically above 300 °C) and the ammonia concentration in the aqueous solution (29.4 %wt), are chosen according to values typically found in conventional deNOx units [46]. Based on the amount of NO present in the flue gas, the stoichiometry of the reaction, and the desired conversion, the model evaluates the flow rates of aqueous ammonia and air to be injected into the SCR.
Plenty of studies report on SCR with conventional flue gas, but none mention its application to typical CLC flue gas. Therefore, further experimental and detailed modeling works are needed on the deNOx reaction for development and industrialization of the CLC technology.
3.2.3. Desulfurization Unit
Most of the SOx capture technologies are based on the reaction of SO2 with alkaline- and alkaline earth-based sorbents. Among the available sorbents, limestone and lime are the most frequently used because of their low cost, large availability, and versatility. Wet flue gas desulfurization (wet-FGD) is the most common SO2 control technology with a share of over 80% of the total installed worldwide FGD capacity [48]. In this technology, an alkaline aqueous slurry is put into contact with the flue gas containing SO2 in an absorption tower. The SO2 dissolves in the slurry and initiates the reaction with the alkaline particles, usually limestone particles [49]. The slurry exiting the absorber is then held in a reaction tank, which provides retention time for the limestone particles in the slurry to complete the reaction with the dissolved SO2 [49], thus yielding the following global reaction: SO2 + CaCO3 + 2 H2O + 1/2 O2 → CaSO4·2H2O + CO2.
The produced gypsum is then separated and dewatered, and the slurry is recirculated in the absorption tower. With the combination of the long residence time in the reaction tank and of the slurry recirculation in the absorption tower, wet-FGD generally works with a Ca/S ratio above 1 [50].
In conventional wet-FGD systems, the reaction tank is located at the bottom of the absorption tower. Since gypsum formation requires oxygen, air is injected into the reaction tank. Wet-FGD application to CLC flue gas would entail the use of a detached oxidation tank to avoid the dilution of the CO2 by the air as suggested for oxycombustion plants [51]. Also, because of the high CO2 and SO2 content of CLC flue gas compared to air-firing conditions, conventional wet-FGD chemistry might be affected.
The representation of the wet-FGD unit in the model is shown in Figure 3. The absorber pressure drop is set to 0.015 bar [52] and its temperature to 70 °C [51]. The absorber is modeled by the combination of a Flash unit, used to evaluate the condensation of water contained in the flue gas induced by the decrease of the temperature between the ESP and the absorber, and by a Separator, which send to the reaction tank the amount of SO2 to be captured with respect to the requirements. The reaction tank is modeled by an RStoic reactor that calculates the amount of limestone slurry and air to be injected in the FGD according to the global reaction mentioned above, expressing the formation of gypsum from SO2, limestone, water, and oxygen. Limestone slurry and air are injected in this reactor after being compressed in a pump and a compressor, respectively. The outlet of the tank is led to a Flash unit representing the intrinsic gas-and-slurry separation taking place in the tank. The slurry collected is then sent to a Separator that models the aqueous cyclone used to collect the formed gypsum. The limestone slurry water content is set to 70%wt [53], and its injection pressure is set to 2.21 bar [54].
In the model, no slurry recirculation is defined. Therefore, to predict the power consumption associated with slurry recirculation ( in kW), the following approximation is done:
with being the gas molar flow rate entering the absorber (kmol/s), being the ideal gas constant, and being the normal temperature (273.15 K) and pressure (101,325 Pa), respectively, being the volumetric flow rate of limestone slurry (m3/s), being the power of the limestone slurry pump (kW), and being the liquid to gas ratio of the absorber, which was set according to [51].
Even though no publication focuses on the application of wet-FGD to CLC flue gas, there have been a few experimental and modeling studies, as well as measurements in a large-scale pilot facility, investigating the application of wet-FGD to oxycombustion exhaust [51,55,56]. Experiments in the large-scale pilot facility of Schwarze Pump (Germany), with SO2 concentration varying from 8000 to 11,500 mg/Nm3dry, showed a removal of SOx of more than 99%, producing gypsum of high quality (more than 95%wt. purity) [56]. Similar results can be expected in the case of wet-FGD application to CLC flue gas. However, as for the SCR, tests in a laboratory should be undertaken to confirm that the specificities of the CLC flue gas (such as the absence of free O2) does not hinder the operation of the conventional FGD process, even though experiments performed on flue gas from oxycombustion units seem promising.
3.3. CO2 Compression Train
The FR flue gas that exits the wet-FGD is clean of pollutants and of particles. However, its water content is still high, and CO2 needs to be compressed for transportation and storage. In the modeled plant considered in this work, to reach the required pressure, the FR flue gas goes through a compression train composed of three series of consecutive coolers (represented by Heaters), separation units (represented by Flash units) and compressors (see Figure 3). Then, the CO2 stream goes through a dehydration unit modeled by a Separator to ensure that its water fraction does not exceed the recommended limit (see Table 1) to prevent hydrate formation during transport. The model evaluates the required dehydration efficiency to reach this limit. Finally, the CO2 is compressed and cooled to its final temperature and pressure. In the first three coolers, the CO2 is cooled down to 30 °C, and the conservative assumption of a pressure drop of 3% of the inlet pressure is considered [57]. For the four stages of compression, compressor efficiencies of 0.869, 0.879, 0.847 and 0.84 are used, respectively [58]. A pressure ratio of 4.3 is used for stages 1 and 2, and a pressure ratio of 2.5 is used for stage 3 [59].
Because the parametric method used for the CLC block does not allow for proper representation of the thermodynamic properties of the supercritical CO2, the LK-PLOCK method is used in the CO2 compression train. The transition from one method to another is done in a Heater.
3.4. Process Heat Integration and Steam Cycle
A supercritical steam cycle is included in the modeled plant considered in this work. The decoupling of the gas exhausts specific to the CLC technology (CO2 and H2O exiting the FR while O2 depleted air exiting the AR) as well as the various beds of hot solids (AR, splitter, FR and CS) multiply the possibilities of heat integration. Thus, different scenarios for steam cycle design were tested, and the one with the largest net electricity production was included in the model and is presented in Section 4.
This steam cycle is shown in blue in Figure 3. The AR (combined with the splitter) and the FR (combined with the CS) are both equipped with a set of two similar heat exchangers (referred to as solid-HX), one in the reactor itself and one in the splitter or CS. Moreover, each flue gas goes through three similar heat exchangers (referred to as FG-HX).
First, the high-pressure boiler feedwater is split in two equal fluxes. One flux goes through the third heat exchanger with the AR flue gas (FG-HX AR#3), then through the first heat exchanger with the AR flue gas (FG-HX AR#1), and then through the heat exchanger in the splitter (solid-HX AR#2), while the other flux goes through the third heat exchanger with the FR flue gas (FG-HX FR#3), then through the heat exchanger in the CS (solid-HX FR#2) and then through the first heat exchanger with the FR flue gas (FG-HX FR#1). Then, the two fluxes are combined and led to the high pressure (HP) turbine inlet. The stream at the outlet of the HP turbine is then reheated through different heat exchangers and sent back to the turbine. At the outlet of the turbine, the steam is condensed in a condenser and then pumped to the desired pressure to regenerate feedwater. Heat integration is critical to improve overall system efficiency. This is carried out through multiple bleeds and reheating [60].
To take advantage of the heat available at low temperatures, the recycled flue gas (from the FR, see Figure 1) is preheated through an exchange of heat with the AR flue gas, while the combustion air is preheated first through a heat exchange with the FR flue gas and then through a heat exchange with the AR flue gas.
The high-pressure steam first enters the turbine at 600 °C and 270 bar while the reheated steam enters it at 600 °C and 58 bar. The flow rate of the boiler feedwater is notably adjusted by the model to ensure that a temperature of 600 °C is reached for these two fluxes. The steam exits the turbine at 50 mbar and exits the condenser at 48 mbar. A pressure drop of 0.015 bar is used on the gas side of each of the heat exchangers. A pressure drop equal to 1.5% of the inlet pressure is used on the feedwater side of the different FG-HX, and a pressure drop equal to 2.0% of the inlet pressure is used on the feedwater side of the different solid-HX. The values given in this paragraph come from the European project CAESAR [57] and from Romeo et al. [60].
The turbine efficiencies, as well as the pump and compressor efficiencies, are taken from the guidelines published by the project CAESAR [57].
The heat exchangers on the flue gases and the solid beds are modeled by HeatX units, whereas the heat exchangers between the bleeds and the feedwater are modeled by MheatX units.
Because the parametric method used for the CLC block does not properly model the thermodynamic state of the supercritical steam, another parametric method, STEAMNBS, is used.
For each heat exchanger, an efficiency, temperature decrease, or an outlet temperature is defined to achieve the different temperatures specified previously (temperature in the FR, temperatures of the flue gases at the inlets of the ESP, etc.).
3.5. Model Parameters
As detailed previously, to simulate the model, the values of several parameters must be specified by the user. They are summarized and classified based on their nature in Figure 4.
The first class of parameters depends on the plant itself. It accounts, for example, for the ambient temperature and pressure, the emission limits to the atmosphere, etc. Other classes regroup the parameters characterizing the OC and those characterizing the fuel, the parameters associated with the reactors design, those associated with the equipment characteristics, etc.
3.6. Results Post-Treatment
Based on the simulation results, all the process inlets and outlets can be characterized. This information is essential to the evaluation of the process CAPEX and OPEX. Based on the heat transferred in the heat exchangers and on the work produced by the turbines and consumed by the pumps and compressors, the plant energy balance can be evaluated. Knowing the net electric production, the plant CO2 specific emissions (kgCO2/kWh) is calculated as:
Equation 8 gives the ratio of the mass of CO2 emitted to the atmosphere per unit of time, equal to the molar flux of CO2 in the oxygen-depleted air exiting the AR () plus the molar flux of CO2 in the gas leaving the FGD () times the molar mass of CO2 () to the net electric production per unit time. The CO2 emitted by the AR is due to the imperfect unreacted char separation occurring in the CS (and, consequently, on the char burned in the AR), whereas the CO2 emitted by the FGD is due to limestone decomposition. By comparing the plant-specific CO2 emissions with the one of a reference plant without carbon capture, the extent of CO2 avoided can be evaluated as:
The reference value used in this study for is 0.7621 kgCO2/kWh. It corresponds to a pulverized boiler with a net efficiency of 44% [61]. The carbon capture efficiency is another indicator used in this study, which consists of the ratio of the total CO2 captured by the plant (not emitted to atmosphere) to the total carbon inlet (both per unit of time).
4. Results and Discussion
4.1. Simulation Results Analysis
The simulation results, obtained using the values of the different input parameters mentioned in the previous sections, are presented in this section. Different calculated process inlets (i.e., inlet flow rates), process outlets (i.e., outlet flow rates and compositions, etc.), process characteristics (i.e., flow rates, CO2 emission characteristics, etc.), and heat integration are successively shown and discussed. The results regarding energy balances are presented and discussed in Section 4.2.
4.1.1. Plant Inlets
The processes inlets evaluated by the simulation are listed in Table 5. The consumption of the oxygen carrier is one of the main CLC process chemicals’ requirements. Based on the cyclone efficiencies given in Table 4, the simulation predicts that an OC makeup inlet flow of around 1 t/h is needed in the 525 MWth unit. This emphasizes the importance of the development of low-cost oxygen carriers for the rentability of a CLC process. Moreover, the results show that steam production consumes 5.4 MWth in the coal case and 22.8 MWth in the petcoke case, representing 1% and 5% of the total heat generated, respectively. These results highlight the importance of the optimization of the process and its design in the improvement of the overall system’s energetic performance.
Char gasification and reactor fluidization are not the sole water consumers. In addition, water is consumed for cooling tower makeup [62] (not included in the model) and in the deSOx units (consumption of 3.3 t/h in the coal case and of 15.8 t/h in the petcoke case). Furthermore, 1.4 t/h of limestone and 0.9 t/h of aqueous ammonia are consumed by the deSOx and deNOx units in the coal case, and the limestone consumption increases to 6.8 t/h in the petcoke case. The flue gas cleanup is therefore possibly a substantial source of OPEX. Finally, to satisfy the oxygen needs of the process, a total of 676 t/h of air is injected in the coal case, total increasing to 695 t/h in the petcoke case.
4.1.2. Plant Outlets
The calculated process outlets are given in Table 6. They outline that large amounts of water, more than 25 t/h, are recovered from the CO2 compression train for both fuels. In the coal case, this water flow is large enough to meet the process’s requirements for steam and FGD water (see Table 5 and Section 4.1.3 below). In the petcoke case, however, the produced water is not sufficient for autoconsumption (see Table 5 and Section 4.1.3 below). Since the water used for the gasification is regenerated in the FR, this shortage is due to the large amount of water that condenses in the FGD absorber and is collected, contaminated with solids, at the outlet of the FGD aqueous cyclone.
Table 6 shows that another big difference between the coal and the petcoke cases are the amounts of solids collected in the ESP. Indeed, because of the large ash content of the coal, ten times more solids are trapped in the ESP for the coal case than in the ESP for the petcoke case.
Finally, because of the higher sulfur content of the petcoke compared to the coal, and because of its lower fuel single-pass conversion, a larger amount of char reaches the AR, thus leading to higher SO2 emissions into the atmosphere. Therefore, efforts should be made to increase the fuel’s single-pass conversion in the FR, as well as to improve the CS char separation efficiency.
4.1.3. Resulting Process Characteristics
Indicators of the efficiency with which carbon is sequestrated in the CLC are given in Table 7. As mentioned above, a larger amount of char reaches the AR in the petcoke case than in the coal case, affecting not only the SO2 emissions, but also the carbon capture efficiency, which decreases from 96.4% for the coal case to 93.9% for the petcoke case. Nevertheless, the extent of CO2 avoided is still high with more than 92% less CO2 emitted with CLC than with conventional technologies without capture.
Selected process parameters evaluated based on the simulation results are given in Table 8. “OC to fuel inlet” is the ratio of the amount of oxygen carrier (from the AR) injected into the FR to the amount of fuel (coal or petcoke) injected in this FR. The values of this ratio show that the amounts of OC introduced in the FR are approximately 100 times larger than the ones of the fuel (as a reminder, the fuel injection rates in the FR are approximately equal to 75 and 60 tons per hour in the coal and petcoke cases, respectively; see Table 5). This shows the importance of OC development with higher oxygen transfer capacity.
Since the fuel’s single-pass conversion is not complete, unreacted char remains at the outlet of the FR. The unreacted char, which is separated from the bulk of the reduced OC in the CS, is thus reinjected in the bottom of the FR bed (FR-REC in Figure 1). However, because the OC-char separation efficiency in the CS is not 100% (see Table 4) and because of the very large amount of OC that circulates in the CLC block, the results given in Table 8 show that the major solid component of this recirculation is the oxygen carrier itself, with a flow rate of around 1100 t/h in both cases. Indeed, the char and ashes only account for around 3% and 23% of the solid in the coal case and 5% and 1% in the petcoke case, respectively. What Table 8 also shows is that, even though ashes accumulate in the beds, especially in the coal case, their content in the stream of oxidized oxygen carrier flowing from the AR to the FR is still small, reaching only 0.05%wt. in the coal case. However, a very large amount of OC entering the FR also means that the fuel would be scarce in the FR-bed compared to the bulk of OC, as 100 tons of OC are injected in the FR per ton of fuel, though this value does not consider the OC brought by the FR recirculation.
Finally, we can mention that the simulation results show that, to reach NOx and SOx contents of less than 100 ppmv in the final CO2 stream, NOx and SOx capture efficiencies of 97.1% must take place in both FG cleanup units in the coal case. These efficiencies are 97.1% for NOx and 99.4% for SOx in the petcoke case. These values are higher than conventional removal efficiencies. This will thus require further investigation. On the other hand, because the NOx and SOx are concentrated in the FR flue gas and not diluted in nitrogen from the air, the flue gas volumetric flow rate to be treated is greatly reduced when compared to conventional technologies and could therefore be handled in smaller cleanup units. Furthermore, contrary to emissions to the atmosphere which must be below the limit set by the local directive, NOx and SOx quality requirements in the final CO2 can vary with the final use of the CO2.
4.1.4. Heat Integration
To evaluate the extent of the process heat integration, the composite curves of the hot and the cold streams were built and are presented in Figure 5. They show that a cold utility of around 290 MWth is consumed in the process. This corresponds to the sum of the cooling needs of the condenser of the steam cycle and of the intercoolers placed along the CO2 compression train.
Figure 5 also shows that, while the heat available at low temperature is used efficiently (which is represented by a small difference between the hot and the cold curves), the heat available at high temperature is not. This is due to the temperature limitations intrinsic to the use of a steam cycle. In the power production sector, the closed Brayton cycle with supercritical CO2 has recently attracted a lot of attention [63,64,65,66]. Replacing the Rankine cycle working with steam by a closed Brayton cycle with supercritical CO2 as the working fluid could, among other benefits, allow the cold-side temperature to be increased to 800 °C [65,67].
The shape of the hot composite curve at high temperatures, which is almost flat at more than 900 °C, is the result of the large heat exchange taking place within the solid-dense environments of the splitter and CS. Because the OC particles have a heat capacity much larger than the flue gas, it leads to large heat exchanges in the splitter and CS without significantly impacting the temperature of the solid. When heat is extracted from the flue gas, on the other hand, the temperature drops very quickly. This large amount of heat available at high temperatures is thus a great advantage of the CLC technology.
4.2. Energy Balance
The process energy balances are represented as Sankey diagrams in Figure 6 and are given in Table 9. Both fuels show similar net efficiencies of 38% as well as a similar extent of thermal power transferred to the steam cycle (466 MWth in the petcoke case and 468 MWth in the coal case). These similarities are surprising because the petcoke case implies a larger flow rate of steam than the flow rate observed in the coal case. Looking at the global process, these results can be explained by the fact that the higher amount of steam needed to be produced in the petcoke case allows the AR FG temperature at the outlet of the steam production exchanger to be as low as 110 °C, whereas it cannot go below 126 °C in the coal case without creating a temperature crossover in the exchanger. The AR exhaust temperature to the atmosphere is therefore higher in the coal case (110 °C) than in the petcoke case (101 °C), thus leading to higher exhaust losses (see Figure 6). This extra heat extracted from the FG in the petcoke case allows it to reach similar efficiency as the one observed in the coal case.
Table 9 also shows the comparison of the resulting energy balances with those of similar studies. Since no study is available for comparison with the petcoke case, only the coal case is discussed here. In all studies, the CO2 was compressed to 110 bar with the exception of the study carried out by NETL, in which the CO2 was compressed to 150 bar. In addition, even in the case of CLC, different reactor configurations are used depending on the study. Indeed, Democlock studied a CLC process composed of an integrated gasification combined cycle (IGCC) producing syngas that is then burned in a packed bed CLC reactor. On the other hand, the NETL study is based on a process flowsheet similar to the one of this study. The CAPEX associated with the different studies might therefore vary significantly. The net efficiency obtained in the current case is higher than that of NETL. This is mainly due to the lower-HP steam conditions (240 bar, 593 °C) used by NETL, which greatly affects the process efficiency. Another influencing parameter is the process optimization carried out in the current study. However, the efficiency obtained by the Democlock study is larger than the one obtained in this study. The principal difference lays in the integration of the CLC with a gasification combined cycle rather than with a simple steam cycle as considered in our work. In addition, there are some differences in the evaluation principles and technological modeling hypothesis, such as compressor efficiencies of 0.85 in the current study compared to 0.925 in the Democlock case. Nevertheless, when compared to the oxycombustion or postcombustion capture technologies, CLC not only exhibits one of the highest net process efficiencies, but also one of the highest carbon capture efficiencies. This is mainly due to the inherent CO2 separation taking place in CLC, making it a technology of choice for the combustion of solid fuels.
4.3. Sensitivity Analysis
A sensitivity analysis was performed to evaluate the effect of some key parameters on the predicted process performance. This analysis was performed for the petcoke case. To illustrate the effect of some parameters on the process efficiency, we have evaluated the expected thermal power (i.e., the value of the numerator of the right-hand side of Equation (1)) needed to reach the same net electricity production than in the reference case, after the modification of each of these parameters. The results are shown in Figure 7.
In most of the cases, the tested values (i.e., the different scenarios) are mentioned in Figure 7. The others are specified hereafter:
- The steam cycle conditions considered in the subcritical case were HP steam at 100 bar and 500 °C, IP steam at 43 bar and 540 °C, and LP steam at 6 bar.
- The ambient air temperature and water content were increased to 40 °C and 5.8%vol (or 80% relative humidity) in the wet summer case and decreased to 10 °C and 0.5%vol (or 40% relative humidity) in the dry winter case.
Figure 7 shows that the temperature and pressure of the steam in the steam cycle have the largest impact on the plant size. Indeed, to work with subcritical steam rather than supercritical, the expected thermal power of the plant must be 10% greater to produce the same amount of electricity. Other parameters with a significant impact on process efficiency include the FR flue gas water content, the AR flue gas oxygen content, and the CS char separation efficiency. For all these three parameters, the lower they are, the smaller the expected thermal power needed to produce a given amount of electricity.
Figure 8 presents the variation of the CLC-specific CO2 emissions related to the different scenarios analyzed in Figure 7. As mentioned previously, decreasing the CS char separation efficiency and the fuel single-pass conversion rate decreases the size of the power plant needed for a given electricity production rate. However, Figure 8 shows that they are also associated with a significant increase in specific CO2 emissions. This is because both the CS char separation efficiency and the fuel single-pass conversion affect the amount of char reaching and, thus, burning in the AR. This highlights how critical the CS design is, even though a less-efficient char separation leads to a higher process efficiency. It should also be reminded that limits on emissions to the atmosphere must not be exceeded or else pollution capture units will have to be installed on the AR outlet, thus leading to a significant CAPEX increase. Regarding the other scenarios, an increase in the power plant size is always associated with an increase of process-specific CO2 emissions.
5. Conclusions
A process model of a 525 MWth CLC power plant was built covering all unit operations, including the reactors, the flue gas treatment units, the heat integration, the compression train, and the steam cycle. A rigorous representation of the solid fuels and of the oxygen carrier was performed. Flue gas compositions obtained with this model showed that flue gas cleanup units are mandatory to comply with CO2 quality requirements. The treatment of the FR flue gas (captured CO2 stream) by conventional industrial methods was studied. Specific characteristics of the FR flue gas, including the absence of free oxygen and high pollutant concentrations due to the absence of diluting nitrogen, especially in the petcoke case, were identified as main development issues to be addressed. On the other hand, the captured CO2 stream had a small flow rate compared to conventional technologies thanks to the absence of nitrogen dilution. This allows for potentially smaller process units compared to conventional power plants with similar fuels. Petcoke was the reference case fuel in this study.
The model predicted a CO2 capture efficiency of 94% in the petcoke case, compared to 96% for the coal case. As for the resulting energy balance, a process net efficiency of 38% in both the coal and petcoke cases was calculated, despite the higher gasification needs associated with petcoke. The comparison of these results with other available carbon capture technologies shows that CLC exhibits one of the highest net plant efficiencies and carbon capture efficiencies. CLC is thus a very promising technology that can result in the production of clean energy from solid feeds such as petcoke. Finally, based on the results of the sensitivity analysis, it was shown that process efficiency is greatly affected by the design and the performance of the CLC furnace itself, which are both expressed by the steam gasification needs, excess air, CS char separation efficiency, reactor pressure drops, and fuel and gas single-pass conversions. The results of this work will allow definition of optimum operating windows for each section of the CLC plant to achieve optimum overall system performance. These results will then be used as targets to develop individual sections, such as reactor pressure drops or CS. In addition, further work is needed on flue gas treatment technologies, mainly deNOx and deSOx, regarding the level of abatement needed for CCUS application as well as the specificities of CLC flue gas compared to conventional combustion plants.
Author Contributions
Conceptualization: all authors; methodology: all authors; software: O.V.; validation: M.Y., F.G. and S.B.; formal analysis: all authors; investigation: O.V.; resources: M.Y., F.G. and S.B.; writing—original draft preparation: O.V.; writing—review and editing: M.Y. and B.H.; supervision: M.Y. and B.H. All authors have read and agreed to the published version of the manuscript.
Funding
This research received no external funding.
Conflicts of Interest
The authors declare that they have no known competing financial interest or personal relationships that could have appeared to influence the work reported in this paper.
Abbreviations
| Acronym | Definition |
| AR | Air reactor |
| ar | As received |
| BECCS | Bioenergy with carbon capture and storage |
| BFW | Boiler feedwater |
| CAPEX | Capital expenditure |
| CC | Carbon capture |
| CCS | Carbon capture and sequestration |
| CFB | Circulating fluidized bed |
| CLC | Chemical looping combustion |
| CLOU | Chemical looping combustion with oxygen uncoupling |
| CS | Carbon stripper |
| db | Dry basis |
| deNOx | Denitrification |
| deSOx | Desulfurization |
| EOR | Enhanced oil recovery |
| ESP | Electrostatic precipitator |
| Fb | Freeboard |
| FCC | Fluid catalytic cracking |
| FG | Flue gas |
| FGD | Flue gas desulfurization |
| FG-HX | Heat exchanger on the flue gas |
| FR | Fuel reactor |
| FR-REC | Stream of solid recycled exiting the fuel reactor cyclone and recycled to its bed |
| FSI | Furnace sorbent injection |
| HHV | Higher heating value |
| HP | High pressure |
| HX | Heat exchanger |
| iG-CLC | In situ gasification chemical looping combustion |
| IGCC | Integrated gasification combined cycle |
| IP | Intermediate pressure |
| LHV | Lower heating value |
| LP | Low pressure |
| MEA | Monoethanolamine |
| NETL | National Energy Technology Laboratory |
| OC | Oxygen carrier |
| OC-NEW | Stream of fresh oxygen carrier at the inlet of the AR |
| OC-OX | Stream of oxidized carrier entering the fuel reactor |
| OC-RED | Stream of reduced oxygen carrier exiting the carbon stripper |
| OPEX | Operational expenditure |
| PCC | Pulverized coal combustion |
| PM | Particulate matter |
| R0 | Oxygen transfer capacity of the oxygen carrier (kgO2/kgOC) |
| R0ΔX | Working oxygen transfer capacity of the oxygen carrier (kgO2/kgOC) |
| SC | Steam cycle |
| SCR | Selective catalytic reduction |
| SNCR | Selective noncatalytic reduction |
| solid-HX | heat exchanger in a solid fluidized bed |
References
- Figueroa, J.; Fout, T.; Plasynski, S.; McIlvried, H.; Srivastava, R. Advances in CO2 capture technology—The U.S. Department of Energy’s Carbon Sequestration Program. Int. J. Greenh. Gas Control 2008, 2, 9–20. [Google Scholar] [CrossRef]
- Leung, D.; Caramanna, G.; Maroto-Valer, M. An overview of current status of carbon dioxide capture and storage technologies. Renew. Sustain. Energy Rev. 2014, 39, 426–443. [Google Scholar] [CrossRef] [Green Version]
- Abad, A.; Adánez, J.; Gayán, P.; de Diego, L.; García-Labiano, F.; Sprachmann, G. Conceptual design of a 100 MWth CLC unit for solid fuel combustion. Appl. Energy 2015, 157, 462–474. [Google Scholar] [CrossRef] [Green Version]
- Chen, L.; Kong, L.; Bao, J.; Combs, M.; Nikolic, H.; Fan, Z.; Liu, K. Experimental evaluations of solid-fueled pressurized chemical looping combustion—The effects of pressure, solid fuel and iron-based oxygen carriers. Appl. Energy 2017, 195, 1012–1022. [Google Scholar] [CrossRef] [Green Version]
- Lyngfelt, A.; Leckner, B. A 1000 MWth boiler for chemical-looping combustion of solid fuels—Discussion of design and costs. Appl. Energy 2015, 157, 475–487. [Google Scholar] [CrossRef] [Green Version]
- Pérez-Vega, R.; Abad, A.; Gayán, P.; de Diego, L.; García-Labiano, F.; Adánez, J. Development of (Mn0.77Fe0.23)2O3 particles as an oxygen carrier for coal combustion with CO2 capture via in-situ gasification chemical looping combustion (iG-CLC) aided by oxygen uncoupling (CLOU). Fuel Process. Technol. 2017, 164, 69–79. [Google Scholar] [CrossRef]
- Schmitz, M.; Linderholm, C. Performance of calcium manganate as oxygen carrier in chemical looping combustion of biochar in a 10 kW pilot. Appl. Energy 2016, 169, 729–737. [Google Scholar] [CrossRef]
- Vilches, T.; Lind, F.; Rydén, M.; Thunman, H. Experience of more than 1000 h of operation with oxygen carriers and solid biomass at large scale. Appl. Energy 2017, 190, 1174–1183. [Google Scholar] [CrossRef]
- Sun, L.; Lin, J.; Kong, D.; Luo, K.; Fan, J. Numerical Simulation of a 10 kW Gas-Fueled Chemical Looping Combustion Unit. Energies 2022, 15, 1973. [Google Scholar] [CrossRef]
- Zylka, A.; Krzywanski, J.; Czakiert, T.; Idziak, K.; Sosnowski, M.; de Souza-Santos, M.; Sztekler, K.; Nowak, W. Modeling of the Chemical Looping Combustion of Hard Coal and Biomass Using Ilmenite as the Oxygen Carrier. Energies 2020, 13, 5394. [Google Scholar] [CrossRef]
- Kumar, P.; Parwani, A.; Gupta, D.; Vitankar, V. Transient Cold Flow Simulation of Fast-Fluidized Bed Air Reactor with Hematite as an Oxygen Carrier for Chemical Looping Combustion. Appl. Sci. 2021, 11, 2288. [Google Scholar] [CrossRef]
- Li, M.; Zheng, T.; Mei, D.; Wang, B.; Ma, J. Selecting and Testing of Cement-Bonded Magnetite and Chalcopyrite as Oxygen Carrier for Chemical-Looping Combustion. Energies 2022, 15, 5093. [Google Scholar] [CrossRef]
- Nguyen, N.; Alobaid, F.; Dieringer, P.; Epple, B. Biomass-Based Chemical Looping Gasification: Overview and Recent Developments. Appl. Sci. 2021, 11, 7069. [Google Scholar] [CrossRef]
- Rydén, M.; Hanning, M.; Corcoran, A.; Lind, F. Oxygen Carrier Aided Combustion (OCAC) of Wood Chips in a Semi-Commercial Circulating Fluidized Bed Boiler Using Manganese Ore as Bed Material. Appl. Sci. 2016, 6, 347. [Google Scholar] [CrossRef] [Green Version]
- Linderholm, C.; Knutsson, P.; Schmitz, M.; Markström, P.; Lyngfelt, A. Material balances of carbon, sulfur, nitrogen and ilmenite in a 100 kW CLC reactor system. Int. J. Greenh. Gas Control 2014, 27, 188–202. [Google Scholar] [CrossRef]
- Mendiara, T.; Izquierdo, M.; Abad, A.; de Diego, L.; García-Labiano, F.; Gayán, P.; Adánez, J. Release of pollutant components in CLC of lignite. Int. J. Greenh. Gas Control 2014, 22, 15–24. [Google Scholar] [CrossRef] [Green Version]
- Pérez-Vega, R.; Adánez-Rubio, I.; Gayán, P.; Izquierdo, M.; Abad, A.; García-Labiano, F.; de Diego, L.; Adánez, J. Sulphur, nitrogen and mercury emissions from coal combustion with CO2 capture in chemical looping with oxygen uncoupling (CLOU). Int. J. Greenh. Gas Control 2016, 46, 28–38. [Google Scholar] [CrossRef]
- Krzywanski, J.; Czakiert, T.; Nowak, W.; Shimizu, T.; Zylka, A.; Idziak, K.; Sosnowski, M. Gaseous emissions from advanced CLC and oxyfuel fluidized bed combustion of coal and biomass in a complex geometry facility: A comprehensive model. Energy 2022, 251, 123896. [Google Scholar] [CrossRef]
- Abad, A.; Gayán, P.; Pérez-Vega, R.; García-Labiano, F.; de Diego, L.; Mendiara, T.; Izquierdo, M.; Adánez, J. Evaluation of different strategies to improve the efficiency of coal conversion in a 50 kWth Chemical Looping combustion unit. Fuel 2020, 271, 117514. [Google Scholar] [CrossRef]
- Chen, X.; Ma, J.; Tian, X.; Wan, J.; Zhao, H. CPFD simulation and optimization of a 50 kWth dual circulating fluidized bed reactor for chemical looping combustion of coal. Int. J. Greenh. Gas Control 2019, 90, 102800. [Google Scholar] [CrossRef]
- Luo, M.; Qin, Y.; Cai, J.; Qian, L.; Wang, S.; Zhang, H.; Zhou, L.; Liu, P. Sulfur release and migration characteristics in chemical looping combustion of high-sulfur coal. Process Saf. Environ. Prot. 2021, 151, 1–9. [Google Scholar] [CrossRef]
- Sedghkerdar, M.; Karami, D.; Mahinpey, N. Reduction and oxidation kinetics of solid fuel chemical looping combustion over a core-shell structured nickel-based oxygen carrier: Application of a developed grain size distribution model. Fuel 2020, 274, 117838. [Google Scholar] [CrossRef]
- Shen, T.; Wang, S.; Yan, J.; Shen, L.; Tian, H. Performance improvement of chemical looping combustion with coal by optimizing operational strategies in a 3 kWth interconnected fluidized bed. Int. J. Greenh. Gas Control 2020, 98, 103060. [Google Scholar] [CrossRef]
- Sozinho, T.; Pelletant, W.; Stainton, H.; Guillou, F. CLC Coal Combustion in a 10 kW Pilot Plant. In Proceedings of the AIChE Annual Meeting, Pittsburgh, PA, USA, 28 October–2 November 2012. [Google Scholar]
- Vin, N.; Bakoc, K.; Lambert, A.; Pelletant, W.; Bertholin, S. Chemical Looping Combustion of Petcoke Using Two Natural Ores in a 10 kWth Continuous Pilot Plant: A Performance Comparison. Energy Fuels 2022, 36, 9485–9501. [Google Scholar] [CrossRef]
- Yazdanpanah, M.; Forret, A.; Gauthier, T.; Delebarre, A. Modeling of CH4 combustion with NiO/NiAl2O4 in a 10 kWth CLC pilot plant. Appl. Energy 2014, 113, 1933–1944. [Google Scholar] [CrossRef]
- Zhou, L.; Deshpande, K.; Zhang, X.; Agarwal, R. Process simulation of Chemical Looping Combustion using ASPEN plus for a mixture of biomass and coal with various oxygen carriers. Energy 2020, 195, 116955. [Google Scholar] [CrossRef]
- Cabello, A.; Abad, A.; de las Obras Loscertales, M.; Bartocci, P.; García-Labiano, F.; de Diego, L. Exploring design options for pressurized chemical looping combustion of natural gas. Fuel 2022, 126983, in press. [Google Scholar] [CrossRef]
- Wang, Y.; Zhu, L.; He, Y.; Zhou, Q.; Hao, Q. Tech-economic assessment of chemical looping combustion coupled with the combined supercritical CO2 Brayton cycle and ORC for power generation. J. Taiwan Inst. Chem. Eng. 2021, 129, 197–206. [Google Scholar] [CrossRef]
- Glarborg, P.; Jensen, A.; Johnsson, J. Fuel nitrogen conversion in solid fuel fired systems. Prog. Energy Combust. Sci. 2003, 29, 89–113. [Google Scholar] [CrossRef]
- Cheng, M.; Sun, H.; Li, Z.; Cai, N. Annular Carbon Stripper for Chemical-Looping Combustion of Coal. Ind. Eng. Chem. Res. 2017, 56, 1580–1593. [Google Scholar] [CrossRef]
- Gauthier, T.; Guillou, F.; Hoteit, A.; Rifflart, S. Particle Separation Device for Chemical Looping Combustion Loop. WO2011151537 A3, 2012. Available online: http://www.google.be/patents/WO2011151537A3 (accessed on 14 December 2022).
- de Visser, E.; Hendriks, C.; Barrio, M.; Mølnvik, M.; de Koeijer, G.; Liljemark, S.; Le Gallo, Y. Dynamis CO2 quality recommendations. Int. J. Greenh. Gas Control 2008, 2, 478–484. [Google Scholar] [CrossRef]
- Jordanger, E. Final Report: DYNAMIS—Towards Hydrogen and Electricity Production with Carbon Dioxide Capture and Storage. 2009. Available online: https://cordis.europa.eu/project/id/19672 (accessed on 14 December 2022).
- NETL. CO2 Impurities Design Parameters. 2013. Available online: https://www.osti.gov/biblio/1566771 (accessed on 14 December 2022).
- White Rose, K. 01 Full Chain FEED Summary Report. 2016. Available online: https://assets.publishing.service.gov.uk/government/uploads/system/uploads/attachment_data/file/531384/K01_Full_chain_FEED_summary_report.pdf (accessed on 14 December 2022).
- Penthor, S.; Mattisson, T.; Adánez, J.; Bertolin, S.; Masi, E.; Larring, Y.; Langørgen, Ø.; Ströhle, J.; Snijkers, F.; Geerts, L.; et al. The EU-FP7 Project SUCCESS—Scale-up of Oxygen Carrier for Chemical Looping Combustion using Environmentally Sustainable Materials. Energy Procedia 2017, 114, 395–406. [Google Scholar] [CrossRef]
- Fan, X. The Fates of Vanadium and Sulfur Introduced with Petcoke to Lime Kilns. Ph.D. Thesis, University of Toronto, Toronto, ON, Canada, 2020. Available online: https://tspace.library.utoronto.ca/bitstream/1807/25572/1/Fan_Xiaofei_201011_MASc_thesis.pdf (accessed on 14 December 2022).
- Knowlton, T.M. Handbook of Fluidization and Fluid Particle Systems; CRC Press: Boca Raton: FL, USA, 2003; Chapter 22. [Google Scholar]
- Yang, W.C. (Ed.) Fluidization Solids Handling and Processing Industrial Applications; Noyes Publications: Park Ridge, NJ, USA, 1999; Chapter 12. [Google Scholar]
- Rodrigues, S.; Forret, A.; Montjovet, F.; Lance, M.; Gauthier, T. Riser hydrodynamic study with different Group B powders. Powder Technol. 2015, 272, 300–308. [Google Scholar] [CrossRef]
- Directive 2010/75/EU of the European Parliament and of the Council of 24 November 2010 on Industrial Emissions (Integrated Pollution Prevention and Control). Available online: https://eur-lex.europa.eu/legal-content/EN/TXT/PDF/?uri=CELEX:32010L0075&from=EN (accessed on 14 December 2022).
- Moretti, A.; Jones, C. Advanced Emissions Control Technologies for Coal-Fired Power Plants, Babcock & Wilcox. 2012. Available online: https://andymaypetrophysicist.com/wp-content/uploads/2017/01/advanced_emissions_control_coal_br-1886.pdf (accessed on 14 December 2022).
- Noda, N.; Makino, H. Influence of operating temperature on performance of electrostatic precipitator for pulverized coal combustion boiler. Adv. Powder Technol. 2010, 21, 495–499. [Google Scholar] [CrossRef]
- Turner, J.; Lawless, P.; Yamamoto, T.; Coy, D.; Greiner, G.; McKenna, J.; Vatavuk, W. Electrostatic Precipitators, EPA Air Pollution Control Cost Manual, Chapter 3, Section 6. 1999. Available online: https://www.epa.gov/sites/default/files/2020-07/documents/c_allchs.pdf (accessed on 14 December 2022).
- Sorrels, J.; Randall, D.; Fry, C.R.; Schaffner, K. Selective Non Catalytic Reduction. 2016. Available online: https://www3.epa.gov/ttn/ecas/docs/SNCRCostManualchapter7thEdition2016.pdf (accessed on 14 December 2022).
- Bell, R.; Buckingham, F. An Overview Of Technologies for Reduction of Oxides of Nitrogen From Combustion Furnaces; MPR: Collegeville, MN, USA, 2012. [Google Scholar]
- Carpenter, A. Low Water FGD Technologies, IEA Clean Coal Centre. 2012. Available online: https://www.usea.org/sites/default/files/112012_Low%20water%20FGD%20technologies_ccc210.pdf (accessed on 14 December 2022).
- Srivastava, R.; Jozewicz, W. Flue Gas Desulfurization: The State of the Art. J. Air Waste Manag. Assoc. 2001, 51, 1676–1688. [Google Scholar] [CrossRef] [PubMed]
- Warych, J.; Szymanowski, M. Model of the Wet Limestone Flue Gas Desulfurization Process for Cost Optimization. Ind. Eng. Chem. Res. 2001, 40, 2597–2605. [Google Scholar] [CrossRef]
- Neveux, T.; Hagi, H.; Le Moullec, Y. Performance Simulation of Full-scale Wet Flue Gas Desulfurization for Oxy-coal Combustion. Energy Procedia 2014, 63, 463–470. [Google Scholar] [CrossRef] [Green Version]
- Roll, D.; Reissner, H.; Licata, A.; Abrams, R. Comparison of Economic and Technical Features of Fluid Bed and Spray Dryer FGD Systems, Babcock Power. 2005. Available online: https://www.babcockpower.com/wp-content/uploads/2018/01/comparison-of-economic-and-technical-features-of-fluid-bed-and-spray-dryer-fgd-systems.pdf (accessed on 14 December 2022).
- Carletti, C.; Bjondahl, F.; De Blasio, C.; Ahlbeck, J.; Järvinen, L.; Westerlund, T. Modeling limestone reactivity and sizing the dissolution tank in wet flue gas desulfurization scrubbers. Environ. Prog. Sustain. 2013, 32, 663–672. [Google Scholar] [CrossRef]
- Nygaard, H.; Kiil, S.; Johnsson, J.; Jensen, J.; Hansen, J.; Fogh, F.; Dam-Johansen, K. Full-scale measurements of SO2 gas phase concentrations and slurry compositions in a wet flue gas desulphurisation spray absorber. Fuel 2004, 83, 1151–1164. [Google Scholar] [CrossRef]
- Hansen, B.; Fogh, F.; Knudsen, N.; Kiil, S. Performance of a Wet Flue Gas Desulfurization Pilot Plant under Oxy-Fuel Conditions. Ind. Eng. Chem. Res. 2011, 50, 4238–4244. [Google Scholar] [CrossRef]
- Faber, R.; Yan, J.; Stark, F.; Priesnitz, S. Flue gas desulphurisation for hot recycle oxyfuel combustion: Experiences from the 30MWth oxyfuel pilot plant in Schwartze Pumpe. Int. J. Greenh. Gas Control 2011, 5, S210–S223. [Google Scholar] [CrossRef]
- CAESAR. European Best Practice Guidelines for Assessment of CO2 Capture Technologies, Politecnico di Milano and Alstom UK. 2011. Available online: http://www.energia.polimi.it/news/D%204_9%20best%20practice%20guide.pdf (accessed on 14 December 2022).
- IEAGHG. Rotating Equipment for Carbon Dioxide Capture and Storage. 2011. Available online: https://ieaghg.org (accessed on 14 December 2022).
- Weatherwax, M.; Patel, V.; Musardo, A.; Giovani, G.; Pelella, M.; Cipriani, S. CO2 compression at wolrd’s largest carbon dioxide injection project. In Proceedings of the Second Middle East Turbomachinery Symposium, Doha, Qatar, 17–20 March 2013; Available online: https://turbolab.tamu.edu/wp-content/uploads/2018/08/METS2Lecture5.pdf (accessed on 14 December 2022).
- Romeo, L.; Espatolero, S.; Bolea, I. Designing a supercritical steam cycle to integrate the energy requirements of CO2 amine scrubbing. Int. J. Greenh. Gas Control 2008, 2, 563–570. [Google Scholar] [CrossRef]
- Yeh, S.; Rubin, E. A Centurial History of Technological Change and Learning Curves for Pulverized Coal-Fired Utility Boilers. Energy 2007, 32, 1996–2005. [Google Scholar] [CrossRef]
- Stiegel, G.; Longanbach, J.; Rutkowski, M.; Klett, M.; Kuehn, N.; Schoff, R.; Vaysman, V.; White, J. Power Plant Water Usage and Loss Study, US DOE. 2007. Available online: https://www.netl.doe.gov/File%20Library/Research/Coal/ewr/water/WaterReport_Revised-May2007.pdf (accessed on 14 December 2022).
- Sandia National Laboratories. Supercritical CO2-Brayton Cycle, Sandia Energy. 2015. Available online: https://energy.sandia.gov/sandias-supercritical-carbon-dioxidebrayton-cycle-laboratory-signs-important-mou-with-industry-partners/ (accessed on 14 December 2022).
- Weiland, N.; Dennis, R.; Ames, R.; Lawson, S.; Strakey, P. 12—Fossil energy. In Fundamentals and Applications of Supercritical Carbon Dioxide (SCO2) Based Power Cycles; Woodhead Publishing: Sawston, UK, 2017; Available online: http://www.sciencedirect.com/science/article/pii/B9780081008041000128 (accessed on 14 December 2022).
- Ahn, Y.; Bae, S.; Kim, M.; Cho, S.; Baik, S.; Lee, J.; Cha, J. Review of supercritical CO2 power cycle technology and current status of research and development. Nucl. Eng. Technol. 2015, 47, 647–661. [Google Scholar] [CrossRef] [Green Version]
- Wang, X.; Liu, Q.; Bai, Z.; Lei, J.; Jin, H. Thermodynamic Analysis of the Cascaded Supercritical CO2 Cycle Integrated with Solar and Biomass Energy. Energy Procedia 2017, 105, 445–452. [Google Scholar] [CrossRef]
- US Department of Energy. Pilot Plant: Supercritical CO2 Power Cycles. Available online: https://energy.gov/under-secretary-science-and-energy/pilot-plant-supercritical-co2-power-cycles (accessed on 14 December 2022).
- Spallina, V.; Romano, M.; Chiesa, P.; Gallucci, F.; van Sint Annaland, M.; Lozza, G. Integration of coal gasification and packed bed CLC for high efficiency and near-zero emission power generation. Int. J. Greenh. Gas Control 2014, 27, 28–41. [Google Scholar] [CrossRef]
- Stevens, R.; Newby, R.; Shah, V.; Kuehn, N.; Keairns, D. Guidance for NETL’s Oxycombustion R&D Program: Chemical Looping Combustion Reference Plant Designs and Sensitivity Studies. 2014. Available online: https://www.osti.gov/biblio/1480856 (accessed on 14 December 2022).
- Bouillon, P.; Hennes, S.; Mahieux, C. ECO2: Post-combustion or Oxyfuel–A comparison between coal power plants with integrated CO2 capture. Energy Procedia 2009, 1, 4015–4022. [Google Scholar] [CrossRef] [Green Version]
- Broutin, P.; Briot, P.; Ehlers, S.; Kather, A. Benchmarking of the DMXTM CO2 Capture Process. Energy Procedia 2017, 114, 2561–2572. [Google Scholar] [CrossRef]
Figure 1.
Schematic representation of the solid fuel CLC process considered in this study and the typical reactions taking place in the air and fuel reactors.
Figure 1.
Schematic representation of the solid fuel CLC process considered in this study and the typical reactions taking place in the air and fuel reactors.

Figure 2.
Reaction paths in the FR. Fractions are given on mass basis.

Figure 3.
Flowsheet representation of the considered CLC power plant.

Figure 4.
Classification of the model inputs.

Figure 5.
Heat exchange composite curves (petcoke case).

Figure 6.
Process Sankey diagrams: (a) coal case, (b) petcoke case.

Figure 7.
Effect of the modification of various parameters on the expected thermal power needed to reach the same net electricity production as in the reference case (199.4 MWe) for petcoke CLC. The data labels show the corresponding process net efficiency. The green bars correspond to the left-hand-side scenarios, while the yellow bars correspond to the right-hand-side scenarios.

Figure 8.
Variation of CLC-specific CO2 emissions related to the different scenarios analyzed in Figure 7. As in Figure 7, the green bars correspond to the left-hand-side scenarios, while the yellow bars correspond to the right-hand-side scenarios.


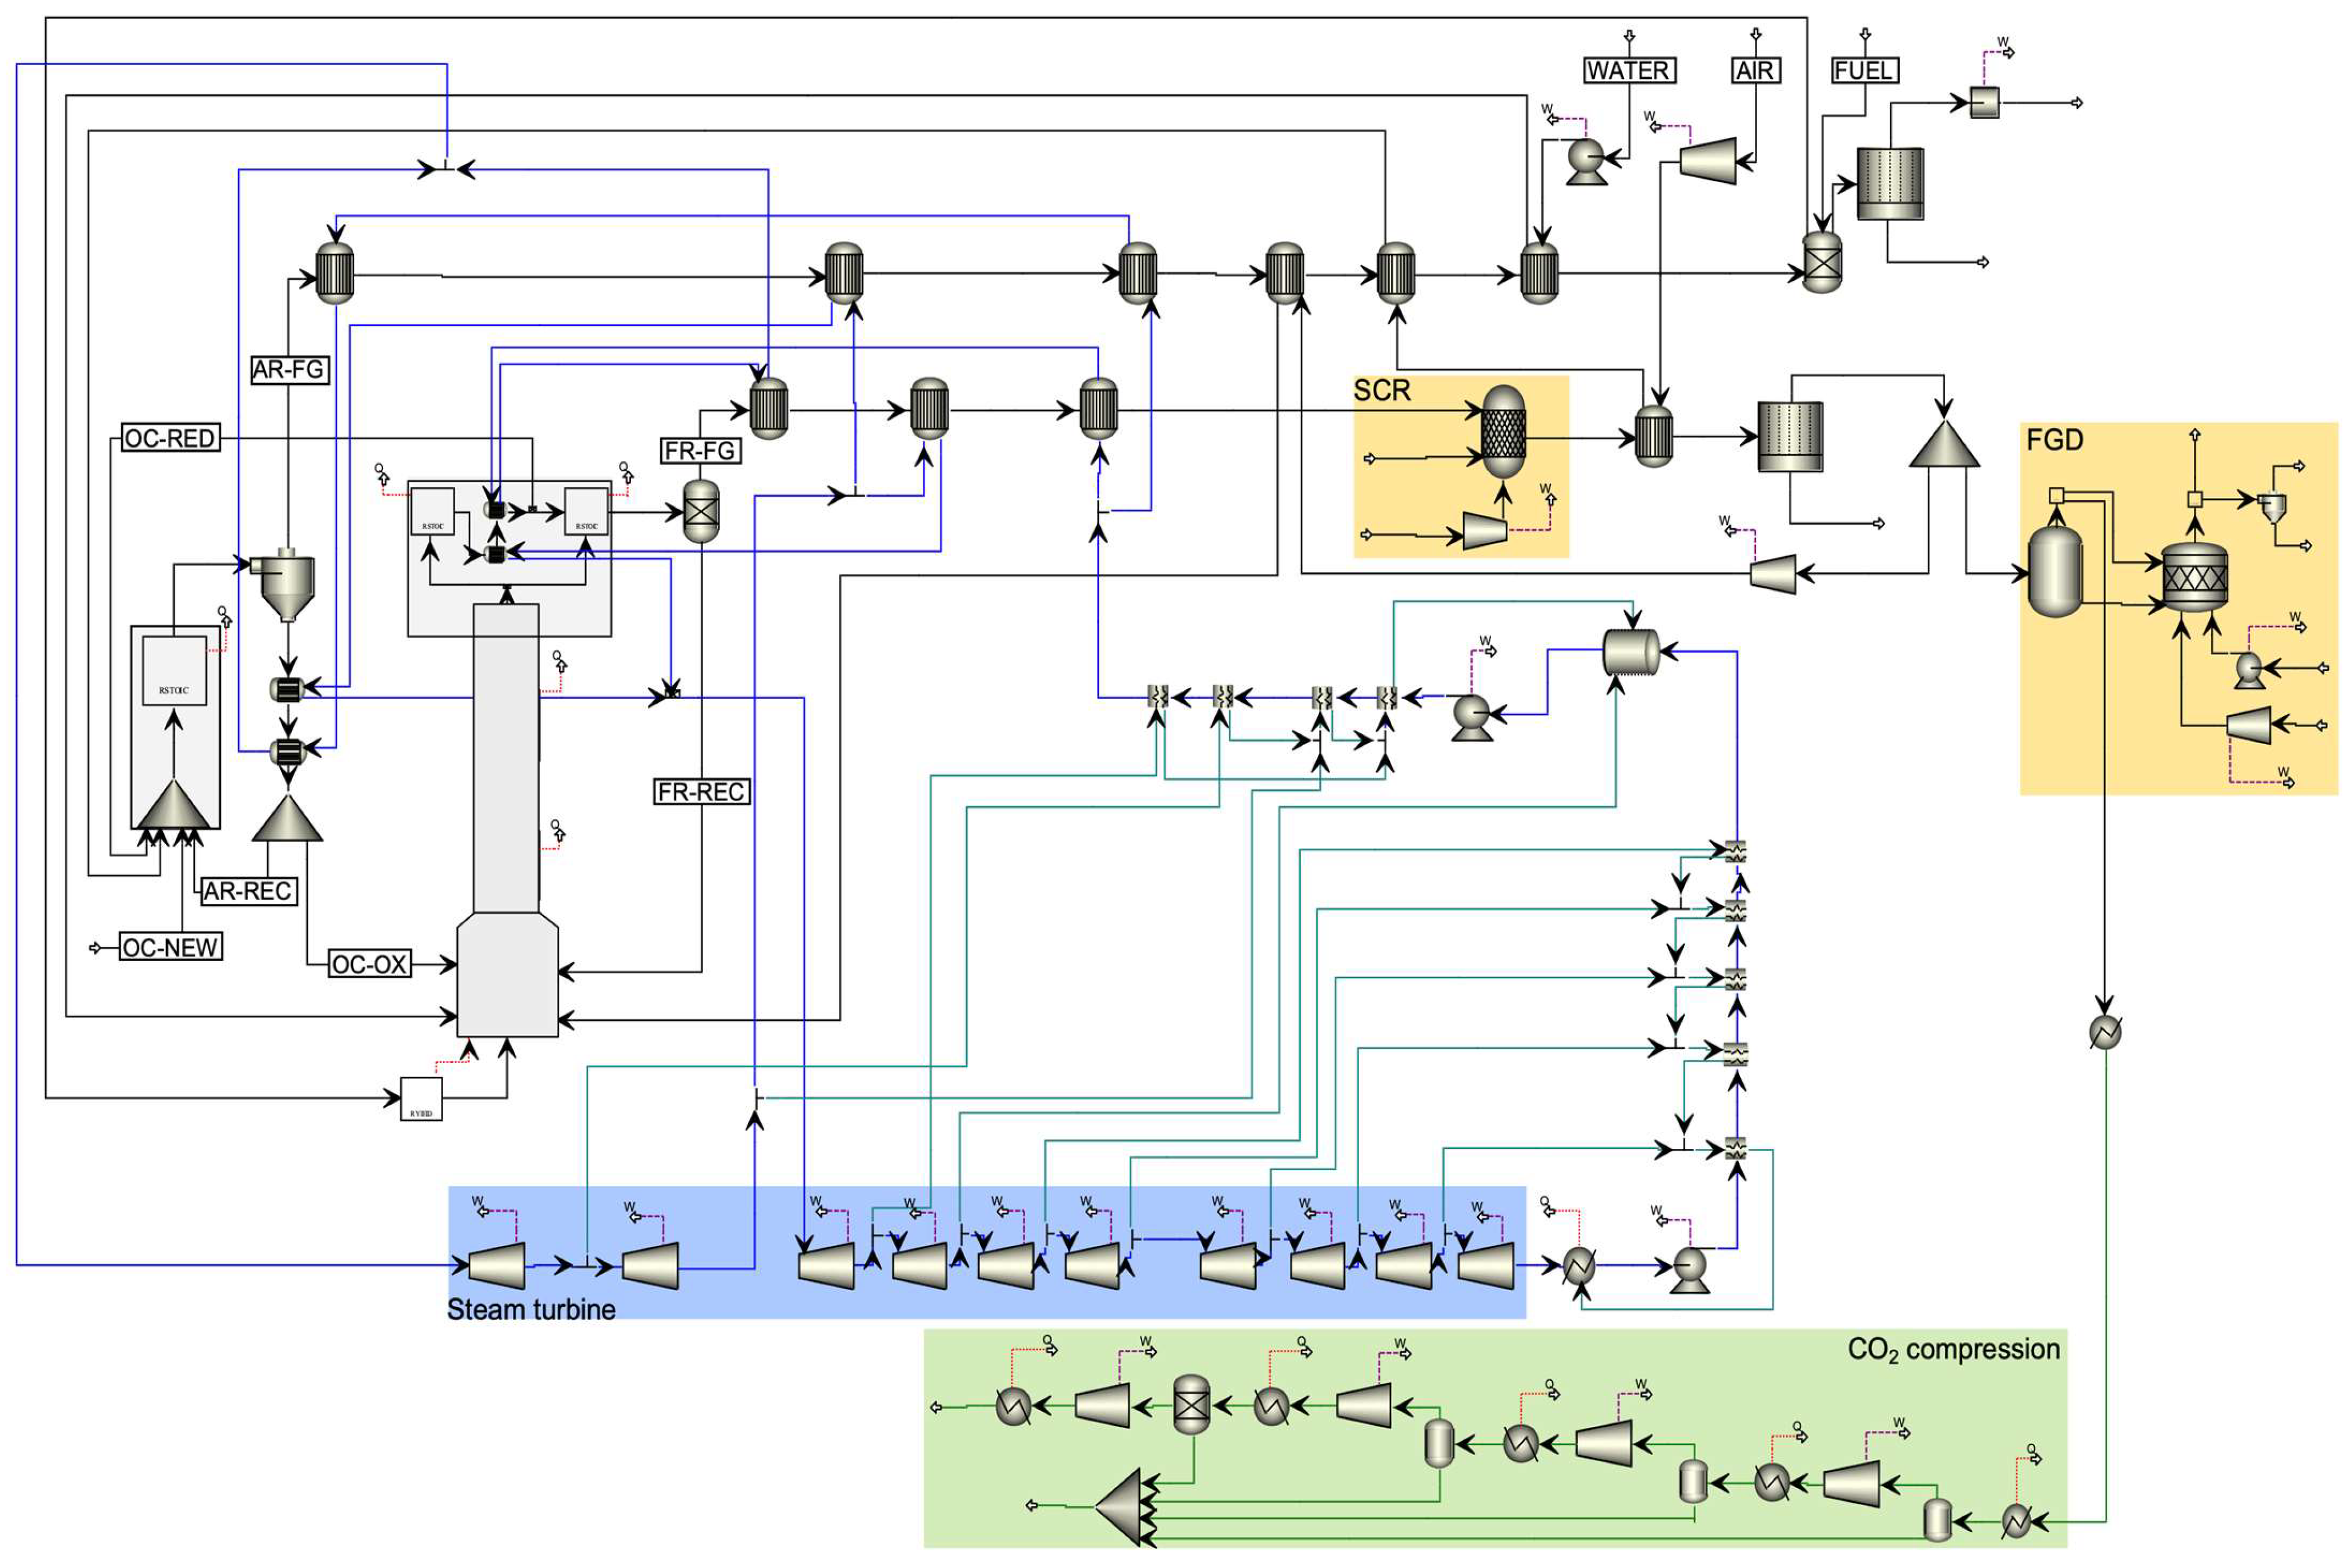
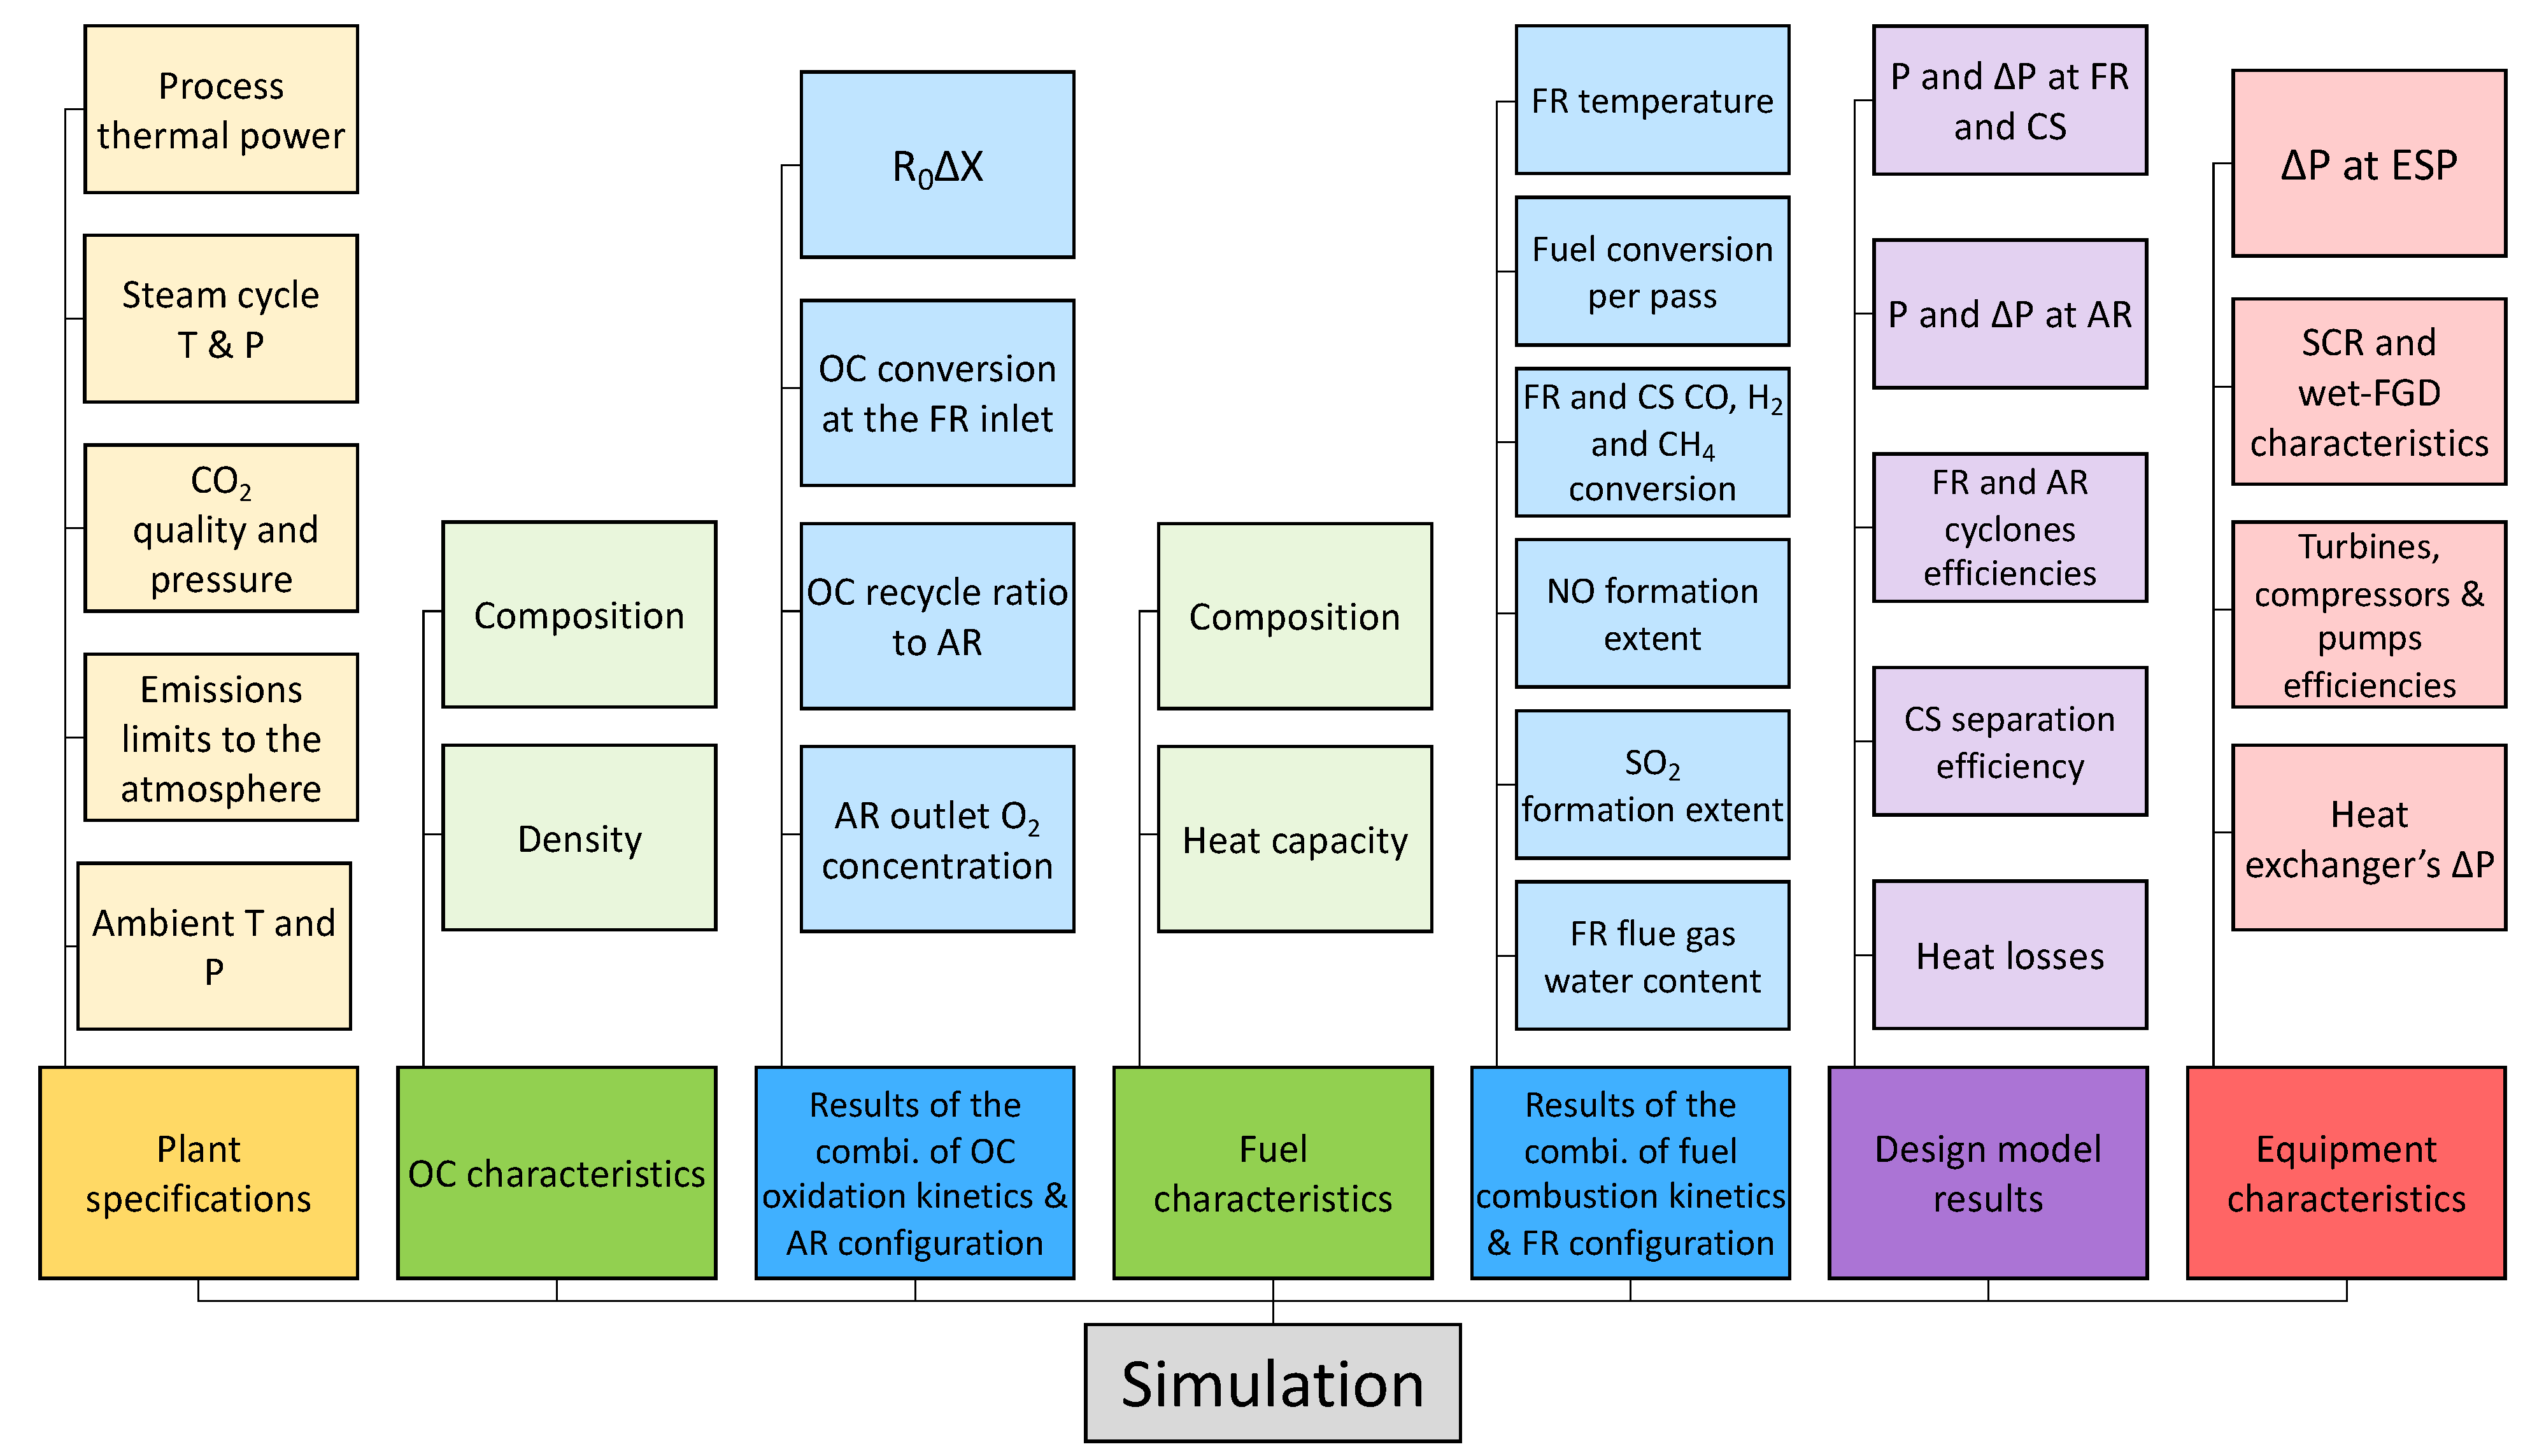
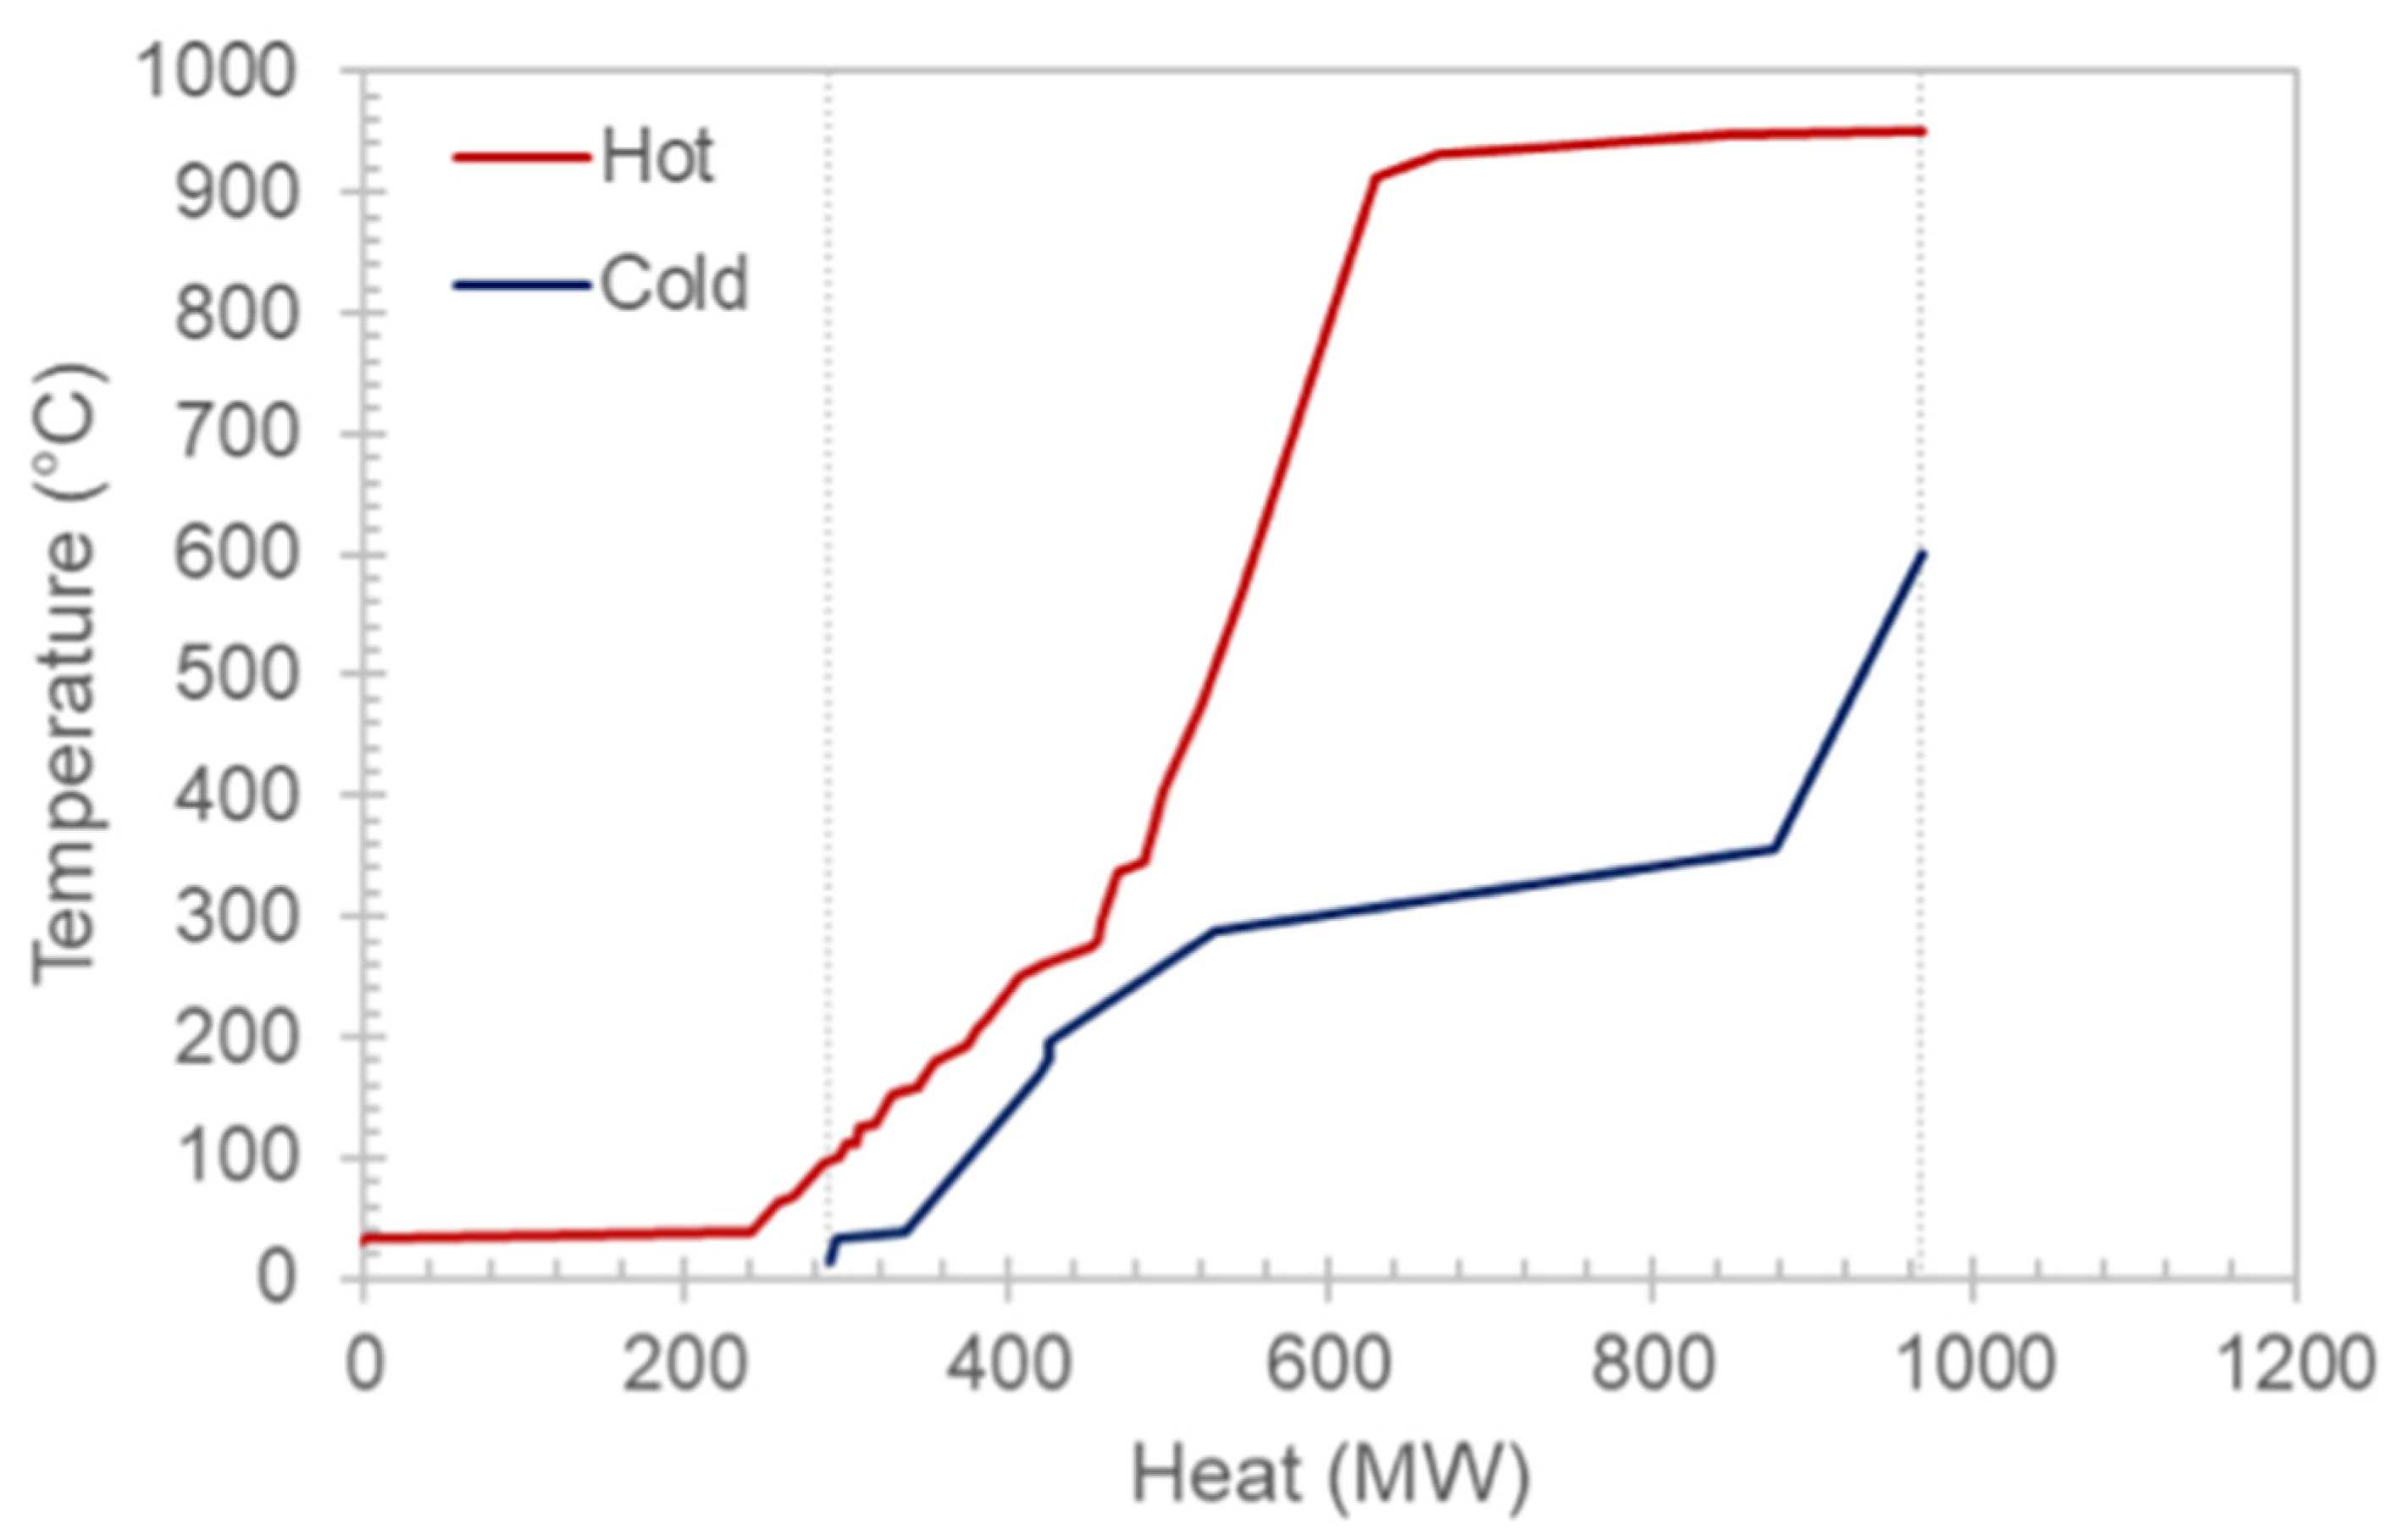
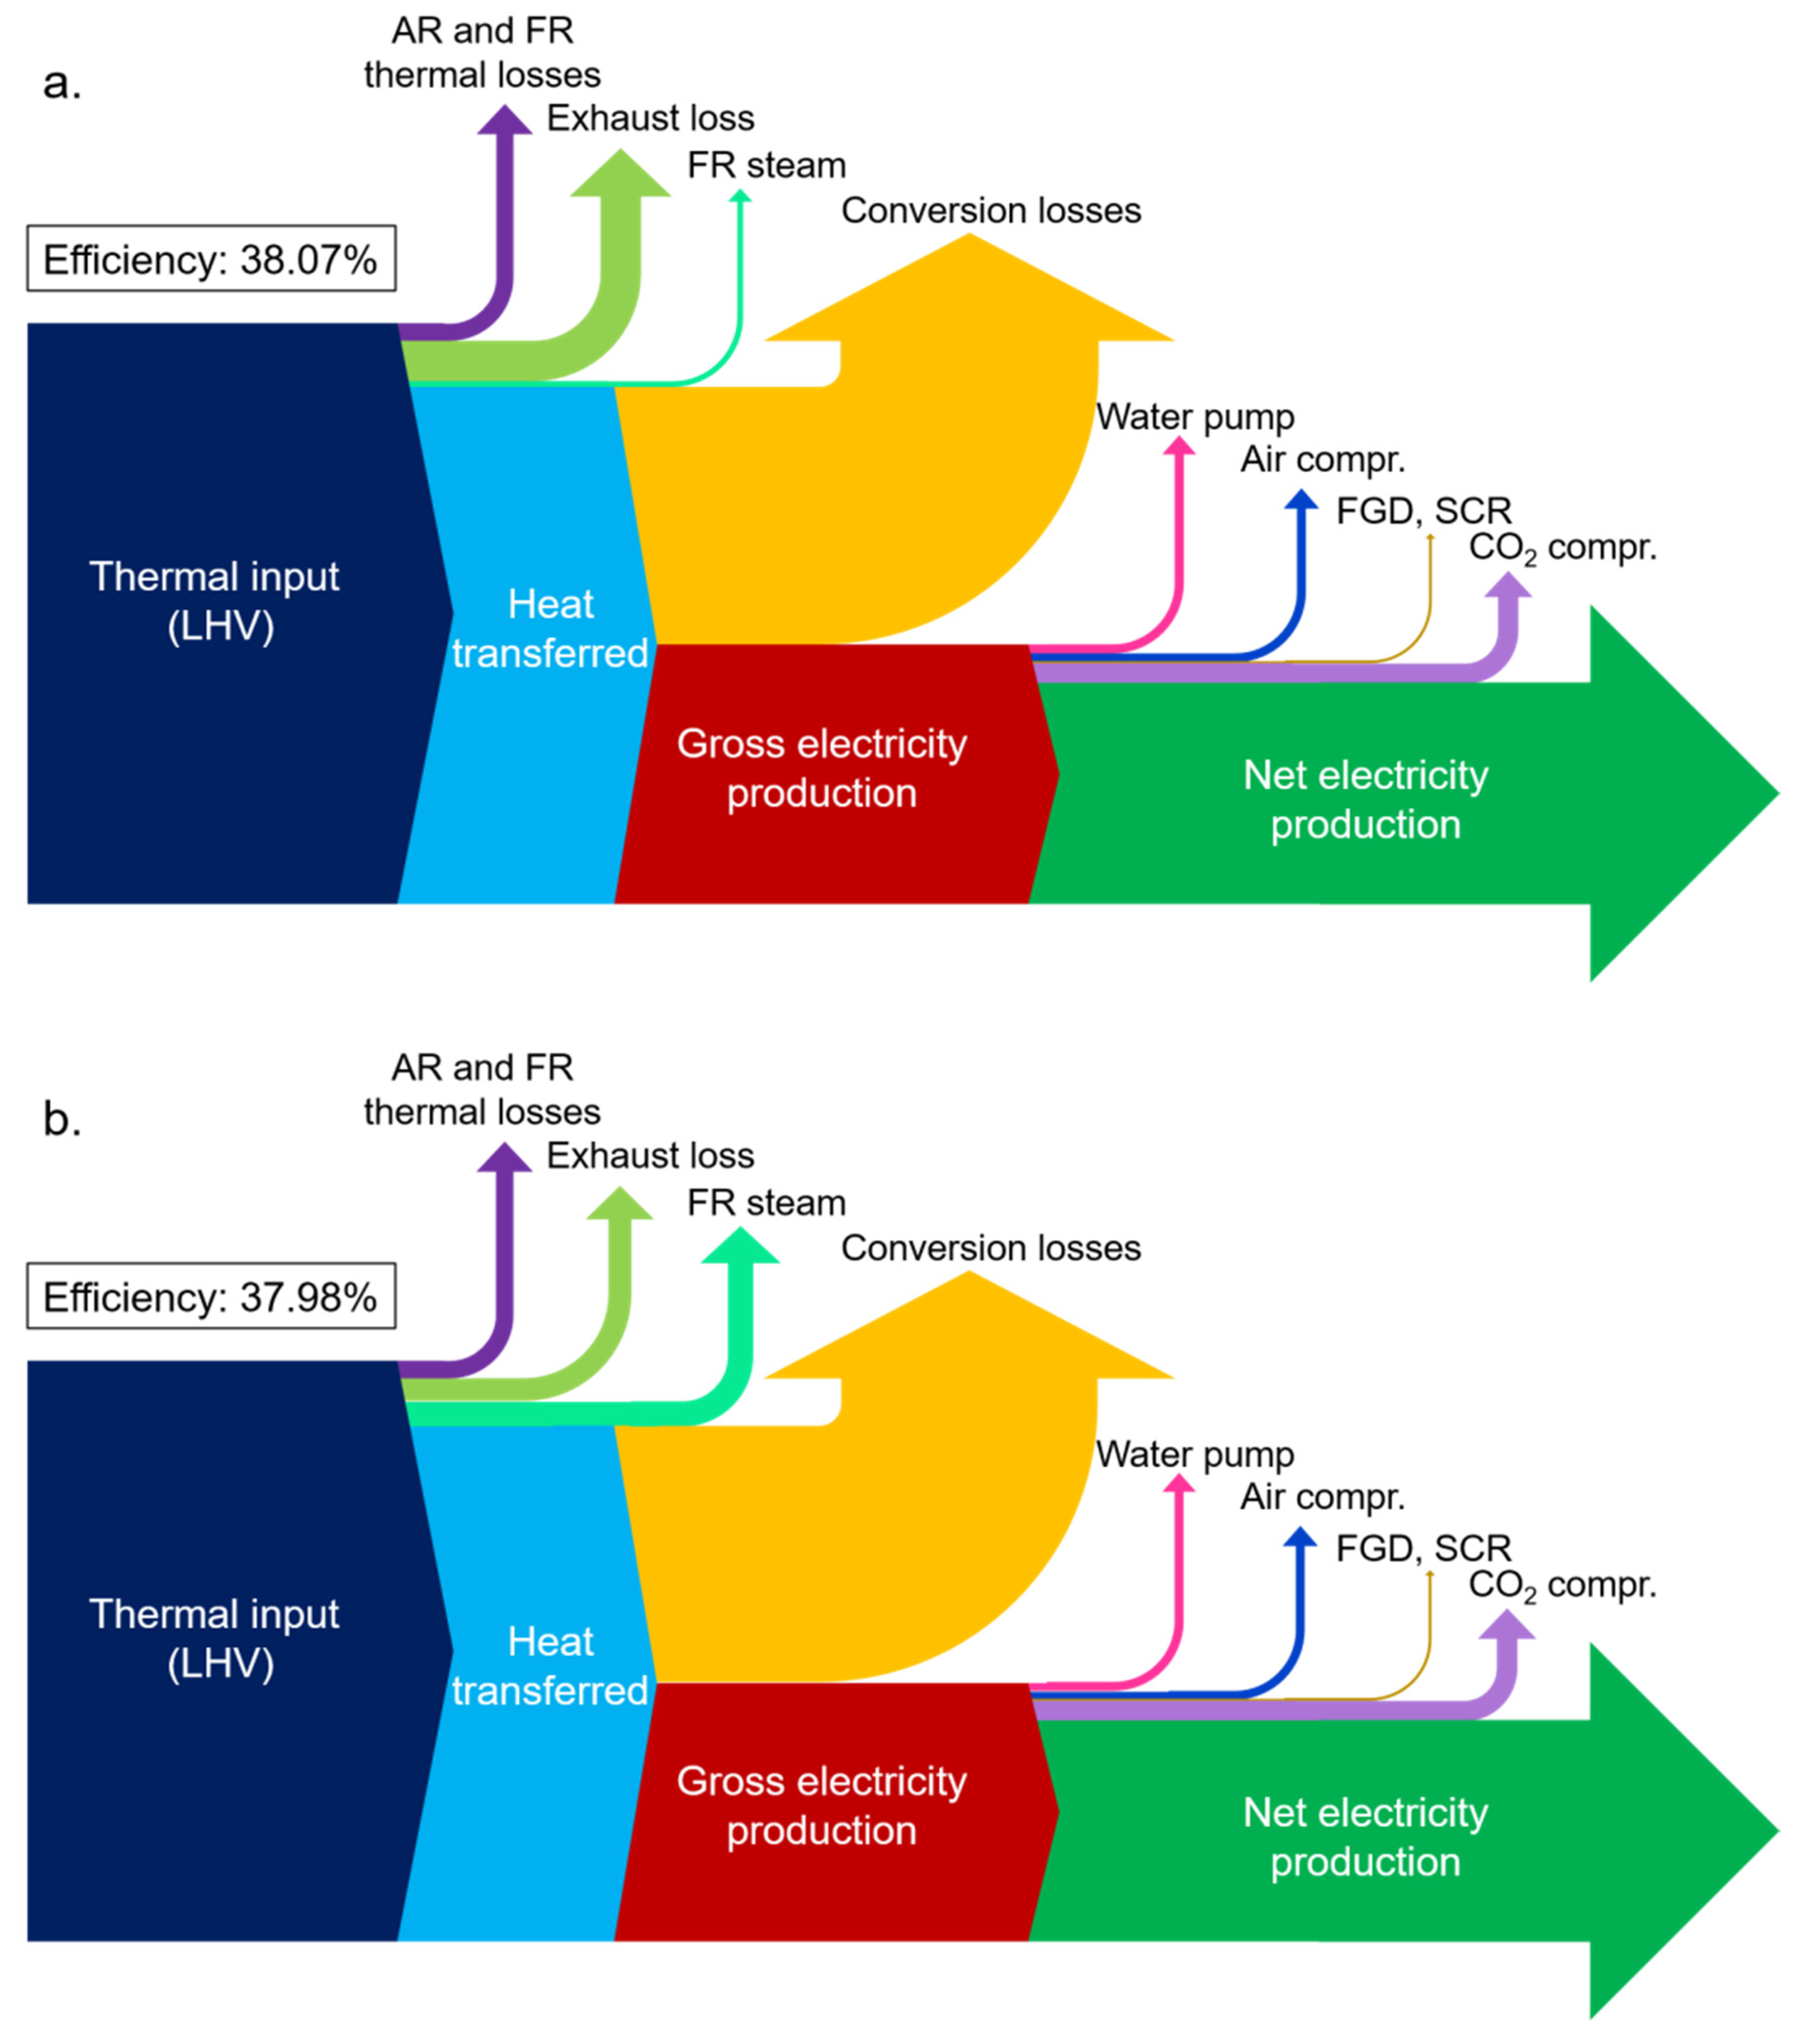
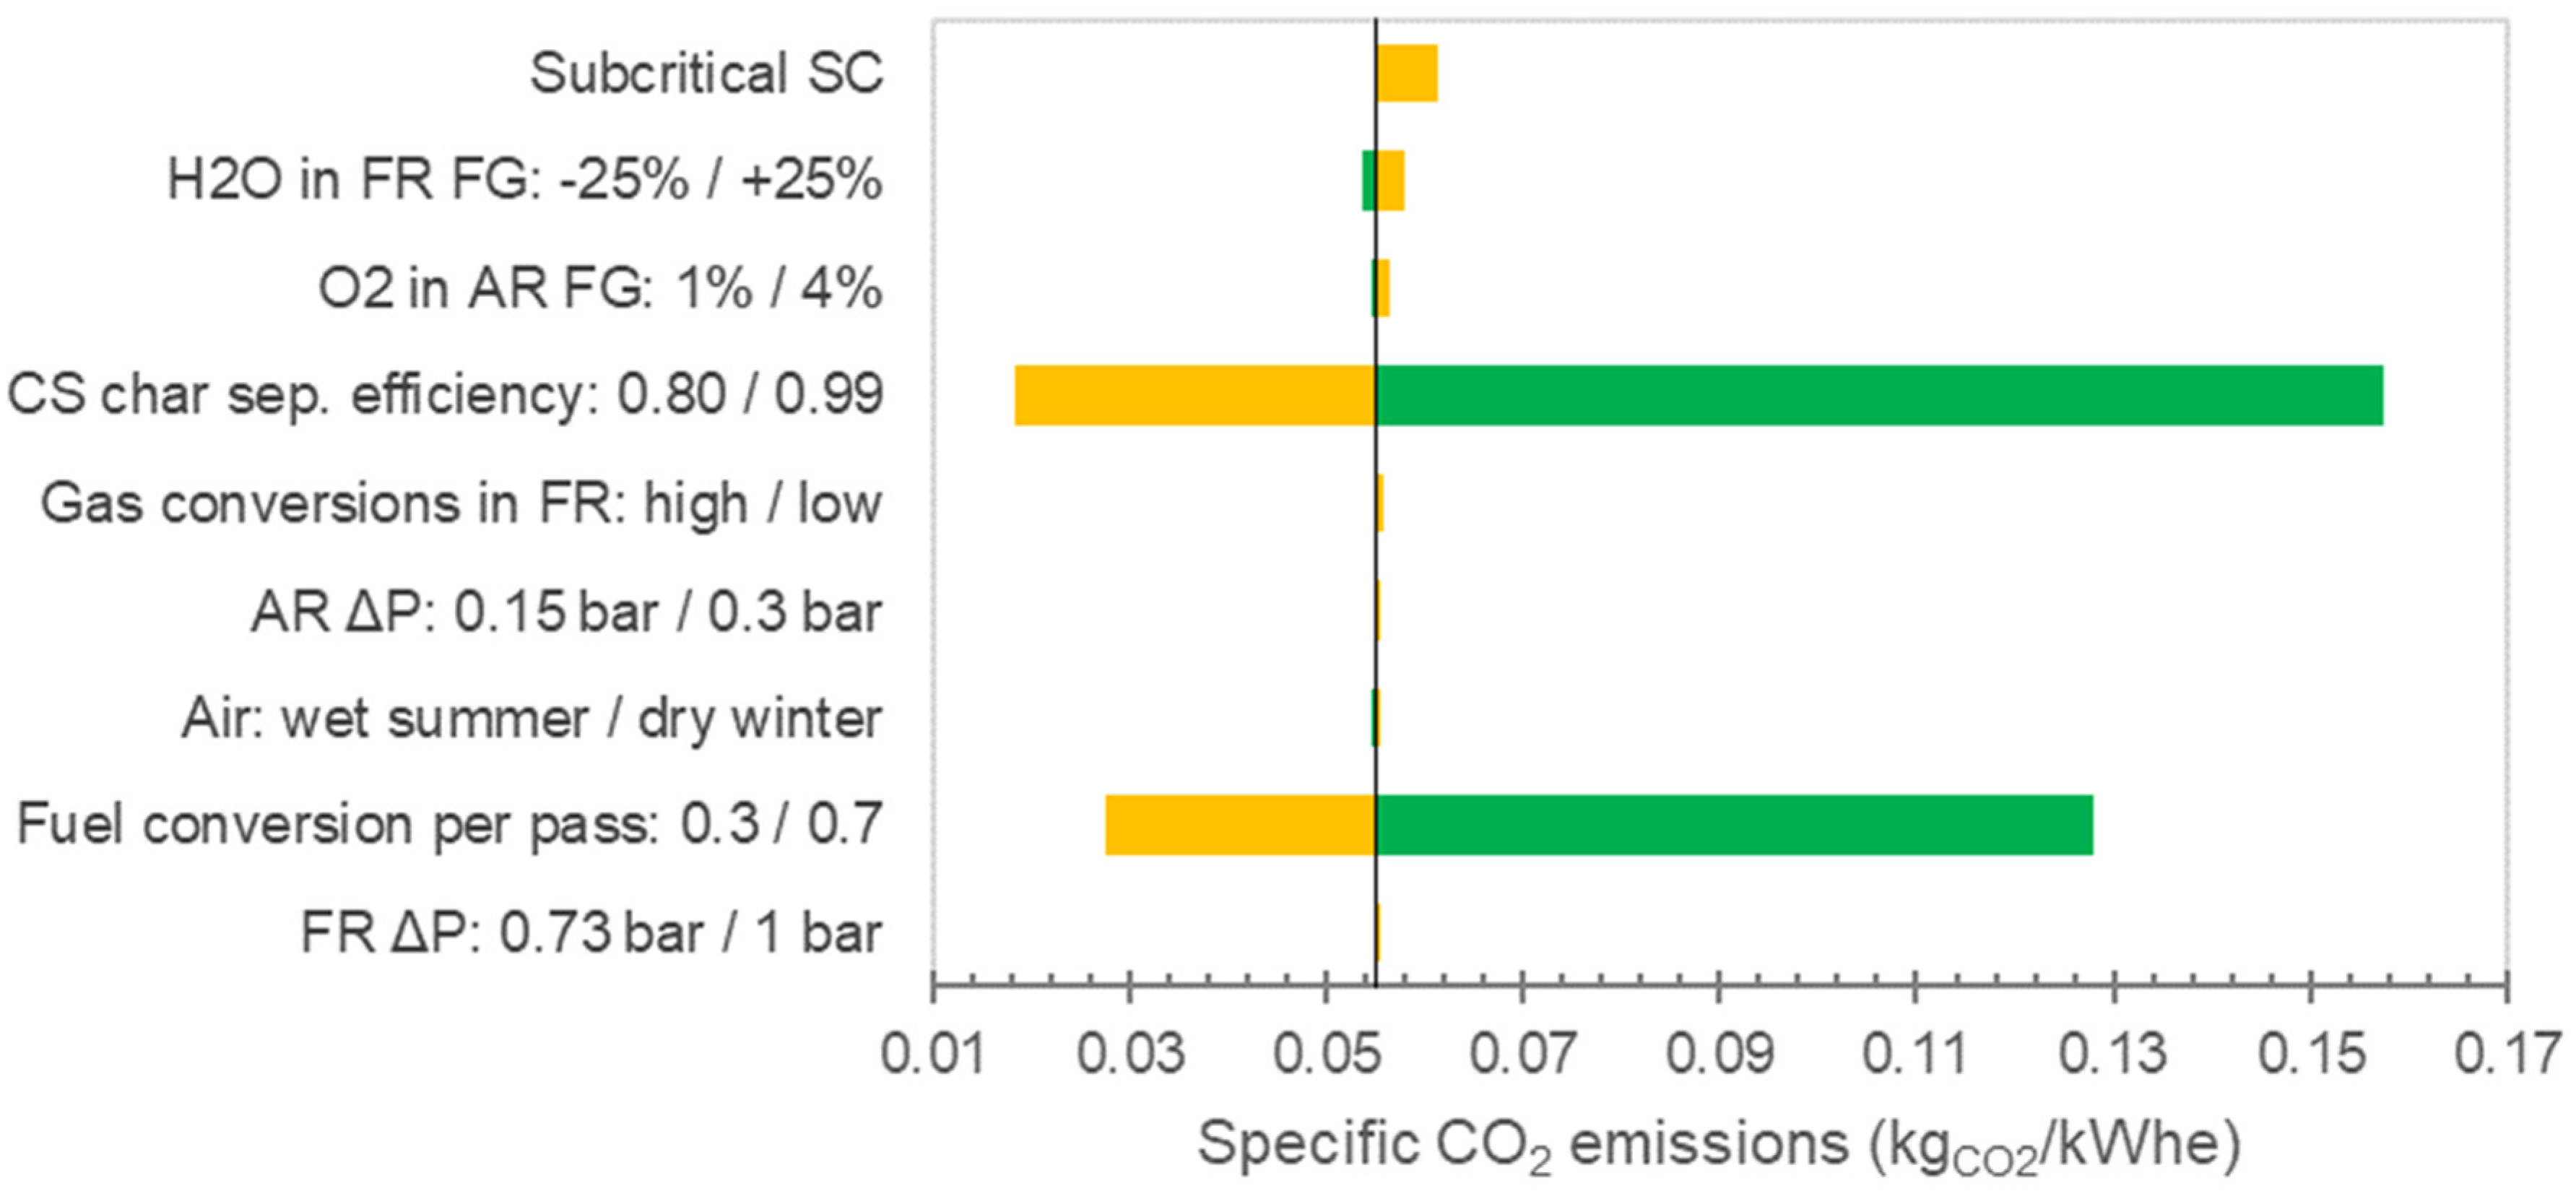
Table 1.
Typical CO2 quality requirements mentioned in the following studies: DYNAMIS [33,34], NETL [35], and White Rose [36].
| Comp. | DYNAMIS (Storage) | NETL (Storage) | NETL (EOR) | White Rose (Storage) |
|---|---|---|---|---|
| H2O | 300–500 ppmv | 500 ppmv | 500 ppmv | 50 ppmv |
| H2S | 200 ppmv | 100 ppmv | 100 ppmv | 20 ppmv |
| CO | 35–2000 ppmv | 35 ppmv | 35 ppmv | 2000 ppmv |
| CH4 | Aquifer 4%vol. | 4%vol. | 1%vol. | 4%vol. |
| O2 | 4%vol. | 10 ppmv | 10 ppmv | 10 ppmv |
| N2, Ar | 4%vol. | 4%vol. | 1%vol. | 4%vol. |
| H2 | 4%vol. | 4%vol. | 1%vol. | 2%vol. |
| SOx | 100 ppmv | 100 ppmv | 100 ppmv | 100 ppmv |
| NOx | 100 ppmv | 100 ppmv | 100 ppmv | 100 ppmv |
| CO2 | >95.5%vol. | >95%vol. | >95%vol. | >96% vol. |
Table 2.
Solid fuels’ characteristics. “wt.” means “mass fraction”, “ar” means “as received” (i.e., on a wet basis), and “db” means “on a dry basis”.
Table 2.
Solid fuels’ characteristics. “wt.” means “mass fraction”, “ar” means “as received” (i.e., on a wet basis), and “db” means “on a dry basis”.
| Parameter | Unit | Coal | Petcoke |
|---|---|---|---|
| Proximate analysis | |||
| Water | wt. ar | 0.02 | 0.011 |
| Fixed carbon | wt. db | 0.59 | 0.901 |
| Volatile matter | wt. db | 0.258 | 0.079 |
| Ash | wt. db | 0.152 | 0.009 |
| Ultimate analysis | |||
| Ash | wt. db | 0.152 | 0.009 |
| C | wt. db | 0.694 | 0.86 |
| H | wt. db | 0.0393 | 0.0336 |
| N | wt. db | 0.0166 | 0.0208 |
| S | wt. db | 0.0084 | 0.0386 |
| O | wt. db | 0.0897 | 0.038 |
| Calorific value | |||
| LHV dry basis | MJ/kg | 26.598 | 33.257 |
| HHV dry basis | MJ/kg | 27.408 | 33.949 |
Table 3.
OC characteristics. is expressed in kg of oxygen per kg of fully oxidized OC.
| Parameter | Unit | Value |
|---|---|---|
| Oxygen transport capacity () | kgO2/kgOC | 2.61% |
| Composition (fully oxidized) | ||
| CuO | wt. basis | 0.13 |
| Al2O3 | wt. basis | 0.87 |
| Average particle size | µm | 150 |
Table 4.
Cyclone and CS separation efficiencies.
| Separation Efficiencies | OC | Char | Ashes |
|---|---|---|---|
| CS, to FR cyclone | 0.1388 | 0.9477 | 0.9915 |
| FR cyclone, to FR FG | 0.9999 | 0.9952 | 0.9712 |
| AR cyclone, to AR FG | 0.9999 | NA | 0.9677 |
Table 5.
Calculated processes inlets.
| Results | Unit | Coal | Petcoke |
|---|---|---|---|
| Fuel | t/h | 72.5 | 57.5 |
| OC makeup | t/h | 0.9 | 0.9 |
| Air: | |||
| CLC | t/h | 673.3 | 683.8 |
| SCR | t/h | 0.6 | 0.6 |
| FGD | t/h | 2.3 | 10.7 |
| NH3,aq | t/h | 0.9 | 0.9 |
| CaCO3 | t/h | 1.4 | 6.8 |
| FGD water | t/h | 3.3 | 15.8 |
Table 6.
Calculated processes outlets (after the gas cleanup units for the CO2 and air outlets).
| CO2 Outlet: | O2 Depleted Air Outlet: | |||||
|---|---|---|---|---|---|---|
| Coal | Petcoke | Limit/Unit | Coal | Petcoke | Limit/Unit | |
| Flow | 174 | 172 | t/h | 537 | 549 | t/h |
| Composition: | ||||||
| CO2 | 96.4% | 98.2% | >95.5%vol | 0.75% | 1.13% | vol. basis |
| O2 | 0 | 0 | 100 ppmv | 2.00% | 2.00% | vol. basis |
| N2 | 1.58% | 1.58% | 4%vol | 94.88% | 94.33% | vol. basis |
| H2O | 500 | 500 | 500 ppmv | 1.24% | 1.40% | vol. basis |
| CO | 463 | 593 | 2000 ppmv | |||
| H2 | 0.05% | 0.07% | 4%vol | |||
| CH4 | 1.82% | 0 | 2%vol | |||
| NO | 99 | 99 | 100 ppmv | 31 | 50 | 150 mg/Nm3 |
| NH3 | 22 | 22 | 50 ppmv | |||
| SO2 | 99 | 97 | 100 ppmv | 39 | 434 | 200 mg/Nm3 |
| Particles | 0 | 0 | 3 | 2 | 20 mg/Nm3 | |
| Other Outlets: | ||||||
| Coal | Petcoke | Unit | ||||
| Water outlet (CO2 compression train) | 27 | 26 | t/h | |||
| Particulate outlets: | ||||||
| AR ESP | 1.2 | 0.8 | t/h | |||
| FR ESP | 10.8 | 0.8 | t/h | |||
| FGD outlets: | ||||||
| Solids | 2.6 | 12.26 | t/h | |||
| Water | 7.5 | 32.6 | t/h | |||
| Gas | 3.2 | 15.0 | t/h | |||
Table 7.
CO2 capture and CO2 avoided efficiency.
| Parameter | Unit | Coal | Petcoke |
|---|---|---|---|
| Specific emissions | kgCO2/kWh | 0.033 | 0.055 |
| CO2 capture efficiency | - | 96.4% | 93.9% |
| Extent of CO2 avoided | - | 95.7% | 92.7% |
Table 8.
Resulting processes parameters.
| AR | FR | ||||
|---|---|---|---|---|---|
| Results | Unit | Coal | Petcoke | Coal | Petcoke |
| Steam injected | t/h | - | - | 13 | 38 |
| OC to fuel inlet (w/o rec.) | kgOC/kgfuel | - | - | 95.4 | 119.6 |
| Solid flow to FR (OC-OX) | Solid flow recirculated to FR (FR-REC) | ||||
| Total flow | t/h | 6918 | 6871 | 1490 | 1158 |
| OC content | wt. basis | 99.95% | 99.998% | 73.3% | 93.7% |
| Ash + char content | wt. basis | 0.05% | 0.002% | 26.7% | 6.3% |
Table 9.
Resulting energy balance comparison with other coal-fueled processes: Democlock [68], NETL [69], ECO2 [70], and OCTAVIUS [71]. The OCTAVIUS energy balance has been rearranged to comply with the other studies.
| This Study | Democlock | NETL | ECO2 | OCTAVIUS | |||||
|---|---|---|---|---|---|---|---|---|---|
| Petcoke | Coal | IGCC-CLC | CLC | PCC w/CCS | CFB w/MEA | Oxyfuel | PCC w/MEA | PCC w/DMX™ | |
| Expected thermal power (MWthLHV) | 525 | 525 | 854 | 1566 | 1924 | 1400 | 1400 | 1637.7 | 1637.7 |
| Gross efficiency | 44.5% | 44.7% | 48.2% | 41.0% | 34.5% | 43.1% | 50.6% | 44.3% | 45.0% |
| Auxiliaries (w/o CC) | −3.0%-pts | −3.0%-pts | −6.2%-pts | −2.3%-pts | −2.7%-pts | −3.9%-pts | −9.6%-pts | −6.0%-pts | −5.5%-pts |
| CO2 compression | −3.5%-pts | −3.6%-pts | −1.5%-pts | −3.6%-pts | −3.4%-pts | −4.6%-pts | −4.4%-pts | −3.3%-pts | −3.3%-pts |
| Net efficiency | 38.0% | 38.1% | 40.5% | 35.1% | 28.4% | 34.6% | 36.6% | 35.0% | 36.2% |
| CC efficiency | 94.3% | 96.4% | 96.1% | 95.8% | 90.0% | 90.0% | 90.0% | ||
| Specific emissions (kgCO2/kWh) | 0.047 | 0.030 | 0.034 | 0.032 | 0.090 | 0.080 | |||
Disclaimer/Publisher’s Note: The statements, opinions and data contained in all publications are solely those of the individual author(s) and contributor(s) and not of MDPI and/or the editor(s). MDPI and/or the editor(s) disclaim responsibility for any injury to people or property resulting from any ideas, methods, instructions or products referred to in the content. |
© 2023 by the authors. Licensee MDPI, Basel, Switzerland. This article is an open access article distributed under the terms and conditions of the Creative Commons Attribution (CC BY) license (https://creativecommons.org/licenses/by/4.0/).
Share and Cite
MDPI and ACS Style
Vekemans, O.; Yazdanpanah, M.; Guillou, F.; Bertholin, S.; Haut, B. Modeling and Simulation of an Industrial-Scale 525 MWth Petcoke Chemical Looping Combustion Power Plant. Processes 2023, 11, 211. https://doi.org/10.3390/pr11010211
AMA Style
Vekemans O, Yazdanpanah M, Guillou F, Bertholin S, Haut B. Modeling and Simulation of an Industrial-Scale 525 MWth Petcoke Chemical Looping Combustion Power Plant. Processes. 2023; 11(1):211. https://doi.org/10.3390/pr11010211
Chicago/Turabian StyleVekemans, Odile, Mahdi Yazdanpanah, Florent Guillou, Stéphane Bertholin, and Benoit Haut. 2023. "Modeling and Simulation of an Industrial-Scale 525 MWth Petcoke Chemical Looping Combustion Power Plant" Processes 11, no. 1: 211. https://doi.org/10.3390/pr11010211
Note that from the first issue of 2016, this journal uses article numbers instead of page numbers. See further details here.