Article

Effect of Hop β-Acids Extract Supplementation on the Volatile Compound Profile of Roasted Chicken Meat

by
Larissa Chirino de Almeida
,
Mirella Romanelli Vicente Bertolo
,
Daniel Rodrigues Cardoso
and
Stanislau Bogusz, Junior
*
University of Sao Paulo (USP), Sao Carlos Institute of Chemistry (IQSC), Sao Carlos 13560-000, Sao Paulo, Brazil
*
Author to whom correspondence should be addressed.
Processes 2023, 11(1), 153; https://doi.org/10.3390/pr11010153
Submission received: 28 November 2022 / Revised: 27 December 2022 / Accepted: 29 December 2022 / Published: 4 January 2023
(This article belongs to the Special Issue Method Optimization of Various Food Processing Technologies)

Abstract

:
The increased interest in greener sources of antioxidants has spurred the research on natural alternatives to enhance poultry production. This study aimed to investigate the effects of natural antioxidant extracts’ (hop β-acids extract) diet supplementation at different concentrations (0, 30, 60, and 120 mg kg−1) on the volatile compound profile of roasted chicken meat. A method based on headspace solid-phase micro-extraction coupled to gas chromatography-mass spectrometry (HS-SPME-GC-MS) was optimized by response surface design to extract the volatile compounds. The optimum extraction conditions were 80 °C and 45 min. A total of 95 volatile compounds were identified in roasted chicken meat, especially aldehydes, alkanes, alcohols, esters, and pyrazines. Principal component analysis (PCA) separated the samples as a function of β-acid supplementation, indicating that increased levels of supplementation lead to distinct volatile profiles in roasted chicken meat. Aldehydes such as octanal and hexanal (8.94% and 17.63%, respectively, for 30 mg kg−1 treatment) played an important role in distinguishing the samples. Those compounds are the main oxidation products of unsaturated fatty acids, which are possibly protected by the antioxidant properties of hop β-acid extracts. Some other compounds with odoriferous importance detected for this level of supplementation were: 2,6-dimethyl pyrazine (5.12%), 2-pentylfuran (2.94%), and 1-octen-3-ol (1.88%). This study significantly contributes to the elucidation of the impact of hops β-acids supplementation in the chicken meat aroma profile, opening new venues for its potential application.

1. Introduction

Poultry meat is one of the most consumed sources of protein due to its low cost and high availability [1]. Increased demand for chicken meat has spurred poultry production towards high animal density systems, which increased their susceptibility to oxidative stress [2]. The incidence of oxidative stress in animals can result in reduced meat quality since the occurrence of an intense redox process in lipids and proteins leads to nutritional loss and flavor alterations [3]. Regarding its flavor, raw chicken meat has a bloody taste with low or no aroma compounds [4]. However, during heating, the development of a highly complex flavor profile occurs in the meat due to the production of volatile and non-volatile compounds from proteins and lipids degradation. In general, most of the volatile compounds that give the desirable characteristic aroma of chicken meat originate from the degradation of its fatty acids, in combination with the products of the Maillard reaction [5]. Moreover, since it is rich in phospholipids, which have polyunsaturated fatty acids in their composition, chicken meat is very susceptible to lipid oxidation, and it can easily develop unpleasant flavors (off-flavors) that can interfere with chicken meat sensory quality [4].
Those off-flavors can be developed during the cooking process of meat from animals that were subjected to stress before slaughter. Zhou et al. [6] reported different patterns of volatiles in Fuliji roast chicken during processing, especially during frying and stewing. Therefore, one way found by the producers and processors to avoid lipid and protein oxidation is by adding natural antioxidants to chicken feed, such as plant extracts, algae, and insect proteins [7,8,9]. Gkarane et al. [7] analyzed the effects of Hermetia illucens larvae and Arthrospira platensis on the volatile profile of chicken meat and reported a reduction in the levels of volatile lipid-derived compounds. Andaleeb et al. [8], in turn, analyzed the antioxidation capacity of spices (Chinese 5-spice blend and garam masala) for the preservation of Sanhuang chicken breast.
One of the natural ingredient sources that stand out due to its antioxidant activity is hops (Humulus lupulus) [3,10,11]. Chemically composed of phenolic compounds, essential oils, α, and β-acids (such lupulone, colupulone, adlupulone, prelupulone, and postlupulone), hops are used in breweries to control oxidative processes and microbial contamination during beer production [12]. It is believed that supplementing the diet of chickens with hop β-acids in adequate concentrations can replace growth promoters, antimicrobials, and antioxidants in animal feed, improving meat production performance and decreasing oxidative processes [3,10]. However, there are no reports regarding the impact of supplementation with hop β-acids in chicken feed on the volatile composition of roasted chicken meat, especially applying multivariate optimization and unsupervised chemometric tools.
The overall aim of this research was to evaluate how the supplementation with different concentrations of hop β-acids (from 0 to 120 mg kg−1) in the diet of broilers could affect the volatile profile of their roasted meat. The specific objectives of this study were (i) select the best solid phase microextraction (SPME) fiber for volatile extractability, (ii) optimize the SPME extraction parameters (time and temperature) for maximum volatile extractability using a central composite design, (iii) identify the volatiles formed in roasted chicken meat at different levels of hop β-acids supplementation by gas chromatography coupled to mass spectrometry (GC-MS), (iv) use unsupervised chemometric tools to betters understand the differences among the samples. Therefore, this work brings novel information on the effects of a combination of multivariate chemometric tools and the supplementation of roasted chicken meat with hop β-acids for volatile profiling.

2. Materials and Methods

2.1. Animals and Sampling

The animal experiments were conducted at the University of São Paulo (USP), College of Agriculture “Luiz de Queiroz” (ESALQ), under the supervision of Prof. Dr. J.F. Menten, and all the procedures were approved by the institutional animal care and use committee (CEUA/ESALQ/USP-Protocol 2012-10) as previously detailed by Zawadzki, et al. [3]. Briefly, one-day-old male Cobb 500 broiler chicks were randomly distributed into four treatments, with six repetitions per treatment, and 40 animals per experimental unit. The animals (960 total) were fed ad libitum for 42 days according to four experimental treatments: 0, 30, 60, and 120 mg of hops β-acids extracts per kg of feed (named T1, T2, T3, and T4, respectively). The nutritional program consisted of four diets: pre-starter (1–7 days), starter (7–21 days), grower (21–35 days), and finisher (35–42 days). The basal diet of the birds included corn, soybean meal, 5% poultry by-products meal, and 5% wheat bran. The required levels of vitamin E were supplied with 20 mg of α-tocopherol acetate per kg of food. More details about the composition of the basal diets such as energy, protein level, lysine content, etc., can be found in Bortoluzzi et al. [10]. After 42 days, one chicken from each replicate of the experiment was slaughtered by cervical dislocation. After slaughter, the pectoralis major muscle was separated from all connective tissue and subcutaneous fat and stored at −80 °C until the chemical analysis.

2.2. Sample Preparation

Chicken meat samples were thawed at 6 °C for 24 h, according to the procedure described by Madruga et al., 2009 [13]. After cleaning and removing the fat, the filets were cooked in a George Foreman® grill (George Foreman Grilling Machine, GR2060 W, 127 V, China), with temperature control (skewer thermometer -Dihao WT-1, Guangdong, China). The filets were grilled for 10 min each side until the internal temperature reached 85 °C, and the cooking process was stopped by cooling them in an ice bath until 0 °C using plastic bags [14].
Finally, the meat was ground using a domestic blender (Black & Decker, model SB40, Uberaba, MG, Brazil), and 10 g aliquots of minced roasted chicken filets from different batches (n = 6) were weighed into 60 mL glass flasks with screw caps and PTFE/silicone septum, suitable for SPME (Supelco, Bellefonte, PA, USA).

2.3. SPME Fiber Coating Selection

Five SPME fiber coatings were tested aiming to select the one with the higher volatile extractability. The coating tested were: PDMS (polydimethylsiloxane, 100 µm), PDMS/DVB (polydimethylsiloxane/divinylbenzene, 65 µm), CAR/PDMS (carboxen/polydimethylsiloxane, 75 µm), DVB/CAR/PDMS (divinylbenzene/carboxen/polydimethylsiloxane, 50/30 µm), and PA (polyacrylate, 85 µm). Before use, all fibers were properly conditioned according to the recommendations of the manufacturer (Supelco, Bellefonte, PA, USA).
The fibers were exposed to the headspace of the samples under the same conditions for comparison purposes: 70 °C of extraction temperature, 10 min of equilibrium time, and 30 min of extraction [14]. The HS-SPME fiber selection extractions were conducted using a jacketed beaker connected to a thermostatic water bath. After extraction, the fibers were immediately introduced into the GC injector for the desorption of the analytes conducted at 250 °C, in splitless mode, for 1 min. After the desorption, the fibers were reconditioned at 250 °C for 15 min, to ensure the absence of peaks in the run blanks [15]. All the extractions were performed in triplicate, and the fiber with the largest total area of the chromatogram was selected for the further steps of extraction optimization.

2.4. Optimization of Volatiles Extraction

After the fiber selection step, the best fiber coating was used to optimize the extraction conditions using a 22 factorial central composite design (CCD), with four axial points (α = 1.41) and three repetitions in the central point (0) [15,16]. The variables studied were extraction time (t, min) and extraction temperature (T, °C) (Table 1). These variables were selected since they are described in the literature as the most significant for the process of extracting volatiles from roasted chicken meat [17]. The other variables of the SPME system, such as sample amount, agitation, and equilibrium time remained constant. In total, 12 experiments were randomly performed, as shown in Table 2. After optimization, volatile extractions were performed in triplicate, under optimal extraction conditions.

2.5. Identification of Volatiles in Roasted Chicken Meat by GC-MS

All the analyses of the volatiles from the roasted chicken meat were performed in a Shimadzu GC-MS system (GC-2010plus, Shimadzu, Kyoto, Japan) coupled to a quadrupole mass spectrometry detector. The analytes were separated in an Agilent VF-5MS fused silica capillary column (30 m × 0.25 mm i.d. × 0.25 µm). The chromatographic conditions were: injector at 250 °C, in splitless mode (1 min), carrier gas helium at 1.0 mL min−1, oven temperature gradient: 40 °C to 240 °C, with an increment of 3 °C min−1, interface at 200 °C, and +70 eV (35–350 m/z, electron ionization source).
The mass spectra obtained for the samples were compared to the NIST 2011 mass spectra, for the identification of the volatiles; a minimum similarity of 85% was adopted. To confirm the identity of the compounds, the Van den Dool and Kratz programmed temperature retention indexes (RI) were calculated, by injecting a solution of n-alkanes (C7–C20) (Supelco, Alltech, PA, USA) into the GC-MS under the same conditions. The considered maximum variation of RI from the sample and literature was ±10.

2.6. Statistical Analysis

The results of total area for the fiber coating selection step were submitted to analysis of variance (ANOVA) and Tukey’s test at 5% of significance. Statistical analysis for CCD was performed using the Statistica v.13 software (Statsoft Inc., Tulsa, OK, USA). Principal component analysis (PCA) was performed to visualize the clusters of samples of volatiles from roasted chicken meat as a function of hop β-acids supplementation. The PCA was performed using the total area of each identified volatile compound, and the data were mean-centered and analyzed using MetaboAnalyst 5.0 (https://www.metaboanalyst.ca/, accessed on 21 November 2022).

3. Results

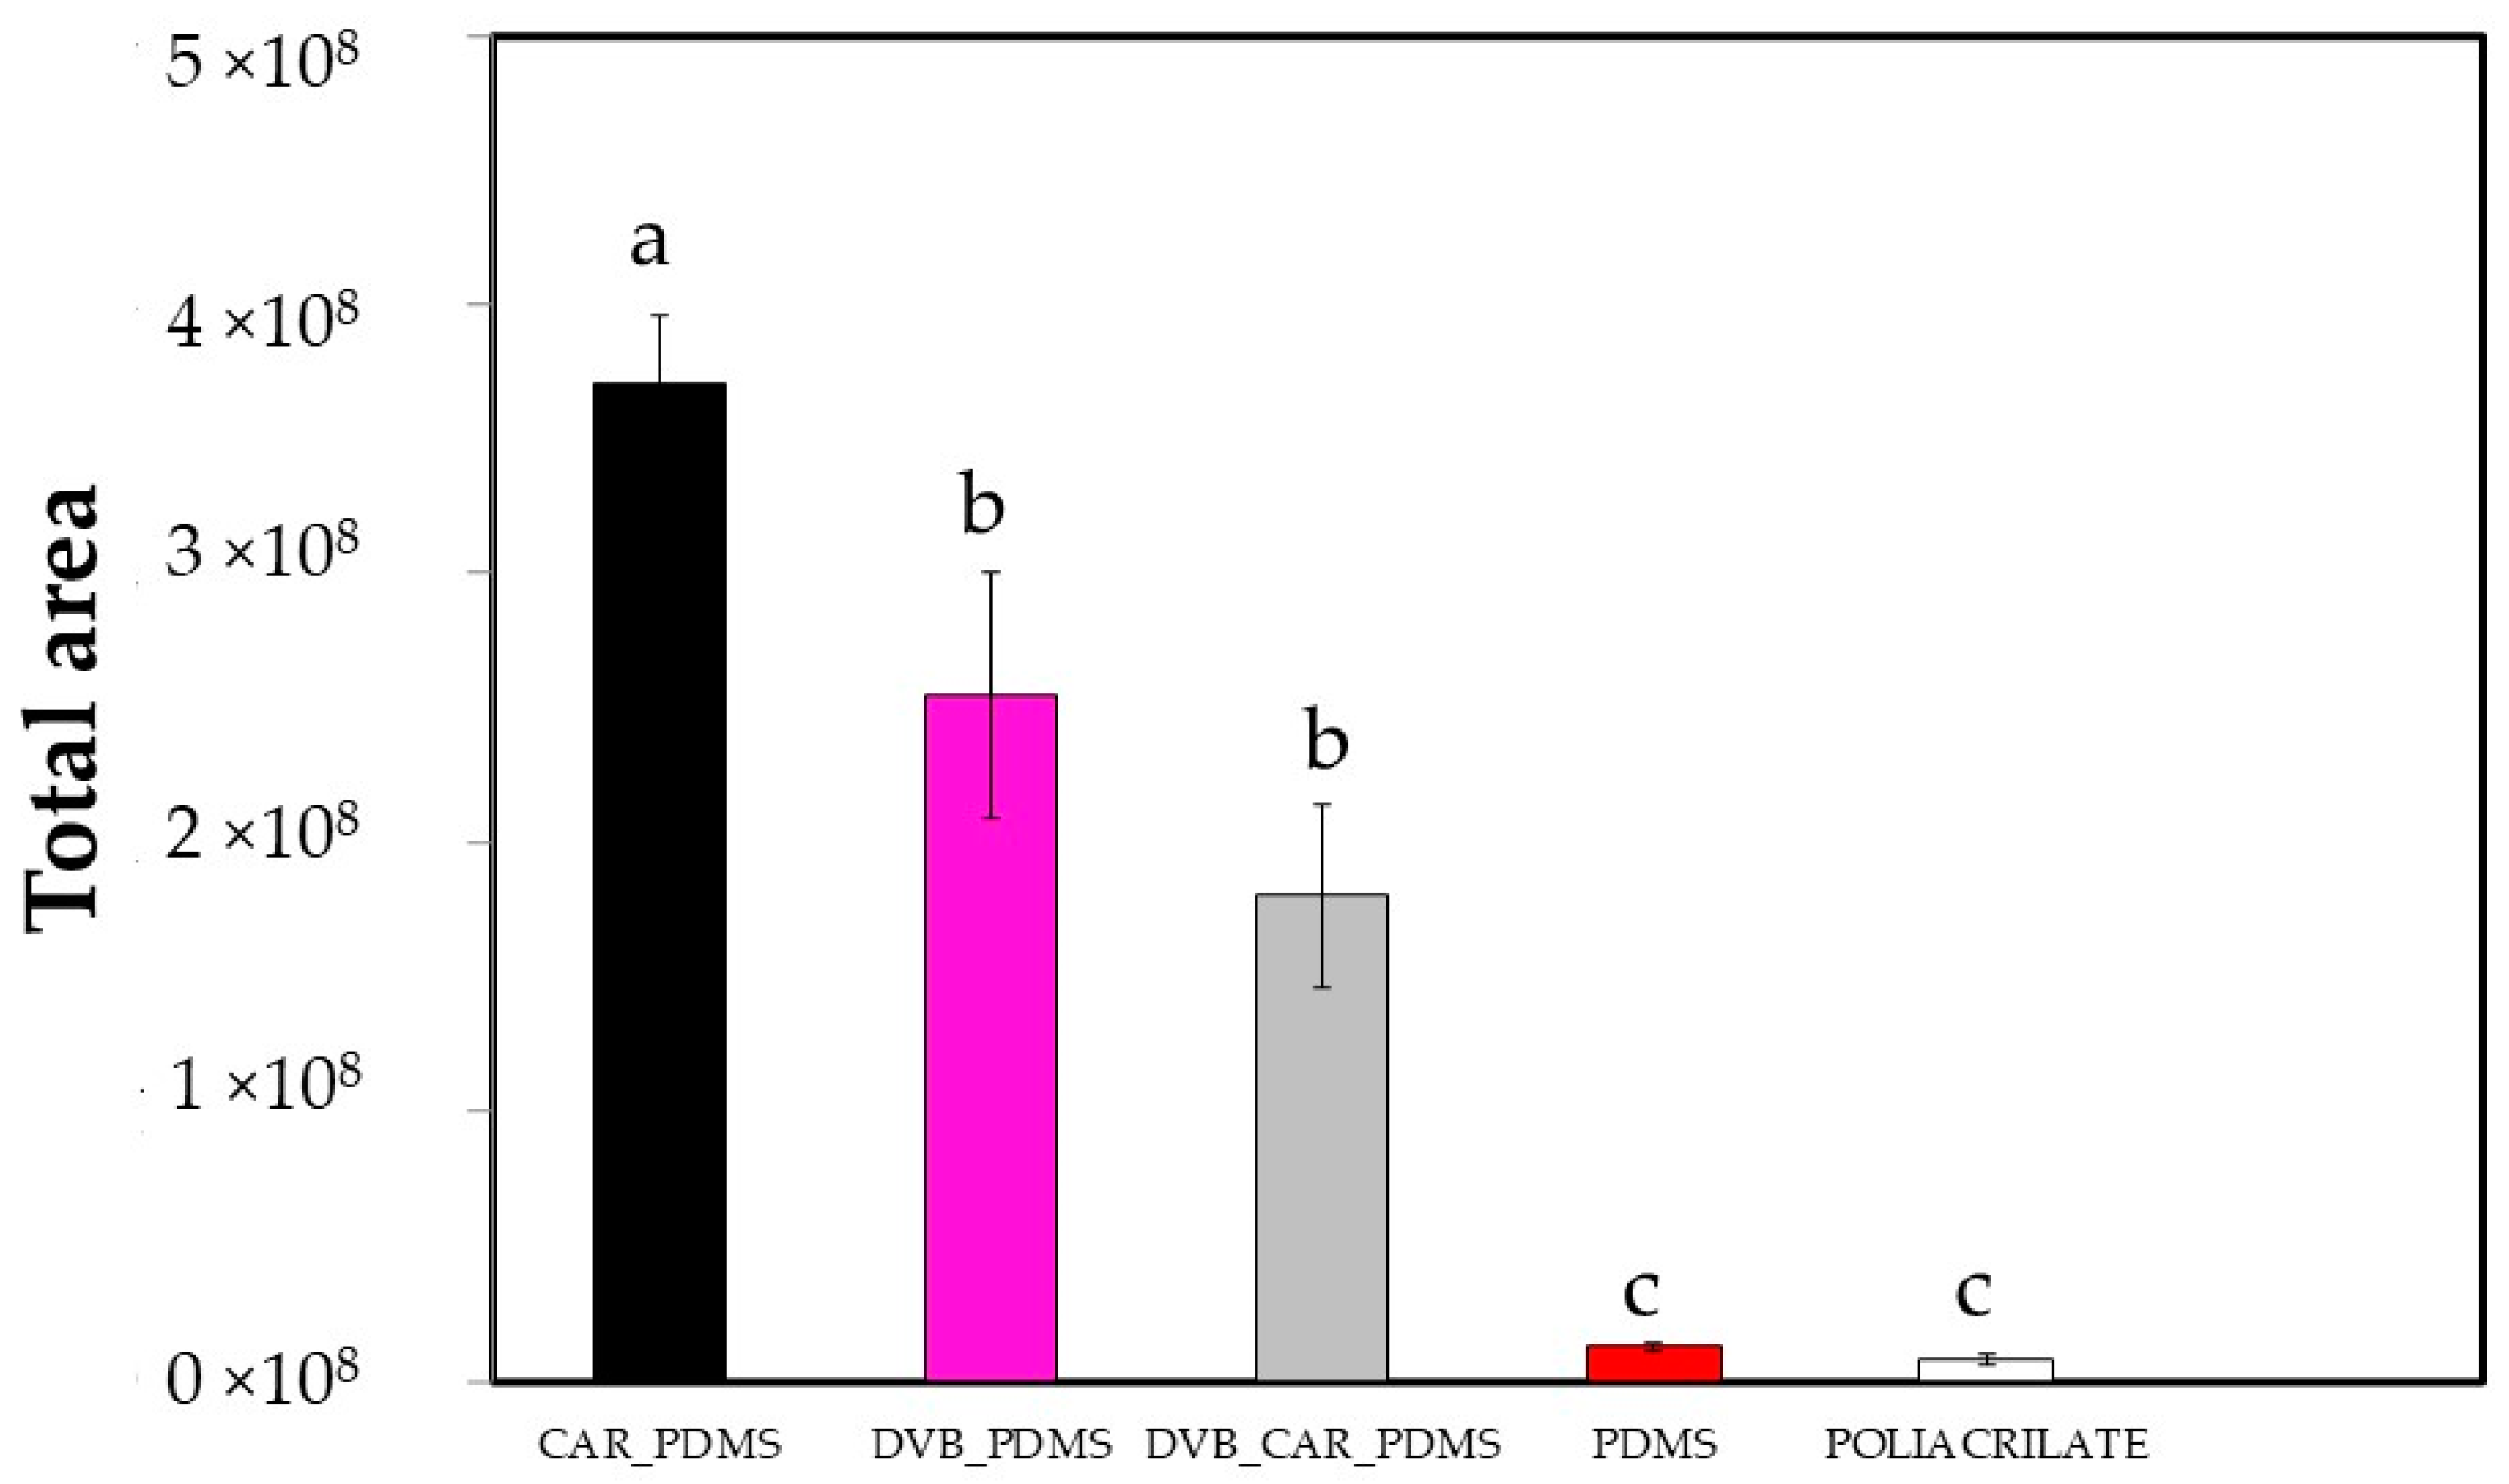
3.1. SPME Fiber Coating Selection

Figure 1 shows the bar graphs of the total area for all five tested SPME fibers. As the extraction conditions were the same for the fibers, the differences observed in the total area reflect the affinity of the volatiles for the different materials or the combination of materials on the coatings for each fiber. This affinity is based on the polarity of the fiber coating material, and in general, non-polar compounds will have a greater affinity for non-polar fibers such as PDMS, while polar compounds will be better recovered by polar fiber materials such as PA, and mixed fibers are useful in extracting mixtures of polar and non-polar compounds [15].
The fiber that showed the largest total area was the CAR/PDMS, followed by DVB/PDMS and DVB/CAR/PDMS. Several studies also reported CAR/PDMS fiber as the most suitable fiber for volatile analysis in roasted meat [14,17,18]. Therefore, CAR/PDMS fiber was selected for the optimization study.

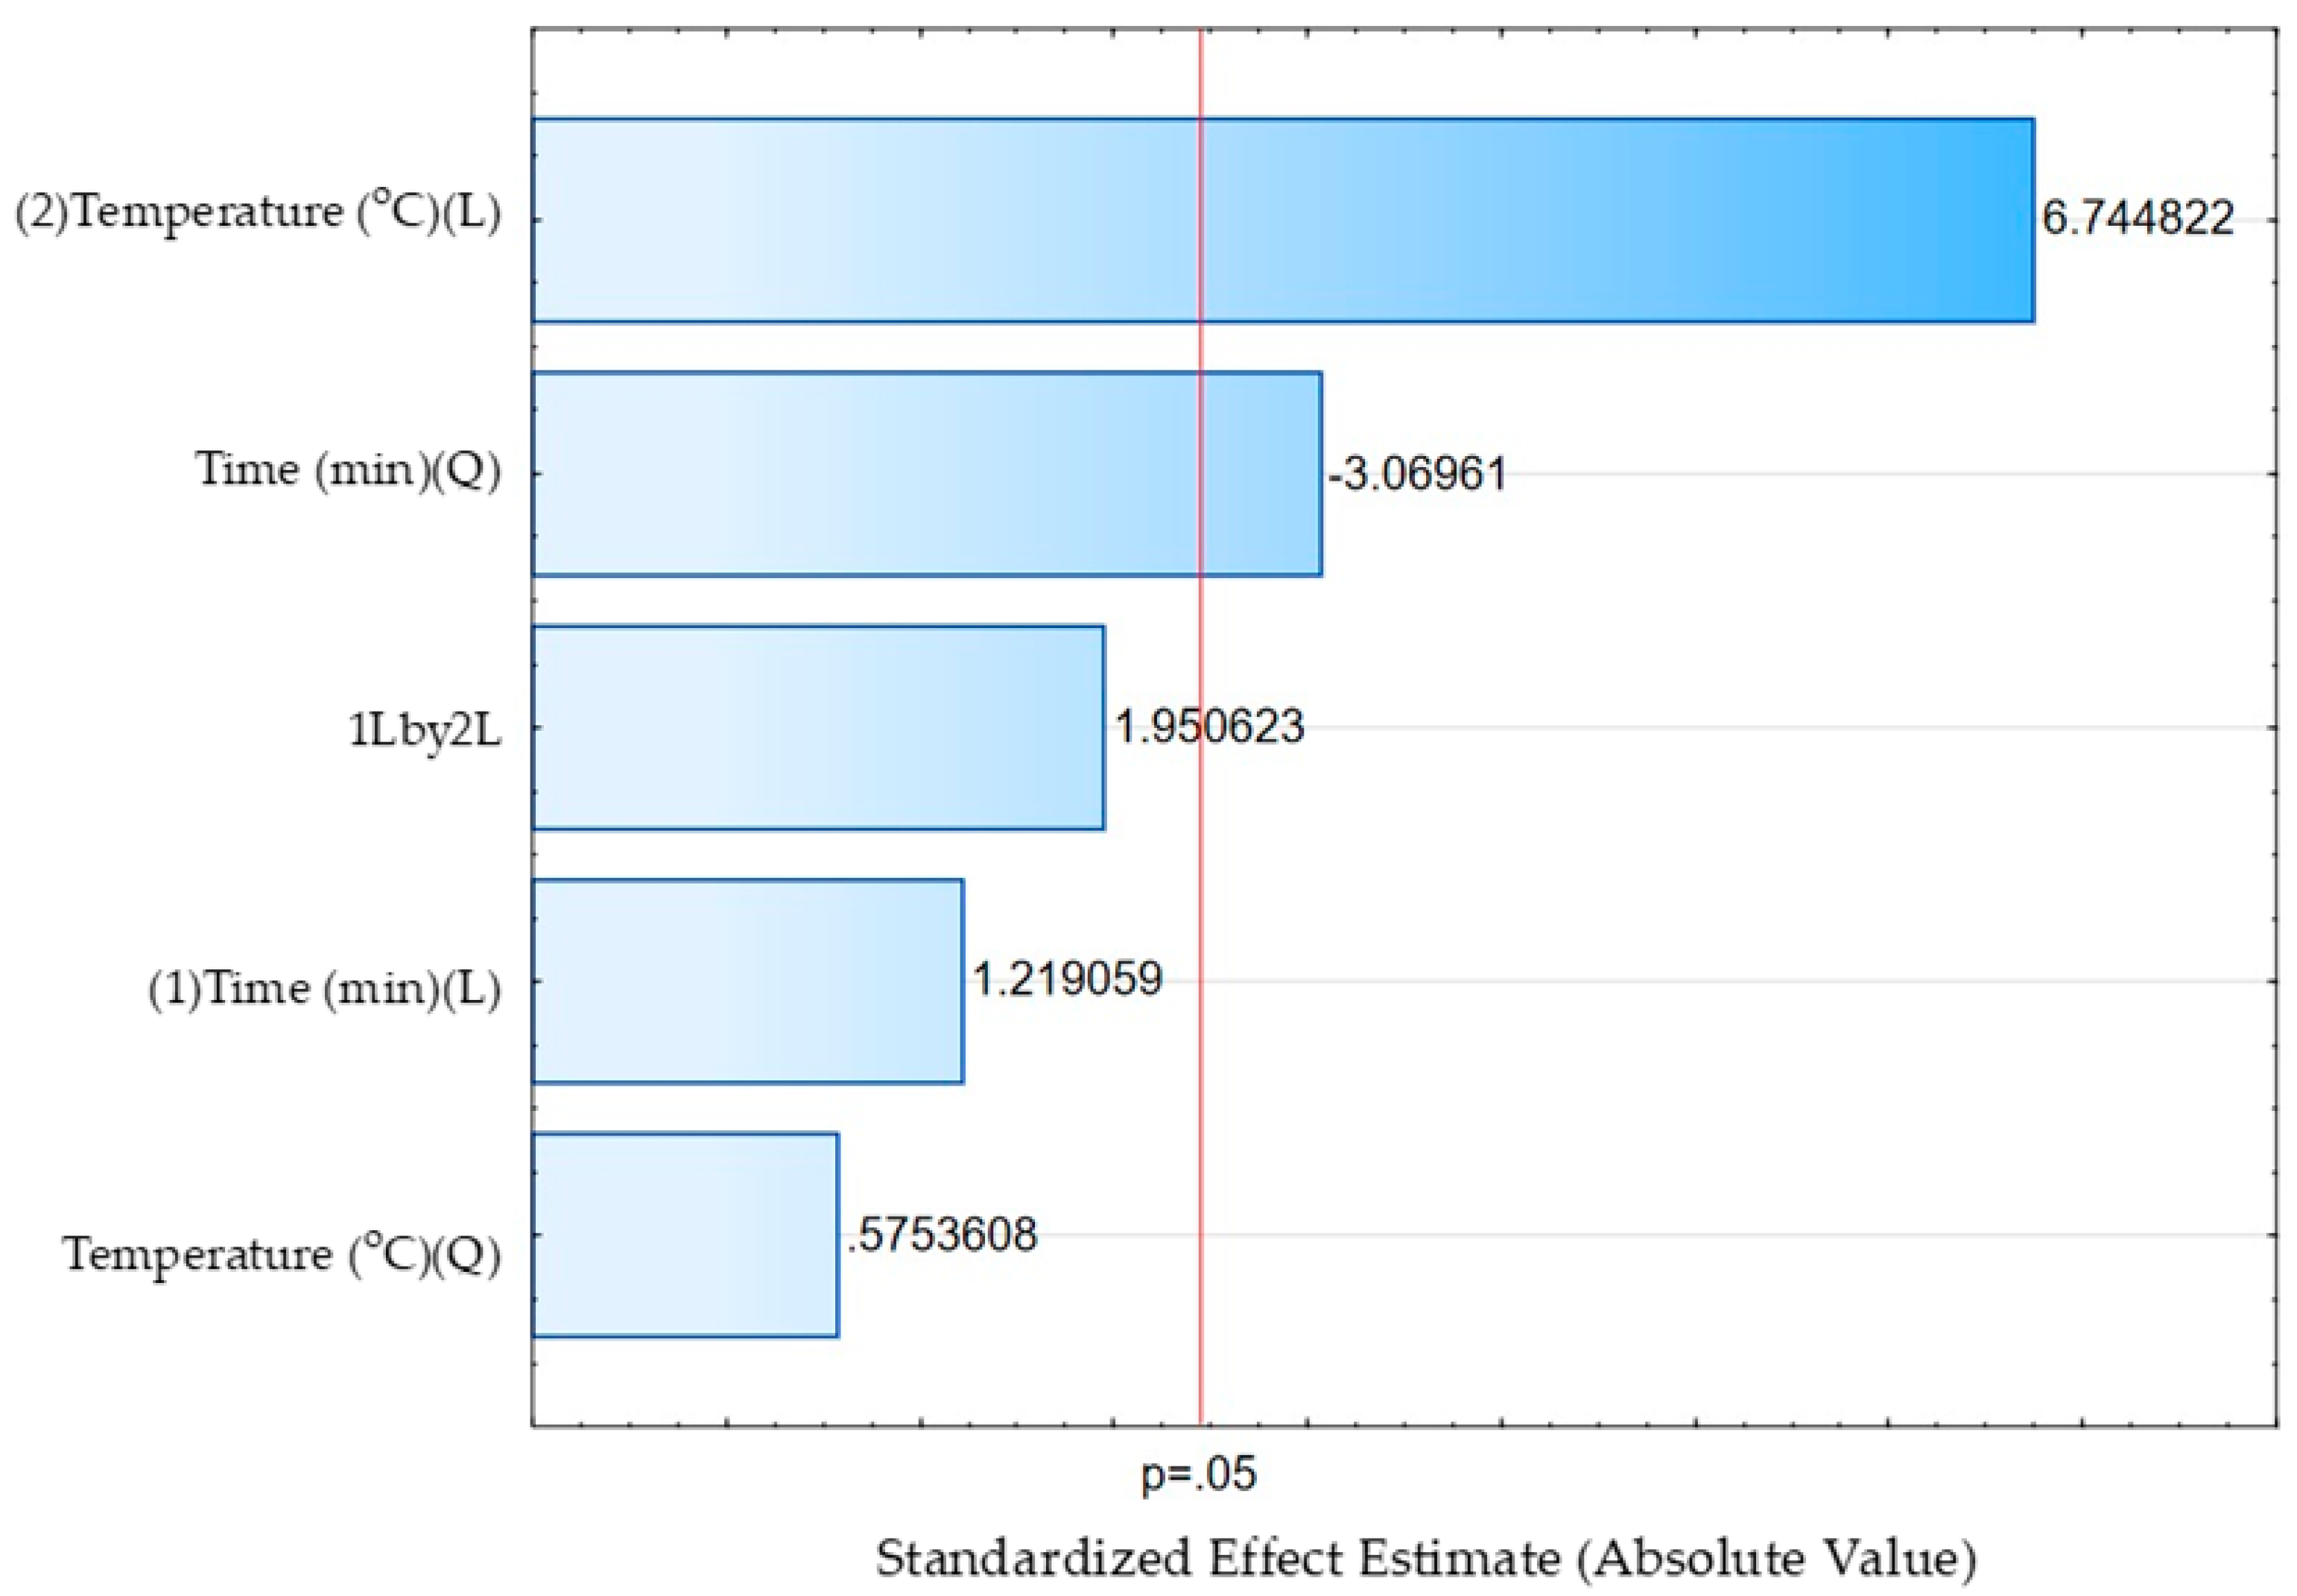
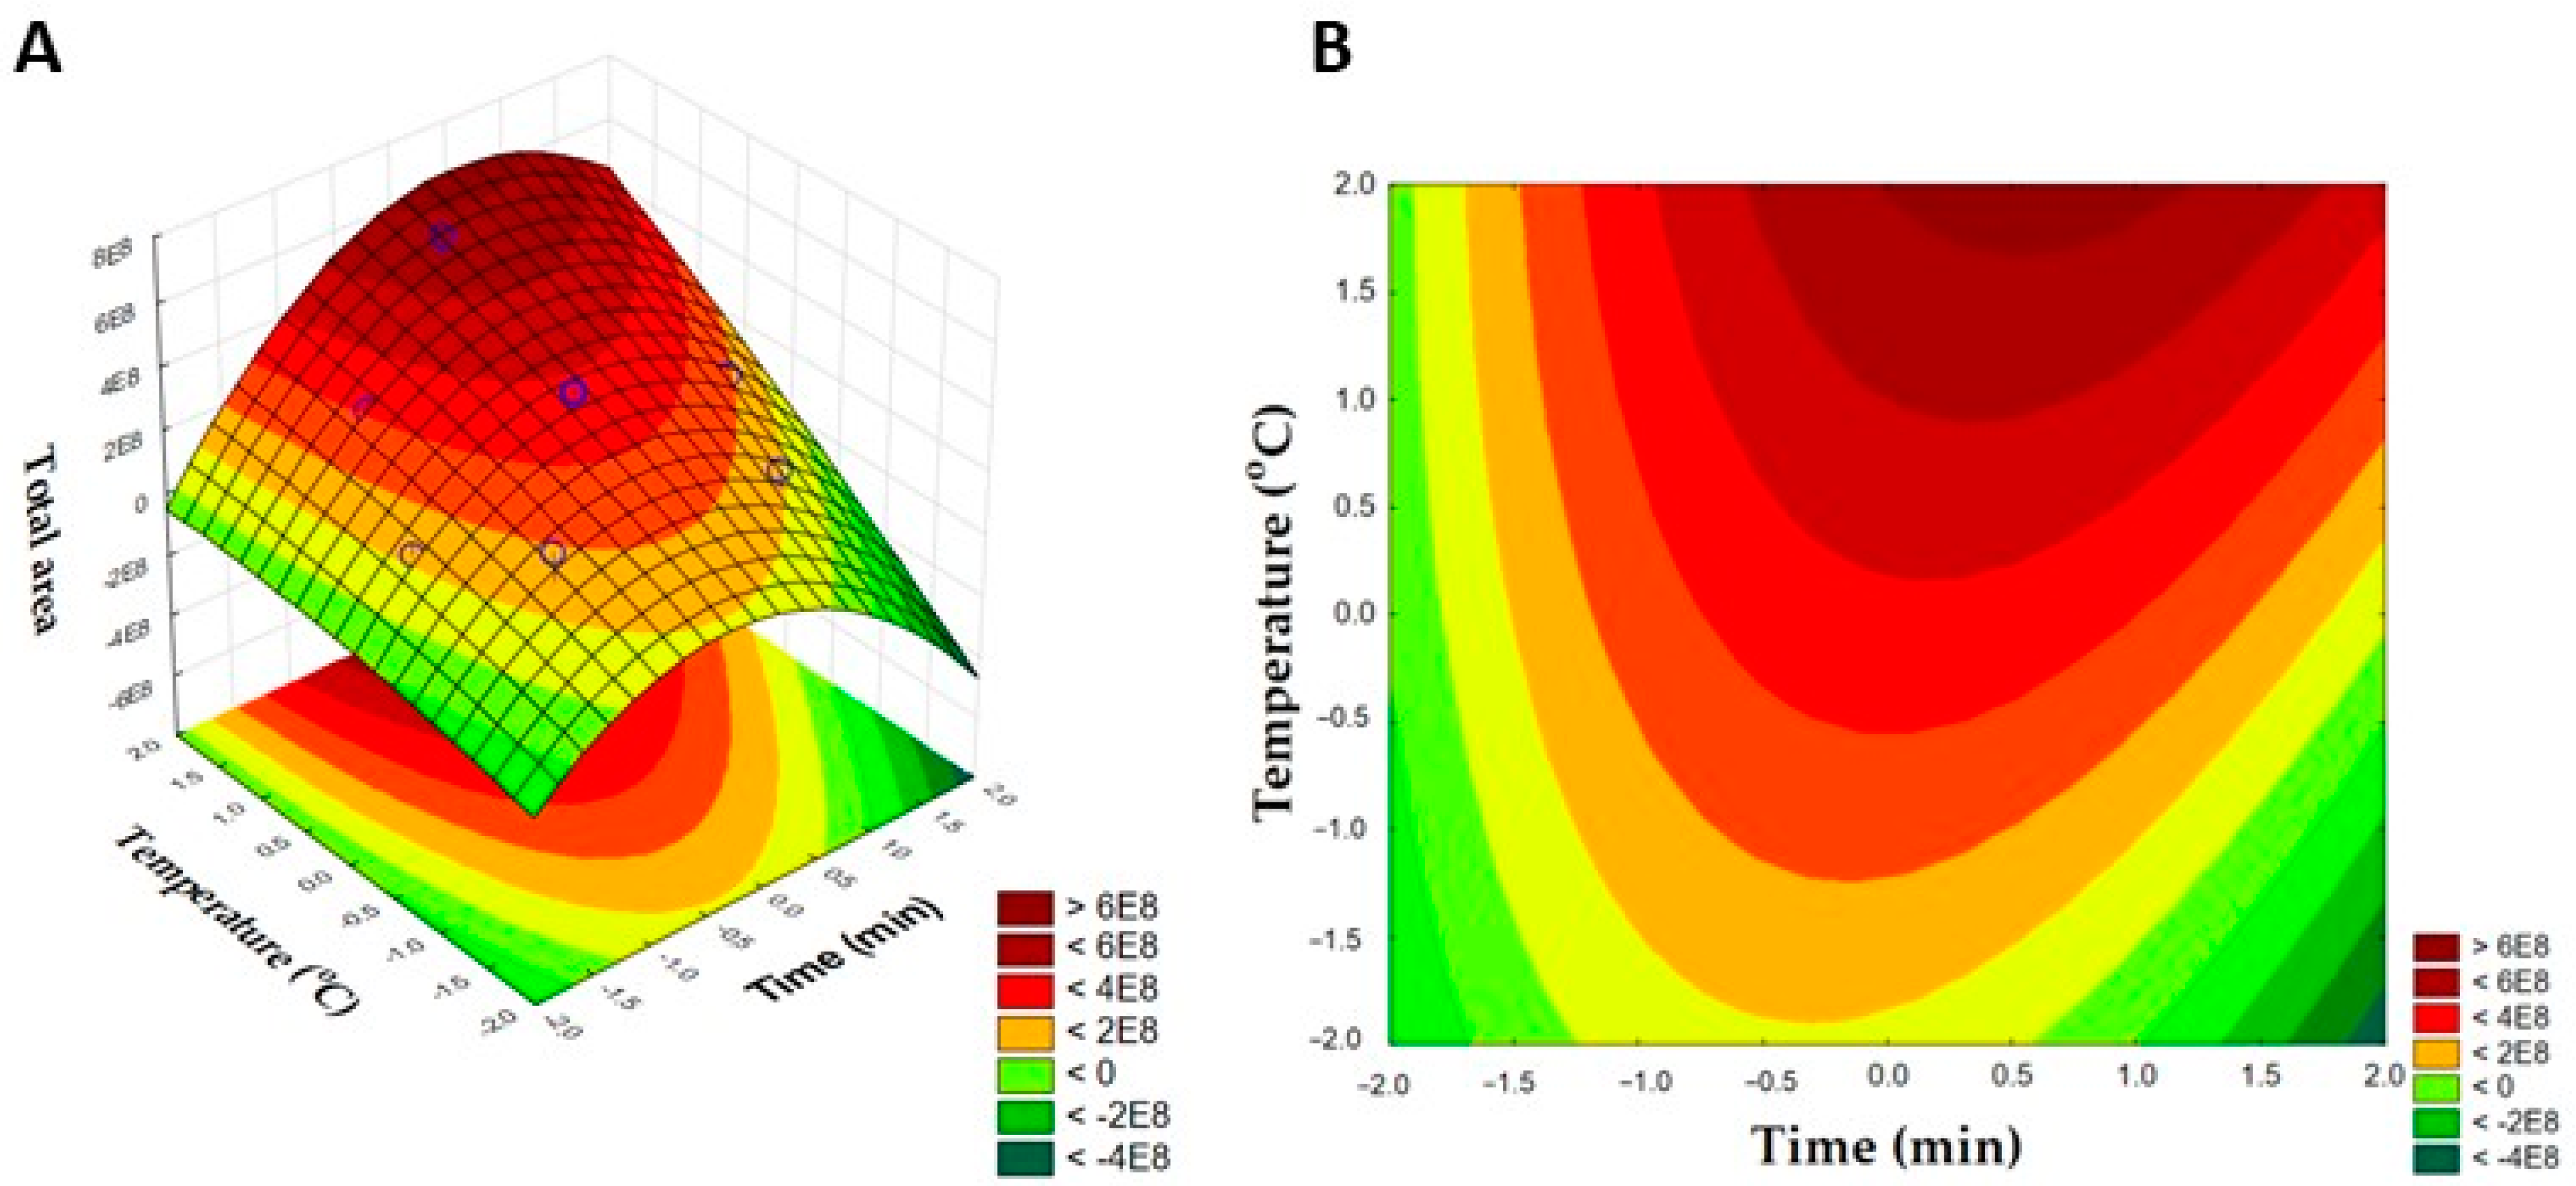
3.2. Optimization of Volatiles Extraction

Table 2 shows the results (expressed in the total area of the chromatograms) of the central composite design (CCD) used to determine the best extraction conditions of volatiles from roasted chicken meat.
The highest value of total area (6.13 × 10⁸) was obtained in experiment 12, with 45 min of extraction at 80 °C; followed by experiment 4 (4.15 × 10⁸), with 60 min of extraction at 75 °C. In general, an increase in the total area of the chromatograms was related to the increase in the extraction temperatures, which can be explained by the disruption of the interactions between the proteins of the meat and its volatile compounds promoted by the elevated temperatures [19].
Figure 2 shows the Pareto diagram, which summarizes the experimental results obtained using the CCD with the CAR/PDMS fiber. The linear temperature (L) and quadratic time (Q) parameters were significant at 95% confidence interval. Since 3 experiments were performed at the central point, the pure error was also estimated (5.2 × 10¹⁴), in order to detect any eventual lack of fit of the model.
Table 3 shows the ANOVA results for the CCD considering the total peak area. The statistical significance of the regression was 6.5, given by the ratio between the quadratic mean of the regression (QMR) and the quadratic mean of the residues (QMr) (QMR/QMr or Fcalculated). The Fcalculated was higher than Ftabulated (5, 6, 95%) (4.4) at a significance level of 95%, which indicates that the proposed regression of the model was statistically significant [12].
Furthermore, the statistical significance of the lack of fit of the model was 2.7, calculated as the ratio between the quadratic mean of the lack of fit (QMlf) and the quadratic mean of the pure error (QMpe) (QMlf/QMpe or Fcalculated). The calculated value was lower than the tabulated one (Ftabulated (5, 6, 95%) = 9.3), indicating a good model fit (Fcalculated < Ftabulated). Therefore, the model obtained does not have a lack of fit in relation to the experimental results, allowing predictions about the total area response for other temperatures and other extraction times within the levels studied. These results are in accordance with the high coefficient of determination value (R2) of the model (84%).
Figure 3 shows the response surface (Figure 3A) and the contour plot (Figure 3B) obtained for the total area response in the CCD. A region of a maximum analytical signal can be observed in both Figure 3 (red regions, area > 6.00 × 10⁸) corresponding to the values of 80 °C (or +1.41 in coded level) and 45 min (or 0 in coded level) for temperature and extraction time, respectively.

3.3. Analysis of Volatile Compounds by SPME for Samples of Chicken Meat Supplemented with Hop β-Acids

The previously optimized extraction conditions were applied for the sample analysis step. The compounds identified for all samples, retention index (RI), their relative percentage, and their respective odor descriptors are shown in Table 4. It is worth mentioning that the relative % values do not represent the real amounts of volatiles in the samples, since they are not quantitative data. In this work, they were used as a parameter to compare the volatile variations related to the different degrees of hop β-acids supplementation in the chicken diets.
In total, 95 volatile compounds were identified in the roasted chicken samples (Supplementary material—Figure S1), a number significantly higher than the 47 compounds determined by gas chromatography ion mobility spectrometry in the study of Zhou et al. [6] for Fuliji roast chicken. Aldehydes and hydrocarbons were the major classes of identified compounds, with 27 volatiles each. Besides aldehydes and hydrocarbons, other chemical classes contributed to the volatile profile of roasted chicken meat, such as alkanes, alcohols, esters, pyrazines, ketones, carboxylic acids, alkenes, sulfur compounds, lactones, acetals, and thiazoles. Similarly, Andaleeb et al. [8] reported that aromatic hydrocarbons (25.62%), alcohols (25.62%), and aldehydes (17.36%) were the main groups of volatiles in Sanhuang chicken breasts supplemented with different Chinese spices; they attributed the predominance of aromatic hydrocarbons to the spices used in the supplementation.
The number of identified compounds varied according to the hop β-acid supplementation: for the control sample (T1, 0 mg kg−1), 72 compounds were identified; for samples with 30, 60, and 120 (T2–T4) mg kg−1 of hop β-acids, 84, 72, and 81 volatile compounds were identified, respectively.
Regarding aldehydes, the samples treated with 30 mg kg−1 (T2) of hop β-acids showed a greater significant area for octanal (8.94 ± 0.77%) when compared to the control sample (0 mg kg−1). This result agrees with previous studies [3,7], in which chicken meat from animals supplemented with 30 mg kg−1 of hop β-acids showed a higher level of long-chain unsaturated fatty acids (n-3 and n-6); that can undergo lipid oxidation leading to the formation of aldehydes such as octanal and (E)-2-octenal that are associated with fatty and citric aroma notes, respectively.
Chicken meat samples whose animals were supplemented with 30 mg kg−1 (T2) of hop β-acids presented higher relative areas of compounds with odoriferous importance such as 2,6-dimethyl pyrazine (5.12 ± 1.41%); its aroma is attributed to notes of chocolate, nuts, and meat products, with a threshold of 400–1500 µg kg−1, and it is naturally found in roasted and grilled beef and chicken [20,21]. Alcohols such as 1-octen-3-ol were identified in all the samples, but with a lower relative area (1.88 ± 0.47%) for the samples treated with 30 mg kg−1 of hop β-acids. This compound has predominant notes of mushrooms and is a key compound for the aroma of roasted meat, with a threshold value of 14 µg kg−1. This alcohol, likewise the aldehydes, has its origin associated with the oxidative degradation of polyunsaturated fatty acids [22].
Among the furans, 2-pentylfuran was found in all samples, including the control (6.09 ± 0.37%); it also impacts the aroma of roasted meats, with odor descriptors of notes of green beans and vegetables, and with a threshold around 6 µg kg−1. Other impact compounds identified in the chicken meat samples were nonanal (threshold from 1 to 8 µg kg−1 and fatty, citric and green odor descriptors), 3,5-diethyl-2-methyl-pyrazine (with nutty and meaty odor descriptors) and decanal (threshold from 0.1 to 6 µg kg−1 and waxy and citric odor descriptors) [4,23,24].
It is important to highlight that some compounds were identified only in the meat of animals that were supplemented with the highest concentrations of hop β-acids (60 and/or 120 mg kg−1 (T3, T4) such as the (E, E)-2,4-decadienal. This compound is generated from the thermal oxidation of polyunsaturated fatty acids and is naturally found in chicken meat. Its odor descriptor is associated with notes of fat and nuances of roasted chicken smell, and its low threshold value (from 0.07 to 10 µg kg−1) implies a great impact on the meat aroma [20].
Thus, the profile of volatile compounds of roasted chicken meat varied considerably with the chicken diet supplementation with hop β-acids; some volatiles of odoriferous importance were identified in the samples with higher concentrations of supplementation. These results are consistent with previous works in the literature that evaluated supplementation of animal diet with hop β-acids in chicken meat volatile profile and found significant effects of supplementation on the concentration of polar metabolites and fatty acids, important for meat quality [3,10]. In general, moderate amounts of hop β-acids (up to 30 mg kg−1) were able to protect proteins and fatty acids against oxidation, thus leading to different volatile profiles.

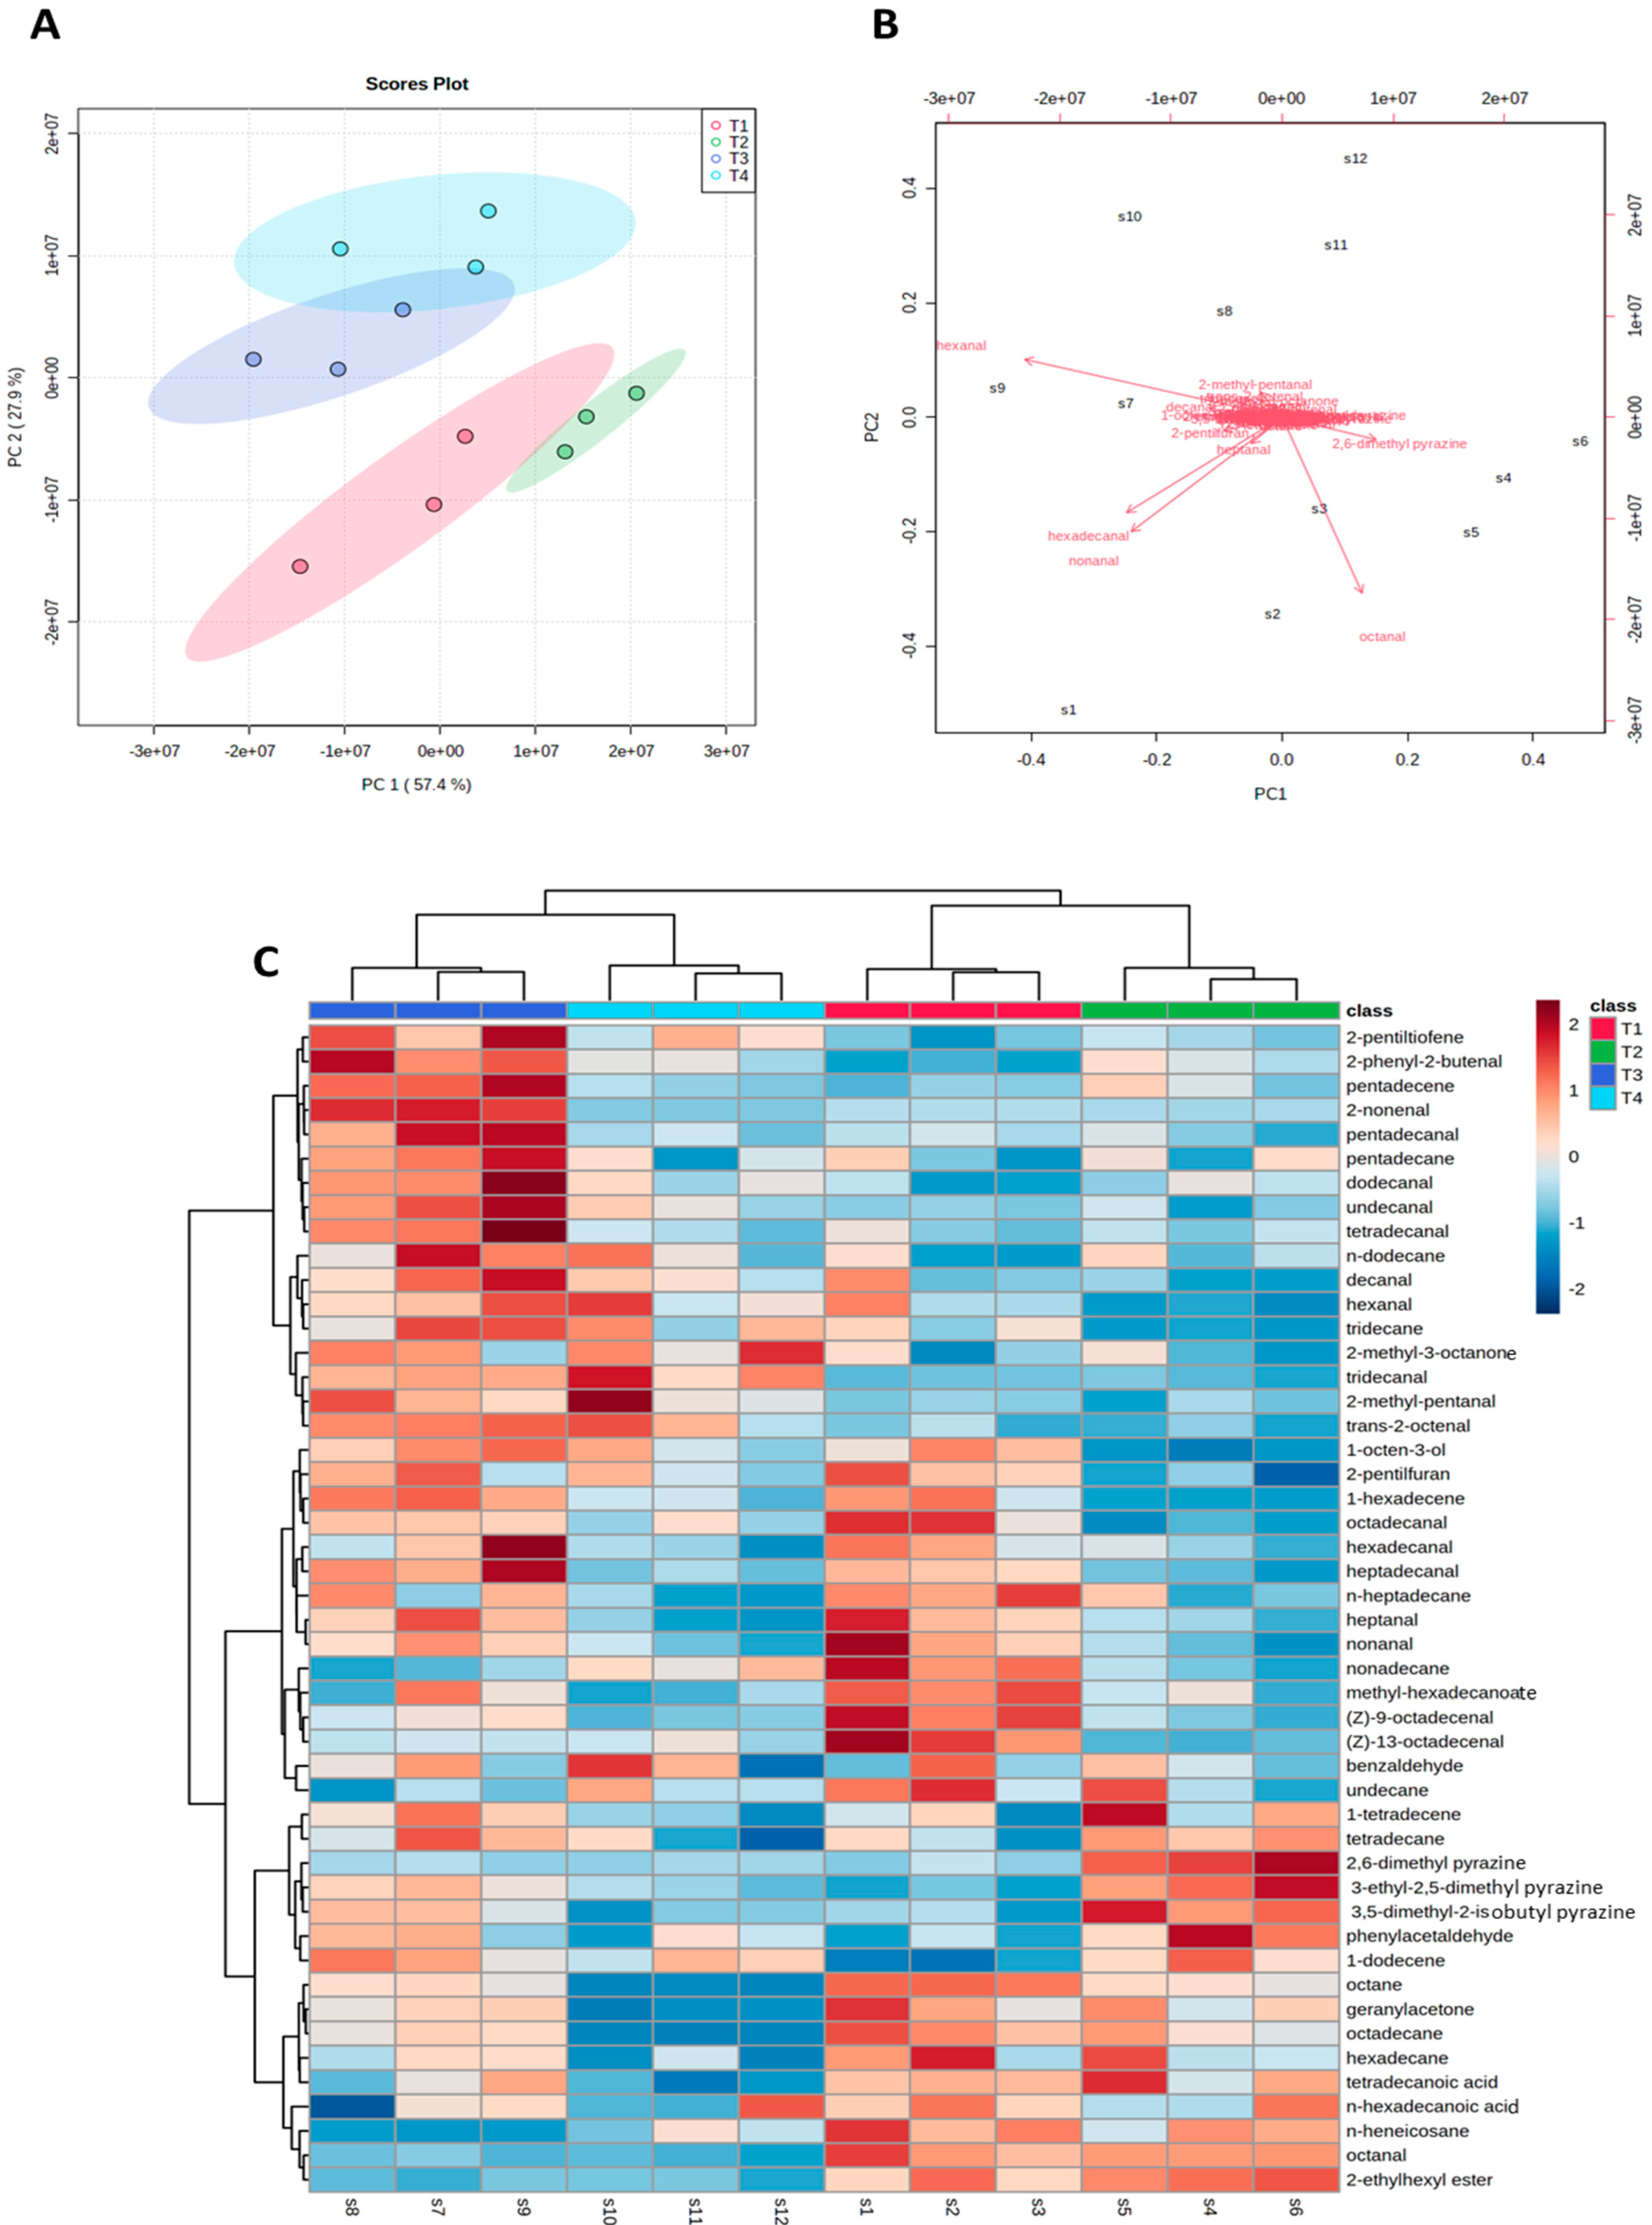
3.4. Principal Component Analysis (PCA)

A principal component analysis (PCA) was performed to separate the samples as a function of hop β-acid supplementation, to assess whether different levels of supplementation could lead to different volatile profiles. Figure 4A,B illustrates the score plot and the biplot of the two first principal components (PC’s), which together explained 85.3% of the total variance of the data (PC1 = 57.4% and PC2 = 27.9%). Figure 4C represents a heat map of the individual replicates of each sample. PCA was able to separate the samples as a function of hop β-acid concentration in two major groups, indicating that different levels of supplementation originated different volatiles in the roasted chicken meat. A major separation was found between the control and low supplementation level (T1 and T2) and the higher levels of supplementation (T3 and T4), which is in accordance with the cluster analysis (Figure 4C).
The negative control (T1) (0 mg kg−1 of β-acids) and T2 (30 mg kg−1 of β-acids) were mainly distinguished by aldehydes such as nonanal, octanal, and hexadecanal, and pyrazines such as the 2,6-dimethyl, pyrazine (Figure 4B,C). The treatments T3 and T4 (60 and 120 mg kg−1 of β-acids) were distinguished by the amount of aldehydes such as hexanal. Aldehydes (hexanal, hexadecanal, nonanal, and octanal) were the volatile class with the highest loadings in both PC’s, indicating their importance in separating the roasted chicken meat in groups according to the level of hop β-acids supplementation. Octanal and 2,6-dimethyl pyrazine were the aldehydes with higher positive loadings for PC1, while hexadecanal and 2-methyl-pentanal were the aldehydes with higher positive loadings for PC2 (Figure 4B). Gkarane et al. [7] also found that alcohols, aldehydes, and ketones were the main volatile compounds responsible for separating their samples, supplemented with algae and insect extracts, in the PCA analysis. In summary, PCA results and cluster analysis highlighted the influence of the concentration of hop β-acids supplementation on the volatile profile of the roasted chicken meat.

4. Conclusions

In this study, the impact of the supplementation of chicken diets with hop β-acids (0, 30, 60, and 120 mg hop β-acid kg−1) on the volatile profile of roasted chicken meat, in combination with a new SPME method developed and optimized with chemometric tools, was evaluated for the first time. The extraction of volatiles by SPME was improved using the fiber with the highest extraction capacity (CAR/PDMS), leading to the optimal extraction conditions of 80 °C and 45 min. A total of 95 volatile compounds from roasted chicken meat were identified, which had their levels, as well as their chemical classes, varying significantly between samples. The sample with supplementation of 30 mg kg−1 of hop β-acid presented around 5 key aroma compounds for chicken meat, mainly pyrazines (such as 2,6-dimethyl, pyrazine, 5.12 ± 1.41%) and aldehydes (such as hexanal, 17.63 ± 1.77%). Aldehydes were one of the major classes of identified volatiles, with a higher incidence in control samples (i.e., without hop β-acids); in the samples containing β-acids, the supplementation must have controlled lipid oxidation, leading to fewer oxidation products, such as aldehydes and alcohols, which affect chicken meat aroma. PCA and cluster analysis separated the samples into 2 groups, according to the level of supplementation; in general, it was demonstrated that the antioxidant action of hop β-acids was able to significantly affect the volatile compounds resulting from the oxidation of polyunsaturated fatty acids in chicken meat. These findings allow new potential applications of hop β-acids as greener supplements for chicken meat, improving the volatile compounds with odoriferous importance and reducing the lipid oxidation that leads to off-flavor formation.

Supplementary Materials

The following supporting information can be downloaded at: https://www.mdpi.com/article/10.3390/pr11010153/s1, Figure S1: Chromatogram of volatiles identified by HS-SPME and GC-MS in roasted chicken meat supplemented with 30 mg kg−1 of hop β-acids, expanding the chromatogram from 11 to 47.5 min.

Author Contributions

Conceptualization, methodology, investigation, supervision, project administration and funding acquisition, review and editing, S.B.J.; formal analysis, data curation, writing—original draft preparation, L.C.d.A.; writing—review and editing, M.R.V.B.; funding acquisition, review and editing, D.R.C. All authors have read and agreed to the published version of the manuscript.

Funding

This research was supported by the Coordenação de Aperfeiçoamento de Pessoal de Nível Superior—Brasil (CAPES)—Finance Code 001. Moreover, the authors would also like to thank the Sao Paulo Research Foundation (FAPESP) for the M.R.V.B. scholarship grant number 2019/18748-8 and D.R.C. grant number 2017/01189-0. The opinions, hypotheses, and conclusions or recommendations expressed in this article are the responsibility of the author(s) and do not necessarily reflect the view of FAPESP and CAPES.

Institutional Review Board Statement

The animal study protocol was approved by the Institutional Animal Care and Use Committee (CEUA/ESALQ/USP-Protocol 2012-10).

Informed Consent Statement

Not applicable.

Data Availability Statement

Not applicable.

Conflicts of Interest

The authors declare no conflict of interest. The funders had no role in the design of the study; in the collection, analyses, or interpretation of data; in the writing of the manuscript; or in the decision to publish the results.

References

  1. Jayasena, D.D.; Jung, S.; Kim, H.J.; Bae, Y.S.; Yong, H.I.; Lee, J.H.; Kim, J.G.; Jo, C. Comparison of quality traits of thigh meat from Korean native chickens and broilers. Korean J. Food Sci. Anim. Resour. 2011, 31, 684–692. [Google Scholar] [CrossRef] [Green Version]
  2. Wang, Y.; Zhou, X.; Liu, M.; Zang, H.; Zhang, H.; Yang, H.; Jin, S.; Qi, X.; Shan, A.; Feng, X. Quality of chicken breast meat improved by dietary pterostilbene referring to up-regulated antioxidant capacity and enhanced protein structure. Food Chem. 2023, 405, 134848. [Google Scholar] [CrossRef]
  3. Zawadzki, A.; Alloo, C.; Grossi, A.B.; Nascimento, E.S.P.; Almeida, L.C.; Bogusz, S.; Skibsted, L.H.; Cardoso, D.R. Effect of hop β-acids as dietary supplement for broiler chickens on meat composition and redox stability. Food Res. Int. 2018, 105, 210–220. [Google Scholar] [CrossRef]
  4. Jayasena, D.D.; Ahn, D.U.; Nam, K.C.; Jo, C. Factors affecting cooked chicken meat flavour: A review. Ann. Anim. Sci. 2013, 14, 265–268. [Google Scholar] [CrossRef] [Green Version]
  5. Yang, Z.; Xie, J.; Zhang, L.; Du, R.; Cao, C.; Wang, M.; Acree, T.; Sun, B. Aromatic effect of fat and oxidized fat on a meat-like model reaction system of cysteine and glucose. Flavour Fragr. J. 2015, 30, 320–329. [Google Scholar] [CrossRef]
  6. Zhou, H.; Cui, W.; Gao, Y.; Li, P.; Pu, X.; Wang, Y.; Wang, Z.; Xu, B. Analysis of the volatile compounds in Fuliji roast chicken during processing and storage based on GC-IMS. Curr. Res. Food Sci. 2022, 5, 1484–1493. [Google Scholar] [CrossRef]
  7. Gkarane, V.; Ciulu, M.; Altmann, B.A.; Schmitt, A.O.; Mörlein, D. The Effect of Algae or Insect Supplementation as Alternative Protein Sources on the Volatile Profile of Chicken Meat. Foods 2020, 9, 1235. [Google Scholar] [CrossRef] [PubMed]
  8. Andaleeb, R.; Zhang, D.; Jianga, S.; Zhang, Y.; Liu, Z. Volatile profile and multivariant analysis of Sanhuang chicken breast in combination with Chinese 5-spice blend and garam masala. Food Sci. Hum. Wellness 2023, 12, 57–68. [Google Scholar] [CrossRef]
  9. Bennato, F.; Luca, A.D.; Martino, C.; Ianni, A.; Marone, E.; Grotta, L.; Ramazzotti, S.; Cichelli, A.; Martino, G. Influence of grape pomace intake on nutritional value, lipid oxidation and volatile profile of poultry meat. Foods 2020, 9, 508. [Google Scholar] [CrossRef] [PubMed] [Green Version]
  10. Bortoluzzi, C.; Menten, J.F.M.; Romano, G.G.; Pereira, R.; Napty, G.S. Effect of hops β-acids (Humulus lupulus) on per-formance and intestinal health of broiler chickens. J. Appl. Poult. Res. 2014, 23, 437–443. [Google Scholar] [CrossRef]
  11. Karre, L.; Lopez, K.; Getty, K.J.K. Natural antioxidants in meat and poultry products. Meat Sci. 2013, 94, 220–227. [Google Scholar] [CrossRef] [PubMed]
  12. Durello, R.S.; Silva, L.M.; Bogusz, S. Química do lúpulo. Quím. Nova 2019, 42, 900–919. [Google Scholar] [CrossRef]
  13. Madruga, M.S.; Elmore, J.S.; Dodson, A.T.; Mottram, D.S. Volatile flavor profile of goat meat extracted by three widely used techniques. Food Chem. 2009, 115, 1081–1087. [Google Scholar] [CrossRef]
  14. Brunton, N.P.; Cronin, D.A.; Monahan, F.J. Volatile components associated with freshly cooked and oxidized off-flavours in Turkey breast meat. Flavour Fragr. J. 2002, 17, 327–334. [Google Scholar] [CrossRef]
  15. Bogusz, S.; Melo, A.M.T.; Zini, C.A.; Godoy, H.T. Optimization of the extraction conditions of the volatile compounds from chili peppers by headspace solid phase micro-extraction. J. Chromatogr. A 2011, 1218, 3345–3350. [Google Scholar] [CrossRef] [PubMed]
  16. Ferreira, S.L.C.; Bruns, R.E.; Silva, E.G.P.; Santos, W.N.L.; Quintella, C.M.; David, J.M.; Andrade, J.B.; Breitkreitz, M.C.; Jardim, I.C.S.F.; Barros Neto, B. Statistical designs and response surface techniques for the optimization of chromatographic systems. J. Chromatogr. A 2007, 1158, 2–14. [Google Scholar] [CrossRef]
  17. Machiels, D.; Istasse, L. Evaluation of two commercial solid-phase microextraction fibres for the analysis of target aroma compounds in cooked beef meat. Talanta 2003, 61, 529–537. [Google Scholar] [CrossRef]
  18. Mikš-Krajnik, M.; Yoon, Y.; Yuk, H. Detection of volatile organic compounds as markers of chicken breast spoilage using HS-SPME-GC/MS-FASST. Food Sci. Biotechnol. 2015, 24, 361–372. [Google Scholar] [CrossRef]
  19. Pino, L.M.; Cavaleiro, C.; Conceição Castilho, M.C.; D’Arce, M.A.B.R.; Torres, E.A.S.; Ramos, F. The use of natural antioxidants (oregano and sage) to reduce hexanal production in precooked chicken during chill storage. Vitae 2013, 20, 105–110. [Google Scholar] [CrossRef]
  20. Burdock, A.G. Fenaroli’s Handbook of Flavor Ingredients, 6th ed.; Taylor & Francis Group: New York, NY, USA, 2010; 2162p. [Google Scholar]
  21. Mancinelli, A.C.; Silletti, E.; Mattioli, S.; Dal Bosco, A.; Sebastiani, B.; Menchetti, L.; Koot, A.; van Ruth, S.; Castellini, C. Fatty acid profile, oxidative status, and content of volatile organic compounds in raw and cooked meat of different chicken strains. Poultry Sci. 2021, 100, 1273–1282. [Google Scholar] [CrossRef]
  22. Ayseli, M.T.; Selli, S.; Filik, G. Evaluation of volatile compounds in chicken breast meat using simultaneous distillation and extraction with odour activity value. J. Food Nutr. Res. 2014, 53, 137–142. [Google Scholar]
  23. Shi, H.H.; Ho, C.T. The flavour of poultry meat. In Flavor of Meat and Meat Products; Shahidi, F., Ed.; Springer: New York, NY, USA, 1994; pp. 52–70. ISBN 978-0-7514-0217. [Google Scholar] [CrossRef]
  24. Farmer, L.J. Poultry meat flavour. In Poultry Meat Science; Richardson, R., Mead, C., Eds.; Carfax Publishing Company: Oxford, UK, 1999; pp. 127–158. ISBN 0-85199-237-4. [Google Scholar]
Figure 1. Extraction efficiency of the SPME fiber coatings tested. The results are expressed as the mean of the triplicates for the total area of the chromatogram. Different letters indicate statistically significant differences by ANOVA and Tukey’s test at 95% confidence.
Processes 11 00153 g001
Figure 2. Pareto diagram of the effects of the variables studied. Response: total area, 2 factors, 1 block, 12 experiments, pure error 3.45 × 10¹⁵.
Processes 11 00153 g002
Figure 3. (A) Response surface obtained by the quadratic model for total area = 3.47 × 10⁸ + 2.70 × 10⁸ ∗ t − 8.76 × 10⁷ ∗ t2 +1.33 × 10⁸ ∗ T + 5.91 × 10⁶ ∗ T2 + 4.77 × 10⁷ ∗ t ∗ T; (B) contour plot of the optimization of extraction temperature (T, °C) and extraction time (t, min) for the roasted chicken meat volatiles extraction by HS-SPME.
Processes 11 00153 g003
Figure 4. (A) Score plot of the first two principal components (PC’s) of the volatile compounds extracted from the headspace of the roasted chicken meat samples; (B) Loadings plot showing the first two PC’s of the volatile compounds for samples of roasted chicken meat; (C) heat map of the volatile compounds for samples of roasted chicken meat.
Processes 11 00153 g004
Table 1. Factors and levels applied to optimize the extraction conditions of volatiles from roasted chicken meat by HS-SPME.
VariablesCoded Variables
−1.41−10+1+1.41
Time (t, min)2430456066
Temperature (T, °C)4550637080
Table 2. Experimental conditions and the response (total area) obtained by the central composite design (CCD) for the optimization of the extraction conditions of volatile compounds from roasted chicken meat by HS-SPME.
ExperimentX1 t (min) X2 T (°C) Total Area *
1 −1 30 −1 50 2.36 × 10⁸
2 1 60 −1 50 2.28 × 10⁸
3 −1 30 1 75 3.53 × 10⁸
4 1 60 1 75 4.70 × 10⁸
5 0 45 0 63 4.08 × 10⁸
6 0 45 0 63 3.90 × 10⁸
7 0 45 0 63 3.88 × 10⁸
8 0 45 0 63 3.02 × 10⁸
9 −1.41 24 0 63 1.87 × 10⁸
10 1.41 66 0 63 3.09 × 10⁸
11 0 45 −1.41 45 1.77 × 10⁸
12 0 45 1.41 80 6.13 × 10⁸
* Total area expressed in arbitrary units.
Table 3. Analysis of variance (ANOVA) of the parameters of time and temperature adopted for the extraction of volatile compounds from roasted chicken meat by HS-SPME.
Sources of
Variation
Sum of
the Squares
Degrees of
Freedom
Quadratic
Mean (QM)
FcalculatedFtabulated Fcalculated/Ftabulated
Regression (R)2.08 × 10¹⁷ 5 4.16 × 10166.48 4.39 1.45
Residues (r)3.86 × 10166 6.43 × 10¹⁵
Lack of fit (lf)2.47 × 10¹⁷ 11 2.24 × 10¹⁶
Pure error (pe)1.03 × 10163 3.45 × 10152.73 9.28 1.50
Total 2.82 × 10161 9.41 × 10¹⁵
R2 0.84
R2 maximum 0.96
Table 4. Volatile compounds identified by HS-SPME and GC-MS in roasted chicken samples with and without hop β-acid supplementation (0–120 mg kg−1) under optimal extraction conditions.
NAME RIcal RI lit Δ 0 mg kg−130 mg kg−1 60 mg kg−1120 mg kg−1 Odor Descriptor
Acetals
4-methyl-2-pentyl-1,3-dioxolane 1096 1097 1 0.87 a ± 0.24 0.53 b ± 0.03 0.28 b ± 0.08 0.34 b ± 0.04 fruity
Alcohols
(E)-2-decen-1-ol 1273 1273 0 0.09 a ± 0.02 - 0.06 b ± 0.02 - wax, citrus
tetradecanol 1677 1671 6 ND ND ND 0.02 a ± 0.00 coconut
7-tetradecanol 1568 1575 7 - 0.03 a ± 0.01 - - -
1-undecanol 1372 1371 1 - 0.11 b ± 0.08 - 0.41 a ± 0.06 mandarin
dodecanol 1483 1482,8 0 0.04 a ± 0.00 0.04 a ± 0.01 ND 0.08 a ± 0.03 fat, wax
tridecanol 1580 1585 5 - - - 0.02 a ± 0.00 must
5-methyl-2-(1-methylethyl)-1-hexanol 1076 1066 −10 0.08 a ± 0.06 0.27 a ± 0.02 0.08 a ± 0.02 0.05 a ± 0.03 -
1-octen-3-ol 985 985 0 3.10 a ± 0.98 1.88 a ± 0.47 2.70 a ± 0.44 3.25 a ± 0.28 mushroom
1-hexadecanol 1885 1882 3 ND 0.03 a ± 0.00 ND 0.02 a ± 0.00 flower, wax
1-heptadecanol 1941 1941 0 ND ND - -
cyclopentanol 763 765 2 ND 1.29 a ± 0.28 ND ND pungent
Aldehydes
benzaldehyde 970 971 1 8.35 a ± 1.26 9.26 a ± 0.33 8.69 a ± 0.71 8.22 a ± 0.71 almond, sugar
(Z)-13-octadecenal 2007 2007 0 0.12 a,b ± 0.01 0.03 b ± 0.01 0.13 a ± 0.05 0.07 a,b ± 0.04 wax
(E)-2-decenal 1270 1265 −5 0.07 b ± 0.02 0.15 b ± 0.07 0.07 b ± 0.02 0.38 a ± 0.08 green, fatty
(E)-2-heptenal 965 964 −1 0.15 a ± 0.05 0.07 a ± 0.07 0.08 a ± 0.00 0.32 a ± 0.16 green, fatty
(E)-2-undecenal 1371 1370 1 - ND ND ND wax, meat, green
2-phenyl-2-butenal 1280 1281 −1 0.09 b ± 0.04 0.27 a ± 0.03 0.06 b ± 0.02 0.31 a ± 0.19 roast beef
2-nonenal 1167 1168 1 0.19 b ± 0.04 0.13 b ± 0.03 0.21 b ± 0.07 0.48 a ± 0.13 fatty, wax
2-butyl, (Z) 2-octenal 1372 1372 0 0.12 a ± 0.04 0.09 a ± 0.04 - - -
(Z)-9-octadecenal 2001 2007 −6 0.32 a ± 0.18 0.15 a ± 0.03 0.42 a ± 0.18 0.25 a ± 0.12 fatty
decanal 1210 1208 −2 3.29 a,b ± 0.55 2.94 b ± 0.18 3.42 a,b ± 0.16 3.89 a ± 0.15 wax, citrus
dodecanal 1414 1415 −1 0.41 b ± 0.09 0.44 a,b ± 0.10 0.50 a,b ± 0.09 0.80 a ± 0.21 soap, wax, citrus
phenylacetaldehyde 1055 1051 4 0.83 a ± 0.17 1.73 a ± 0.53 0.63 a ± 0.03 0.91 a ± 0.43 green, tobacco
heptadecanal 1925 1920 5 0.08 a ± 0.01 0.04 a ± 0.00 0.06 a ± 0.03 0.07 a ± 0.02 -
heptanal 909 910 1 2.40 a ± 0.12 1.83 a,b ± 0.08 1.73 b ± 0.17 1.97 a,b ± 0.43 green, fatty
hexadecanal 1823 1825 2 10.86 a,b ± 0.51 9.14 b ± 0.44 13.36 a ± 2.57 9.75 a,b ± 1.41 paper card
hexanal 807 806 −1 20.73 a ± 1.19 17.63 a ± 1.77 21.76 a ± 3.39 21.81 a ± 0.14 grass, fatty
ethyl benzaldehyde 1172 1168 −4 - 0.11 b ± 0.02 - 0.86 a ± 0.24 sweet
nonanal 1110 1108 −2 13.96 a ± 0.50 10.74 b ± 0.32 12.33 a,b ± 0.36 11.13 b ± 1.32 fat, citrus, green
octadecanal 2027 2021 6 0.35 a,b ± 0.05 0.18 b ± 0.03 0.52 a ± 0.18 0.35 a,b ± 0.12 oily
octanal 1010 1007 −3 8.15 a,b ± 0.16 8.94 a ± 0.77 5.19 b.c ± 2.53 4.08 c ± 0.70 waxy, greasy
pentadecanal 1720 1721 1 0.57 a,b ± 0.12 0.43 b ± 0.11 0.73 a,b ± 0.26 1.03 a ± 0.33 fresh, wax
2-methyl-pentanal 746 746 0 1.83 a ± 0.68 2.05 a ± 1.22 1.76 a ± 0.32 1.60 a ± 0.66 ether, fruity
tetradecanal 1618 1617 1 0.54 b ± 0.12 0.51 b ± 0.14 0.72 a,b ± 0.18 1.07 a ± 0.25 fatty, wax, citrus
(E, E)-2,4-decadienal 1330 1325 5 ND ND ND 0.12 a ± 0.05 oily, chicken fat
(E)-2-octenal 1065 1070 −5 0.62 b ± 0.12 0.73 a,b ± 0.15 0.55 b ± 0.11 1.02 a ± 0.09 fatty and citric
tridecanal 1517 1513 4 0.20 a ± 0.06 0.20 a ± 0.09 0.28 a ± 0.10 0.44 a ± 0.11 floral, aldehyde
undecanal 1313 1314 −1 0.36 a ± 0.05 0.30 a ± 0.07 0.34 a ± 0.04 0.43 a ± 0.07 wax, soap, green
Carboxylic acids
tetra decanoic acid 1772 1770 2 0.03 a ± 0.02 0.05 a ± 0.01 0.02 a ± 0.01 0.03 a ± 0.00 wax, fatty, soap
hexadecenoic acid 1973 1968 5 0.54 a ± 0.08 0.57 a ± 0.21 0.33 a ± 0.08 0.36 a ± 0.07 wax, candle
Esters
methyl octadecanoate 2131 2128 3 ND ND 0.08 a ± 0.01 - oily, wax
ethyl hexadecanoate 1997 1994 −3 0.03 a ± 0.00 ND - - waxy, fruity
octadecanoic acid, 2-ethylhexyl ester 1706 1715 9 0.04 a,b ± 0.01 0.05 a ± 0.01 0.03 a,b ± 0.01 0.02 b ± 0.00 fruity
methyl hexadecanoate 1931 1927 4 0.03 a ± 0.01 - - - oily, fatty, wax
Hydrocarbons
p-xylene 875 877 2 0.20 a ± 0.09 0.06 a ± 0.01 ND ND alkane
toluene 784 784 0 1.08 a ± 0.02 0.65 a ± 0.57 1.03 a ± 0.07 0.80 a ± 0.10 -
undecane 1100 1100 0 0.49 a ± 0.05 0.47 a ± 0.07 ND 0.34 a ± 0.00 -
1-tetradecene 1392 1393 −1 0.55 a ± 0.09 0.54 a ± 0.18 0.63 a ± 0.10 0.59 a ± 0.07 alkane, soft, wax
dodecane 1200 1200 0 1.04 a ± 0.10 1.30 a ± 0.15 1.17 a ± 0.02 1.30 a ± 0.14 alkane, gasoline
pentadecene 1493 1492 0 0.07 a ± 0.00 0.09 a ± 0.03 0.08 a ± 0.03 0.12 a ± 0.03 alkane
4-decyne 1037 1033 −4 0.11 a ± 0.03 0.10 a ± 0.03 0.11 a ± 0.02 0.16 a ± 0.04 -
tetradecene 1399 1400 −1 0.80 a ± 0.08 0.94 a ± 0.28 0.81 a ± 0.11 0.95 a ± 0.05 -
pentadecene 1500 1500 0 0.50 a ± 0.01 0.50 a ± 0.14 0.59 a ± 0.12 0.64 a ± 0.17 gasoline
heptadecene 1699 1700 −1 0.09 a ± 0.01 0.08 a ± 0.02 0.08 a ± 0.02 0.06 a ± 0.02 alkane
1-heptadecene 1693 1696 −3 0.02 a ± 0.00 - ND - -
ethylbenzene 865 868 3 0.06 a ± 0.02 0.05 a ± 0.02 ND ND alkane
octane802 800 −2 0.28 a ± 0.04 0.23 a ± 0.00 0.13 a ± 0.08 0.16 a ± 0.09 -
1-dodecene 1192 1191 −1 0.23 b ± 0.05 0.54 a ± 0.20 0.30 a,b ± 0.04 0.34 a,b ± 0.08 -
decane 1000 1000 0 ND 0.64 a ± 0.01 0.49 a ± 0.12 0.49 a ± 0.09 -
5-dodecen-7-yne, (E) 1229 1239 10 ND 0.10 a ± 0.05 ND ND alkane
tetradecane, 3-methyl- 1446 1448 2 ND 0.02 a ± 0.01 - 0.02 a ± 0.01 alkane
ciclopentane, nonil- 1450 1451 −1 0.05 a ± 0.02 0.09 a ± 0.06 0.05 a ± 0.00 0.04 a ± 0.00 alkane
hexadecane 1600 1600 0 0.26 a ± 0.04 0.27 a ± 0.04 0.23 a ± 0.04 0.20 a ± 0.01 alkane
octadecane 1800 1800 0 0.09 a ± 0.00 0.07 a,b ± 0.01 0.07 a,b ± 0.01 0.06 b ± 0.00 -
tridecane 1300 1300 0 1.17 a ± 0.25 1.14 a ± 0.34 1.26 a ± 0.27 1.71 a ± 0.22 -
1-hexadecene 1593 1590 3 0.17 a ± 0.04 0.05 b ± 0.01 0.13 a ± 0.03 0.15 a ± 0.03 -
nonadecane 1900 1900 0 0.19 a ± 0.02 0.09 b ± 0.02 0.10 b ± 0.03 0.06 b ± 0.00 alkane
heneicosane 2100 2100 0 0.02 a ± 0.00 0.02 a ± 0.01 0.02 a ± 0.00 - -
docosane2199 2200 −1 ND 0.08 a ± 0.02 ND ND alkane
1-undecene 1092 1093 −1 0.68 a ± 0.16 0.41 a ± 0.05
tricosane 2300 2300 0 ND - ND - alkane
Ketones
3-octanone, 2-methyl- 990 988 −2 1.41 a ± 0.19 1.56 a ± 0.07 1.47 a ± 0.45 1.48 a ± 0.36 -
2-pentadecanone 1703 1702 −1 0.03 a ± 0.00 0.02 a ± 0.01 - 0.03 a ± 0.01 jasmine, celery
geranyl acetone 1454 1452 2 0.14 a ± 0.01 0.13 a ± 0.02 0.07 a ± 0.03 0.09 a ± 0.01 floral, fresh
2-decanone 1195 1191 −4 ND 0.15 a ± 0.02 - 0.12 a ± 0.01 orange, floral
Lactones
2-pentylfuran 998 993 −5 6.09 a ± 0.37 4.94 a ± 0.49 6.25 a ± 0.66 6.35 a ± 0.90 green, bean
2-pentylthiophene 1164 1169 5 0.09 a ± 0.02 0.12 a ± 0.00 0.09 a ± 0.00 0.13 a ± 0.04 fatty, meat
Pyrazins
2,6-dimethyl, pyrazine 924 925 1 1.51 b ± 0.36 5.12 a ± 1.41 1.60 b ± 0.35 1.36 b ± 0.25 chocolate, roast
2,3,5,6-tetramethyl, pyrazine 1089 1087 2 0.28 b ± 0.03 0.82 a ± 0.20 0.83 a ± 0.13 0.58 a,b ± 0.00 coffee, cocoa
3-ethyl-2,5-dimethyl, pyrazine 1089 1091 2 0.85 b ± 0.14 2.33 a ± 0.51 0.84 b ± 0.25 1.36 b ± 0.25 potato, roast
2-ethyl-6-methyl, pyrazine 1006 1007 1 ND 0.75 b ± 0.21 0.42 b ± 0.03 3.34 a ± 0.62 baked potato
2,3,5-trimethyl pyrazine 1009 1005 −4 ND ND 3.52 a ± 0.63 ND moldy, potato,
2,3-diethyl-5-methylpyrazine 1159 1158 1 0.10 a ± 0.04 0.21 a ± 0.07 0.09 a ± 0.05 ND roasted, potato
3,5-diethyl-2-methyl-pyrazine 1161 1156 −5 ND 0.12 a ± 0.06 - 0.10 a ± 0.04 nut, meat
2-butyl-3,5-dimethyl, pyrazine 1305 0.07 a ± 0.01 0.11 a ± 0.04 ND 0.04 a ± 0.02 sweety, earthy
3,5-dimethyl-2-isobutyl, pyrazine 1318 0.21 b.c ± 0.04 0.52 a ± 0.05 0.11 c ± 0.04 0.30 b ± 0.08 -
2-hexyl-6-methyl, pyrazine 1256 ND 0.04 a ± 0.02 ND 0.05 a ± 0.02 -
2-ethyl-3,5-dimethyl-, pyrazine 1088 1081 −7 ND 0.82 a ± 0.20 ND ND roasted, walnut
Sulfur compounds
cyclic octaatomic sulfur 2074 2083 −9 1.46 a ± 0.18 1.401 a ± 0.25 1.42 a ± 0.45 1.04 a ± 0.49 -
tetrasulfide, dimethyl 1224 1223 1 ND 0.06 a ± 0.02 ND - garlic, meat
Thiasol
thiazolidine-2,4-dione, 3-methyl-5-(3,4-methylenedioxybenzyliden)2333 2334 −1 0.08 a ± 0.02 0.06 a,b ± 0.01 0.04 b ± 0.010.04 b ± 0.00 -
Results were expressed as relative area (%). RI calc = experimental retention index obtained using capillary column 5% diphenyl 95% dimethylpolysiloxane. RI lit = retention index from the literature obtained for capillary column 5% diphenyl 95% dimethyl-polysiloxane. Δ = difference between calculated (RI calc) and the literature (RI lit) retention indexes. ND: not detected. Areas indicated with a dash: compound found at trace level, relative area ≤ 0.01. Means with distinct letters superscripted on the same line indicate a statistical difference (p < 0.05) by ANOVA and Tukey. Odor descriptors were obtained from Flavornet (https://www.flavornet.org/, accessed on 21 November 2022).
Disclaimer/Publisher’s Note: The statements, opinions and data contained in all publications are solely those of the individual author(s) and contributor(s) and not of MDPI and/or the editor(s). MDPI and/or the editor(s) disclaim responsibility for any injury to people or property resulting from any ideas, methods, instructions or products referred to in the content.

