
Analysis of the Fungi Community Variation during Rice Storage through High Throughput Sequencing
by
 , and
, and
Wanting Li
1, 
Jie Cui
2,
Jiafeng Li
3,
Jian Guo
4,
Tao Huang
5,
Jiaojiao Zhang
4 ,
,
Hao Hu
4,* and
Xingquan Liu
4,* 1
College of Forestry and Biotechnology, Zhejiang Agriculture and Forest University, Hangzhou 311300, China
2
Grain and Oil Storage Depot of Zhejiang Grain Bureau, Hangzhou 310000, China
3
Grain and Emergency Support Center of Zhejiang Province, Hangzhou 310000, China
4
College of Food and Health, Zhejiang Agriculture and Forest University, Hangzhou 311300, China
5
College of Animal Science and Technology, Zhejiang Agriculture and Forest University, Hangzhou 311300, China
*
Authors to whom correspondence should be addressed.
Processes 2022, 10(4), 754; https://doi.org/10.3390/pr10040754
Submission received: 14 March 2022
/
Revised: 9 April 2022
/
Accepted: 11 April 2022
/
Published: 13 April 2022
(This article belongs to the Special Issue Agriculture Products Processing and Storage)
Abstract
:Rice storage conditions include location, granary depth, storage time, temperature and atmosphere. The fungi community varies during storage, but how these communities change remains unexplored so far. This study collected rice samples from granaries in different horizontal and vertical directions and storage time over two years. High-throughput ITS (Internal Transcribed Spacer) sequencing analysis revealed that Ascomycota (73.81%), Basidiomycota (6.56%) and Mucoromycota (9.42%) were the main Eumycota present during rice storage. The main fungi communities were Aspergillus sp., Fusarium sp., Rhizopus sp., Gibberella sp., Tilletia sp. and Penicillium sp. The contribution of storage time, horizontal orientation and vertical depth effect on fungi community relative abundance were 17.18%, 5.98% and 0.11%, respectively. Aspergillus sp. was the predominant Eubacterium during this process. The horizontal A was mainly occupied by Paraconiothyrium sp. and the location S, had Clavispora sp. Both of these varied dramatically during storage. Furthermore, Aspergillus sp., as a main mycotoxin producer, was the dominant fungi at vertical L1. This study comprehensively analyzed fungi community variation in horizontal and vertical directions to elucidate fungi community variation on rice during storage and to find the detrimental fungi. Therefore, it is important to improve granary ventilation systems and to ensure a uniform atmosphere to control fungi growth.
1. Introduction
Rice is a basic crop and staple food for the global population, which is related to country development and society stability [1]. It is a seasonal production crop, so a large portion of its annual production needs to be stored. Around 40% of the annual production of rice is stored for about 16 months in China [2]. Therefore, keeping rice quality at a high standard during storage is quite important [3]. Penicillium sp. and Aspergillus sp. are the most common fungi contaminants in rice storage [4]. They can decompose grains and produce mycotoxins leading to grain quality deterioration. Other fungi, such as Alternaria sp. and Fusarium sp., can also cause rice mildew and generate mycotoxins which can result in serious food safety problems [5,6]. According to some reports, the annual loss of rice caused by molds is up to 10–15% in Europe and other developing countries [7].
The growth and survival of fungi are influenced by the water activity of the rice grain as well as environmental factors, such as temperature, humidity and oxygen concentration, which often vary even within the same granary [8]. The stored rice grain pile in a granary has a porous and loose structure, but gas and moisture are usually not uniform, which leads to the temperature and water activity varying in different parts of the granary. The temperature on the top layer of the grain pile sometimes changes drastically due to thermal air convections, and the temperature fluctuations in the headspace are greater than within the pile [9]. The variation of the local temperature often influences the grain pile’s moisture migration significantly and causes the alteration of fungi structure. Moreover, the irregularity of the grain piles and granary walls also affect the fungi growth and communities. There are many studies exploring fungi variation and composition during rice storage, however, few of them have utilized high-throughput sequencing to reveal the changes in the fungi communities. According to a previous report, there were fewer molds on the upper layer of the grain pile than the middle and lower layers [10]. Another study confirmed that the storage time and granary location had significant effects on the quantity of molds and bacteria population [11]. Similarly, the fungi community of newly stored rice was more diverse than those stored for a long time [12].
To explore the diversity and distribution of the dominant fungi communities in stored rice under different conditions, this present study identified the relative abundance of the dominant fungal genera during rice storage and statistically analyzed the patterns of fungi community changes in the horizontal orientation, vertical depth and storage time. The results are mainly about the attributes of the dominant fungal genera, which provides a comprehensive basis for effective mold control and rice postharvest quality assurance. It also provides insight into rice safety and quality management during storage.
Highlights: To understand the diversity and distribution of fungi community in rice storage, high-throughput ITS sequencing was used to analyze their variation. The dominant fungi at different orientation and storage time were elucidated clearly, which provides a comprehensive insight into fungi genera transformation and a suggestion for rice storage quality.
2. Materials and Methods
2.1. Rice Samples
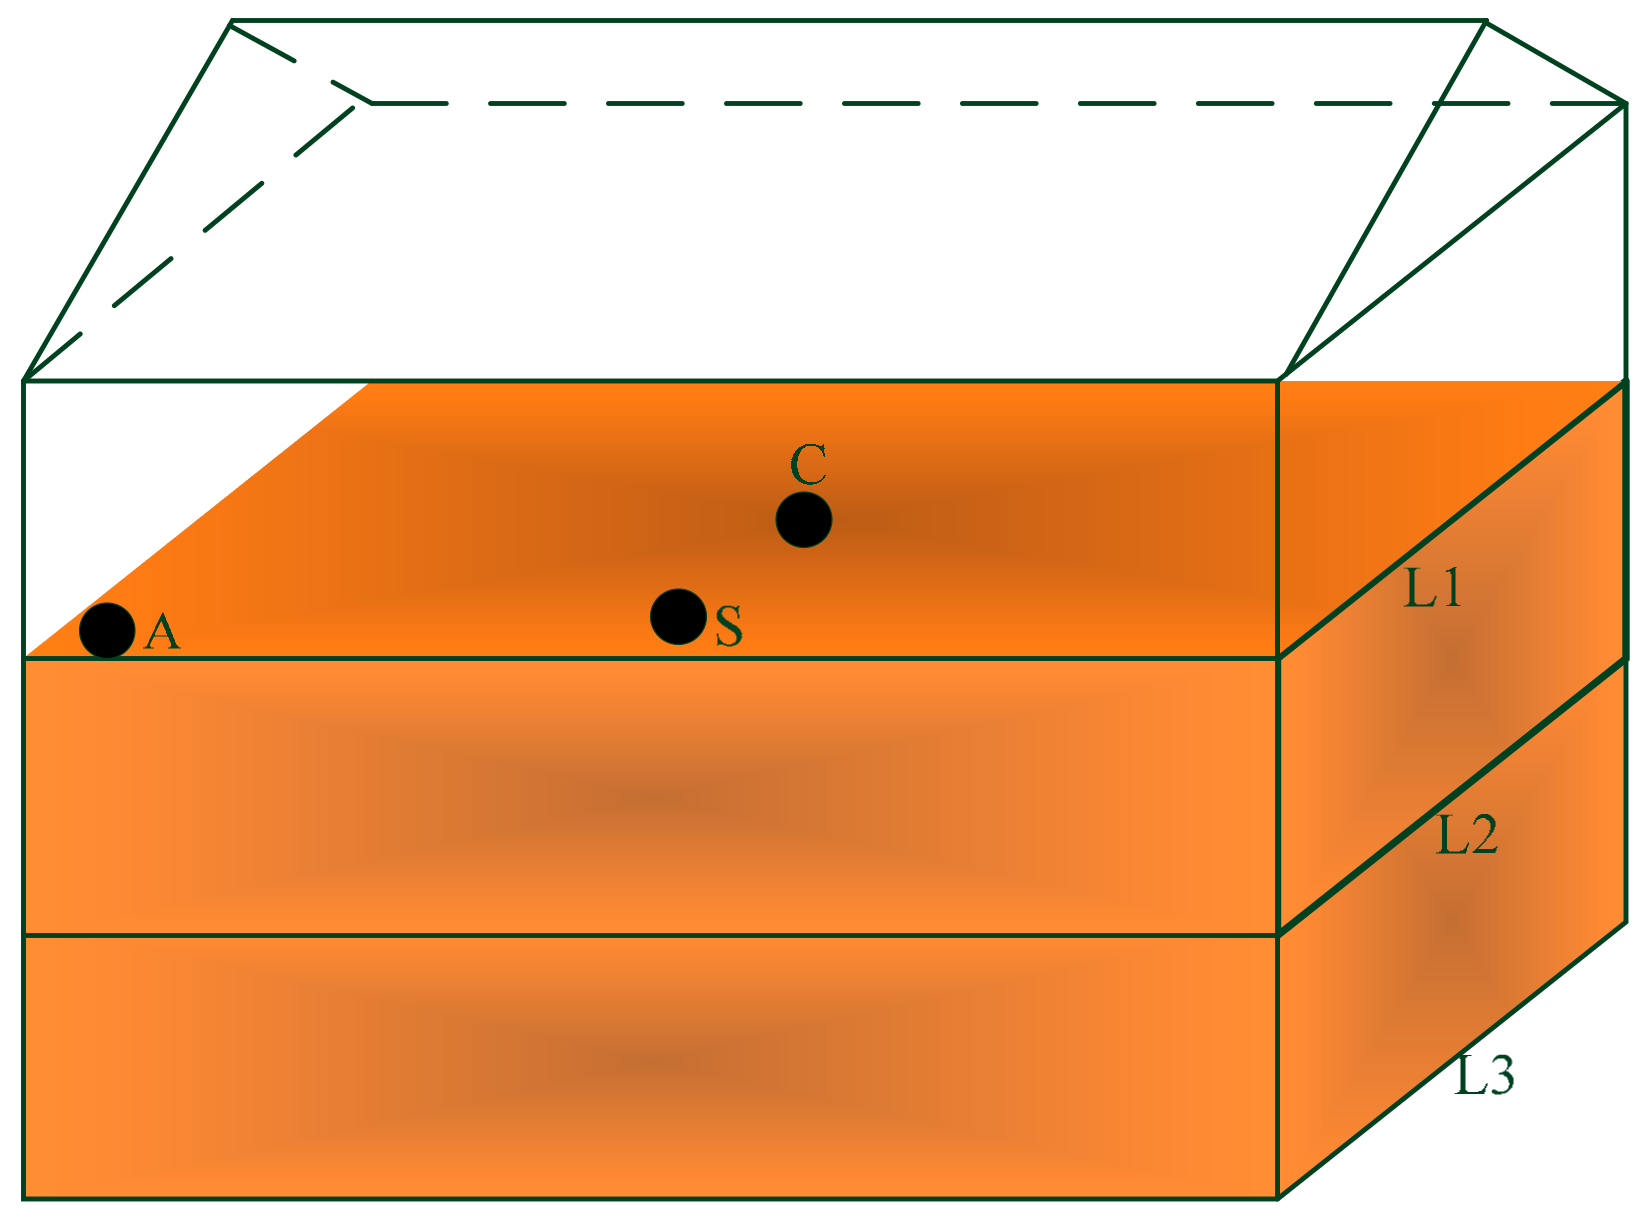
The rice samples for this study were obtained from grain warehouses of the Quzhou controlled corporation (Zhejiang Province Grain Reserve Management Co., Ltd., Zhejiang, China). The early indica rice were selected from granaries numbered A, B and C (rice stored for one year, Y1) and D, E and F (rice stored for two years, Y2), respectively. Each granary was divided into three layers according to its vertical position, i.e., the upper layer (L1), middle layer (L2) and lower layer (L3). The L1 was 0.3 m from the grain surface, L2 was located in the middle of the grain pile, and L3 was 0.3 m from the bottom. The center of each granary was denoted as the center (C) and the side as (S), which was measured 0.3 m from the wall. The angle (A) was also measured 0.3 m from both sides of the wall. The sampling diagram is shown in Figure 1. A total of 108 samples were collected from six granaries, each granary had 18 samples, and each layer had two samples.
2.2. Collection and Isolation of Fungi
The collection and isolation of fungi from the rice surface was conducted following the methods of Kumar et al. with modification [13]. Firstly, 200 g rice was measured in a sterile bag, and 200 mL of sterile saline water was added to it. Secondly, fungi were washed off with sonication for 30 min. The washing solution was collected by centrifugation (1.2 × 10⁵ rpm, 10 min), and the supernatant was filtered through a microporous membrane (0.45 µm). The precipitation of the supernatant was the fungi isolates obtained from the rice grain samples.
2.3. Analysis of Fungi Diversity by High-Throughput Sequencing
2.3.1. DNA Extraction and Sequencing
Total fungi DNA was extracted using the E.Z.N.A.® soil kit (Omega Bio-Tek, Norcross, GA, USA) and following the manufacturer’s instruction. The DNA concentration and purity were measured by NanoDrop2000, and the quality of extracted DNA was determined by 1% agarose gel. The ITS2 variable region was amplified by a polymerase chain reaction (PCR) using ITS3F (GCATCGAT GAAG AACGCAGC) and ITS4R (TCCTCCGCTTA TT GATATGC) primers. The PCR products were resolved in 2% agarose gels, and the DNA was extracted with AxyPrep DNA Gel Extraction Kit (Axygen Biosciences, Union City, CA, USA). After purification, the amplified fragments were used to construct the PE2 × 300 libraries according to the Illumina MiSeq platform (Illumina, San Diego, CA, USA) standard operating protocols. The sequencing of libraries was performed using Illumina’s MiSeq PE300 platform (Shanghai Meiji Biomedical Technology Co., Ltd., Shanghai, China).
2.3.2. Data Analysis
The obtained raw sequences were quality-controlled by Fastp software (version 0.19.6 https://github.com/OpenGene/fastp, accessed on 15 January 2021), and sequence splicing was performed using Flash (version 1.2.11 https://ccb.jhu.edu/software/FLASH/index.shtml, accessed on 16 January 2021). Later, the sequences were clustered using Uparse (version 7.0.1090 http://www.drive5.com/uparse, accessed on 17 January 2021) following operational taxonomic unit (OTU) clustering based on 97% identity. The accession number of the NGS was PRJNA822770. The sequences annotation was performed with the RDP Classifier (version 2.11 https://sourceforge.net/projects/rdp-classifier, accessed on 18 January 2021) for classification. The alpha diversity analysis was performed using Mothur (version 1.30.2 https://www.mothur.org/wiki/Download-mothur, accessed on 19 January 2021). Another program, Qiime (version 1.9.1 http://qiime.org/install/index.html, accessed on 20 January 2021), was used to generate the various types of academic level abundances, calculate beta diversity distances and perform permutation multivariate analysis of variance.
2.3.3. Statistical Analysis
The SPSS (version 22.0) was used for statistical analysis through one-way analysis of variance (ANOVA) and multivariate analysis of variance (MANOVA). The significance of differences among multiple groups was analyzed by the Kruskal–Wallis rank–sum test. Additionally, Tukey–Kramer and multiple tests were adopted for the post-hoc test and correction of fdr, respectively. The scatter plots, bar charts, and heat maps of the obtained data were plotted using Origin (version 2018) software. The Wayne plots were plotted using the UpSet package (version 1.4.0). Furthermore, to understand the evolutionary relationships, phylogenetic trees were constructed with the MEGA package (version 7.0) following the neighbor-joining method [14].
3. Results
3.1. Fungal Diversity of Rice Samples
To investigate the composition of fungi in each sample, the species annotation was processed on OUTs through clustering at 97% identity of valid sequences from 108 samples. Though the available data for all individuals was more than 30,000 sequences, individual No. B33 was found only 18,609 times, so it was removed from subsequent ITS analysis. The generated sequences from high-throughput sequencing were spliced and filtered, which yielded a total of 6,200,682 valid ITS rRNA sequences from 107 samples. The quantity of valid sequences obtained by ITS gene sequencing ranged from 30,438 to 74,496 per sample. High sample coverage was over 99.68% for ITS rRNA gene sequences, which indicated a high detection rate of OTUs per gene pool. Eventually, the alpha diversity of fungi on the rice grains was expressed by the Shannon index and Chao1 values. As presented in Table 1, the Chao1 index was found significantly different (p < 0.05) for varied orientations and storage duration. A significantly higher Chao1 index was observed in orientation A than in orientation C. The fungal abundance on the surface of the rice grain decreased with the extent of storage time (Table 1). Furthermore, the multivariate analysis of variance (MANOVA) also revealed that storage time significantly influenced the Chao1 richness index of the fungi (Table 1). The resolution of storage time to fungi Chao1 abundance index was up to 17.18%, and the resolution of orientation was 5.98% (Table 2).
3.2. Fungi Communities Variation and Evolution in Storage
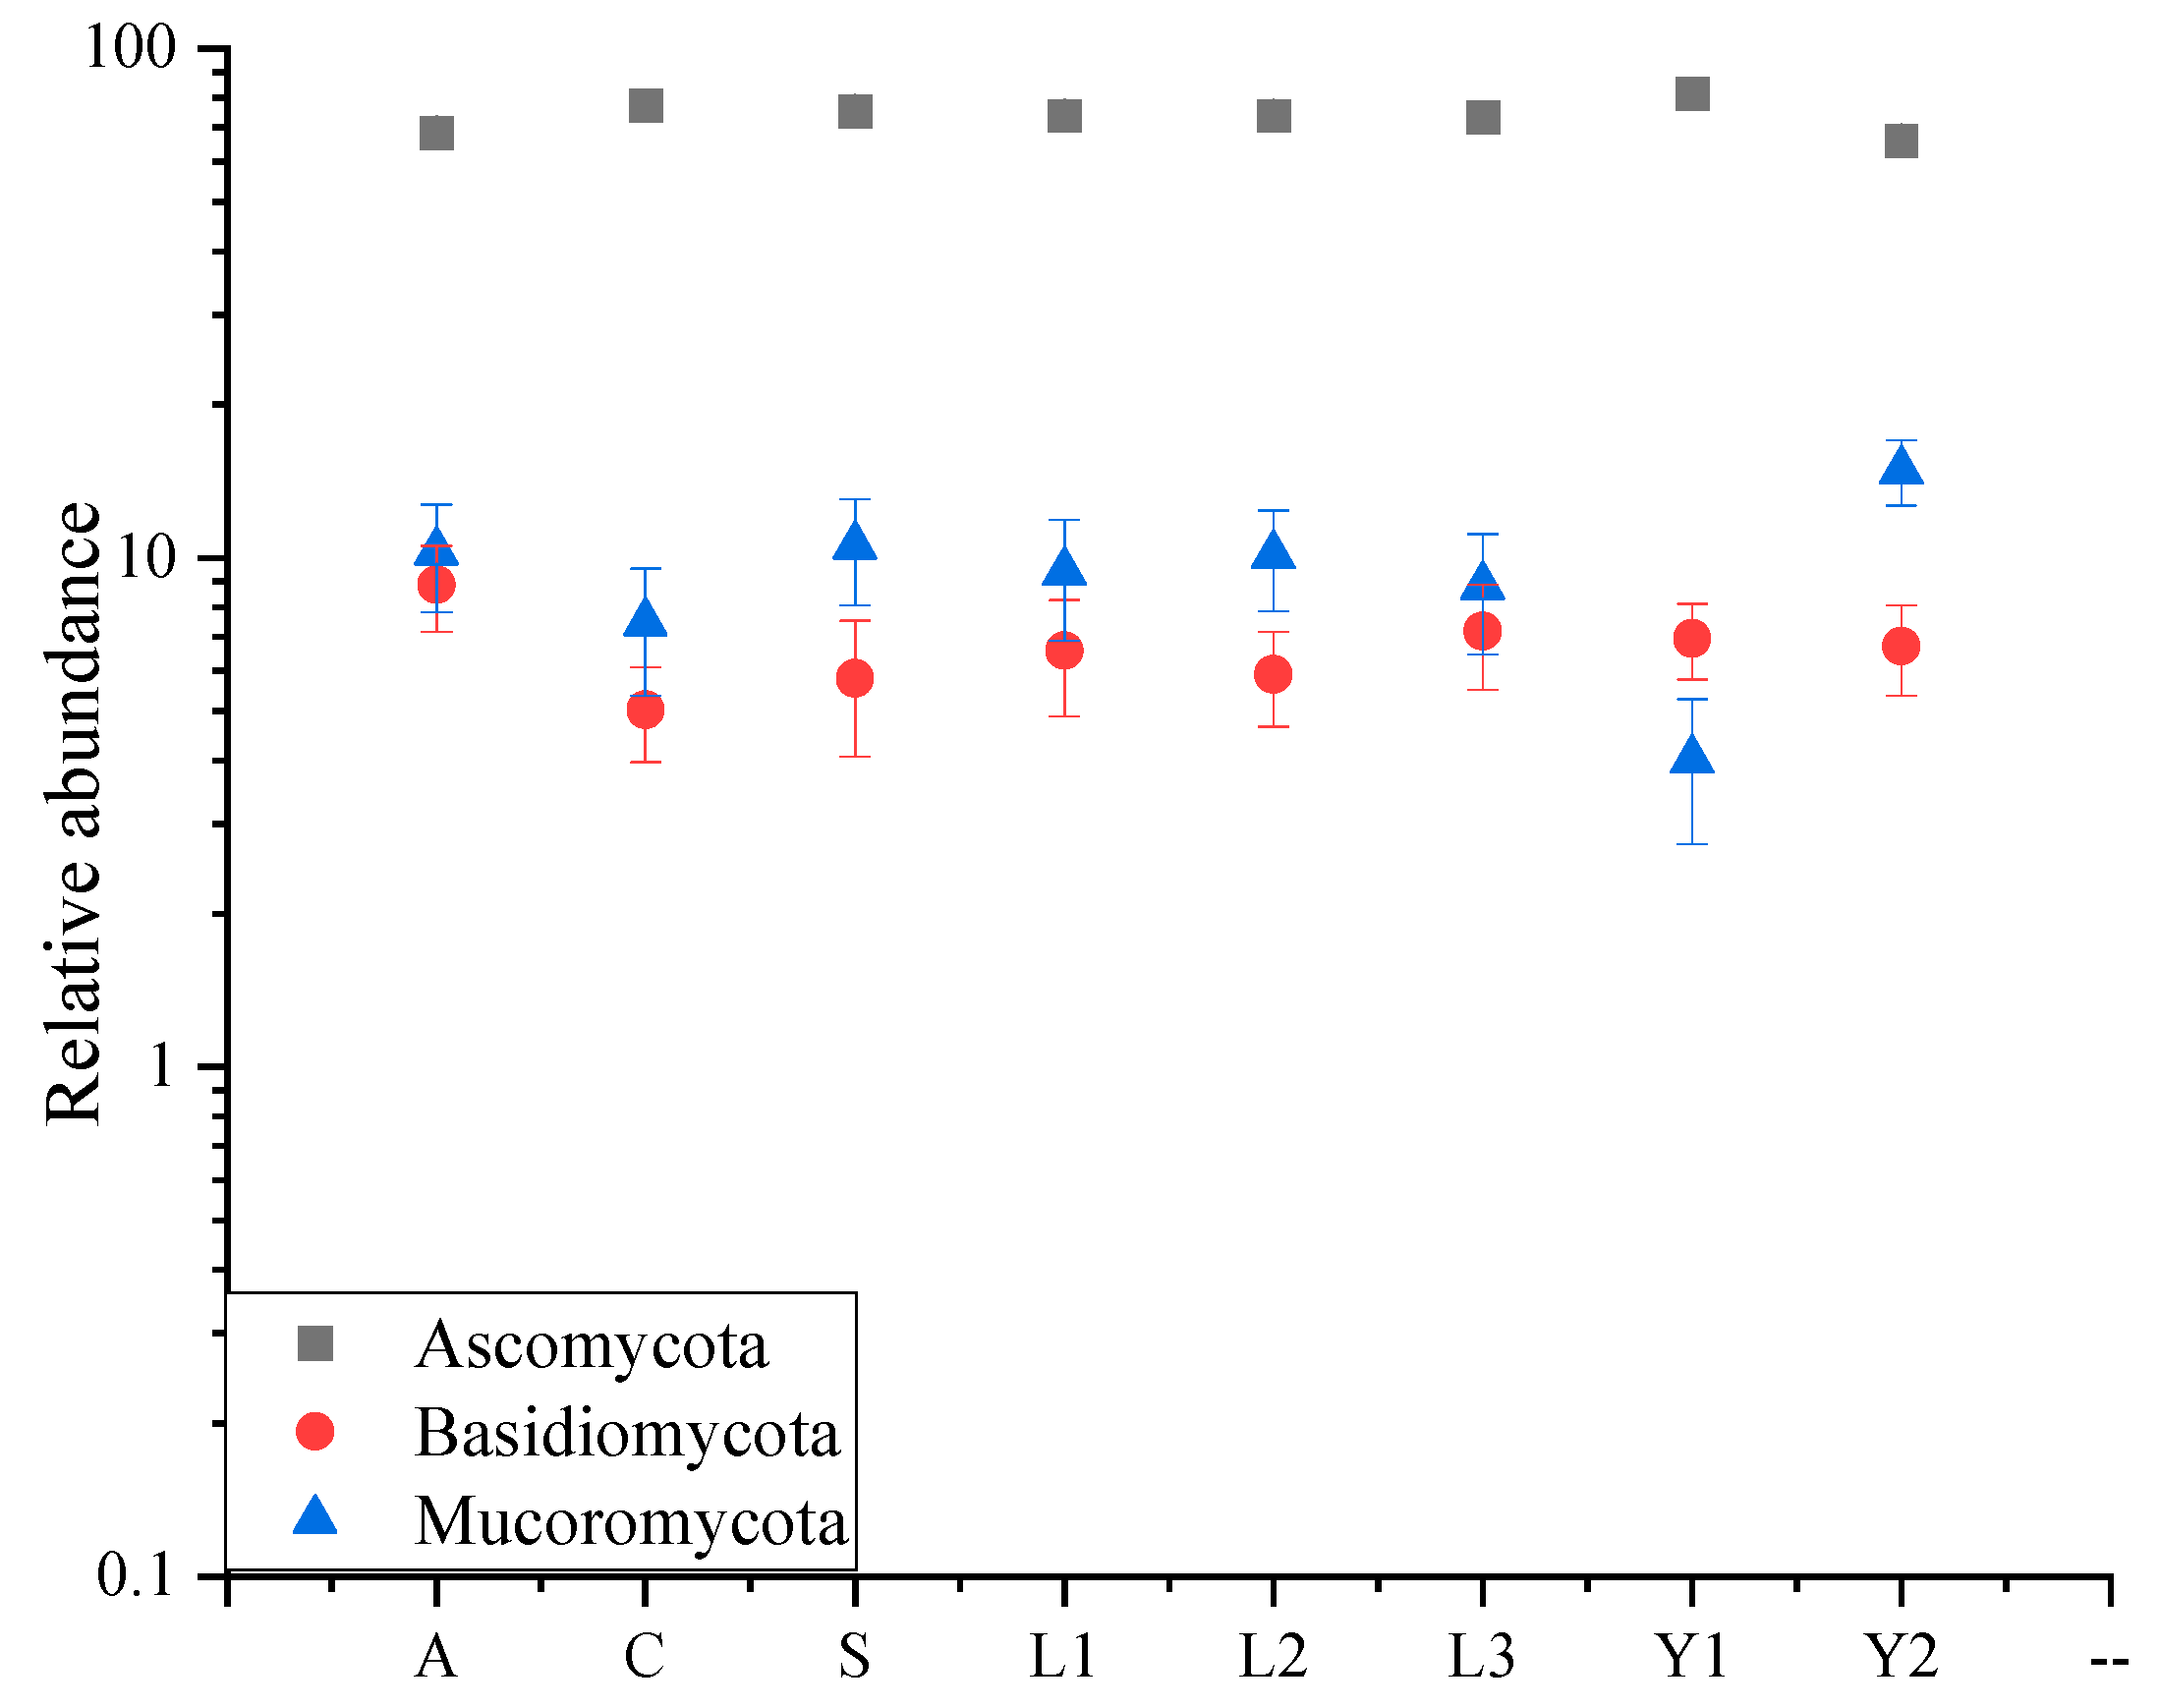
The presence of six Eumycota were detected in the rice samples, and Ascomycota, Basidiomycota and Mucoromycota were dominant with a relative abundance over 1% (Figure 2). The multivariate analysis of variance (MANOVA) result showed that storage time significantly influenced the relative abundance of Ascomycota and Mucoromycota (Table S1). Among them, the relative abundance of Ascomycota varied obviously with the orientation, the highest presented in orientation C (82.24 ± 4.49%), and the lowest was in orientation A (72.14 ± 2.72%)). Moreover, the relative abundance of Mucoromycota differed significantly with the storage time following a proportional increase (Table S2).
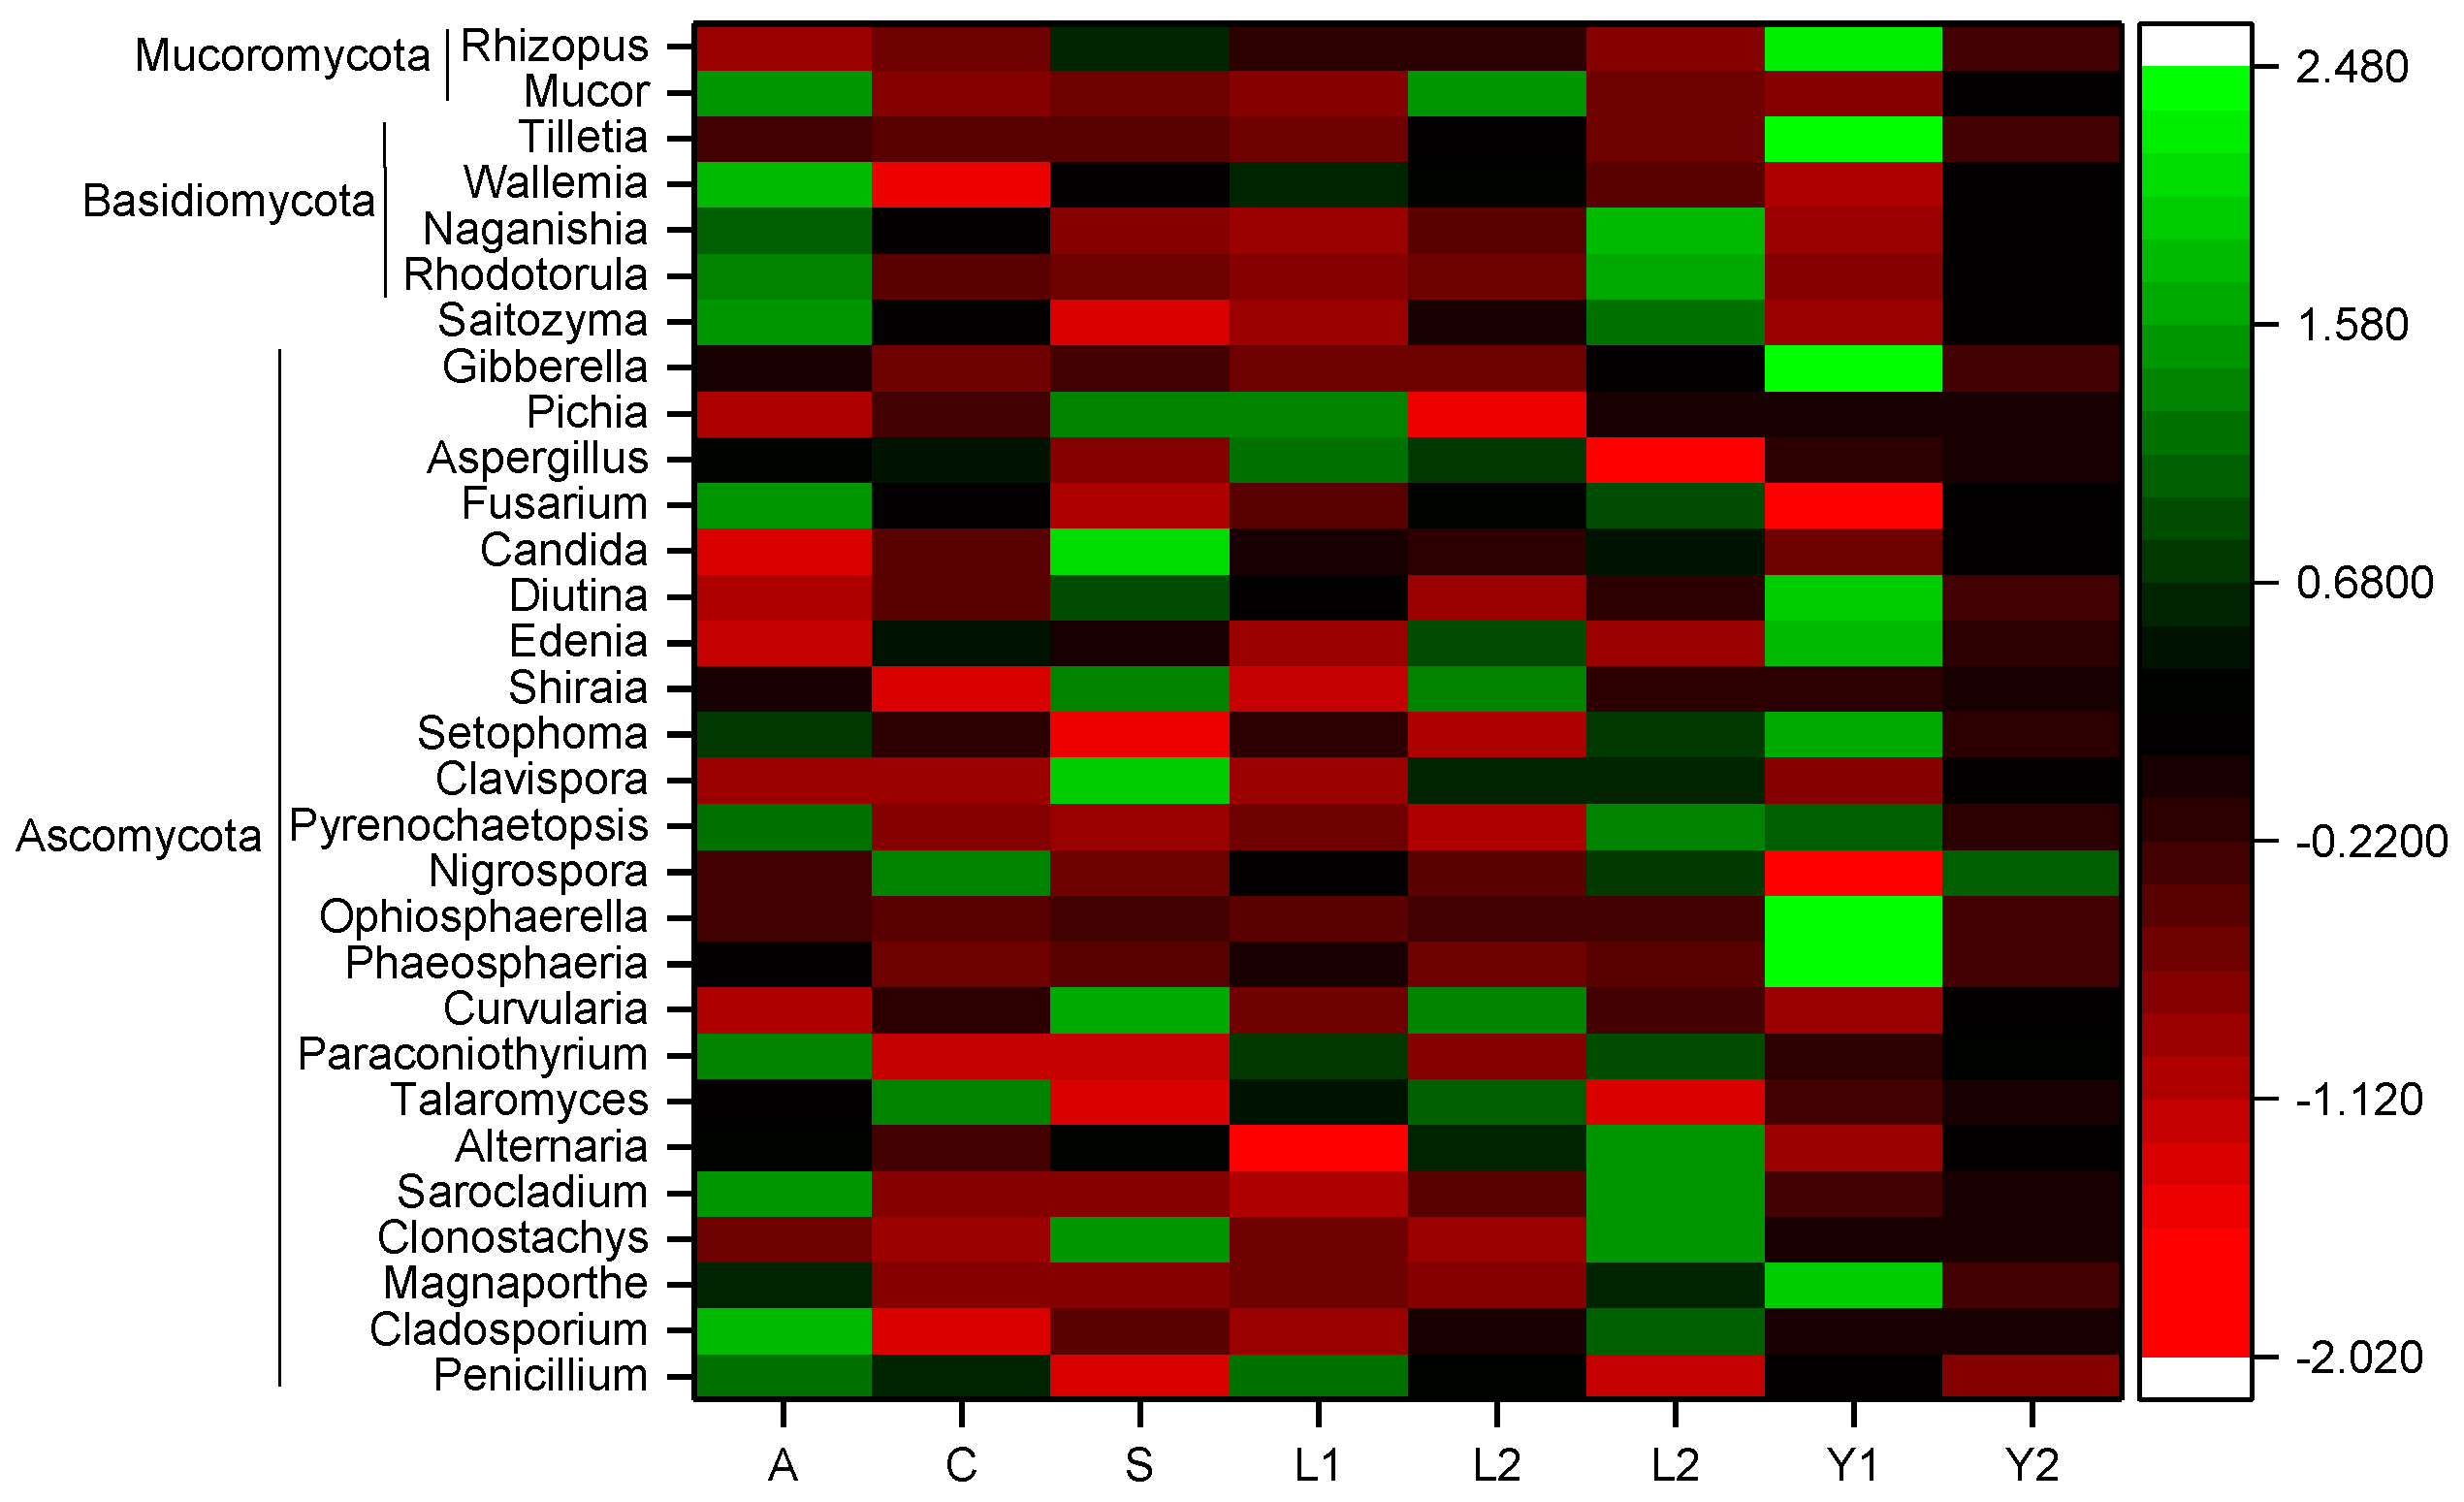
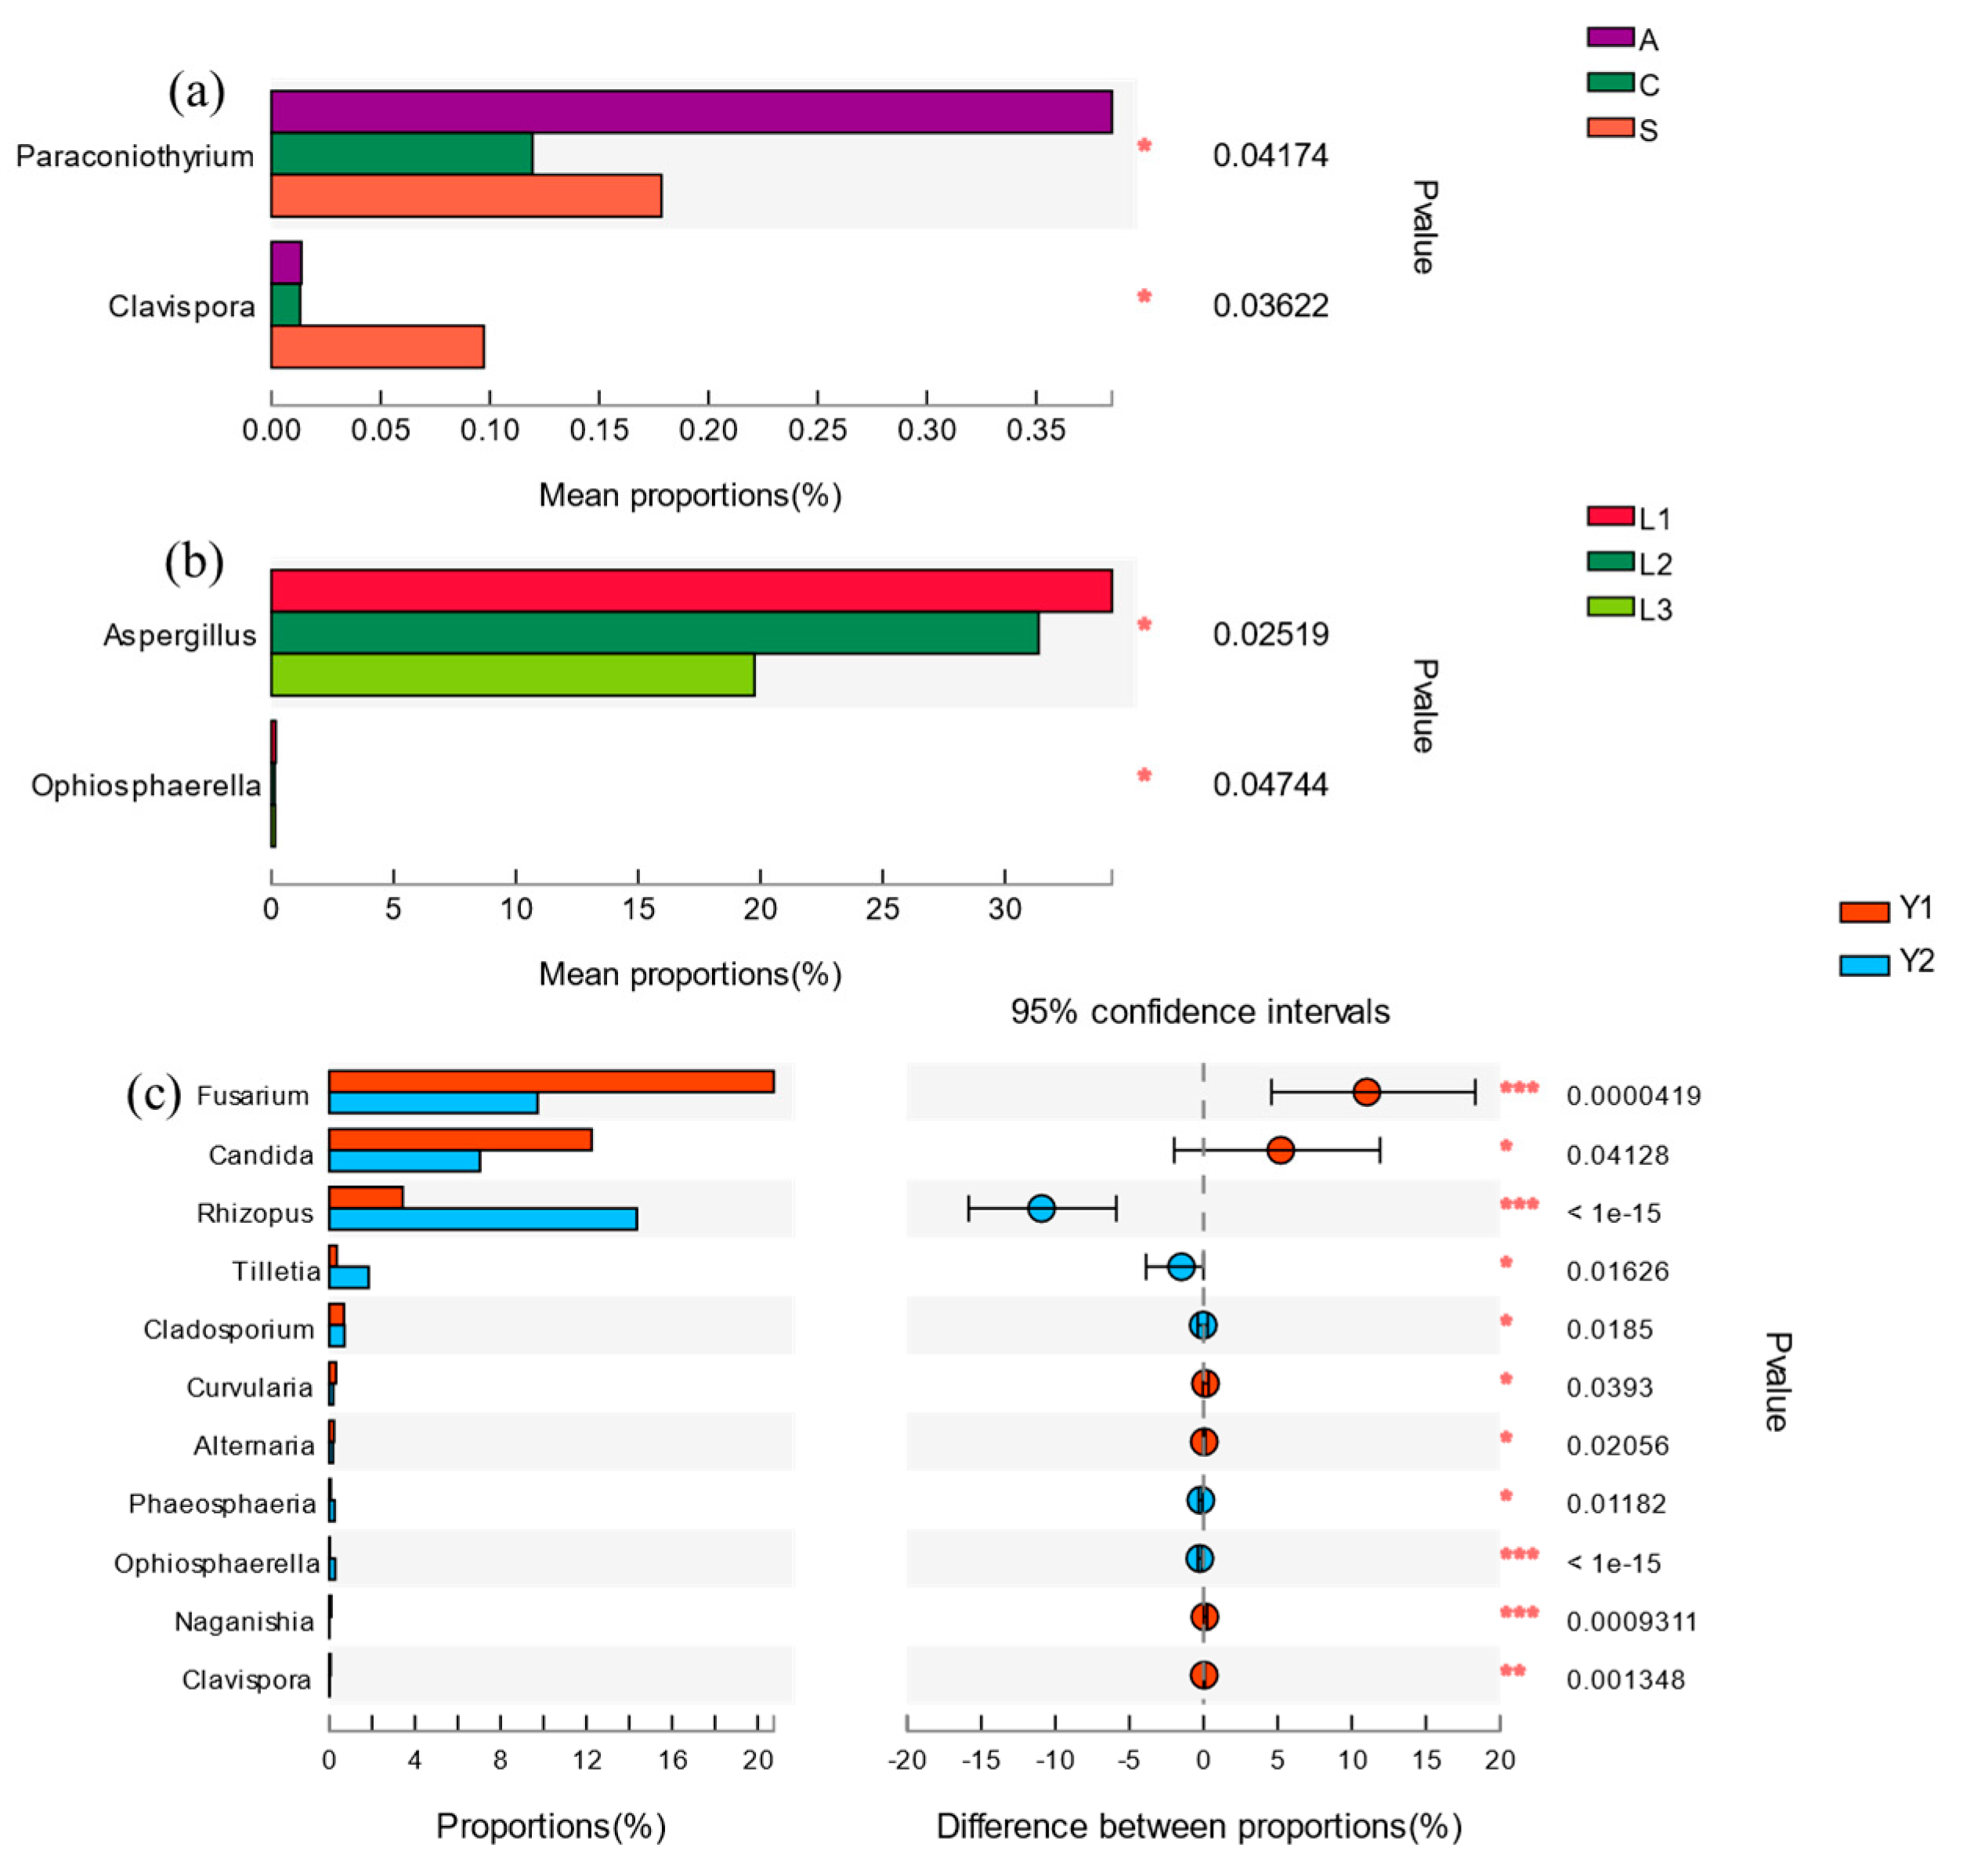
At the genus level, a total of 254 fungi genera were detected in the rice samples. As shown in Figure 3, the highest relative abundance of 30 genera belonged to Ascomycota, Basidiomycota and Mucoromycota, respectively. The resolution of horizontal orientation, vertical depth and storage time were 0.06349, 0.02438 and 0.02242, respectively, which indicates that the fungi community composition was affected significantly by these three factors (Table 3). Among them, the orientation had more effect on the relative abundance of Paracoinothyrium sp. and Clavispora sp. (Figure 4). Similarly, the vertical position had a significant effect on the relative abundance of Aspergillus sp. and Clavispora sp., which are two dominant fungal genera in rice grain (Figure 4). Moreover, the storage time also had a significant effect on eleven dominant fungi genera, which were Candida sp., Fusarium sp., Rhizopus sp., Cladosporium sp., Alternaria sp., Curvularia sp., Phaeosphaeria sp., Ophiosphaerella sp., Clavispora sp., Naganishia sp. and Tilletia sp. (Figure 4). The relative abundance of five fungi genera, including Rhizopus sp., Tilletia sp., Phaeosphaeria sp., Ophiosphaerella sp. and Cladosporium sp., increased with the storage time extended (Table S3).
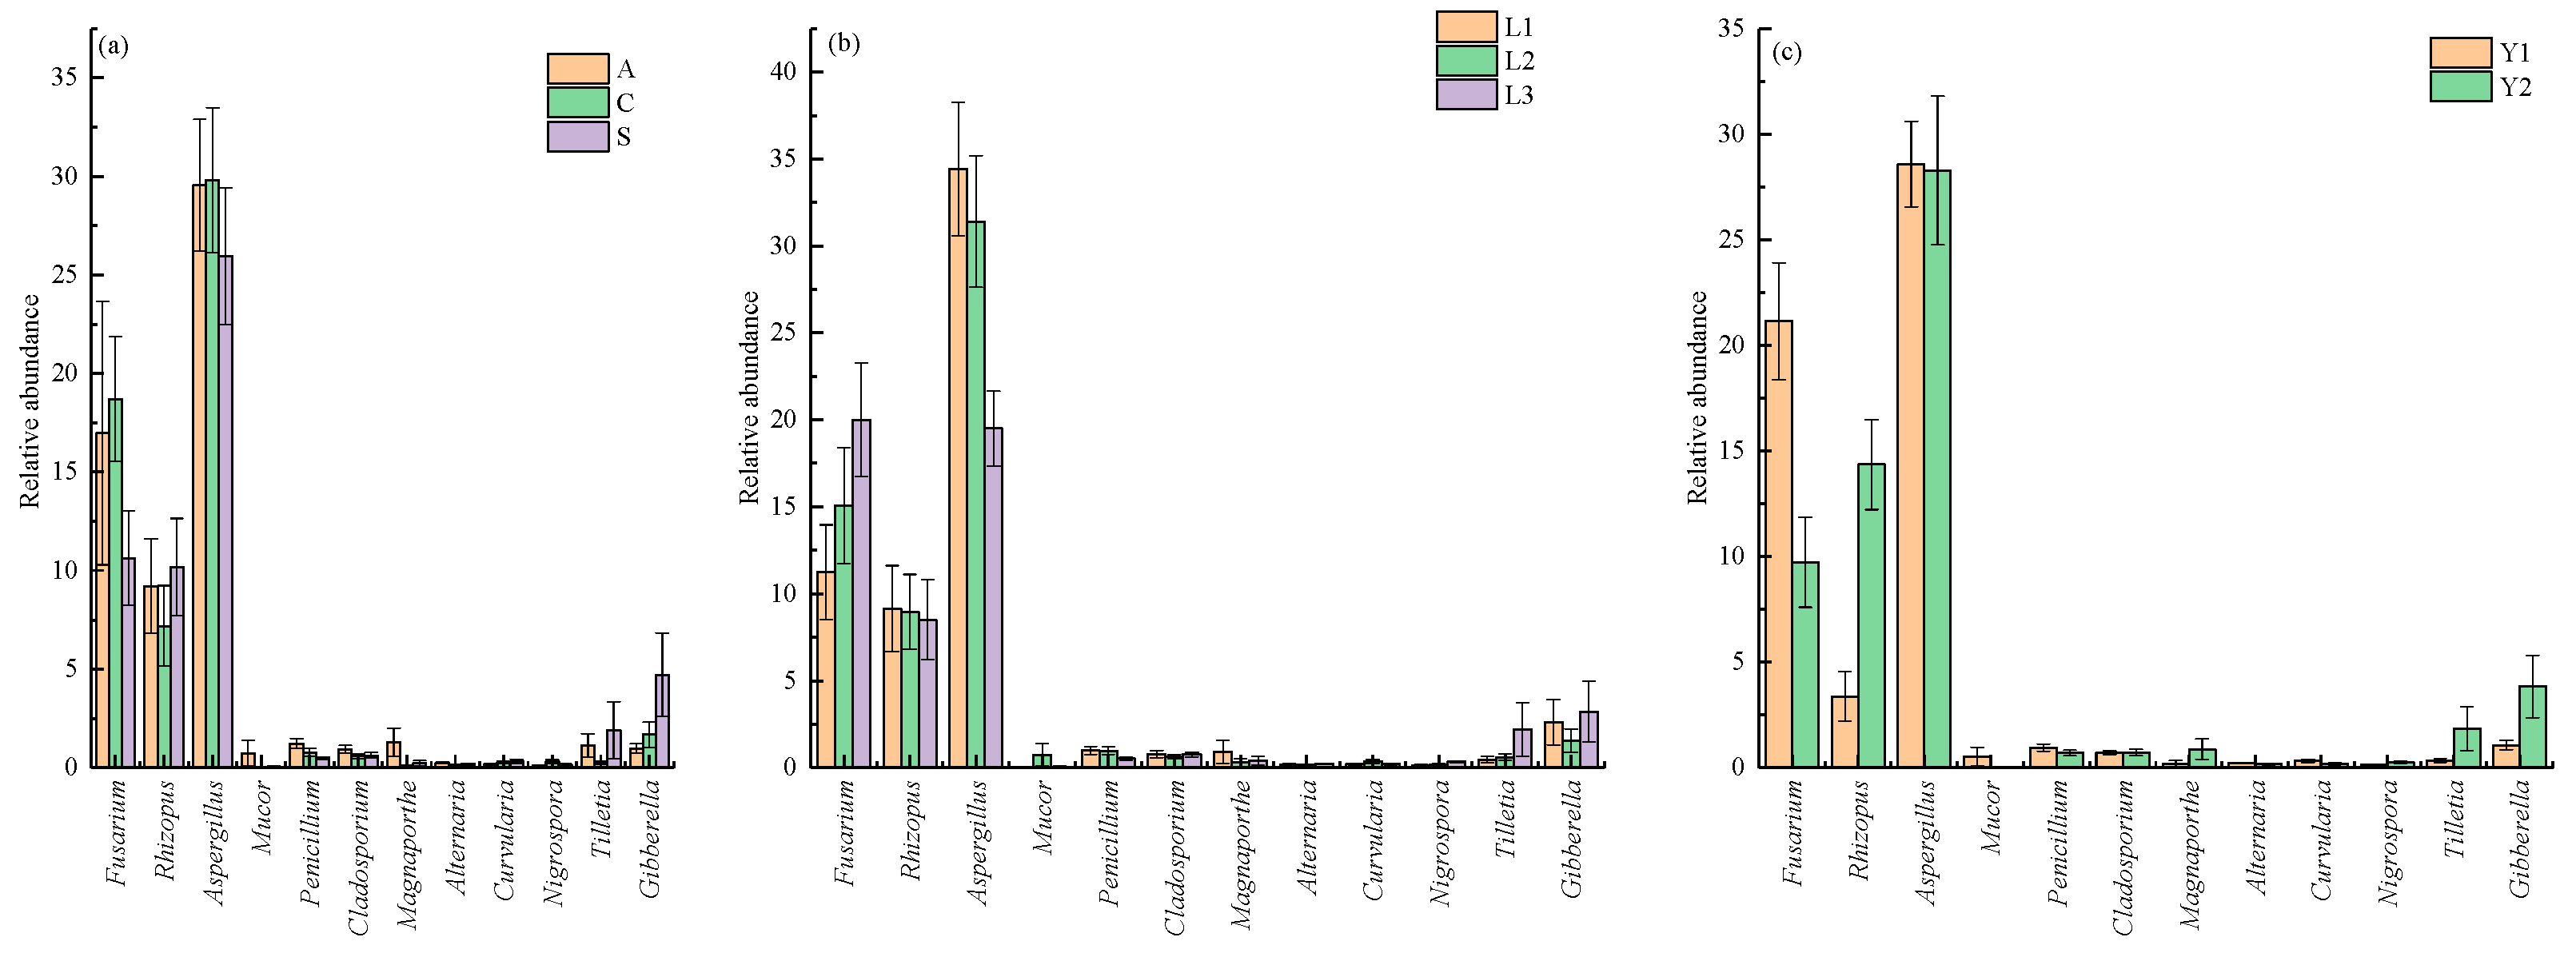
Among the 30 genera with high relative abundance, the harmful genera for rice storage included Fusarium sp., Rhizopus sp., Aspergillus sp., Mucor sp., Penicillium sp., Cladosporium sp., Magnaporthe sp., Alternaria sp., Curvularia sp., Nigrospora sp., Tilletia sp. and Gibberella sp. (Figure 5 and Table S4). The relative abundance with significant differences was found for Penicillium sp. (1.22 ± 0.25%) at sampling point A, point C (0.77 ± 0.20%) and point S (0.48 ± 0.06%). The relative abundance of Nigrospora sp. was also disparate at different orientations. The highest one was at sampling point C (0.31 ± 0.09%), the next highest one was at point S (0.14 ± 0.05%) and the lowest was at sampling point A (0.10 ± 0.02%). Another relative abundance of Aspergillus sp. showed variation in the vertical positions. L1 (34.41 ± 3.84%) was the highest, followed by L2 (31.41 ± 3.78%) and L3 (19.50 ± 2.16%). Meanwhile, there was a significant increase in the relative abundance of Rhizopus sp. with the storage time extended, which increased by 10.97% in the second year. In contrast, the relative abundance of Fusarium sp. decreased eventually with increased storage time, decreasing by 11.41% compared with the first year (Table S3).
3.3. Core Fungi Community of Rice Samples
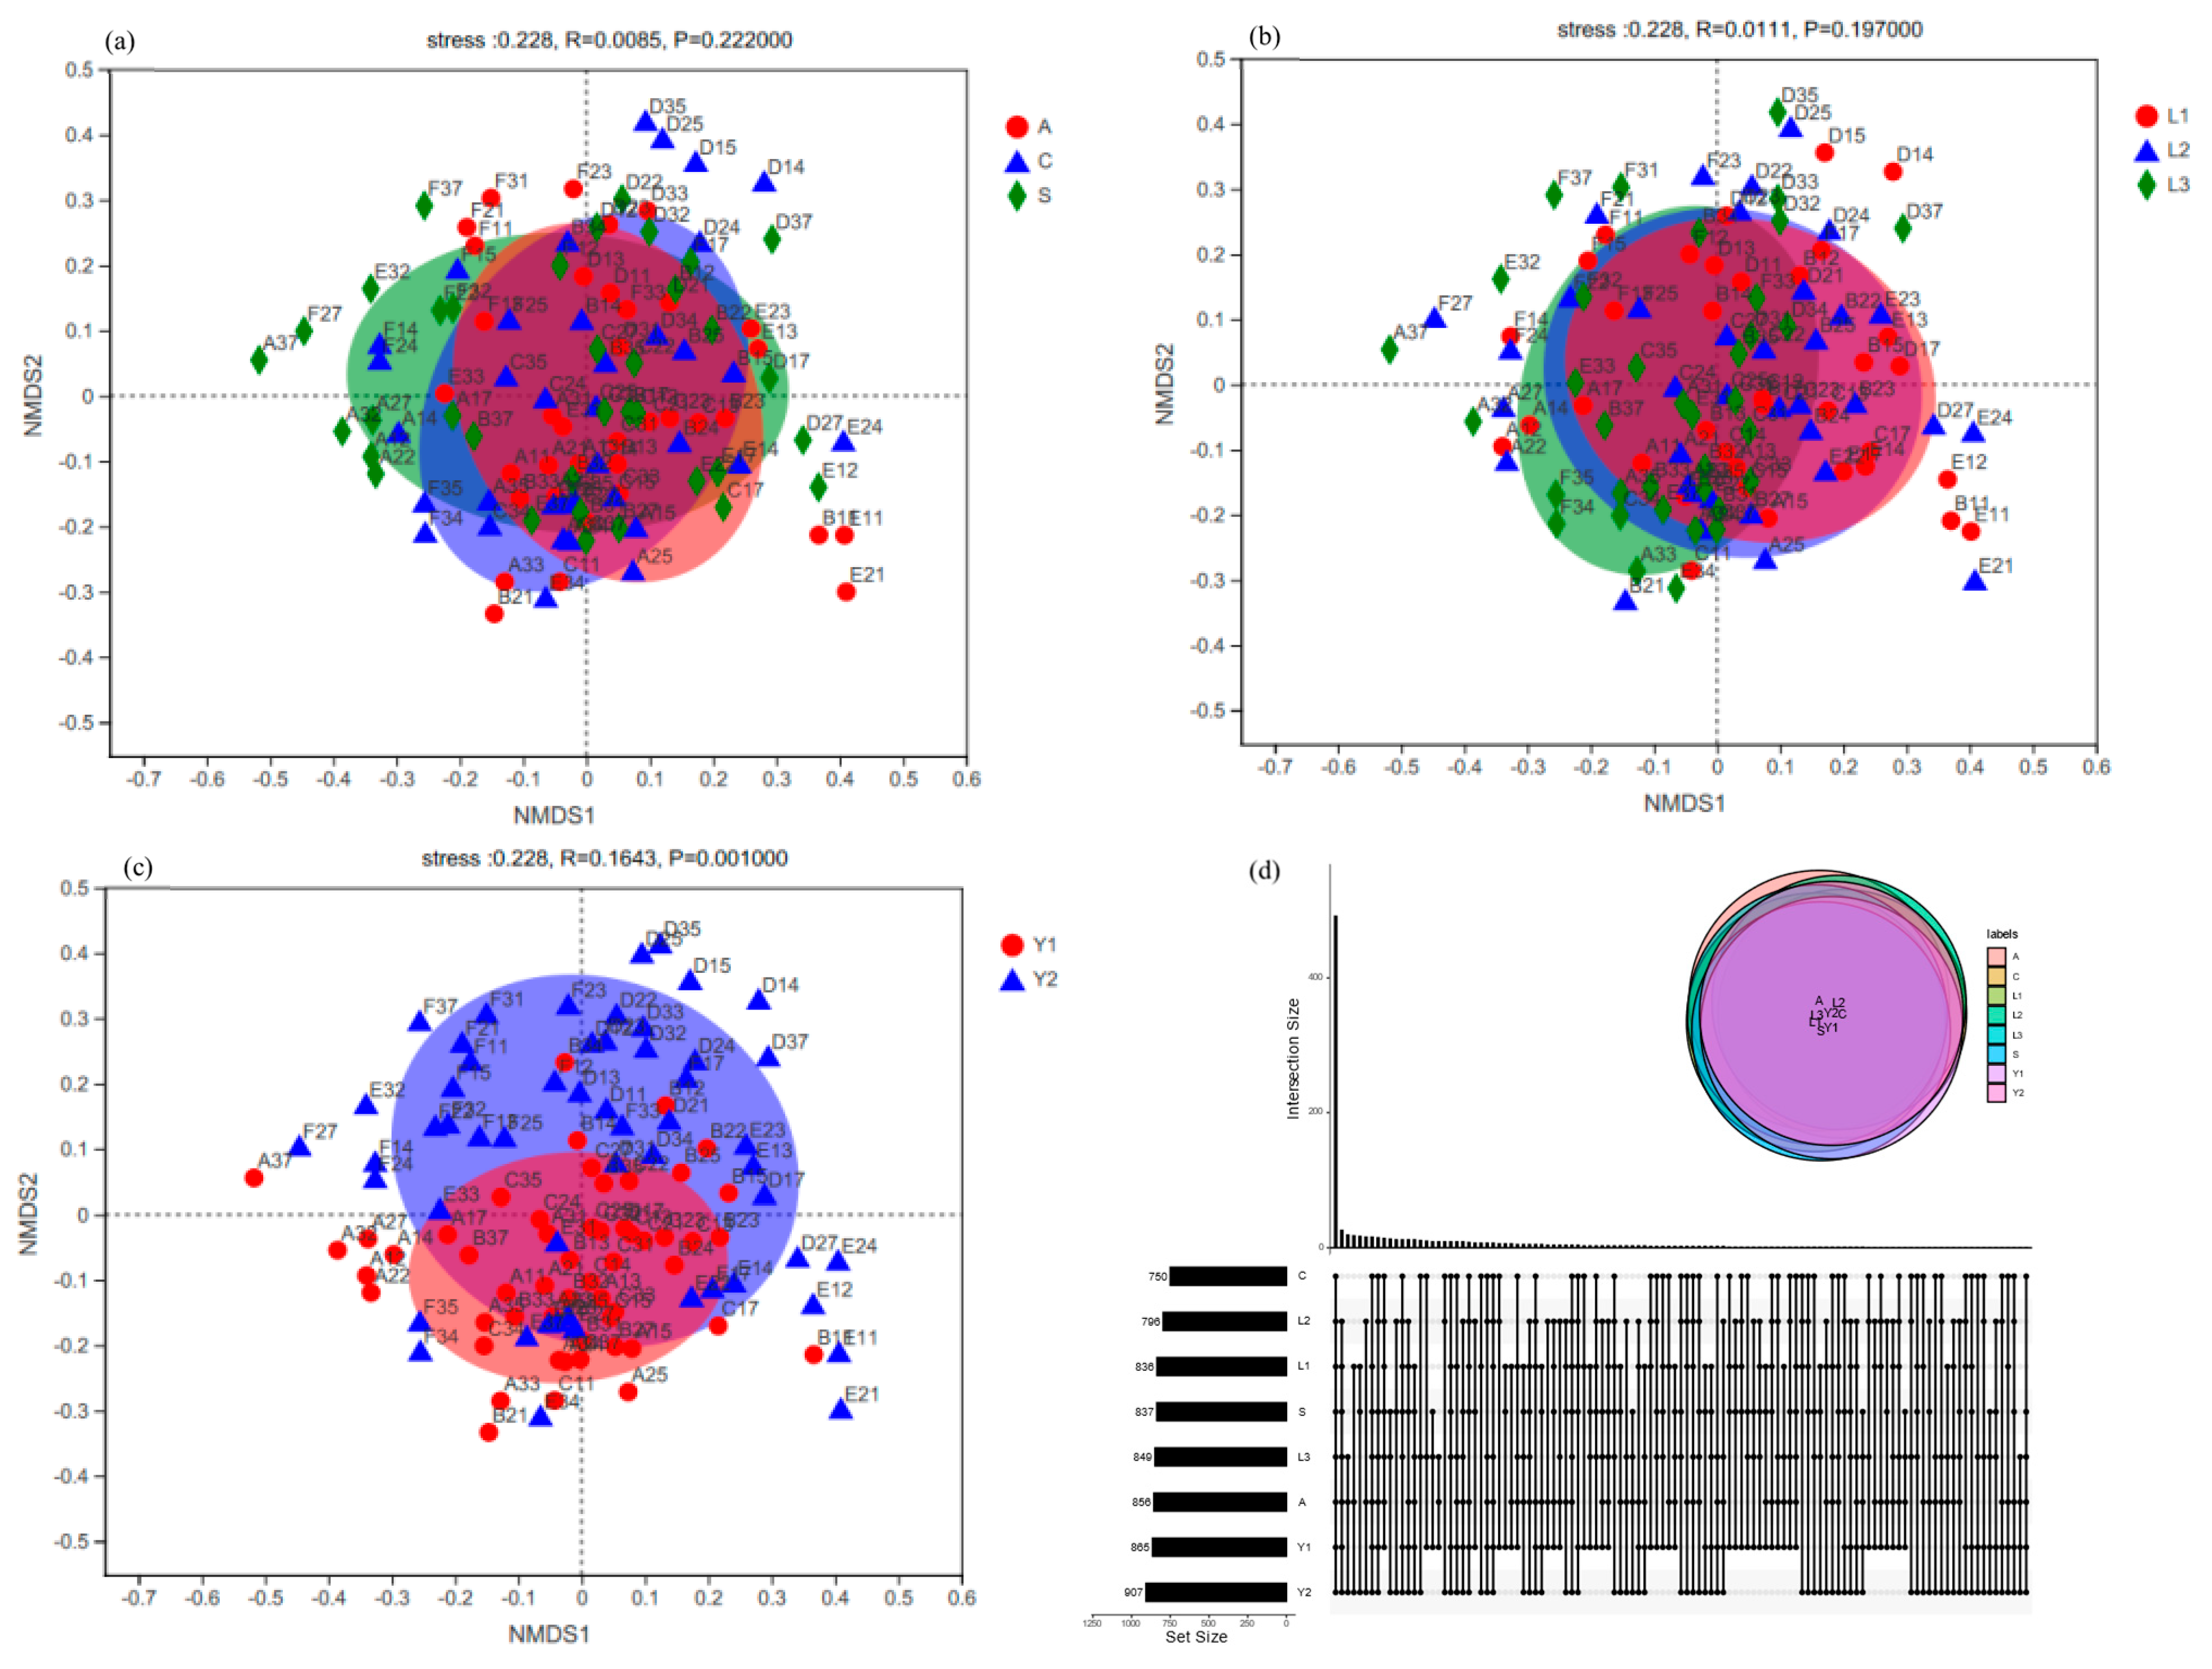
The result of non-metric multidimensional scaling (NMDS) based on fungi OTU levels showed that different samples were distributed in orientation A, orientation C and orientation S (Figure 6a–c). However, there was no significant difference among them. In the vertical position the separated samples of L1 were D15, D14, E12, B11 and E11, the L2 samples were D25, E21 and F27, and the L3 samples were D35, F37, D37 and A37. However, their fungi composition did not show significant differences. The effect of storage time on fungi communities also showed the same phenomenon.
To analyze the similarity and specificity of fungi communities, the rice samples’ OTUs were compared with each other. The results are presented in the Wayne diagram (Figure 6d). A total of 118 fungi OTUs were found in all the samples and were defined as core OTUs. These OTUs were found to account for 71.51% of the total ITS gene sequences. However, only nine fungi core OTUs were affected by the orientation, including OTU4, OTU19, OTU98, OTU103, OTU152, OTU201, OTU597, OTU1107 and OTU1348. OTU1348, was the most abundant species and was found in orientations A, C and S. Two core OTUs, OTU188 and OTU370, were also affected by the vertical position (Table S5). Between them, as shown in Figure S1 and Table 3, OTU188 had a higher quantity in the orientations L1, L2 and L3 (L1: 7.75 ± 2.77%, L2: 8.75 ± 3.01%, L3: 12.18 ± 3.42%, Candida sp.). Moreover, the 62 fungi core OTUs were influenced by storage time, from which OTU123 had the highest quantity in Y1 and Y2 (Y1: 21.14 ± 2.77%, Y2: 9.73 ± 2.13%, Fusarium sp.) as shown in Table 3 and Figure S1.
4. Discussion
4.1. Effect of Granary Orientation, Vertical Position and Storage Time on Rice Fungi Communities in Storage
In this study, the effects of granary orientation, vertical position and storage time on the alpha diversity of fungi on rice were analyzed using ITS gene sequencing (Table 1). This index showed the fungi community in orientation A was significantly higher than in orientation C. This is because orientation A is close to the granary walls, which makes the ventilation uneven at the bottom and corners. This phenomenon easily causes overheating and leads to fungi community diversity variation. The Chao1 index of fungi community decreased with the storage time extension. Previous studies have reported that freshly stored rice carried a large number of field fungi with ample microbial communities, which was gradually replaced by storage fungi during storage [15]. Moreover, other reports have also shown that storage fungi are inhibited because of controlled storage conditions, which leads to a reduction in the fungi community with increasing storage years [16].
Among the 30 dominant fungi genera with high relative abundance, the orientation had a significant effect on the relative abundance of Paracoinothyrium sp. and Clavispora sp. (Figure 4), but both of them are harmless to rice. The Paracoinothyrium sp. is a kind of fungi from plant, while Clavispora sp. belongs to ascomycetous yeast separated from grapes [17,18]. Their relative abundance also decreased obviously during storage. The vertical position within the granary had an important influence on Aspergillus sp., which was much more prevalent in the upper and middle layers than the bottom, but its relative abundance decreased with grain pile depth increase. The genus Aspergillus sp. is widely distributed in nature, accounting for about 12% of airborne fungi and causing mold rot in a wide range of materials. It is considered the most destructive fungal pathogen of rice. There are at least 170 species belonging to Aspergillus sp., including A. penicillioides, A. flavus, A. amsterlodami, A. proliferans, A. niger and A. ochraceus which mainly exist in rice grain [19]. According to the sequence similarity analysis in this study, A. penicillioides and A. flavus were present in rice samples and might cause mildew (Figure S1.). In previous studies, Aspergillus penicillioides was isolated from rice grain and was recognized as a key pathogen causing mold [20]. The optimal growth conditions for Aspergillus sp. range between 25–30 °C. It has a hyperosmotic tolerance characteristic and can grow on dry substrates, therefore, it is usually found during rice storage [21], so rice moisture control is an important way to avoid rice mildew. Especially, the moisture of a granary with freshly harvested rice often has significant effect on the fungi community [22]. Many different methods are used to control paddy rice moisture to avoid rice mildew and mycotoxin production, such as thermal sterilization, microwave and infrared radiation heating [23]. In addition to rice moisture and fungi community variation, the germination rate, enzyme activity and sulfhydryl content of rice grains were also reported to decrease with increasing storage time, while its fatty acid values, malondialdehyde content, and electrical conductivity increased [24].
Volatile organic compounds (VOC) are recognized as a key index to estimate rice quality, and include aldehydes, heterocycles and other specific organic compounds [25]. These aromas are significantly affected by temperature, moisture, storage time and microbiology. When the microbiology changes, the VOC of rice also changes, so VOCs are also an effective method to test fungi community variation [26].
The relative abundance of Candida sp., Fusarium sp., Alternaria sp., Curvularia sp., Clavispora sp. and Naganishia sp. decreased with the storage time extended, while five other fungi genera showed an opposite trend. Rhizopus sp. is also detrimental to rice grain and is considered a pernicious fungus in rice [27]. According to a previous report, Rhizopus sp. is found mainly in soil, vegetation and grain, is highly adaptable and can grow on a variety of organic matter. Once the sporangiospore is emitted from the sporangium, it moves freely in the air and settles down on the surface of organic matter [28]. The Gibberella sp. usually causes rice bakanae disease, leading to quantitative and qualitative losses of rice under field conditions [29]. The Tilletia sp. is also an important category that causes rice fungal disease, such as Tilletia barclayana, which mainly leads to rice kernel smut and causes considerable losses of yield in rice and reduced milling quality in epidemic years [30].
4.2. Core Fungi of Rice Storage
The present study shows that storage orientation, vertical position and storage time have different effects on the rice fungi community. Although the most dominant Eumycota in rice samples was Ascomycota (Figure 2), it showed significant variation at the genus level, such as Mucor sp., Clavispora sp. and Rhodotorula sp. (Table S3). Mucor sp. has been reported as a main c fungi contaminant in rice, but some kinds of them are used for rice fermentation [31,32]. When the conditions are suitable, Mucor sp. strains can hydrolyze the proteins of rice grain and make rice straw convert to ethanol [33]. When conditions are appropriate for growing, it might resolve the proteins of rice and is able to utilize cellobiose as the carbon source to saccharify and ferment into ethanol. Most strains of Clavispora. sp. are harmless to rice, they are often used for fermentation of acid rice soup or rice wine [34]. The Rhodotorula sp. belongs to yeast, the strains of which are usually found in soil and seawater and are also used to hydrolyze rice straw and rice bran [35].
In addition, nine screened OTUs were significantly affected by the orientation, and 77.78% of them belonged to the genus Candida sp. According to some reports, most strains of Candida sp. in rice are related to rice starch fermentation, organic acid production and phytase-production [36,37]. Two other OTUs belonged to the Aspergillus sp. and varied obviously at various vertical positions. Moreover, there were 62 OTUs that were influenced by storage time distinctly, and 37.10% of them belonged to Aspergillus sp., 17.74% were Candida sp., and 16.13% were Penicillium sp. Penicillium sp. grows on decaying fruit, vegetables and grains in a saprophytic manner. As a common fungi genus in rice, Penicillium sp. is often found in rice roots and stems, which can cause rice yellowing, mildew and produce mycotoxins during rice storage. Especially, sterigmatocystin (STC) is an emerging mycotoxin leading to cancer, and is secreted by some Penicillium sp. strains [38]. To avoid STC production, it is better to keep rice at a low temperature and find a method to remove Penicillium sp. from rice.
The fungi abounded on the rice surface in which the main communities that caused rotten rice were filamentous fungi, including Mucor, Penicillium, Cladosporium, Magnaporthe, Alternaria, Curvularia and Nigrospora. Tilletia and Gibberella can seriously damage rice, and the current granary management did not have good control of these fungal communities. There were twelve fungi harmful to rice among the thirty most dominant communities, and a few of them were stored fungi, including Aspergillua and Penicillium. Compared with other studies concerning rice fungi, our study mainly focused on postharvest fungi variation during storage, so we did not mention the arbuscular mycorrhizal fungi (AMF), which naturally colonize on rice and form symbiotic relationships with it to provide nutrients and defend from other pathogen fungi [39]. Another fungi that also did not appear in this study was Ustilaginoidea virens, which often infects rice and leads to rice growth reduction [40]. This may have been because of the growth condition variations, as field fungi are often significantly reduced during rice storage [41]. There are also other studies about rice stored fungi, but they were mainly concerned with the relationship between fungi and mycotoxin. So, this study provides a comprehensive analysis of fungi variation in stored rice.
5. Conclusions
This study provided a systematic analysis of fungi communities composition and variation during rice storage, which revealed the effects of storage conditions on fungi diversity. It identified that rice had many fungi communities during storage, and the main fungi zones were harmful to its quality and to food safety. The obtained data showed that the dominant Eumycota were Ascomycota (73.81%), Mucoromycota (9.42%), and Basidiomycota (6.56%) and the dominant fungal genera were Aspergillus sp., Fusarium sp., Rhizopus sp., Gibberella sp., Tilletia sp., and Penicillium sp. These fungi communities were also significantly affected by the granary orientation, vertical position, and storage time, therefore, an efficient way to control fungi growth is by ensuring a uniform atmosphere and uniform humidity through good ventilation.
Supplementary Materials
The following supporting information can be downloaded at: https://www.mdpi.com/article/10.3390/pr10040754/s1, Figure S1: Evolutionary tree of the 43 fungal core OTU sequences from rice samples; Table S1: The effect of orientation, vertical position and storage time on fungal alpha diversity and the relative abundance of dominant Eumycota; Table S2: Relative abundance of dominant fungi on the rice surface at the phylum level; Table S3: Relative abundance of dominant fungal genera; Table S4: The relative abundance of 30 dominant fungal genera under different orientation, vertical position and storage time; Table S5: The relative abundance of core fungi OTUs in different storage orientations.
Author Contributions
Conceptualization, X.L. and H.H.; methodology, W.L.; software, J.C.; validation, W.L.; formal analysis, J.Z.; investigation, H.H.; resources, J.L.; data curation, T.H.; writing—original draft preparation, W.L.; writing—review and editing, H.H.; visualization, J.G.; supervision, X.L.; project administration, X.L.; funding acquisition, H.H. All authors have read and agreed to the published version of the manuscript.
Funding
This research was funded by [National Natural Science Foundation of China] grant number [No.32102103]; [Zhejiang Lingyan Research Plan Program] grant number [No.2022C020202] and [Hangzhou Agriculture and Society Active Design Program] grant number [No.20190101A07].
Institutional Review Board Statement
Not applicable.
Informed Consent Statement
Not applicable.
Data Availability Statement
Not applicable.
Conflicts of Interest
The authors declare no conflict of interest.
References
- Tong, C.; Gao, H.; Luo, S.; Liu, L.; Bao, J. Impact of Postharvest Operations on Rice Grain Quality: A Review. Compr. Rev. Food Sci. Food Saf. 2019, 18, 626–640. [Google Scholar] [CrossRef] [PubMed] [Green Version]
- Liu, Y.; Shad, Z.M.; Strappe, P.; Xu, L.; Zhang, F.; Chen, Y.; Li, D. A review on rice yellowing: Physicochemical properties, affecting factors, and mechanism. Food Chem. 2022, 370, 131265. [Google Scholar] [CrossRef]
- Prom-U-Thai, C.; Rerkasem, B. Rice quality improvement. A review. Agron. Sustain. Dev. 2020, 40, 28. [Google Scholar] [CrossRef]
- Bertuzzi, T.; Romani, M.; Rastelli, S.; Giorni, P. Mycotoxins and Related Fungi in Italian Paddy Rice During the Growing Season and Storage. Toxins 2019, 11, 151. [Google Scholar] [CrossRef] [PubMed] [Green Version]
- Choi, S.; Jun, H.; Bang, J.; Chung, S.-H.; Kim, Y.; Kim, B.-S.; Kim, H.; Beuchat, L.R.; Ryu, J.-H. Behaviour of Aspergillus flavus and Fusarium graminearum on rice as affected by degree of milling, temperature, and relative humidity during storage. Food Microbiol. 2015, 46, 307–313. [Google Scholar] [CrossRef] [PubMed]
- Tian, T.; Zhang, B.; Chen, S.; Tao, T.; Liu, Q.; Liu, B.; Yuan, J.; Ding, C. Characterization of differences between microwave and traditional thermal sterilization to prevent fungal spoilage during storage of high-moisture paddy rice. Cereal Chem. 2021, 98, 154–163. [Google Scholar] [CrossRef]
- Chai, Q.; Li, Y.; Li, X.; Wu, W.; Peng, H.; Jia, R.; Sun, Q. Assessment of variation in paddy microbial communities under different storage temperatures and relative humidity by Illumina sequencing analysis. Food Res. Int. 2019, 126, 108581. [Google Scholar] [CrossRef]
- Shad, Z.M.; Atungulu, G.G. Post-harvest kernel discoloration and fungi activity in long-grain hybrid, pureline and medium-grain rice cultivars as influenced by storage environment and antifungal treatment. J. Stored Prod. Res. 2019, 81, 91–99. [Google Scholar] [CrossRef]
- Duan, S.; Yang, W.; Wang, X.; Mao, S.; Zhang, Y. Forecasting of Grain Pile Temperature From Meteorological Factors Using Machine Learning. IEEE Access 2019, 7, 130721–130733. [Google Scholar] [CrossRef]
- Peng, D.; Nie, J.; Chen, W. Performance and energy consumption of liquid desiccant dehumidification grain in-bin drying system via layered model. Trans. Chin. Soc. Agric. Eng. 2021, 37, 274–282. [Google Scholar]
- Syamsiyah, J.; Sunarminto, B.H.; Hanudin, E.; Widada, J.; Herawati, A. Assessing soil carbon sequestration in upland rice systems using rice straw and mycorrhiza. IOP Conf. Ser. Earth Environ. Sci. 2018, 200, 012028. [Google Scholar] [CrossRef]
- He, X.; Liu, H.; Lv, C.; Wang, F.; Zhao, C.; Tao, R.; Li, J.; Liu, Z.; Du, L. Analysis of rice microbial communities under different storage conditions using culture-dependent and -independent techniques. Qual. Assur. Saf. Crop. Foods 2022, 14, 1–11. [Google Scholar] [CrossRef]
- Kumar, D.; Singh, K.N.; Shamim, M.; Kumar, M.; Siddiqui, M.W.; Srivastava, D.; Kumar, S.; Kumar, R.; Upadhyay, P.K. Storage of fungi with rice (Oryza sativa)-PRH 10 and their influence on seed quality. Indian J. Agric. Sci. 2020, 90, 1250–1253. [Google Scholar]
- Toju, H.; Tanabe, A.; Yamamoto, S.; Sato, H. High-Coverage ITS Primers for the DNA-Based Identification of Ascomycetes and Basidiomycetes in Environmental Samples. PLoS ONE 2012, 7, e40863. [Google Scholar] [CrossRef] [PubMed] [Green Version]
- Qi, Z.; Zhou, X.; Tian, L.; Zhang, H.; Cai, L.; Tang, F. Distribution of mycotoxin-producing fungi across major rice production areas of China. Food Control 2022, 134, 108572. [Google Scholar] [CrossRef]
- He, P.; Hassan, M.; Tang, F.; Jiang, H.; Chen, M.; Liu, R.; Lin, H.; Chen, Q. Total Fungi Counts and Metabolic Dynamics of Volatile Organic Compounds in Paddy Contaminated by Aspergillus niger During Storage Employing Gas Chromatography-Ion Mobility Spectrometry. Food Anal. Methods 2022, 1–14. [Google Scholar] [CrossRef]
- Drumonde-Neves, J.; Čadež, N.; Reyes-Domínguez, Y.; Gallmetzer, A.; Schuller, D.; Lima, T.; Pais, C.; Franco-Duarte, R. Clavispora santaluciae f.a., sp. nov., a novel ascomycetous yeast species isolated from grapes. Int. J. Syst. Evol. Microbiol. 2020, 70, 6307–6312. [Google Scholar] [CrossRef] [PubMed]
- Guo, Z.; Ren, F.; Che, Y.; Liu, G.; Liu, L. New Bergamotane Sesquiterpenoids from the Plant Endophytic Fungus Paraconiothyrium brasiliense. Molecules 2015, 20, 14611–14620. [Google Scholar] [CrossRef] [Green Version]
- Saleh, A.S.M.; Wang, P.; Wang, N.; Yang, L.; Xiao, Z. Brown Rice Versus White Rice: Nutritional Quality, Potential Health Benefits, Development of Food Products, and Preservation Technologies. Compr. Rev. Food Sci. Food Saf. 2019, 18, 1070–1096. [Google Scholar] [CrossRef] [Green Version]
- Golroodbari, M.S.; Nosrati, A.C. Evaluation of Aspergillus spp. reflecting to subgenus circumdati section flavi contamination in the gilan province, is stored and fresh harvested rice crops. IIOAB J. 2016, 7, 58–61. [Google Scholar]
- Xu, J.; Liu, K.; Zhang, C. Electronic nose for volatile organic compounds analysis in rice aging. Trends Food Sci. Technol. 2021, 109, 83–93. [Google Scholar] [CrossRef]
- Ding, C.; Khir, R.; Pan, Z.; Wood, D.F.; Venkitasamy, C.; Tu, K.; El Mashad, H.; Berrios, J. Influence of infrared drying on storage characteristics of brown rice. Food Chem. 2018, 264, 149–156. [Google Scholar] [CrossRef] [PubMed]
- Wang, B.; Khir, R.; Pan, Z.; El Mashad, H.; Atungulu, G.G.; Ma, H.; McHugh, T.H.; Qu, W.; Wu, B. Effective Disinfection of Rough Rice Using Infrared Radiation Heating. J. Food Prot. 2014, 77, 1538–1545. [Google Scholar] [CrossRef] [PubMed]
- Müller, A.; Nunes, M.T.; Maldaner, V.; Coradi, P.C.; de Moraes, R.S.; Martens, S.; Leal, A.F.; Pereira, V.F.; Marin, C.K. Rice Drying, Storage and Processing: Effects of Post-Harvest Operations on Grain Quality. Rice Sci. 2022, 29, 16–30. [Google Scholar] [CrossRef]
- Lim, D.; Mo, C.; Lee, D.-K.; Long, N.P.; Lim, J.; Kwon, S.W. Non-destructive profiling of volatile organic compounds using HS-SPME/GC–MS and its application for the geographical discrimination of white rice. J. Food Drug Anal. 2018, 26, 260–267. [Google Scholar] [CrossRef]
- Gu, S.; Wang, Z.; Wang, J. Untargeted rapid differentiation and targeted growth tracking of fungal contamination in rice grains based on headspace-gas chromatography-ion mobility spectrometry. J. Sci. Food Agric. 2021. [Google Scholar] [CrossRef]
- Zhao, C.; Su, W.; Mu, Y.; Jiang, L.; Mu, Y. Correlations between microbiota with physicochemical properties and volatile flavor compo-nents in black glutinous rice wine fermentation. Food Res. Int. 2020, 138, 109800. [Google Scholar] [CrossRef]
- Dossou, B.; Silue, D. Rice pathogens intercepted on seeds originating from 11 African countries and from the USA. Seed Sci. Technol. 2018, 46, 31–40. [Google Scholar] [CrossRef]
- Lee, S.-B.; Kim, N.; Hur, Y.-J.; Cho, S.-M.; Kim, T.-H.; Lee, J.-Y.; Cho, J.-H.; Lee, J.-H.; Song, Y.-C.; Seo, Y.-S.; et al. Fine mapping of qBK1, a major QTL for bakanae disease resistance in rice. Rice 2019, 12, 136. [Google Scholar] [CrossRef] [Green Version]
- Wang, L.; Nysetvold, E.; Zhou, X.-G. Culture media promoting sporulation of rice kernel smut fungus Tilletia barclayana. Eur. J. Plant Pathol. 2021, 161, 629–635. [Google Scholar] [CrossRef]
- Makun, H.A.; Gbodi, T.A.; Akanya, O.H.; Salako, E.A.; Ogbadu, G.H. Fungi and some mycotoxins contaminating rice (Oryza sativa) in Niger State, Nigeria. Afr. J. Biotechnol. 2007, 6, 99–108. [Google Scholar]
- Khosravi, A.R.; Shokri, H.; Zaboli, F. Grain-Borne Mycoflora and Fumonisin B1 From Fresh-Harvested and Stored Rice in Northern Iran. Jundishapur J. Microbiol. 2013, 6, 1–6. [Google Scholar] [CrossRef] [Green Version]
- Khaleghian, H.; Karimi, K.; Behzad, T. Ethanol production from rice straw by sodium carbonate pretreatment and Mucor hiemalis fermentation. Ind. Crop. Prod. 2015, 76, 1079–1085. [Google Scholar] [CrossRef]
- Liu, N.; Pan, J.; Miao, S.; Qin, L. Microbial community in Chinese traditional fermented acid rice soup (rice-acid) and its correlations with key organic acids and volatile compounds. Food Res. Int. 2020, 137, 109672. [Google Scholar] [CrossRef] [PubMed]
- Yin, L.; Chen, J.; Wu, W.; Du, Z.; Guan, Y. Immobilization of Laccase on Magnetic Nanoparticles and Application in the Detoxification of Rice Straw Hydrolysate for the Lipid Production of Rhodotorula glutinis. Appl. Biochem. Biotechnol. 2021, 193, 998–1010. [Google Scholar] [CrossRef]
- Li, N.; Zhang, B.; Zhao, S.; Niu, M.; Jia, C.; Huang, Q.; Liu, Y.; Lin, Q. Influence of Lactobacillus/Candida fermentation on the starch structure of rice and the related noodle features. Int. J. Biol. Macromol. 2019, 121, 882–888. [Google Scholar] [CrossRef]
- Zhu, A.; Tan, H.; Cao, L. Isolation of phytase-producing yeasts from rice seedlings for prospective probiotic applications. 3 Biotech 2019, 9, 216. [Google Scholar] [CrossRef]
- Samsudin, N.I.P.; Abdullah, N. A preliminary survey on the occurrence of mycotoxigenic fungi and mycotoxins contaminating red rice at consumer level in Selangor, Malaysia. Mycotoxin Res. 2013, 29, 89–96. [Google Scholar] [CrossRef]
- Bernaola, L.; Cange, G.; Way, M.O.; Gore, J.; Hardke, J.; Stout, M. Natural Colonization of Rice by Arbuscular Mycorrhizal Fungi in Different Production Areas. Rice Sci. 2018, 25, 169–174. [Google Scholar] [CrossRef]
- Qiu, J.H.; Meng, S.; Deng, Y.Z.; Huang, S.W.; Kou, Y.J. Ustilaginoidea virens: A Fungus Infects Rice Flower and Threats World Rice Production. Rice Sci. 2019, 26, 199–206. [Google Scholar] [CrossRef]
- Pitt, J.I.; Miller, J.D. A Concise History of Mycotoxin Research. J. Agric. Food Chem. 2017, 65, 7021–7033. [Google Scholar] [CrossRef] [PubMed]
Figure 1.
The illustration of position distribution for sampling points in a granary.

Figure 2.
Relative abundance of fungi on rice grain. The relative abundance of Eumycota level, containing Ascomycota, Basidiomycota and Mucoromycota are represented by a square, circle and triangle, respectively.
Figure 2.
Relative abundance of fungi on rice grain. The relative abundance of Eumycota level, containing Ascomycota, Basidiomycota and Mucoromycota are represented by a square, circle and triangle, respectively.

Figure 3.
Heat map of the fungal community variation on rice grain. The highest relative abundance of 30 fungal genera were selected to generate the heat map. The color-coding was based on the average relative abundance at the genus level of each sample.
Figure 3.
Heat map of the fungal community variation on rice grain. The highest relative abundance of 30 fungal genera were selected to generate the heat map. The color-coding was based on the average relative abundance at the genus level of each sample.

Figure 4.
The effect of orientation, position and storage time on the 30 genera with the highest relative abundance. The results of different orientation, vertical position, and storage time effect on fungi are show in (a), (b) and (c), respectively.
Figure 4.
The effect of orientation, position and storage time on the 30 genera with the highest relative abundance. The results of different orientation, vertical position, and storage time effect on fungi are show in (a), (b) and (c), respectively.

Figure 5.
The relative abundance variation of 30 fungal genera in different orientations, vertical positions and storage times. The results of different orientation, vertical position, and storage time effect on fungi are show in (a), (b) and (c), respectively.
Figure 5.
The relative abundance variation of 30 fungal genera in different orientations, vertical positions and storage times. The results of different orientation, vertical position, and storage time effect on fungi are show in (a), (b) and (c), respectively.

Figure 6.
Venn diagram of fungi based on OUT levels in orientation (a), vertical position (b) and storage time (c) and non-metric multidimensional scale analysis (NMDS) for unique and shared fungi OUTs (d).
Figure 6.
Venn diagram of fungi based on OUT levels in orientation (a), vertical position (b) and storage time (c) and non-metric multidimensional scale analysis (NMDS) for unique and shared fungi OUTs (d).


Table 1.
Shannon’s diversity index and Chao1 richness index of fungi on the rice surface.
| Sample Name | Fungus | ||
|---|---|---|---|
| Shannon | Chao1 | ||
| Orientation | A | 2.68 ± 0.11 a | 317.02 ± 16.90 a |
| C | 2.58 ± 0.09 a | 264.65 ± 15.80 b | |
| S | 2.41 ± 0.10 a | 291.46 ± 13.08 ab | |
| Vertical position | L1 | 2.58 ± 0.11 a | 290.07 ± 17.68 a |
| L2 | 2.57 ± 0.10 a | 283.26 ± 14.36 a | |
| L3 | 2.52 ± 0.11 a | 299.30 ± 14.75 a | |
| Storage time | Y1 | 2.53 ± 0.09 a | 321.08 ± 10.09 a |
| Y2 | 2.58 ± 0.08 a | 261.08 ± 13.87 b | |
Different letters a and b indicate significant differences between samples (p < 0.05, Duncan’s test, T-test). A, C, S, L1, L2, L3, Y1 and Y2 mean the different sampling location.
Table 2.
Effect of granary orientation, vertical position and storage time on the variance of fungi Shannon diversity index and Chao1 abundance index.
Table 2.
Effect of granary orientation, vertical position and storage time on the variance of fungi Shannon diversity index and Chao1 abundance index.
| Shannon | Chao1 | |
|---|---|---|
| Horizontal | 2.92 | 5.98 |
| Vertical | 0.09 | 0.11 |
| Storage time | 0.20 | 17.18 |
Table 3.
Multivariate analysis of variance of the orientation, vertical position and storage time effect on fungi.
Table 3.
Multivariate analysis of variance of the orientation, vertical position and storage time effect on fungi.
| Sums of Squares | Mean Squares | F.Model | R2 | p-Value | |
|---|---|---|---|---|---|
| Horizontal | 0.67926 | 0.33963 | 1.31205 | 0.02438 | 0.13 |
| Vertical | 0.62467 | 0.31234 | 1.2042 | 0.02242 | 0.266 |
| Storage time | 1.76889 | 1.76889 | 7.18676 | 0.06349 | 0.001 |
Publisher’s Note: MDPI stays neutral with regard to jurisdictional claims in published maps and institutional affiliations. |
© 2022 by the authors. Licensee MDPI, Basel, Switzerland. This article is an open access article distributed under the terms and conditions of the Creative Commons Attribution (CC BY) license (https://creativecommons.org/licenses/by/4.0/).
Share and Cite
MDPI and ACS Style
Li, W.; Cui, J.; Li, J.; Guo, J.; Huang, T.; Zhang, J.; Hu, H.; Liu, X. Analysis of the Fungi Community Variation during Rice Storage through High Throughput Sequencing. Processes 2022, 10, 754. https://doi.org/10.3390/pr10040754
AMA Style
Li W, Cui J, Li J, Guo J, Huang T, Zhang J, Hu H, Liu X. Analysis of the Fungi Community Variation during Rice Storage through High Throughput Sequencing. Processes. 2022; 10(4):754. https://doi.org/10.3390/pr10040754
Chicago/Turabian StyleLi, Wanting, Jie Cui, Jiafeng Li, Jian Guo, Tao Huang, Jiaojiao Zhang, Hao Hu, and Xingquan Liu. 2022. "Analysis of the Fungi Community Variation during Rice Storage through High Throughput Sequencing" Processes 10, no. 4: 754. https://doi.org/10.3390/pr10040754
Note that from the first issue of 2016, this journal uses article numbers instead of page numbers. See further details here.