
Predictive Classifier for Cardiovascular Disease Based on Stacking Model Fusion


College of Intelligence Equipment, Shandong University of Science and Technology, Tai’an 271000, China
*
Author to whom correspondence should be addressed.
Processes 2022, 10(4), 749; https://doi.org/10.3390/pr10040749
Submission received: 4 March 2022
/
Revised: 7 April 2022
/
Accepted: 11 April 2022
/
Published: 13 April 2022
(This article belongs to the Special Issue Recent Advances in Machine Learning and Applications)
Abstract
:The etiology of cardiovascular disease is still an unsolved world problem, and high morbidity, disability, and mortality are the main characteristics of cardiovascular diseases. There is, therefore, a need for effective and rapid early prediction of likely outcomes in patients with cardiovascular disease using artificial intelligence (AI) techniques. The Internet of Things (IoT) is becoming a catalyst for enhancing the capabilities of AI applications. Data are collected through IoT sensors and analyzed and predicted using machine learning (ML). Existing traditional ML models do not handle data inequities well and have relatively low model prediction accuracy. To address this problem, considering the data observation mechanism and training methods of different algorithms, this paper proposes an ensemble framework based on stacking model fusion, from Support Vector Machines (SVM), K-Nearest Neighbor (KNN), Logistic Regression (LR), Random Forest (RF), Extra Tree (ET), Gradient Boosting Decision Tree (GBDT), XGBoost, LightGBM, CatBoost, and Multilayer Perceptron (MLP) (10 classifiers to select the optimal base learners). In order to avoid the overfitting phenomenon generated by the base learners, we use the Logistic Regression (LR) simple linear classifier as the meta learner. We validated the proposed algorithm using a fused Heart Dataset from several UCI machine learning repositories and another publicly available Heart Attack Dataset, and compared it with 10 single classifier models. The experimental results show that the proposed stacking classifier outperforms other classifiers in terms of accuracy and applicability.
1. Introduction
Machine learning (ML) is a branch of artificial intelligence (AI) that is essentially how computers make sense of data and decide or classify tasks with or without human supervision [1]. The use of machine learning is growing dramatically in the medical diagnostic industry, where computer analysis can reduce human error and improve accuracy [2,3,4,5,6,7,8,9].
Cardiovascular diseases (CVDs), including coronary artery disease (CAD), atrial fibrillation (AF), and other cardiac and vascular diseases, remain leading contributors to death worldwide [10]. The number of people suffering from CVDs is increasing year by year due to the improvement in people’s living standards and the increase in life stress. CVDs include two main categories, namely, acute cardiovascular diseases and chronic cardiovascular diseases [11]. The World Health Organization (WHO) counted about 17.9 million deaths from CVD in 2019, accounting for 32% of global deaths [12,13]. Of the 17 million premature deaths (under 70 years of age) due to non-communicable diseases in 2019, 38% were caused by CVD [14,15]. It is estimated that by 2030, nearly 23.6 million people will die from CVD [16,17]. CVDs include myocardial infarction, atrial fibrillation, and heart failure [18,19]. The occurrence of CVD is influenced by various risk factors, such as race, ethnicity, age, sex, weight, height and blood test results, including renal function, liver function and cholesterol levels [20,21]. These factors are often intertwined and influence the development of various diseases in a complex manner. Therefore, predictive models based on traditional statistical methods usually do not reflect all the complex causal relationships between various risk factors [22,23]. The Internet of Things (IoT) has shown a crucial role in the era of big data bodies, where patients can wear smart pills and smart bracelets with the ability to monitor and collect specific data, and they can feed information into a database during a pandemic [24]. Data sources for healthcare systems are increasingly coming from the analysis of IoT data, and researchers use AI technology to mine new medical information to help physicians understand symptoms and analyze them, and make early predictions of diseases and thus make decisions for different patient conditions, effectively contributing to the development of safe diagnostic methods [25]. The recent standardization of medical data and the systematization of national health screening data have made it possible to analyze previously unknown risk factors [26,27,28]. These factors may be statistically significantly associated with the occurrence of disease, which may in turn allow us to trace various disease mechanisms. In addition, big data analysis is crucial for accurate predictive models of disease occurrence [29,30]. AI and big data have recently attracted much attention and are increasingly being used to predict CVD models. Weng, S.F. et al. [31] used four models: Random Forest (RF), Logistic Regression (LR), Gradient Boosting Decision Tree (GBDT) and Neural Network (NN) on clinical data from more than 300,000 UK households and showed that NN had a very significant advantage in CVD prediction with the best prediction results for the larger amount of data processed. For the small dataset of CVDs, Dimopoulos, A.C. et al [32] studied three traditional machine learning models: K-Nearest Neighbor (KNN), RF, and Decision Tree (DT), based on the ATTICA data with 2020 samples. Under comparison with the HellenicSCORE tool (a calibration of ESC SCORE), RF was found to achieve the best goals. With the popularity of ML techniques in IoT applications, Mohan, S. et al. [33] tried to combine a hybrid approach of two or more techniques by merging RF and Linear Method (LM) and proposed a hybrid HRFLM approach to further improve the prediction accuracy of the model. With the gradual development of the IoT, Akash, I. et al. [34] investigated an approach combining IoT and ML to predict the heart status of the human body. It first collects important data from the human body, such as heart rate, ECG signal, and cholesterol, through IoT devices (sensors), and then uses an ML algorithm model in order to calculate and predict the overall condition of the patient’s heart. The prediction of local areas with unique prediction models has gradually become a hot research topic in recent years, and Yang, L. et al. [35] used LR to analyze 30 CVD-related indicators using more than 200,000 high-risk subjects in eastern China. While using Multiple Regression Models, Classification and Regression Trees (CART), Naive Bayes, Bagging Trees, AdaBoost, and RF were predicted by several methods, and the experimental results obtained an RF model more applicable to the eastern region of China. Yang, L. et al. [36] first introduced a stacking model in the field of CVDs, and, in predicting the daily hospitalization of CVDs, air pollution data and meteorological data characteristics were considered, and a grassroots level consisting of five base learners was constructed for the stacking model, which obtained a stacking model with a better effect than the base learners, but the selection of the base learners is random, which will affect the final prediction result of the meta learner. Zheng, H. et al. [37] used multiple sampling techniques to imbalance the data in predicting and diagnosing the occurrence of major adverse cardiovascular events (MACEs) in patients with early acute coronary syndrome (ACS) and constructed a stacking model consisting of seven base learners. Although the increased variety of base learners can improve the final prediction results of a meta learner to some extent, the selection of base learners is still random and the selection of base learners is more traditional. The world is undergoing the fourth industrial revolution (Industry 4.0), the rapid development and application of digital, fully automated habitats and cyber-physical systems. The fourth industrial revolution is bringing innovative ideas and technological compositions in almost all fields, such as smart healthcare, which recommends technologies and mechanisms for the early prediction of life-threatening diseases [38]. CVDs are still the leading cause of death worldwide, and research in the field of CVDs is urgently needed in order to meet this shift in the fourth industrial revolution.
This thesis aims to solve the problem of randomness in the selection of base learners for the stacking fusion model [39] by adding new base classifiers for the base learners, while we select the SHAP method [40] in feature selection and provide a reasonable explanation for the features within the model. This paper proposes an ensemble framework based on stacking model fusion, from Support Vector Machines (SVM), KNN, LR, RF, Extra Tree (ET), GBDT, XGBoost, LightGBM, CatBoost, and Multilayer Perceptron (MLP) (10 classifiers to select the optimal base learners). In order to avoid the overfitting of the base learners, we use the LR linear classifier as the meta learner. Inspired by many ML models, the stacking model was applied to CVD prediction. The proposed algorithm was validated using a fused Heart Dataset from several UCI machine learning repositories and another publicly available Heart Attack Dataset, and the models were evaluated against 10 single classifiers for accuracy, precision, recall, F1 Score, and AUC values.
2. Materials and Methods
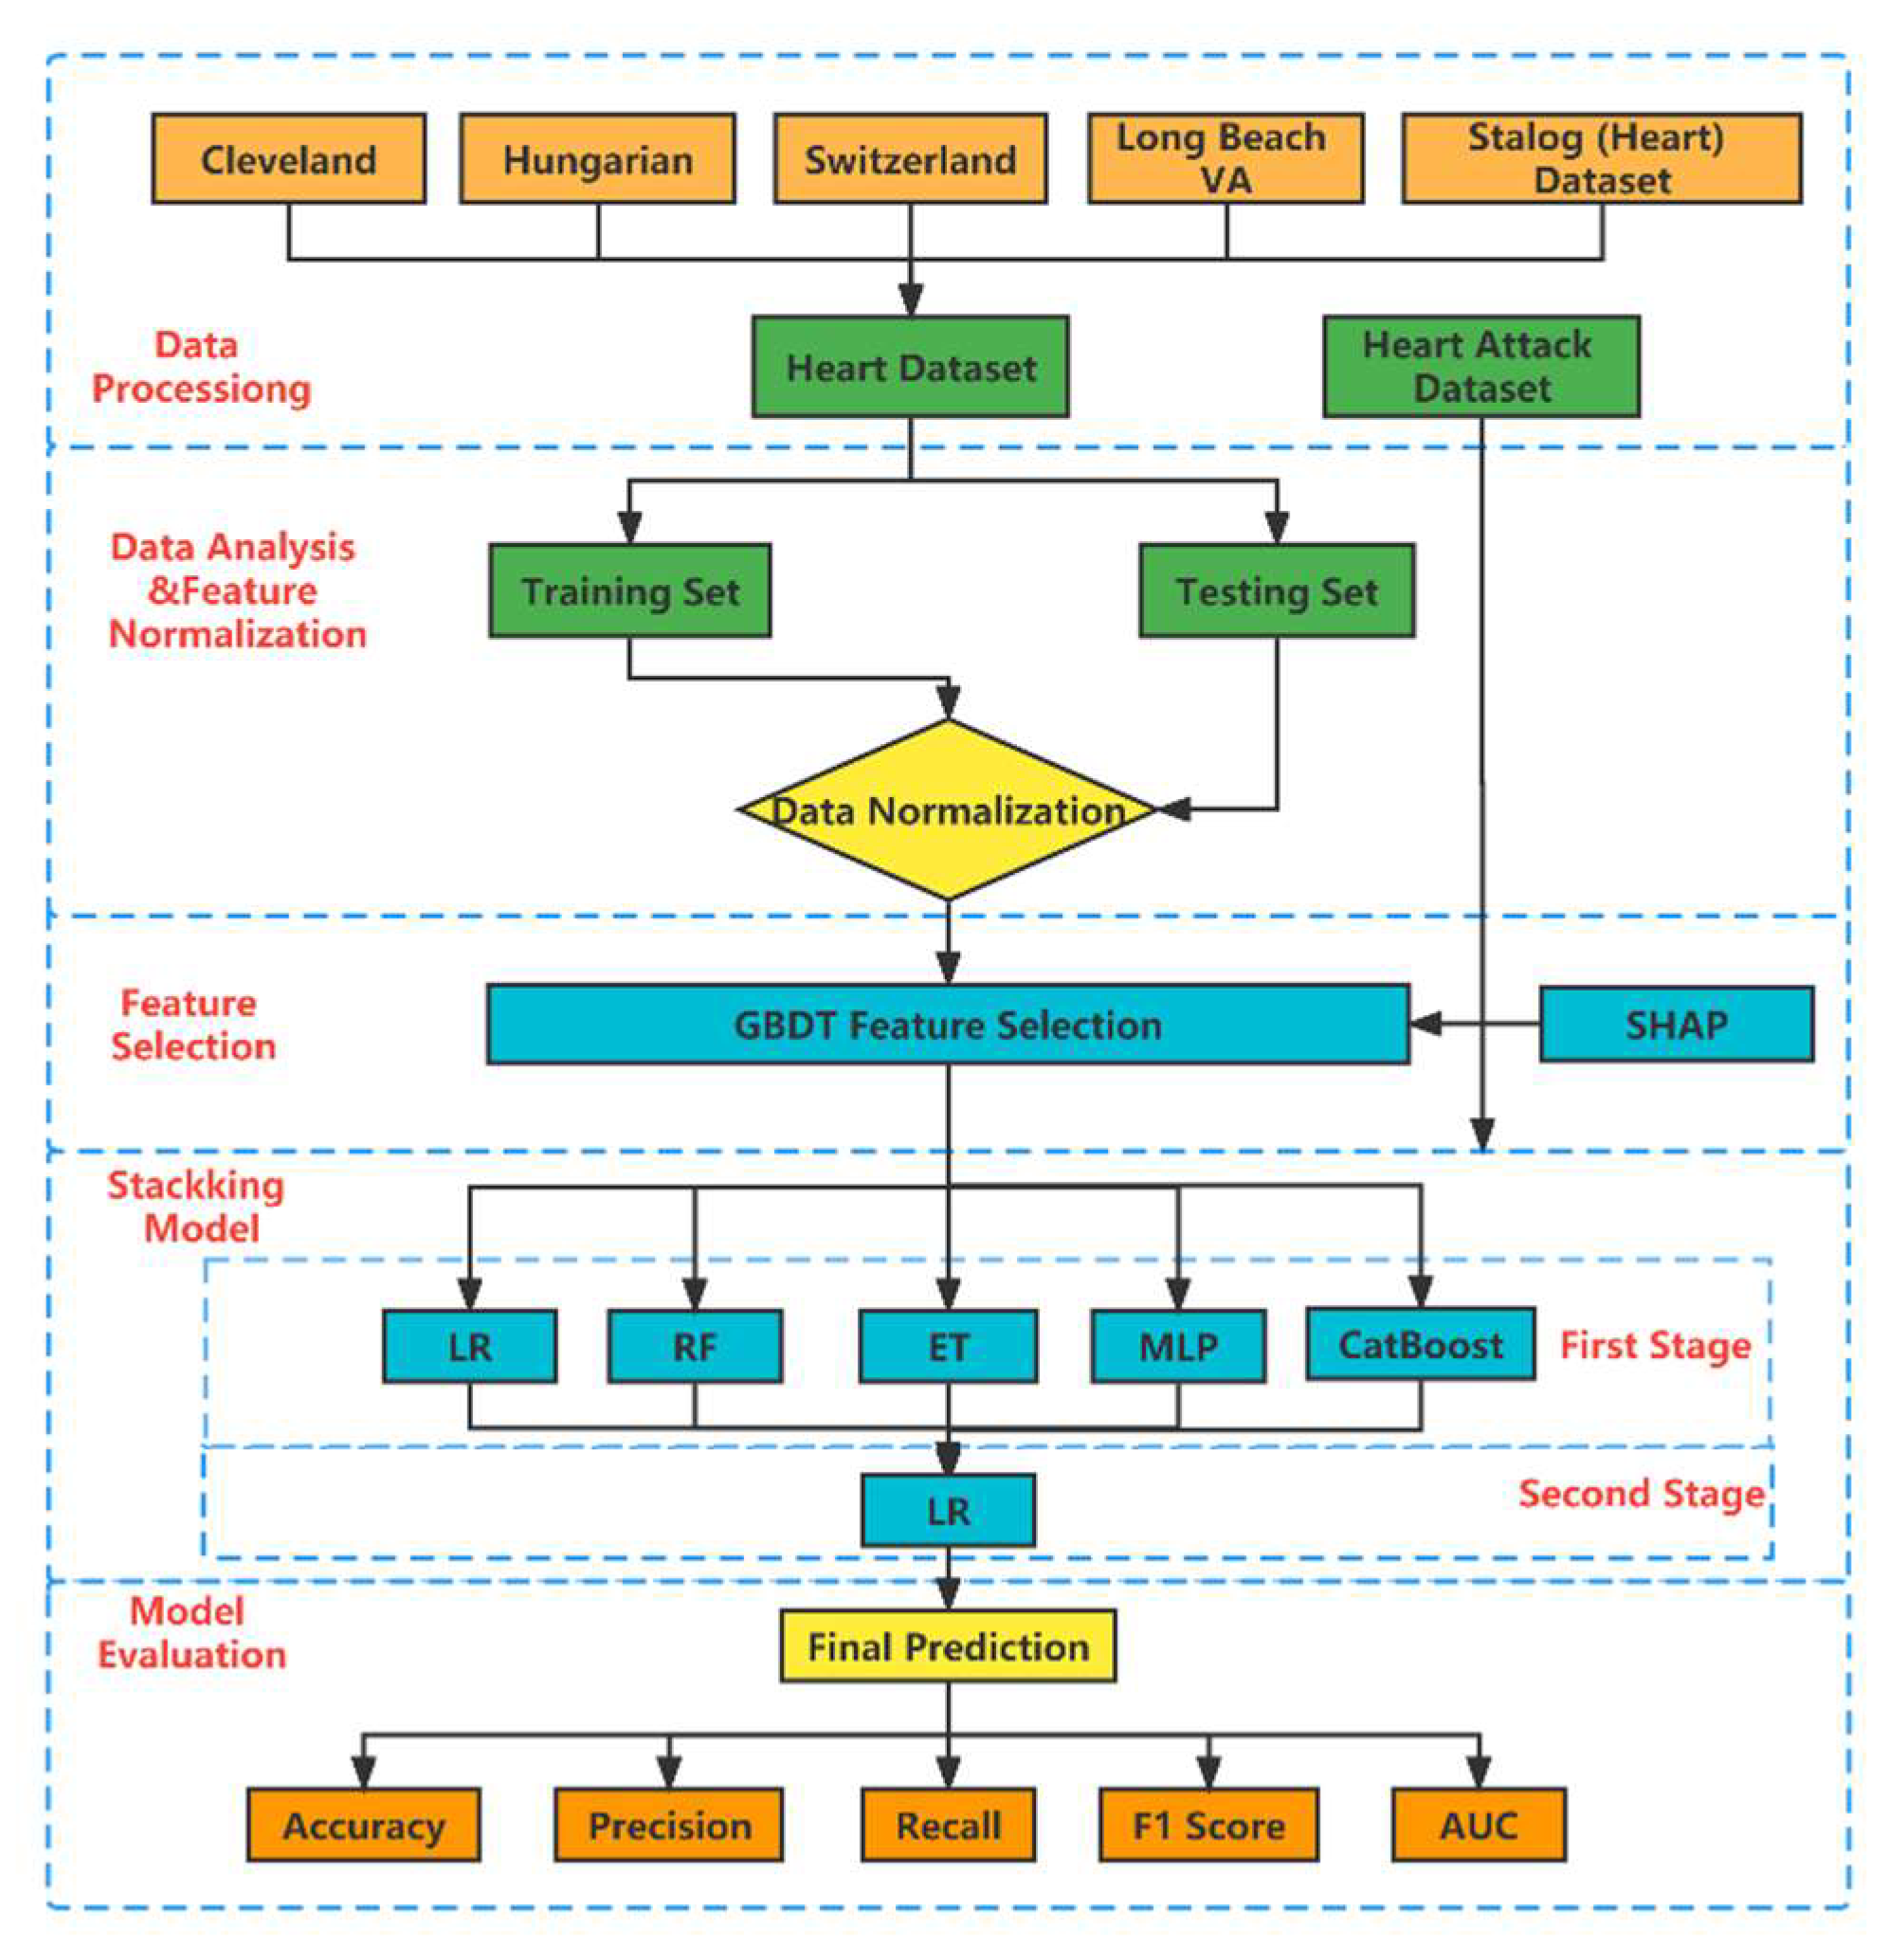
In Figure 1, we show the detailed flow of the whole prediction process. First, integrate the Heart Dataset (including Cleveland data, Hungarian data, Swizerlang data, Long Beach VA data, and Stalog (Heart) data). A total of 11 features were extracted from the five datasets. Immediately afterwards, we divided the Heart Dataset into training set and testing set in a ratio of 8:2 and normalized the data. Feature selection is performed based on the SHAP method using the embedded GBDT. In order to explore the interpretable meaning of the model, we perform SHAP individual feature contributions and individual joint feature contributions on the data after dimensionality reduction here. Next, we construct the stacking model with one layer of base learners and one layer of meta learners. Based on the principle of “good but different,” we selected the LR, RF, ET, MLP, and CatBoost classifiers as base learners from the 10 initial classifiers. In order to avoid overfitting of the base learners, we use the LR linear classifier as the meta learner. Finally, we evaluate the proposed stacking model in terms of accuracy, precision, recall, F1 score, and AUC value. To verify the generalization ability of the model, we chose another public dataset (Heart Attack Dataset) to make predictions on. Detailed information will be discussed in the following subsections.
2.1. Dataset
The Heart Dataset is a fusion of five representative datasets from the UCI machine learning repository, namely, Cleveland data, Hungarian data, Swizerlang data, Long Beach VA data, and Stalog (Heart) data. A total of 1190 samples were selected, and 272 duplicates were removed, leaving 918 sample datasets. Eleven features with significant relevant features from five datasets were selected as the final Heart Dataset, as shown in Table 1. Another public dataset (Heart Attack Dataset) is shown in Table 2.
2.2. Feature Select and Analysis
Feature selection is the process of selecting the best subset of features that have a significant impact on the prediction results [41], which can be effective in improving model performance and saving significant runtime. There are three common feature selection methods: filters, wrappers, and embedded [42]. Since embedded methods have better prediction performance than filter methods and run much faster than wrapper methods [43], our study used the embedded method GBDT to select feature variables [44]. GBDT is an optimization process that uses an additive model and a forward stepwise algorithm to achieve learning [45]. By calculating the reduction in weighted impurity at splitting for all non-leaf nodes, the greater reduction indicates the more important features.
Although the feature importance ranking can be obtained by the embedded GBDT, it is not possible to explain exactly how individual features affect the final prediction results. To address this issue, we use a feature imputation approach where the explanatory model is a linear function of the feature imputation values.
where is the number of features, is the feature attribute value of feature i, and represents whether the feature is observed or not, where the feature attribute can be considered “feature contribution”.
To compute the value of Equation (1), Lundberg, S. et al. [40] introduced a tree-valued estimation algorithm (SHAP method) based on game theoretical ideas as the feature attribute values. A model and a set containing non-zero indexes in with the classical shapley valued attribute for each feature can be formulated as follows.
where is the set of all input features.
The SHAP method is a locally accurate, personalized feature attribution method. Unlike the tree model gain, this method is able to display the consistent results of global feature attributes. In our study, the SHAP method is used for feature filtering and interpretation of individual feature attributes.
Because certain features can be combined with other features for prediction, we also study the interaction between individual features. To distinguish the contributions of individual features, we refer to the contributions of feature interactions as the joint feature contribution. The Shapeley interaction index follows a similar formula to the SHAP value, and the joint feature contribution value for features and is calculated as follows.
When :
Considering the relative ease of obtaining the twinning relationships between joint features in the GBDT model, the feature interactions are further quantified by Equations (3) and (4), and thus the joint contribution of interacting features is estimated and predicted when interpreting the model.
2.3. Model Building
The better the learning ability of each base learner in stacking and the lower the degree of correlation, the better the model prediction. If the diversity of individual learners is greater, the better the fusion of models will be when the individual learners are already more accurate. This is the famous “error-ambiguity decomposition” theory. Therefore, the selection of base learners should follow the principle of “good but different,” which means that while considering the performance of individual learners, we should also consider the dissimilarity between individual learners. In principle, as long as the base classifier of the stacking model works well, the layers of stacking model can be stacked indefinitely, which obviously increases the complexity of the model. We ensure accuracy while reducing the complexity of the model as much as possible, so we only choose the stacking model with a two-layer structure of base learners and meta learner. Therefore, SVM, KNN, LR, RF, ET, GBDT, XGBoost, LightGBM, CatBoost, and MLP were selected as the candidate models for base learners to predict CVDs. The models with better prediction performance were initially selected as base learners based on accuracy, and we finally selected five widely representative models as candidates, including LR, RF, DT, MLP, and CatBoost. The model parameters were optimized by the optuna [46] framework.
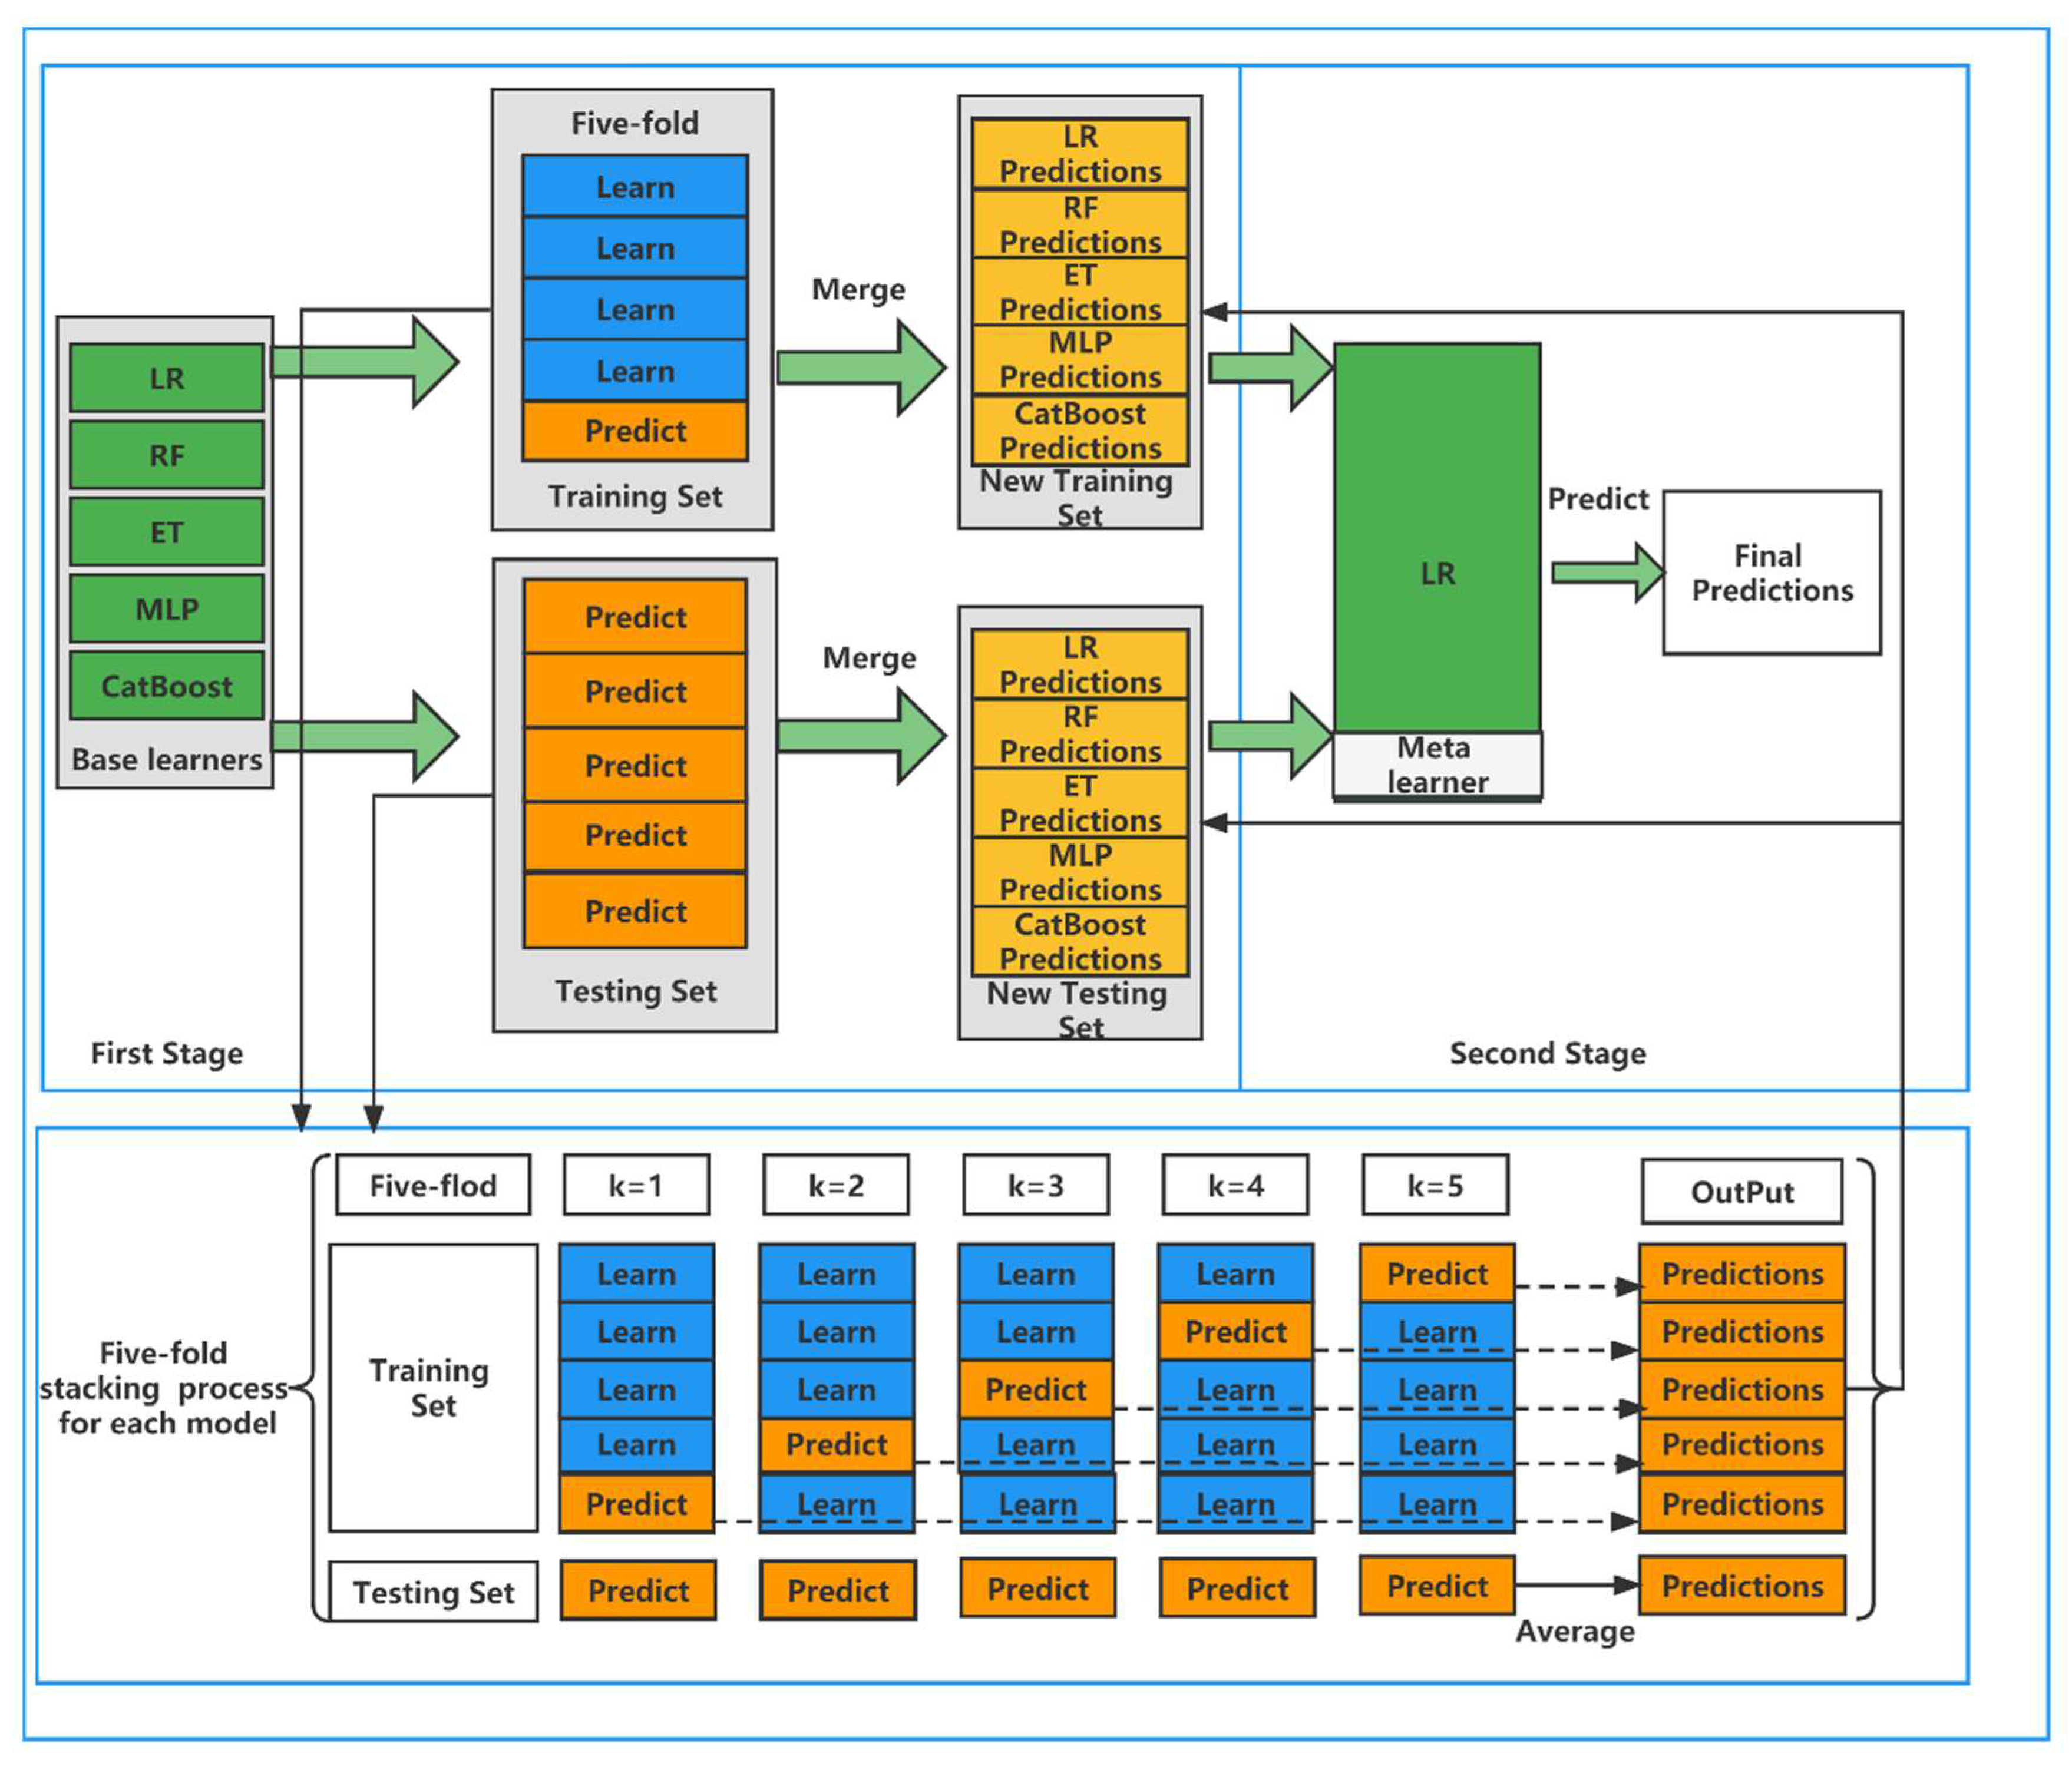
The first layer of the stacking framework usually uses five-fold CV to get the input features of the second layer, and the same model can output multiple features after five-fold CV. The second layer of the stacking framework usually chooses simple classifiers to make predictions, usually generalized linear regression (GLR), so this paper chooses LR as the classifier of the fusion model. The reason is that the base model chosen in the first layer of the stacking framework is usually a complex nonlinear transformation, so there is no need to use complex transformations in the second layer of classifier selection. This is like the output layer of a neural network, which uses very simple functions because they do not require complex functions to control the complexity. The framework of the stacking ensemble learning model is shown in Figure 2.
It can be seen that the base learners include LR, RF, DT, MLP, and CatBoost. In the first stage, we divide the training set and the testing set according to the ratio of 8:2. In the training set, we use five-fold CV for each of the five base learners. One base learner can get five predictions, and we stack these five predictions vertically into a one-dimensional matrix. A total of five base learners can be combined into a five-dimensional matrix as the training data for the second stage. In the testing set, we likewise use the five-fold CV model to predict our original testing set, again obtaining five predictions. In order to ensure the slitting ratio between the training set and testing set, so here the predictions are averaged horizontally to obtain a one-dimensional matrix. The same five base learners can be made to combine into a five-dimensional matrix as the testing data for the second stage. In the second stage, these predictions have high feature importance, and to avoid the resulting overfitting phenomenon, we apply LR to the meta learner and derive the final results based on these predictions. The detailed algorithm of the superposition model is shown in Algorithm 1.
| Algorithm 1: Stacking Model |
| DEFINE: A training set and a testing set . is the training set in five-fold CV process. is the testing set in five-fold CV process. . are base learners, is meta learner. The training set of , the testing set of . |
|
2.4. Evaluation Metrics
ML typically uses true positives (), true negatives (), false positives (), and false negatives () to assess the performance of a model. Our commonly used , , , and Score are obtained from all four of them. The calculation is shown in Equations (5)–(8).
3. Results and Discussion
To illustrate the advantages of the proposed stacking model, we will analyze the experimental results in this section. All experiments were performed in a Python 3.9.7 environment. The sklearn 1.0.2 toolbox was used for model prediction, SHAP 0.40.0 for feature selection and interpretation of features after feature selection, and the Optuna 2.10.0 framework was used to find the optimal parameters. Considering the small sample size and the randomness of the experimental results in this study, we performed 10 splits of the dataset using different random seeds, and the average of the 10 experimental results was used as the final result.
3.1. Results of Feature Selection and Analysis
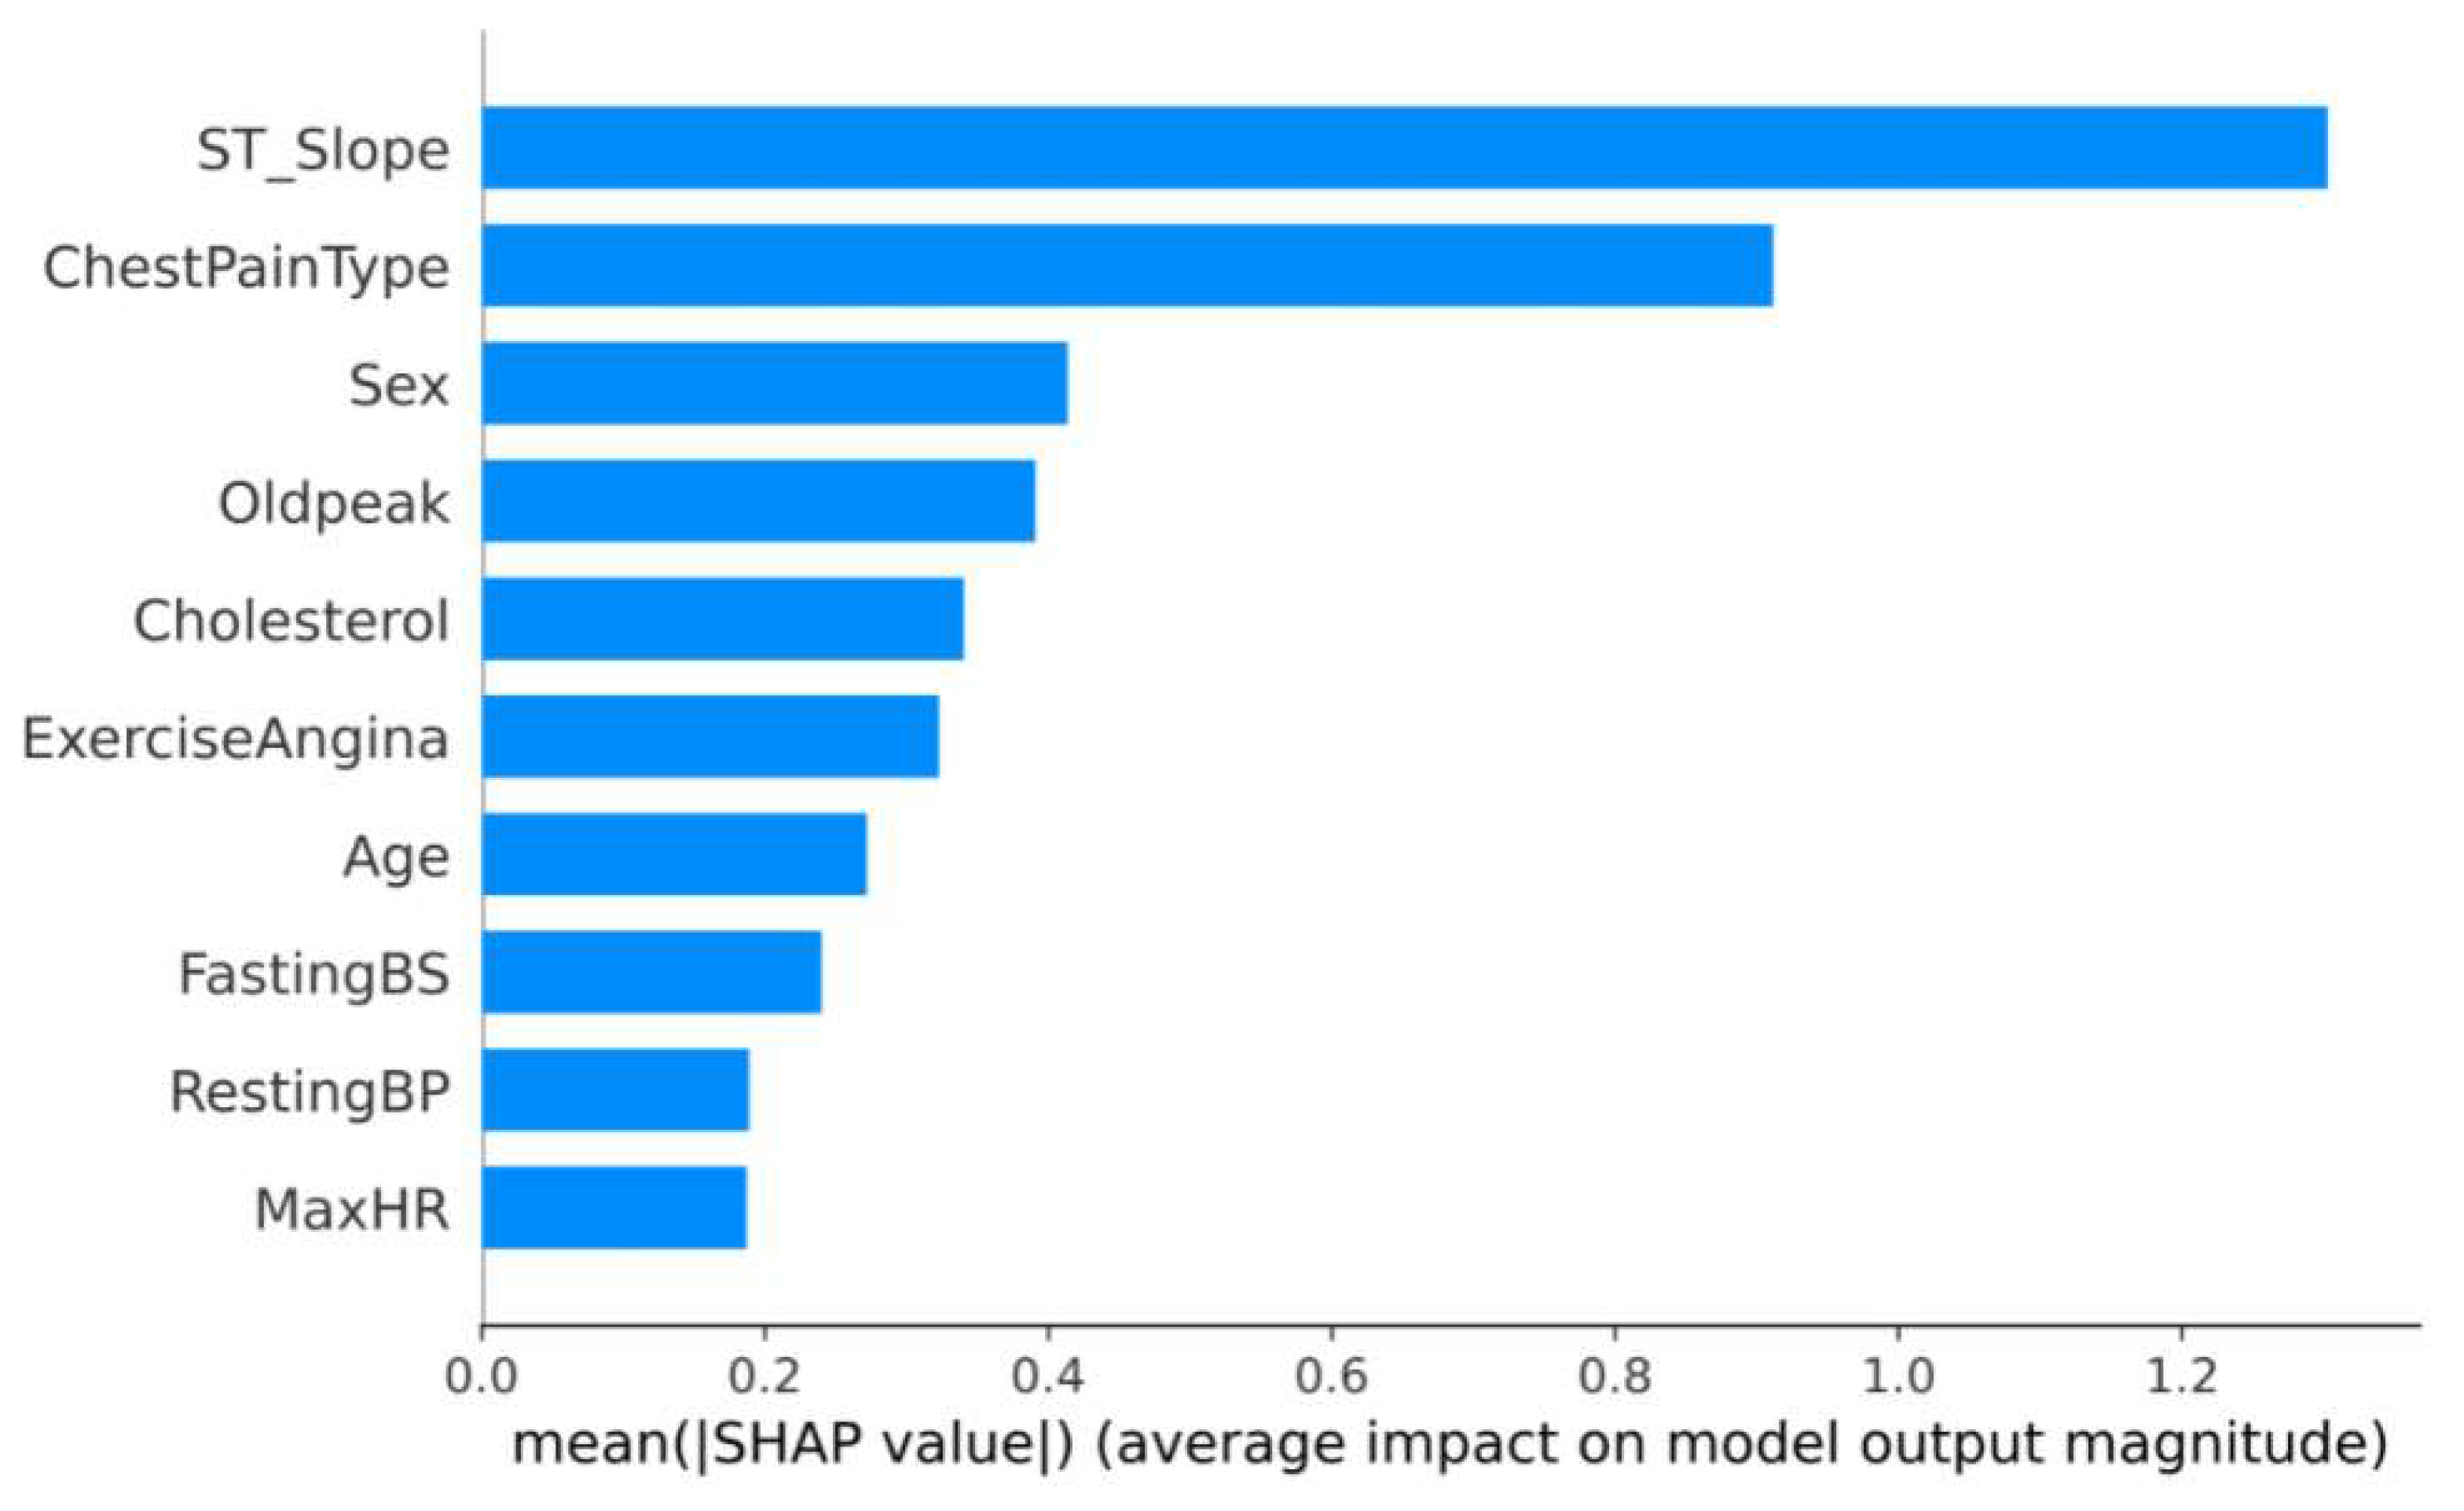
Prior to feature selection, we had 11 features in our dataset. The Tree SHAP method is able to calculate the contribution value of each feature to the individuals in the sample dataset. The feature contributions are ranked by calculating the average of the SHAP values for all samples. Figure 3 shows the global feature contributions in the GBDT model. It can be seen that the “ST_Slope” and “ChestPainType” have a large impact on patients with CVD. To further reduce the running time of the model, we need to remove some redundant features. We set a threshold of 0.02, which resulted in removing the “Resting ECG” feature and retaining the 10 final features. We further used AUC as an evaluation metric to compare the performance before and after feature selection. Although the results of the AUC values of GBDT decreased, the decrease was negligible, and there was no statistically significant difference.
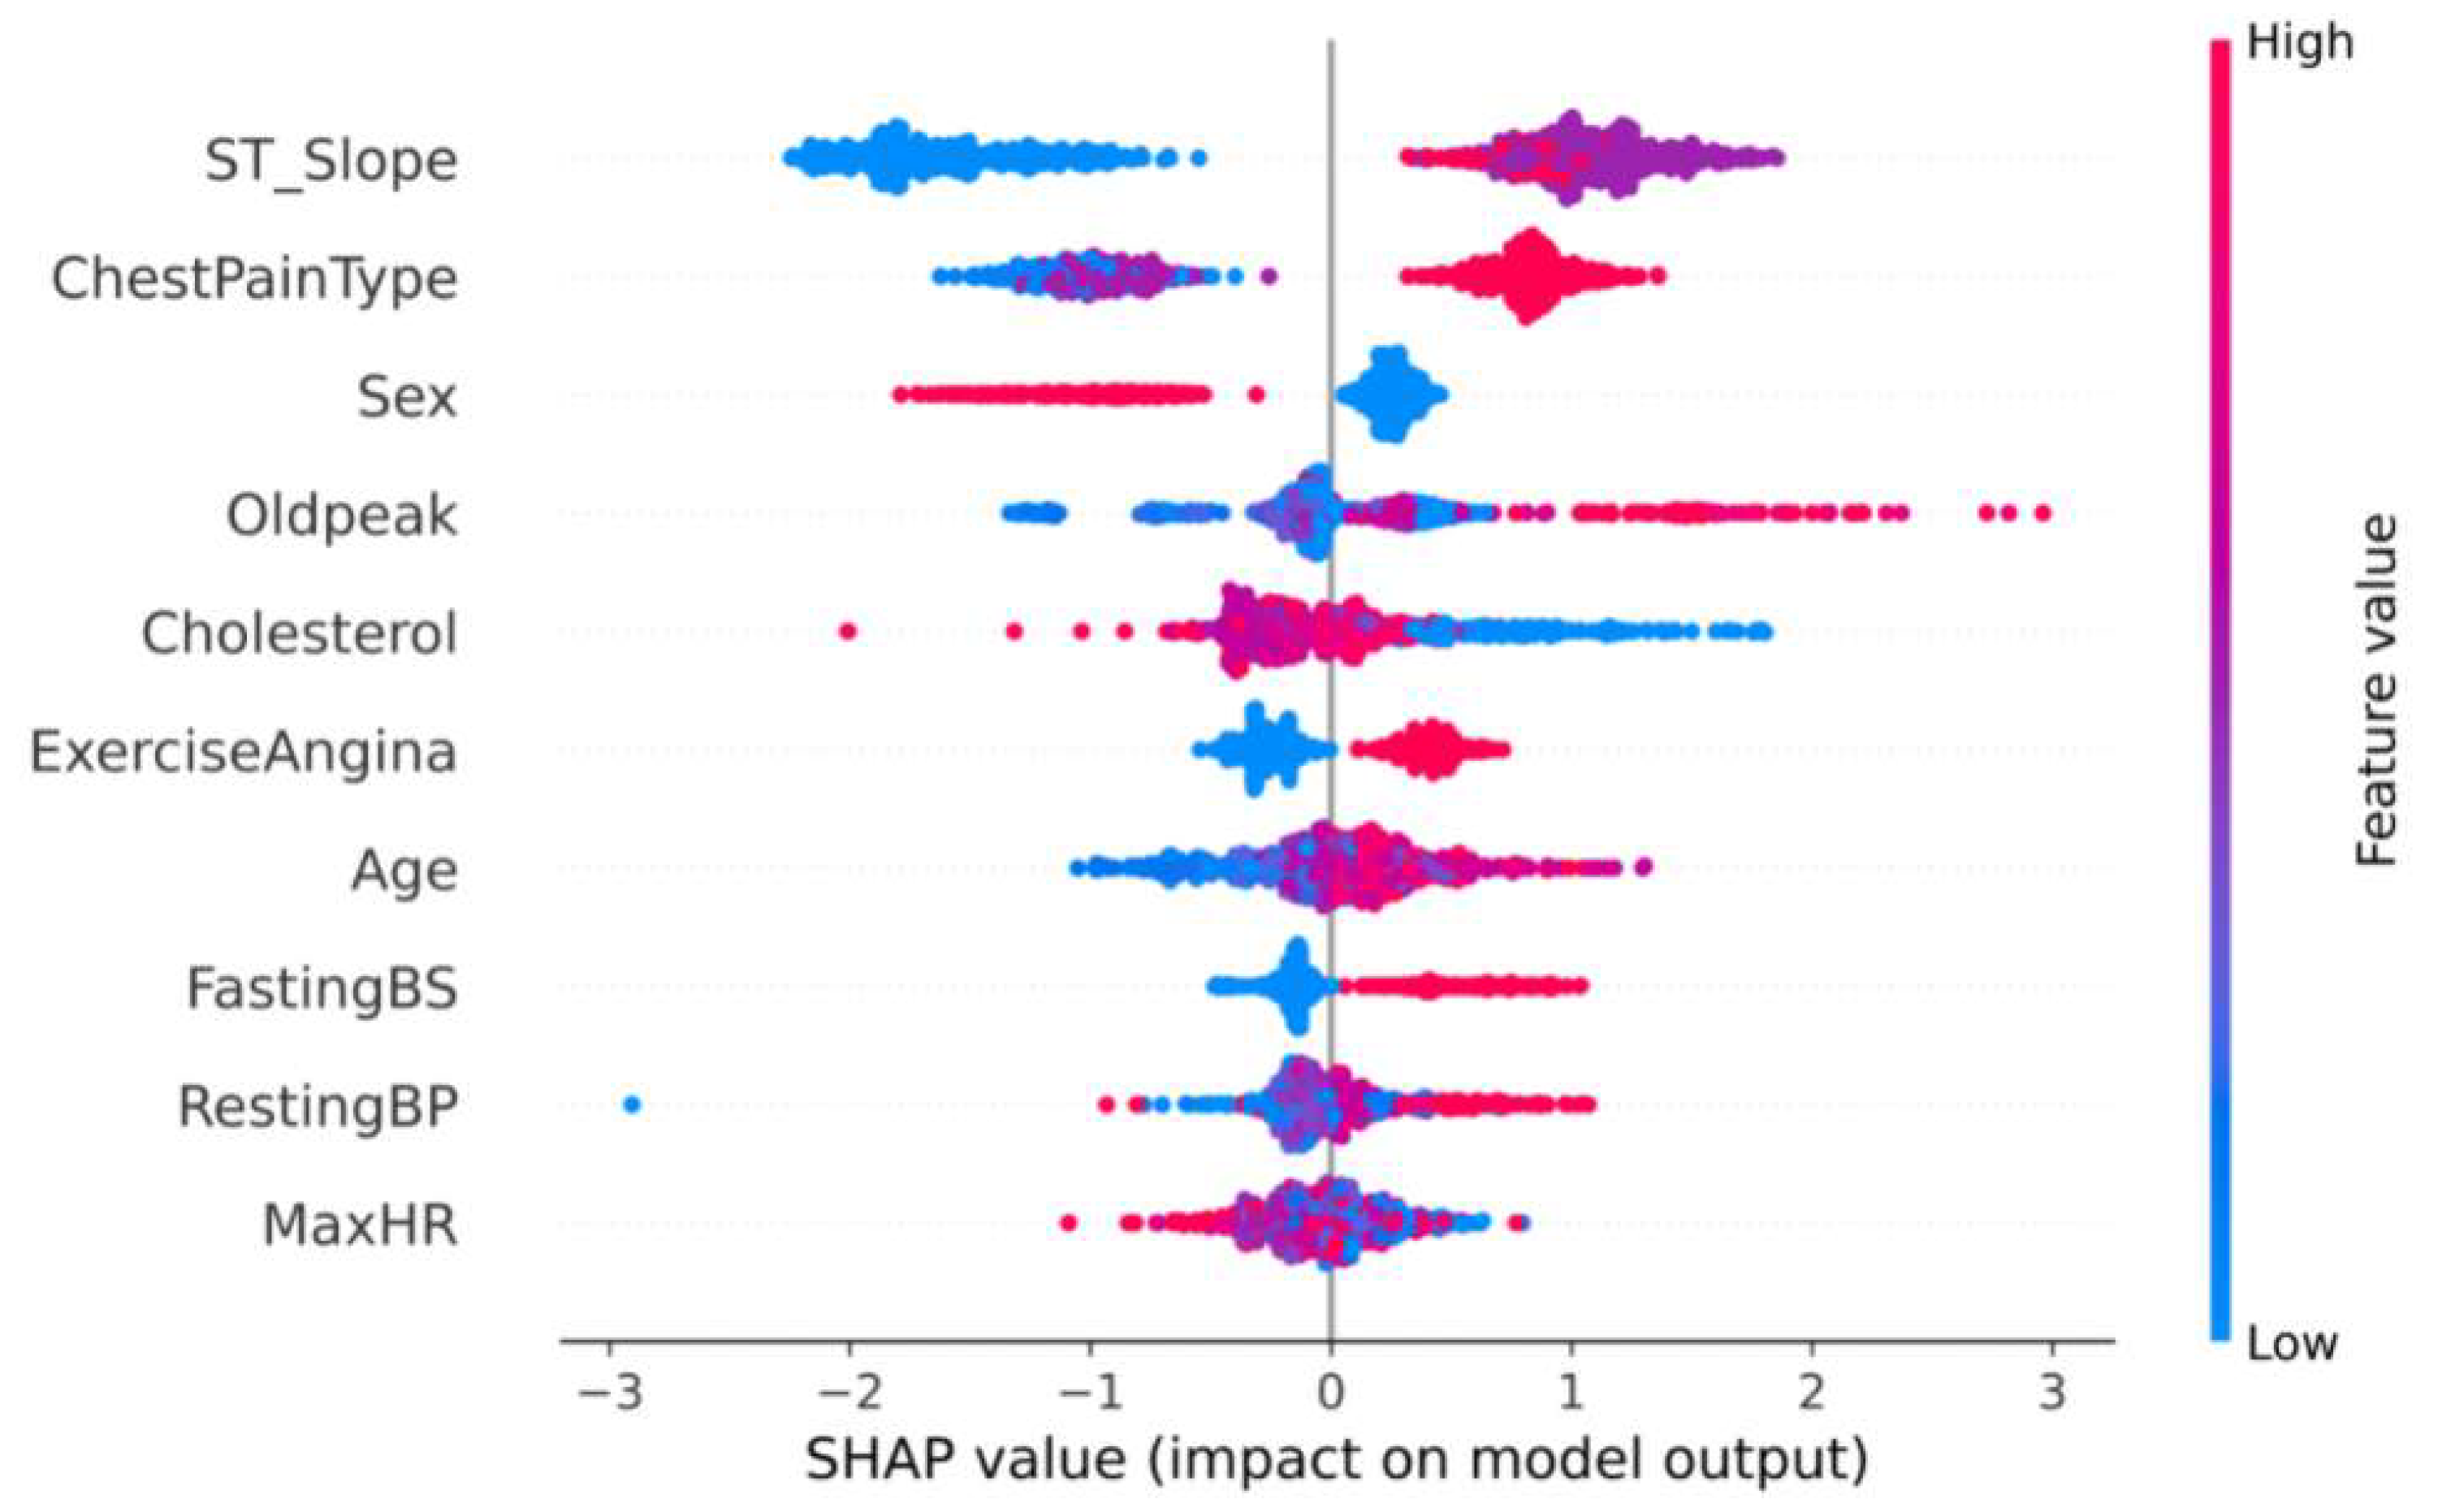
The Tree SHAP values are related to how the features are interpreted, so from the model we can get the feature interpretation for each sample. Some information about the contribution of individual features to the output of the model is shown in Figure 4 and shows in detail how it is affected by their values. The x-axis indicates the magnitude of the contribution of the feature, and the magnitude of the feature value is indicated by the color of the different points.
From Figure 4, we can see that most of the feature values have a non-linear relationship with the contribution values. For example, the top-ranked feature “ST_Slope” has the highest contribution to the prediction result when it is in the “flat” state, while it has the lowest contribution to the prediction result when it is in the “up” state. On the contrary, only “Sex”, “ExerciseAngina” and “FastingBS” are linearly correlated. For example, as the values of “ExerciseAngina” and “FastingBS” increase, the contribution value also increases, making it more important to the predicted results.
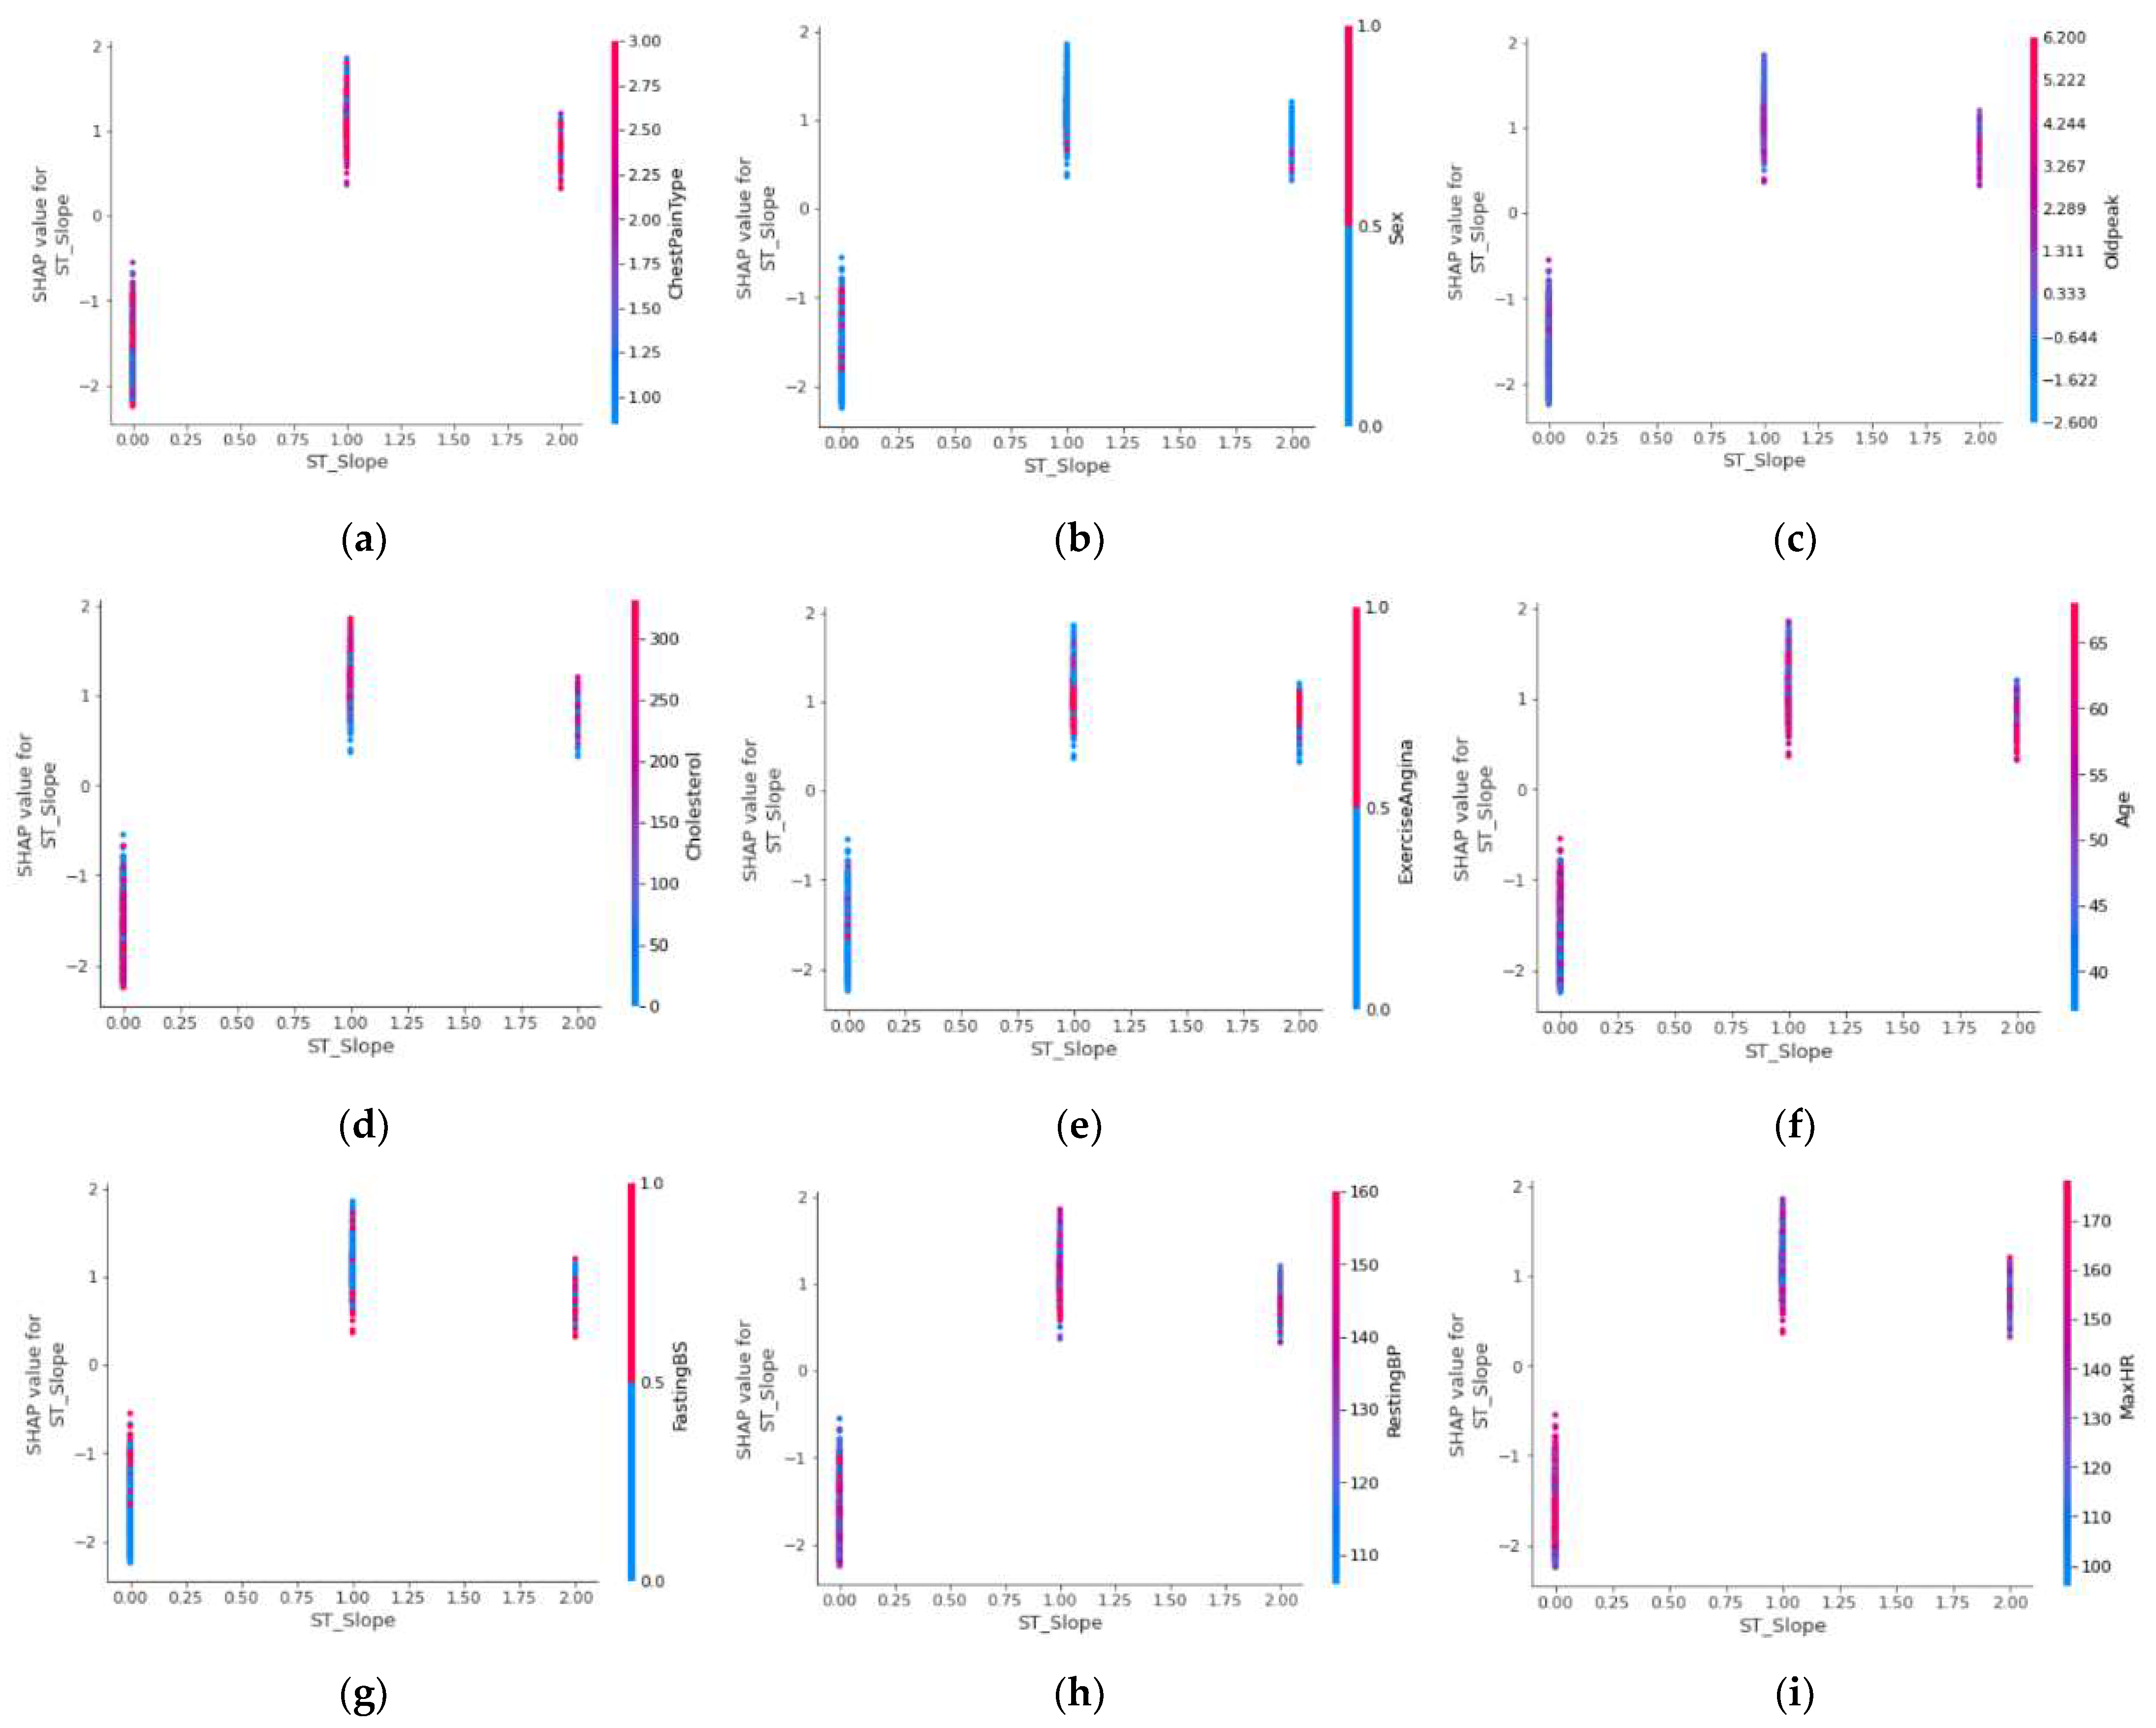
To observe the interaction between the most dominant features and the remaining features, we map the values of the most dominant features to the SHAP values and color-code the remaining features.
As can be seen in Figure 5, “ST_Slope” has the highest contribution value when it is at the “flat” value, when different features also have different effects when “ST_Slope” is at different values. As shown in Figure 5a, when “ST_Slope” is in the “up” state, the number of people with typical angina is relatively small and has a low contribution value, while in the rest of the states, the number of people with apparently asymptomatic angina is predominant and has the highest contribution value. As shown in Figure 5b, the male population was predominant in most cases and had a higher contribution. As shown in Figure 5c, the “ST_Slope” value “up” state, “Oldpeak” has a positive linear correlation to the contribution value, while in the “flat” state there is a negative linear correlation. Finally, in the “down” state, the significantly higher “Oldpeak” value dominates. As shown in Figure 5d, serum cholesterol concentration was negatively linearly correlated to the contribution value when “ST_Slope” was in the “up” state, while in the “flat” and “down” states, it showed a positive linear correlation. As shown in Figure 5e, the “ST_Slope” in the “up” state, the absence of exercise angina accounted for the majority, while in the remaining two states, the presence or absence of exercise angina was significantly different. As shown in Figure 5f, the “ST_Slope” in the “up” state, the contribution value will be higher with increasing age. The remaining two states are dominated by the older age group, but the contribution shows a negative linear correlation, which means that the younger age group has a higher contribution value. As shown in Figure 5g, the “ST_Slope” state of “up“, the fasting blood glucose value showed a positive correlation to the contribution value, while in the “down” state and the “flat” state, the high fasting blood glucose value dominated and the contribution values also had significant differences. As shown in Figure 5h, regardless of the state of “ST_Slope”, the contribution of resting blood pressure value fluctuates significantly, the high resting blood pressure value is dominant in the “flat” state where the highest contribution was achieved. As shown in Figure 5i, in the last maximum heart rate achieved feature, in the “up” state, the higher maximum heart rate achieved dominance, and in the remaining two states, maximum heart rate achieved values show complex variability.
3.2. Results of the Proposed Stacking Model and Other Models
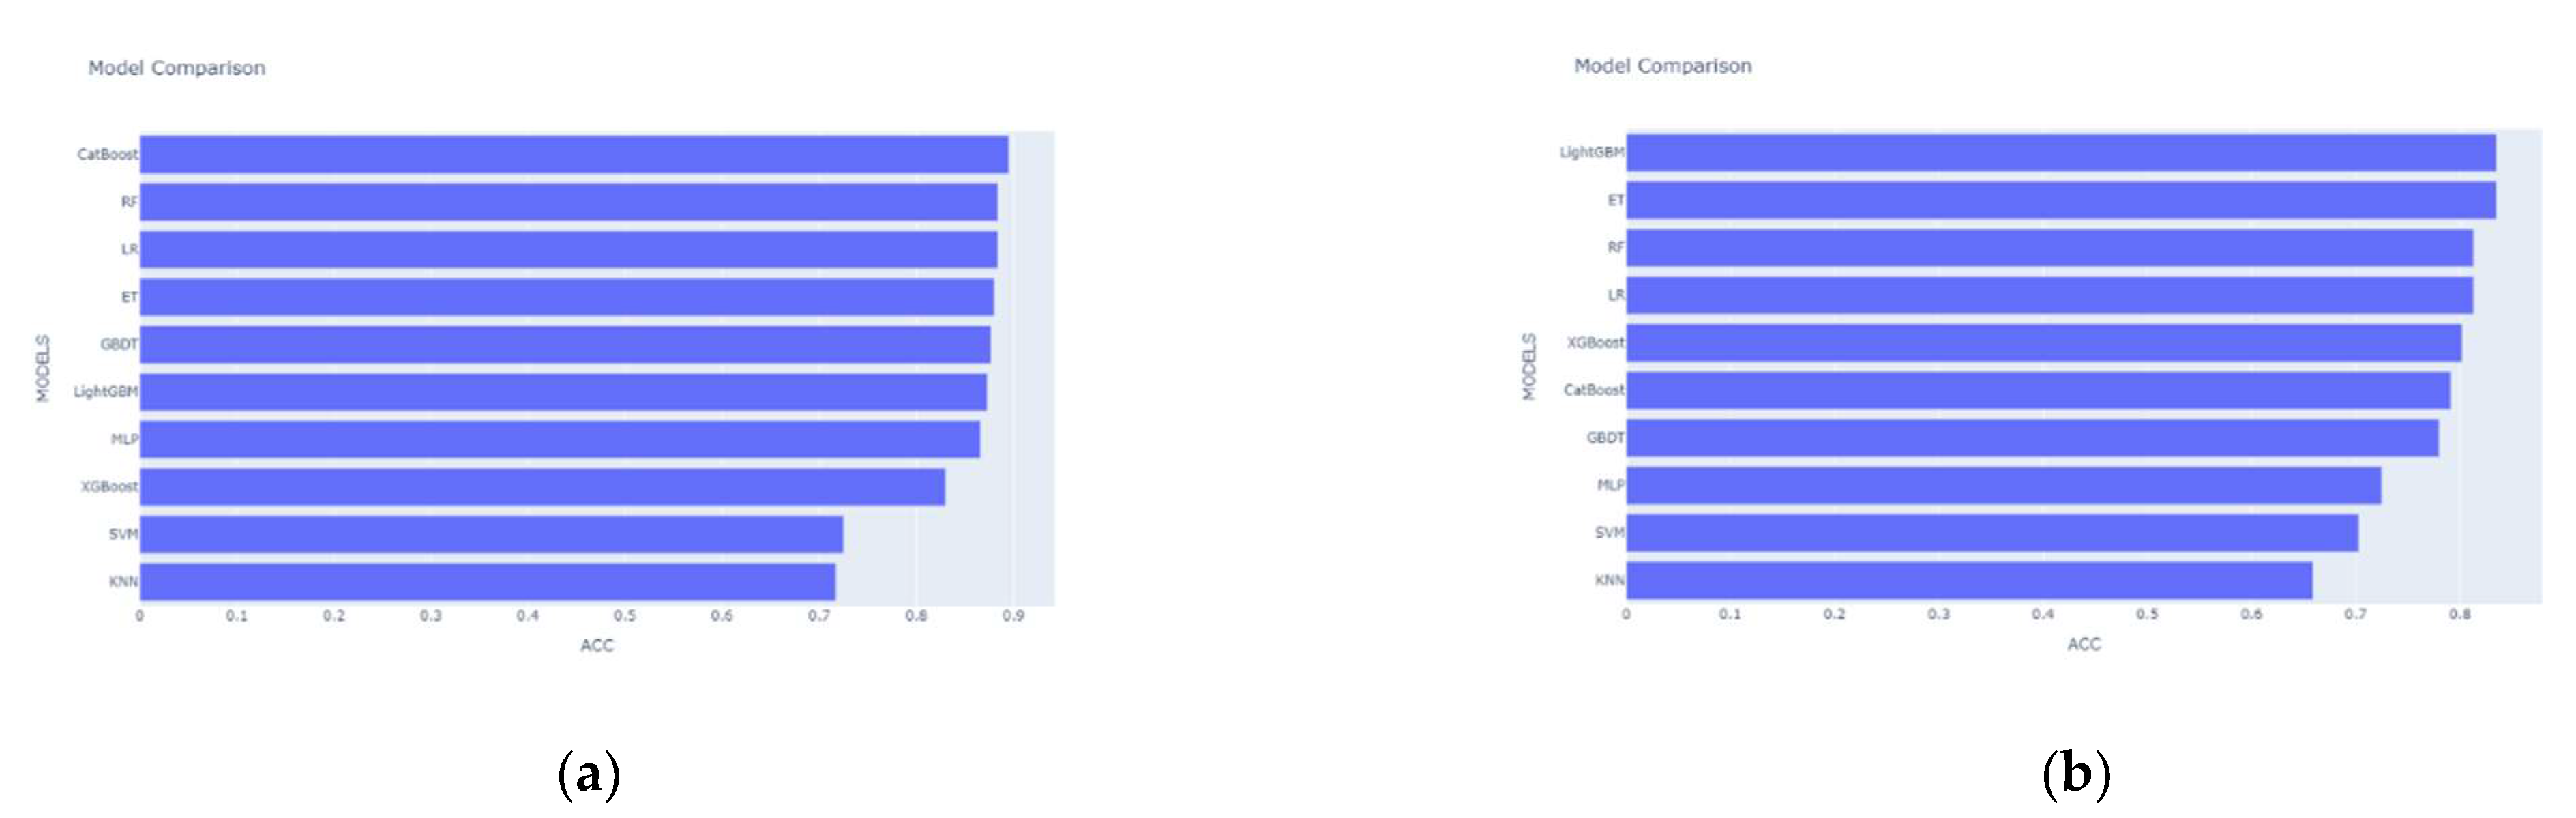
The stronger the learning ability of each base learner in stacking and the lower the correlation level, the better the model prediction will be. The selection of base learners should follow the principle of “good but different,” which means that while considering the performance of individual learners, we should also consider the dissimilarity between individual learners. We initially select a model with good prediction performance based on accuracy as the base learner. The accuracy of the 10 single candidate models in the first layer of the stacking model for the base learner selection on the Heart Dataset is shown in Figure 6a. It can be seen that the top seven are CatBoost, RF, LR, MLP, ET, GBDT, and LightGBM, with accuracy rates almost close to 90%. Next, we study the degree of correlation between the models. CatBoost is a boosting ensemble learning algorithm that can randomize the dataset to reduce overfitting and ensure that all datasets are available for learning. The LR model has low complexity, small memory resource consumption, and a fast training speed. MLP has a strong learning ability and is good at mining the nonlinear relationship between control factors and results. ET will randomly select a feature value to divide the decision tree after the division feature is selected, and has better generalization ability. GBDT and LightGBM, which are ranked next, still have good accuracy, but they are both ensemble learning algorithms based on bagging, which is less relevant. We follow the principle of “good but different” and eliminate these two algorithms. The accuracy of the remaining three algorithms was too low, which would seriously reduce the prediction effect of the meta learner, so we also eliminated them. Finally, we selected five widely representative models as candidates, including LR, RF, DT, MLP, and CatBoost. By the same method, on Heart Attack Dataset, we choose different classifiers for the stacking model based on the experimental results in Figure 6b. The difference here is that there is a big gap between the second and third accuracy rankings, and if the third-ranked but relatively less accurate RF is chosen as the base learner, this will seriously affect the predictive ability of the meta learner. So, we only choose LightGBM and ET as the base learners here, while using LR as the meta learner.
The results of the single classifier model and our proposed stacking model are shown in Table 3(the results that work best are shown in bold). On the Heart Dataset, the tree-based model has relatively better performance, with significant improvements in all four metrics, which is significantly superior to the traditional machine learning models KNN and SVM. Similarly, the MLP also has good prediction results. Our proposed stacking model outperforms all the base models in predicting CVD in aggregate. Compared to 10 single models, the stacking model improves 0.4 percentage points in accuracy metrics, and although there is a slight decrease in accuracy in precision and recall, it still improves in the F1 Score of the combined precision and recall metrics. On the Heart Attack dataset, the accuracy of the stacking model is slightly reduced, but there is a significant improvement in the accuracy, recall, and F1 value metrics. This demonstrates a clear advantage of the proposed stacking model in predicting CVD.
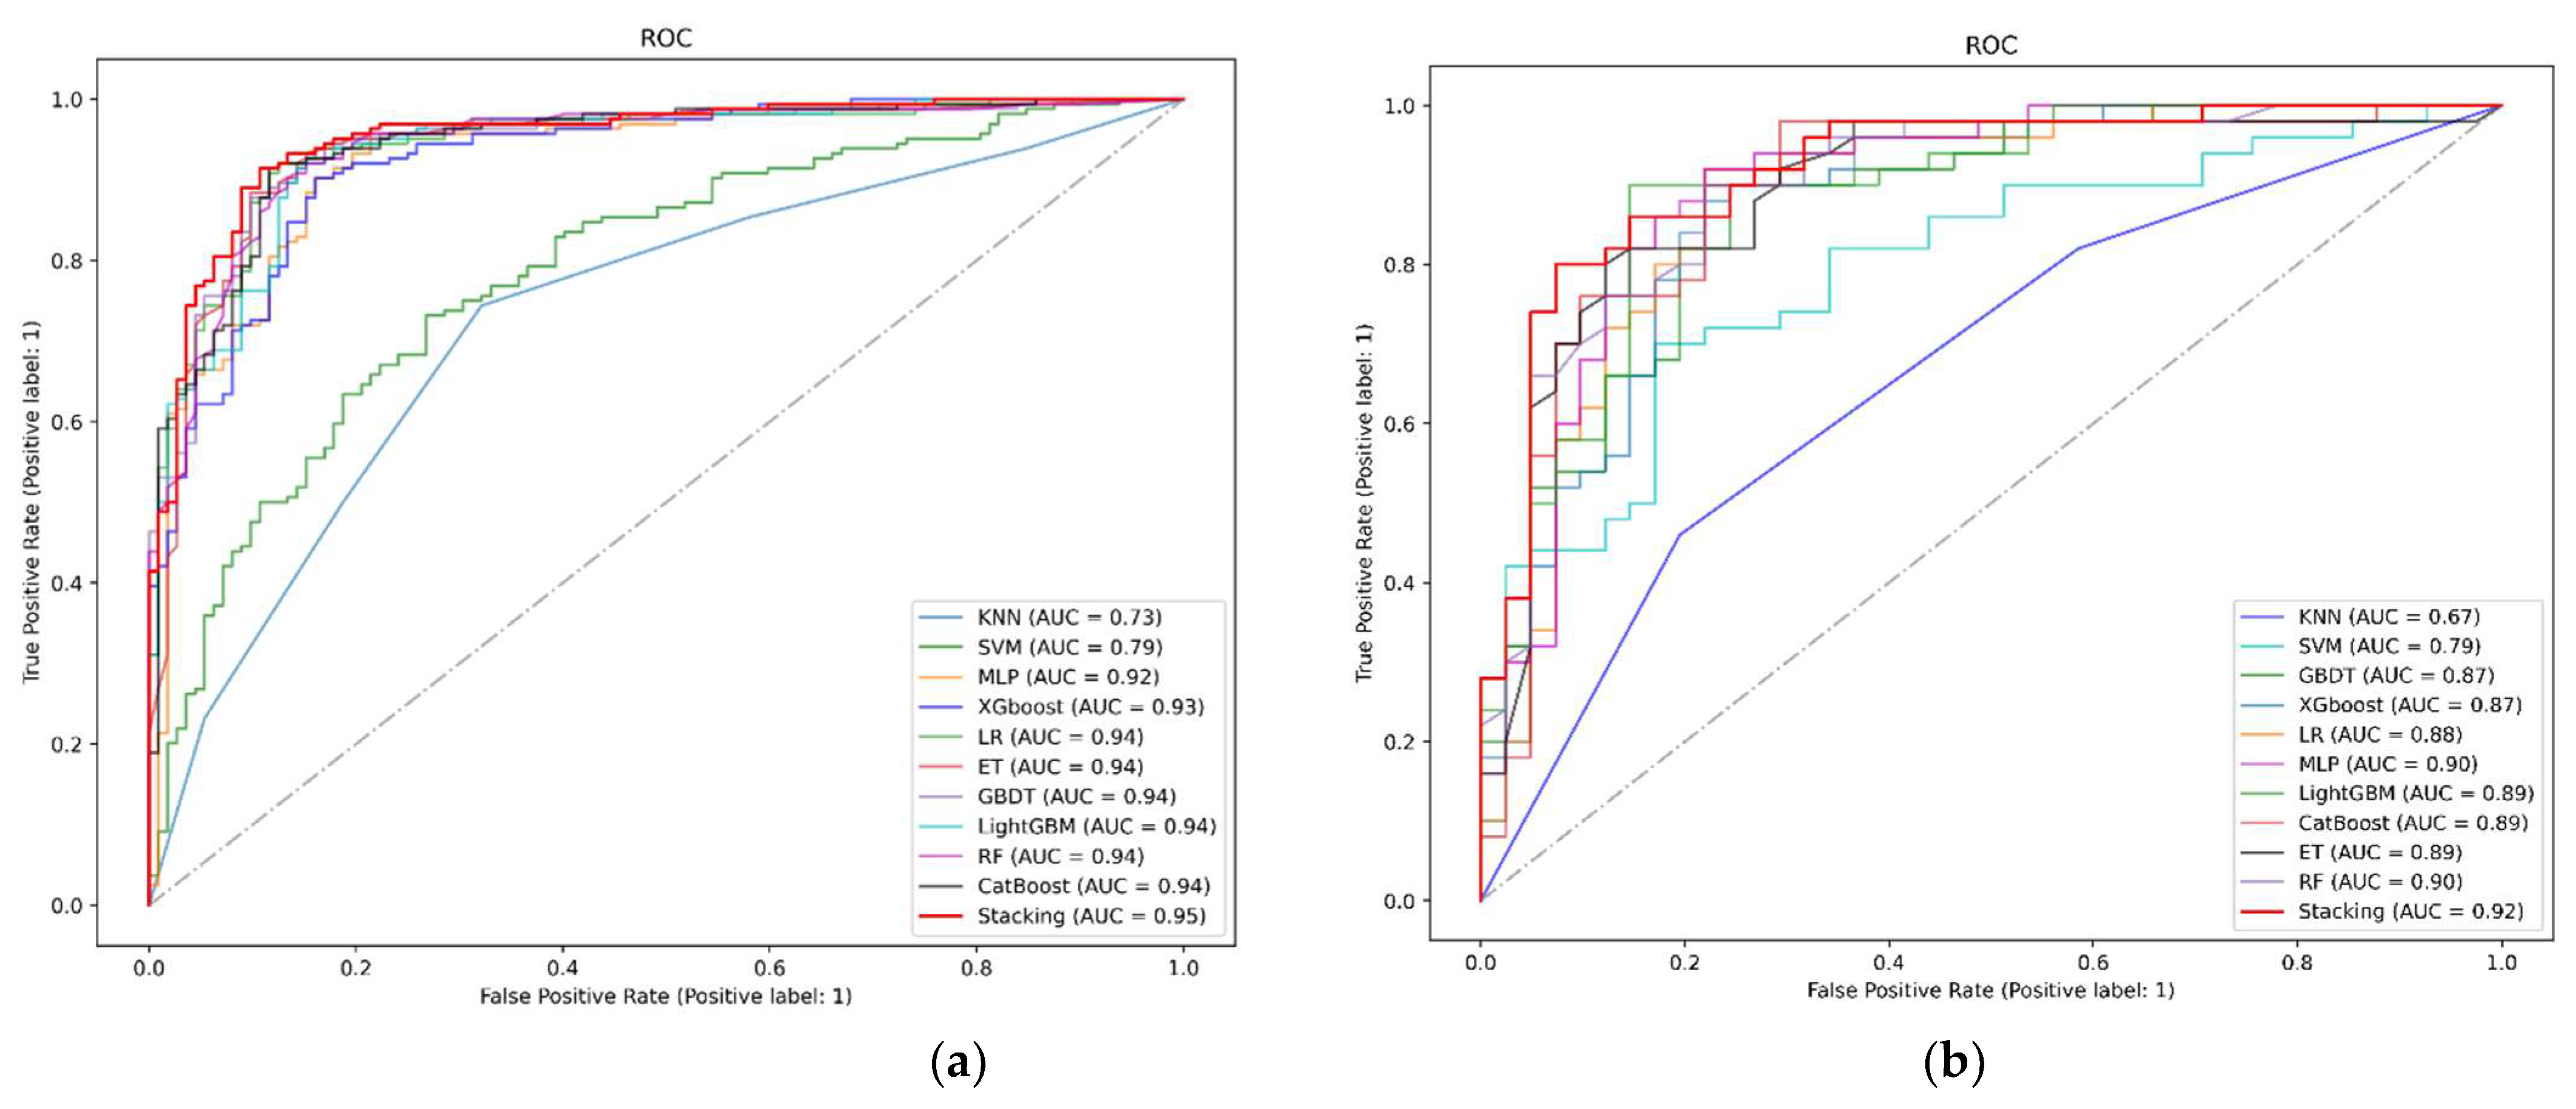
Finally, we plotted the ROC curve, as shown in Figure 7. The full name of the ROC curve is the Receiver Operating Characteristic (ROC) curve, and each point in the ROC curve has the corresponding FPR (False Positive Rate) value as the horizontal coordinate and the TPR (True Positive Rate) value as the vertical coordinate. The AUC (Area Under Curve) denotes the area under the ROC curve, which is mainly used to measure the generalization performance of the model and how well the classification works. On the Heart Dataset, the improved classifier achieved an AUC value of 0.95, which is higher than the AUC values of all the underlying classifiers, indicating that a more accurate classifier was produced. Moreover, in the Heart Attack dataset, the AUC value reached the highest value of 0.92, and the experimental results further demonstrate that the stacking model has higher accuracy in predicting death in patients with CVD.
4. Conclusions and Future Work
In this study, we propose a classifier based on stacking fusion models, and the comparison results show that our proposed classifier outperforms individual models in all evaluation metrics, which indicates that stacking models can integrate the advantages of different individual models to achieve better prediction performance. Clearly, the proposed stacking model has better predictive performance, robustness, and utility for predicting patients with CVD and can provide valuable insights into hospital management to identify high-risk patients and target them for early clinical intervention to reduce the likelihood of developing CVD. In future research, more data from multiple medical centers can be collected and used in the field of deep learning to further validate the strengths and weaknesses of our models by building artificial neural network structures or using deep learning frameworks.
Author Contributions
J.L. and H.Z. designed this work; X.D. and Y.T. performed cardiovascular disease analysis and wrote the manuscript. All authors have read and agreed to the published version of the manuscript.
Funding
This study was supported by the National Natural Science Foundation of China (No.72101137), the Major Scientific and Technological Innovation Projects of Shandong Province, China (No. 2019JZZY010132) and the Natural Science Foundation of Shandong Province (No. ZR2013DM011).
Institutional Review Board Statement
Not applicable.
Informed Consent Statement
Not applicable.
Data Availability Statement
The data presented in this study are available in the public database. Heart Dataset and Heart Attack Dataset. Retrieved from https://www.kaggle.com/fedesoriano/heart-failure-prediction (accessed on 10 January 2022) and https://www.kaggle.com/datasets/rashikrahmanpritom/heart-attack-analysis-prediction-dataset (accessed on 27 March 2022).
Conflicts of Interest
The authors declare no conflict of interest.
References
- Krittanawong, C.; Virk, H.; Bangalore, S.; Wang, Z.; Johnson, K.W.; Pinotti, R.; Zhang, H.; Kaplin, S.; Narasimhan, B.; Kitai, T.; et al. Machine Learning Prediction in Cardiovascular Diseases: A Meta-Analysis. Sci. Rep. 2020, 10, 16057. [Google Scholar] [CrossRef] [PubMed]
- Kavitha, M.; Gnaneswar, G.; Dinesh, R.; Sai, Y.R.; Suraj, R.S. Heart Disease Prediction Using Hybrid Machine Learning Model. In Proceedings of the 2021 6th International Conference on Inventive Computation Technologies, Tamilnadu, India, 20–22 January 2021. [Google Scholar]
- Jabbar, M.A.; Deekshatulu, B.L.; Chandra, P. Intelligent Heart Disease Prediction System Using Random Forest and Evolutionary Approach. J. Netw. Innov. Comput. 2016, 4, 175–184. [Google Scholar]
- Alkeshuosh, A.H.; Moghadam, M.Z.; Mansoori, I.A.; Abdar, M. Using PSO Algorithm for Producing Best Rules in Diagnosis of Heart Disease. In Proceedings of the 2017 international conference on computer and applications, Doha, United Arab Emirates, 6–7 September 2017. [Google Scholar]
- Ramalingam, V.V.; Dandapath, A.; Karthik Raja, M. Heart Disease Prediction Using Machine Learning Techniques: A Survey Heart Disease Prediction Using Machine Learning Techniques: A Survey. Artic. Int. J. Eng. Technol. 2018, 7, 684–687. [Google Scholar] [CrossRef] [Green Version]
- Katarya, R.; Meena, S.K. Machine Learning Techniques for Heart Disease Prediction: A Comparative Study and Analysis. Health Technol. 2021, 11, 87–97. [Google Scholar] [CrossRef]
- Diwakar, M.; Tripathi, A.; Joshi, K.; Singh, P.; Memoria, M.; Kumar, N. Latest Trends on Heart Disease Prediction Using Machine Learning and Image Fusion. Mater. Today Proc. 2021, 37, 3213–3218. [Google Scholar] [CrossRef]
- Bharti, R.; Khamparia, A.; Shabaz, M.; Dhiman, G.; Pande, S.; Singh, P. Prediction of Heart Disease Using a Combination of Machine Learning and Deep Learning. Comput. Intell. Neurosc. 2021, 2021, 1687–5237. [Google Scholar] [CrossRef]
- Krzowski, B.; Rokicki, J.; Główczyńska, R.; Fajkis-Zajączkowska, N.; Barczewska, K.; Mąsior, M.; Grabowski, M.; Balsam, P. The Use of Machine Learning Algorithms in the Evaluation of the Effectiveness of Resynchronization Therapy. J. Cardiovasc. Dev. Dis. 2022, 9, 17. [Google Scholar] [CrossRef]
- Yan, T.; Zhu, S.; Xie, C.; Zhu, M.; Weng, F.; Wang, C.; Guo, C. Coronary Artery Disease and Atrial Fibrillation: A Bidirectional Mendelian Randomization Study. J. Cardiovasc. Dev. Dis. 2022, 9, 69. [Google Scholar] [CrossRef]
- Sun, W.; Zhang, P.; Wang, Z.; Li, D. Prediction of Cardiovascular Diseases Based on Machine Learning. ASP Trans. Internet Things 2021, 1, 30–35. [Google Scholar] [CrossRef]
- Association, D.; Sun, L.; Zhou, Y.; Zhang, M.; Li, C.; Qu, M.; Cai, Q.; Meng, J.; Fan, H.; Zhao, Y.; et al. Association of Major Chronic Noncommunicable Diseases and Life Expectancy in China, 2019. Healthcare 2022, 10, 296. [Google Scholar] [CrossRef]
- Makino, K.; Lee, S.; Bae, S.; Chiba, I.; Harada, K.; Katayama, O.; Shinkai, Y.; Shimada, H. Absolute Cardiovascular Disease Risk Assessed in Old Age Predicts Disability and Mortality: A Retrospective Cohort Study of Community—Dwelling Older Adults. Am. Hear. Assoc. 2021, 10, 22004. [Google Scholar] [CrossRef] [PubMed]
- Elyamani, R.; Soulaymani, A.; Hami, H. Epidemiology of Cardiovascular Diseases in Morocco: A Systematic Review. Rev. Diabet. Stud. 2021, 17, 57–67. [Google Scholar] [CrossRef] [PubMed]
- Pharr, J.R.; Batra, K.; Santos, A.C. Non-Communicable Disease (NCDs). Healthcare 2021, 9, 696. [Google Scholar] [CrossRef] [PubMed]
- Lbrini, S.; Fadil, A.; Aamir, Z.; Khomali, M.; Jarar Oulidi, H.; Rhinane, H. Big Health Data: Cardiovascular Disease Prevention Using Big Data and Machine Learning. Stud. Comput. Intell. 2021, 971, 311–327. [Google Scholar] [CrossRef]
- Toure, A.I.; Souley, K.; Boncano, A.; Dodo, B.; Haggar, M.; Mahmat, S.; Zakaria, A.; SDjonyabo Akakpo, E.; Gonda, I.; Moustapha, O. Acute Coronary Syndromes in Niger: (West Africa): Epidemiological, Clinical, Para clinical and Therapeutic Aspects. Cardiol. Vasc. Res. 2021, 5, 1–7. [Google Scholar]
- Bihrmann, K.; Gislason, G.; Larsen, M.L.; Ersbøll, A.K. Joint Mapping of Cardiovascular Diseases: Comparing the Geographic Patterns in Incident Acute Myocardial Infarction, Stroke and Atrial Fibrillation, a Danish Register-Based Cohort Study 2014–15. Int. J. Health Geogr. 2021, 20, 41. [Google Scholar] [CrossRef]
- Mir, R.; Elfaki, I.; Khullar, N.; Ahmad Waza, A.; Jha, C.; Muzaffar Mir, M.; Nisa, S.; Mohammad, B.; Ahmad Mir, T.; Maqbool, M.; et al. Role of Selected MiRNAs as Diagnostic and Prognostic Biomarkers in Cardiovascular Diseases, Including Coronary Artery Disease, Myocardial Infarction And Atherosclerosis. J. Cardiovasc. Dev. Dis. 2021, 8, 22. [Google Scholar] [CrossRef]
- Wang, T.J.; Larson, M.G.; Levy, D.; Vasan, R.S.; Leip, E.P.; Wolf, P.A.; D’Agostino, R.B.; Murabito, J.M.; Kannel, W.B.; Benjamin, E.J. Temporal Relations of Atrial Fibrillation and Congestive Heart Failure and Their Joint Influence on Mortality: The Framingham Heart Study. Circulation 2003, 107, 2920–2925. [Google Scholar] [CrossRef] [Green Version]
- Piepoli, M.F.; Hoes, A.W.; Agewall, S.; Albus, C.; Brotons, C.; Catapano, A.L.; Cooney, M.-T.; Corrà, U.; Cosyns, B.; Deaton, C.; et al. 2016 European Guidelines on cardiovascular disease prevention in clinical practice: The Sixth Joint Task Force of the European Society of Cardiology and Other Societies on Cardiovascular Disease Prevention in Clinical Practice (constituted by representatives of 10 societies and by invited experts)Developed with the special contribution of the European Association for Cardiovascular Prevention & Rehabilitation (EACPR). Eur. Heart J. 2017, 37, 2315–2381. [Google Scholar]
- Desai, R.J.; Wang, S.V.; Vaduganathan, M.; Evers, T.; Schneeweiss, S. Comparison of Machine Learning Methods With Traditional Models for Use of Administrative Claims With Electronic Medical Records to Predict Heart Failure Outcomes. JAMA Netw. Open 2020, 3, e1918962. [Google Scholar] [CrossRef]
- Alaa, A.M.; Bolton, T.; Angelantonio, E.D.; Rudd, J.H.F.; van der Schaar, M. Cardiovascular Disease Risk Prediction Using Automated Machine Learning: A Prospective Study of 423,604 UK Biobank Participants. PLoS ONE 2019, 14, e0213653. [Google Scholar] [CrossRef] [PubMed] [Green Version]
- Hussain, W.; Aldahiri, A.; Alrashed, B. Trends in Using IoT with Machine Learning in Health Prediction System. Forecasting 2021, 3, 181–207. [Google Scholar] [CrossRef]
- Kishor, A.; Chakraborty, C. Artificial Intelligence and Internet of Things Based Healthcare 4.0 Monitoring System. Wirel. Pers. Commun. 2021, 2, 1–17. [Google Scholar] [CrossRef]
- Ristevski, B.; Snezana, S. Healthcare and Medical Big Data Analytics; Elsevier: Amsterdam, The Netherlands, 2021. [Google Scholar] [CrossRef]
- Lee, S.S.; Ae, K.K.; Kim, D.; Lim, Y.; Yang, P.; Yi, J.; Kim, M.; Kwon, K.; Pyun, W.B.; Joung, B.; et al. Clinical Implication of an Impaired Fasting Glucose and Prehypertension Related to New Onset Atrial Fibrillation in a Healthy Asian Population without Underlying Disease. Eur. Heart J. 2017, 38, 2599–2607. [Google Scholar] [CrossRef] [PubMed]
- Alsunaidi, S.J.; Almuhaideb, A.M.; Ibrahim, N.M.; Shaikh, F.S.; Alqudaihi, K.S.; Alhaidari, F.A.; Khan, I.U.; Aslam, N.; Alshahrani, M.S. Applications of Big Data Analytics to Control COVID-19 Pandemic. Sensors 2021, 21, 2282. [Google Scholar] [CrossRef] [PubMed]
- Ali, M.M.; Paul, B.K.; Ahmed, K.; Bui, F.M.; Quinn, J.M.; Moni, M.A. Heart Disease Prediction Using Supervised Machine Learning Algorithms: Performance Analysis and Comparison. Comput. Biol. Med. 2021, 136, 104672. [Google Scholar] [CrossRef]
- Dogan, O.; Tiwari, S.; Jabbar, M.A.; Guggari, S. A Systematic Review on AI/ML Approaches against COVID-19 Outbreak. Complex. Intell. Syst. 2021, 7, 2655–2678. [Google Scholar] [CrossRef]
- Weng, S.F.; Reps, J.; Kai, J.; Garibaldi, J.M.; Qureshi, N. Can Machine-Learning Improve Cardiovascular Risk Prediction Using Routine Clinical Data? PLoS ONE 2017, 12, e0174944. [Google Scholar] [CrossRef] [Green Version]
- Dimopoulos, A.C.; Nikolaidou, M.; Caballero, F.F.; Engchuan, W.; Sanchez-Niubo, A.; Arndt, H.; Ayuso-Mateos, J.L.; Haro, J.M.; Chatterji, S.; Georgousopoulou, E.N.; et al. Machine Learning Methodologies versus Cardiovascular Risk Scores, in Predicting Disease Risk. BMC Med. Res. Methodol. 2018, 18, 179. [Google Scholar] [CrossRef] [PubMed]
- Mohan, S.; Thirumalai, C.; Srivastava, G. Effective Heart Disease Prediction Using Hybrid Machine Learning Techniques. IEEE Access 2019, 7, 81542–81554. [Google Scholar] [CrossRef]
- Akash, I.; Tabassum, S.; Ullah, S.; Nahar, S.; Ittahad, M.; Zaman, U.; Ullah, M.S.; Rahaman, A.; Islam, A.K.M.M. Towards IoT and ML Driven Cardiac Status Prediction System. In Proceedings of the 2019 1st International Conference on Advances in Science, Engineering and Robotics Technology (ICASERT), Dhaka, Bangladesh, 3–5 May 2019. [Google Scholar] [CrossRef]
- Yang, L.; Wu, H.; Jin, X.; Zheng, P.; Hu, S.; Xu, X.; Yu, W.; Yan, J. Study of Cardiovascular Disease Prediction Model Based on Random Forest in Eastern China. Sci. Rep. 2020, 10, 5245. [Google Scholar] [CrossRef] [Green Version]
- Hu, Z.; Qiu, H.; Su, Z.; Shen, M.; Chen, Z. A Stacking Ensemble Model to Predict Daily Number of Hospital Admissions for Cardiovascular Diseases. IEEE Access 2020, 8, 138719–138729. [Google Scholar] [CrossRef]
- Zheng, H.; Sherazi, S.W.A.; Lee, J.Y. A Stacking Ensemble Prediction Model for the Occurrences of Major Adverse Cardiovascular Events in Patients with Acute Coronary Syndrome on Imbalanced Data. IEEE Access 2021, 9, 113692–113704. [Google Scholar] [CrossRef]
- Ahamed, J.; Mir, R.N.; Chishti, M.A. Industry 4.0 Oriented Predictive Analytics of Cardiovascular Diseases Using Machine Learning, Hyperparameter Tuning and Ensemble Techniques. Ind. Rob. 2022. Ahead-of-print. [Google Scholar] [CrossRef]
- Ting, K.; Witten, I. Stacking Bagged and Dagged Models. In Proceedings of the Fourteenth International Conference on Machine Learning, 8–12 July 1997; Morgan Kaufmann Publishers Inc.: San Francisco, CA, USA, 1997. [Google Scholar]
- Lundberg, S.M.; Erion, G.G.; Lee, S.-I. Consistent Individualized Feature Attribution for Tree Ensembles. arXiv 2018, arXiv:1802.03888. [Google Scholar]
- Dash, M.; Liu, H. Feature Selection for Classification. Intell. Data Anal. 1997, 1, 131–156. [Google Scholar] [CrossRef]
- Parthiban, R.; Usharani, S.; Saravanan, D.; Jayakumar, D.; Palani, U.; Stalindavid, D.; Raghuraman, D. Prognosis of Chronic Kidney Disease (CKD) Using Hybrid Filter Wrapper Embedded Feature Selection Method. Eur. J. Mol. Clin. Med. 2020, 7, 2511–2530. [Google Scholar]
- Chen, L.; Xia, M. A Context-Aware Recommendation Approach Based on Feature Selection. Appl. Intell. 2021, 51, 865–875. [Google Scholar] [CrossRef]
- Rao, H.; Shi, X.; Rodrigue, A.K.; Juanjuan, F.; Yingchun, X.; Mohamed, E.; Xiaohui, Y.; Lichuan, G. Feature Selection Based on Artificial Bee Colony and Gradient Boosting Decision Tree. Appl. Soft Comput. 2019, 74, 634–642. [Google Scholar] [CrossRef]
- Zhang, J.; Liang, Q.; Jiang, R.; Li, X. A Feature Analysis Based Identifying Scheme Using GBDT for DDoS with Multiple Attack Vectors. Appl. Sci. 2019, 9, 4633. [Google Scholar] [CrossRef] [Green Version]
- Akiba, T.; Sano, S.; Yanase, T.; Ohta, T.; Koyama, M. Optuna: A Next-Generation Hyperparameter Optimization Framework. In Proceedings of the 25th ACM SIGKDD International Conference on Knowledge Discovery & Data Mining, Anchorage, AK, USA, 4–8 August 2019; Association for Computing Machinery: New York, NY, USA, 2019; pp. 2623–2631. [Google Scholar] [CrossRef]
Figure 1.
Prediction process flow chart.

Figure 2.
The stacking ensemble learning model.

Figure 3.
Global feature contributions.

Figure 4.
Comparison of individual feature contributions.

Figure 5.
(a) “ST_Slope”and“ChestPainType” joint feature contribution. (b) “ST_Slope”and“Sex” joint feature contribution. (c) “ST_Slope”and“Oldpeak” joint feature contribution. (d) “ST_Slope”and“Cholesterol” joint feature contribution. (e) “ST_Slope”and“ExerciseAngina” joint feature contribution. (f) “ST_Slope”and“Age” joint feature contribution. (g) “ST_Slope”and“FastingECG” joint feature contribution. (h) “ST_Slope”and“RestingBP” joint feature contribution. (i) “ST_Slope”and“MaxHR” joint feature contribution.

Figure 6.
(a) Accuracy of SVM, KNN, LR, RF, ET, GBDT, XGBoost, LightGBM, CatBoost and MLP on Heart Dataset. (b) Accuracy of SVM, KNN, LR, RF, ET, GBDT, XGBoost, LightGBM, CatBoost and MLP on Heart Attack Dataset.
Figure 6.
(a) Accuracy of SVM, KNN, LR, RF, ET, GBDT, XGBoost, LightGBM, CatBoost and MLP on Heart Dataset. (b) Accuracy of SVM, KNN, LR, RF, ET, GBDT, XGBoost, LightGBM, CatBoost and MLP on Heart Attack Dataset.

Figure 7.
(a) ROC curve on Heart Dataset. (b) ROC curve on Heart Attack Dataset.


Table 1.
Heart Dataset.
| ID | Feature | Detailed Information |
|---|---|---|
| 1 | Age | Age |
| 2 | Sex | Sex (Male: 0 or female: 1) |
| 3 | ChestPainType | Four types of chest pain (TA: typical angina, ATA: atypical angina, NAP: non-angina, ASY: asymptomatic) |
| 4 | RestingBP | Resting blood pressure value (Unit mm hg) |
| 5 | Cholesterol | Serum cholesterol concentration (Unit mm/dL) |
| 6 | FastingBS | Fasting blood glucose value (1: blood glucose > 120 mg/dL, 0: other) |
| 7 | RestingECG | Resting electrocardiogram (Normal: normal, ST: with ST-T wave abnormalities (T-wave inversion or ST elevation or depression > 0.05 mv), LVH: possible or definite left ventricular hypertrophy according to criteria) |
| 8 | MaxHR | The maximum heart rate achieved. (Values between 60 and 202) |
| 9 | ExerciseAngina | Whether you have exercise angina (No: 0, Yes: 1) |
| 10 | Oldpeak | Exercise-induced ST-segment drop (ST value judgment) |
| 11 | ST_Slope | Slope of the ST section at the peak of the movement (up, flat, down) |
Table 2.
Heart Attack Dataset.
| ID | Feature | Detailed Information |
|---|---|---|
| 1 | Age | Age |
| 2 | Sex | Sex of the patient (Male: 0, female: 1) |
| 3 | Exang | Exercise induced angina (1 = yes, 0 = no) |
| 4 | Ca | Number of major vessels (0–3) |
| 5 | Cp | Chest Pain type chest pain typeb (1: typical angina, 2: atypical angina, 3: non-anginal pain, 4: asymptomatic) |
| 6 | Trtbps | Resting blood pressure (Unit mm hg) |
| 7 | Chol | Cholestoral in mg/dL fetched via BMI sensor |
| 8 | Fbs | (Fasting blood sugar > 120 mg/dL) (1 = true, 0 = false) |
| 9 | Rest_ecg | Resting electrocardiographic results (0: normal, 1: having ST-T wave abnormality (T wave inversions and/or ST elevation or depression of >0.05 mV), 2: showing probable or definite left ventricular hypertrophy by Estes’ criteria) |
| 10 | Thalach | Maximum heart rate achieved |
Table 3.
Classification results of eleven classifiers.
| Dataset | Model | Accuracy (%) | Precision (%) | Recall (%) | F1 Score (%) |
|---|---|---|---|---|---|
| Heart Dataset | KNN | 71.74 | 77.22 | 74.39 | 75.78 |
| SVM | 72.46 | 78.85 | 73.17 | 75.94 | |
| LR | 88.41 | 92.31 | 87.81 | 90 | |
| RF | 87.68 | 90.62 | 88.41 | 89.51 | |
| ET | 88.04 | 92.81 | 86.58 | 89.59 | |
| GBDT | 87.68 | 92.76 | 85.98 | 89.24 | |
| XGBoost | 82.97 | 89.8 | 80.49 | 84.89 | |
| LightGBM | 87.32 | 90.56 | 87.81 | 89.16 | |
| CatBoost | 89.49 | 91.41 | 90.85 | 91.13 | |
| MLP | 87.32 | 90.06 | 88.41 | 89.23 | |
| Stacking | 89.86 | 92.5 | 90.24 | 91.36 | |
| Heart Attack Dataset | KNN | 61.54 | 74.19 | 46 | 56.79 |
| SVM | 70.33 | 67.16 | 72 | 76.92 | |
| LR | 81.32 | 82.35 | 84 | 83.17 | |
| RF | 80.22 | 82 | 82 | 83.17 | |
| ET | 80.22 | 82 | 82 | 82 | |
| GBDT | 78.02 | 82.61 | 76 | 79.17 | |
| XGBoost | 80.22 | 83.33 | 80 | 81.63 | |
| LightGBM | 83.52 | 87.23 | 82 | 84.54 | |
| CatBoost | 79.12 | 81.63 | 80 | 80.81 | |
| MLP | 71.43 | 87.13 | 56 | 68.2 | |
| Stacking | 84.62 | 86 | 86 | 86 |
Publisher’s Note: MDPI stays neutral with regard to jurisdictional claims in published maps and institutional affiliations. |
© 2022 by the authors. Licensee MDPI, Basel, Switzerland. This article is an open access article distributed under the terms and conditions of the Creative Commons Attribution (CC BY) license (https://creativecommons.org/licenses/by/4.0/).
Share and Cite
MDPI and ACS Style
Liu, J.; Dong, X.; Zhao, H.; Tian, Y. Predictive Classifier for Cardiovascular Disease Based on Stacking Model Fusion. Processes 2022, 10, 749. https://doi.org/10.3390/pr10040749
AMA Style
Liu J, Dong X, Zhao H, Tian Y. Predictive Classifier for Cardiovascular Disease Based on Stacking Model Fusion. Processes. 2022; 10(4):749. https://doi.org/10.3390/pr10040749
Chicago/Turabian StyleLiu, Jimin, Xueyu Dong, Huiqi Zhao, and Yinhua Tian. 2022. "Predictive Classifier for Cardiovascular Disease Based on Stacking Model Fusion" Processes 10, no. 4: 749. https://doi.org/10.3390/pr10040749
Note that from the first issue of 2016, this journal uses article numbers instead of page numbers. See further details here.