Article

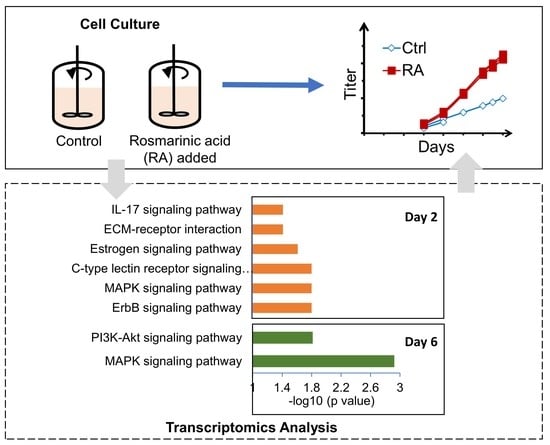
Insights into the Impact of Rosmarinic Acid on CHO Cell Culture Improvement through Transcriptomics Analysis

Biologics Development, Global Product Development and Supply, Bristol Myers Squibb, Devens, MA 01434, USA
*
Author to whom correspondence should be addressed.
These authors contributed equally to this work.
Processes 2022, 10(3), 533; https://doi.org/10.3390/pr10030533
Submission received: 30 January 2022 / Revised: 24 February 2022 / Accepted: 4 March 2022 / Published: 8 March 2022
(This article belongs to the Section Biological Processes and Systems)

Abstract

:
The use of antioxidants in Chinese hamster ovary (CHO) cell cultures to improve monoclonal antibody production has been a topic of great interest. Nevertheless, the antioxidants do not have consistent benefits of production improvement, which might be cell line specific and/or process specific. In this work, we investigated how treatment with the antioxidant rosmarinic acid (RA) improved cell growth and titer in CHO cell cultures using transcriptomics. In particular, transcriptomics analysis indicated that RA treatment modified gene expression and strongly affected the MAPK and PI3K/Akt signaling pathways, which regulate cell survival and cell death. Moreover, it was observed that these signaling pathways, which had been identified to be up-regulated on day 2 and day 6 by RA, were also up-regulated over time (from initial growth phase day 2 to slow growth or protein production phase day 6) in both conditions. In summary, this transcriptomics analysis provides insights into the role of the antioxidant RA in industrial cell culture processes. The current study also represents an example in the industry of how omics can be applied to gain an in-depth understanding of CHO cell biology and to identify critical pathways that can contribute to cell culture process improvement and cell line engineering.

Graphical Abstract

1. Introduction

The global annual sales of monoclonal antibodies (mAbs) were above USD 115 billion in 2018 and are predicted to rise above USD 300 billion in 2025 [1]. Due to the unmet need for mAbs and vaccines for treatment, the global COVID-19 pandemic may push biologics sales to even higher values beyond 2021 [2,3]. The majority of mAbs are produced using Chinese hamster ovary (CHO) cell culture. To reduce manufacturing costs and, in turn, allow wider patient access, upstream titer improvement is still the primary focus of cell culture process development. The optimization of chemically defined media is essential for cell culture titer improvement and control of mAb quality attributes [4,5]. In addition to nutrients that are commonly optimized in chemically defined media, small molecule medium additives have shown great promise for titer improvement. Antioxidants represent a particularly interesting class of additives to mitigate significant detrimental impacts that oxidative stress and reactive oxygen species (ROS) can have on CHO cell performance [6,7]. However, the application of small molecule additives as new raw materials should be thoroughly evaluated to ensure raw material quality control, acceptable costs, and sufficient removal by downstream purification without affecting final product quality attributes. We have recently reported that rosmarinic acid (RA) shows particular promise, having doubled mAb titer during the manufacture of a clinical mAb with acceptable cost and comparable mAb quality attributes to the original manufacturing process without RA [8]. Nevertheless, a systematic study on the detailed mechanism by which RA improves titer has not been reported in the literature.
The advancement of omics has dramatically increased our ability to comprehensively interrogate cell physiology of CHO cell lines under various culture conditions [9,10,11,12,13,14,15]. Recently, Lakshmanan et al. (2019) employed transcriptomic and proteomic profiling to systematically link phenotypic differences, including cell growth and glycosylation, with genotypes across different CHO hosts [16]. Ali et al. (2019 and 2020) conducted omics studies to explore the impact of cysteine feed level on CHO cell metabolism [17,18]. Additionally, omics approaches have been applied to support scale-up activities. Gao et al. (2016) identified the cause for productivity difference between 20 L bench-top scale and 5000 L production scale by combined metabolomic and proteomic analysis [19]. Similar work reported by Vodopivec et al. (2019) compared intracellular metabolomics of different growth phases among three bioreactors scales (10 L, 100 L, and 1000 L) to observe the scale-up effect [20]. As well as the studies in fed-batch cultures, Bertrand et al. (2019) applied transcriptomics and proteomics to investigate the influence of long-term perfusion cultivation on the physiological state in an industrial CHO cell line [21]. Overall, omics approaches have contributed to deciphering the complicated CHO cell metabolism better and have aided in the identification of targets for rational genetic engineering and process optimization [22].
In the present study, our objective was to apply omics technologies to explore how RA addition led to cell culture improvement in an industrial CHO cell line. To achieve this, we analyzed transcriptomics data with a particular focus on metabolic pathway analysis using differentially expressed genes in response to RA addition. The findings from this work will improve our knowledge of metabolic pathways that are core to CHO cell culture and provide insights into ways to improve monoclonal antibody production through additives treatment.

2. Materials and Methods

2.1. Cell line, Media, and Upstream Cell Culture Processes

A CHO DG44 cell line was used for the expression of a proprietary IgG4 mAb using a vector with a dihydrofolate reductase (DHFR)-selectable marker, which was previously reported [8]. For the control condition, proprietary chemically defined seed, basal, and feed media were used. For the RA condition, 36 mg/L RA was added into the control basal media only, while the seed media and feed media were the same as those used in the control condition. RA (purity ≥ 95.5%) was purchased from Sigma-Aldrich (St. Louis, MO, USA).
CHO seed culture was started from the thaw of a working cell bank vial. All seed cultures were counted and passaged every three days. The same seed culture after 7 passages was used to inoculate all six 7-L bioreactors (Sartorius, Germany) with a target viable cell density (VCD) of 0.6 × 10⁶ cells/mL and an initial working volume of 3.5 L. Three 7-L bioreactors were preloaded with the control basal media, while the other three 7-L bioreactors were preloaded with the basal media containing 36 mg/L RA. All 7-L bioreactors were run under the same operation conditions as described previously [8]. In brief, the fed-batch process was initially operated at 37 °C and shifted to a lower temperature at 35 °C when VCD reached ≥10 × 106 cells/mL. The bioreactor pH was set at pH 7.1 and controlled by CO2 gas or 1 M Na2CO3 base to adjust pH as needed. The DO was maintained at 50% of air saturation by sparging of oxygen. The bioreactors were terminated if cell viability was lower than 50%.

2.2. Upstream Cell Culture Titer and Other In-Process Parameter Assays

The product concentration, or titer (g/L), was measured using Protein A UPLC. The protein titer on day 14 in 7-L control bioreactor was set as 100% to normalize titer within this study. Other in-process cell culture assays were performed as follows [23]. VCD and cell viability were measured off-line by Cedex automatic cell counter (Innovatis AG, Malvern, PA, USA) using trypan blue exclusion. Off-line pH, pCO2, pO2, glucose, glutamine, glutamate, lactate, and ammonia were measured using a BioProfile 400 analyzer (Nova Biomedical, Waltham, MA, USA). The overall cell specific productivity was calculated as the mAb concentration measured at the end of culture divided by the integrated viable cell density.

2.3. RNA Isolation and Microarray Analysis

To discover the underlying molecular pathways improving culture performance in RA treated CHO cells, the levels of gene expression were determined. Three biological samples were taken at predefined culture stages during the process, i.e., day 2, which represents an initial growth phase where cell growth is highest, and day 6, which represents low growth or production phase where cell growth has slowed or stopped and protein production is elevated. Ten million cells were taken for each sample. RNA was isolated using the RNeasy® Mini kit (Qiagen, Valencia, CA, USA) according to the manufacturer’s instructions. The transcriptional profiling was performed using custom-made Affymetrix® CHO microarray chips (Affymetrix, Santa Clara, CA, USA) following the manufacturer’s recommendations. The detailed method has been described in our previous studies [24,25].

2.4. Metabolic Pathway Analysis

A total of 29,700 transcripts were measured. Of these, 18,186 were protein-coding transcripts and the remaining 11,514 were non-coding transcripts. In this work, this protein-coding set was annotated by CHO gene symbols and used for the subsequent differentially expressed genes (DEGs) identification and pathway analysis. For the statistical analysis of the gene expression, ANOVA (Analysis of variance) method was used to calculate the p-value between conditions. The resulting p-values were adjusted for multiple testing using the Benjamini–Hochberg method [26]. A gene was considered to be differentially expressed across conditions if the calculated p-value was less than 0.05 and their fold change (i.e., the relative change in gene expression compared to control) was larger than 1.5. It is important to note that the threshold is user-defined. The fold-changes used in previous studies varied from 1.2 to 1.5 or higher [27,28,29,30,31]. A web server KOBAS was used to perform the pathway enrichment analysis using a set of identified DEGs [32]. The resulting p-values in enrichment analysis were also adjusted for multiple testing using the Benjamini–Hochberg method [26]. The output of the analysis is a list of significantly enriched pathways according to a hypergeometric test. The Kyoto Encyclopedia of Genes and Genomes (KEGG) pathway database of Cricetulus griseus (Chinese hamster) was employed during the analysis. In this study, the pathways with adjusted p-value < 0.05 were considered as significantly enriched. MATLAB (MathWorks, Natick, MA, USA) was used for the ANOVA analysis. Principal component analysis (PCA) of all genes was performed by SIMCA (Sartorius Stedim Data Analytics AB, Umeå, Sweden). The omics data used in this study can be available by contacting the authors upon reasonable request.

3. Results

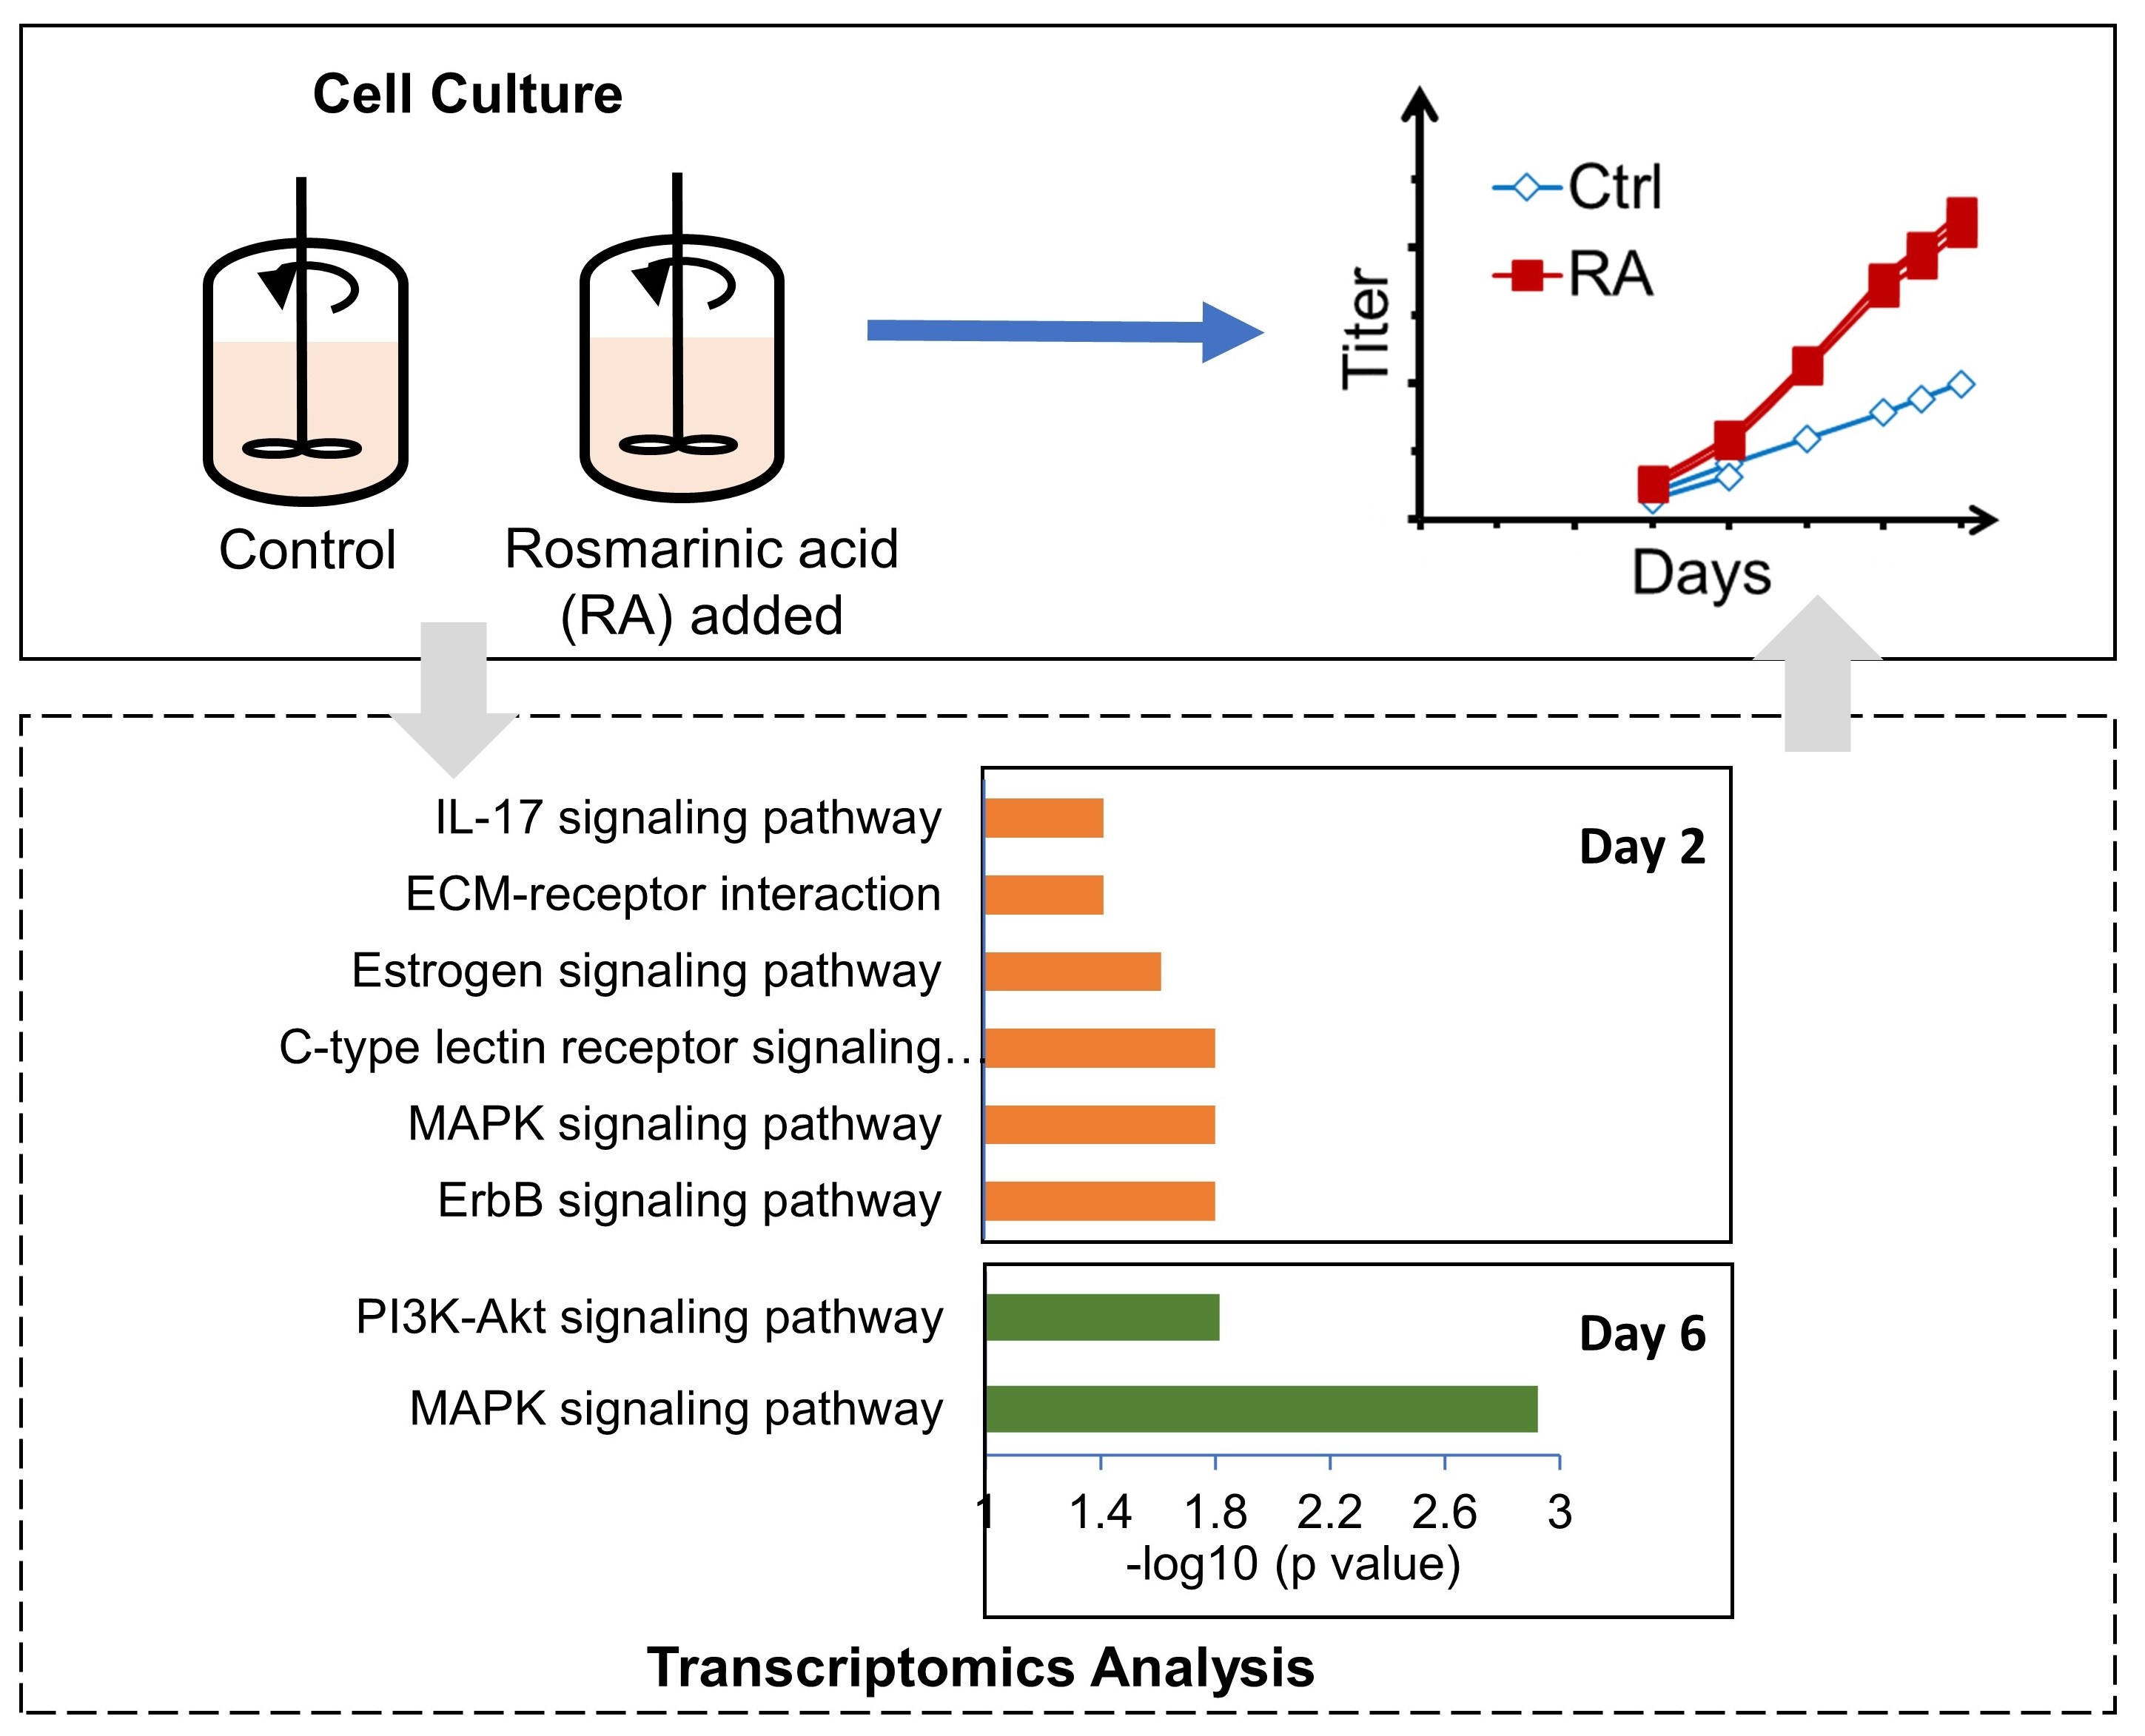
3.1. RA Enhances Cell Growth and Protein Production in CHO Cells

In this work, a CHO DG44 cell line for the expression of an IgG4 mAb was cultivated in 7-L bioreactors with feed media supplemented in bolus starting from day 3 for a total duration of 14 days. Biological triplicate runs were performed under each of two different basal production media conditions, e.g., a basal media (Ctrl condition) and the basal media with RA addition (RA condition) (Figure 1). It should be noted that RA was added in the basal production media for the RA condition only (no RA addition in any seed expansion step or the feed media). Cell culture performance was assessed by measuring VCD, cell viability, and titer daily (Figure 1). Similar VCD and viability profiles were observed under these two conditions until day 6, after which a decline was evident in the controls without RA. Although all six bioreactors were operated using the same bioreactor conditions, only one of the controls ran through the entire 14-day duration, while the other two control bioreactors were terminated on days 8 and 9 when viability decreased below 50%. The difference in cell culture performance for the three replicate 7-L control bioreactors indicates that the control condition was quite variable even under the same operation conditions (Figure 1). In our previous studies using 5-L bioreactors [8], we did not see large variations as in this study using 7-L bioreactors. This difference between 5-L and 7-L studies would most likely be due to the different bioreactor configurations and control systems. We controlled the same operation parameters (e.g., inoculation cell density, pH, temperature, seed, basal, feed media, etc.) for all different lab bioreactor runs including both 5-L and 7-L bioreactors. Nonetheless, the control conditions without RA all reached a much lower viability and titer than the RA conditions regardless of different bioreactors. Thus, the 7-L bioreactor study results are still meaningful to demonstrate the positive effect of RA on the cell culture performance. In contrast, all three RA bioreactors ran well for the entire duration with consistent cell culture performance (Figure 1). Much higher VCD and cell viability for the RA condition were achieved than the controls. The overall integrated VCD (IVCD) was increased by 69.4%, and the overall cell specific productivity was increased by 29.5% in RA-treated cell cultures compared to the control (only one control was available for IVCD and overall specific productivity calculation). Taken together, the addition of RA to the cell culture basal media increased product titer by 119%. Cell pellets were collected at various time points across the cell cultures. Next, transcriptomics analyses were conducted to explore the molecular mechanisms involved in RA treatment.

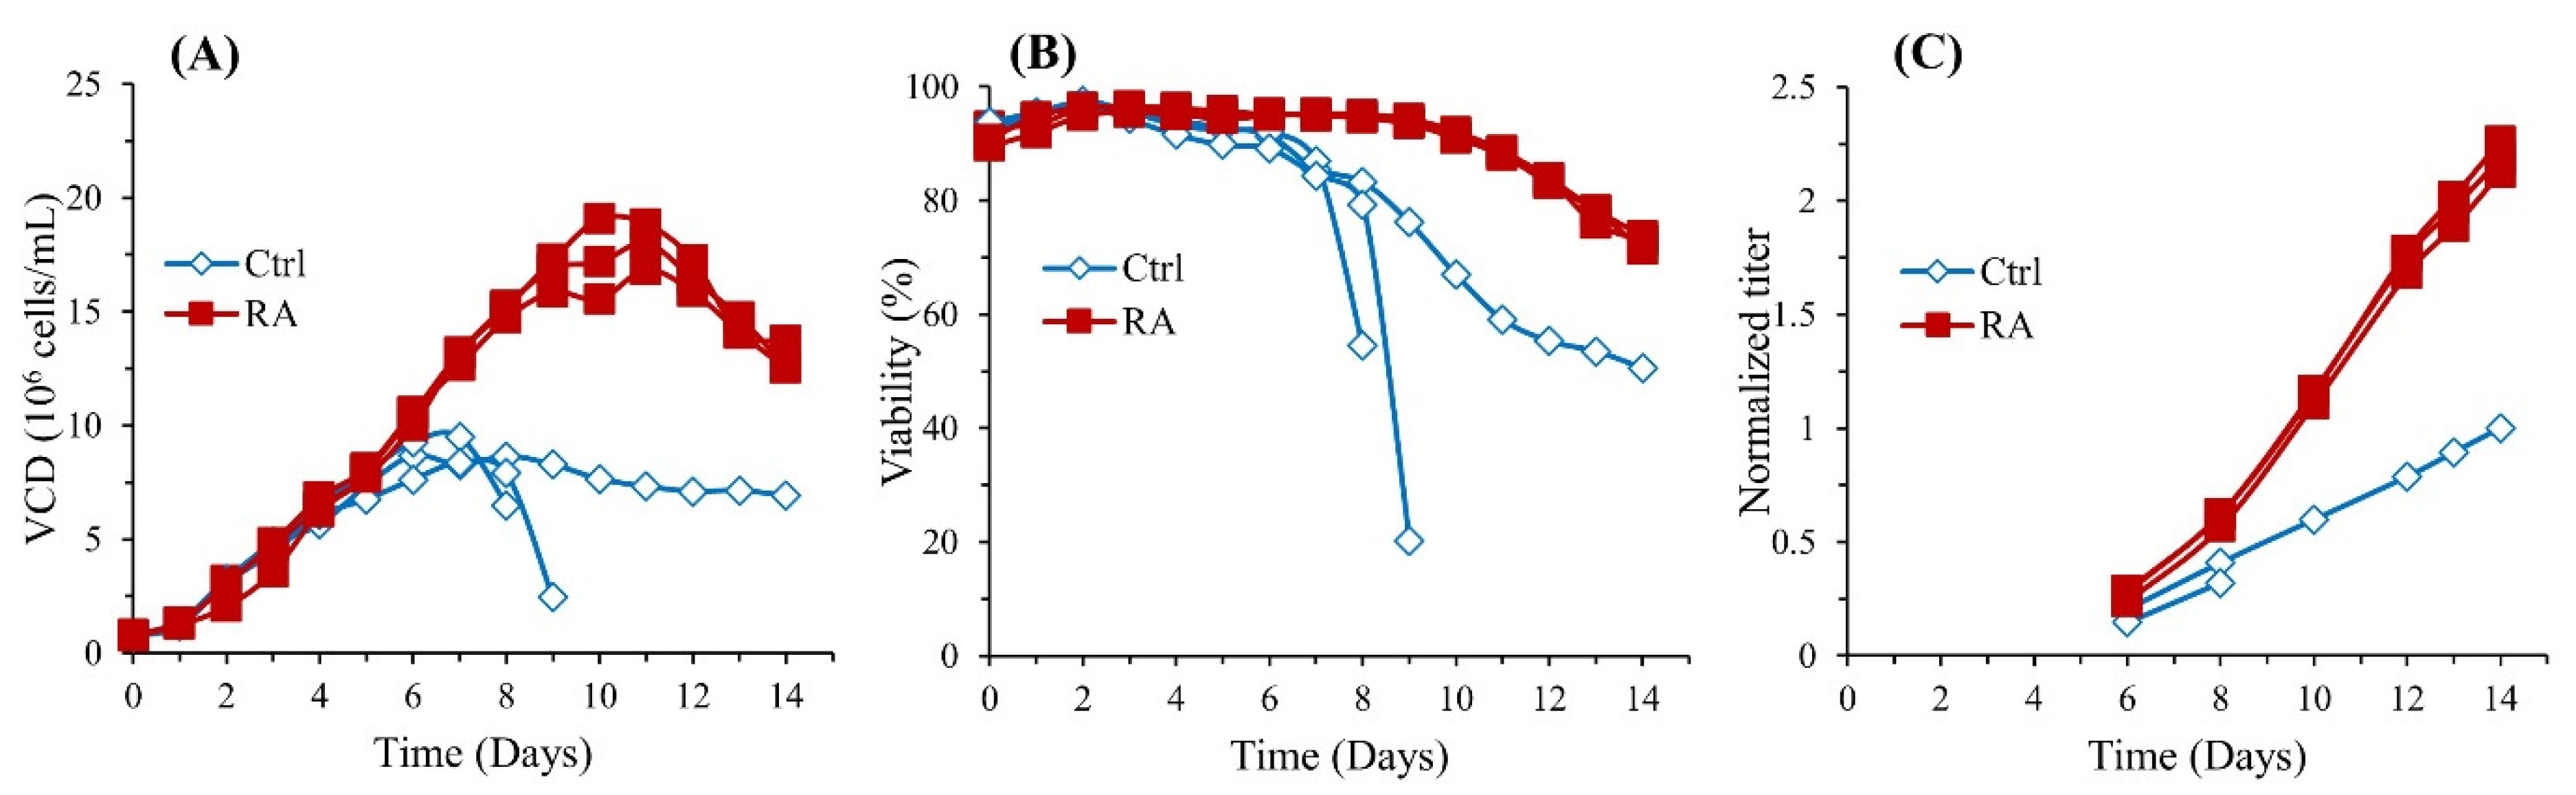
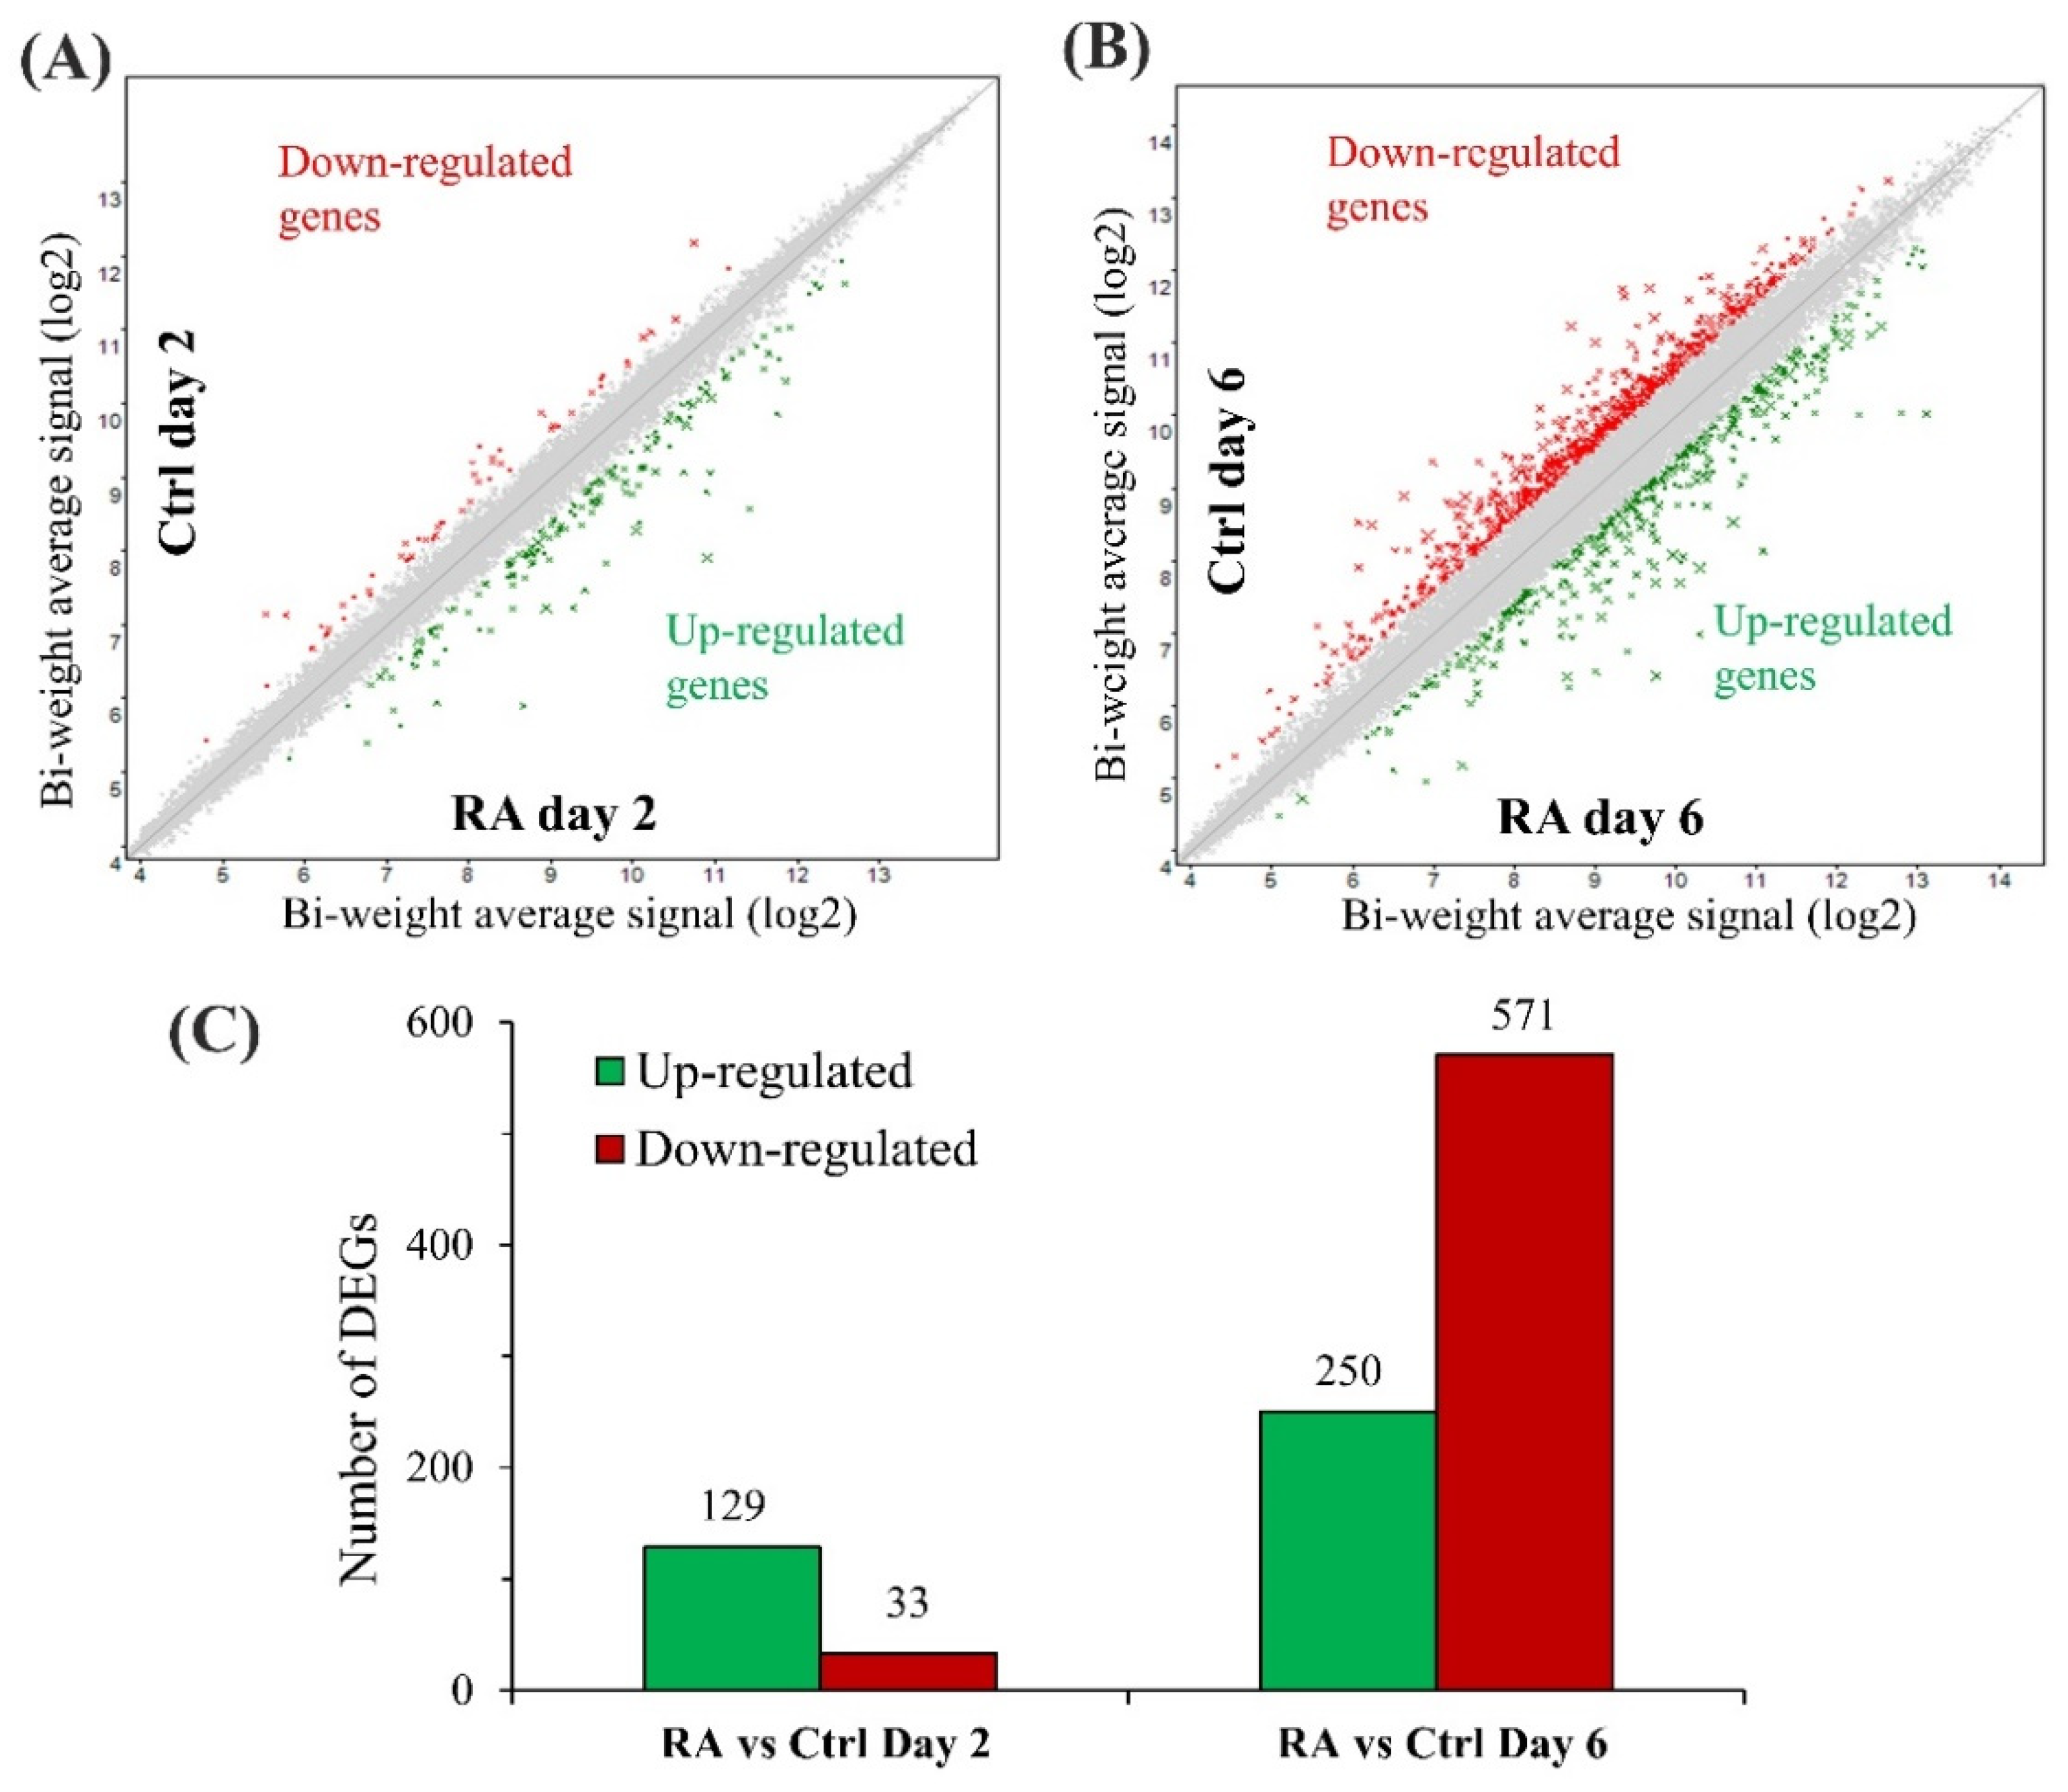
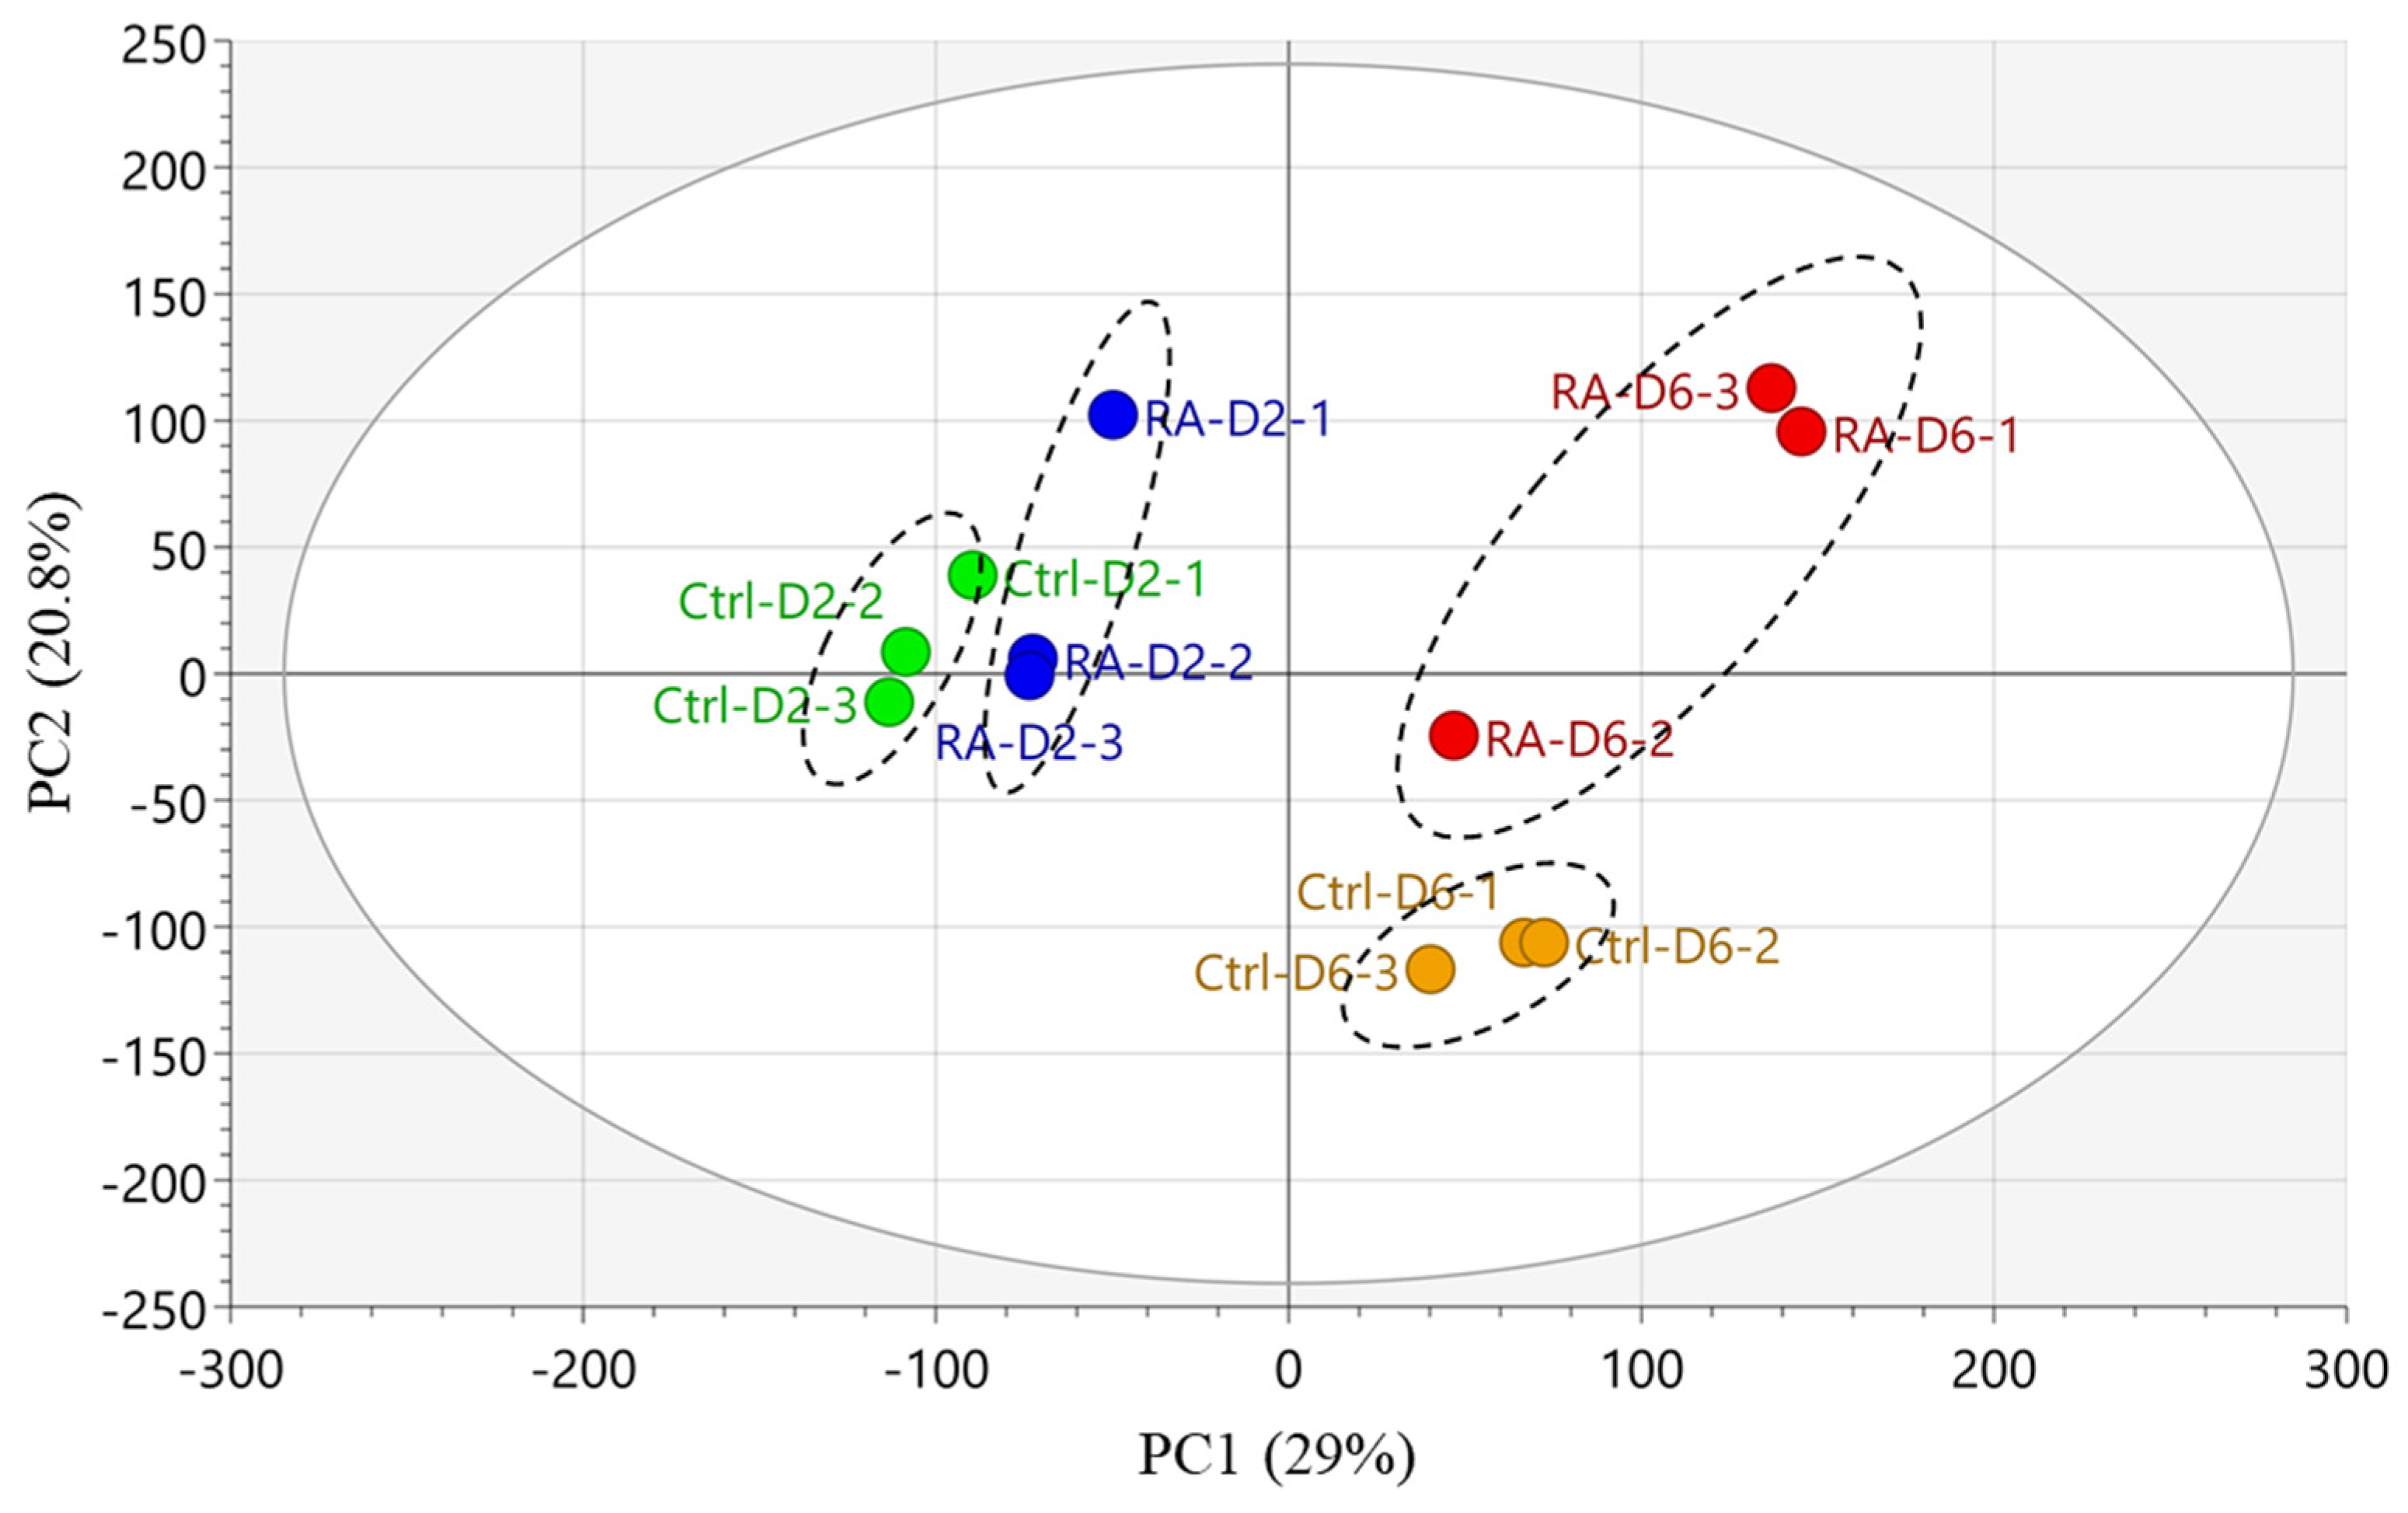
3.2. RA Treatment Alters the Transcriptional Profile of CHO Cells

We first analyzed the transcriptome of cells from RA and control cultures by using DNA microarrays. Samples were taken from the biological triplicate reactors at predefined cell culture stages during the process, specifically, the initial growth phase (day 2) and the slow growth or protein production phase (day 6). DEGs were then identified according to fold change (Figure 2). The scatter plots represent DEGs between the untreated control and the RA treated cells on day 2 (Figure 2A) and day 6 (Figure 2B). The green and red dots correspond to up- and down-regulated genes, respectively. With a fold change >1.5, a total of 162 DEGs were identified on day 2 (1st bars in Figure 2C) and 821 DEGs on day 6 (2nd bars in Figure 2c). Among the day 2 DEGs, 129 (79.6%) DEGs in RA cultures were up-regulated, and only 33 (20.4%) were down-regulated, compared to the control. On day 6, 250 (30.4%) DEGs in RA cultures were up-regulated, and 571 (69.6%) were down-regulated. PCA of all genes in Figure 3 also showed that RA treatment has discernible effects, with day 6 more severely impacted as compared with day 2, consistent with the DEGs analysis where a much larger portion of genes were affected by the RA on day 6.

3.3. Gene Expression Analysis Reveals RA Modulates Pathways Associated with Apoptosis and Survival

In order to further parse the changes in gene expression caused by RA, the identified DEGs were next interrogated by pathway analysis to identify the specific processes impacted. By projecting the DEGs on day 2 between RA and control cultures to the KEGG pathway database, we found that several pathways were up-regulated in RA cultures (Table 1). This included the groups of pathways related to environmental information processing, such as ErbB signaling pathway, mitogen-activated protein kinase (MAPK) signaling pathway, and ECM-receptor interaction. Additionally, several immune system-related pathways, including C-type lectin receptor signaling pathway, and IL-17 signaling pathways, were enriched in RA cultures. On day 6, several environmental information processing-related pathways were up-regulated in RA condition with respect to control. This included the MAPK signaling pathway and phosphatidylinositol 3-kinase (PI3K)/Akt signaling pathway, suggesting that RA was able to counteract apoptosis and survival-associated changes in these pathways, a hypothesis that will be discussed in detail later. It is important to point out the pathway analysis in Table 1 also shows several up-regulated pathways, which are not relevant to CHO cells, such as hepatitis B, colorectal cancer, axon guidance. It is mainly because of the overlapping pathways where genes are often not pathway specific or show bias in the databases used where human diseases are overrepresented.
CHO cells usually progress through multiple metabolic stages during fed-batch cultures, including an exponential growth phase, a low growth or antibody production phase when specific antibody production increases, and a decline phase. As seen in Figure 1c, antibody production is elevated starting on day 6. Therefore, it is interesting to investigate pathway changes from day 2 (initial growth phase) to day 6 (low growth or production phase) affected by RA. This was performed by comparing the number of pathways that increased or decreased from day 2 to day 6 between RA and control cultures. In total, 1755 and 1417 genes were identified as being differentially expressed from day 2 to day 6 in the untreated control and RA cultures, respectively (Figure S1). Pathway analysis indicated that no significant difference was observed in the pathways from day 2 to day 6 between RA and control cultures. Within the top 15 regulated pathways (p-value < 0.05) on day 6 compared to day 2 (Tables S1 and S2), there were 9 up-regulated and 12 down-regulated pathways that overlapped in those two conditions. Most of the up-regulated pathways were associated with environmental information processing, including PI3K/Akt signaling pathway, ECM-receptor interaction, MAPK signaling pathway, Rap1 signaling pathway, TNF signaling pathway, Ras signaling pathway, and calcium signaling pathway. In contrast, most of the down-regulated pathways from day 2 to day 6 were associated with genetic information processing. This included pathways that related to replication and repair (including DNA replication, nucleotide excision repair, mismatch repair, Fanconi anemia pathway, homologous recombination, and base excision repair), translation, transcription, and folding, sorting, and degradation (Table S2). Other significantly down-regulated pathways were related to cell growth and death, including cell cycle and p53 signaling pathway, likely a consequence of the cellular response to the changing culture environments and accumulation of toxic byproducts. Interestingly, it was observed that the MAPK and PI3K/Akt signaling pathways, which had been identified to be up-regulated on day 2 and day 6 by RA (Table 1), were also up-regulated over time in both conditions.

4. Discussion

The use of antioxidants in CHO cell cultures to improve monoclonal antibody production has been a topic of great interest [8,33,34,35,36,37,38,39]. Nevertheless, the precise mechanisms by which RA impacts CHO cell growth, metabolism, and productivity need further elucidation. In this work, we utilized transcriptomics as a tool to elucidate potential factors that could have an impact on the cell culture growth and productivity due to RA treatment. In particular, RA treatment substantially modified gene expression and strongly affected the signaling pathways, including the MAPK signaling pathway and PI3K/Akt signaling pathway that regulate cell survival and cell death. In control conditions, though these signaling pathways were also up-regulated from day 2 to day 6 in culture (as seen in Table S1), the low viability revealed that cell death was predominant. Similar extracellular metabolic profiles (glutamine, glutamate, lactate) were also observed before day 6 except for glucose and ammonia, which were mainly due to different viable cell densities (Figure S2). Interestingly, lactate metabolism shift was observed in RA conditions around day 6, which is likely triggered by cellular redox state [40]. We also investigated if intracellular metabolism was affected by RA treatment by comparing intracellular amino acids’ metabolism between RA and control cultures. Significant alterations in amino acid pools were not evident until day 6 (Figure S3). Additionally, the level of almost all the amino acids was continuously increased starting from day 6 in both control and RA conditions, possibly reflecting generally reduced metabolism in response to changing cell culture environments as the cells were undergoing decreased cell growth and overfeeding, especially in the control conditions.
Apoptosis, or programmed cell death, has been reported to account for the majority of cell death in mammalian cell cultures, affecting cell viability, productivity, and product quality [41,42,43]. Both caspase-3 activity and ROS were measured for the 500-L bioreactors with and without RA at different timeline points in our previous study [8]. The same seed culture, basal and feed media, and process conditions were used for these satellite 7-L bioreactors in this study. Thus, both caspase-3 and ROS were not measured for the 7-L runs. Caspase-3 activity was shown to decrease from day 1 to day 6 in the 500-L CHO cell cultures with the addition of RA, suggesting that apoptosis is suppressed in the RA cultures compared to the control [8]. In the present study, using transcriptomics analysis, ErbB and MAPK signaling pathways were enriched on day 2 compared to the control. Moreover, MAPK and PI3K-Akt signaling pathways, directly or indirectly activated by ErbBs, were up-regulated on day 6 in RA-supplemented cultures. Previous studies have demonstrated that several signaling pathways, including PI3K/Akt and MAPKs, play critical roles in regulating cell survival and apoptosis [44]. Interestingly, the identified MAPK and PI3K-Akt signaling pathways are also reported to be functionally mediated by reactive oxygen species (ROS) [45,46,47]. ROS generally participates in cellular physiological functions, including cell proliferation, and maintains the redox balance, contributing to a beneficial environment for cell survival [48]. However, there is ample evidence showing excess cellular ROS can have a devastating effect on cellular components, such as DNA, proteins, and lipids, which can lead to activation of death processes such as apoptosis [46,49]. ROS increases may be due to the overproduction from extracellular or intracellular processes, or there may be a decrease in endogenous antioxidant defense, which can scavenge excessively produced ROS. Interestingly, our previous scale-up 500-L study using the same process demonstrated that the RA-supplemented cultures generated less ROS from day 1 to day 6 than the non-RA condition [8].
By comparing the transcriptome on day 6 to day 2 for each condition, we found that cell survival-related pathways such as DNA replication, cell cycle, and nucleotide excision repair were down-regulated on day 6 compared to day 2 in both conditions (as seen in Table S2), reflecting the general consequence of the cellular response to the progressively deteriorating culture environments. Collectively, our results indicated that RA treatment alleviated apoptotic death in CHO cells. According to the pathway analysis above (in the Results section), an intriguing scenario would be that the RA addition slowed the process of cellular damage by oxidation, resulting in enhanced cell growth and protein production. It is important to note that mammalian cells have integrated antioxidant systems to protect cells from ROS, including enzymatic and non-enzymatic antioxidants. In the present study, the polyphenol RA was added as a non-enzymatic antioxidant to scavenge ROS. The primary antioxidant enzymes against ROS include superoxide dismutase (Sod), catalase (Cat), glutathione peroxidase (Gpx), and glutathione reductase (Grx) [50]. Our results revealed that most of these genes were not differentially expressed (fold change <1.5) between RA and control, as shown in Table S3. The genes of Cat and Gpx1 were even down-regulated on day 6 compared to the control, which indicated decreased ROS might trigger gene down-regulation to make endogenous antioxidant systems less active. However, how the RA directly modulates the PI3K/Akt and MAPKs pathways activation will need to be elucidated with further experiments.
Apoptosis caused by cellular stress can limit productivity in CHO cultures. Manipulating apoptotic associated pathways has been applied to improve recombinant protein titers. Overexpressing anti-apoptotic genes, such as Bcl-2 or Bcl-xL [51,52,53,54], and down-regulating pro-apoptotic genes such as caspase-3 [55], have been applied to inhibit or delay the progression of apoptosis and found to be effective at extending culture longevity and enhancing the production. In this study, only the gene Bcl2l12 among the genes involved in apoptosis (Bcl-2, Bax, Caspase-3 and -7), as shown in Table S3, had a slightly higher expression on day 6, although not significant (fold change 1.44 < 1.5) in RA conditions, which indicates that apoptosis decreased in RA conditions. Furthermore, the combinatorial approach of engineering anti-apoptosis and pro-autophagy pathways was attempted and achieved a higher VCD and longer culture duration than the single anti-apoptosis engineering approach [56]. It has been suggested that PI3K/Akt and MAPKs play important roles in the regulation of cell cycle progression and apoptosis through altering the level of pro-apoptotic and anti-apoptotic proteins [57,58,59,60,61]. Most interestingly, the Akt pathway has been involved in several previous CHO cell studies and was found to play a crucial role in cell survival and growth. Hwang and Lee (2009) investigated the role of Akt on cell survival during nutrient-limiting batch culture and showed overexpression of Akt in CHO cells could inhibit apoptosis as well as autophagy [62]. Xu (2010) demonstrated that overexpression of Prospero-related homeobox1 (Prox1) promotes CHO cell proliferation via activation of the Akt signaling pathway [63]. Coleman et al. (2019) identified a number of differentially up-regulated proteins involved in the Akt pathway, which may drive increased cell growth and productivity in miR-7-depleted CHO cells [64]. Therefore, the Akt and MAPKs related genes could be used as potential targets for CHO cell engineering along with the anti-apoptotic and antioxidant genes to enhance protein production.
Taken together, convincing evidence from both this 7-L bioreactor and previously published scale-up 500-L bioreactor studies suggests that RA can be used as a new additive to enhance VCD and cell viability and markedly improve titer in CHO cells. Metabolic pathway analysis of the transcriptome revealed that both the control and RA-supplemented conditions underwent down-regulation of proliferation genes over time in culture, but more survival activity was observed in RA-supplemented cultures than the control. In summary, transcriptomics analysis indicated that RA treatment modified gene expression and strongly affected the MAPK and Akt signaling pathways, which regulate cell survival and cell death. Future experiments should also quantify the corresponding protein levels by using methods such as Western blot, which can provide further supporting evidence. This omics analysis has important implications for the role of the antioxidant RA in the industrial cell culture process. The current study also represents another successful attempt to apply omics to gain an in-depth understanding of CHO cell biology and identify critical pathways that can be leveraged for cell culture process improvements and as cell line engineering targets.

Supplementary Materials

The following are available online at https://www.mdpi.com/article/10.3390/pr10030533/s1, Figure S1: Analysis of gene expression between day 2 and day 6 for control and RA conditions in the 7-L bioreactors. Figure S2: Time-series extracellular metabolite concentrations, including glucose, glutamine, glutamate, lactate, and ammonium. Figure S3: Time-series amino acids in cell pellets (n = 3, except n = 2 in the control for day 8). The concentration of each metabolite at day 1 in control was set as 100% to normalize data from different time points. Intracellular metabolite profiling was determined in cell pellets by a method combining NMR and LC/MS at Bristol-Myers Squibb. The detailed sample preparation and analytical procedures are described in previous studies published by our group. Table S1: Summary of the up-regulated pathways from day 2 to day 6, Table S2: Summary of the down-regulated pathways from day 2 to day 6, Table S3: Fold change of the key genes in enzymatic antioxidant system.

Author Contributions

Conceptualization, Z.H. and J.X.; methodology, J.X. and J.T.; software, Z.H.; formal analysis, Z.H.; investigation, J.T.; data curation, J.T.; writing—original draft preparation, Z.H. and J.X.; writing—review and editing, K.L.A., Y.Q. and M.C.B.; project administration, M.C.B., Z.L. and G.P. All authors have read and agreed to the published version of the manuscript.

Funding

This research received no external funding.

Institutional Review Board Statement

Not applicable.

Informed Consent Statement

Not applicable.

Data Availability Statement

The data presented in this study are available on request from the corresponding author.

Acknowledgments

Thank you to Bruce Eagan for 7-L bioreactor operation and Ayesha Aijaz for omics data generation.

Conflicts of Interest

The authors declare no conflict of interest.

References

  1. Lu, R.-M.; Hwang, Y.-C.; Liu, I.J.; Lee, C.-C.; Tsai, H.-Z.; Li, H.-J.; Wu, H.-C. Development of therapeutic antibodies for the treatment of diseases. J. Biomed. Sci. 2020, 27, 1. [Google Scholar] [CrossRef] [PubMed]
  2. Tuccori, M.; Ferraro, S.; Convertino, I.; Cappello, E.; Valdiserra, G.; Blandizzi, C.; Maggi, F.; Focosi, D. Anti-SARS-CoV-2 neutralizing monoclonal antibodies: Clinical pipeline. MAbs 2020, 12, 1854149. [Google Scholar] [CrossRef] [PubMed]
  3. Kelley, B. Developing therapeutic monoclonal antibodies at pandemic pace. Nat. Biotechnol. 2020, 38, 540–545. [Google Scholar] [CrossRef] [PubMed]
  4. Xu, J.; Rehmann, M.S.; Xu, X.; Huang, C.; Tian, J.; Qian, N.-X.; Li, Z.J. Improving titer while maintaining quality of final formulated drug substance via optimization of CHO cell culture conditions in low-iron chemically defined media. mAbs 2018, 10, 488–499. [Google Scholar] [CrossRef]
  5. Huang, Y.-M.; Hu, W.; Rustandi, E.; Chang, K.; Yusuf-Makagiansar, H.; Ryll, T. Maximizing productivity of CHO cell-based fed-batch culture using chemically defined media conditions and typical manufacturing equipment. Biotechnol. Prog. 2010, 26, 1400–1410. [Google Scholar] [CrossRef]
  6. Handlogten, M.W.; Zhu, M.; Ahuja, S. Intracellular response of CHO cells to oxidative stress and its influence on metabolism and antibody production. Biochem. Eng. J. 2018, 133, 12–20. [Google Scholar] [CrossRef]
  7. Yun, Z.; Takagi, M.; Yoshida, T. Combined addition of glutathione and iron chelators for decrease of intracellular level of reactive oxygen species and death of chinese hamster ovary cells. J. Biosci. Bioeng. 2003, 95, 124–127. [Google Scholar] [CrossRef]
  8. Xu, J.; Rehmann, M.S.; Tian, J.; He, Q.; Chen, J.; Lee, J.; Borys, M.C.; Li, Z.J. Rosmarinic acid, a new raw material, doubled monoclonal antibody titer in cell culture manufacturing. Biochem. Eng. J. 2020, 160. [Google Scholar] [CrossRef]
  9. Lee, A.P.; Kok, Y.J.; Lakshmanan, M.; Leong, D.; Zheng, L.; Lim, H.L.; Chen, S.; Mak, S.Y.; Ang, K.S.; Templeton, N.; et al. Multi-omics profiling of a CHO cell culture system unravels the effect of culture pH on cell growth, antibody titer and product quality. Biotechnol. Bioeng. 2021, 118, 4305–4316. [Google Scholar] [CrossRef]
  10. Xu, N.; Ma, C.; Ou, J.; Sun, W.W.; Zhou, L.; Hu, H.; Liu, X.M. Comparative Proteomic Analysis of Three Chinese Hamster Ovary (CHO) Host Cells. Biochem. Eng. J. 2017, 124, 122–129. [Google Scholar] [CrossRef]
  11. Chen, C.; Le, H.; Follstad, B.; Goudar, C.T. A Comparative Transcriptomics Workflow for Analyzing Microarray Data From CHO Cell Cultures. Biotechnol. J. 2018, 13, 1700228. [Google Scholar] [CrossRef] [PubMed]
  12. Kumar, S.; Dhara, V.G.; Orzolek, L.D.; Hao, H.; More, A.J.; Lau, E.C.; Betenbaugh, M.J. Elucidating the impact of cottonseed hydrolysates on CHO cell culture performance through transcriptomic analysis. Appl. Microbiol. Biotechnol. 2021, 105, 271–285. [Google Scholar] [CrossRef] [PubMed]
  13. Datta, P.; Linhardt, R.J.; Sharfstein, S.T. An 'omics approach towards CHO cell engineering. Biotechnol. Bioeng. 2013, 110, 1255–1271. [Google Scholar] [CrossRef] [PubMed]
  14. Sharfstein, S.T. Omics insights into production-scale bioreactors. Biotechnol. J. 2016, 11, 1124–1125. [Google Scholar] [CrossRef] [Green Version]
  15. Huang, Z.; Xu, J.; Yongky, A.; Morris, C.S.; Polanco, A.L.; Reily, M.; Borys, M.C.; Li, Z.J.; Yoon, S. CHO cell productivity improvement by genome-scale modeling and pathway analysis: Application to feed supplements. Biochem. Eng. J. 2020, 160, 107638. [Google Scholar] [CrossRef]
  16. Lakshmanan, M.; Kok, Y.J.; Lee, A.P.; Kyriakopoulos, S.; Lim, H.L.; Teo, G.; Poh, S.L.; Tang, W.Q.; Hong, J.; Tan, A.H.-M.; et al. Multi-omics profiling of CHO parental hosts reveals cell line-specific variations in bioprocessing traits. Biotechnol. Bioeng. 2019, 116, 2117–2129. [Google Scholar] [CrossRef]
  17. Ali, A.S.; Raju, R.; Kshirsagar, R.; Ivanov, A.R.; Gilbert, A.; Zang, L.; Karger, B.L. Multi-Omics Study on the Impact of Cysteine Feed Level on Cell Viability and mAb Production in a CHO Bioprocess. Biotechnol. J. 2019, 14, 1800352. [Google Scholar] [CrossRef]
  18. Ali, A.S.; Chen, R.; Raju, R.; Kshirsagar, R.; Gilbert, A.; Zang, L.; Karger, B.L.; Ivanov, A.R. Multi-Omics Reveals Impact of Cysteine Feed Concentration and Resulting Redox Imbalance on Cellular Energy Metabolism and Specific Productivity in CHO Cell Bioprocessing. Biotechnol. J. 2020, 15, 1900565. [Google Scholar] [CrossRef]
  19. Gao, Y.; Ray, S.; Dai, S.; Ivanov, A.R.; Abu-Absi, N.R.; Lewis, A.M.; Huang, Z.; Xing, Z.; Borys, M.C.; Li, Z.J.; et al. Combined metabolomics and proteomics reveals hypoxia as a cause of lower productivity on scale-up to a 5000-liter CHO bioprocess. Biotechnol. J. 2016, 11, 1190–1200. [Google Scholar] [CrossRef]
  20. Vodopivec, M.; Lah, L.; Narat, M.; Curk, T. Metabolomic profiling of CHO fed-batch growth phases at 10, 100, and 1000 L. Biotechnol. Bioeng. 2019, 116, 2720–2729. [Google Scholar] [CrossRef]
  21. Bertrand, V.; Karst, D.J.; Bachmann, A.; Cantalupo, K.; Soos, M.; Morbidelli, M. Transcriptome and proteome analysis of steady-state in a perfusion CHO cell culture process. Biotechnol. Bioeng. 2019, 116, 1959–1972. [Google Scholar] [CrossRef]
  22. Orellana, C.A.; Martínez, V.S.; MacDonald, M.A.; Henry, M.N.; Gillard, M.; Gray, P.P.; Nielsen, L.K.; Mahler, S.; Marcellin, E. ‘Omics driven discoveries of gene targets for apoptosis attenuation in CHO cells. Biotechnol. Bioeng. 2021, 118, 481–490. [Google Scholar] [CrossRef] [PubMed]
  23. Xu, J.; Jin, M.; Song, H.; Huang, C.; Xu, X.; Tian, J.; Qian, N.-X.; Steger, K.; Lewen, N.S.; Tao, L.; et al. Brown drug substance color investigation in cell culture manufacturing using chemically defined media: A case study. Process. Biochem. 2014, 49, 130–139. [Google Scholar] [CrossRef]
  24. Jing, Y.; Qian, Y.; Ghandi, M.; He, A.; Borys, M.C.; Pan, S.H.; Li, Z.J. A mechanistic study on the effect of dexamethasone in moderating cell death in Chinese Hamster Ovary cell cultures. Biotechnol. Prog. 2012, 28, 490–496. [Google Scholar] [CrossRef] [PubMed]
  25. Qian, Y.; Xing, Z.; Lee, S.; Mackin, N.A.; He, A.; Kayne, P.S.; He, Q.; Qian, N.-X.; Li, Z.J. Hypoxia influences protein transport and epigenetic repression of CHO cell cultures in shake flasks. Biotechnol. J. 2014, 9, 1413–1424. [Google Scholar] [CrossRef]
  26. Benjamini, Y.; Hochberg, Y. Controlling the False Discovery Rate: A Practical and Powerful Approach to Multiple Testing. J. R. Stat. Society. Ser. B (Methodological) 1995, 57, 289–300. [Google Scholar] [CrossRef]
  27. Sha, S.; Bhatia, H.; Yoon, S. An RNA-seq based transcriptomic investigation into the productivity and growth variants with Chinese hamster ovary cells. J. Biotechnol. 2018, 271, 37–46. [Google Scholar] [CrossRef]
  28. Courtes, F.C.; Lin, J.; Lim, H.L.; Ng, S.W.; Wong, N.S.; Koh, G.; Vardy, L.; Yap, M.G.; Loo, B.; Lee, D.Y. Translatome analysis of CHO cells to identify key growth genes. J. Biotechnol. 2013, 167, 215–224. [Google Scholar] [CrossRef]
  29. Chen, C.; Le, H.; Goudar, C.T. An automated RNA-Seq analysis pipeline to identify and visualize differentially expressed genes and pathways in CHO cells. Biotechnol. Prog. 2015, 31, 1150–1162. [Google Scholar] [CrossRef]
  30. Sommeregger, W.; Mayrhofer, P.; Steinfellner, W.; Reinhart, D.; Henry, M.; Clynes, M.; Meleady, P.; Kunert, R. Proteomic differences in recombinant CHO cells producing two similar antibody fragments. Biotechnol. Bioeng. 2016, 113, 1902–1912. [Google Scholar] [CrossRef]
  31. Sha, S.; Kuang, B.; Yoon, S. Characterization of dynamic regulation in Chinese hamster ovary (CHO) cell cultures in the late exponential phase. Biochem. Eng. J. 2021, 167, 107897. [Google Scholar] [CrossRef]
  32. Xie, C.; Mao, X.; Huang, J.; Ding, Y.; Wu, J.; Dong, S.; Kong, L.; Gao, G.; Li, C.Y.; Wei, L. KOBAS 2.0: A web server for annotation and identification of enriched pathways and diseases. Nucleic Acids Res. 2011, 39 (Suppl. 2), W316–W322. [Google Scholar] [CrossRef] [PubMed] [Green Version]
  33. Yamano, N.; Omasa, T. EGCG improves recombinant protein productivity in Chinese hamster ovary cell cultures via cell proliferation control. Cytotechnology 2018, 70, 1697–1706. [Google Scholar] [CrossRef] [PubMed]
  34. Toronjo Urquiza, L.; James, D.C.; Nagy, T.; Falconer, R.J. Screening Naturally Occurring Phenolic Antioxidants for Their Suitability as Additives to CHO Cell Culture Media Used to Produce Monoclonal Antibodies. Antioxidants 2019, 8, 159. [Google Scholar] [CrossRef] [PubMed] [Green Version]
  35. Toronjo-Urquiza, L.; Acosta-Martin, A.E.; James, D.C.; Nagy, T.; Falconer, R.J. Resveratrol addition to Chinese hamster ovary cell culture media: The effect on cell growth, monoclonal antibody synthesis, and its chemical modification. Biotechnol. Prog. 2020, 36, e2940. [Google Scholar] [CrossRef]
  36. Toronjo-Urquiza, L.; Acosta-Martin, A.E.; James, D.C.; Nagy, T.; Falconer, R.J. The use of catechins in Chinese hamster ovary cell media for the improvement of monoclonal antibody yields and a reduction of acidic species. Biotechnol. Prog. 2020, 36, e2980. [Google Scholar] [CrossRef] [PubMed]
  37. Ha, T.K.; Hansen, A.H.; Kol, S.; Kildegaard, H.F.; Lee, G.M. Baicalein Reduces Oxidative Stress in CHO Cell Cultures and Improves Recombinant Antibody Productivity. Biotechnol. J. 2018, 13, e1700425. [Google Scholar] [CrossRef] [PubMed]
  38. Chung, S.; Tian, J.; Tan, Z.; Chen, J.; Zhang, N.; Huang, Y.; Vandermark, E.; Lee, J.; Borys, M.; Li, Z.J. Modulating cell culture oxidative stress reduces protein glycation and acidic charge variant formation. MAbs 2019, 11, 205–216. [Google Scholar] [CrossRef] [Green Version]
  39. Hossler, P.; Wang, M.; McDermott, S.; Racicot, C.; Chemfe, K.; Zhang, Y.; Chumsae, C.; Manuilov, A. Cell culture media supplementation of bioflavonoids for the targeted reduction of acidic species charge variants on recombinant therapeutic proteins. Biotechnol. Prog. 2015, 31, 1039–1052. [Google Scholar] [CrossRef]
  40. Hartley, F.; Walker, T.; Chung, V.; Morten, K. Mechanisms driving the lactate switch in Chinese hamster ovary cells. Biotechnol. Bioeng. 2018, 115, 1890–1903. [Google Scholar] [CrossRef]
  41. Goswami, J.; Sinskey, A.J.; Steller, H.; Stephanopoulos, G.N.; Wang, D.I.C. Apoptosis in batch cultures of Chinese Hamster Ovary cells. Biotechnol. Bioeng. 1999, 62, 632–640. [Google Scholar] [CrossRef] [Green Version]
  42. Mastrangelo, A.J.; Betenbaugh, M.J. Overcoming apoptosis: New methods for improving protein-expression systems. Trends Biotechnol. 1998, 16, 88–95. [Google Scholar] [CrossRef]
  43. Grilo, A.L.; Mantalaris, A. Apoptosis: A mammalian cell bioprocessing perspective. Biotechnol Adv. 2019, 37, 459–475. [Google Scholar] [CrossRef] [PubMed]
  44. Sekine, Y.; Hatanaka, R.; Watanabe, T.; Sono, N.; Iemura, S.; Natsume, T.; Kuranaga, E.; Miura, M.; Takeda, K.; Ichijo, H. The Kelch repeat protein KLHDC10 regulates oxidative stress-induced ASK1 activation by suppressing PP5. Mol. Cell 2012, 48, 692–704. [Google Scholar] [CrossRef] [Green Version]
  45. Zhou, W.; Quan, J.-H.; Lee, Y.-H.; Shin, D.-W.; Cha, G.-H. Toxoplasma gondii Proliferation Require Down-Regulation of Host Nox4 Expression via Activation of PI3 Kinase/Akt Signaling Pathway. PLoS ONE 2013, 8, e66306. [Google Scholar] [CrossRef] [Green Version]
  46. Redza-Dutordoir, M.; Averill-Bates, D.A. Activation of apoptosis signalling pathways by reactive oxygen species. Biochim. Biophys. Acta 2016, 1863, 2977–2992. [Google Scholar] [CrossRef]
  47. Reczek, C.R.; Chandel, N.S. The Two Faces of Reactive Oxygen Species in Cancer. Annu. Rev. Cancer Biol. 2017, 1, 79–98. [Google Scholar] [CrossRef]
  48. Jiang, Y.; Wang, X.; Hu, D. Furanodienone induces G0/G1 arrest and causes apoptosis via the ROS/MAPKs-mediated caspase-dependent pathway in human colorectal cancer cells: A study in vitro and in vivo. Cell Death Dis. 2017, 8, e2815. [Google Scholar] [CrossRef] [Green Version]
  49. Perillo, B.; Di Donato, M.; Pezone, A.; Di Zazzo, E.; Giovannelli, P.; Galasso, G.; Castoria, G.; Migliaccio, A. ROS in cancer therapy: The bright side of the moon. Exp. Mol. Med. 2020, 52, 192–203. [Google Scholar] [CrossRef]
  50. Birben, E.; Sahiner, U.M.; Sackesen, C.; Erzurum, S.; Kalayci, O. Oxidative Stress and Antioxidant Defense. World Allergy Organ. J. 2012, 5, 9–19. [Google Scholar] [CrossRef] [Green Version]
  51. Cost, G.J.; Freyvert, Y.; Vafiadis, A.; Santiago, Y.; Miller, J.C.; Rebar, E.; Collingwood, T.N.; Snowden, A.; Gregory, P.D. BAK and BAX deletion using zinc-finger nucleases yields apoptosis-resistant CHO cells. Biotechnol. Bioeng. 2010, 105, 330–340. [Google Scholar] [CrossRef] [PubMed]
  52. Chiang, G.G.; Sisk, W.P. Bcl-x(L) mediates increased production of humanized monoclonal antibodies in Chinese hamster ovary cells. Biotechnol. Bioeng. 2005, 91, 779–792. [Google Scholar] [CrossRef]
  53. Meents, H.; Enenkel, B.; Eppenberger, H.M.; Werner, R.G.; Fussenegger, M. Impact of coexpression and coamplification of sICAM and antiapoptosis determinants bcl-2/bcl-x(L) on productivity, cell survival, and mitochondria number in CHO-DG44 grown in suspension and serum-free media. Biotechnol. Bioeng. 2002, 80, 706–716. [Google Scholar] [CrossRef] [PubMed]
  54. Zhang, X.; Han, L.; Zong, H.; Ding, K.; Yuan, Y.; Bai, J.; Zhou, Y.; Zhang, B.; Zhu, J. Enhanced production of anti-PD1 antibody in CHO cells through transient co-transfection with anti-apoptotic genes Bcl-x L and Mcl-1. Bioprocess. Biosyst Eng. 2018, 41, 633–640. [Google Scholar] [CrossRef] [PubMed]
  55. Sung, Y.H.; Lee, J.S.; Park, S.H.; Koo, J.; Lee, G.M. Influence of co-down-regulation of caspase-3 and caspase-7 by siRNAs on sodium butyrate-induced apoptotic cell death of Chinese hamster ovary cells producing thrombopoietin. Metab. Eng. 2007, 9, 452–464. [Google Scholar] [CrossRef]
  56. Lee, J.S.; Ha, T.K.; Park, J.H.; Lee, G.M. Anti-cell death engineering of CHO cells: Co-overexpression of Bcl-2 for apoptosis inhibition, Beclin-1 for autophagy induction. Biotechnol. Bioeng. 2013, 110, 2195–2207. [Google Scholar] [CrossRef]
  57. Yuan, L.; Wang, J.; Xiao, H.; Xiao, C.; Wang, Y.; Liu, X. Isoorientin induces apoptosis through mitochondrial dysfunction and inhibition of PI3K/Akt signaling pathway in HepG2 cancer cells. Toxicol. Appl. Pharmacol. 2012, 265, 83–92. [Google Scholar] [CrossRef]
  58. Chang, F.; Lee, J.T.; Navolanic, P.M.; Steelman, L.S.; Shelton, J.G.; Blalock, W.L.; Franklin, R.A.; McCubrey, J.A. Involvement of PI3K/Akt pathway in cell cycle progression, apoptosis, and neoplastic transformation: A target for cancer chemotherapy. Leukemia 2003, 17, 590–603. [Google Scholar] [CrossRef] [Green Version]
  59. Liu, C.M.; Ma, J.Q.; Sun, Y.Z. Puerarin protects rat kidney from lead-induced apoptosis by modulating the PI3K/Akt/eNOS pathway. Toxicol. Appl. Pharmacol. 2012, 258, 330–342. [Google Scholar] [CrossRef]
  60. Granado-Serrano, A.B.; Angeles Martín, M.; Izquierdo-Pulido, M.; Goya, L.; Bravo, L.; Ramos, S. Molecular Mechanisms of (−)-Epicatechin and Chlorogenic Acid on the Regulation of the Apoptotic and Survival/Proliferation Pathways in a Human Hepatoma Cell Line. J. Agric. Food Chem. 2007, 55, 2020–2027. [Google Scholar] [CrossRef]
  61. Yamaguchi, H.; Wang, H.-G. The protein kinase PKB/Akt regulates cell survival and apoptosis by inhibiting Bax conformational change. Oncogene 2001, 20, 7779–7786. [Google Scholar] [CrossRef] [PubMed] [Green Version]
  62. Hwang, S.O.; Lee, G.M. Effect of Akt overexpression on programmed cell death in antibody-producing Chinese hamster ovary cells. J. Biotechnol. 2009, 139, 89–94. [Google Scholar] [CrossRef] [PubMed]
  63. Xu, S.-Z. Prox1 Facilitates Transfected CHO Cell Proliferation through Activation of the AKT Signaling Pathway. Int. J. Biomed. Sci. 2010, 6, 49–59. [Google Scholar]
  64. Coleman, O.; Suda, S.; Meiller, J.; Henry, M.; Riedl, M.; Barron, N.; Clynes, M.; Meleady, P. Increased growth rate and productivity following stable depletion of miR-7 in a mAb producing CHO cell line causes an increase in proteins associated with the Akt pathway and ribosome biogenesis. J. Proteom. 2019, 195, 23–32. [Google Scholar] [CrossRef] [PubMed]
Figure 1. Effect of RA on fed-batch cell culture performance in 7-L bioreactors containing the control basal media (Ctrl condition) or the basal media with RA addition (RA condition) (n = 3): (A) VCD, (B) cell viability, and (C) titer. The titer on day 14 in 7-L control bioreactor was set as 100% to normalize titer within this study. Given the lower cell viability at <50%, two control bioreactors were terminated on days 8 and 9.
Processes 10 00533 g001
Figure 2. Analysis of gene expression on day 2 and day 6 for the control and RA conditions in the 7-L bioreactors: scatter plot of the differentially expressed genes on (A) day 2 and (B) day 6; (C) relative proportions of up- and down-regulated DEGs on day 2 and day 6. The green and red dots represent up- and down-regulated genes, respectively, while the grey dots represent the genes that have no significant change in expression.
Processes 10 00533 g002
Figure 3. Principal component analysis of all genes on day 2 and day 6 in the control and RA conditions. The green and blue circles represent control and RA-treated samples on day 2, respectively, while the orange and red circles represent control and RA-treated samples on day 6, respectively.
Processes 10 00533 g003
Table 1. Summary of the main up-regulated pathways on day 2 and day 6 in RA condition compared to the control.
PathwayCategoryAdjusted p-Value
RA-D2 vs. Control-D2ErbB signaling pathwayEnvironmental Information Processing/Signal transduction0.0240
Parathyroid hormone synthesis, secretion and actionOrganismal Systems/Endocrine system0.0240
Hepatitis BHuman Diseases/Infectious disease: viral0.0240
Colorectal cancerHuman Diseases/Cancer: specific types0.0240
MAPK signaling pathwayEnvironmental Information Processing/Signal transduction0.0240
Axon guidanceOrganismal Systems/Development and regeneration0.0240
C-type lectin receptor signaling pathwayOrganismal Systems/Immune system0.0240
Bladder cancerHuman Diseases/Cancer: specific types0.0240
MicroRNAs in cancerHuman Diseases/Cancer: overview0.0299
Estrogen signaling pathwayOrganismal Systems/Endocrine system0.0335
Human T-cell leukemia virus 1 infectionHuman Diseases/Infectious disease: viral0.0350
Fluid shear stress and atherosclerosisHuman Diseases/Cardiovascular disease0.0374
ECM-receptor interactionEnvironmental Information Processing/Signaling molecules and interaction0.0479
IL-17 signaling pathwayOrganismal Systems/Immune system0.0479
RA-D6 vs. Control-D6MAPK signaling pathwayEnvironmental Information Processing/Signal transduction0.0012
MicroRNAs in cancerHuman Diseases/Cancer: overview0.0028
Proteoglycans in cancerHuman Diseases/Cancer: overview0.0089
PI3K-Akt signaling pathwayEnvironmental Information Processing/Signal transduction0.0153
Pathways in cancerHuman Diseases/Cancer: overview0.0153
Publisher’s Note: MDPI stays neutral with regard to jurisdictional claims in published maps and institutional affiliations.

