Article

Removal of Lead, Cadmium, and Aluminum Sulfate from Simulated and Real Water with Native and Oxidized Starches

1
Leibniz-Institut für Polymerforschung Dresden e.V., Hohe Str. 6, 01069 Dresden, Germany
2
Kurt-Schwabe-Institut für Mess-und Sensortechnik Meinsberg e.V., Kurt-Schwabe-Str. 4, 04736 Waldheim, Germany
3
Institute of Physical Chemistry, Technische Universität Dresden, 01062 Dresden, Germany
*
Author to whom correspondence should be addressed.
These authors contributed equally to this work.
Polysaccharides 2021, 2(2), 429-453; https://doi.org/10.3390/polysaccharides2020027
Submission received: 28 February 2021 / Revised: 13 April 2021 / Accepted: 26 May 2021 / Published: 4 June 2021

Abstract

:
The separation of toxic pollutants such as Pb2+, Cd2+, and Al3+ from water is a constant challenge as contamination of natural water bodies is increasing. Al3+ and especially Pb2+ and Cd2+ are ecotoxic and highly toxic for humans, even in ppb concentrations, and therefore removal below a dangerous level is demanding. Herein, the potential adsorber material starch, being ecofriendly, cheap, and abundantly available, was investigated. Thus, four different native starch samples (potato, corn, waxy corn, and wheat starch) and two oxidized starches (oxidized potato and corn starch) were comprehensively analyzed with streaming potential and charge density measurements, SEM-EDX, ATR-FTIR, 1H-NMR, and TGA. Subsequently, the starch samples were tested for the adsorption of Pb2+, Cd2+, and Al3+ from the respective sulfate salt solution. The adsorption process was analyzed by ICP-OES and SEM-EDX, and the adsorption isotherms were fitted comparing Langmuir, Sips, and Dubinin-Radushkevich models. Oxidized starch, for which chemical modification is one of the simplest, and also native potato starch were excellent natural adsorber materials for Al3+, Cd2+, and especially Pb2+ in the low concentration range, exhibiting maximum adsorption capacities of 84, 71, and 104 µmol/g for oxidized potato starch, respectively.

Graphical Abstract

1. Introduction

The amount of environmental contamination and discharges of industrial waste all over the world is increasing at an alarming pace, with a simultaneously growing water demand worldwide [1,2]. The separation of heavy metal ions by technically feasible and cost-efficient adsorber materials is crucial for the water supply of people worldwide, especially in economically weaker countries or for the supply after environmental disasters. Different separation methods can be applied such as ion exchange, membrane filtration, chemical precipitation, electrocoagulation, and reverse osmosis [3]. Yet, these methods are very costly and can be exorbitantly resource-consuming when upscaled to huge factories. Furthermore, these methods partially have negative impacts on nature when used excessively [4]. In order for these problems to be circumvented, adsorption methods using biopolymers can be applied, wherein they feature several advantages as they are biodegradable, renewable, abundant, compostable, and environmentally friendly [5,6]. Thus, biopolymers are a better alternative for synthetic adsorber materials since these can pose a risk to the environment with toxic byproducts or educts [7]. The increasing demand for environmentally friendly and biodegradable processes for the recovery of metal ions from industrial effluents led many research groups to investigate biomaterials such as chitosan, starch, and pectin [8,9,10]. Chitosan is a biobased polymer that has been extensively investigated by many research groups as an adsorber material and flocculant for water purification, as ion-complexing compounds in electrochemical sensors, in biomedical applications, or as an additive in paper processing due to its astonishing properties [11,12,13,14,15,16,17,18,19,20,21]. Moreover, other biomaterials such as pectin or starch have been studied as flocculants or as adsorbers for the removal of toxic heavy metal ions [22,23,24]. However, to enhance the adsorption efficiency of starch, it is often modified in various ways, e.g., by etherification [25], esterification [3], carboxymethylation [26], or hydrogelation [27]. Time- or energy-consuming chemical modifications, especially when including the use of costly or toxic educts, partially counteract the advantage of starch, being itself a low-cost and ecofriendly biopolymer. Therefore, it is important to investigate the ability of unmodified starch or only simple chemical modifications, such as oxidation [28], whereby the ecologic and economic advantages of this ‘green’ adsorber material are not outweighed.
Highly toxic and abundantly used heavy metal ions, such as Pb2+ and Cd2+, pollute natural water bodies worldwide through progressing industrialization. The pollution by Pb2+ can be caused by mining, battery production, and metal processing [1,2,29,30]. Bioaccumulation of lead at ppm or ppb levels can cause severe damage in, e.g., metabolism, hematopoiesis, and the nervous system of all exposed living organisms, including humans, leading to death [29,31,32,33,34,35,36,37]. Cd2+ is mainly released to the environment by fertilizer and battery production and the semiconductor industry [1,2,30,38,39,40]. In the environment, Cd2+ in low concentrations can pose a risk to marine and freshwater aquatic life in the form of, e.g., genotoxicity and liver and kidney degeneration [38,41]. Therefore, Cd2+ is classified as carcinogenic in addition to lowering bone density in humans and severe renal damage [42,43]. In addition to weathering of minerals, Al3+ enters the aquatic ecosystems from anthropogenic activities such as waste disposal and the metal-producing industry, and is still widely applied for water treatment as cheap flocculant [44,45,46,47,48]. Aluminum, although not being a heavy metal, is harmful for humans as it is highly cytotoxic since it causes oxidative stress and alters enzymatic activity [48]. Furthermore, Al3+ is toxic for algae, fish, and invertebrates due its acidity [45,49]. Thus, the sufficient removal of these metal ions below a dangerous concentration is still a crucial problem. The adsorption of Al3+ on starch has been reported by Choksi et al. by using AlCl3 at nearly neutral initial pH values of 6.0 to 8.5 [50].
Here, we show the first study on the adsorption of Al2(SO4)3 on different native and oxidized starch samples at pH 4.2 and 3.4 using simulated and real water samples, respectively. We investigated different native starches (i.e., potato starch, corn starch, waxy corn starch, and wheat starch) and oxidized starches (i.e., oxidized potato starch and oxidized corn starch), representing the simplest chemical modification, for the adsorption of Al3+, Cd2+, Pb2+, and SO42− from Al2(SO4)3, CdSO4, and PbSO4 solutions. To compare the adsorption properties of these different starches, we comprehensively characterized the samples by laser diffractometry, SEM-EDX, 1H-NMR, ATR-FTIR spectroscopy, TGA, moisture analysis, and ICP-OES. We compared the adsorption performance of native and oxidized starches for Al3+, Cd2+, Pb2+, and sulfate at concentrations in the lower ppm range. On the basis of the adsorption performance at low concentrations, we further investigated n. potato starch as the best performing native starch for the adsorption of Al3+, Cd2+, and Pb2+ and n. corn starch as a reference, together with the corresponding oxidized starches. The kinetics and adsorption mechanism of the samples were discussed on the basis of the sorption isotherms measured with ICP-OES and further characterized by SEM-EDX imaging and spectroscopy.

2. Materials and Methods

2.1. Materials

Starch samples: Different starch samples, namely, native potato starch (Agrana sample number A4757), native corn starch (Agrana sample number A4758), native waxy corn starch (Agrana sample number A4759), native wheat starch (Agrana sample number A4760), oxidized corn starch (Agrana sample number A4761), and oxidized potato starch (Agrana sample number A4762) were received as powder from AGRANA Research and Innovation Center GmbH, Tulln, Austria. The starch samples were characterized and used without further purification.
For simplification, we have abbreviated the native starches with “n.” and the oxidized starches with “o.” in figures.
Ultrapure water purified by a Milli-Q Advantage A10® system (Millipore, Darmstadt, Germany) (total organic carbon = 5 ppb, resistivity of 18.2 MΩ cm) was used for all experiments.
Heavy metal salts: For the sorption experiments, PbSO4 (98%) (Sigma-Aldrich, München, Germany), CdSO4 · H2O (p.a.) (Merck, Darmstadt, Germany), and Al2(SO4)3 (p.a.) (Sigma-Aldrich, München, Germany) were used as received without further purification.
ICP-OES standard solutions: For the ICP-OES measurements, the following standards were used: 10,008 mg/L Pb in 5 wt % HNO3 (Sigma-Aldrich, München, Germany), 10,000 mg/L Cd in 2 mol/L HNO3 (Bernd Kraft, Duisburg, Germany), 10,000 mg/L Al in 2 mol/L HNO3 (Bernd Kraft, Duisburg, Germany), 10,000 mg/L P in water (Bernd Kraft, Duisburg, Germany), 9998 mg/L S in water (Sigma-Aldrich, München, Germany), 10,000 mg/L Ca in 4 wt % HNO3 (CPI International, Santa Rosa, CA, USA), 10,000 mg/L Na in 3 wt % HNO3 (CPI International, Santa Rosa, CA, USA), 10,000 mg/L K in 1 wt % HNO3 (CPI International, Santa Rosa, CA, USA), and 10,000 mg/L Si in H2O (CPI International, Santa Rosa, CA, USA).

2.2. Methods

Charge density was measured with the particle charge detector MÜTEK PCD-04 from the company BTG Instruments GmbH in Wessling, Germany. A total of 25 g of the starch samples were added to 500 mL of ultrapure water. The pH of the dispersion was then adjusted with 0.1 m/L NaOH or 0.1 mol/L HCl solution to reach pH values of 3, 5, and 9. The samples were titrated against a poly(diallyldimethylammonium chloride) (PDADMAC) or a polyethylensulfonate (PES-Na) solution with a concentration of 0.001 mol/L until the point of zero charge was reached. A total of 10 mL of the real water samples were also titrated this way.
Streaming potential vs. pH curves were measured to determine the starch surface charge in dependence of the pH. Moreover, the real water samples were analyzed. The samples were characterized by titration to pH 3 and 9 from the initial pH with the particle charge detector MÜTEK PCD-04 from the company BTG Instruments GmbH. For this purpose, we added 0.5 g of the native starch powders or 0.1 g of the oxidized starch samples to 15 mL of ultrapure water. From the real water samples, 15 mL was measured without dilution. The samples were titrated against a 0.1 m/L NaOH or 0.1 mol/L HCl solution, depending on the desired pH range.
Moisture analysis of the starch samples and the real water samples were carried out at 110 °C with the Halogen Moisture Analyzer HX204 from Mettler Toledo, Gießen, Germany. These results were taken into account for the adsorption experiments.
Solubility determination was carried out by stirring 0.1 g of the respective starch sample in 50 mL of ultrapure water. The suspension was stirred for 24 h at 400 rpm at room temperature. The solubility was visually assessed. Furthermore, the particle size distributions were measured after 0 min and 24 h in water (see particle size measurement).
Scanning electron microscope (SEM): Different samples were analyzed using a SEM Ultra Plus from Carl Zeiss Microscopy GmbH, Oberkochen, Germany. For this purpose, the samples were fixed with double-sided adhesive carbon tape on an aluminum pin sample tray and afterwards streamed with N2 to obtain only a thin layer of particles. The samples were then sputtered with 3 nm of platinum using a Sputter Coater SCD050 from Leica Microsystems, Wetzlar, Germany, before the investigation started. The measurements were carried out with an acceleration voltage of 3 keV at different magnifications.
Scanning electron microscope with energy-dispersive X-ray spectroscopy (SEM-EDX): Different samples were analyzed using a scanning electron microscope (SEM Ultra Plus, Carl Zeiss Microscopy GmbH, Jena, Germany), equipped with an energy-dispersive X-ray spectroscopy detector (EDX XFlash Quad 5060F, Bruker Nano GmbH, Berlin, Germany). For the measurement of inorganic impurities, the samples were fixed with double-sided adhesive carbon tape on an aluminum pin sample tray and covered with carbon before the investigation starts. The measurements were carried out with an acceleration voltage of 6 keV at different magnifications. In some instances, for the qualification of trace elements, we measured maximum pixel spectra, as also stated in the respective graphs.
The elemental mapping of the samples after the adsorption experiments by SEM-EDX was carried out using a Phenom XL Workstation from Thermo Scientific (Waltham, USA) with an energy-dispersive X-ray spectroscopy (EDX) detector (Silicon Drift Detector SDD, thermoelectrically cooled (LN2free), 25 mm2 detector active area). The samples were fixed on a double-sided adhesive carbon tape on an aluminum pin sample tray. The measurements were carried out in low-vacuum mode (p = 60 Pa) with an acceleration voltage of 15 keV at different magnifications.
ATR-FTIR spectra were acquired with a Tensor 27 device equipped with a Platinum ATR module, both from Bruker Corporation, Billerica, MA, USA. The samples were measured in dry state with a resolution of 2 cm−1 and with 100 scans.
The particle size distributions of the dispersed particles in ultrapure water were determined with the Mastersizer Microplus device from Malvern Panalytical GmbH, Kassel Germany. For the measurements without swelling time, the dry particles were directly added into the dispersion chamber and subsequently measured. For the measurement of the particles in swollen state, 5 g of the starch samples were placed in 100 mL water and were allowed to swell for 24 h under stirring. Afterwards, they were added to the dispersion chamber and subsequently measured. For evaluation, the 5OFD model was chosen, with 1.5295 as the refractive index of starch, 0.01 as absorption value for starch, and 1.33 as refractive index of water.
In dry state, the particle sizes were measured using the device BlueWave from Microtrac, Meerbusch, Germany. As a model, aspherical particles were assumed and 1.5295 was taken as refractive index.
Elemental analysis was carried out using a vario MICRO cube from the company Elementar, Langenselbold, Germany.
Nitrogen sorption measurements were performed using the Autosorb iQ MP from Quantachrome Instruments (Boynton Beach, FL, USA). First, the samples were dried in a vacuum oven at 100 °C. The samples were activated by degassing in vacuum (5 × 10⁻¹⁰ mbar) at 90 °C. The nitrogen sorption measurements were performed at 77 K.
Carbon dioxide sorption measurements were performed using the Autosorb iQ MP from Quantachrome Instruments (Boynton Beach, FL, USA). First, the samples were dried in a vacuum oven at 100 °C. The samples were activated by degassing in vacuum (5 × 10⁻¹⁰ mbar) at 90 °C. The carbon dioxide sorption measurements were performed at 273 K.
Inductively Coupled Plasma Optical Emission Spectrometry (ICP-OES) (iCAP 7400 from Thermo Scientific, Waltham, MA, USA) was used to determine
  • the heavy metal ion and sulfate ion concentrations in simulated wastewater. Thus, 5 standards were used: Standard 1: S (100 mg/L); Standard 2: Pb, Al, Cd, and S (each 50 mg/L), Standard 3: Pb, Al, Cd, and S (each 10 mg/L), Standard 4: Pb, Al, Cd, and S (each 5 mg/L), Standard 5: Pb, Al, Cd, and S (each 1 mg/L), Standard 6: Pb, Al, Cd, and S (each 0.5 mg/L). Each standard contained 4 wt % HNO3. To each sample of 8 mL, we added 2 mL of 20 wt % nitric acid prior to analysis. From the threefold measurement of all standards, we constructed a calibration curve. All samples were measured three times. The detection limits in the measurement solutions were given with 0.05 mg/L Al, 0.01 mg/L Cd, 0.05 mg/L Pb, and 0.06 mg/L S.
  • potential inorganic impurities in the starch samples. First, 100 mg of each sample was digested by 3.5 mL 5 M HNO3 and 0.5 mL 30 wt % H2O2 in a 10 mL microwave vessel using a Discover SP microwave oven (CEM Corporation, Matthews, NC, USA) in a two-step dynamic, pressurized process (first step: 50 W max./85 °C max./17 bar max./5 min/high magnetic stirring; depressurizing; second step: 100 W max./100 °C max./17 bar max./5 min/high magnetic stirring) (modified method from Gonzalez et. al. [51]). Afterwards, the sample was quantitatively transferred into a 50 mL measuring flask with water and filled up to a total volume of 50 mL. The sample was shaken for 24 h. To each ICP-OES sample of 8 mL, we added 2 mL of 12 wt % HNO3. The following standards were used: Standard 1: Ca, Na, K, S, P, and Si (each 500 mg/L); Standard 2: Ca, Na, K, S, P, and Si (each 100 mg/L); Standard 3: Ca, Na, K, S, P, and Si (each 50 mg/L); Standard 4: Ca, Na, K, S, P, and Si (each 10 mg/L); Standard 1: Ca, Na, K, S, P, and Si (each 5 mg/L); Standard 5: Ca, Na, K, S, P, and Si (each 1 mg/L). Each standard contained 4 wt % HNO3. From the threefold measurement of all standards, we constructed a calibration curve. All samples were measured three times. The given detection limits were calculated by the software QtegraTM from Thermo Scientific, Waltham, MA, USA. The detection limits in the measurement solutions were given with 0.05 mg/L Ca, 0.09 mg/L Na, 0.55 mg/L K, 0.14 mg/L S, 0.05 mg/L P, and 0.03 mg/L for Si.
Of the many measured wavelengths, the ones with a low standard deviation and no interferences were chosen.
1H-NMR spectroscopy was conducted by using the device Avance III 500 from Bruker Corporation, Billerica, MA, USA, at 500 MHz and 25 °C. A total of 10 mg of the starch samples was added to a mixture of 0.5 mL deuterated dimethyl sulfoxide (DMSO-d6) (99.5 atom % deuterated) from Sigma-Aldrich, München, Germany, and 0.12 mL D2O (99.98 atom % deuterated) from Chemotrade, Düsseldorf, Germany, and afterwards heated to 90 °C for 15 min.
The branching degree (BD%) was calculated using the equation proposed by Gunilla et al. [52]. Thereby the integral H1 hydrogen from the α-1,6 glycosidic linkage (branching units) is referenced to the total integral of hydrogens from this position including linear (α-1,4 glycosidic linkage = H1(1–4)), branching (H1(1–6)), and terminal (H1(t)) units.
BD % = Integral   H 1 ( 1 6 ) Integral   H 1 ( 1 6 ) +   H 1 ( 1 4 ) +   H 1 ( t ) 100 %
Thermogravimetric analysis (TG) was performed by using the device 1 Star System from Mettler Toledo, Gießen, Germany. The measurements were carried out with approximately 7 to 8 mg of starch in a platinum crucible. The investigated temperature range was from 25 °C to 1000 °C with a heating rate of 10 °C/min under air and N2 atmosphere with a flow rate of 40 mL/min.
pH and conductivity measurements were conducted with the device SevenExcellence™ from Mettler Toledo, Gießen, Germany.

2.3. Adsorption Experiments

2.3.1. Simulated Water Samples

Stock solutions of each heavy metal salt (Al2(SO4)3, CdSO4, or PbSO4) were prepared in 500 mL volumetric flasks with 50 mg/L Al3+, 50 mg/L Cd2+, or 40 mg/L Pb2+, respectively. For the adsorption experiments, these were diluted to targeted metal ion concentrations ranging from 0.1 to 50 mg/L. For PbSO4(aq), solutions with a maximum concentration of 40 mg/L were prepared due to the solubility limit of lead sulfate. The salts were dissolved in ultrapure water. The pH of the resulting solutions was not adjusted. For the adsorption experiments, 100 mg starch was placed into a 50 mL centrifuge tube. Subsequently, 30 mL of the respective heavy metal ion solution was added. The samples were stirred for two hours with a magnetic stirrer. After the centrifugation (11,000 rpm for 8 min), the pH of the supernatant was analyzed. A total of 8 mL of the supernatant was taken and mixed with 2 mL of 20 wt % nitric acid for ICP-OES analysis. To determine the adsorption capacity experimentally with PbSO4, we later used only 10 mg of starch instead of 100 mg due to the limited solubility of PbSO4.

2.3.2. Real Water Samples

Three real water samples were taken from three different spots at the Vincenzgraben in Germany. The pH and the electrical conductivity were measured. For the adsorption experiments, 100 mg starch was placed into a 50 mL centrifuge tube. For the adsorption experiment with water 1, 30 mL of the real water sample was added. The sample was stirred for two hours. For the adsorption experiments with water 2 and water 3, 15 mL ultrapure water was added first. After 24 h, 15 mL of the real water samples was added. The samples were stirred for 24 h with a magnetic stirrer. After the centrifugation (11,000 rpm for 8 min), the pH of all supernatants was analyzed. A total of 8 mL of the supernatants was taken and mixed with 2 mL of 20 wt % nitric acid for ICP-OES analysis.
To evaluate potential errors by contained solids or dissolved organic matter, we processed a control sample containing only the real water sample without starch in the same way as the adsorption samples, which was subsequently analyzed. The initial ion concentration of the unprocessed water sample and the control sample itself were taken as upper and lower error limits, respectively. The mean value of both was taken as the initial concentration for the calculation of the adsorption.

2.4. Theoretical Model

To determine the sorption efficiency of the starches, we detected the concentration of the adsorbed metal ions and sulfate ions in equilibrium by ICP-OES, which was used in Equation (2), where the calculation of the sorption as a percentage can be seen with c0 as the concentration of the respective ion in the initial solution and ceq as the concentration after reaching equilibrium.
adsorption   ( % ) = 100 c 0 c eq c 0
The respective sorption capacity q in equilibrium was calculated as follows:
q eq = ( c 0 c eq ) V L m A
with VL referring to the given volume of the adsorptive solution and mA to the mass of the sorbent material used in the experiment.
To model the sorption process, we used different fitting models, as there were Langmuir (Equation (4) [53], Sips (Equation (5)) [54] and Dubinin-Radushkevich (Equations (6)–(8)) [55] models.
Langmuir model
q eq = Q m K L c eq 1 + K Langmuir c eq
Sips model
q eq = Q m K S c eq n 1 + K S c eq n
Dubinin-Radushkevich model
q eq = Q m exp ( β DR ε 2 )
ε = RT ln ( 1 + 1 c e q )
E ads , DR = 1 2 β DR
KL and KS thereby represent the model equilibrium constants, Qm represents the maximum adsorption capacity, n represents the Sips model exponent, βDR represents the activity coefficient that is related via Equation (8) to the mean free energy of adsorption, and Eads,DR and ε correspond to the Polanyi potential [56,57].

3. Results and Discussion

Starch is a biopolymer that can be obtained from different plants such as root tuber (e.g., potato), corn (e.g., maize (corn) and wheat), and pea. Depending on their origin, the starches can feature different properties and thus diverse adsorption characteristics. Here, we studied the four diverse native starches from potato, corn, waxy corn, and wheat, as well as two oxidized starches from potato and corn (i.e., oxidized potato starch and oxidized corn starch). In particular, we investigated the surface properties utilizing charge density and streaming potential vs. pH curves, supported by the analysis of the chemical composition of the samples via elemental analysis, ATR-FTIR spectroscopy, and thermogravimetric analysis. The morphology of the starch samples was studied using SEM imaging as well as laser diffractometry in dry and wet states, respectively.
For simplification, the native starches are abbreviated with “n.” and the oxidized starches with “o.” in figures.

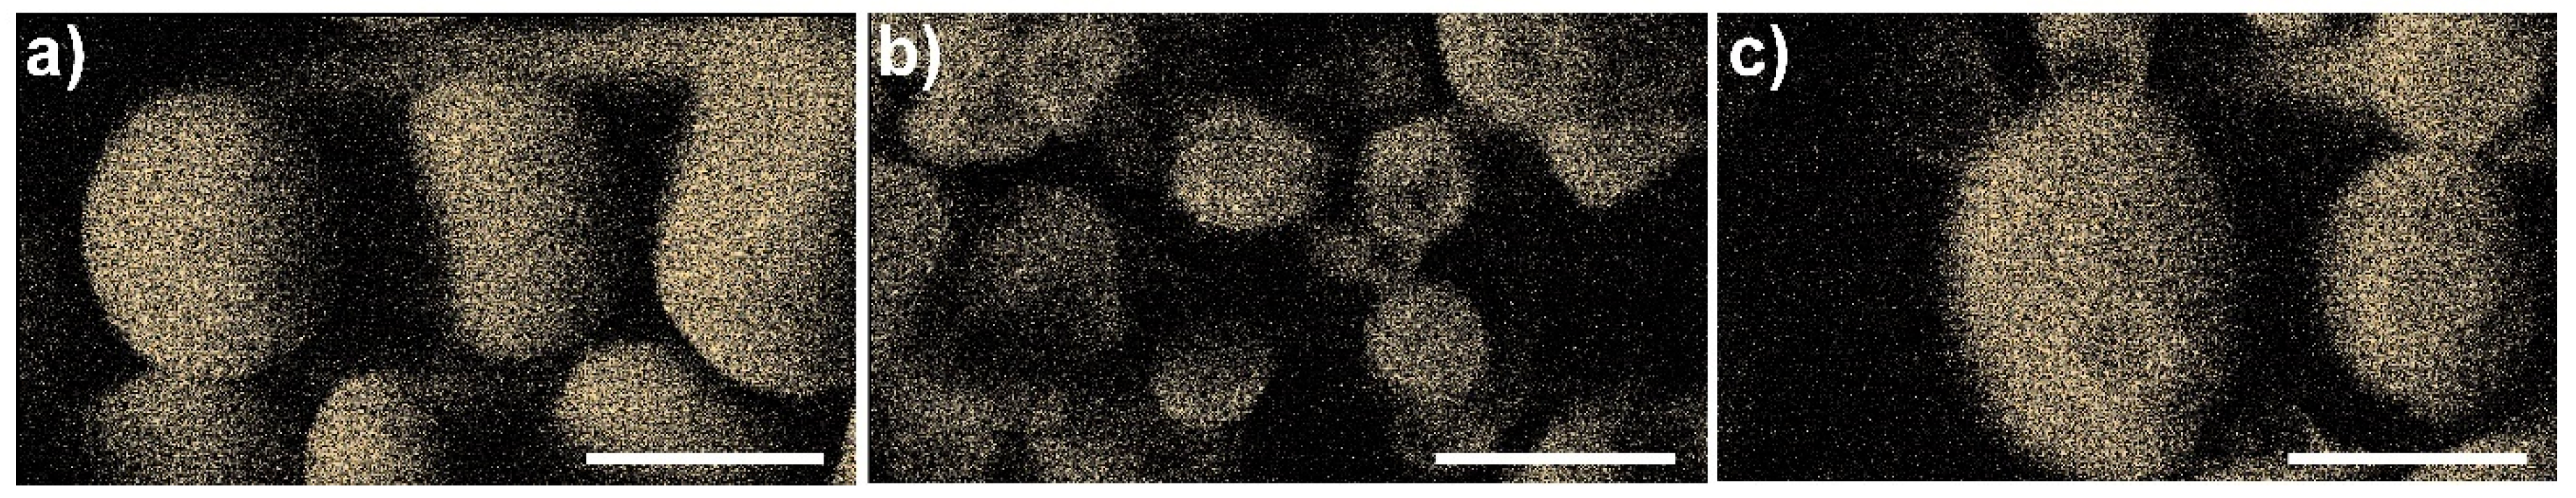
3.1. Characterisation of Starch

The streaming potential and the charge density were measured as a function of pH to determine the functional groups, which can be active for the adsorption process in water treatment applications (see Figure 1). According to the streaming potential vs. pH curves, native corn, waxy corn, and wheat starch were positively charged at pH 3 and showed an isoelectric point (IEP) at pH 4.5, 4.2, and 5.0, respectively. The oxidized corn and potato starch had no IEP exhibiting a negative charge throughout the pH range of 3 to 9, owing to the increased number of carboxyl and hydroxyl groups on the oxidized starch. At the pH of 5, the oxidized starch samples exhibited a significant negative charge density of −8.51 and −27.69 µeq/g for potato and corn starch, respectively (see Figure 1b), whereas the native starches only showed a charge density between −0.29 and −0.28 µeq/g. At pH values of 9, all starch samples featured a negative charge, whereby the oxidized corn starch and the oxidized potato starch in particular showed the highest negative charge densities.
From the relatively high negative charge density of the oxidized corn starch (−14.24 µeq/g at pH = 3), we were able to deduce that this sample exhibited more carboxyl groups than the other samples, as carboxyl groups have the lowest pKa relative to primary and secondary hydroxyl groups. At pH 5 and 9, the high charge densities indicated a higher number of hydroxyl groups than, e.g., oxidized potato starch, as hydroxyl groups are deprotonated in very high pH ranges. The relatively low difference in the charge density of oxidized potato starch between pH = 5 and pH = 9 indicated a relatively lower amount of hydroxyl functions in comparison to oxidized corn starch.
To further determine the chemical composition of the starch samples, we performed elemental analysis (Table 1), ATR-FTIR spectroscopy (Figure 2 and Figure S2, Table S1), and 1H-NMR analysis (Figure 3 and Figure S1, Table 2). From elemental analysis, it is noticeable that no nitrogen was present in the starches, indicating the complete absence of proteins. Besides the measured elements C, H, and N, the starch structure contained a high amount of oxygen as well (see residual Table 2). Furthermore, all starch samples contained moisture, as shown in the moisture analysis in Figure S3.
The FTIR spectra of all six samples are almost congruent, all exhibiting vibration modes consistent with the literature (Figure S2). A detailed annotation is given in Table S1 [58,59,60]. All starches exhibited minor deviations in the intensity of the OH-related peak at 3000–3680 cm−1 (see Figure S2) and the peak at 1643 cm−1 due to varying amounts of residual water [60]. Furthermore, the variation of the peak at 930 cm−1 related to the α-1,4 glycosidic bond indicated different branching degrees, since peaks of α-1,6 glycosidic linkages are typically shifted toward higher wavenumbers [60]. Due to the overlap of the peaks, an accurate quantification of the branching degree was not possible via ATR-FTIR. The oxidized starches showed similar variations in the before mentioned peaks. Additionally, a peak at 1614 cm−1 was visible, which was attributed to the valence C=O mode (Figure 2, marked by an arrow). In consistency with the negative streaming potentials of the starches at low pH values, this indicated the formation of COOH functionalities during the oxidation process. The complementary bands of the COOH functionality were bound to overlap with the existing OH bands.
Similar to the FTIR data, the 1H-NMR spectra of the different starches were mainly congruent (Figure 3). Therefore, the peak assignment was valid for all starches. Following standard numeration procedure, we found that the H-1 hydrogen was coupled to the carbon participating in the α-1,4 (1-4) or α-1,6 (1-6) glycosidic linkage. The peaks of H-1 linked to a linear α-1,4 linkage and of H-1 of terminal (t) glucose units were positioned at 5.08 and 5.04 ppm, respectively [52]. The peak corresponding to the H-1 α-1,6 glycosidic linkage was slightly shifted to lower values to 4.74 ppm. The other ring hydrogen atoms were numbered along the C-chain. The complementary peaks were found at 3.65 ppm (H-3+H-6), 3.57 ppm (H-5), and 3.36 ppm (H-2+H-4) [52]. Since they included the linear, branched, and terminal unit signals, they were comparatively broad.
To determine the branching degree (BD), we used the more separated peaks of H-1 α-1,4 + H-1 (t) and H-1 α-1,6 (Equation (1), compare Figure S1). The calculated BD% are listed in Table 2.
Apparently, the oxidized corn starch had a lower BG than the native corn starch, whilst oxidized potato starch and native potato starch showed an opposite relation. For starch being a biopolymer, deviations in the branching degree can be possible depending on the synthesizing plant and natural circumstances of synthesis. Another possible explanation for the differences of native and oxidized corn starch could be that the oxidization reduced the branching degree by breaking the α-1,6-linkage as amylopectin is more prone to oxidization than amylose [61,62].
The thermogravimetric analysis of the samples under air and nitrogen atmosphere (Figure 4) featured typical behavior for starch samples, as seen in comparable studies [63,64]. In general, the weight loss of starch samples can be attributed to three different stages. Up to 150 °C physical dehydration of adsorbed water can be seen. Around 300 °C, chemical dehydration begins, and above 500 °C, carbonization reactions with transition first to aromatic structures and later to amorphous carbon takes place [63,64]. Under air atmosphere, further degradation to CO2 and H2O occurs. As stated in the literature, thermal decomposition is not affected by the initial water content or crystallinity but by the overall branching degree as amylopectin is retarding decomposition [63,65]. Moreover, functionalization facilitates the thermal degradation around 300 °C [66].
In general, it is visible that both, under air and nitrogen atmosphere, oxidized starches showed a lower stability in the temperature range between 200 °C and 300 °C. This can be attributed to the introduced oxygen functionalities that facilitate the combustion of the starch structure into CO2 and H2O. All samples decomposed completely under air atmosphere at 1000 °C (residuals were between 0 and 2 wt %, which is within the limit of detection). Thus, all samples were purely organic without appreciable amounts of inorganic impurities. Under nitrogen, the starch samples exhibited a final residuum of around 10 to 14 wt %, except for the oxidized potato starch with 21 wt %. This higher residual weight is attributed to an increased formation of amorphous carbon structures, which indicates that with the modification process of the oxidized starch, a significant amount of the carbohydrate ring structure has been opened and reacted to aldehyde functionalities. These enhance the thermal transition to aromatic furan derivatives and therefore increased thermal stability above 500 °C [63]. This is in agreement with the results deduced from charge density measurement. We assume that oxidized potato starch exhibited a higher number of aldehyde groups instead of carboxyl or hydroxyl groups, thus not contributing significantly to the negative charge density and differences of the charge density over pH. In contrast, oxidized corn starch exhibited more carboxylic functionalities that facilitate thermal degradation under N2.
Potential minor inorganic impurities of the starch samples were analyzed by SEM-EDX (see Figures S5–S10b). The chemical mapping of the samples can be seen in Figures S5–S10a in the Supplementary Information. From this investigation, we were able to deduce that all starch samples contained low amounts of impurities, such as Na, Fe, Si, P, S, Cl, K, Ca, and F, whereby most of these elements were not homogeneously distributed over the sample (see Figures S5–S10b). Additionally, in the EDX analysis, the starch was digested by HNO3 and H2O2 under microwave irradiation with a subsequent analysis by ICP-OES for the common elements Na, K, Ca, Si, P, and S. The results are depicted in Table 3. It is noticeable that the starch samples contained different inorganic elements with total amounts between 2.5 and 11.3 mg/g.
Furthermore, the starch samples were also analyzed for their potential micro- or mesoporous structure with nitrogen and carbon dioxide sorption measurements (see Figure S11). As expected, none of the starch samples showed a significant specific surface area or detectable micro- or mesopore structure in dry state.
To investigate the morphology and macroscopic surface properties, we examined the six starch samples using scanning electron microscopy (SEM) (Figure 5). A corresponding particle size distribution in dry state is plotted in Figure S4 in the Supplementary Information. Native corn starch, native waxy corn starch, and the oxidized corn starch featured a more polyhedral shape, while the native potato starch, native wheat starch, and oxidized potato starch exhibited more spherical and oval shapes.
The particle size distribution of the six starch samples as a function of time in ultrapure water was measured by laser diffractometry (see Figure 6). The bimodal progression of the particle size distribution curves indicated the existence of two types of particle sizes: small particles with a diameter between 0.1 and 5 μm and larger ones between 30 and 100 μm. Native corn starch and native wheat starch featured very sharp peaks at around 17 µm and 22 µm, respectively. The particle size did not change after 24 h. Native waxy corn starch also possessed a very sharp peak at 11 µm, whereby after 24 h, an increase in particle size to 17 µm was visible. Native potato starch and oxidized potato starch exhibited both a peak at 48 µm. After 24 h, an increase in particle size caused by swelling was not observed. In contrast, oxidized corn starch possessed a much broader particle size distribution at around 65 µm with a decrease in particle size after 24 h to 19 µm. Furthermore, the second peak at around 0.1 to 3 µm decreased significantly, yielding in particles with diameters around 0.3 µm after 24 h. As shown in the SEM images of the dry samples, the largest particles were observed for n. and o. potato starch, which was in agreement with the particle size distribution curves measured by laser diffractometry. However, the particle sizes measured by laser diffractometry at 0 min for n. waxy corn starch and o. corn starch were relatively large, as well in comparison to the relatively small particles depicted in the SEM images. As shown in the SEM images, the small particles were aggregated to larger ones, yielding in larger particles in the particle size distribution curves. After 24 h stirring in water, the particles sizes were smaller because the particle aggregates were dispersed by stirring featuring the particle sizes of the single particles in solution. The dispersed starch particles in water after 24 h of constant stirring are shown in Figure 7.

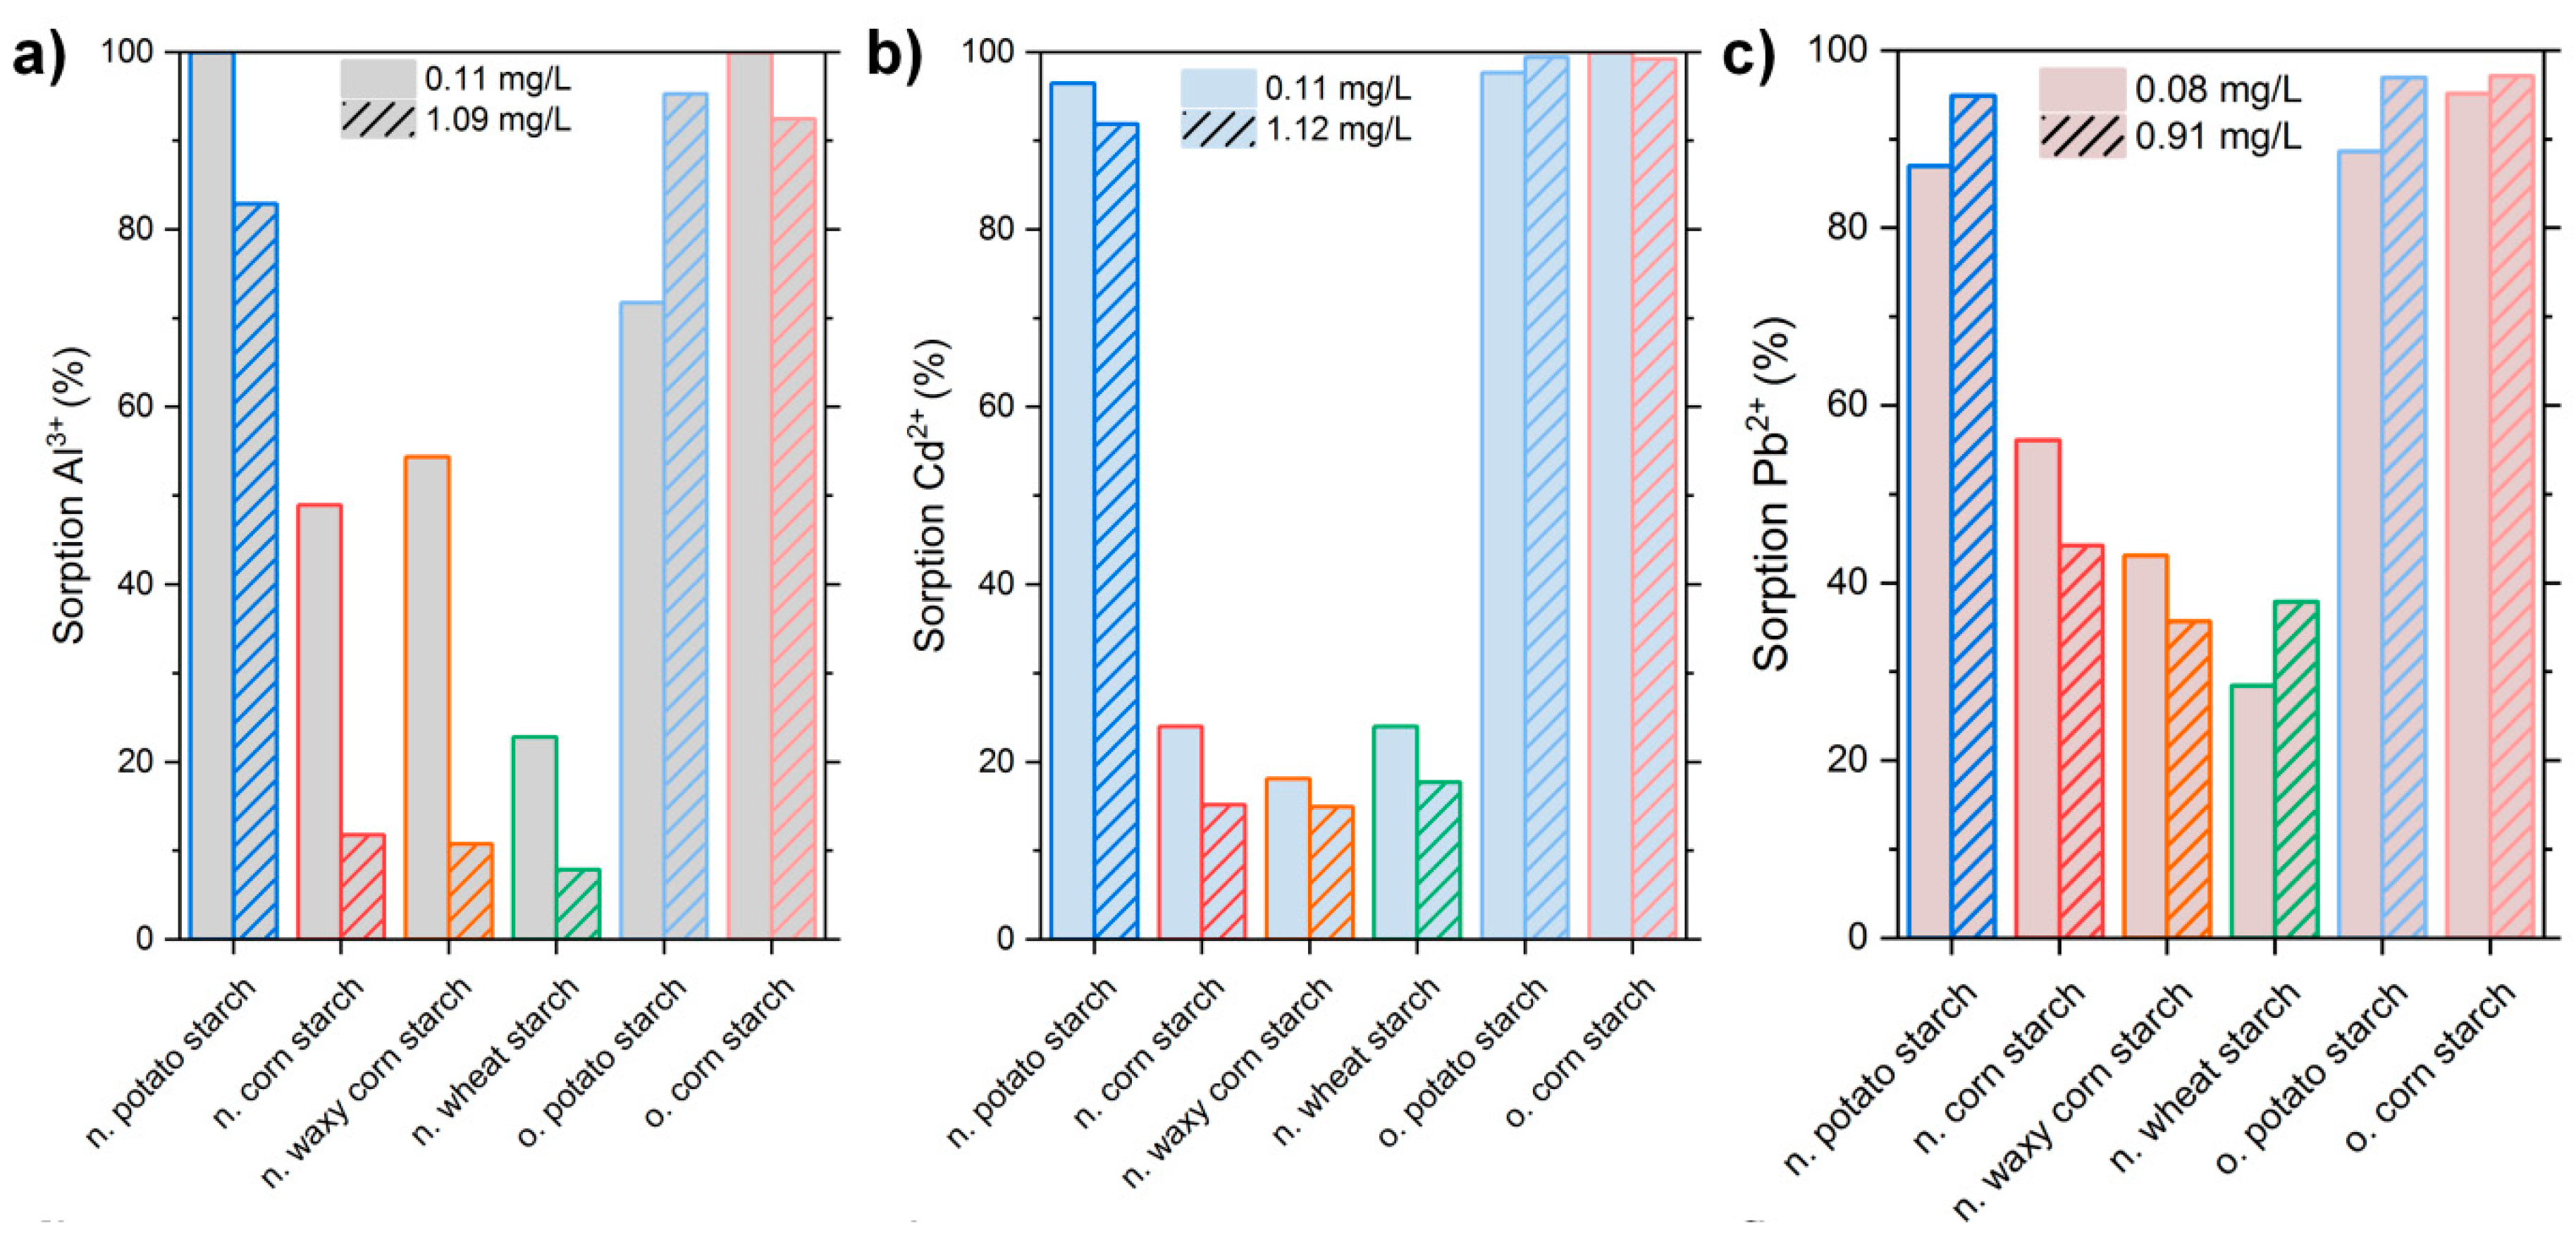
3.2. Low-Concentration Sorption Experiments

Adsorption experiments with the ions of Al3+, Cd2+, and Pb2+ were conducted with all six starch samples in order to evaluate the potential application of starch for wastewater treatment. To reconstruct pollutions in a concentration range of potential real contaminants, we tested concentrations of 0.1 and 1 mg/L of the respective metal ions from the sulfate salt in screening experiments with Al3+, Pb2+, and Cd2+ (Figure 8). Native potato starch, oxidized potato starch, and oxidized corn starch in particular possessed high adsorption rates with over 80% for Al3+, Cd2+, and Pb2+ for 0.1 and 1 mg/L. For 0.1 mg/L Al3+, native potato starch and oxidized corn starch featured an excellent adsorption rate of 100%. Furthermore, oxidized corn starch achieved a perfect separation of 100% for 0.1 mg/L Cd2+, yielding drinking water quality values below 0.003 mg/L for Cd2+ (related to the limit specified by the WHO) [67]. Hence, both oxidized starches adsorbed around 99% of Cd2+ at 1 mg/L. For Pb2+, a complete removal was not observed, but it is noticeable that the adsorption rate of the native potato and wheat starch as well as for both oxidized starches increased insignificantly with increasing initial concentration from 0.1 to 1 mg/L. The excellent adsorption properties of native potato starch and both oxidized starches for Al3+, Cd2+, and Pb2+ were in agreement with the zetapotential measurements, featuring a higher charge density in comparison to the other native starch samples (see Figure 1b).
For the adsorption of SO42− ions, the highest percentage separation with around 76% was achieved with native potato starch for the CdSO4 solution with a concentration of 0.1 mg/L Cd2+ (see Figure S15). For starch being negatively charged in the pH range of the respective experiments, the adsorption of negatively charged sulfate species is unusual, and therefore some kind of cooperative mechanism for the adsorption together with the corresponding metal ion could be possible.

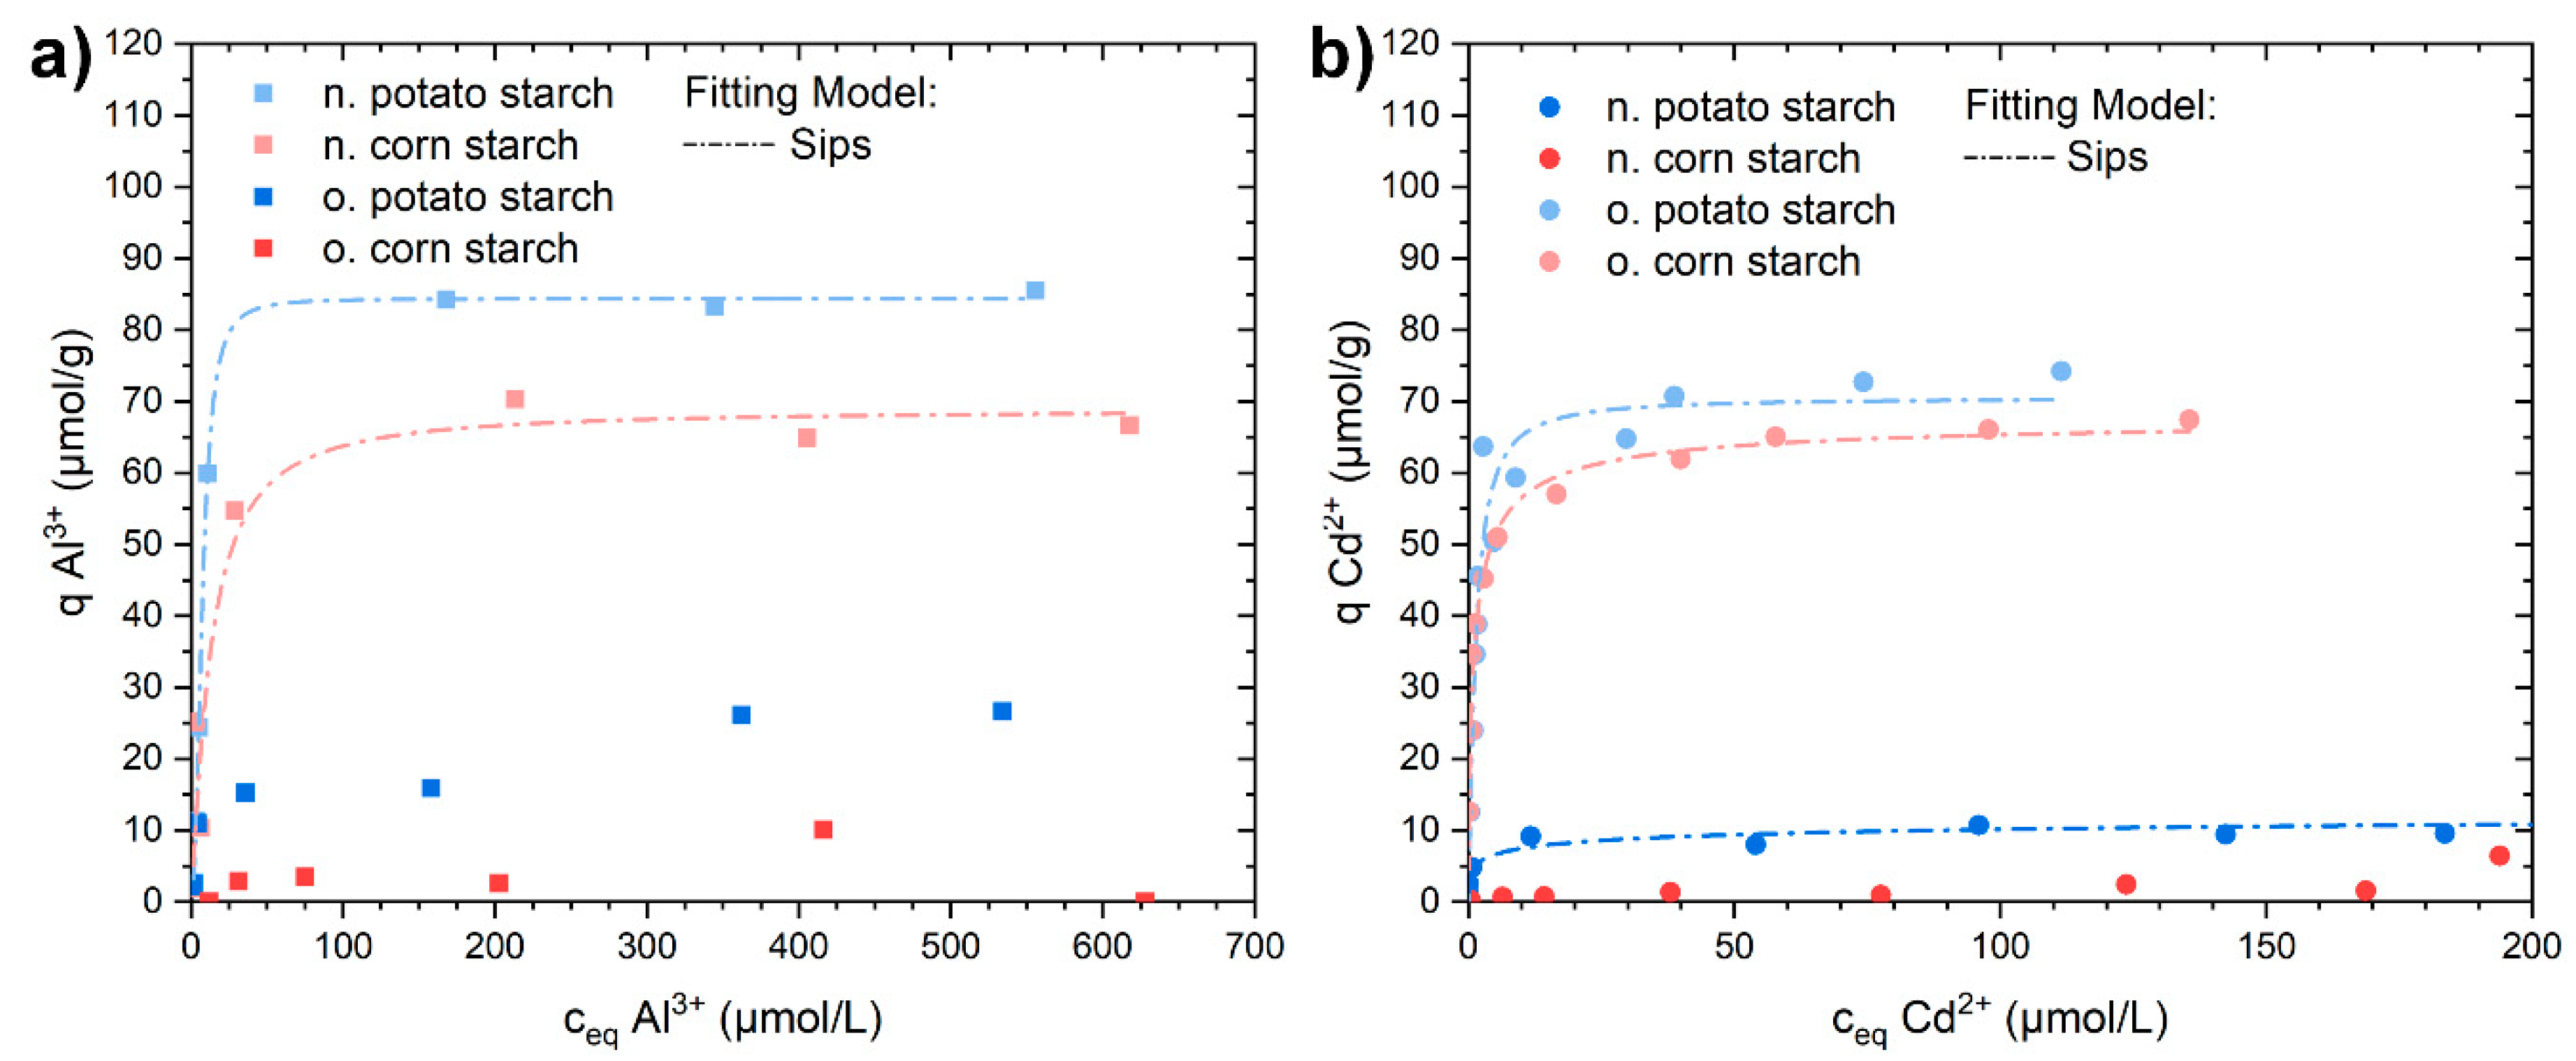
3.3. Sorption Isotherm Experiments with Al3+, Pb2+, and Cd2+

To investigate the adsorption behavior in more detail, we selected the oxidized and native potato and corn starches to analyze the adsorption isotherms for Al2(SO4)3(aq), CdSO4(aq), and PbSO4(aq). The obtained adsorption isotherms were fitted with the respective adsorption isotherm models to obtain insights into the adsorption process. The decision to the respective models was made upon the coefficient of determination (COD) R2. The corresponding equations to the models used can be seen in Section 2.4, and a comparison of different fits is shown in Figures S22–S25.
In Figure 9, the adsorption isotherms for Al2(SO4)3 solutions are shown, featuring a very high adsorption rate for both oxidized starches for initial concentrations of Al3+ between 40 and 250 µmol/L. The adsorption capacities of the oxidized starches were reached at 74 and 102 µmol/g for oxidized corn and potato starch, respectively. The native starches possessed distinct lower adsorption rates with a maximum experimental adsorption capacity of 10 µmol/g for native corn starch and 27 µmol/g for native potato starch. This trend is in agreement with the preliminary adsorption measurements for 1 mg/L and 0.1 mg/L (for comparison see Figure 8). In experiments with native potato starch and native corn starch, a constant adsorption of sulfate ions in the range of 20% to 40% for concentrations of above 200 µmol/L SO42− can be seen, which is unusual for the also negatively charged starch (see Figure S16a).
As fitting functions, Langmuir, Sips, and Dubinin-Radushkevich were chosen, whereby the derived fitting parameters and coefficient of determination are stated in Table 4. The fitting for the Sips isotherm with the best R2 is given in Figure 9, and the diagram with all three mentioned fits is depicted in Figure S22. Native corn starch exhibited no reasonable converging fit for any model applied due to the generally low adsorption values. Sips isotherm model was in greatest consistency with the data in terms of R2 (R2 = 0.999 for o. potato starch and R2 = 0.916 for o. corn starch). This led to the assumption that the adsorption of Al3+ on starch cannot be described by a simple monolayer process onto a homogeneous surface. Sips isotherm model, as a combination of Freundlich and Langmuir, describes adsorption onto heterogeneous surfaces and second-order processes more efficiently [54,57]. Moreover, the Sips isotherm model exponent n indicates a heterogeneity of the adsorber surface for values above 1 [57,68]. The calculated maximum adsorption capacities from the Sips fittings were also in agreement with the highest experimental adsorption capacities.
The modeling with the Dubinin-Radushkevich isotherm showed values of R2 close to the ones of the Sips model, giving the opportunity to compare among the different samples the derivable mean free energy of adsorption calculated with Equation (8). It is shown that the values for Eads increased from native potato starch over oxidized corn starch to oxidized potato starch. All values were below 8 kJ/mol, therefore indicating physisorption.
In Figure 9b, the adsorption capacity of Cd2+ from CdSO4 solution is presented. Up to an initial concentration of 215 µmol/L, the oxidized starches featured an excellent adsorption rate with almost complete Cd2+ adsorption. In comparison, the native potato starch showed high adsorption rates for Cd2+ at low initial concentrations up to 13 µmol/L. The adsorption isotherms of native potato starch, oxidized corn starch, and oxidized potato starch were fitted with Langmuir, Sips, and Dubinin-Radushkevich models. The curves and fitting parameters of these three models for native potato starch, oxidized potato starch, and oxidized corn starch are given in Table 5 and Figure S23. The isotherm fitting with Sips model showed the highest values for R2 for the adsorption of Cd2+ yielding in the best fitting model (see Figure 9b). In general, the calculated maximum adsorption capacities (15 µmol Cd2+/g native potato starch, 71 µmol Cd2+/g oxidized potato starch, 68 µmol Cd2+/g oxidized corn starch) were consistent with the maximum experimental adsorption capacities. In comparison, the mean free energy values for the adsorption onto the different starch samples derived from the Dubinin-Radushkevich model showed almost equal values among the different starches. This indicates a similar affinity of the different starches toward Cd2+, although exhibiting different maximum adsorption capacities. Thus, this can be explained by differing heterogeneous distributions with different amounts of accessible active sites on the surface of the starch samples.
After the adsorption experiment, the starch samples were rinsed with ultrapure water and subsequently investigated using SEM-EDX analysis with elemental mapping (Figure 10). The adsorption of Cd2+ occurred homogeneously among the surface of the starch samples. This is in agreement with the viable and relatively similar coefficient of determination derived from Langmuir and Sips adsorption models. The amounts of Cd2+ on native corn starch were below the detection limit in EDX, which was also in agreement with the lowest adsorption efficiency among the different starch samples.
Additionally, the adsorption of Pb2+ from PbSO4 solution onto the native and oxidized potato and corn starches was investigated, and the results are depicted in Figure 11. Due to the low solubility of PbSO4, the maximum tested Pb2+ concentration was 190 µmol/L. Within the complete range of concentrations, the oxidized starches showed a very high adsorption rate for Pb2+ of > 97%. As shown in Figure 11a, no plateau was obtained for the oxidized starches. The n. potato starch showed high adsorption values for Pb2+ concentrations between 0.3 and 19 µmol/L (84–100%). Native corn starch exhibited an overall lower adsorption efficiency, as expected from the results shown in Section 3.2. The highest experimental adsorption capacities among the respective isotherms of native potato and corn starch were 15.0 and 5.5 µmol/g, respectively. For the native starches, different fitting models could be applied. The fitting parameters are presented in Table 6 and the Sips isotherm fit is shown in Figure 11a featuring the highest R2 value among all tested models.

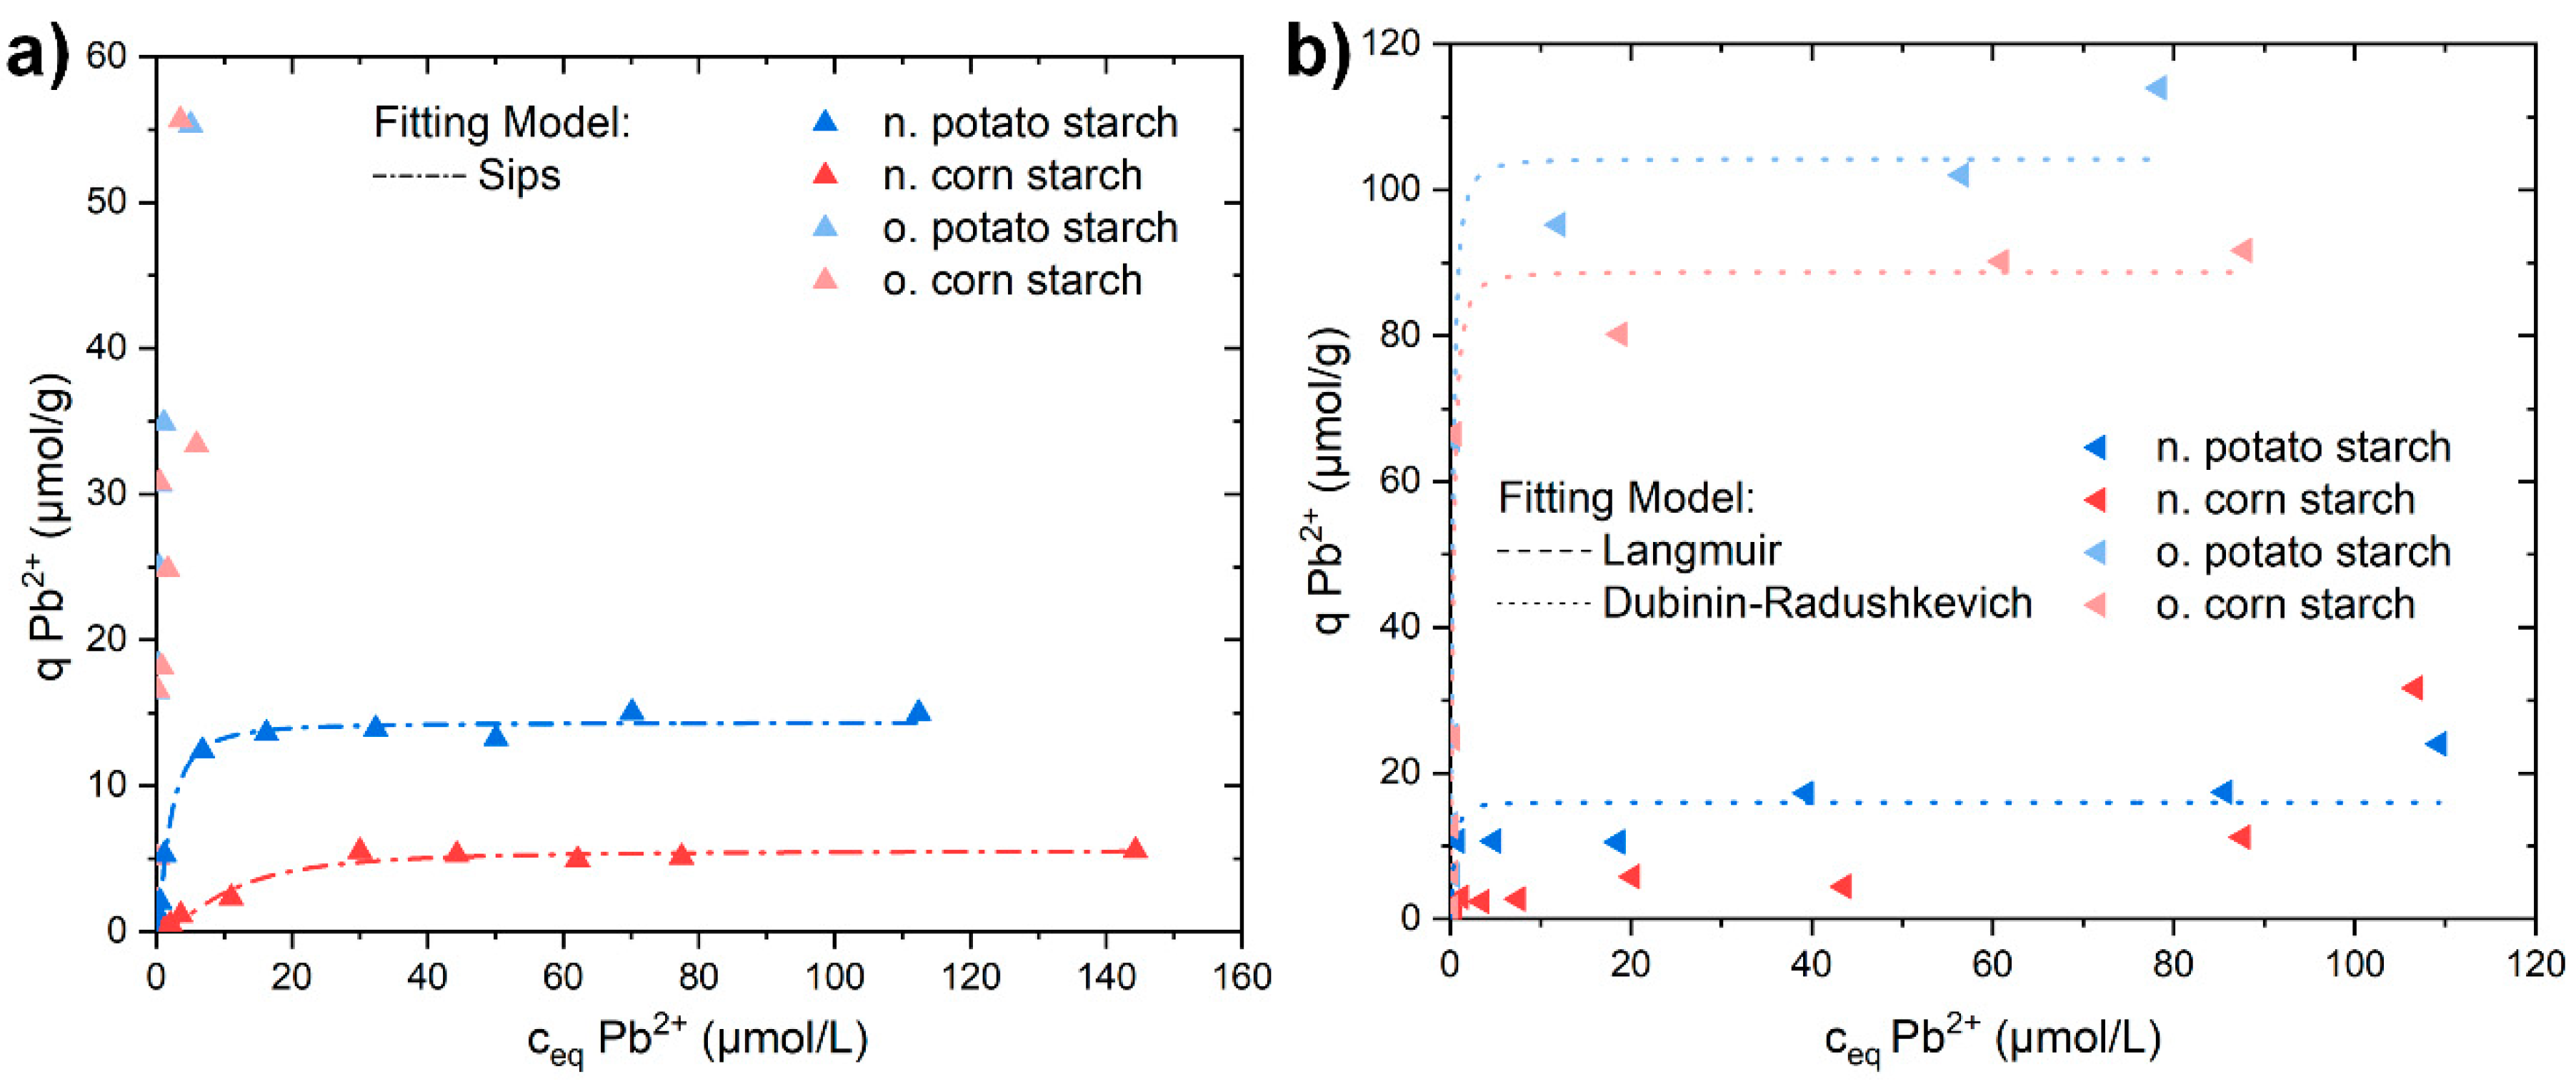
3.4. Pb2+ Batch Adsorption Experiments with Decreased Adsorbent Dose

To determine an adsorption capacity of the oxidized starch samples for the Pb2+ adsorption from PbSO4 solution, we carried out further batch adsorption experiments, using only 10 wt % of the originally 100 mg adsorber material. The results for these adsorption isotherms are presented in Figure 11b. Up to a concentration of 22 µmol/L, the oxidized starches exhibited an excellent adsorption with adsorption rates above 96%. The presented adsorption curves showed maximum experimental adsorption capacities of 113 and 92 µmol/g for oxidized potato starch and oxidized corn starch, respectively. The fittings of the adsorption isotherms were performed using the Dubinin-Radushkevich model (see Figure 11b) (for fitting parameters see Table 7). Sips model gave no reasonable fitting for all isotherms. The coefficients of determination R2 for the respective Langmuir and Dubinin-Radushkevich models were relatively similar, whereby native potato starch showed better fitting with the Langmuir model and the oxidized starches with the Dubinin-Radushkevich model.
Native potato starch exhibited a similar adsorption capacity as in the experiment before, confirming the obtained plateau in the experiments presented before (Figure 11a). For the oxidized potato and corn starch, maximum adsorption capacities of 106 and 90 µmol/g were derived, respectively. With the increasing adsorption capacity in the order of native potato starch < oxidized corn starch < oxidized potato starch, the free energy of adsorption was found to be increasing too. Therefore, it can be concluded that oxidized potato starch exhibited the strongest adsorption interaction toward Pb2+.
The samples of the adsorption experiments treated with the highest Pb2+ concentrations were rinsed with ultrapure water and subsequently dried for investigation with SEM-EDX (Figure 12). For all the starches, a clustering of very high Pb2+ concentration occurred, indicating both a heterogeneous surface with potentially monolayer adsorption onto less active sites and a multilayer adsorption onto distinctive spots on the surface. These spots mainly featured low amounts of S in addition to the high amounts of Pb in the energy-dispersed spectra (see Figures S20 and S21, Tables S2 and S3).
Oxidized potato starch featured the highest adsorption capacities for Pb2+, Cd2+, and Al3+. In particular, the amount of aldehyde groups contributed to its very good adsorption performance. Oxidized corn starch also possessed relatively high adsorption capacities. The lower adsorption capacity compared to the oxidized potato starch could have been due to the higher pH dependency of the carboxylic group. In general, native potato starch and native corn starch featured a lower charge density and a lower number of functional groups. Thus, in comparison to the oxidized starches, both native starches exhibited lower maximum adsorption capacities. Among the native starch samples, native potato starch possessed the highest adsorption capacities with 23 µmol Al3+/g, 15 µmol Cd2+/g, and 17 µmol Pb2+/g. Furthermore, the already improved adsorption properties of the native potato starch in comparison to the other native starches might have also had an influence on the high adsorption capacities of the oxidized potato starch. Additionally, native potato starch and the oxidized starches showed very good adsorption rates for the lower concentrations in the ppm range.
The achieved maximum adsorption capacities were compared with the literature (see Supplementary Information, Tables S4–S6). The oxidized starch samples surpassed most of the abundantly available, unmodified bioadsorbers such as algae or bacteria. For the first time, we successfully present the adsorption of Al3+ onto native and oxidized starches in acidic pH range.

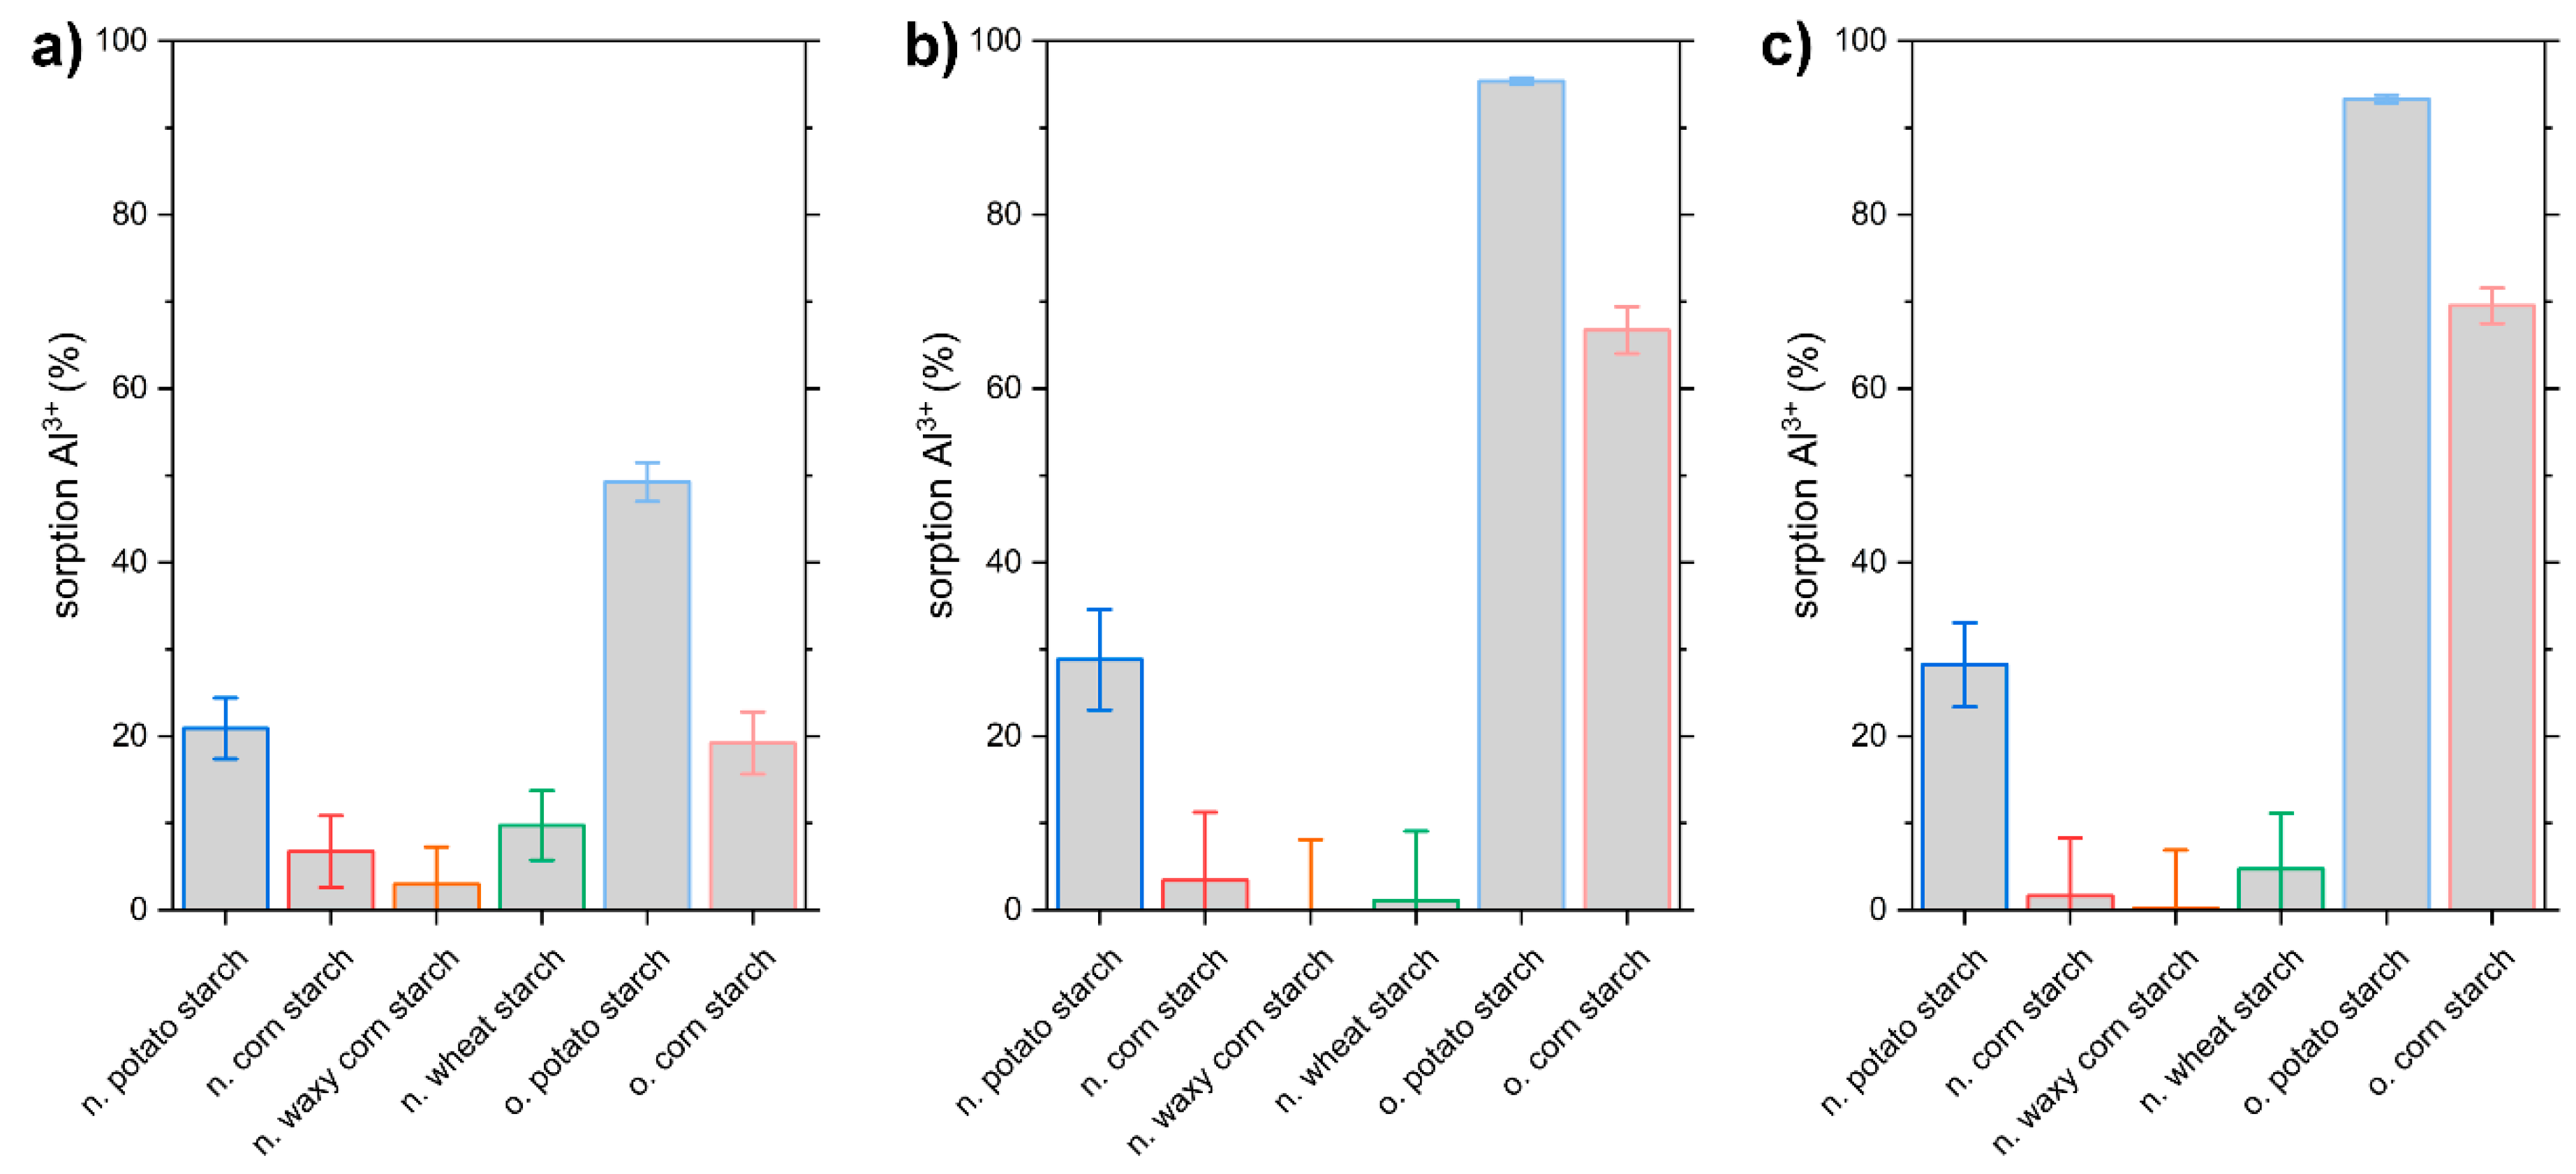
3.5. Al3+ Sorption Experiments with Real Water Samples

To simulate natural conditions, we considered testing surface water to evaluate the starch absorption ability of metal ions. The three investigated real water samples were first analyzed with ICP-OES, pH, and conductivity measurements (see Table 8 and Figures S26 and S27). All three real water samples contained elevated levels of Al3+ and very low levels of Pb2+ (see Table 8). Only the adsorption of Al3+ is discussed, as the very low initial concentration of Pb2+ (and Cd2+ in water 1) is prone to errors, especially under non-ideal conditions such as in real water samples. Furthermore, these samples also contained a considerable amount of sulfate, which exceeded the German Drinking Water ordinance limit for sulfate (250 mg/L; [69]) up to a factor of 1.6. Additionally, the samples exhibited highly acidic pH values between 3.4 and 3.8 (see Figures S28–S30).
In all cases, the adsorption of the positively charged Al3+ was successful, while the adsorption performance of the negatively charged starch toward sulfate ions were negligible as expected from the experiments with simulated water (see Figure S28). Figure 13 shows the results of Al3+ adsorption onto the six diverse starch samples. Even under these non-laboratory conditions, the results showed viable separation of Al3+ from the water. As the real water samples also contained solid materials, other competitive ions (e.g., Cu2+, Fe2+/3+, Mnn+, PO43−), and dissolved organic matter, a decreased adsorption rate compared to the simulated wastewaters seems reasonable. The native potato starch adsorbed 21% of Al3+ (Figure 13a), which was lower than in the adsorption from simulated waters (83% from 1 mg/L Al3+). For the oxidized corn starch, a similar trend was visible: Its adsorption performance decreased from 92% of the initial 1 mg/L Al3+ in the simulated water to 19% in the real water experiment (Figure 13a). This could have been due to other competing ions and the lower initial pH0 of 3.4 in the real water samples vs. an initial pH of 7.4 in the laboratory conditions (see Figure S27) sites. Especially in the case of oxidized corn starch, this acidic pH decreased the deprotonation of carboxylic groups, leading to a lower charge density (see Figure 1b) and adsorption performance.
In general, the adsorption rates for the six investigated starches obtained for the real water samples confirmed the results from the simulated water experiments. Except for n. potato starch, the native starches showed negligible adsorption rates for Al3+. Furthermore, similar to the simulated water, o. potato starch featured the highest adsorption rates among all six starches. Thus, we proved a successful adsorption process with real water samples, despite many other substances, which were present in the real water samples and the significantly lower initial pH value. Especially oxidized potato starch with its aldehyde and keto groups featured excellent Al3+ removal that was independent of the initial pH.

4. Conclusions

In this article, we investigated four different native and two oxidized starch samples with respect to their application as suitable adsorber materials for water treatment. The adsorption performance of all six starch samples for Al3+, Cd2+, and Pb2+ was investigated. The adsorption rates for the four diverse native starches featured significant differences showing a distinct improved adsorption performance for all three metal ions (Al3+, Cd2+, and Pb2+) for n. potato starch. Particular effort was devoted to the low concentration regions, which are important for the management of water quality. Furthermore, we are the first to report on the adsorption of Al3+ on starch samples in an acidic pH range. Both oxidized starches and native potato starch featured excellent adsorption properties, especially in the low concentration ranges, and therefore are potential viable adsorber materials for Al3+, Cd2+, and Pb2+. Furthermore, oxidized starches outperformed the native starches, especially at higher pollutant concentrations. Nonetheless, due to their low cost, also native starches such as, e.g., the here-presented potato starch can be applied to improve water quality of aquatic ecosystems or natural water reservoirs due to their high adsorption rates in low concentration regions, their low cost, and their natural abundance. Oxidized potato starch systematically featured the highest adsorption rates and capacities for all three metal ions among the investigated starches. The improved adsorption performance of o. potato starch in comparison to o. corn starch might have been due to the already good properties and adsorption rates of the native potato starch, relative to the other native starch samples.

Supplementary Materials

The following are available online at https://www.mdpi.com/article/10.3390/polysaccharides2020027/s1, Figure S1. Integrals of H1 (α 1,4) + H1 (t) and H1 (α 1,6) from oxidized potato starch. Figure S2. ATR-FTIR spectra of the solid native potato starch (blue), native corn starch (red), native waxy corn starch (orange), native wheat starch (green), oxidized potato starch (light blue), and oxidized corn starch (pink). Figure S3. Moisture analysis of the samples carried out at 150 °C. Figure S4. Particle size distribution of the starch samples in dry state. Figure S5. (a) SEM images and SEM-EDX elemental mappings from native potato starch; (b) sum spectrum (blue) and maximum pixel spectrum (red). Figure S6. (a) SEM images and SEM-EDX elemental mappings from native corn starch; (b) sum spectrum (blue) and maximum pixel spectrum (red). Figure S7. (a) SEM images and SEM-EDX elemental mappings from native waxy corn starch; (b) sum spectrum (blue) and as maximum pixel spectrum (red). Figure S8. (a) SEM images and SEM-EDX elemental mappings from native wheat starch; (b) sum spectrum (blue) and maximum pixel spectrum (red). Figure S9. (a) SEM images and SEM-EDX elemental mappings from oxidized potato starch; (b) sum spectrum (blue) and maximum pixel spectrum (red). Figure S10. (a) SEM images and SEM-EDX elemental mappings from oxidized corn starch; (b) sum spectrum (blue) and maximum pixel spectrum (red). Figure S11. (a) Nitrogen sorption isotherms at 77 K and (b) carbon dioxide sorption isotherms at 273 K of native potato starch (blue), native corn starch (red), native waxy corn starch (orange), native wheat starch (green), oxidized potato starch (light blue), and oxidized corn starch (pink). Figure S12. pH values for the experiments with Al2(SO4)3 solution of 0.11 mg/L and 1.09 mg/L Al3+ before (pH0) and after (pHeq) the adsorption process of native potato starch (blue), native corn starch (red), native waxy corn starch (orange), native wheat starch (green), oxidized potato starch (light blue), and oxidized corn starch (pink). pH0 corresponds to the pH value of the adsorptive solution before the experiment and pHeq corresponds to the pH value after the adsorption process. Figure S13. pH values for the experiments with CdSO4 solution of 0.11 mg/L and 1.12 mg/L Cd2+ before (pH0) and after (pHeq) the adsorption process of native potato starch (blue), native corn starch (red), native waxy corn starch (orange), native wheat starch (green), oxidized potato starch (light blue), and oxidized corn starch (pink). pH0 corresponds to the pH value of the adsorptive solution before the experiment and pHeq corresponds to the pH value after the adsorption process. Figure S14. pH values for the experiments with PbSO4 solution of 0.08 mg/L and 0.91 mg/L Pb2+ before (pH0) and after (pHeq) the adsorption process of native potato starch (blue), native corn starch (red), native waxy corn starch (orange), native wheat starch (green), oxidized potato starch (light blue), and oxidized corn starch (pink). pH0 corresponds to the pH value of the adsorptive solution before the experiment and pHeq corresponds to the pH value after the adsorption process. Figure S15. Percentage adsorption of SO42− ions from (a) Al2(SO4)3 adsorption experiments with an initial concentration of aluminum ions of 0.11 mg/L (solid) and 1.09 mg/L (striped); (b) CdSO4 adsorption experiments with an initial concentration of cadmium ions of 0.11 mg/L (solid) and 1.12 mg/L (striped); (c) PbSO4 adsorption experiments with an initial concentration of lead ions of 0.08 mg/L (solid) and 0.91 mg/L (striped) onto native potato starch (blue), native corn starch (red), native waxy corn starch (orange), native wheat starch (green), oxidized potato starch (light blue), and oxidized corn starch (pink) in screening experiments with Al3+, Pb2+, and Cd2+. Figure S16. (a) SO42− percentage adsorption and (b) corresponding pH0 and pHeq values from adsorption of Al2(SO4)3 solution onto the starch samples with native potato starch (blue), native corn starch (red), oxidized potato starch (light blue), and oxidized corn starch (pink). pH0 (black) corresponds to the pH value of the adsorptive solution before the experiment and pHeq corresponds to the pH value after the adsorption process. Figure S17. (a) SO42− percentage adsorption and (b) corresponding pH0 and pHeq values from adsorption of CdSO4 solution onto the starch samples with native potato starch (blue), native corn starch (red), oxidized potato starch (light blue), and oxidized corn starch (pink). pH0 (black) corresponds to the pH value of the adsorptive solution before the experiment and pHeq corresponds to the pH value after the adsorption process. Figure S18. (a) SO42− percentage adsorption and (b) corresponding pH0 and pHeq values from adsorption of PbSO4 solution onto the starch samples with native potato starch (blue), native corn starch (red), oxidized potato starch (light blue), and oxidized corn starch (pink). pH0 (black) corresponds to the pH value of the adsorptive solution before the experiment and pHeq corresponds to the pH value after the adsorption process. Figure S19. (a) SO42− percentage adsorption and (b) corresponding pH0 and pHeq values from adsorption of PbSO4 solution onto 10 mg of the starch samples with native potato starch (blue), native corn starch (red), oxidized potato starch (light blue), and oxidized corn starch (pink). pH0 (black) corresponds to the pH value of the adsorptive solution before the experiment and pHeq corresponds to the pH value after the adsorption process. Figure S20. SEM image of oxidized potato starch (10 mg/30 mL adsorbent dose) after adsorption experiment with PbSO4 solution at 1000-fold magnification with the location of the following spot analysis by EDS. Figure S21. SEM image of oxidized corn starch (10 mg/30 mL adsorbent dose) after adsorption experiment with PbSO4 solution at 1000-fold magnification with the location of the following spot analysis by EDS. Figure S22. Comparison of isotherms fitted for the Langmuir, Sips, and Dubinin-Radushkevich models for the adsorption of Al3+ from Al2(SO4)3 solution with native potato starch (blue), oxidized potato starch (light blue), and oxidized corn starch (pink). Native corn starch (red) did not exhibit a viable fitting for the above-mentioned models. Figure S23. Comparison of isotherms fitted for the Langmuir, Sips, and Dubinin-Radushkevich models for the adsorption of Cd2+ from CdSO4 solution with native potato starch (blue), oxidized potato starch (light blue), and oxidized corn starch (pink). Native corn starch (red) did not exhibit a viable fitting for the above-mentioned models (R2 < 0.7). Figure S24. Comparison of isotherms fitted for the Langmuir, Sips, and Dubinin-Radushkevich models for the adsorption of Pb2+ from PbSO4 solution with adsorbent doses of 100 mg/30mL of the respective starch. Native potato starch is shown in blue and native corn starch in red. Oxidized corn starch (pink) and oxidized potato starch (light blue) were not fitted due to not reaching a plateau. Figure S25. Comparison of isotherms fitted for the Langmuir and Dubinin-Radushkevich models for the adsorption of Pb2+ from PbSO4 solution with decreased amounts (10 mg each) of native potato starch (blue), oxidized potato starch (light blue), and oxidized corn starch (pink). Native corn starch (red) did not exhibit a viable fitting for the above-mentioned models. Figure S26. (a) Streaming potential vs. pH curves and (b) charge densities at pH value of 3.6 of water 2 (brown) and water 3 (red). Figure S27. (a) pH values for the water samples with water 2 is shown in brown and water 3 is shown in red; (b) solid content in percentage in water 2 and water 3; (c) electrical conductivity of water 2 and 3. Figure S28. pH0 and pHeq values from adsorption of Al3+ onto the starch samples in real water 1 with native potato starch (blue), native corn starch (red), oxidized potato starch (light blue), and oxidized corn starch (pink). pH0 corresponds to the pH value of the adsorptive solution before the experiment and pHeq corresponds to the pH value after the adsorption process. Figure S29. pH0 and pHeq values from adsorption of Al3+ onto the starch samples in real water 2 with native potato starch (blue), native corn starch (red), oxidized potato starch (light blue), and oxidized corn starch (pink). pH0 corresponds to the pH value of the adsorptive solution before the experiment and pHeq corresponds to the pH value after the adsorption process. Figure S30. pH0 and pHeq values from adsorption of Al3+ onto the starch samples in real water 3 with native potato starch (blue), native corn starch (red), oxidized potato starch (light blue), and oxidized corn starch (pink). pH0 corresponds to the pH value of the adsorptive solution before the experiment, and pHeq corresponds to the pH value after the adsorption process. Figure S31. SO42− percentage adsorption onto the starch samples in real water 1 with native potato starch (blue), native corn starch (red), oxidized potato starch (light blue), and oxidized corn starch (pink). Moreover, for reference, one blind sample without added adsorber material is presented (black and dashed horizontal line). Figure S32. SO42− percentage adsorption onto the starch samples in real water 2 with native potato starch (blue), native corn starch (red), oxidized potato starch (light blue), and oxidized corn starch (pink). Moreover, for reference, one blind sample without added adsorber material is presented (black and dashed horizontal line). Figure S33. SO42− percentage adsorption onto the starch samples in real water 3 with native potato starch (blue), native corn starch (red), oxidized potato starch (light blue), and oxidized corn starch (pink). Moreover, for reference, one blind sample without added adsorber material is presented (black and dashed horizontal line). Table S1. FTIR vibration modes [1,2,3] for the starch samples. Table S2. Relative atomic concentration derived from spot analyses (location in Figure S20) at oxidized potato starch (10 mg/30 mL adsorbent dose) after adsorption experiment with PbSO4 solution. Table S3. Relative atomic concentration derived from spot analyses (location in Figure S21) at oxidized corn starch (10 mg/30 mL adsorbent dose) after adsorption experiment with PbSO4 solution. Table S4. Sorption capacities for removal of Al3+ compounds from aqueous solutions with different sorbent materials and adsorbent doses (a.d.). The obtained sorption capacities from this work were achieved in the batch adsorption experiments. Table S5. Sorption capacities for removal of Cd2+ compounds from aqueous solutions with different sorbent materials and adsorbent doses (a.d.). The obtained sorption capacities from this work were achieved in the batch adsorption experiments. Table S6. Sorption capacities for removal of Pb2+ compounds from aqueous solutions with different sorbent materials and adsorbent doses (a.d.). The obtained sorption capacities from this work were achieved in the batch adsorption experiments.

Author Contributions

Methodology, C.S.; formal analysis, R.B. (Regine Boldt), C.S., R.B. (Rahma Boughanmi), K.B.L.B., B.R.; investigation, R.B. (Regine Boldt), C.S., R.B. (Rahma Boughanmi), P.G., K.B.L.B., B.R., P.Z.; writing—original draft preparation, R.B. (Rahma Boughanmi), K.B.L.B., B.R.; writing—review and editing, A.S., J.S., S.S., M.M, D.S., C.S., R.B. (Rahma Boughanmi), K.B.L.B., B.R., P.Z.; visualization, R.B. (Rahma Boughanmi), C.S., D.S., K.B.L.B.; supervision, S.S., D.S.; project administration, M.M., S.S.; funding acquisition, M.M., S.S. All authors discussed the results and commented on the manuscript. All authors have read and agreed to the published version of the manuscript.

Funding

The authors gratefully acknowledge the support received from the Saxonian funding organization SAB and LfULG within the cooperative projects entitled “Development of environmentally compatible biopolymers as flocculants/adsorbents for the removal of iron and sulfate ions from surface waters” (SAB no 100377122) and “Mobile sensor systems for on-site heavy metal detection in water” (contract 33-8128/157/1), respectively.

Institutional Review Board Statement

Not applicable.

Informed Consent Statement

Not applicable.

Data Availability Statement

All findings discussed are based on the data contained within this current study.

Acknowledgments

The authors thank AGRANA Research and Innovation Center GmbH from Tulln, Austria, for the support of the materials, discussions, and cooperativeness. The authors also gratefully thank Marina Oelmann for particle size measurements, Eileen Schierz and Roland Schulze for elemental analysis measurements, and Egon Höfgen for characterization of real water samples. Both institutes (IPF Dresden and KSI Meinsberg) gratefully acknowledge the co-financing by tax funds on the basis of the budget passed by the Saxon state parliament.

Conflicts of Interest

The authors declare no conflict of interest.

References

  1. Kumar, V.; Parihar, R.D.; Sharma, A.; Bakshi, P.; Sidhu, G.P.S.; Bali, A.S.; Karaouzas, I.; Bhardwaj, R.; Thukral, A.K.; Gyasi-Agyei, Y.; et al. Global evaluation of heavy metal content in surface water bodies: A meta-analysis using heavy metal pollution indices and multivariate statistical analyses. Chemosphere 2019, 236, 124364. [Google Scholar] [CrossRef] [PubMed]
  2. Zhou, Q.; Yang, N.; Li, Y.; Ren, B.; Ding, X.; Bian, H.; Yao, X. Total concentrations and sources of heavy metal pollution in global river and lake water bodies from 1972 to 2017. Glob. Ecol. Conserv. 2020, 22, e00925. [Google Scholar] [CrossRef]
  3. Soto, D.; Urdaneta, J.; Pernía, K.; León, O.; Muñoz-Bonilla, A.; Fernandez-García, M. Removal of heavy metal ions in water by starch esters. Starch Stärke 2015, 68, 37–46. [Google Scholar] [CrossRef]
  4. Anghel, N.; Marius, N.; Spiridon, I. Heavy metal adsorption ability of a new composite material based on starch strengthened with chemically modified cellulose. Polym. Adv. Technol. 2019, 30, 1453–1460. [Google Scholar] [CrossRef]
  5. El-Hamshary, H.; Fouda, M.M.G.; Moydeen, M.; Al-Deyab, S.S. Removal of heavy metal using poly (N-vinylimidazole)-grafted-carboxymethylated starch. Int. J. Biol. Macromol. 2014, 66, 289–294. [Google Scholar] [CrossRef]
  6. Garcia, M.A.V.T.; Garcia, C.F.; Faraco, A.A.G. Pharmaceutical and Biomedical Applications of Native and Modified Starch: A Review. Starch Stärke 2020, 72, 1900270. [Google Scholar] [CrossRef]
  7. Gui, Q.; Ouyang, Q.; Xu, C.; Ding, H.; Shi, S.; Chen, X. Facile and Safe Synthesis of Novel Self-Pored Amine-Functionalized Polystyrene with Nanoscale Bicontinuous Morphology. Int. J. Mol. Sci. 2020, 21, 9404. [Google Scholar] [CrossRef] [PubMed]
  8. Crini, G. Recent developments in polysaccharide-based materials used as adsorbents in wastewater treatment. Prog. Polym. Sci. 2005, 30, 38–70. [Google Scholar] [CrossRef]
  9. De Gisi, S.; Lofrano, G.; Grassi, M.; Notarnicola, M. Characteristics and adsorption capacities of low-cost sorbents for wastewater treatment: A review. Sustain. Mater. Technol. 2016, 9, 10–40. [Google Scholar] [CrossRef] [Green Version]
  10. Nasrollahzadeh, M.; Sajjadi, M.; Iravani, S.; Varma, R.S. Starch, cellulose, pectin, gum, alginate, chitin and chitosan derived (nano)materials for sustainable water treatment: A review. Carbohydr. Polym. 2020, 251, 116986. [Google Scholar] [CrossRef]
  11. Weißpflog, J.; Gündel, A.; Vehlow, D.; Steinbach, C.; Müller, M.; Boldt, R.; Schwarz, S.; Schwarz, D. Solubility and Selectivity Effects of the Anion on the Adsorption of Different Heavy Metal Ions onto Chitosan. Molecules 2020, 25, 2482. [Google Scholar] [CrossRef] [PubMed]
  12. Ghiorghita, C.-A.; Borchert, K.B.L.; Vasiliu, A.-L.; Zaharia, M.-M.; Schwarz, D.; Mihai, M. Porous thiourea-grafted-chitosan hydrogels: Synthesis and sorption of toxic metal ions from contaminated waters. Colloids Surfaces A Physicochem. Eng. Asp. 2020, 607, 125504. [Google Scholar] [CrossRef]
  13. Zhao, D.; Yu, S.; Sun, B.; Gao, S.; Guo, S.; Zhao, K. Biomedical Applications of Chitosan and Its Derivative Nanoparticles. Polymers 2018, 10, 462. [Google Scholar] [CrossRef] [Green Version]
  14. Borchert, K.B.L.; Steinbach, C.; Schwarz, S.; Schwarz, D. A Comparative Study on the Flocculation of Silica and China Clay with Chitosan and Synthetic Polyelectrolytes. Mar. Drugs 2021, 19, 102. [Google Scholar] [CrossRef] [PubMed]
  15. Wei, H.; Gao, B.; Ren, J.; Li, A.; Yang, H. Coagulation/flocculation in dewatering of sludge: A review. Water Res. 2018, 143, 608–631. [Google Scholar] [CrossRef] [PubMed]
  16. Song, Z.; Li, G.; Guan, F.; Liu, W. Application of Chitin/Chitosan and Their Derivatives in the Papermaking Industry. Polymers 2018, 10, 389. [Google Scholar] [CrossRef] [Green Version]
  17. van den Broek, L.A.M.; Boeriu, C.G.; Stevens, C.V. (Eds.) Chitin and Chitosan: Properties and Applications; Wiley: Hoboken, NJ, USA, 2020; ISBN 978-1-119-45043-6. [Google Scholar]
  18. Da Silva, S.B.; Batista, G.L.; Santin, C.K. Chitosan for Sensors and Electrochemical Applications. In Chitin and Chitosan: Properties and Applications; van den Broek, L.A.M., Boeriu, C.G., Stevens, C.V., Eds.; Wiley: Hoboken, NJ, USA, 2020; pp. 461–476. ISBN 978-1-119-45043-6. [Google Scholar]
  19. Suginta, W.; Khunkaewla, P.; Schulte, A. Electrochemical Biosensor Applications of Polysaccharides Chitin and Chitosan. Chem. Rev. 2013, 113, 5458–5479. [Google Scholar] [CrossRef] [PubMed]
  20. Ahmad, M.; Zhang, B.; Wang, J.; Xu, J.; Manzoor, K.; Ahmad, S.; Ikram, S. New method for hydrogel synthesis from diphenylcarbazide chitosan for selective copper removal. Int. J. Biol. Macromol. 2019, 136, 189–198. [Google Scholar] [CrossRef]
  21. Manzoor, K.; Ahmad, M.; Ahmad, S.; Ikram, S. Synthesis, Characterization, Kinetics, and Thermodynamics of EDTA-Modified Chitosan-Carboxymethyl Cellulose as Cu(II) Ion Adsorbent. ACS Omega 2019, 4, 17425–17437. [Google Scholar] [CrossRef] [Green Version]
  22. Wang, R.; Liang, R.; Dai, T.; Chen, J.; Shuai, X.; Liu, C. Pectin-based adsorbents for heavy metal ions: A review. Trends Food Sci. Technol. 2019, 91, 319–329. [Google Scholar] [CrossRef]
  23. Bratskaya, S.Y.; Genest, S.; Petzold-Welcke, K.; Heinze, T.; Schwarz, S. Flocculation Efficiency of Novel Amphiphilic Starch Derivatives: A Comparative Study. Macromol. Mater. Eng. 2013, 299, 722–728. [Google Scholar] [CrossRef]
  24. Krentz, D.-O.; Lohmann, C.; Schwarz, S.; Bratskaya, S.; Liebert, T.; Laube, J.; Heinze, T.; Kulicke, W.-M. Properties and Flocculation Efficiency of Highly Cationized Starch Derivatives. Starch Stärke 2006, 58, 161–169. [Google Scholar] [CrossRef]
  25. Aly, A.A. Preparation, Characterization and Evaluation of Anionic Starch Derivatives as Flocculants and for Metal Removal. Starch Stärke 2006, 58, 391–400. [Google Scholar] [CrossRef]
  26. Pant, B.R.; Jeon, H.-J.; Song, H.H. Radiation cross-linked carboxymethylated starch and iron removal capacity in aqueous solution. Macromol. Res. 2011, 19, 307–312. [Google Scholar] [CrossRef]
  27. Ekebafe, L.O. Removal of heavy metals from aqueous media using native cassava starch hydrogel. Afr. J. Environ. Sci. Technol. 2012, 6, 6. [Google Scholar] [CrossRef]
  28. Soto, D.; Urdaneta, J.; Pernía, K.; León, O.; Muñoz-Bonilla, A.; Fernández-García, M. Heavy metal (Cd2+, Ni2+, Pb2+and Ni2+) adsorption in aqueous solutions by oxidized starches. Polym. Adv. Technol. 2014, 26, 147–152. [Google Scholar] [CrossRef]
  29. United Nations Environment Programme, Chemical Branch, DTIE. Final Review of Scientific Information on Lead-Version of December 2010. 2010. Available online: https://wedocs.unep.org/handle/20.500.11822/27635 (accessed on 15 February 2021).
  30. Abbas, A.; Al-Amer, A.M.; Laoui, T.; Al-Marri, M.J.; Nasser, M.S.; Khraisheh, M.; Atieh, M.A. Heavy metal removal from aqueous solution by advanced carbon nanotubes: Critical review of adsorption applications. Sep. Purif. Technol. 2016, 157, 141–161. [Google Scholar] [CrossRef]
  31. Ahmed, M.J.K.; Ahmaruzzaman, M. A review on potential usage of industrial waste materials for binding heavy metal ions from aqueous solutions. J. Water Process. Eng. 2016, 10, 39–47. [Google Scholar] [CrossRef]
  32. Das, A.; Bar, N.; Das, S.K. Pb(II) adsorption from aqueous solution by nutshells, green adsorbent: Adsorption studies, regeneration studies, scale-up design, its effect on biological indicator and MLR modeling. J. Colloid Interface Sci. 2020, 580, 245–255. [Google Scholar] [CrossRef]
  33. Ali, H.; Khan, E. Bioaccumulation of non-essential hazardous heavy metals and metalloids in freshwater fish. Risk to human health. Environ. Chem. Lett. 2018, 16, 903–917. [Google Scholar] [CrossRef]
  34. Church, B.G.; Van Sprang, P.A.; Chowdhury, M.J.; Deforest, D.K. Updated species sensitivity distribution evaluations for acute and chronic lead toxicity to saltwater aquatic life. Environ. Toxicol. Chem. 2017, 36, 2974–2980. [Google Scholar] [CrossRef]
  35. Air Quality Guidelines for Europe, 2nd ed.; WHO: Geneva, Switzerland; Regional Office for Europe: Copenhagen, Denmark, 2000; ISBN 978-9-28-901358-1.
  36. Caravati, E.M. Medical Toxicology, 3rd ed.; Lippincott, Williams & Wilkins: Philadelphia, PA, USA, 2004; ISBN 978-0-7817-2845-4. [Google Scholar]
  37. Cleveland, L.M.; Minter, M.L.; Cobb, K.A.; Scott, A.A.; German, V.F. Lead hazards for pregnant women and children: Part 1: Immigrants and the poor shoulder most of the burden of lead exposure in this country. Part 1 of a two-part article details how exposure happens, whom it affects, and the harm it can do. Am. J. Nurs. 2008, 108, 40–49. [Google Scholar] [CrossRef]
  38. Moiseenko, T.I.; Gashkina, N.A. Biogeochemistry of Cadmium: Anthropogenic Dispersion, Bioaccumulation, and Ecotoxicity. Geochem. Int. 2018, 56, 798–811. [Google Scholar] [CrossRef]
  39. Hsu, L.-C.; Huang, C.-Y.; Chuang, Y.-H.; Chen, H.-W.; Chan, Y.-T.; Teah, H.-Y.; Chen, T.-Y.; Chang, C.-F.; Liu, Y.-T.; Tzou, Y.-M. Accumulation of heavy metals and trace elements in fluvial sediments received effluents from traditional and semiconductor industries. Sci. Rep. 2016, 6, 34250. [Google Scholar] [CrossRef]
  40. Hutton, M. Sources of cadmium in the environment. Ecotoxicol. Environ. Saf. 1983, 7, 9–24. [Google Scholar] [CrossRef]
  41. Pavlaki, M.D.; Araújo, M.J.; Cardoso, D.N.; Silva, A.R.R.; Cruz, A.; Mendo, S.; Soares, A.M.V.M.; Calado, R.; Loureiro, S. Ecotoxicity and genotoxicity of cadmium in different marine trophic levels. Environ. Pollut. 2016, 215, 203–212. [Google Scholar] [CrossRef]
  42. Hartwig, A. Cadmium and Cancer. Metal Ions Life Sci. 2012, 11, 491–507. [Google Scholar] [CrossRef]
  43. Godt, J.; Scheidig, F.; Grosse-Siestrup, C.; Esche, V.; Brandenburg, P.; Reich, A.; Groneberg, D.A. The toxicity of cadmium and resulting hazards for human health. J. Occup. Med. Toxicol. 2006, 1, 22. [Google Scholar] [CrossRef] [Green Version]
  44. Mathy, P. (Ed.) Air Pollution and Ecosystems; Springer: Dordrecht, The Netherlands, 1988; ISBN 978-94-010-8276-1. [Google Scholar]
  45. Rosseland, B.O.; Eldhuset, T.D.; Staurnes, M. Environmental effects of aluminium. Environ. Geochem. Health 1990, 12, 17–27. [Google Scholar] [CrossRef]
  46. Shinzato, M.C.; Hypolito, R. Effect of disposal of aluminum recycling waste in soil and water bodies. Environ. Earth Sci. 2016, 75, 1–10. [Google Scholar] [CrossRef]
  47. Hashimoto, Y.; Sekine, Y.; Otoshi, T. Atmospheric aluminum from human activities. Atmos. Environ. Part B Urban Atmos. 1992, 26, 295–300. [Google Scholar] [CrossRef]
  48. Igbokwe, I.O.; Igwenagu, E.; Igbokwe, N.A. Aluminium toxicosis: A review of toxic actions and effects. Interdiscip. Toxicol. 2019, 12, 45–70. [Google Scholar] [CrossRef] [Green Version]
  49. Gensemer, R.W.; Playle, R.C. The Bioavailability and Toxicity of Aluminum in Aquatic Environments. Crit. Rev. Environ. Sci. Technol. 1999, 29, 315–450. [Google Scholar] [CrossRef]
  50. Choksi, P.M.; Joshi, V.Y. Adsorption kinetic study for the removal of nickel (II) and aluminum (III) from an aqueous solution by natural adsorbents. Desalination 2007, 208, 216–231. [Google Scholar] [CrossRef]
  51. Gonzalez, M.H.; Souza, G.B.; Oliveira, R.V.; Forato, L.A.; Nóbrega, J.A.; Nogueira, A.R.A. Microwave-assisted digestion procedures for biological samples with diluted nitric acid: Identification of reaction products. Talanta 2009, 79, 396–401. [Google Scholar] [CrossRef] [PubMed]
  52. Nilsson, G.S.; Gorton, L.; Bergquist, K.-E.; Nilsson, U.J. Determination of the Degree of Branching in Normal and Amylopectin Type Potato Starch with1H-NMR Spectroscopy Improved resolution and two-dimensional spectroscopy. Starch Stärke 1996, 48, 352–357. [Google Scholar] [CrossRef]
  53. Langmuir, I. The constitution and fundamental properties of solids and liquids. Part I. solids. J. Am. Chem. Soc. 1916, 38, 2221–2295. [Google Scholar] [CrossRef] [Green Version]
  54. Sips, R. On the Structure of a Catalyst Surface. J. Chem. Phys. 1948, 16, 490–495. [Google Scholar] [CrossRef]
  55. Dubinin, M.M. The Equation of the Characteristic Curve of Activated Charcoal. Proceedings of the USSR Academy of Sciences 1947, 55, 327–329. [Google Scholar]
  56. Kamga, F.T. Modeling adsorption mechanism of paraquat onto Ayous (Triplochiton scleroxylon) wood sawdust. Appl. Water Sci. 2018, 9, 1. [Google Scholar] [CrossRef] [Green Version]
  57. Foo, K.Y.; Hameed, B.H. Insights into the modeling of adsorption isotherm systems. Chem. Eng. J. 2010, 156, 2–10. [Google Scholar] [CrossRef]
  58. Cael, J.J.; Koenig, J.L.; Blackwell, J. Infrared and Raman spectroscopy of carbohydrates. Part VI: Normal coordinate analysis of V-amylose. Biopolymers 1975, 14, 1885–1903. [Google Scholar] [CrossRef]
  59. Cael, S.J.; Koenig, J.L.; Blackwell, J. Infrared and raman spectroscopy of carbohydrates. Carbohydr. Res. 1973, 29, 123–134. [Google Scholar] [CrossRef]
  60. Kizil, R.; Irudayaraj, J.; Seetharaman, K. Characterization of Irradiated Starches by Using FT-Raman and FTIR Spectroscopy. J. Agric. Food Chem. 2002, 50, 3912–3918. [Google Scholar] [CrossRef] [PubMed]
  61. Kuakpetoon, D.; Wang, Y.-J. Locations of hypochlorite oxidation in corn starches varying in amylose content. Carbohydr. Res. 2008, 343, 90–100. [Google Scholar] [CrossRef] [PubMed]
  62. Zhang, Y.-R.; Wang, X.-L.; Zhao, G.-M.; Wang, Y.-Z. Preparation and properties of oxidized starch with high degree of oxidation. Carbohydr. Polym. 2012, 87, 2554–2562. [Google Scholar] [CrossRef]
  63. Liu, Y.; Yang, L.; Ma, C.; Zhang, Y. Thermal Behavior of Sweet Potato Starch by Non-Isothermal Thermogravimetric Analysis. Materials 2019, 12, 699. [Google Scholar] [CrossRef] [Green Version]
  64. Liu, X.; Wang, Y.; Yu, L.; Tong, Z.; Chen, L.; Liu, H.; Li, X. Thermal degradation and stability of starch under different processing conditions. Starch Stärke 2012, 65, 48–60. [Google Scholar] [CrossRef]
  65. Liu, X.; Yu, L.; Xie, F.; Li, M.; Chen, L.; Li, X. Kinetics and mechanism of thermal decomposition of cornstarches with different amylose/amylopectin ratios. Starch Stärke 2010, 62, 139–146. [Google Scholar] [CrossRef]
  66. Soliman, A.A.A.; El-Shinnawy, N.A.; Mobarak, F. Thermal behaviour of starch and oxidized starch. Thermochim. Acta 1997, 296, 149–153. [Google Scholar] [CrossRef]
  67. Guidelines for Drinking-Water Quality, 4th ed.; World Health Organization: Geneva, Switzerland, 2017; ISBN 978-92-4-154995-0.
  68. Al-Ghouti, M.A.; Da’ana, D.A. Guidelines for the use and interpretation of adsorption isotherm models: A review. J. Hazard. Mater. 2020, 393, 122383. [Google Scholar] [CrossRef] [PubMed]
  69. Bundesministerin der Justiz und für Verbraucherschutz-Trinkwasserverordnung, Anlage 2 (zu § 6 Absatz 2): TrinkwV, 2019.
Figure 1. (a) Streaming potential vs. pH curves and (b) charge densities at pH values of 3 (solid), 5 (striped), and 9 (crossed) of native potato starch (blue), native corn starch (red), native waxy corn starch (orange), native wheat starch (green), oxidized potato starch (light blue), and oxidized corn starch (pink).
Polysaccharides 02 00027 g001
Figure 2. ATR-FTIR spectra comparison of oxidized and native corn as well as potato starches, C=O vibration mode is marked as arrow and other vibrations are marked as dashed line.
Polysaccharides 02 00027 g002
Figure 3. 1H-NMR of the starch samples in DMSO-d6 and D2O at 500 MHz and 25 °C with assignments: H-1 either from α-1,4 (H-1(1–4)), -1,6 (H-1(1–6)) glycosidic linkage or terminal unit (H-1(t)), H-2–H-5 hydrogens along glucose ring, and H-6 for CH2OH. Native potato starch shown in blue, native corn starch in red, native waxy corn starch in orange, native wheat starch in green, oxidized potato starch in light blue, and oxidized corn starch in pink. Respective signals between 4.2 and 3.9 ppm corresponded to H2O and signals at 2.5 ppm to DMSO.
Polysaccharides 02 00027 g003
Figure 4. Thermogravimetric analysis (a) under air and (b) under nitrogen atmosphere of native potato starch (blue), native corn starch (red), native waxy corn starch (orange), native wheat starch (green), oxidized potato starch (light blue), and oxidized corn starch (pink).
Polysaccharides 02 00027 g004
Figure 5. SEM images of (a) native potato starch, (b) native corn starch, (c) native waxy corn starch, (d) native wheat starch, (e) oxidized potato starch, and (f) oxidized corn starch.
Polysaccharides 02 00027 g005
Figure 6. Particle size distributions in aqueous solution at 0 min and 24 h of (a) native potato starch, (b) native corn starch, (c) native waxy corn starch, (d) native wheat starch, (e) oxidized potato starch, and (f) oxidized corn starch.
Polysaccharides 02 00027 g006
Figure 7. Solubility experiments of starch (a) directly after addition of starch and (b) after stirring for 24 h. From left to right: Native potato starch, native corn starch, native waxy corn starch, native wheat starch, oxidized potato starch, and oxidized corn starch.
Polysaccharides 02 00027 g007
Figure 8. Screening experiments with Al3+, Pb2+, and Cd2+ with the percentage sorption of (a) aluminum from Al2(SO4)3 adsorption experiments with an initial concentration of aluminum ions of 0.11 mg/L (solid) and 1.09 mg/L (striped); (b) cadmium from CdSO4 adsorption experiments with an initial concentration of cadmium ions of 0.11 mg/L (solid) and 1.12 mg/L (striped); (c) lead from PbSO4 adsorption experiments with an initial concentration of lead ions of 0.08 mg/L (solid) and 0.91 mg/L (striped) on native potato starch (blue), native corn starch (red), native waxy corn starch (orange), native wheat starch (green), oxidized potato starch (light blue), and oxidized corn starch (pink). The corresponding pH values for the sorption experiments are shown in Figures S12–S14. The corresponding adsorption of sulfate ions is shown in Figure S15, whereby most of the S-concentrations were below the limit of detection for S.
Polysaccharides 02 00027 g008
Figure 9. Adsorption capacity (a) for Al3+ from Al2(SO4)3 solution and (b) for Cd2+ of CdSO4 solution and corresponding Sips isotherm model fits. Native potato starch is shown in blue, native corn starch in red, oxidized potato starch in light blue, and oxidized corn starch in pink. The corresponding SO42− adsorption and pH values can be seen in Figure S22 for the experiment with Al2(SO4)3 solution and Figure S23 for the experiment with CdSO4 solution. Native potato starch did not exhibit a viable fitting for Sips model in the Al2(SO4)3 sorption experiments. Native corn starch (red) did not exhibit a viable fitting for Sips model (R2 < 0.7) for both isotherms.
Polysaccharides 02 00027 g009
Figure 10. Elemental mapping derived from SEM-EDX from (a) native potato starch, (b) oxidized potato starch, and (c) oxidized corn starch after adsorption experiments with CdSO4 solution Cd in yellow at 10,000-fold magnification. For native corn starch, the adsorbed amounts of Cd2+ were below the detection limit for SEM-EDX. Scale bar is 15 µm.
Polysaccharides 02 00027 g010
Figure 11. (a) Adsorption isotherm of Pb2+ from PbSO4 solution with adsorbent dosage of 100 mg/30 mL and corresponding Sips isotherm model fits. Native potato starch is shown in blue, native corn starch in red, oxidized potato starch in light blue, and oxidized corn starch in pink. The corresponding SO42− adsorption and pH values can be seen in Figure S24. (b) Adsorption isotherm of Pb2+ from PbSO4 solution with decreased adsorbent dosage of 10 mg/30 mL and corresponding Dubinin-Radushkevich isotherm model fits. Native potato starch is shown in blue, native corn starch in red, oxidized potato starch in light blue, and oxidized corn starch in pink. The corresponding SO42− adsorption and pH values can be seen in Figure S25.
Polysaccharides 02 00027 g011
Figure 12. SEM-EDX elemental mapping of oxidized corn starch (a,b) and oxidized potato starch (c,d) at 10,000 fold magnification. C is shown in red, O in blue, and Pb in green. Scale bar is 15 µm.
Polysaccharides 02 00027 g012
Figure 13. Adsorption experiment with Al3+ in water samples. (a) Adsorption experiment with Al3+ in water 1 with an initial concentration of aluminum ions of 2.16 mg/L. (b) Adsorption experiment with Al3+ in water 2 with an initial concentration of aluminum ions of 0.84 mg/L. (c) Adsorption experiment with Al3+ in water 3 with an initial concentration of aluminum ions of 0.94 mg/L on native potato starch (blue), native corn starch (red), native waxy corn starch (orange), native wheat starch (green), oxidized potato starch (light blue), and oxidized corn starch (pink). The corresponding pH values for the real water samples are shown in Figures S28–S30 and the corresponding SO42− percentage adsorption is shown in Figures S31–S33. The adsorption experiments with water 1 were conducted with an adsorption time of two hours, while 24 h was chosen for water 2 and 3.
Polysaccharides 02 00027 g013
Table 1. Results of the elemental analysis for the different starches. Residue here describes the relative mass that was not attributed to the elements C, H, and N.
SampleC (wt %)H (wt %)N (wt %)Residue (wt %)
Native potato starch37.76.0056.3
Native corn starch39.86.3054.0
Native waxy corn starch39.66.1054.3
Native wheat starch39.76.3054.1
Oxidized potato starch39.36.2054.6
Oxidized corn starch37.45.8056.9
Table 2. Calculated degree of branching (BD) (see Equation (1)) for the different starch samples and the values for the respective integrals used for calculation. The respective spectra are shown in Figure S1.
StarchIntegral H1 α-1,4 + H-1 (t)
5.40 ppm–4.90 ppm
Integral H-1 α-1,6
4.80 ppm–4.65 ppm
BD
Native potato1.00000.04144.0%
Native corn1.00000.04284.1%
Native waxy corn1.00000.05645.3%
Native wheat1.00000.05675.4%
Oxidized potato1.00000.05785.5%
Oxidized corn1.00000.03333.2%
Table 3. Relative weight of contained elements analyzed by ICP-OES after liquid digestion of the starch samples by HNO3 and H2O2 with microwave irradiation.
SampleS
(mg/g)
P
(mg/g)
Si
(mg/g)
Na
(mg/g)
K
(mg/g)
Ca
(mg/g)
Sum
(mg/g)
Native potato starch0.60.72.42.02.70.38.8
Native corn starch0.40.10.61.20.80.13.3
Native waxy corn starch0.30.10.31.10.60.12.5
Native wheat starch0.20.50.20.90.50.12.3
Oxidized potato starch0.1 *0.80.29.40.70.111.3
Oxidized corn starch0.10.10.16.10.30.27.1
* value below detection limit.
Table 4. Fitting parameters for Langmuir, Sips, and Dubinin-Radushkevich isotherm models for adsorption from Al2(SO4)3 solution. Here, Qm is the maximal sorption capacity, K is the equilibrium constant for the respective model, n is the Sips isotherm model exponent, and Eads,DR is the mean free energy of adsorption derived from the Dubinin-Radushkevich model. No applied model gave a reasonable fit to the isotherm of native corn starch. Sips isotherm model gave no reasonable fit for native potato starch.
SampleModelQm
µmol/g
K
L/µmol
β D R
mol2/J2
nEads,DR
kJ/mol
R2 (COD)
Native potato starchLangmuir23.1 ± 2.50.12 ± 0.08------0.850
Dubinin-Radushkevich21.0 ± 2.5--2.16 ∙ 10−6 ± 1.50 ∙ 10−6--0.48 ± 0.170.791
Oxidized potato starchLangmuir88.5 ± 6.00.09 ± 0.02------0.944
Sips84.4 ± 0.70.01 ± 0.00--2.30 ± 0.1--0.999
Dubinin-Radushkevich83.6 ± 1.9--5.91 ∙ 10−6 ± 5.8 ∙ 10−7--0.29 ± 0.010.993
Oxidized corn starchLangmuir70.5 ± 6.00.07 ± 0.03------0.913
Sips68.9 ± 7.20.05 ± 0.06--1.2 ± 0.5--0.916
Dubinin-Radushkevich66.1 ± 6.1--2.16 ∙ 10−5 ± 1.50 ∙ 10−5--0.48 ± 0.170.864
Table 5. Fitting parameters for Langmuir, Sips, and Dubinin-Radushkevich isotherm models for native potato starch, oxidized potato starch, and oxidized corn starch for adsorption from CdSO4 solution. Qm thereby is the maximal sorption capacity, K is the equilibrium constant for the respective model, n is the Sips isotherm model exponent, and Eads,DR is the mean free energy of adsorption derived from the Dubinin-Radushkevich model. None of the applied models gave a reasonable fit to the isotherm of native corn starch.
SampleModelQm
µmol/g
K
L/µmol
β D R
mol2/J2
nEads,DR
kJ/mol
R2 (COD)
Native potato starchLangmuir10.4 ± 0.71.45 ± 0.70------0.831
Sips14.6 ± 6.50.48 ± 0.41--0.3 ± 0.2--0.876
Dubinin-Radushkevich10.3 ± 0.7--1.49 ∙ 10−7 ± 8.4 ∙ 10−8--1.83 ± 0.520.809
Oxidized potato starchLangmuir72.7 ± 2.70.72 ± 0.11------0.967
Sips70.5 ± 2.80.72 ± 0.12--1.2 ± 0.2--0.970
Dubinin-Radushkevich67.4 ± 2.5--3.40 ∙ 10−7 ± 5.3 ∙ 10−8--1.21 ± 0.940.955
Oxidized corn starchLangmuir63.6 ± 1.71.23 ± 0.18------0.980
Sips68.1 ± 2.21.01 ± 0.11--0.7 ± 0.1--0.991
Dubinin-Radushkevich60.0 ± 2.5--1.49 ∙ 10−7 ± 8.4 ∙ 10−8--1.84 ± 0.200.941
Table 6. Fitting parameters for Langmuir, Sips, and Dubinin-Radushkevich isotherm models for native potato starch and native corn starch for Pb2+ adsorption from PbSO4 solution with adsorbent dosage of 100 mg/30 mL. Qm thereby is the maximal sorption capacity, K is the equilibrium constant for the respective model, n is the Sips isotherm model exponent, and Eads,DR is the mean free energy of adsorption derived from the Dubinin-Radushkevich model.
SampleModelQm
µmol/g
K
L/µmol
β D R
mol2/J2
nEads,DR
kJ/mol
R2 (COD)
Native potato starchLangmuir6.4 ± 0.60.07 ± 0.02------0.947
Sips5.6 ± 0.40.02 ± 0.02--1.7 ± 0.5--0.971
Dubinin-Radushkevich5.5 ± 0.3--1.68 ∙ 10−5 ± 5.0 ∙ 10−6--0.17 ± 0.030.950
Native corn starchLangmuir15.3 ± 0.50.39 ± 0.07------0.982
Sips14.3 ± 0.40.38 ± 0.06--1.5 ± 0.2--0.992
Dubinin-Radushkevich14.0 ± 0.3--4.04 ∙ 10−7 ± 5.16 ∙ 10−8--1.11 ± 0.070.987
Table 7. Fitting parameters for Langmuir, Sips, and Dubinin-Radushkevich isotherm models for adsorption with decreased adsorbent dose from PbSO4 solution. Qm thereby is the maximal sorption capacity, K is the equilibrium constant for the respective model, and Eads,DR is the mean free energy of adsorption derived from the Dubinin-Radushkevich model. To the isotherm of native corn starch, no applied model gave a reasonable fit.
SampleModelQm
µmol/g
K
L/µmol
β D R
mol2/J2
Eads,DR
kJ/mol
R2 (COD)
Native potato starchLangmuir17.1 ± 2.01.31 ± 0.96----0.770
Dubinin-Radushkevich16.0 ± 1. 9--7.79 ∙ 10−8 ± 4.27 ∙ 10−82.53 ± 0.690.740
Oxidized potato starchLangmuir105.5 ± 9.72.78 ± 1.25----0.896
Dubinin-Radushkevich104.2 ± 9.4--4.91 ∙ 10−8 ± 1.30 ∙ 10−83.19 ± 0.420.898
Oxidized corn starchLangmuir89.5 ± 6.12.52 ± 0.78----0.941
Dubinin-Radushkevich88.7 ± 4.5--5.86 ∙ 10−8 ± 9.2 ∙ 10−92.92 ± 0.230.966
Table 8. Amount of sulfate and heavy metal ions in the real water sample and values for pH, conductivity, and solid content.
SampleSO42−
(mg/L)
Cd2+
(mg/L)
Al3+
(mg/L)
Pb2+
(mg/L)
pH0
Water 1446.950.012.160.063.4
Water 2374.800.001.680.023.7
Water 3367.430.001.870.023.8
Publisher’s Note: MDPI stays neutral with regard to jurisdictional claims in published maps and institutional affiliations.

