Article

Influence of pH, Temperature and Sample Size on Natural and Enforced Syneresis of Precipitated Silica

Karlsruhe Institute of Technology (KIT), Institute of Thermal Process Engineering, Kaiserstraße 12, 76131 Karlsruhe, Germany
*
Author to whom correspondence should be addressed.
Polymers 2015, 7(12), 2504-2521; https://doi.org/10.3390/polym7121528
Submission received: 22 October 2015 / Revised: 18 November 2015 / Accepted: 25 November 2015 / Published: 1 December 2015
(This article belongs to the Collection Silicon-Containing Polymeric Materials)

Abstract

:
The production of silica is performed by mixing an inorganic, silicate-based precursor and an acid. Monomeric silicic acid forms and polymerizes to amorphous silica particles. Both further polymerization and agglomeration of the particles lead to a gel network. Since polymerization continues after gelation, the gel network consolidates. This rather slow process is known as “natural syneresis” and strongly influences the product properties (e.g., agglomerate size, porosity or internal surface). “Enforced syneresis” is the superposition of natural syneresis with a mechanical, external force. Enforced syneresis may be used either for analytical or preparative purposes. Hereby, two open key aspects are of particular interest. On the one hand, the question arises whether natural and enforced syneresis are analogous processes with respect to their dependence on the process parameters: pH, temperature and sample size. On the other hand, a method is desirable that allows for correlating natural and enforced syneresis behavior. We can show that the pH-, temperature- and sample size-dependency of natural and enforced syneresis are indeed analogous. It is possible to predict natural syneresis using a correlative model. We found that our model predicts maximum volume shrinkages between 19% and 30% in comparison to measured values of 20% for natural syneresis.

Graphical Abstract

1. Introduction

Precipitated silica (SiO2) is an amorphous solid and is applied in many fields of industrial applications. It can be used not only for adsorption of impurities in liquids and gases, as a binder in concrete or ceramics and an anti-caking agent in the food sector, but also as an inert filling material in the pharmaceutical or polymer industry. Beside a gaseous reaction route, silica may be precipitated in a stirred semi-batch process by mixing an acid (e.g., sulfuric acid) and a silicate (e.g., sodium silicate), see Figure 1, in the liquid phase.
Monomeric silicic acid polymerizes to oligomeric silicic acid with water as a by-product. These oligomers grow due to the further addition of monomeric silicic acid to primary particles (~20–50 nm) that aggregate. Finally, a particulate gel is formed. The gel is characterized by a porous solid skeleton of these primary silica particles and a liquid that is immobilized within the pores [1]. In the case of the stirred process, the gel is fragmented, resulting in gel fragments (~10–100 µm). These fragments consolidate due to the continuing polymerization. As a direct consequence, the gel fragments shrink and change their volume, porosity and internal surface with time. The liquid contained in the pores is expulsed due to a pressure difference that is induced between the gel and its environment. These processes are known as syneresis and are highly important for the final product properties [1,2].
Figure 1. Mechanisms of silica precipitation (after Schlomach [3]).
Polymers 07 01528 g001
Direct observation of syneresis of these gel fragments is difficult because the volume decrease, respectively, the shrinkage and the property changes cannot be clearly assigned to syneresis or mechanical crushing due to the stirrer. However, syneresis of precipitated silica is not limited to stirred gels, but can also be observed in unstirred samples. Macroscopic samples may be appropriate to determine the syneresis behavior. Nevertheless, it is known to be a slow process [1]. Relative volume changes in the order of only 7%–10% after ten days have been measured for cylindrical samples with initial radii of 0.15 cm and 0.67 cm [1]. Analysis of the influences on syneresis of the principal process parameters, such as temperature, pH and ionic strength, is very time-consuming. It has been shown, that syneresis can be accelerated by applying an external, compressive force to the gel sample [4,5], resulting in an additional pressure difference. This additional pressure difference superimposes the “naturally” present pressure difference. It is appropriate to define this process as “enforced syneresis” in contrast to the “natural syneresis”. As a result, the pore liquid enclosed drains out of the sample more rapidly. In addition to this analytical purpose in terms of a faster detection of the syneresis behavior, enforced syneresis may also be used for preparative objectives, e.g., the production of stationary phases for chromatography with well-defined porosity.
Understanding the dependency between the process parameters and the polymerization, fragmentation and consolidation will give the opportunity to control the precipitation process of silica in order to produce a product with properties specially designed for the application purpose. However, this method shall not only be applied to silica, but is expanded to other materials offering an analogous production route. In previous publications, we showed that the polymerization, fragmentation and consolidation of silica depend not only on pH, temperature and ionic strength, but also on the energy dissipation in the case of the stirred process. It is known that pH affects the structure and firmness of the gels [6]. Stronger gels are obtained for acidic rather than basic reactant conditions. Gelation is accelerated with temperature and ionic strength. An increased energy dissipation results in smaller gel fragments, in analogy to a highly viscous fluid [7]. Enforced syneresis applied to a gel with an acidic reactant condition shows an analogous temperature behavior as natural syneresis [5]. Therefore, the consolidation mechanism itself is checked for its dependency of the process parameters that also affect the polymerization. This work is intended to expand this knowledge to basic reactant conditions and different sample sizes.
In this publication, we concentrate on enforced syneresis as a rather fast means to a qualitative and quantitative description of the slow mechanisms of natural syneresis. The aim of this publication is twofold. On the one hand, it is necessary to prove the analogy in pH-, temperature- and sample size-dependency of both natural and enforced syneresis. On the other hand, a method is desirable that correlates the characteristics of natural and enforced syneresis. Different experimental set-ups are required which allow for the measurement of both types of syneresis to pursue these aims. Natural syneresis is measured with an adapted pycnometer device, whereas a specially designed pressure cell is proposed for the observation of enforced syneresis. These devices have already proven to be suitable [5]. Nevertheless, some minor changes were necessary within the scope of this work.
In the first section, a brief review of the state-of-the-art in theory of precipitation of silica is given. Following this part, an experimental set-up is proposed that permits the measurement of natural and enforced syneresis. Subsequently, the results obtained for both types of syneresis are presented and checked for their analogous behavior. Thereafter, the correlative model for the prediction of natural syneresis is derived.

2. State-of-the-Art

This work succeeds some of our previous work [3,4,5,6,7,8]. We refer to the literature [1,2,9,10,11] for a profound understanding of the polymerization and syneresis process of silica. Significant process parameters for the precipitation of silica are the pH, temperature and sample size as well as the ionic strength and the concentration of silicate in the mixed solution. The gelation process is accelerated by addition of salts—synonymous with an increase of the ionic strength—due to charge screening. Divalent ions screen the silica more effectively than monovalent ions [12]. An increase of the concentration of silicate results in a maximum volume shrinkage up to 80% [13]. However, these two process parameters are not considered within the scope of this publication. Nevertheless, the influences of pH, temperature and sample size on the polymerization and syneresis are summarized in the following.

2.1. Polymerization and Syneresis

According to Figure 1, monomeric silicic acid (Si(OH)4) is formed due to mixing of sodium silicate and sulfuric acid. The very low solubility of monomeric silicic acid ( c Si(OH) 4 ≈ 192 mg/L, corresponding to c ˜ Si(OH) 4 ≈ 2 mmol/L for pH < 7 and ϑ = 25 °C [2]) in combination with concentrations of c Si(OH) 4 ≈ 105 mg/L at typical process conditions lead to a high supersaturation of S = c S i ( O H ) 4 c S i ( O H ) 4 * ≈ 500. This supersaturation is depleted by polymerization of silanol groups (Si–OH) to siloxane bonds (Si–O–Si), resulting in oligomers that grow further and agglomerate to larger structures. Depending on the pH, polymerization is catalyzed either by H+-ions or by OH-ions. Eventually, a gel comprising a porous solid skeleton of nanoscale silica particles and of immobilized pore liquid forms. In the case of mechanical energy input, gel fragments are obtained instead of a continuous gel network. Both the gel fragments and the continuous gel network consolidate and show syneresis behavior, but in different time scales and degrees. Smaller gel samples consolidate faster and to a higher degree than larger samples [1]. This is due to an easier drainage of the pore liquid and a higher flexibility of the gel network.
The polymerization reaction that causes particle formation and gelation is also responsible for syneresis [1]. Figure 2 is a zoom of two primary particles and shows the process of syneresis schematically. For reasons of simplicity, the pore liquid is represented by H2O (blue) although it is a mixture of water, sodium, sulfate ions and monomeric silicic acid.
Two silanol groups (red) at the surface of the two primary particles polymerize to a new siloxane bond. This siloxane bond requires less space than the two silanol groups. Thus, the newly formed siloxane bond acts like a spring and contracts the solid skeleton (depicted as Δ in the right part of Figure 2) as long as the skeleton remains flexible. A direct consequence is the development of a pressure difference between the gel network and its environment, leading to expulsion of the pore liquid. These two mechanisms, namely the formation of new siloxane bonds and the reduction of the pressure difference through drainage of the pore liquid and subsequent contraction of the solid skeleton, lead to natural syneresis. Contrarily, we define “enforced” syneresis as the superposition of this “naturally” present pressure difference with an external one [4,5].
Figure 2. Illustration of syneresis, pore liquid in blue and formation of a new siloxane bond in red.
Polymers 07 01528 g002

2.2. Influence of pH

The influence of pH is threefold. Firstly, it directly affects the solubility of the monomeric silicic acid c ˜ Si(OH) 4 . The solubility c ˜ Si(OH) 4 can be calculated by:
log ( c ˜ Si(OH) 4 c ˜ Si(OH) 4 , 1 c ˜ Si(OH) 4 , 2 c ˜ Si(OH) 4 , 1 ) = pH pH 2
where c ˜ Si(OH) 4 , 1 = 2 mmol/L, c ˜ Si(OH) 4 , 2 = 2.3 mmol/L and pH2 = 9 are found for a temperature of ϑ = 25 °C [13]. The course of the solubility is shown in Figure S1 that can be found in the Supplementary Material at the end of this publication. For pH < 8, the solubility is constant and very low ( c ˜ Si(OH) 4 = 2 mmol/L, but it increases dramatically for pH > 8 by several orders of magnitude. This is due to an equilibrium between the monomeric silicic acid and its deprotonated anion that can be stabilized by water molecules [1,14]. The equilibrium is shifted to the anion with increasing pH. Thus, pH affects the supersaturation S.
Secondly, pH influences the catalytic polymerization reaction and the structure of the gel network. For pH < pHiso, the polymerization is catalyzed by surface-bound H+-ions (acid-catalyzed), whereas it is catalyzed by surface-bound OH-ions (base-catalyzed) for pH > pHiso. The isoelectric point is at pHiso ≈ 1.7–2 in the case of sulfuric acid [1,6,10]. These two different regions of catalysis have to be considered separately. In the case of an acid-catalyzed polymerization, the silanol group is protonated and forms a cationic monomeric silicic acid, see Figure 3a [10].
Figure 3. Scheme of pH-dependent catalytic partial reactions, acid-catalyzed (a) and base-catalyzed (b).
Polymers 07 01528 g003
This cationic silicic acid polymerizes with neutral silanol groups of the least acidic silicon atoms to an intermediate state and water. The H+-ion of the intermediate state is later removed by water or another neutral monomeric silicic acid. In general, the acidity of a silicon atom in silica increases with the greater number of siloxane bonds and fewer number of silanol groups [10]. Thus, the acid-catalyzed polymerization yields preferentially linear chains or weakly branched structures. With proceeding polymerization, these rather linear structures bind to each other into rather loosely connected agglomerates [6,10].
The mechanism of the base-catalyzed polymerization differs from the one described above. It is depicted in Figure 3b. A silanol group is deprotonated to its anionic form. The anion polymerizes with neutral silanol groups of the most acidic silicon atom, i.e., the silicon atom with the largest number of siloxane bonds. These are rather middle than end groups (as in the case of acid-catalyzed polymerization), resulting in highly branched clusters [6,10].
Thirdly, the rate of polymerization is influenced by pH, see Figure 4a. The gelation time tg and the shrinkage of an acid-catalyzed and base-catalyzed gel is shown as a function of pH. For pH = pHiso, the gelation time tg attains its maximum. This is due to a minimum concentration of the cationic and anionic monomer species that are necessary for the polymerization. The gelation time tg drops sharply with deviation from pHiso because the concentrations of these catalytic ionic species increase. In addition, the rate of shrinkage is accelerated by deviation from pHiso, as shown in Figure 4b,c. The closer the pH is to pHiso, the slower syneresis is.
Figure 4. Gelation time tg as a function of pH for increasing concentrations of monomeric silicic acid of 1.09 (1), 1.33 (2) and 1.78 mol/L (a); shrinkage for acid-catalyzed (b); and base-catalyzed (c) cylindrical gel samples [11].
Polymers 07 01528 g004

2.3. Influence of Temperature

Temperature influences the polymerization of silica in various ways. Firstly, the solubility of monomeric silicic acid c ˜ Si(OH) 4 depends on the temperature ϑ. The mass-related solubility c Si(OH) 4 can be calculated by Equation (2), according to [2], and converted into the molar solubility c ˜ Si(OH) 4 :
log ( c Si(OH) 4 mg/L ) = 4.52 731 ϑ + 273.15   ° C
This relation plotted in Figure S2 is valid for pH < 7 because there is no dependence between the solubility c ˜ Si(OH) 4 and pH, see Figure S1 in the Supplementary Materials. For pH > 7, the pH-dependency must be taken into account [2]. As can be seen from Equation (2), the solubility c ˜ Si(OH) 4 rises with temperature and, thus, affects the supersaturation S.
Secondly, the temperature affects the polymerization reaction rate [1]. This influence differs depending on the pH. In the case of an acid-catalyzed polymerization, a strong acceleration of gelation and syneresis can be detected with increasing temperature. The viscosity of the pore liquid decreases, leading to its easier drainage out of the solid skeleton of silica. By contrast, the maximum shrinkage was found to be lower with increasing temperature [15]. Newly formed siloxane bonds exert stress on the solid skeleton. It is assumed that the stress is lowered by shear deformation rather than by volume decrease with increasing temperature [1]. Thus, the maximum shrinkage is lower at higher temperatures. In contrast to the acid-catalyzed polymerization, an unrestricted acceleration of gelation for base-catalyzed polymerization with increasing temperature cannot be stated. Gelation is slowed down within a temperature range of 15 to 35 °C, but it increases again for higher temperatures. This peculiar behavior has been reported previously [1,6] and attributed to a possible preequilibrium step involving an induction period during which small polymeric units react preferentially with monomeric silicic acid instead of with other polymeric units.

2.4. Influence of Sample Size

The shrinkage and its rate depend on the sample size. As the gel network contracts, the pore liquid within is squeezed out due to the pressure difference induced. Small samples allow for an easy drainage of the pore liquid, whereas a steeper pressure difference is necessary for larger gels [1]. The measured, radial shrinkage of gel cylinders with different initial radii is given in Figure 5. As might be expected, the smaller gel sample (r0 = 0.15 cm) shrinks faster than the larger one (r0 = 0.67 cm). The rate of shrinkage slows down with time because the gel network stiffens due to the newly formed siloxane bonds.
Figure 5. Radial shrinkage of gel cylinders as a function of different initial radii [1].
Polymers 07 01528 g005
In summary, the influences of pH, temperature and sample size on the polymerization process of silica involving particle formation and subsequent consolidation, respectively, syneresis are reviewed. Different experimental set-ups (measurement of shrinkage and its rate) are suggested in order to prove these influences and transfer them from “natural” to “enforced” syneresis. The aim of our experiments which are explained in the next chapters is to check whether both types of syneresis show an analogous dependency on pH, temperature and sample size.

3. Experimental Set-Up

3.1. Gel Preparation

The gels are prepared by mixing sodium silicate and sulfuric acid solutions in a Y-mixing nozzle [16] with a volumetric ratio of 1:1. Both reactants are filled into syringes and pumped through the nozzle via an electrically driven syringe pump (Nexus 6000, Chemyx Inc., Stafford, TX, USA) to assure constant mixing conditions. The sodium silicate solution is prepared by dilution of sodium silicate (consisting of 35.5% Na2O·3.3SiO2 and 64.5% H2O by weight, Roth GmbH, Karlsruhe, Germany) with ultrapure water (Milli-Q, Millipore, Darmstadt, Germany) and has a mass fraction of x Sil = 0.40. In order to obtain an acid-catalyzed (pH < pHiso, in this particular case pH < 0) and a base-catalyzed gel (pH > pHiso, in this particular case pH ≈ 10), sulfuric acid solutions with mass fractions of x H 2 SO 4 = 0.5 and 0.032 are used, which were prepared from sulfuric acid (purity of 96% by weight, Roth GmbH, Karlsruhe, Germany) upon dilution with ultrapure water. Both reactants and the resulting mixture are thermostated at ϑ = 20 °C to avoid a rise in temperature due to the released heat of mixing.

3.2. Measurement of Syneresis

An adapted pycnometer device (for details see [5]) allows the measurement of natural syneresis of cylindrical gel samples (dCyl =12 mm and VGel ≈ 3 mL), see Figure 6a. The measurement is based on displacement and pycnometry. The volume of the gel sample Vgel can be calculated by subtraction of the maximum filling volume Vfill,max and the volume Vfill poured into the pycnometer flask. Both Vfill,max and Vfill are determined gravimetrically. The pycnometer flask containing the gel sample can be immersed in a thermostated water bath for the investigation of syneresis at different temperatures ϑ. Three samples are averaged to obtain one measurement point. A different experimental set-up is necessary in order to analyze the natural syneresis of smaller gel samples. We developed a cell, made of PMMA, which can be used with a microscope (Stemi 2000-C, Zeiss, Oberkochen, Germany). Small gel droplets (dDrop ≈ 3 mm) are prepared with a syringe (VSyr = 1 mL) and a cannula. The temperature is constant at 20 °C during the first 20 min, that is negligibly longer than the gelation time of 12 min [6], and pictures of the droplets are taken with a macro lens. Thereafter, the gel droplets are placed into the sample areas, see Figure 6b. Each sample area is sealed with a cover glass on the top of the left part and a second cover glass between the two parts of the cell. Thus, drying is avoided and the temperature can be controlled by immersing the cell in a thermostated water bath. The changes in dimension of the gel droplets are determined optically with the microscope by taking pictures of the top and side view. For the side view, a reflector is used with the same microscope. Several measurement series were performed and averaged in order to compensate for measurement inaccuracies.
Figure 6. Measurement equipment for natural syneresis, cylindrical samples (a) [5] and gel droplets (b).
Polymers 07 01528 g006
In the case of enforced syneresis, an external uniaxial force F is applied to the gel sample in a specially designed measuring cell, see Figure 7. Compared to the cell previously used [5], some modifications were made. The cell is placed into a uniaxial testing machine (ProLine Z010, Zwick/Roell, Ulm, Germany) which applies the force F to the gel and records the resulting change in gel height Δs. Considering the cross section, Δs can be converted into a corresponding volume decrease. All components that are in contact with the gel or the pore liquid squeezed out (cell wall, head, base and support plate, as well as the perforated filter plates) are made of POM (polyoxymethylene). In addition, threads, HPLC tubings and fittings are mounted to collect the pore liquid at minimum dead volume. The filter plates support the nanofiltration membranes that hold back the solid silica. Two different types of membranes are used (NF270, Dow Filmtec, Terneuzen, The Netherlands and NP010, Microdyn-Nadir, Wiesbaden, Germany). They differ in molecular weight cut-off and retention of ions. As with the pycnometer flasks, the cell is immersed in a thermostated water bath to assure a constant temperature ϑ during the experiment.
Figure 7. Measurement equipment for enforced syneresis, with small modifications compared to [5].
Polymers 07 01528 g007

3.3. Determination of Monomeric Silicic Acid in Pore Liquid

An essential condition for comparing enforced and natural syneresis is that the mechanism of syneresis is not influenced by the external force. In particular, we assume the reduction of the concentration of monomeric silicic acid and, thus, the depletion of the supersaturation S to be equal for both types of syneresis. To prove this assumption, the concentration of monomeric silicic acid of the pore liquid squeezed out is determined with a colorimetric method described by Alexander [17]. According to this method, an aqueous reaction solution containing ammonium molybdate tetrahydrate (Roth GmbH) and sulfuric acid (Roth GmbH) is prepared. When mixed with a sample of pore liquid containing monomeric silicic acid, a yellow silicomolybdate complex forms. The extinction at a wavelength of λ = 400 nm [15] of this complex is measured with a UV/Vis spectrophotometer (Genesys 10S, ThermoScientific, Braunschweig, Germany). A standard solution (1000 mg/L Si Certipur®, Merck Millipore, Darmstadt, Germany, in 0.5 mol/L NaOH) is used for calibration.

4. Results and Discussion

4.1. Natural Syneresis

The temporal courses of the relative shrinkage ΔV/V0 of the cylindrical samples (dCyl = 12 mm and VGel ≈ 3 mL) are determined experimentally for three different temperatures and are depicted in 
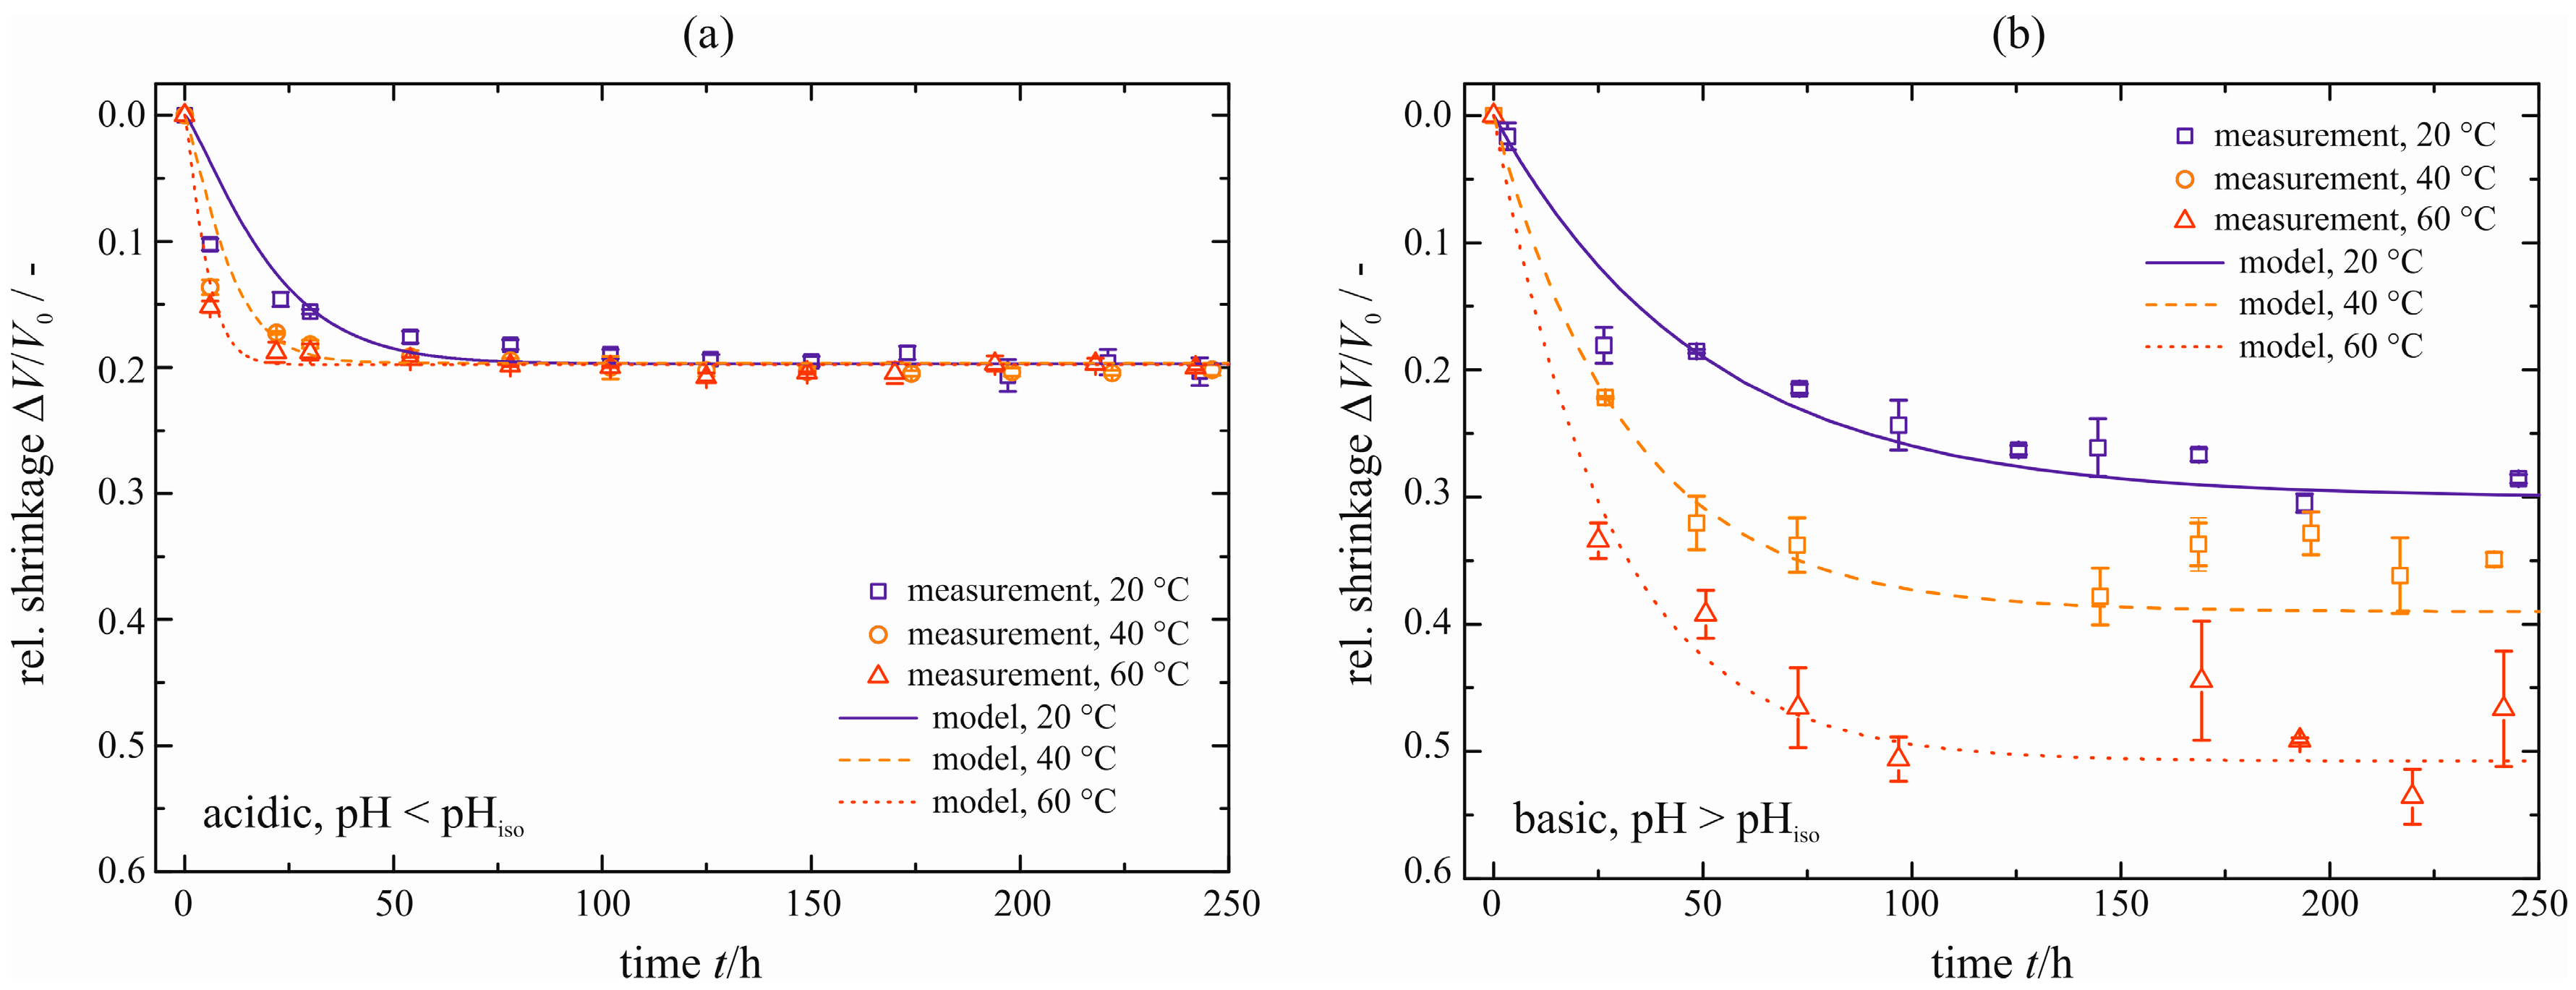
Figure 8 for an acid- and base-catalyzed gel. For the acid-catalyzed gel, a maximum shrinkage of ΔV/V0|max = 0.20 is reached independently of the temperature. The phenomenon of a slightly lower value for the maximum shrinkage with increasing temperature stated by Ponomerova [15] cannot be proved or disproved when the error bars are regarded. However, the temperature affects the kinetics of syneresis reflected by the different slopes for t < 50 h. With increasing temperature, syneresis is accelerated. A simple model based upon a kinetic rate equation is proposed for a quantitative description of the courses, see Equation (3). A physically based model is still to be made.
Δ V V 0 = ( Δ V V 0 ) max [ 1 exp ( t τ ) ]
Equation (3) comprises two parameters that represent the maximum shrinkage ΔV/V0|max (the value for t→∞) and the characteristic time constant τ (taking into consideration the kinetics at the beginning). These two parameters are characteristic for the measurements and are used for further comparison of the influence of different process conditions. Their values are listed in Table 1.
Figure 8. Relative shrinkage ΔV/V0 of the cylindrical samples, natural syneresis for different temperatures ϑ, acid-catalyzed [5] (a), and base-catalyzed (b).
Polymers 07 01528 g008
Table 1. Maximum shrinkage ΔV/V0|max and characteristic time constant τ for the cylindrical samples (dCyl = 12 mm and VGel ≈ 3 mL), natural syneresis, model parameters.
Temperature ϑ/°CMaximum Shrinkage ΔV/V0|max/-Time Constant τ/h
Acid-catalyzed pH < pHisoBase-catalyzed pH > pHisoAcid-catalyzed pH < pHisoBase-catalyzed pH > pHiso
200.200.3021.350.1
400.200.3911.732.0
600.200.515.027.5
A different behavior is observed for the base-catalyzed gel, see Figure 8b. Both the maximum shrinkage and the rate increase with temperature. In direct comparison to the acid-catalyzed gel, the base-catalyzed gel exhibits larger values for the maximum shrinkage. They reach from ΔV/V0|max = 0.30 to 0.51. This can be explained by the different structure of the solid skeleton. The acid-catalyzed gel is built up of compact primary particles that are connected loosely, resulting in a translucent gel tending to brittle fracture. However, the base-catalyzed gel behaves in an opposite way. It is composed of loosely connected primary particles that form a softer network than the acid-catalyzed gel. As a result of these different structures, the base-catalyzed gel exhibits a larger maximum shrinkage [1]. The shrinkages measured are fitted with the same model, see Equation (3). The base-catalyzed gel consolidates at a much slower velocity, reflected by larger values for the characteristic time constant τ (see Table 1). One explanation might be the difference in the solid structure of the gels. In the case of the acid-catalyzed gel, the pore liquid can flow more easily through the gel network due to the compact, but loosely connected primary particles. For the base-catalyzed gel, a denser network forms, resulting in a slower drainage of the pore liquid. Scattering experiments of these differently catalyzed gels emphasize these differences in their solid structures and optical appearances [8]. Regarding the maximum shrinkage, there are small deviations between the measured and modeled data. The measured data seem to decrease further even after t > 250 h, especially for higher temperatures. These deviations are accepted in order to facilitate a comparison to the acid-catalyzed gel.
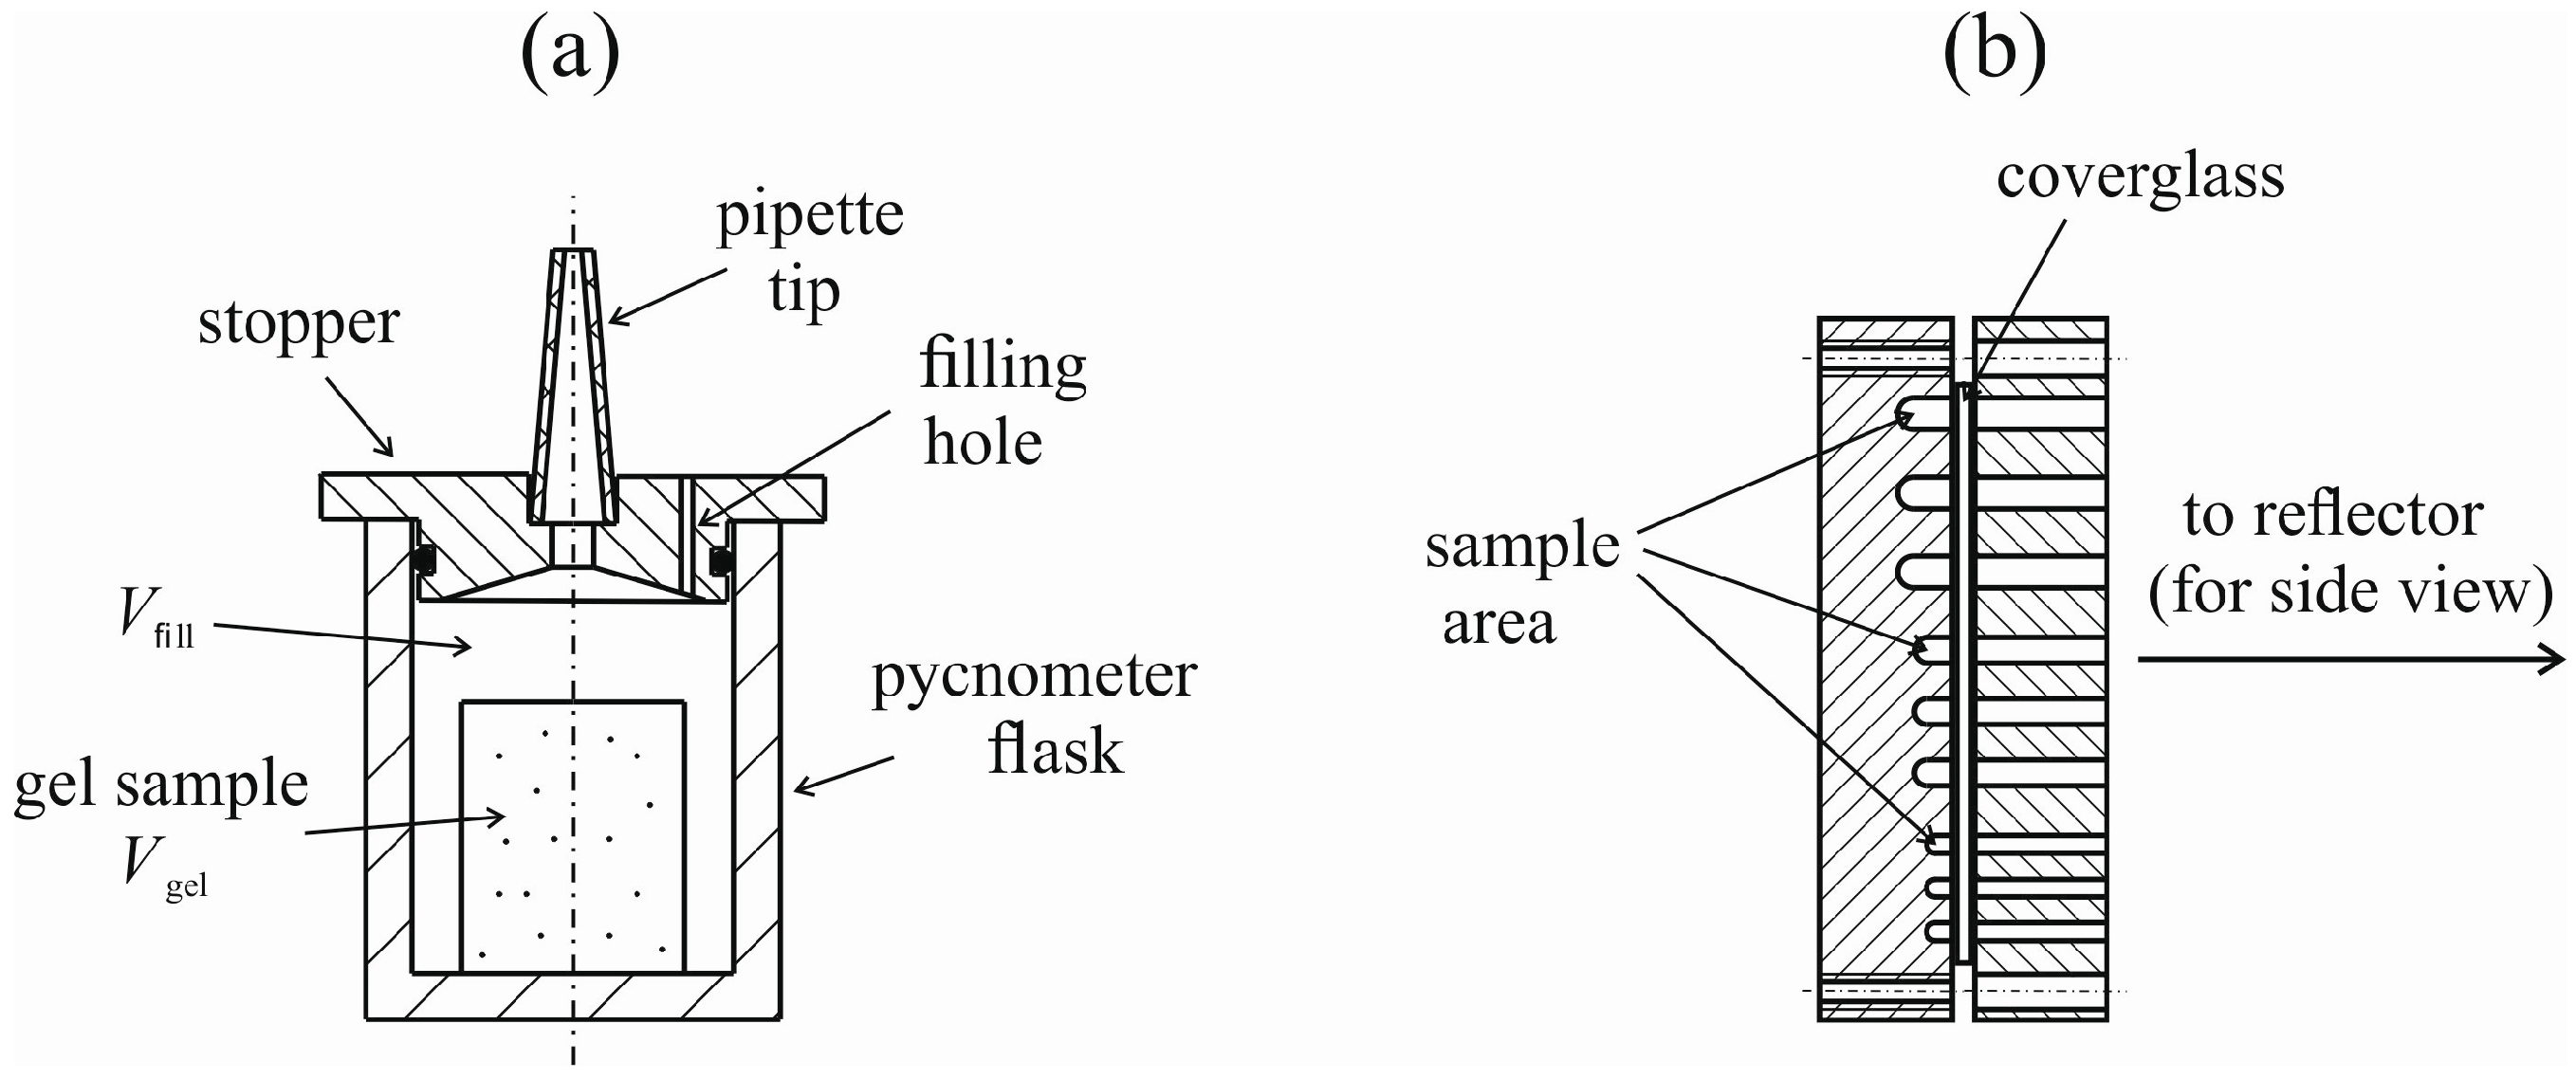
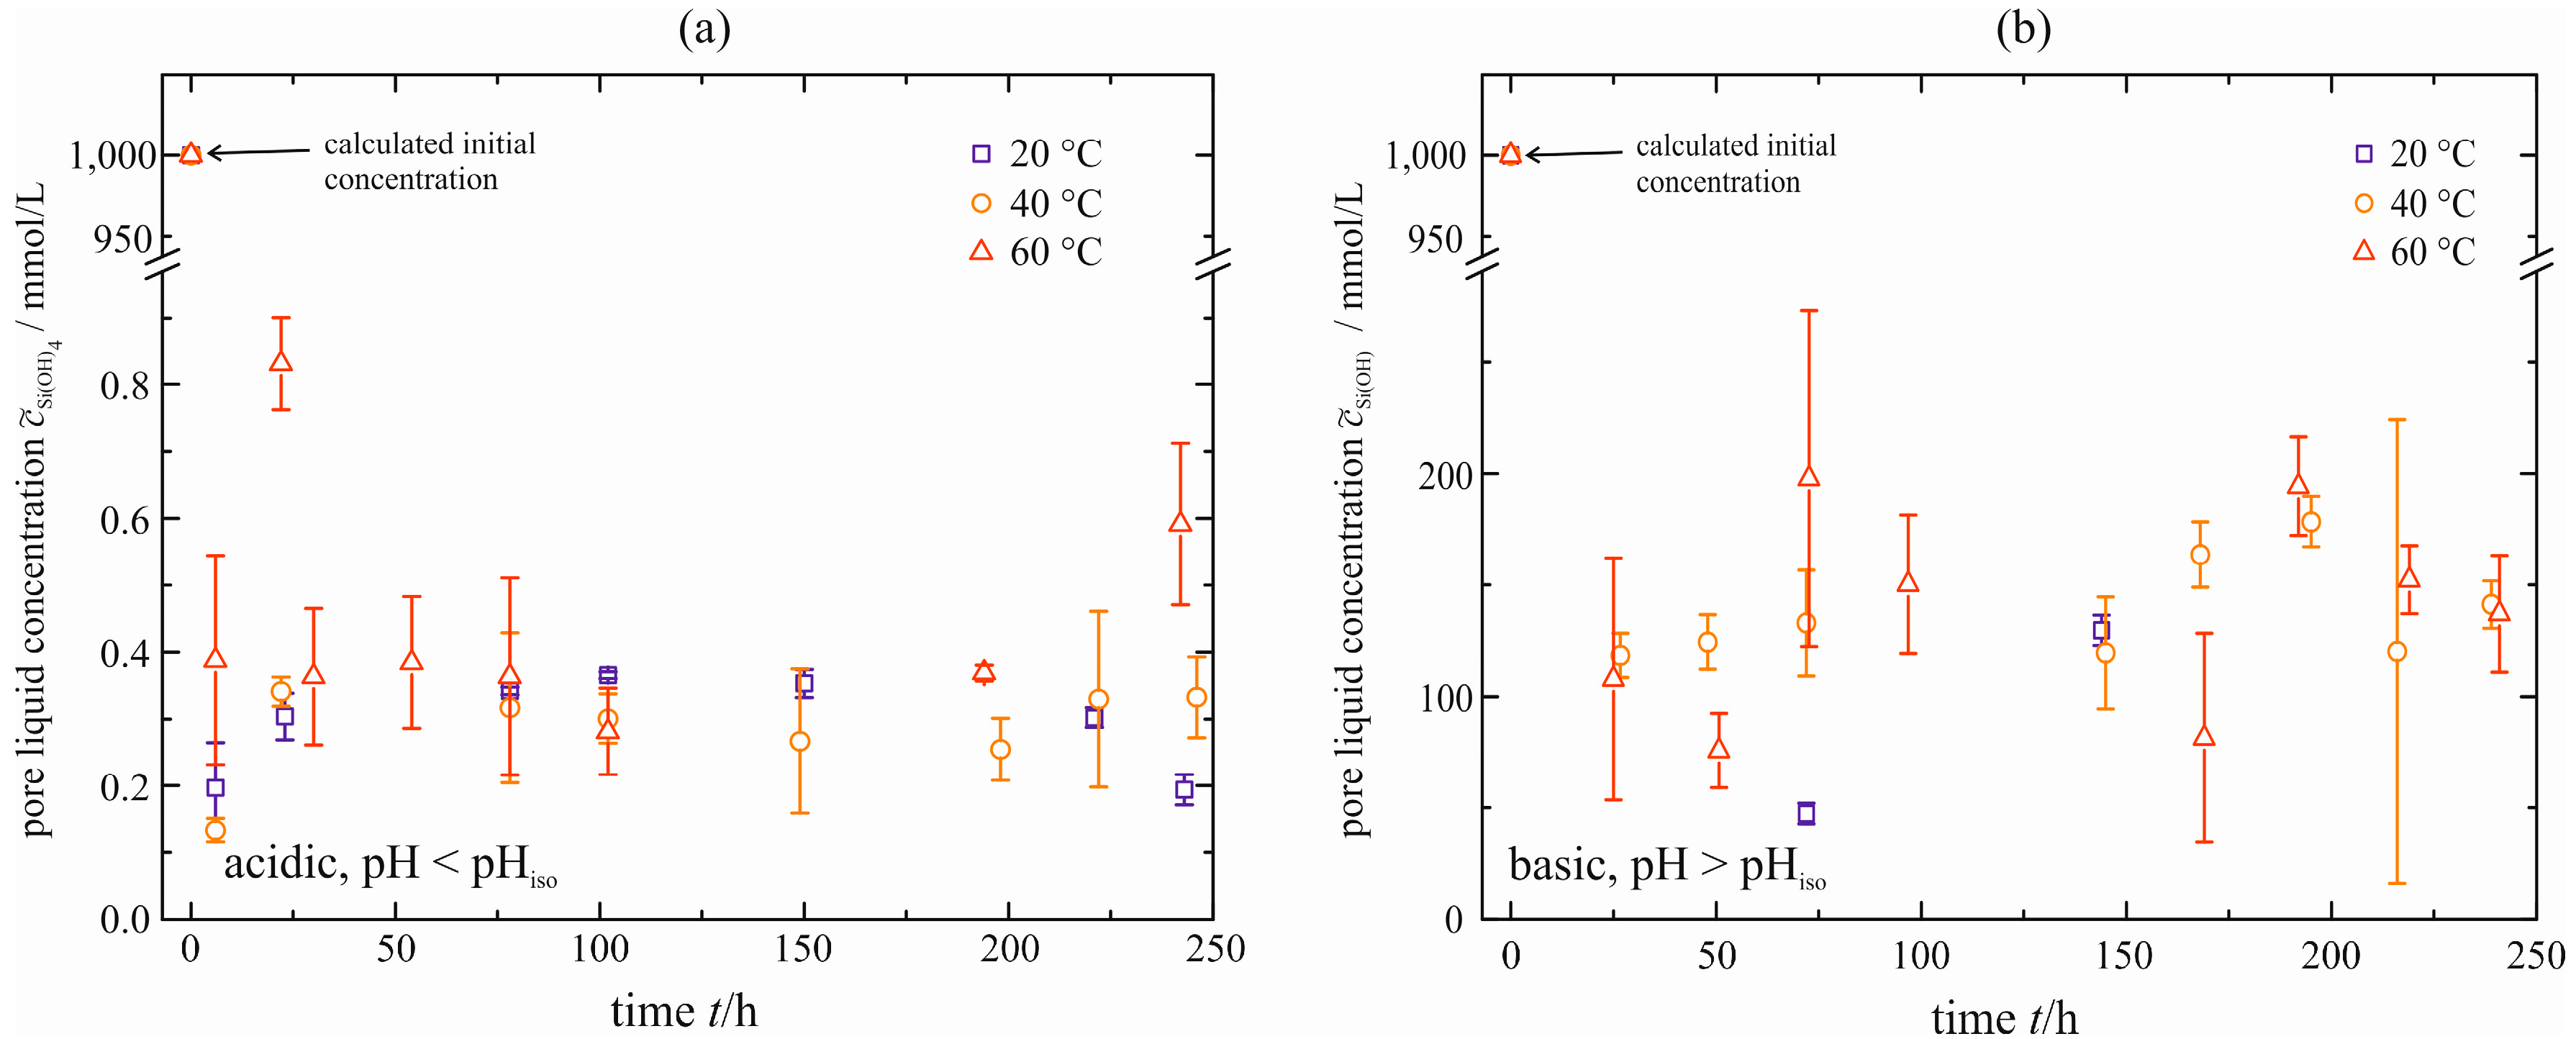
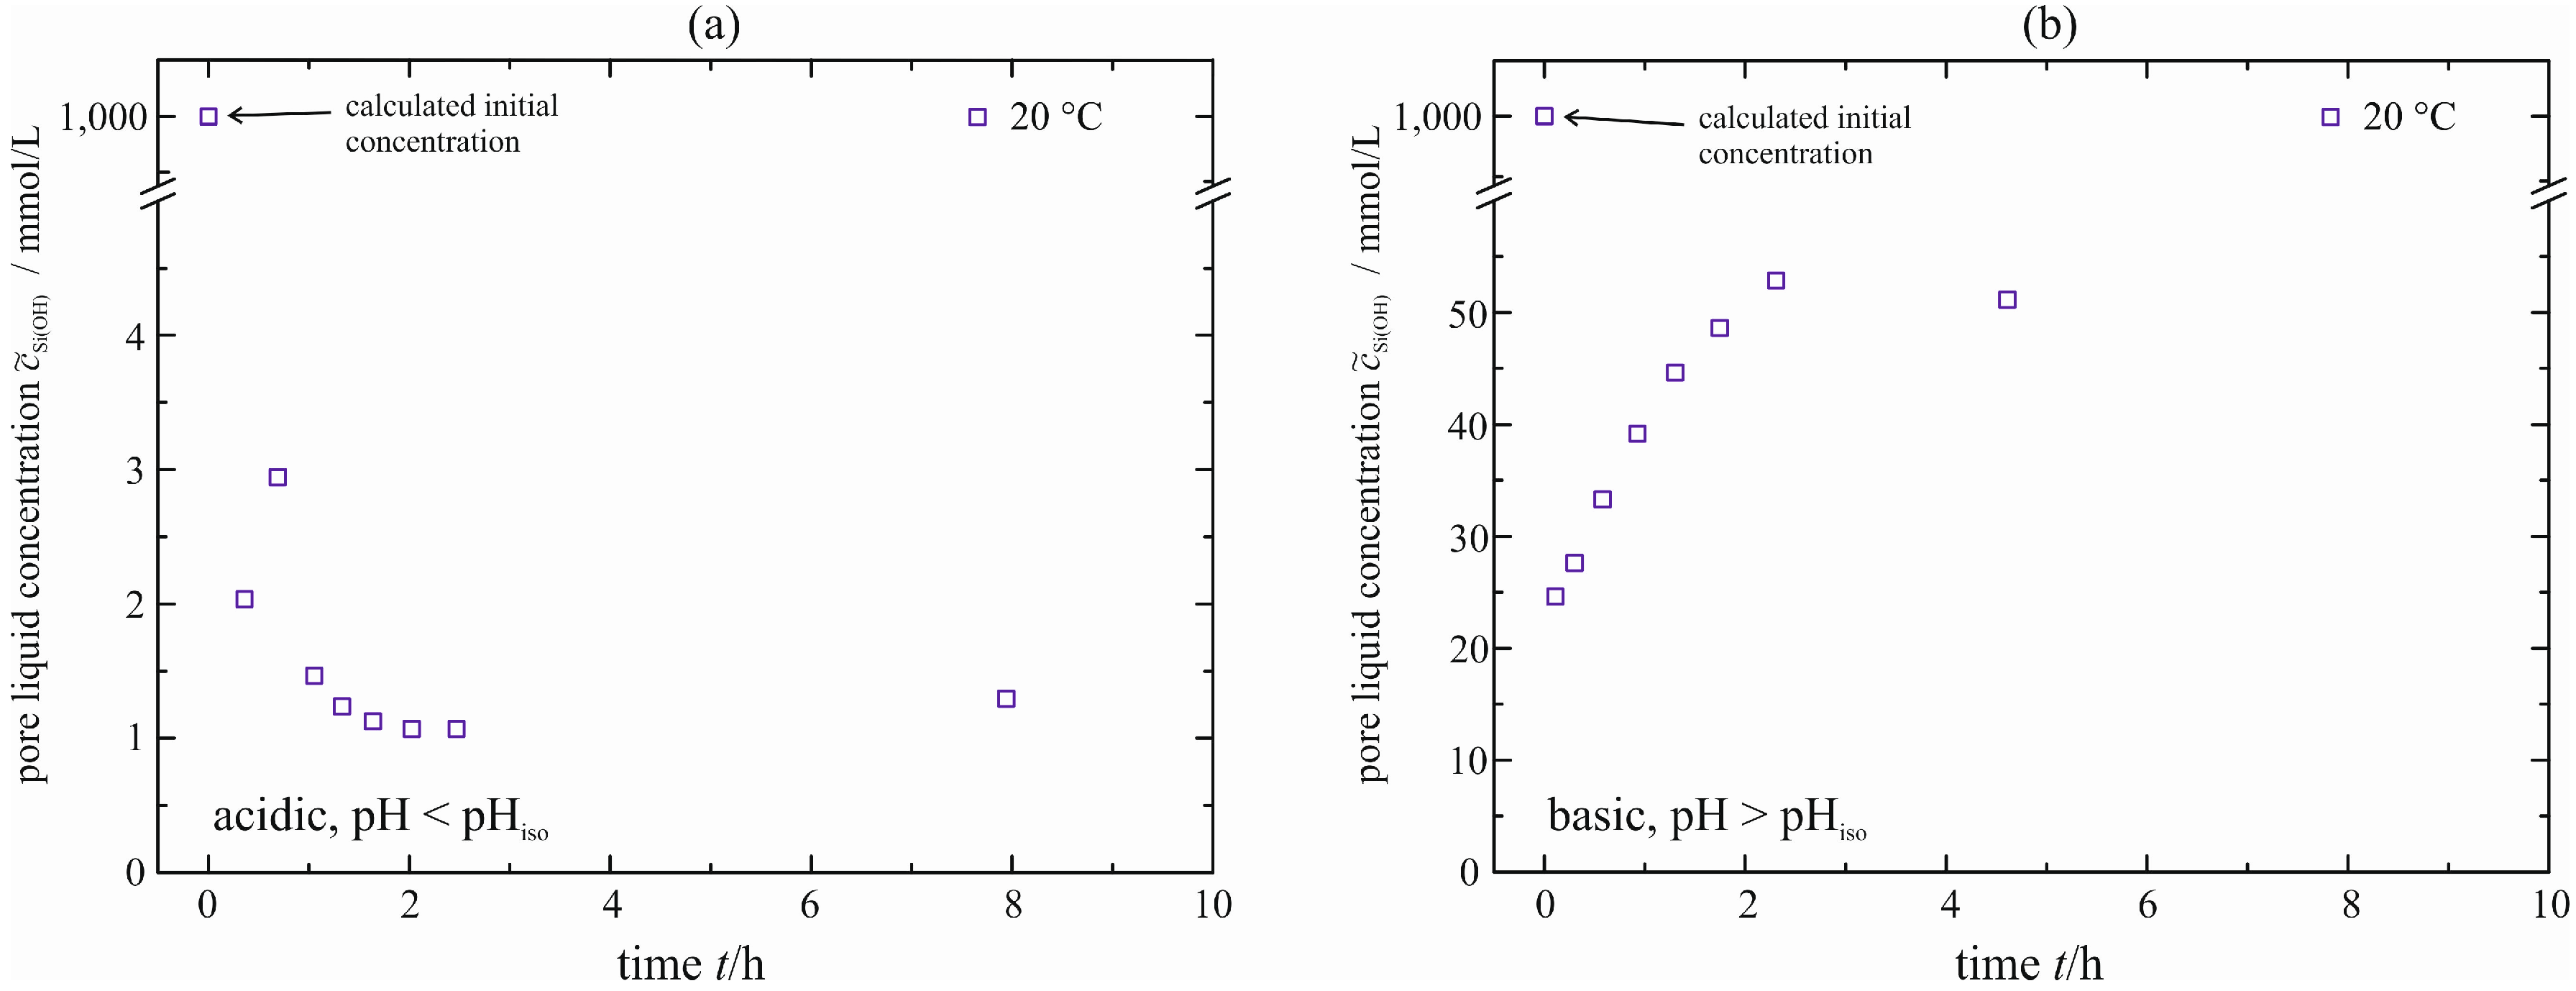
The concentration of monomeric silicic acid in the pore liquid squeezed out is determined to monitor a possible residual supersaturation S. Therefore, the pore liquid is analyzed spectroscopically, as described by Alexander [17]. The courses are shown in Figure 9. The initial concentration c ˜ Si(OH) 4 ( t = 0 ) of monomeric silicic acid is determined and calculated by the weight of sodium silicate solution used. A very strong reduction to concentrations in order of c ˜ Si(OH) 4 = 0.2–0.4 mmol/L is obtained for the acid-catalyzed gel (Figure 9a). They are within the solubility limit of ≤2 mmol/L given by Iler [2]. There is no distinct change with time t and temperature. The latter can be explained by the solubility of monomeric silicic acid that is nearly independent of temperature in this range of pH [3]. In the case of the base-catalyzed gel (Figure 9b), this reduction is much less distinct ( c ˜ Si(OH) 4 = 100–200 mmol/L). This is due to the higher pH, resulting in the increase of solubility c ˜ Si(OH) 4 . As already stated for the acid-catalyzed gel, there is no distinct dependency on temperature although the solubility of monomeric silicic acid increases strongly with temperature for the base-catalyzed polymerization. This might be due to the fact that the spectroscopic analysis could not be performed at elevated temperature, but at room temperature (~20 °C). Thus, monomeric silicic acid can polymerize and lower the concentration in the pore liquid squeezed out.
Figure 9. Concentration of monomeric silicic acid in the pore liquid of cylindrical samples, acid-catalyzed (a) and base-catalyzed (b), natural syneresis.
Polymers 07 01528 g009
For reasons still not explained, the concentration measured is higher than the solubility calculated with Equation (1). This fact is confirmed by the pore liquid that becomes turbid if stored for several days at constant temperature. It seems as if new solid is formed when the pore liquid is separated from the solid. However, an unambiguous increase of the concentration with temperature, as presented previously in the state-of-the-art, cannot be stated. If any, there is only a small tendency for both gels.
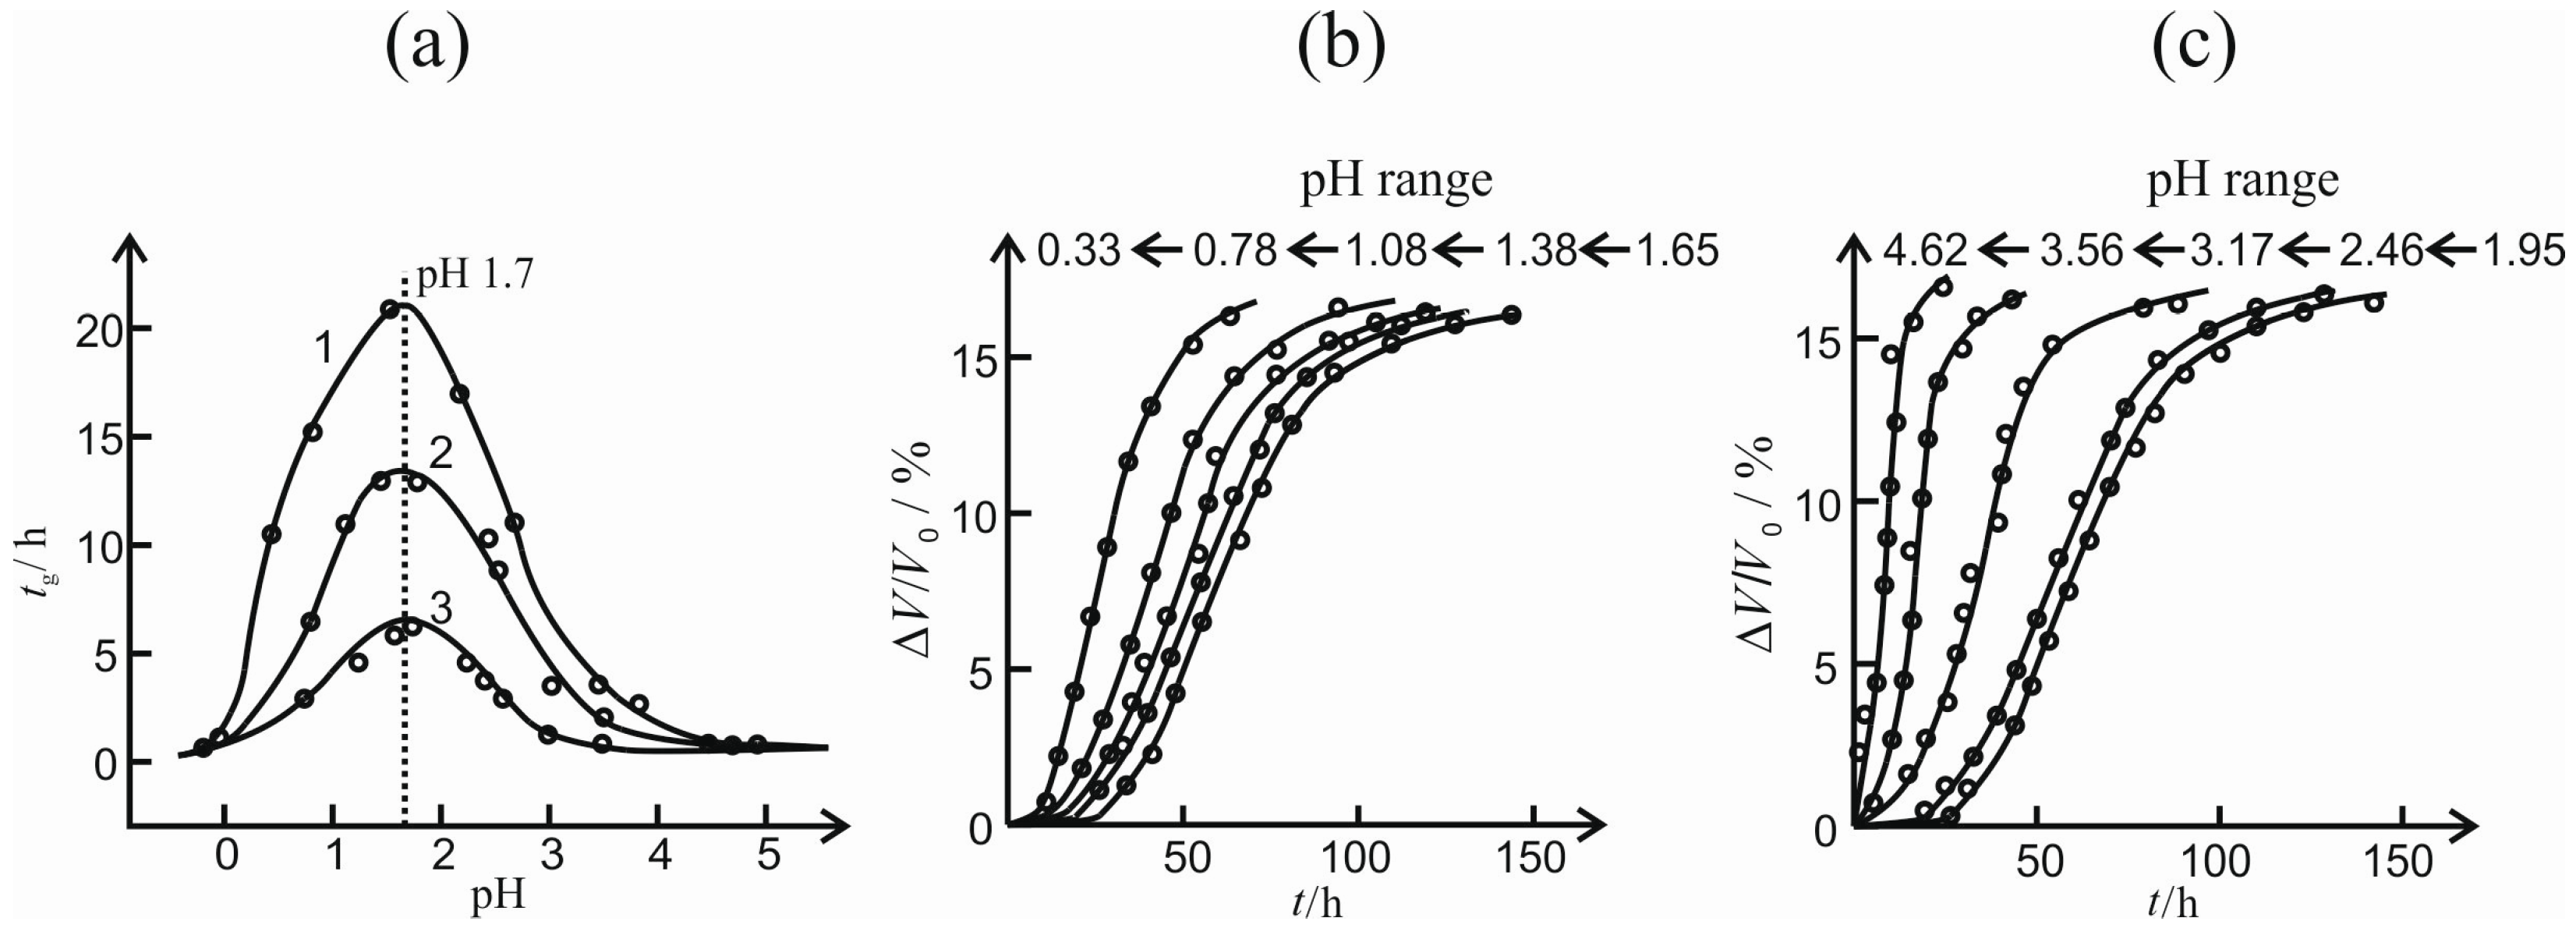
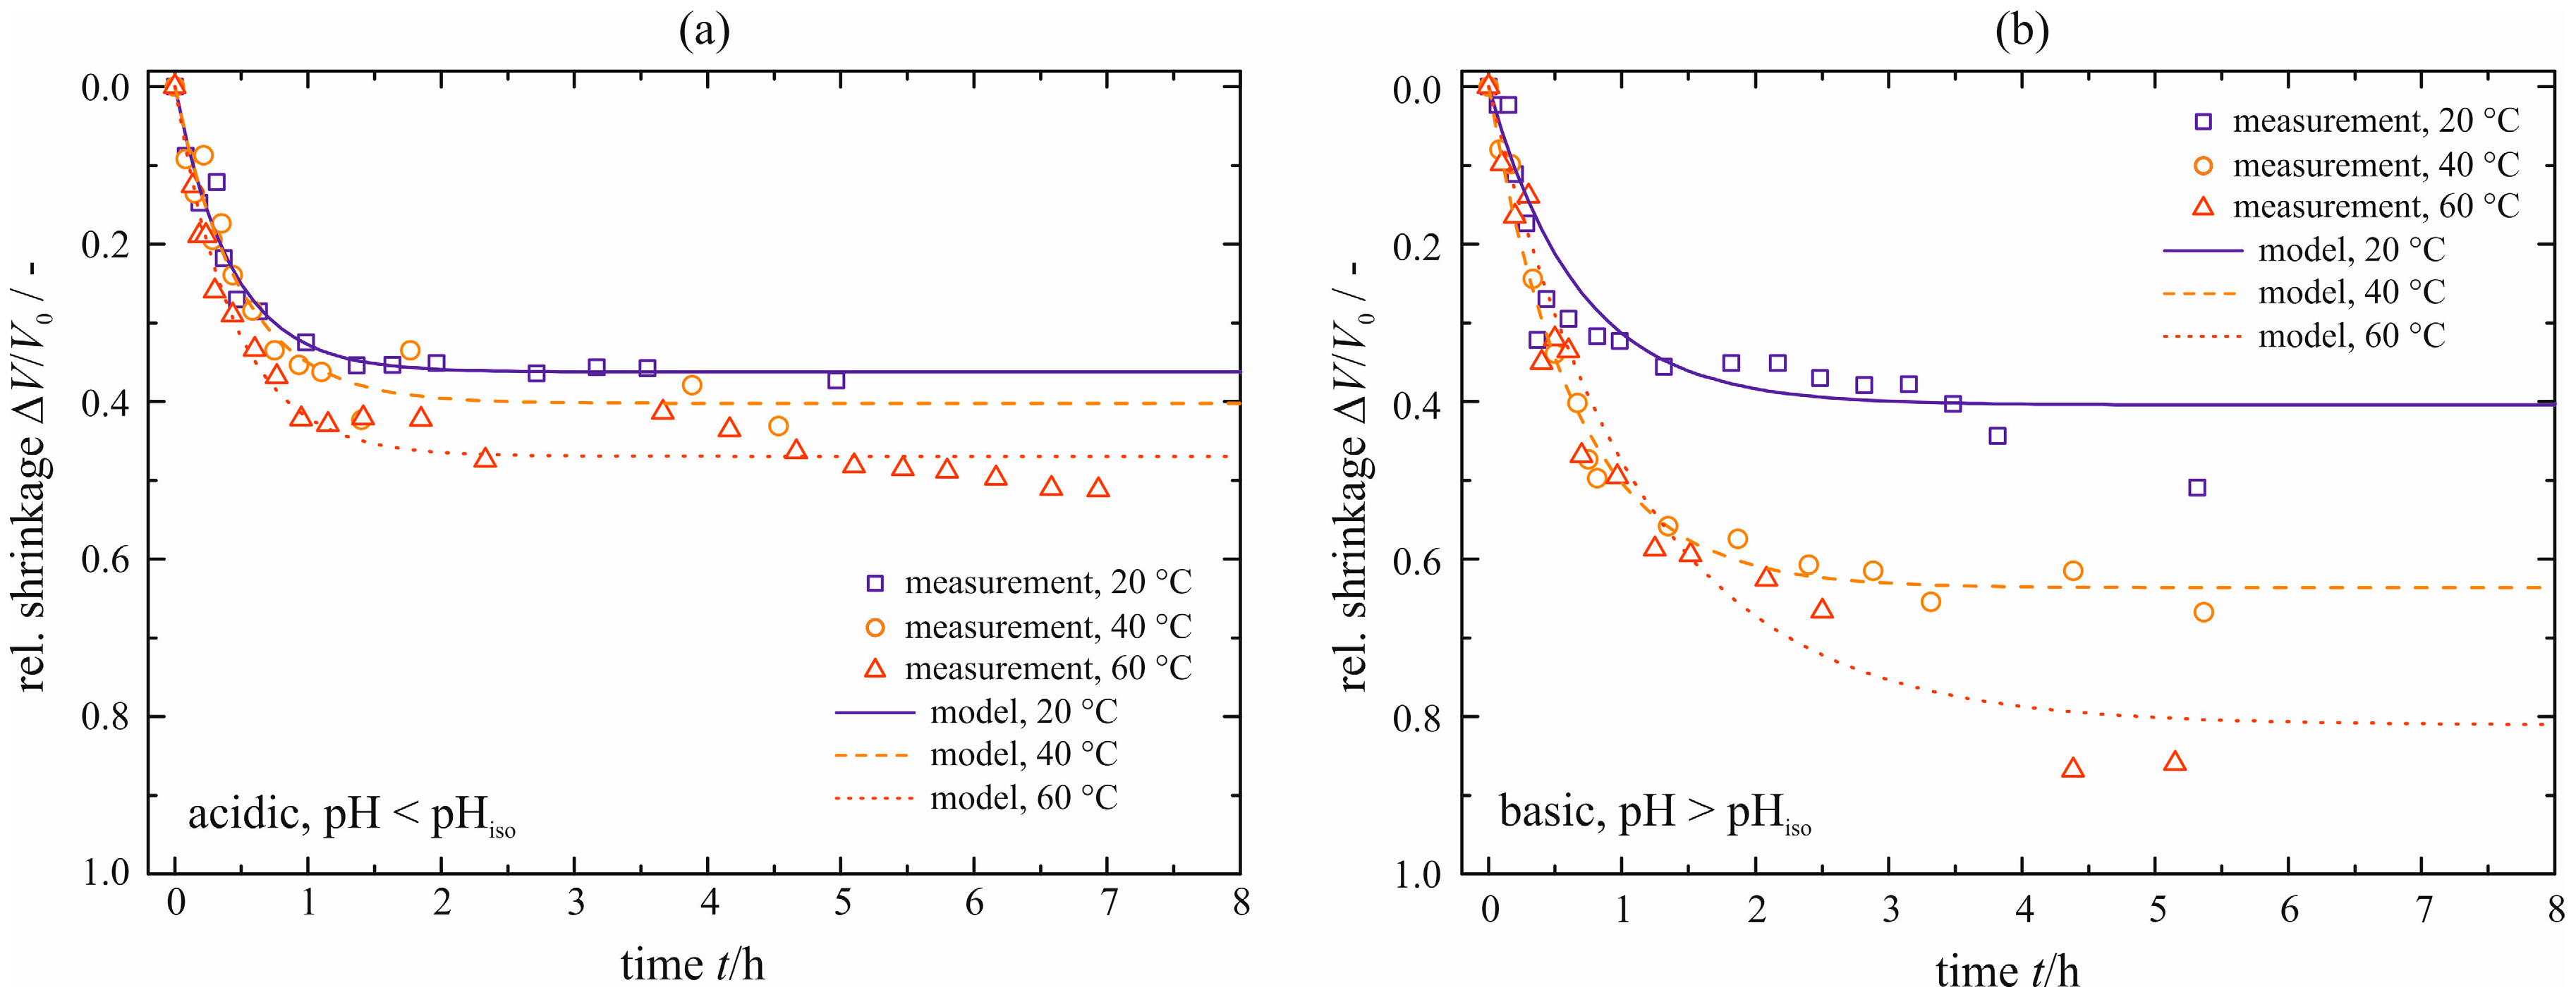
The sample size affects the syneresis behavior strongly. Therefore, small gel droplets (dDrop ≈ 3 mm) instead of the cylindrical samples are prepared and examined for their syneresis behavior depending on pH and temperature. The courses of shrinkage of the gel droplets are depicted in Figure 10.
Compared to Figure 8, the different scaling of the x-axis should be noted. Smaller samples consolidate much faster, clearly showing the dependency between the syneresis rate and sample size. Furthermore, the maximum shrinkage ΔV/V0|max increases for both types of catalysts and, in the case of the acid-catalyzed gel, even fans out with increasing temperature. This behavior cannot be observed for the cylindrical samples and, thus, must be attributed to the smaller sample size. There is no great difference between the courses for both types of catalyst during the first 30 min. This is due to the constant temperature of 20 °C during this period. Thereafter, the temperature is set to the values given in Figure 10. Thus, each droplet must be heated firstly to this temperature. This might be the reason for the almost similar course in the case of 40 and 60 °C for t ≤ 2 h, especially for the base-catalyzed gel droplets. All model parameters for the gel droplets are summarized in Table 2.
Figure 10. Relative shrinkage ΔV/V0 of the gel droplets, natural syneresis for different temperatures ϑ, acid-catalyzed (a) and base-catalyzed (b).
Polymers 07 01528 g010
Table 2. Maximum shrinkage ΔV/V0|max and characteristic time constant τ for the gel droplets (dDrop ≈ 3 mm), natural syneresis, model parameters.
Temperature ϑ/°CMaximum Shrinkage ΔV/V0|max/-Time Constant τ/h
Acid-catalyzed pH < pHisoBase-catalyzed pH > pHisoAcid-catalyzed pH < pHisoBase-catalyzed pH > pHiso
200.370.300.400.67
400.410.390.640.57
600.480.510.770.95
An analysis of the pore liquid as performed for the cylindrical gel samples is not possible due to the very small amounts of pore liquid squeezed out of the gel droplets.

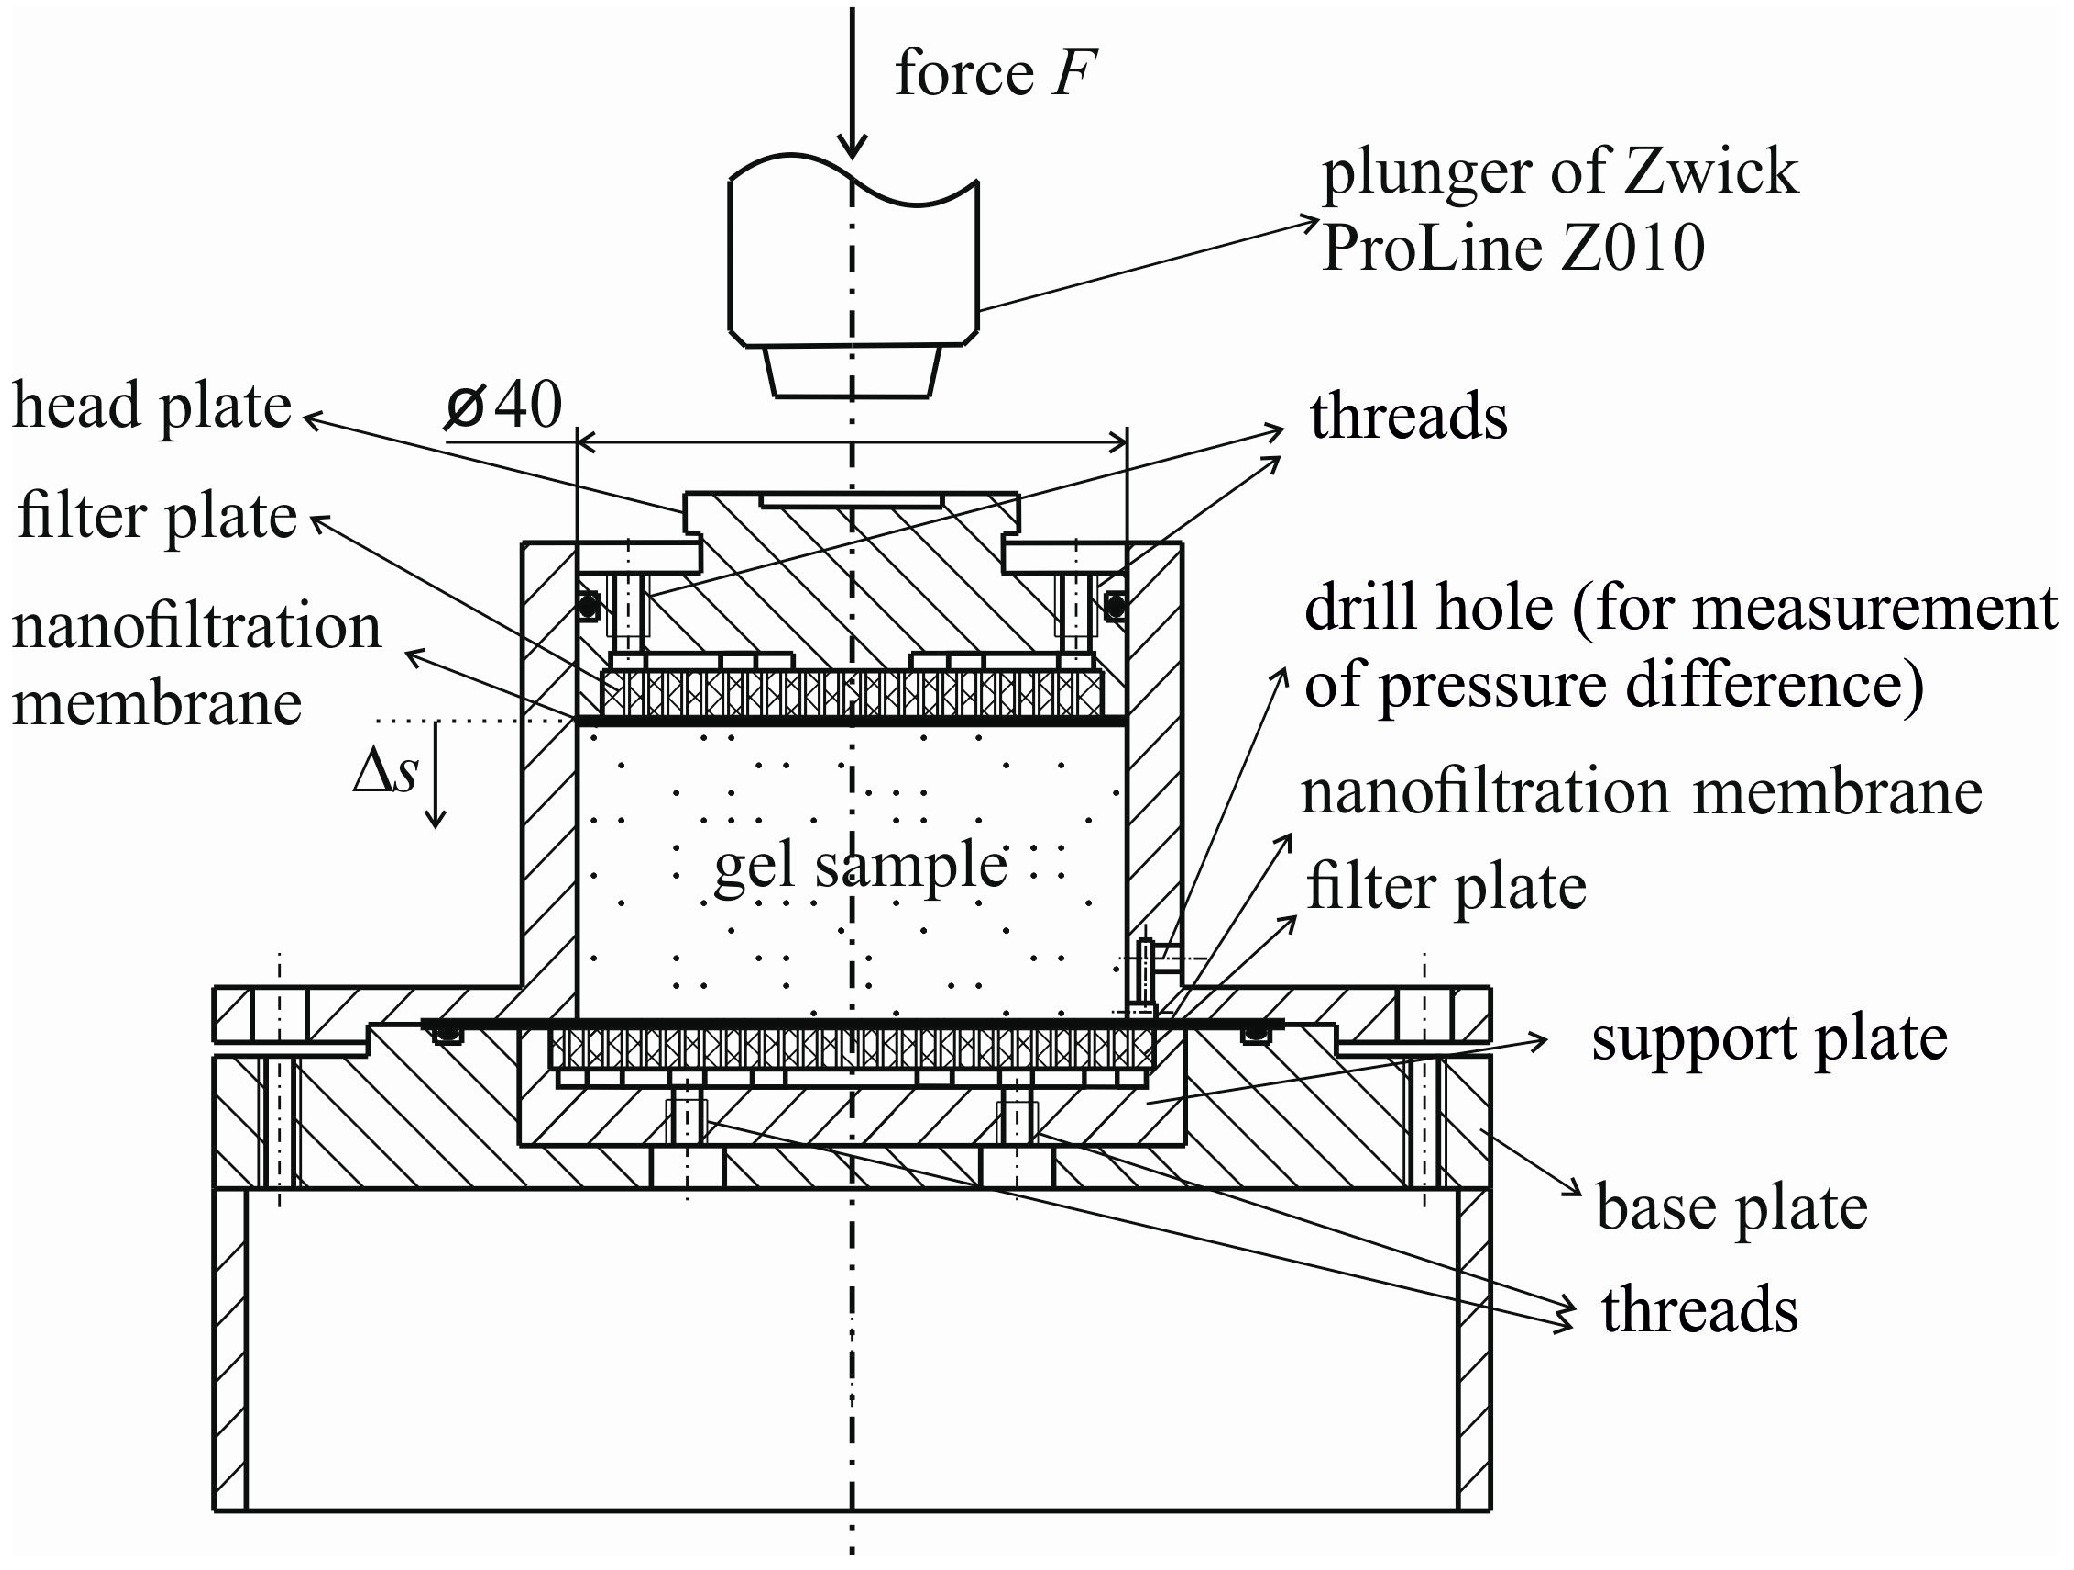
4.2. Enforced Syneresis

An additional process parameter, that is the pressure difference Δp induced by the external force F, is introduced for enforced syneresis. Generally, a membrane is necessary to retard the solid formed. Two different membranes are investigated with regard to their suitability for enforced syneresis. A simple and easy to perform experiment comprising a pressure nutsch and the specific membrane is set up. The pressure nutsch is filled with Si standard solution (Certipur®, Merck Millipore) already used for the calibration of UV/Vis measurements. The nutsch is operated with pressurized air at Δpair = 4 bar and the concentration in the permeate is determined with the same method described in the previous section. 
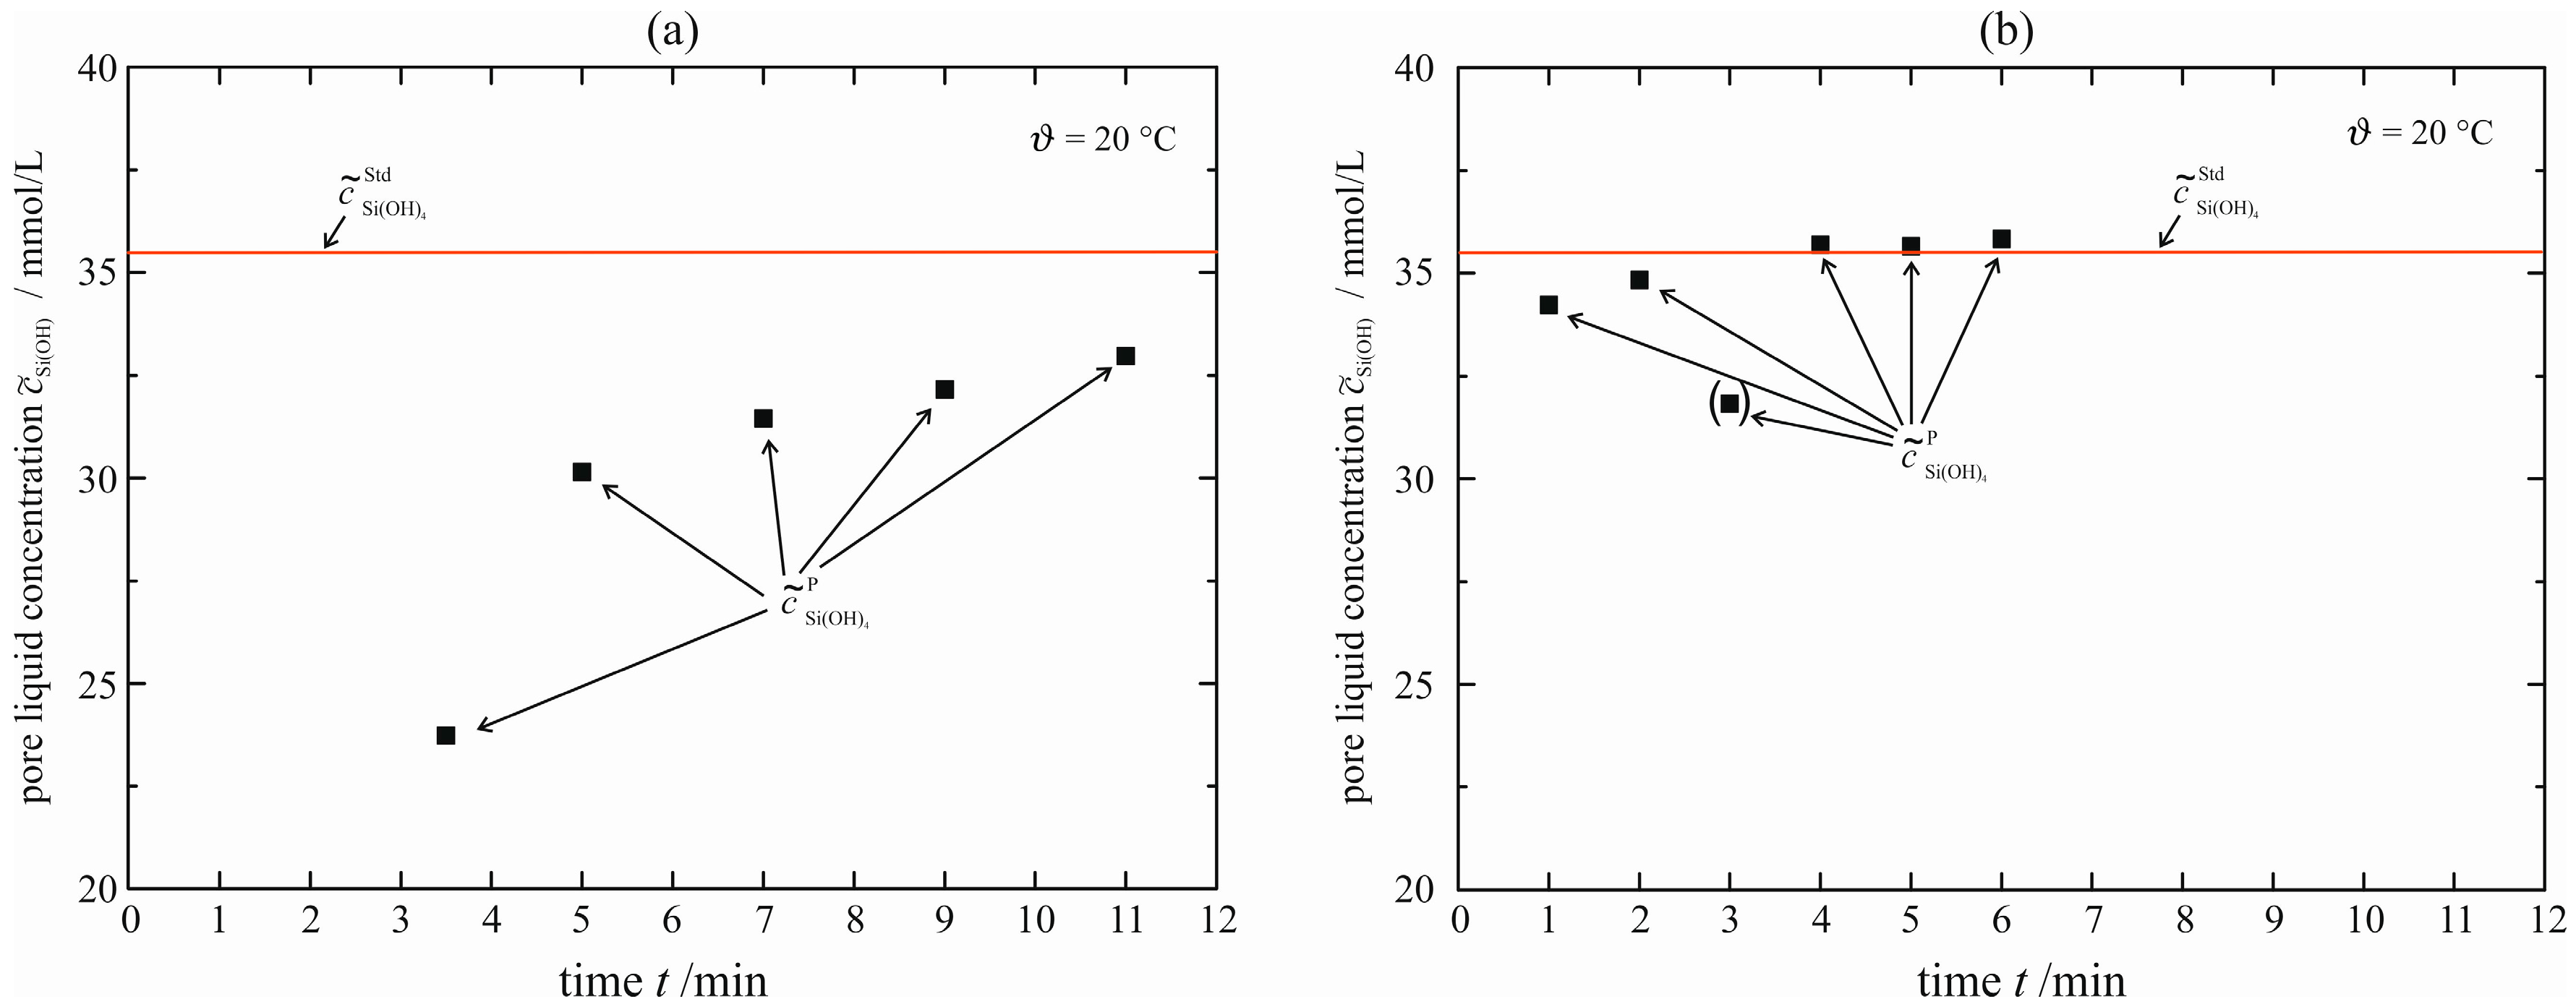
Figure 11 shows the courses of permeate concentration for the two different membranes. The Si standard solution has a molar concentration of c ˜ Si(OH) 4 Std = 35.7 mmol/L and is depicted as a horizontal line. The permeate concentrations c ˜ Si(OH) 4 P (a permeate volume of VP = 1 mL is chosen) for the membrane Dow Filmtec NF270 (Figure 11a) is always lower than the standard solution that is filled into the pressure nutsch. Thus, that membrane retards the monomeric silicic acid and, when applied to enforced syneresis, an influence on the syneresis process cannot be excluded. Using the membrane Microdyn-Nadir NP010, the permeate concentrations reach the concentration of the standard solution almost immediately. This means that much less monomeric silicic acid is stored inside or held back by the membrane. For this reason, the latter membrane is used to retard the solid in the case of enforced syneresis. In the previous publication [5], experiments of the acid-catalyzed gel were performed with the membrane Dow Filmtec NF270. All these experiments are repeated with the membrane Microdyn-Nadir NP010. There is no significant difference in the results between the two membranes. However, this is not valid for the base-catalyzed gel.
Figure 11. Concentration of monomeric silicic acid in the permeate for membrane Dow Filmtec NF270 (a) and Microdyn-Nadir NP010 (b) upon filtration of Si standard solution (Certipur®, Merck Millipore).
Polymers 07 01528 g011
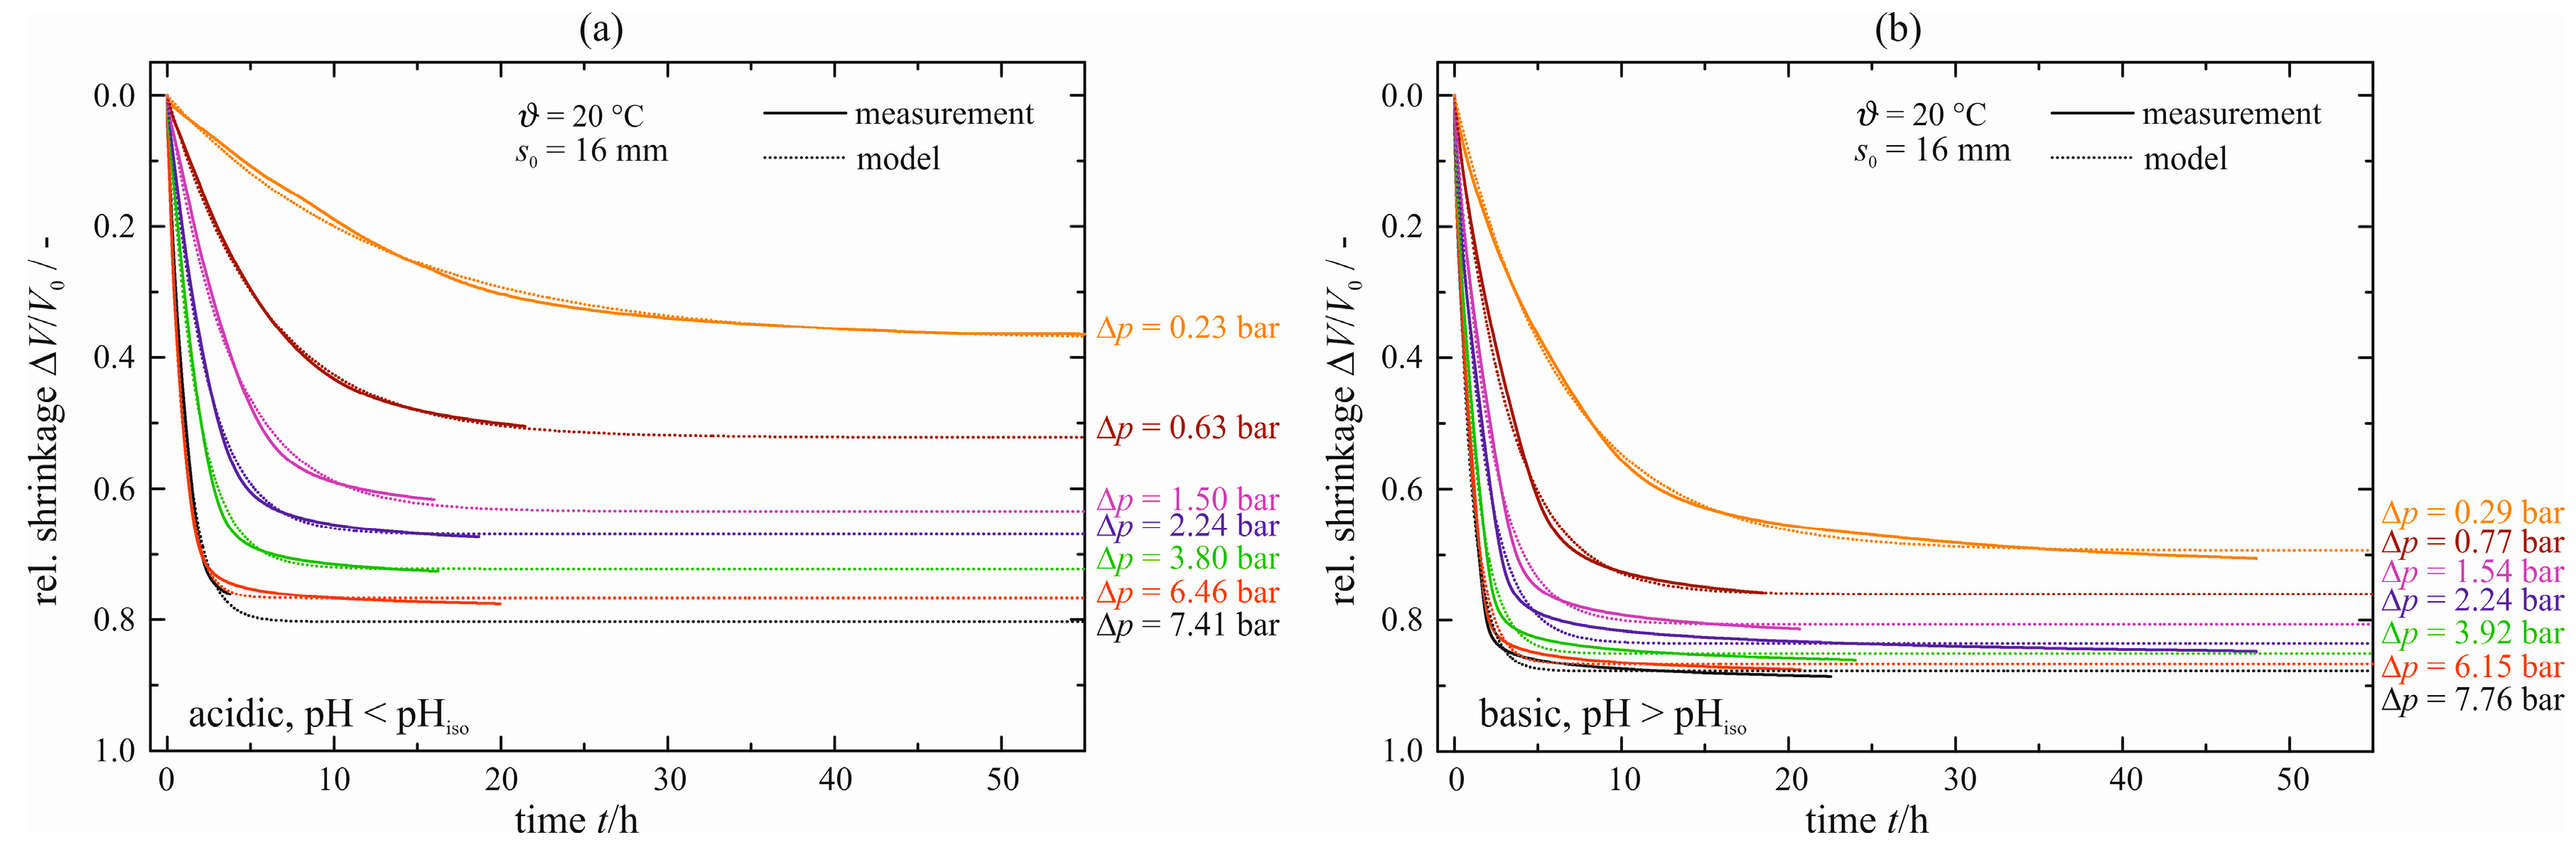
The courses of enforced syneresis for ϑ = 20 °C with an initial gel sample height s0 = 16 mm are shown in Figure 12. Both measured (solid lines) and modeled data (dashed lines), see Equation (3), are given. As might be expected, all curves are shifted to larger maximum shrinkages and shorter times with increasing pressure difference Δp, independently of the catalyst. When comparing the acid- with the base-catalyzed gel, the latter exhibits a less distinctive spread although the same range of pressure differences Δp is covered. A reason might be the softer solid structure, leading to a lower resistance against the pressure difference. This is supported by a larger maximum shrinkage for equal pressure differences Δp (e.g., ΔV/V0|max = 0.8 and 0.63 at Δp = 1.54 and 1.50 bar, respectively).
Figure 12. Relative shrinkage ΔV/V0 of enforced syneresis for s0 = 16 mm and ϑ = 20 °C, acid-catalyzed (a) and base-catalyzed (b).
Polymers 07 01528 g012
All values for the maximum shrinkage ΔV/V0|max and the characteristic time constant τ are summarized in Table 3. As can be seen, the maximum shrinkage almost halved from maximum to minimum pressure difference for the acid-catalyst gel, whereas the base-catalyst gel shows a reduction of merely one fifth. Exactly the inverse applies for the characteristic time constant τ. A 13-fold increase stands against a 6–7-fold increase.
Until now, the concentration of monomeric silicic acid in the permeate is given merely for Si standard solution filled in. Adopting the same procedure, the concentration in the permeate is measured for the acid- and base-catalyzed gel in order to compare them with the concentrations of natural syneresis. This is done exemplarily for Δp = 3.80–3.92 bar and ϑ = 20 °C. The courses are given in Figure 13. In the case of the acid-catalyzed gel, there is a strong reduction in the concentration from c ˜ Si(OH) 4 ( t = 0 ) = 1000 mmol/L to c ˜ Si(OH) 4 ≈ 1.0–1.5 mmol/L. A decrease in concentration (from 1000 to 25 mmol/L) and a subsequent increase to approximately 55 mmol/L is observed for the base-catalyzed gel. Neither are determined for natural syneresis (see Figure 9). We assume an additional solid formation directly on the membrane due to the rising turbidity of the pore liquid for natural syneresis described already in Section 4.1. To prove this assumption, the pore liquid of natural syneresis (base-catalyzed gel) is filled into the pressure nutsch. Therefore, the influence of the solid is eliminated and only the behavior of pore liquid and membrane is investigated. The analysis of the pore liquid with respect to monomeric silicic acid yields a very similar diagram to Figure 13b.
Table 3. Maximum shrinkage ΔV/V0|max and characteristic time constant τ, enforced syneresis, s0 = 16 mm and ϑ = 20 °C.
Pressure Difference Δp/barMaximum Shrinkage ΔV/V0|max/-Time Constant τ/h
Acid-catalyzed pH < pHisoBase-catalyzed pH > pHisoAcid-catalyzed pH < pHisoBase-catalyzed pH > pHiso
0.23–0.290.380.6913.16.5
0.63–0.770.520.765.93.2
1.50–1.540.630.813.82.1
2.24–2.240.670.832.31.7
3.80–3.920.720.851.71.1
6.15–6.460.770.871.11.0
7.41–7.760.800.881.00.9
Figure 13. Concentration of monomeric silicic acid in the pore liquid, acid-catalyzed (a) and base-catalyzed (b), enforced syneresis for Δp = 3.80–3.92 bar.
Polymers 07 01528 g013
A decrease and a subsequent increase of permeate concentration is observed. In addition, the time which elapsed between two samples to collect a permeate volume of VP = 1 mL increased from a few minutes directly at the beginning to several hours for the last sample although the driving pressure was constant (Δp = 4 bar) and there was still enough retentate volume present in the cell (VR ≈ ¾ VR (t = 0)). This is an indication of a buildup of an additional flow resistance. Indeed, there is a thin layer on the membrane after the termination of the experiment. However, this layer is found only for pore liquid of the base-catalyzed gel. We conclude that the layer is built up during enforced syneresis, but has no significant influence on the maximum shrinkage due to its negligibly small thickness. By contrast, there is an influence on the kinetics of syneresis that has not been able to be eliminated up to now. The courses and model parameters of enforced syneresis for ϑ = 40 and 60 °C are given in the Figures S3 and S4 and in the Tables S1 and S2 in the Supplementary Materials. Due to the increased temperature, the rate of syneresis is accelerated (smaller values for the characteristic time constant τ) for both types of catalyst. However, the maximum shrinkage ΔV/V0|max is almost unaffected for the acid-catalyzed gel, whereas larger values are obtained in the case of the base-catalyzed gel. Thus, this is a first indication of an analogous behavior between natural and enforced syneresis.
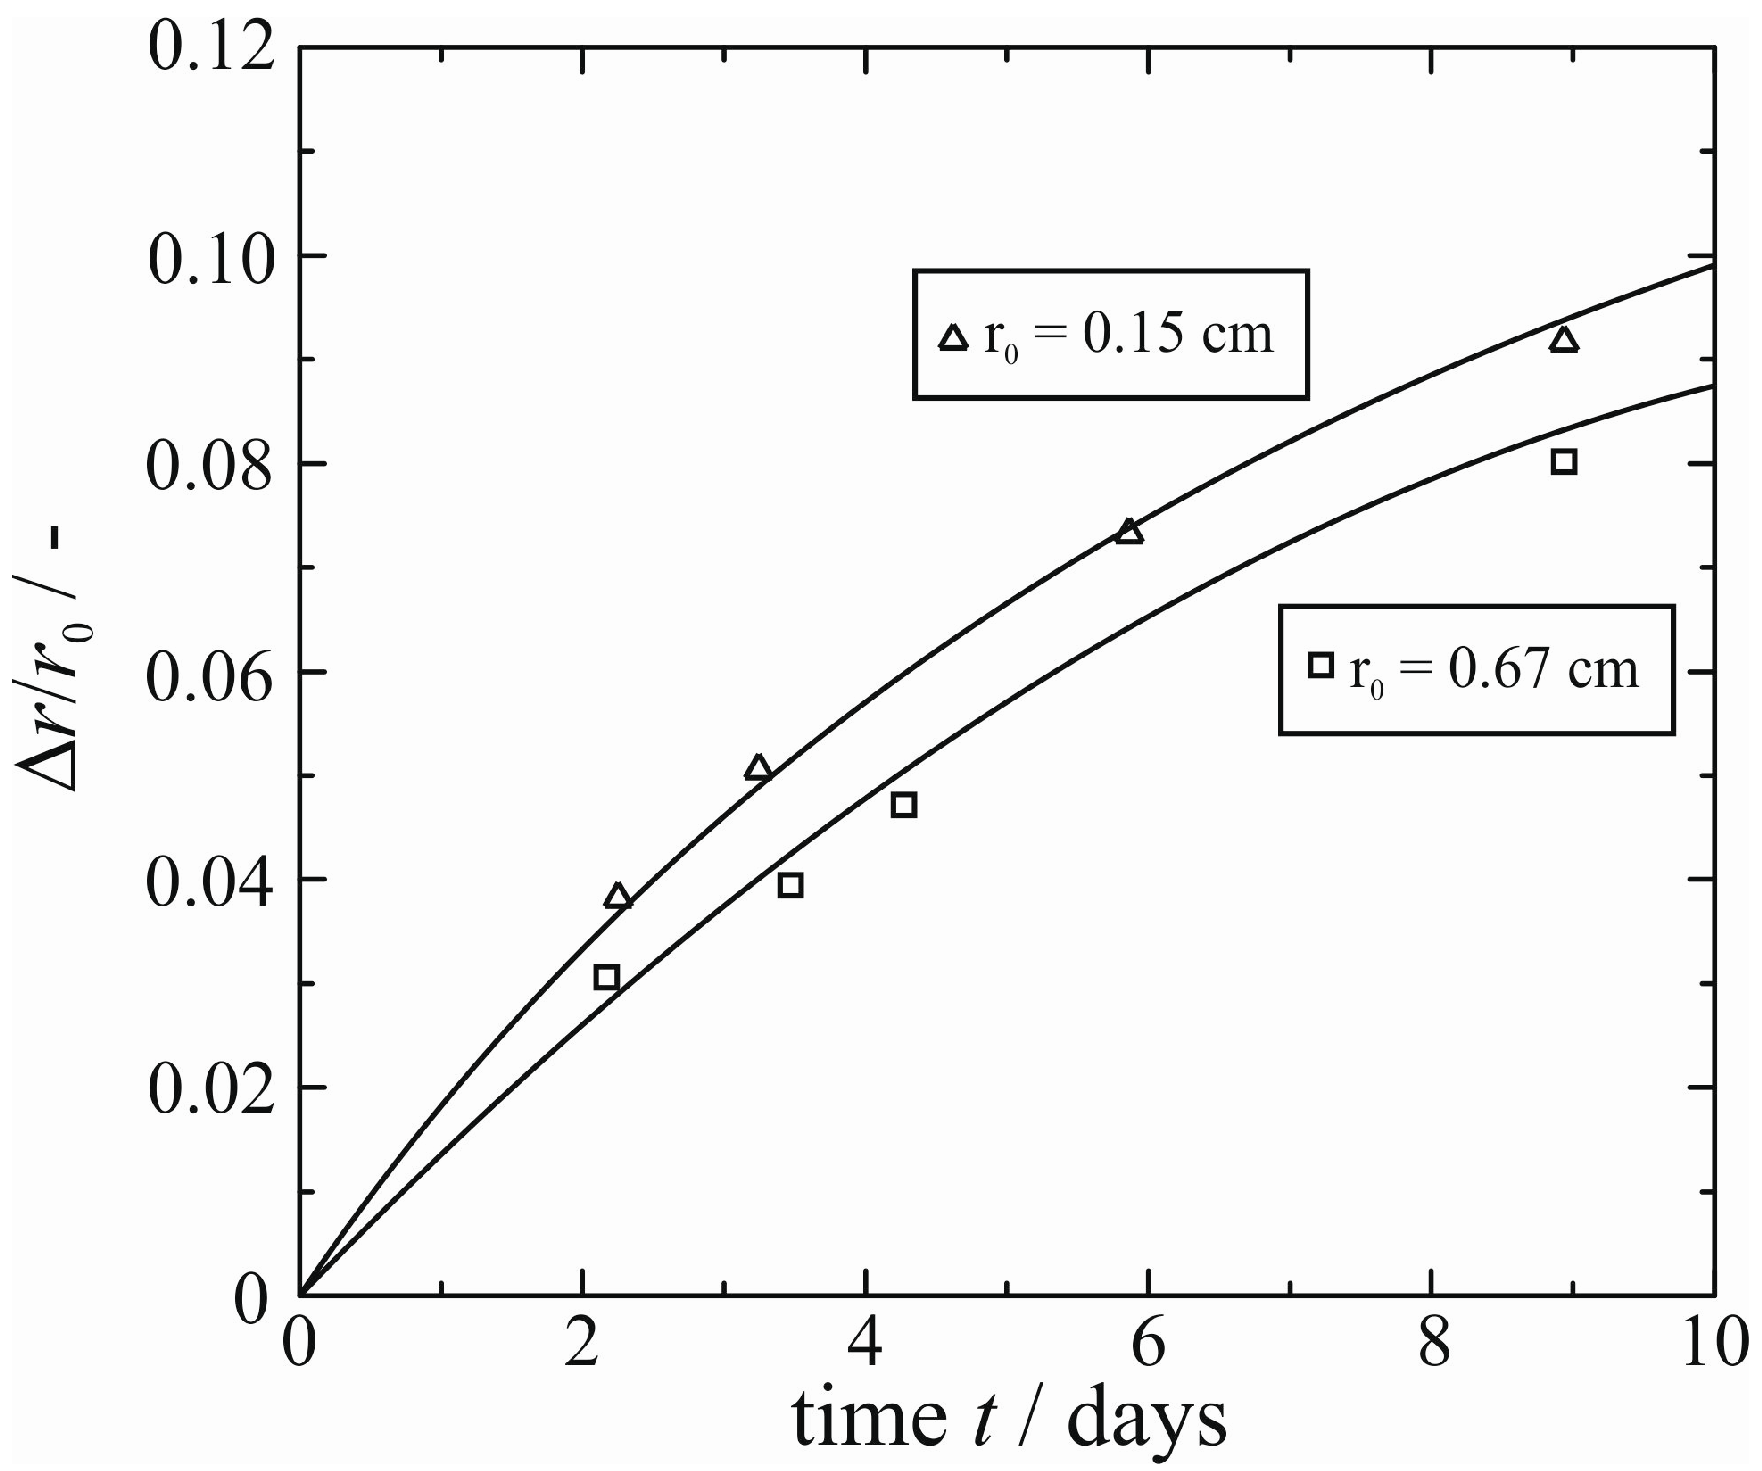
The distances that are flowed through by the pore liquid have to be equal for a quantitative comparison between natural and enforced syneresis. Assuming a radial flow within the cylindrical gel samples, this distance corresponds to the radius, that is r c y l = d c y l 2 = 6 mm. For the enforced syneresis presented above, this distance matches half of the initial gel sample height, s 0 2 
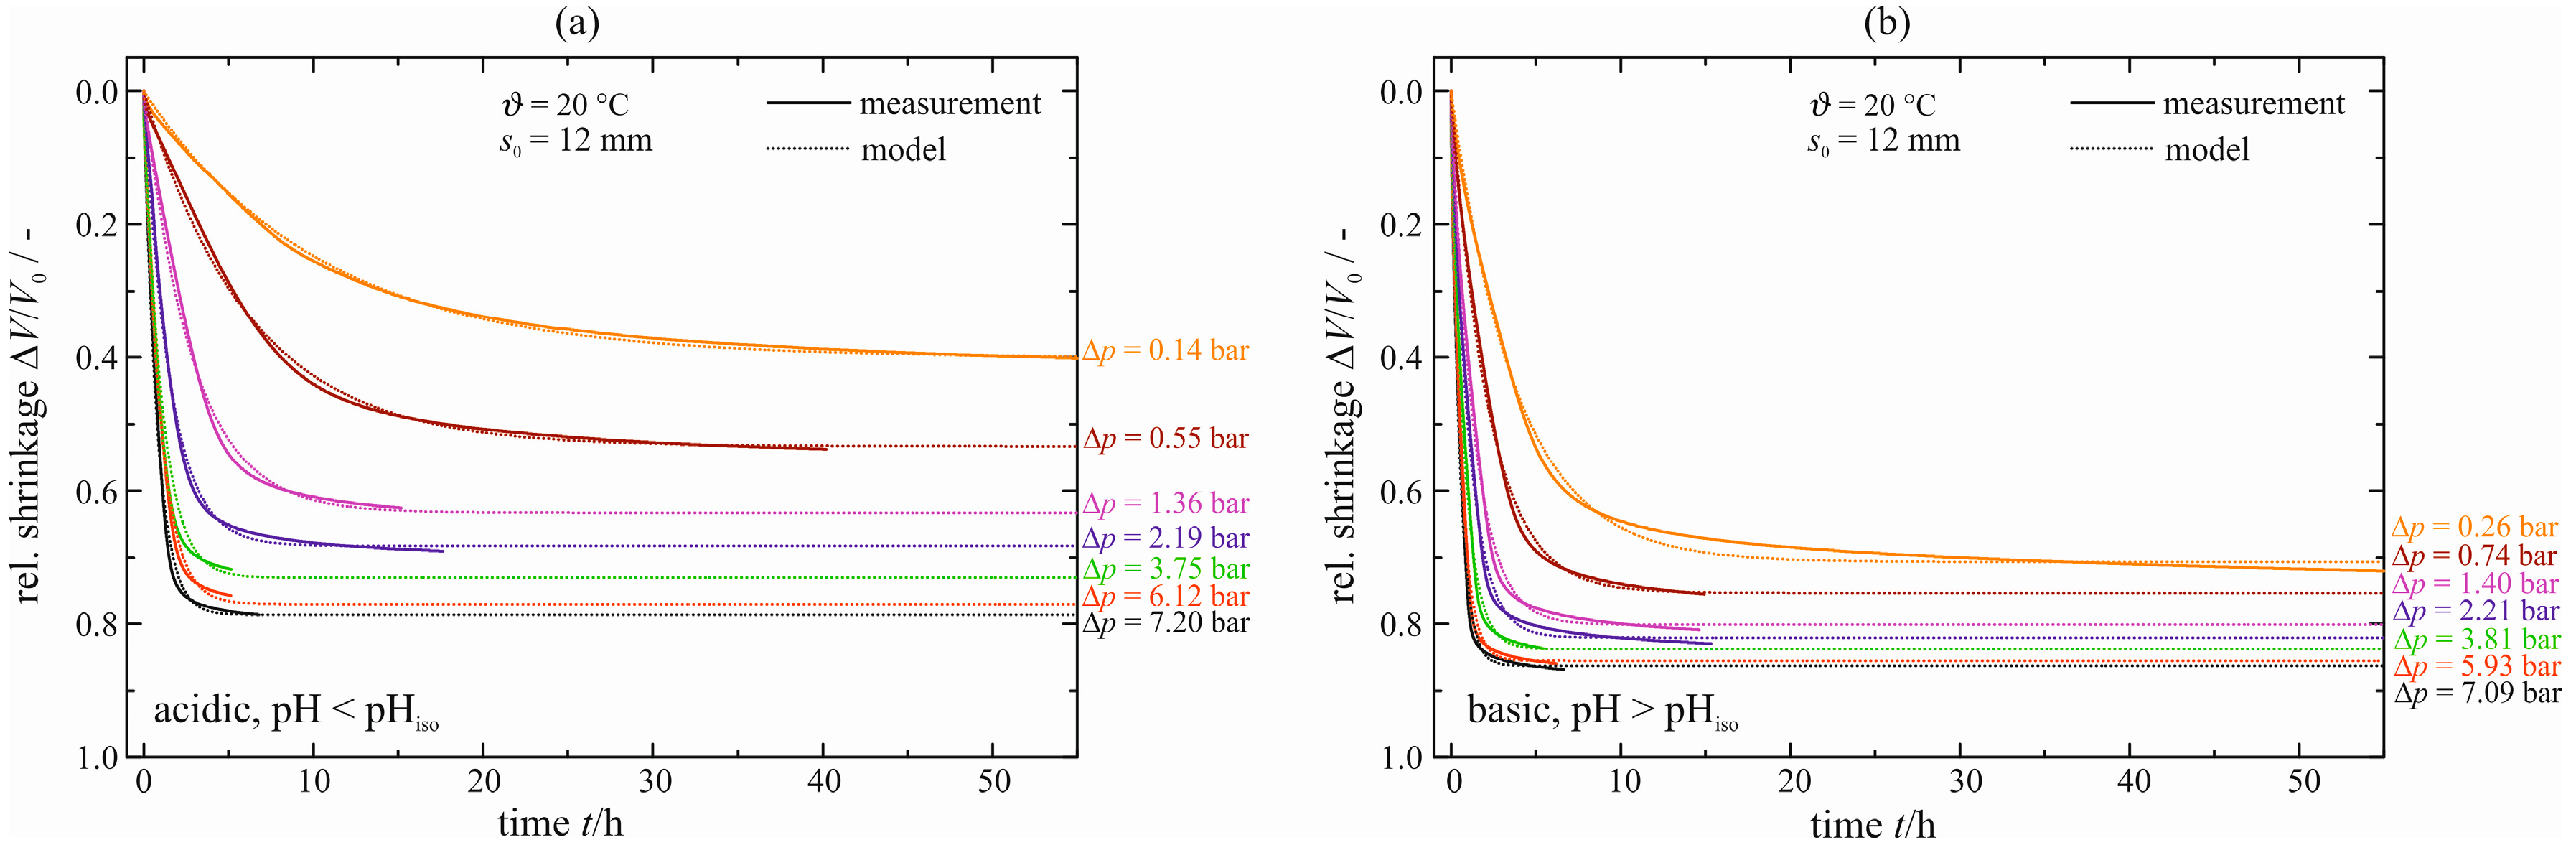
= 8 mm. These differences, albeit small, affect at least the kinetics and, potentially, the maximum shrinkage. Therefore, the initial sample height is reduced to s0 = 12 mm. The temporal courses of shrinkage are shown in Figure 14.
Figure 14. Relative shrinkage ΔV/V0 of enforced syneresis for s0 = 12 mm and ϑ = 20 °C, acid-catalyzed (a) and base-catalyzed (b).
Polymers 07 01528 g014
As might be expected from the results of natural syneresis, the kinetics of syneresis is accelerated, compared with Figure 12. This is expressed by smaller values for the characteristic time constant τ, e.g., from τ = 2.3 to 1.5 h for the acid-catalyzed gel with Δp = 2.24 and 2.19 bar, respectively. Thus, enforced syneresis behaves analogously to natural syneresis with respect to initial sample size. However, the maximum shrinkage ΔV/V0|max is virtually unaffected by the reduction of the initial gel sample height, contrary to the results of the cylindrical gel samples and droplets. All values can be found in Table S3 in the Supplementary Materials. A possible explanation is the very different order of size reduction between the cylindrical gel samples and droplets for natural syneresis, i.e., the reduction of gel sample height by 4 mm for enforced syneresis. The courses of shrinkage for elevated temperature of 40 and 60 °C and their model parameters can be found in Figures S5 and S6 and Tables S4 and S5 in the Supplementary Materials. The maximum shrinkage ΔV/V0|max is nearly independent of the temperature for the acid-catalyzed gel, whereas it increases with temperature in the case of the base-catalyzed gel. In direct comparison to the larger initial gel sample height, see Figure 12, the maximum shrinkage is equal with a small tendency to larger values. However, the rate of syneresis is accelerated due to the reduced initial gel sample height, represented by smaller values for the characteristic time constant τ. In summary, enforced syneresis behaves analogously to natural syneresis with respect to changes in the initial sample dimensions.

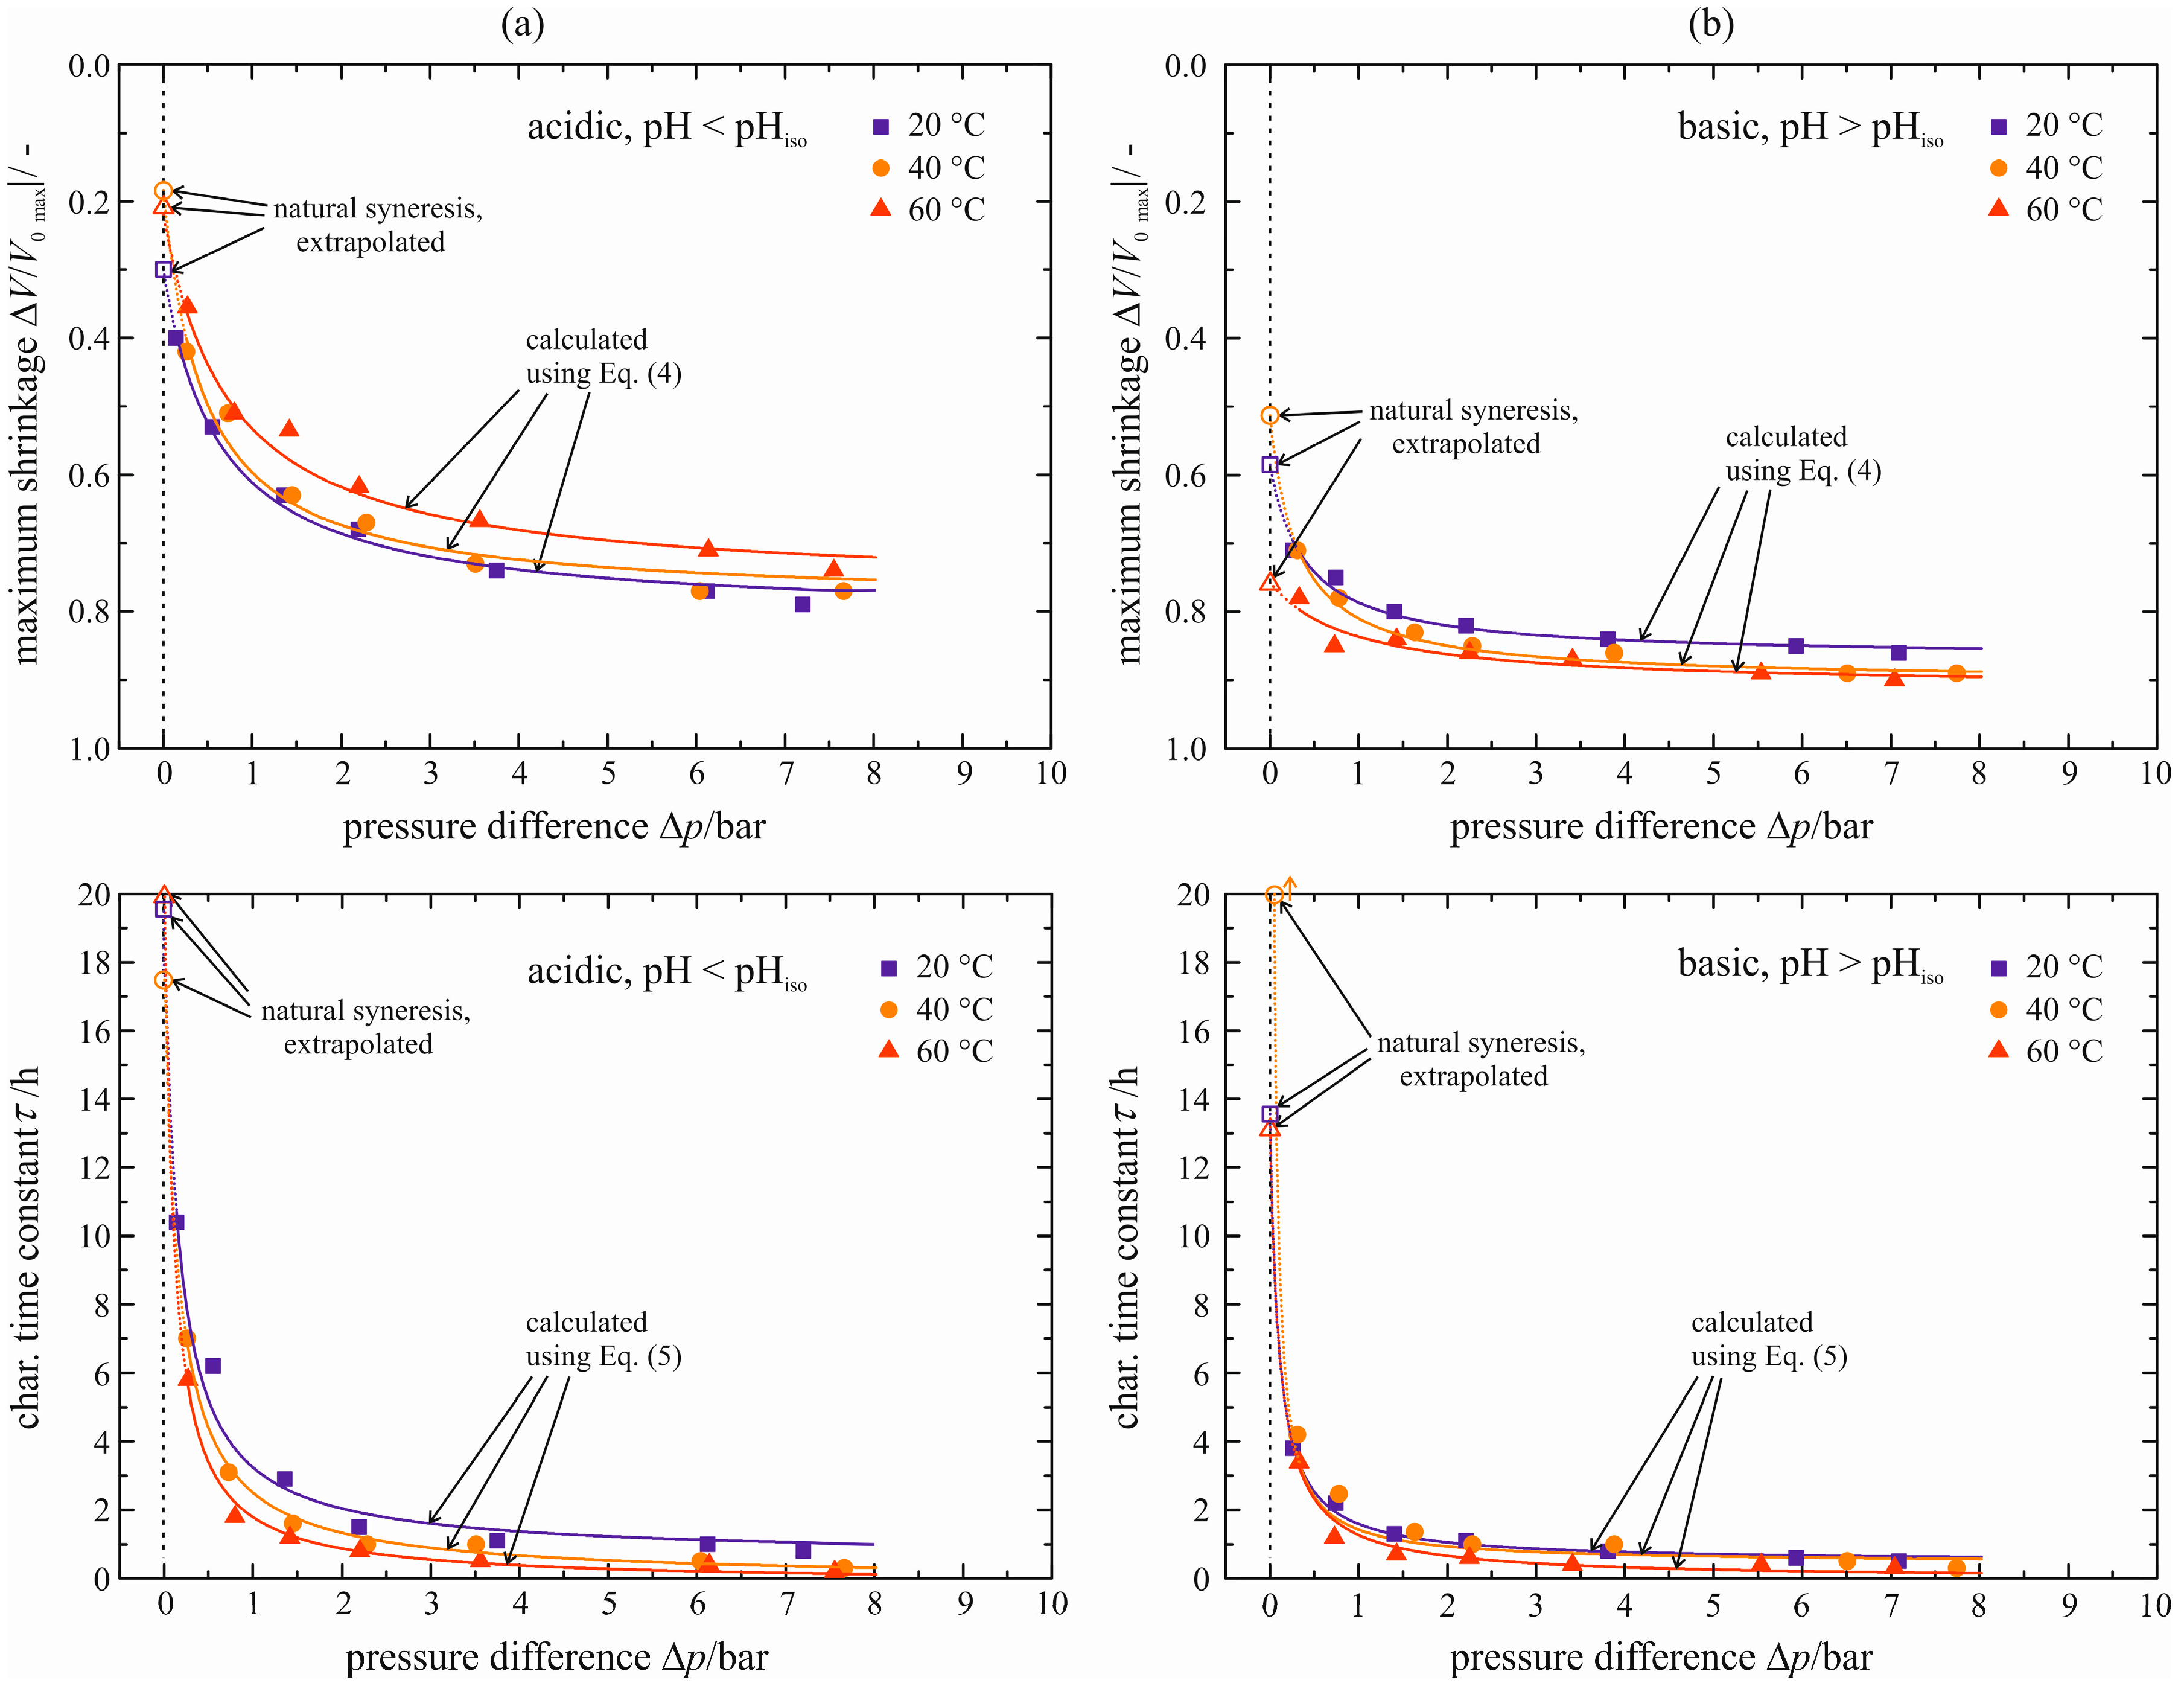
4.3. Correlative Model

The model correlates the maximum shrinkage ΔV/V0|max and the characteristic time constant τ to the applied pressure difference Δp. They are represented by the filled symbols in Figure 15. Their dependence on the pressure difference Δp may be fitted separately for each temperature with the following equations:
( Δ V V 0 ) | max = A + B C + Δ p
τ = D + E F + Δ p
Figure 15. Maximum shrinkage ΔV/V0|max and characteristic time constant τ for acid-catalyzed (a) and base-catalyzed (b) gel as a function of pressure difference Δp.
Polymers 07 01528 g015
These equations are chosen with respect to the course of the values and to the possibility of a mathematical extrapolation towards Δp = 0 bar. All values for the coefficients AF can be found in Tables S6 and S7 in the Supplementary Materials. The courses of these equations are split in two regions. The first region comprises the pressure differences that are covered experimentally and is depicted as solid lines in Figure 15. Equations (4) and (5) reflect the progression of enforced syneresis sufficiently. This region is used to compare the temperature-dependent behavior of enforced with natural syneresis. The second region of the courses deals with the extrapolation towards Δp = 0 bar, shown as dotted lines in Figure 15. The values obtained for Δp = 0 bar are shown by the blank symbols.
A slightly smaller value for the maximum shrinkage ΔV/V0|max can be detected with increasing temperature for the acid-catalyzed gel (Figure 15a). This is not in accordance with the temperature behavior for natural syneresis (see Figure 8). The extrapolation towards Δp = 0 bar yields maximum shrinkages for natural syneresis of ΔV/V0|max = 0.19 to 0.30 that are in the range of the values measured for natural syneresis. In the case of the base-catalyzed gel (Figure 15b), larger values for the maximum shrinkage are obtained with increasing temperature as already measured for natural syneresis (Figure 8). The extrapolated values for Δp = 0 bar are ΔV/V0|max = 0.52 to 0.75 depending on the temperature and, thus, almost twice as large as those measured for natural syneresis. Here, the correlative model overestimates natural syneresis. Nevertheless, larger shrinkages for the base-catalyzed gel are predicted in comparison to the acid-catalyzed gel that is accordance with the measurements. Independent of the catalyst, the syneresis velocity increases with temperature, reflected by smaller values for the characteristic time constant (Figure 15). This behavior is analogous to natural syneresis. However, the acceleration is less distinctive and less unambiguous for the base-catalyzed gel. The values predicted through extrapolation towards Δp = 0 bar vary between 17.4 h ≤ τ (Δp = 0 bar) ≤ 21.2 h for the acid-catalyzed gel. They match partially or are at least in the range of the values determined for natural syneresis, see Table 1. In the case of the base-catalyzed gel, the characteristic time constant takes values of 13.2 h ≤ τ (Δp = 0 bar) ≤ 50.6 h. Again, these values are related to those of natural syneresis, but the correct assignment to temperature is not given. Here, the largest value for τ is assigned to ϑ = 40 °C and not to the lowest temperature of ϑ = 20 °C. This is due to the sensitivity of the extrapolation especially for small pressure differences. Thus, special attention must be paid to the correlative model to predict natural syneresis.

5. Summary and Conclusions

“Natural syneresis” of silica can be measured with a pycnometer device adapted to determine the influence of the process parameters. In particular, an acid- and base-catalyzed polymerization reaction is investigated at different temperatures and sample sizes. It is found that the maximum shrinkage for rather large gels (cylindrical gel samples) is independent of the temperature range investigated (20, 40 and 60 °C) and has a value of ΔV/V0|max ≈ 0.20 for the acid-catalyzed gel, whereas a dependency on temperature is detected in the case of the base-catalyzed gel. The maximum shrinkage is ΔV/V0|max ≈ 0.30, 0.39 and 0.51 for the three temperatures. These differences between the two catalysts can be explained with the different chemical mechanisms of solid formation and the resulting differences in gel structure. The rate of syneresis, represented by the characteristic time constant τ, rises with increasing temperature. This is synonymous to a reduced characteristic time constant, i.e., for the acid-catalyzed gel τ(20 °C) = 21.3 h, τ(40 °C) = 11.7 h and τ(60 °C) = 5.0 h, respectively, τ(20 °C) = 50.1 h, τ(40 °C) = 32.0 h and τ(60 °C) = 27.5 h in the case of the base-catalyzed gel. Reducing of the characteristic length that must be flowed through by the pore liquid leads to smaller characteristic time constants and larger maximum shrinkages.
The duration of experiments for the larger samples (dCyl = 12 mm and VGel ≈ 3 mL) is approximately ten days. This duration can be reduced significantly by applying an additional, external force to the gel sample (“enforced syneresis”). In comparison to the natural syneresis of the acid-catalyzed gel, larger values for the maximum shrinkage are reached (e.g., ΔV/V0|max = 0.79 for Δp = 7.20 bar and ϑ = 20 °C), whereas the kinetics of syneresis is strongly accelerated (characteristic time constant of τ = 0.8 h). With increasing temperature, a slight reduction in the maximum shrinkage can be detected. This reduction is in contrast to the natural syneresis behavior. Thus, enforced and natural syneresis differ in temperature behavior with respect to the maximum shrinkage. The characteristic time constant τ decreases monotonously with temperature, as already stated for natural syneresis, to τ(40 °C) = 0.34 h and τ(60 °C) = 0.23 h. There is no difference in temperature dependence between enforced and natural syneresis for the base-catalyzed gel. The values for the maximum shrinkage become larger (e.g., from ΔV/V0|max = 0.86 to 0.90 for ϑ = 20 to 60 °C) and the characteristic time constant reduces (from τ(20 °C) = 0.5 h to τ(60 °C) = 0.3 h). As already shown for natural syneresis, a reduction in the initial sample dimensions results in a faster syneresis, but to almost unchanged maximum shrinkage. This might be due to a reduction factor of merely one fourth. This factor was chosen to allow for a comparison between enforced and natural syneresis with equal characteristic lengths.
An empirical, correlative model based on enforced syneresis is used for the prediction of natural syneresis due to extrapolation of the two model parameters ΔV/V0|max and τ towards Δp = 0 bar. The extrapolation of these parameters for the acid-catalyzed gel yields values in the range of ΔV/V0|max = 0.19 to 0.30 and τ = 17.4 to 21.2 h for the three temperatures (20, 40 and 60 °C) and, thus, match partially or are in the range of measured values. In the case of the base-catalyzed gel, the predicted values are ΔV/V0|max = 0.52 to 0.75 and τ = 13.2 to 50.6 h. Here, the maximum shrinkages are overestimated by a factor of two, but the characteristic time constants are related to the values measured, even though the temperature assignment is incorrect. The largest value for τ is not obtained for the highest temperature, but for ϑ = 40 °C. This is because of the sensitivity of the extrapolation, especially for the small pressure differences applied. As a result, special attention must be paid to the extrapolation.
The process parameters which influence the formation of particles and their subsequent consolidation, i.e., the syneresis, can be identified in a much shorter time with the concept of enforced syneresis. Beside this analytical aspect, one can think of a preparative application of enforced syneresis. Furthermore, influencing and stopping the polymerization (i.e., with an additive inactivating the hydroxyl groups) will give the possibility of producing stable silica at any desired intermediate state. The phenomenology of syneresis is described in this work by means of an empirical model. The development of a physically based model is part of the actual research and will be presented in the future.

Supplementary Materials

Supplementary materials can be found at www.mdpi.com/2073-4360/7/12/1528/s1.

Acknowledgments

This research project is supported financially by Deutsche Forschungsgemeinschaft DFG within the priority program “SPP 1273 Kolloidverfahrenstechnik” (KI 709/22-3, colloid process engineering). We would like to thank the assisting students who performed parts of the measurement and analyses, as well as our colleagues for their advice.
We acknowledge support by Deutsche Forschungsgemeinschaft and Open Access Publishing Fund of Karlsruhe Institute of Technology.

Author Contributions

Sebastian Wilhelm and Matthias Kind conceived and designed the experiments and wrote the publication. Sebastian Wilhelm performed the experiments and analyzed the data, assisted by students.

Conflicts of Interest

The authors declare no conflict of interests. The founding sponsors had no role in the design of the study, in the collection, analyses, or interpretation of data, in writing of the manuscript, and in the decision to publish the results.

References

  1. Brinker, C.J.; Scherer, G.W. Sol-Gel Science—The Physics and Chemistry of Sol-Gel Processing; Academic Press Inc.: San Diego, CA, USA, 1990. [Google Scholar]
  2. Iler, R.K. The Chemistry of Silica—Solubility, Polymerization, Colloid and Surface Properties, and Biochemistry; John Wiley & Sons: New York, NY, USA, 1978. [Google Scholar]
  3. Schlomach, J. Feststoffbildung bei Technischen Fällprozessen—Untersuchungen zur Industriellen Fällung von Siliciumdioxid und Calciumcarbonat; Universitätsverlag Karlsruhe: Karlsruhe, Germany, 2006. (In German) [Google Scholar]
  4. Sahabi, H.; Kind, M. Consolidation of inorganic precipitated silica gel. Polymers 2011, 3, 1423–1432. [Google Scholar]
  5. Wilhelm, S.; Kind, M. On the relation between natural and enforced syneresis of acidic precipitated silica. Polymers 2014, 6, 2896–2911. [Google Scholar] [CrossRef]
  6. Quarch, K.; Kind, M. Inorganic precipitated silica gel part 1: Gelation kinetics and gel properties. Chem. Eng. Technol. 2010, 33, 1034–1039. [Google Scholar] [CrossRef]
  7. Quarch, K.; Durand, E.; Schilde, C.; Kwade, A.; Kind, M. Mechanical fragmentation of precipitated silica aggregates. Chem. Eng. Res. Des. 2010, 88, 1639–1647. [Google Scholar] [CrossRef]
  8. Quarch, K. Produktgestaltung an Kolloidalen Agglomeraten und Gelen—Gelierung und Fragmentierung Anorganisch Gefällten Siliciumdioxids; KIT Scientific Publishing: Karlsruhe, Germany, 2010. (In German) [Google Scholar]
  9. Bergna, H.E. The Colloid Chemistry of Silica; American Chemical Society: Washington, DC, USA, 1994. [Google Scholar]
  10. Zerda, T.W.; Artaki, I.; Jonas, J. Study of polymerization processes in acid and base catalyzed silica sol-gels. J. Non-Cryst. Solids 1986, 81, 365–379. [Google Scholar] [CrossRef]
  11. Vysotskii, Z.Z.; Strazhesko, D.N. Isoelectric state of disperse silica and ion exchange in acid solutions. Adsorpt. Adsorbents 1973, 1, 55–71. [Google Scholar]
  12. Hamouda, A.A.; Amiri, H.A.A. Factors affecting alkaline sodium silicate gelation for in-depth reservoir profile modification. Energies 2014, 7, 568–590. [Google Scholar] [CrossRef]
  13. Vinot, B.; Schechter, R.S.; Lake, L.W. Formation of water-soluble silicate gels by hydrolysis of a diester of dicarboxylic acid solubilized as microemulsions. SPE Res. Eng. 1989, 8, 391–397. [Google Scholar] [CrossRef]
  14. Schlomach, J.; Kind, M. Investigations on the semi-batch precipitation of silica. J. Colloid Interface Sci. 2004, 277, 316–326. [Google Scholar] [CrossRef] [PubMed]
  15. Ponomareva, T.P.; Kontorovich, S.I.; Chekanov, M.I.; Shchukin, E.D. Kinetics of shrinkage during formation of polysilicic acid hydrogel structures. Colloid J. USSR 1984, 46, 118–120. [Google Scholar]
  16. Haselhuhn, F.; Kind, M. Pseudo-polymorphic behavior of precipitated calcium oxalate. Chem. Eng. Technol. 2003, 26, 347–353. [Google Scholar] [CrossRef]
  17. Alexander, G.B. The reaction of low molecular weight silicic acids with molybdic acid. J. Am. Chem. Soc. 1953, 75, 5655–5657. [Google Scholar] [CrossRef]

