Article

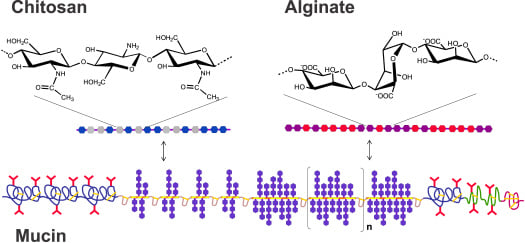
Direct Determination of Chitosan–Mucin Interactions Using a Single-Molecule Strategy: Comparison to Alginate–Mucin Interactions

1
Biophysics and Medical Technology, Department of Physics, the Norwegian University of Science and Technology (NTNU), NO-7491 Trondheim, Norway
2
Department of Biotechnology, the Norwegian University of Science and Technology (NTNU), NO-7491 Trondheim, Norway
*
Author to whom correspondence should be addressed.
These authors contributed equally to this work.
Polymers 2015, 7(2), 161-185; https://doi.org/10.3390/polym7020161
Submission received: 10 October 2014 / Accepted: 19 January 2015 / Published: 29 January 2015
(This article belongs to the Collection Polysaccharides)

Abstract

:
Aqueous chitosan possesses attractive interaction capacities with various molecular groups that can be involved in hydrogen bonds and electrostatic and hydrophobic interactions. In the present paper, we report on the direct determination of chitosan–mucin molecular pair interactions at various solvent conditions as compared to alginate–mucin interactions. Two chitosans of high molecular weight with different degrees of acetylation—thus possessing different solubility profiles in aqueous solution as a function of pH and two alginates with different fractions of α-guluronic acid were employed. The interaction properties were determined through a direct unbinding assay at the single-molecular pair level using an atomic force microscope. When probed against immobilized mucin, both chitosans and alginates revealed unbinding profiles characteristic of localized interactions along the polymers. The interaction capacities and estimated parameters of the energy landscapes of the pairwise chitosan–mucin and alginate–mucin interactions are discussed in view of possible contributions from various fundamental forces. Signatures arising both from an electrostatic mechanism and hydrophobic interaction are identified in the chitosan–mucin interaction properties. The molecular nature of the observed chitosan–mucin and alginate–mucin interactions indicates that force spectroscopy provides fundamental insights that can be useful in understanding the surface binding properties of other potentially mucoadhesive polymers.

Graphical Abstract

1. Introduction

Chitosan is a linear polysaccharide composed of randomly distributed β-(1–4)-linked d-glucosamine and N-acetyl-d-glucosamine, which is positively charged at physiological pH [1,2]. Chitosan is conventionally obtained by de-acetylation of chitin [3]. The α-chitin crystalline structure is reported to form sheets stabilized by C(7)–N(7)···H–N(7) hydrogen bonds [4]. Later structural revision also indicates that hydrogen bonds involving O(6) are present [5]. As chitosan is obtained from chitin, the same molecular groups can also potentially be involved in hydrogen bonding for chitosan interactions. Furthermore, the de-acetylation process yields a primary amine that can be protonated, thus supporting Coulomb-based interactions. In addition, the acetyl groups that are present in chitosan can potentially mediate hydrophobic interactions. The structure of chitosan thus underpins interactions through various mechanisms, with amine and hydroxyl groups supporting hydrogen bonding, the protonated amine supporting interactions through an electrostatic mechanism, and the hydrophobic nature of the N-acetyl supporting hydrophobic interactions.
The range of available opportunities for interaction within the chitosan molecules is central both to biological functionality and technological applications. The enzymatic processing of chitosan, including degradation and de-acetylation, is mediated by dynamic realization of a set of interactions, in particular hydrogen bonds, between molecular groups of the chitosan and the enzyme [6,7]. Enzymatic catalysis depends on chitosan–enzyme interactions spanning a set of chitosan residues interacting with the sub-sites of the catalytic cleft, thus producing a reaction rate that reflects the local sequence of the polysaccharide [8,9].
The polycationic nature of chitosan has been exploited for various technological applications, in particular the preparation of polyelectrolyte multilayers and polyelectrolyte complexes. Examples of polyanions used in combination with chitosans for the preparation of multilayers include alginate [10,11], hyaluronic acid [12,13], and dopamine grafted hyaluronic acid [14], among others [15,16]. Analogously, the interaction capacities of chitosans with polyanions have been exploited to a large extent in the formation of polyelectrolyte complexes involving chitosan, in particular for development of vehicles for enhanced delivery of polynucleotides (DNA vectors and siRNA). Understanding of the well-known chitosan–DNA polyelectrolyte condensation and stability and its dependence on chitosan chain length [17,18,19,20,21,22,23] is initially achieved by realizing that the complexation is a counterion exchange reaction and thus that the electrostatic mechanism manifests itself in an entropic dominated contribution. Recently, it has also been reported that oligomannuronan forms stronger gels with chitosan through more optimal mutual localization of charged groups than for the oligoguluronate–chitosan combination [24].
In the present study, we characterize the interaction of chitosan with mucin using a direct forced dissociation approach using atomic force microscopy. The cationic nature of chitosan is believed to be centrally important for its interaction with mucins [2,25,26], which carry a net negative charge at physiological pH. In addition, various structural groups within the mucin polymer can be expected to interact with chitosan via various types of hydrogen bonds and hydrophobic interactions. The interaction between chitosan and mucin is relevant for mucoadhesion, a special case of bioadhesion where one of the materials is a mucosal surface of the body. Mucoadhesion is of particular interest in the pharmaceutical sciences as a method of improving drug delivery [27], where prolonged contact and retention of the dosage form/drug delivery system at the mucosa improves uptake of the payload and thereby improves bioavailability and pharmacological effect [28]. In situ residence time and intimate contact of the payload with the mucosa have been shown to directly or indirectly improve not only drug bioavailability but also protection of labile molecules and controlled/prolonged drug release [29]. The process of adhesion of a dosage form or drug delivery system to a mucosal surface can be divided into two stages, the initial contact phase and a consolidation phase, with various physiochemical interactions occurring at the interface between the two surfaces that give rise to prolonged adhesion [27,30]. General theories of the molecular basis of adhesion have been applied to the discussion of mucoadhesion [31]. Chitosan performs well as a mucoadhesive dosage form both in vivo [32,33,34,35,36,37,38] and in vitro [2,25,26,28,39,40,41,42,43,44,45,46] and it is therefore of interest to determine the strength of the basic interactions related to this important property.
The interaction between chitosan and mucin is compared with that of alginate and mucin. Alginate is a linear copolymer composed of (1–4)-linked β-d-mannuronate (M) and α-l-guluronate (G) residues arranged either as M, G or MG blocks. Alginate is negatively charged at physiological pH and whilst it is widely used in pharmaceutical formulations [47,48] it generally performs relatively poorly in terms of mucoadhesion when compared to chitosan [26]. However, alginates are clearly capable of interacting with mucins [49] and have the potential to modify the functional properties of mucus systems [50,51,52].
In this study we utilize atomic force microscopy (AFM) to study the interactions of alginate and chitosan with a mucin substrate. Figure 1 depicts an overview of the strategy applied. Two chitosans with different degrees of acetylation were employed to explore the effect of the pH-dependent solubility of the chitosan molecules [53,54] on their interaction with mucins. Two alginates with different fractions of guluronic acid representing the variety of alginate chemical structures utilized in pharmaceutical applications were selected for this study of interaction capacity with mucin.
Figure 1. A schematic illustration of the data collection and analysis for the forced-unbinding study of chitosan–mucin and alginate–mucin. (a) An AFM-cantilever with peptide-bond anchored chitosan/alginate was extended to a mica slide with peptide-bond anchored mucin and subsequently retracted; (b) Illustrations of typical interaction curves obtained from the AFM experiments; (c,d) The unbinding forces with corresponding loading rates were analyzed as outlined in the experimental section, to yield estimates of parameters xβ, τ0 and ΔG of the interaction. Symbols included in the graph are explained below.
Polymers 07 00161 g001

2. Experimental Section

2.1. Biopolymer Samples

The mucin samples were collected from the cardia and fundus of pigs, according to a method that has been previously described in the literature [52,55]. Mucus was scraped from the gastric mucosa of recently slaughtered pigs after rinsing the stomach of food debris. The purification of the crude sample obtained was carried out as described in the literature [56]. The protocol includes a brief homogenization, centrifugation, purification step using CsCl equilibrium density gradient centrifugation, and dialysis to exchange Cs counterions with sodium. The purified mucin samples were finally lyophilized and stored at −20 °C.
Two high molecular weight alginates with different fractions of guluronic acid were selected for the direct unbinding characterization with the mucin. The sample with a high fraction of guluronic acid was from Laminaria hyperborea stipe and the medium G alginate sample from Macrocystis pyriferia. Two high molecular weight chitosans with different acetyl content, fraction of acetyl groups (FA) being FA = 0.01 and FA =0.49 (kindly provided by Prof. Kjell Morten Vårum, Department of Biotechnology, NTNU) were employed. The chitosan and alginate samples were subjected to compositional characterization of the content and sequences [57,58], and their intrinsic viscosity, [η], was determined. The molecular weights of the chitosans were estimated from the determined [η] using the Mark–Houwink–Kuhn equation with the reported parameters [59]. The molecular weights of the alginates were determined as reported [60]. The parameters of the chitosan and alginate samples are summarized in Table 1.
Table 1. Properties of chitosans and alginates.
PolysaccharideProperties &
AlginatesSourceFGFMFGGFMGNG > 1[η] (mL/g)Mw (kg/mol)
L. hyperborea, stipe0.650.350.530.1211585114
M. pyriferia0.380.620.190.2051005220
Chitosans FAFD Mw (kg/mol)
0.010.99 610162
0.490.51 1090250
& The abbreviations used to denote the properties of the alginates and chitosans are as follow: FG, FM, FGG, FMG, NG > 1, refer to the fraction of guluronic (G) acid, mannuronic acid (M), dimers of GG, MG, and length of average G-block sequence longer than 1, respectively. FA, and FD refer to the fraction of acetyl and deacetylated residues of the chitosan, respectively. [η] is the intrinsic viscosity and Mw is the molecular weight of the polymers.

2.2. Immobilization of Mucin, Chitosans and Alginates

The forced dissociation of the molecular pairs, mucin and either alginate or chitosan, were conducted using covalently anchored biopolymers following previous reported protocols [49,61,62]. The pig gastric mucin (PGM) was covalently linked to mica surfaces, and chitosan and alginates were covalently linked to AFM tips (OTR4, Bruker AFM Probes, Camarillio, CA, USA, triangular cantilevers with nominal spring constant 0.02 nN/nm) following previously developed protocols. Mica (mineral muscovite, SPI Supplies, Structure Probe, West Chester, PA, USA) was cleaved and the freshly exposed mica surfaces were cleaned in a 1:1 v/v methanol:HCl for 30 min and rinsed in deionized water (resistivity 18 MΩ·cm, obtained using a MilliQ set-up, Merck Millipore, Darmstadt, Germany). The AFM tips were cleaned using the same procedure. Mica surfaces and AFM tips for immobilization with alginate were amine-silanized (1% trimethoxysilylpropyl-diethylene-triamine in 1 mM acetic acid, 20 min incubation), whereas the AFM for covalent anchoring of chitosan were silanized with a carboxyl terminating functionality (3% of N-(trimethoxysilylpropyl) ethylenediamine triacetic acid in 1 mM acetic acid, 20 min incubation). PGM was covalently linked to the amine-silanized mica by incubating the surface with aqueous PGM (50 µg/mL in 50 mM boric acid, pH 5.8) and a water soluble carbodiimide (500 µg/mL 1-ethyl 3(3-dimethylamino-propyl)-3-ethylcarboiimide (EDAC), 2 h or overnight). Covalent linkage of alginate to the amine-silanized AFM tips was catalyzed by EDAC (100 µg/mL alginate in 50 mM Boric acid pH 5.8, 500 µg/mL EDAC). Chitosan was conjugated by the amino groups to the carboxy-terminated silanized AFM tips (300 µg/mL chitosan in 50 mM boric acid pH 5.8, 100 µg/mL EDAC, 1 h incubation).

2.3. Determination of Molecular Pair Interactions

The interactions between mucin immobilized on mica and either alginate or chitosan functionalized AFM tips were determined employing a ForceRobot 300 (JPK instruments, Berlin, Germany) equipped with a high-precision mapping stage. The measurements were conducted in a buffered aqueous solution (25 mM Hepes buffer, 150 mM NaCl, pH 6.9 for alginates and chitosans) and at room temperature (298 K). The interactions between chitosan and mucin were also measured at a lower pH, using 25 mM acetate buffer, 150 mM NaCl, pH 5.5.
Each functionalized cantilever was calibrated by first determining the deflection sensitivity of the actual cantilever (pressing against a non-functionalized glass surface), followed by calibration of the cantilever spring constant using the thermal tune method [63,64]. The cantilever approach-retract cycle employed no surface delay before retraction, and was repeatedly conducted at several locations at the sample surface. The force curves were obtained using z-piezo translation and retraction speed of 3–4 µm and 2 µm/s, respectively, for the alginate–PGM interactions, and 2–4 µm and 1–3 µm/s, respectively, for the chitosan–PGM interactions. The actual velocities were selected to limit data collection time for the required statistics while at the same time providing apparent loading rates over an extended range to the parameters determined for the energy landscape. We have previously reported on control experiments between alginate functionalized tips and freshly cleaved mica or aminosilanized mica [49] as well as between immobilized mucin and aminosilanized surfaces [62]. Control experiments relevant for the chitosan–mucin interaction consisted of probing the chitosan functionalized AFM tip with the aminsilanized surface, i.e., the surface used for conjugation of the mucin.

2.4. Analysis of Chitosan–Mucin and Alginate–Mucin Unbinding Data

The magnitude of the unbinding force and force loading rate (rf = Δft) were determined for each unbinding event based on the observed force jump and increase in force just prior to the dissociation event. Force unbinding events that were well-separated, meaning the cantilever returned to the resting position before another interaction event was encountered (Figure 1b), were included. Typically 1340–2800 data points were obtained for each system studied. The fraction of the retraction curves containing interactions compared to the total number of trials for the actual macromolecular interaction probed is referred to as the probability of interaction (Pint). The parameters of the energy landscape for the single pairwise interaction were determined based on the theory underlying force spectroscopy [65,66,67,68,69]. For a single-barrier interaction, the thermally scaled asymptotic expression for the mean rupture force, <f>, at a particular force loading rate region with mean loading rate <rf>, is given by [68]:
f = Δ G ν x β { 1 [ k B T Δ G ln ( k B T e Δ G k B T + γ τ 0 x β r f ) ] ν }
where kB and T are the Boltzmann constant and the absolute temperature, respectively, xβ is the distance from the bound state to the dissociation barrier, τ0 is the lifetime of the bound complex in the absence of an external force, and ΔG is the activation free energy for the dissociation pathway in the absence of an external force. γ is the Euler–Mascheroni constant (γ = 0.577); however, when γ = 1, Equation (1) is a good approximation to the maximum rupture force in a force distribution with corresponding <rf>. The parameter ν describes the free-energy surface for which ν = 1 corresponds to the phenomenological approach [68]. Situations in which ν = 1/2 and ν = 2/3 yield expressions that describe the mean rupture forces for system with linear-cubic and cusp-like energy surfaces, respectively. Parameters xβ, τ0 and ΔG are determined by fitting experimental data from <f> versus ln(<rf>) to Equation (1). Equation (1) is obtained based on the assumption that the dissociation rate of the bound complex through a thermally activated process is increased by an applied force, f.
A general term for the rate of escape for the phenomenological, linear-cubic and cusp-like barrier theories can be written as [68]:
k ( f ) = 1 τ 0 ( 1 ν f x β Δ G ) 1 / ν 1 exp { Δ G k B T [ 1 ( 1 ν f x β Δ G ) 1 / ν ] }
where the lifetime at zero applied force, τ0, is related to the dissociation rate, τ0 =1/k0. The observed unbinding events for a macromolecular pair were grouped into intervals based on their force loading rates, histograms were constructed, and the most probable unbinding force, f*, was determined by fitting the probability of unbinding at a given loading rate [68]:
P ( f ) = 1 r f k ( f ) exp { k B T τ 0 x β r f } exp { k ( f ) k B T x β r f [ 1 ν f x β Δ G ] 1 1 / ν }
to the histograms. These regressions were carried out to verify that Equation (1) with γ = 1 would yield mean rupture force values equal to that of the most probable unbinding force f*. Furthermore, as a consistency test, all constant-speed rupture-force histograms were used to generate a constant-force rupture-rate plot by applying the relationship:
k ( f ) = r f P ( f ) 1 0 f P ( f ) d f   r f
The analytical expression used to convert each histogram bin into corresponding rupture-rate values is given as:
k ( f ) = n = 1 N h p = 1 N b k ( f 0 n + ( p 1 / 2 ) Δ f n ) = n = 1 N h p = 1 N b [ h p n r f n ( h p n 2 + i = p + 1 N b h i n ) Δ f n ]
where Nh and Nb are the number of histograms and bins, respectively. f0n is the force of the first bin in the governing histogram, and binwidth Δfn. hpn represents the height of each bin p in each governing histogram n, while <rf>n denotes the mean loading rate for each histogram n.

3. Results and Discussion

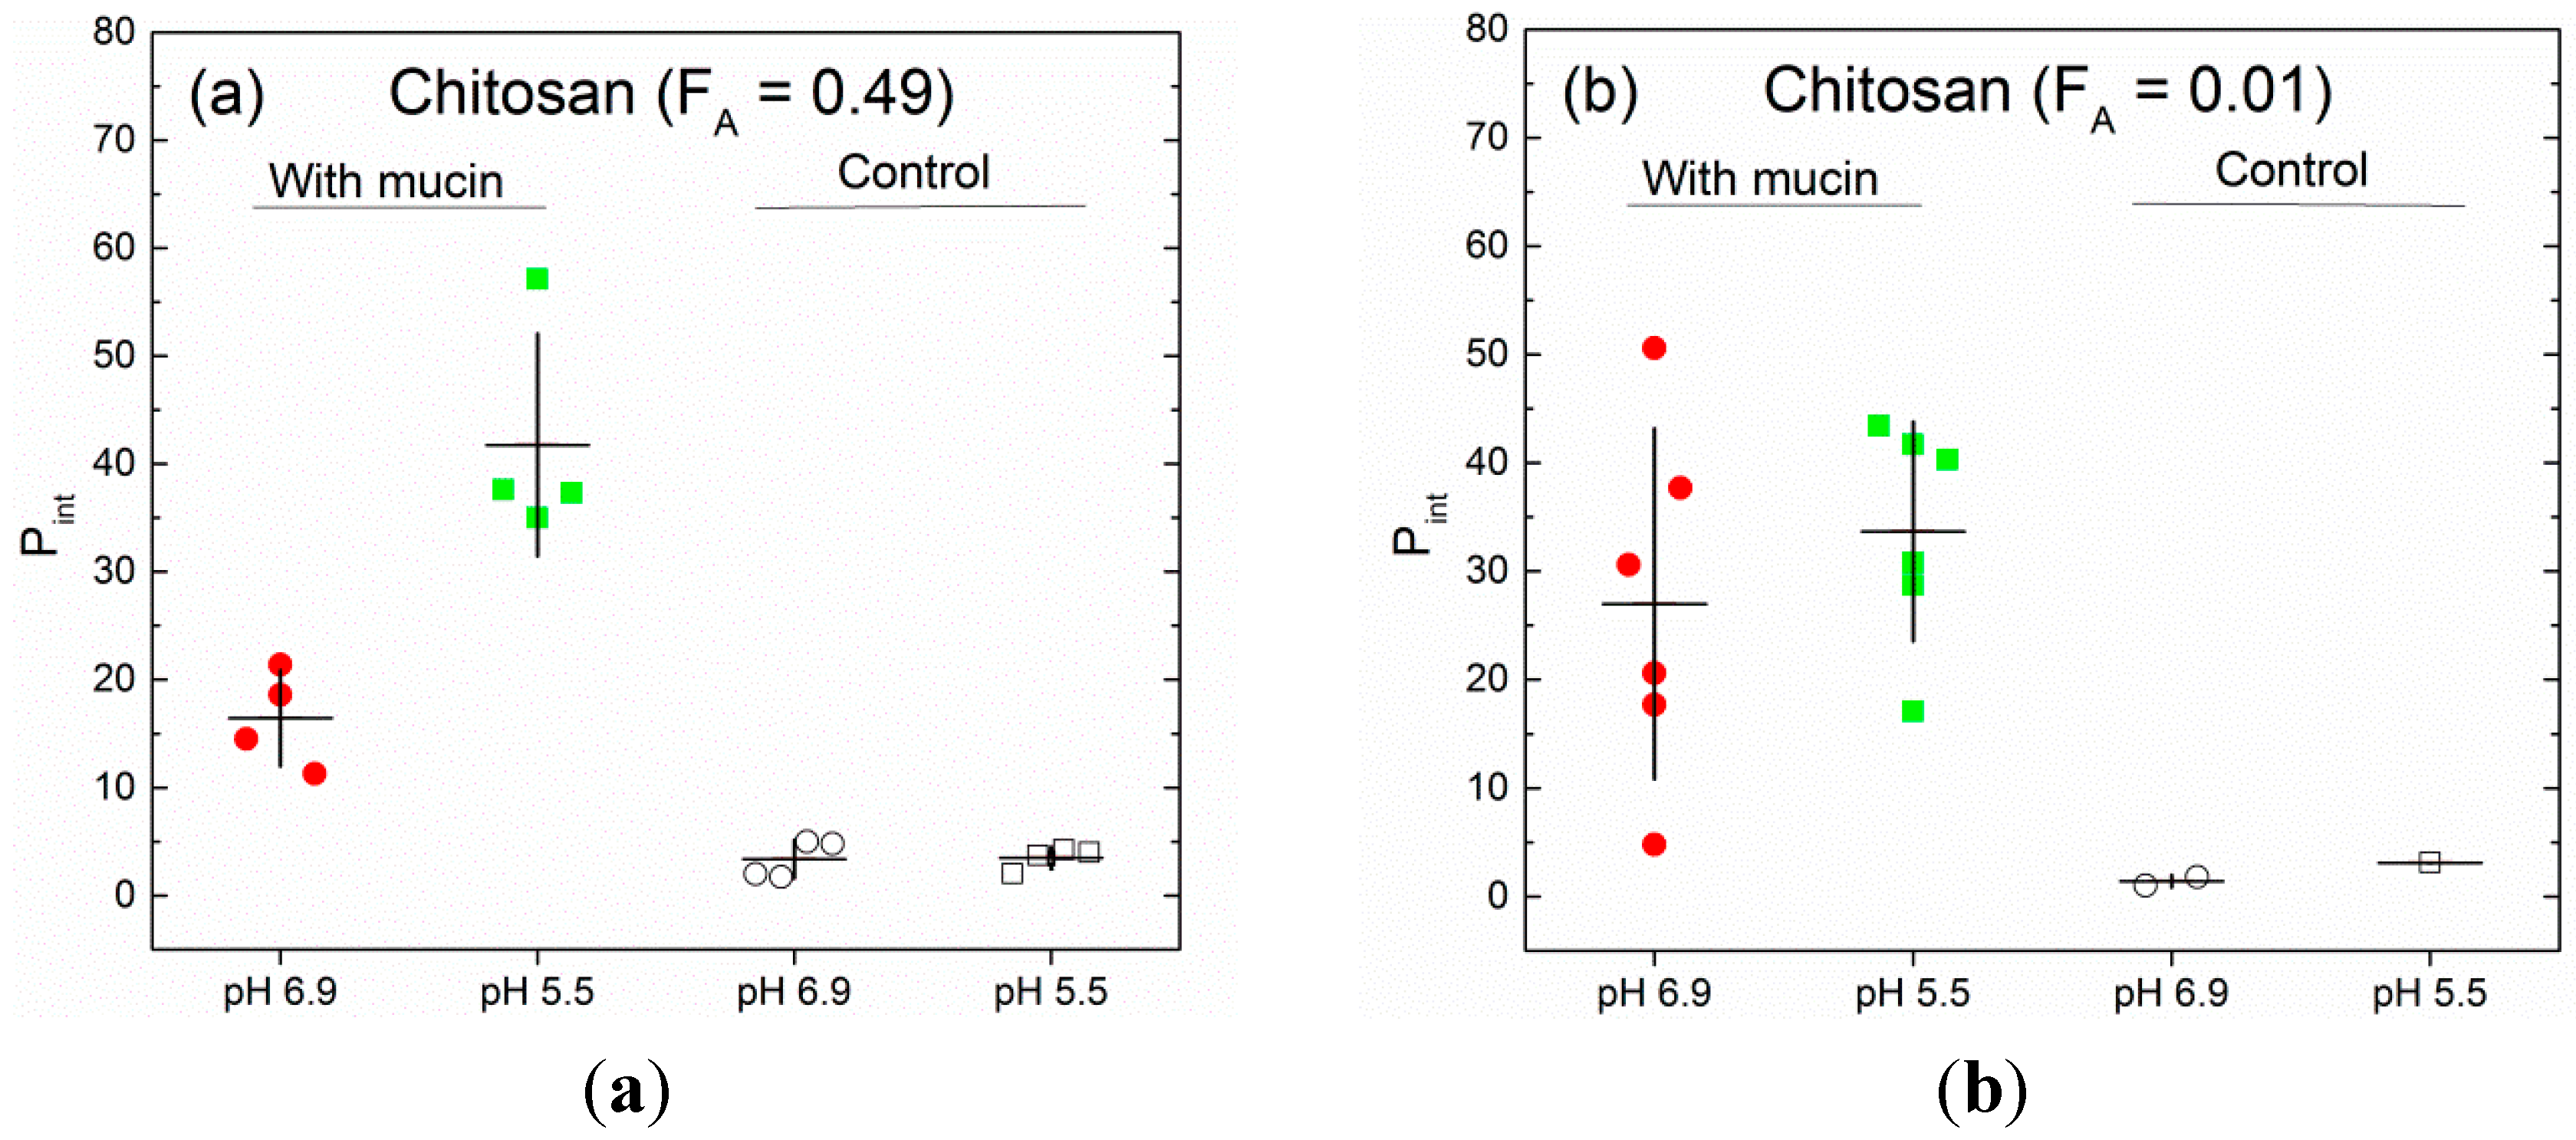
3.1. Fraction of Force-Retraction Cycles with Molecular Interactions

The concentrations of mucin, chitosan and alginate and the incubation conditions were adjusted (final parameters given in experimental section) to yield a high probability of single-bond ruptures in the forced dissociation experiments (Pint in the 10%–40% range). The fraction of the approach-retract curves that contained interactions for the chitosan–mucin preparations was found to depend on the type of chitosan and solvent conditions (Figure 2). For chitosan FA = 0.49, a decrease in pH from 6.9 to 5.5 led to an increase of the average Pint (from 4 measurement series) from 16.5% to nearly 41.8%.
Figure 2. The fractions of mucin–chitosan force-distance curve cycles containing unbinding events. AFM tips functionalized with chitosan with acetyl content in two groups, (a) FA = 0.49 and (b) FA = 0.01 were used to repeatedly probe pig gastric mucin immobilized on mica (filled symbols) or aminosilanized mica (labeled as control, open symbols) at pH 6.9 (25 mM Hepes buffer, 150 mM NaCl, circular symbols) and after changing the pH to 5.5 (25 mM acetate buffer, 150 mM NaCl square symbols)). The graphs display the average within individual probing series (symbols) and the mean ± 1 standard deviation (lines) within each macromolecular combination and solvent condition. The individual probing series are based on 1200–3000 force-distance curves.
Polymers 07 00161 g002
The series of chitosan (FA = 0.01)–mucin interaction showed an increase in average Pint from 27% at pH 6.9 to 33.7% at pH 5.5, but with a larger spread between the measurement series than the chitosan (FA = 0.49)–mucin interaction. Changing the buffer from pH 6.9 to pH 5.5 for the same functionalized chitosan tip–mucin surface combination consistently resulted in an increase in the curves revealing interactions. The parameters Pint for the mucin–alginate combinations were about 7% and 3% for the alginates with FG = 0.65 and FG = 0.38, respectively, for data collected from a total of 26,000 and 19,000 force-distance trials.
The control experiments probing (i) chitosan against the aminosilanized surfaces (Figure 2), alginate functionalized tips against (ii) freshly cleaved mica or (iii) aminosilanized mica [49], and (iv) immobilized mucin towards aminosilanized surfaces [62] show that the interactions observed are specific to the chitosan–mucin and alginate–mucin molecular pairs.

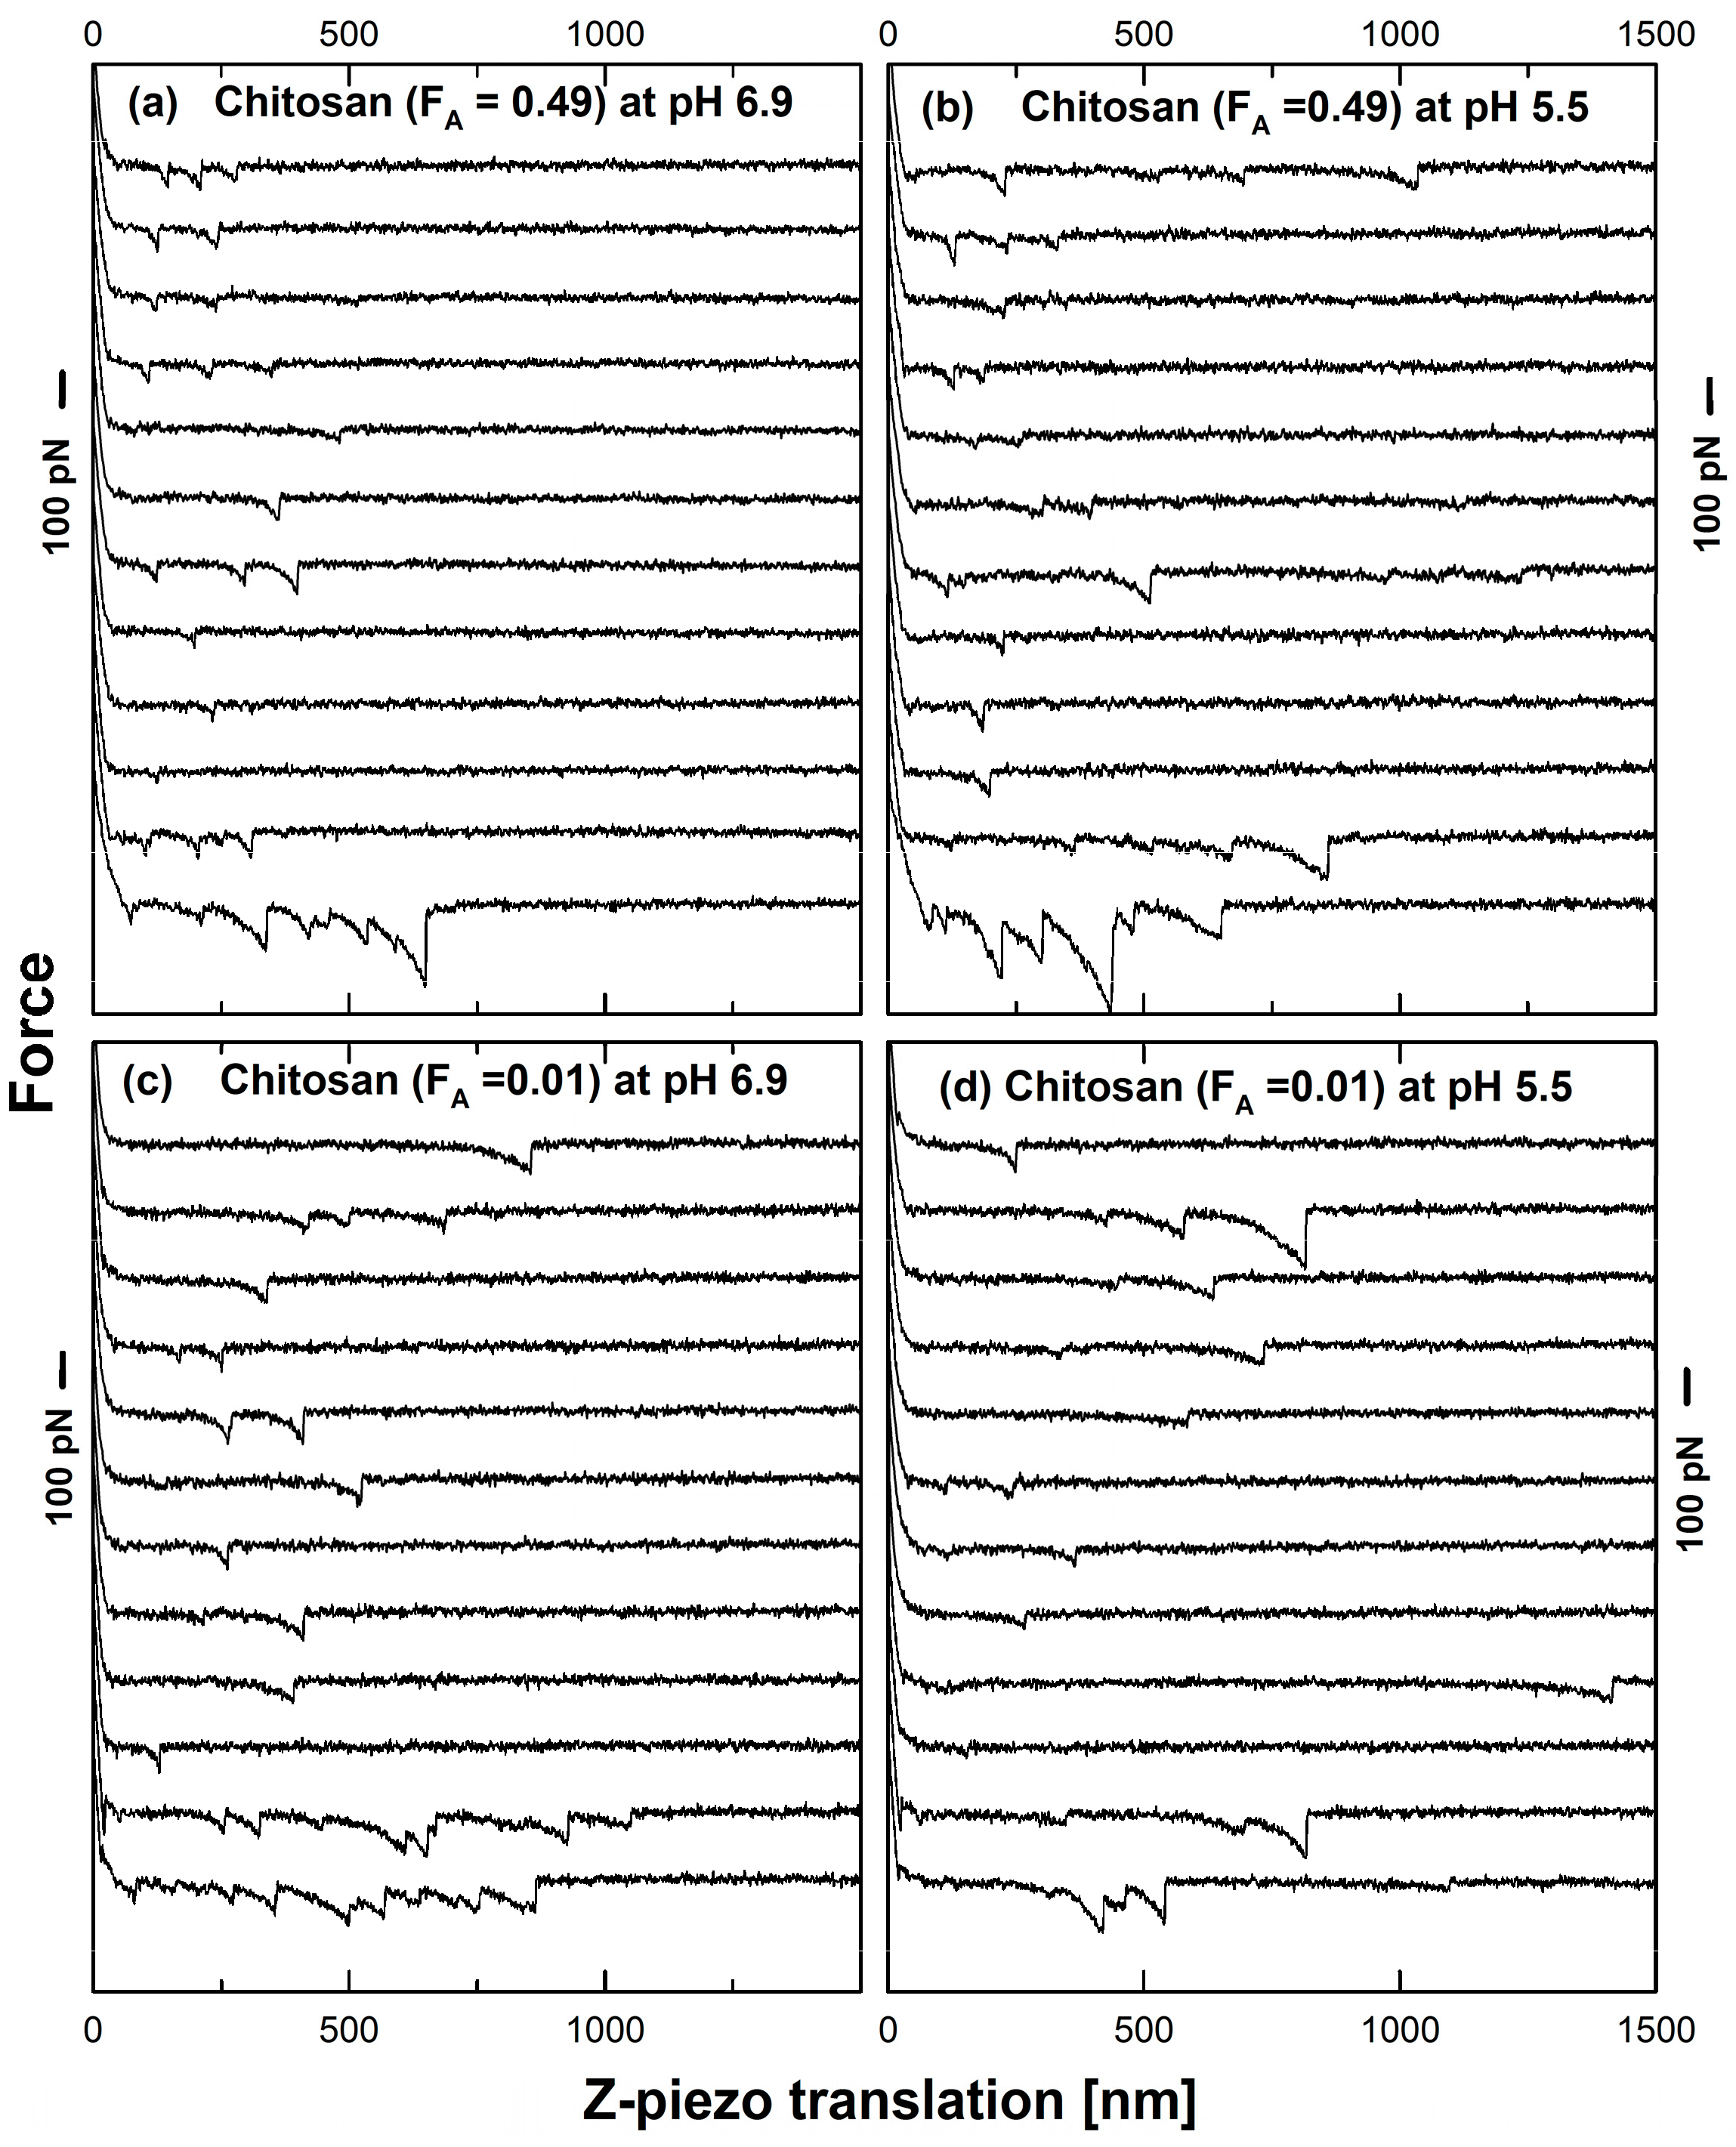
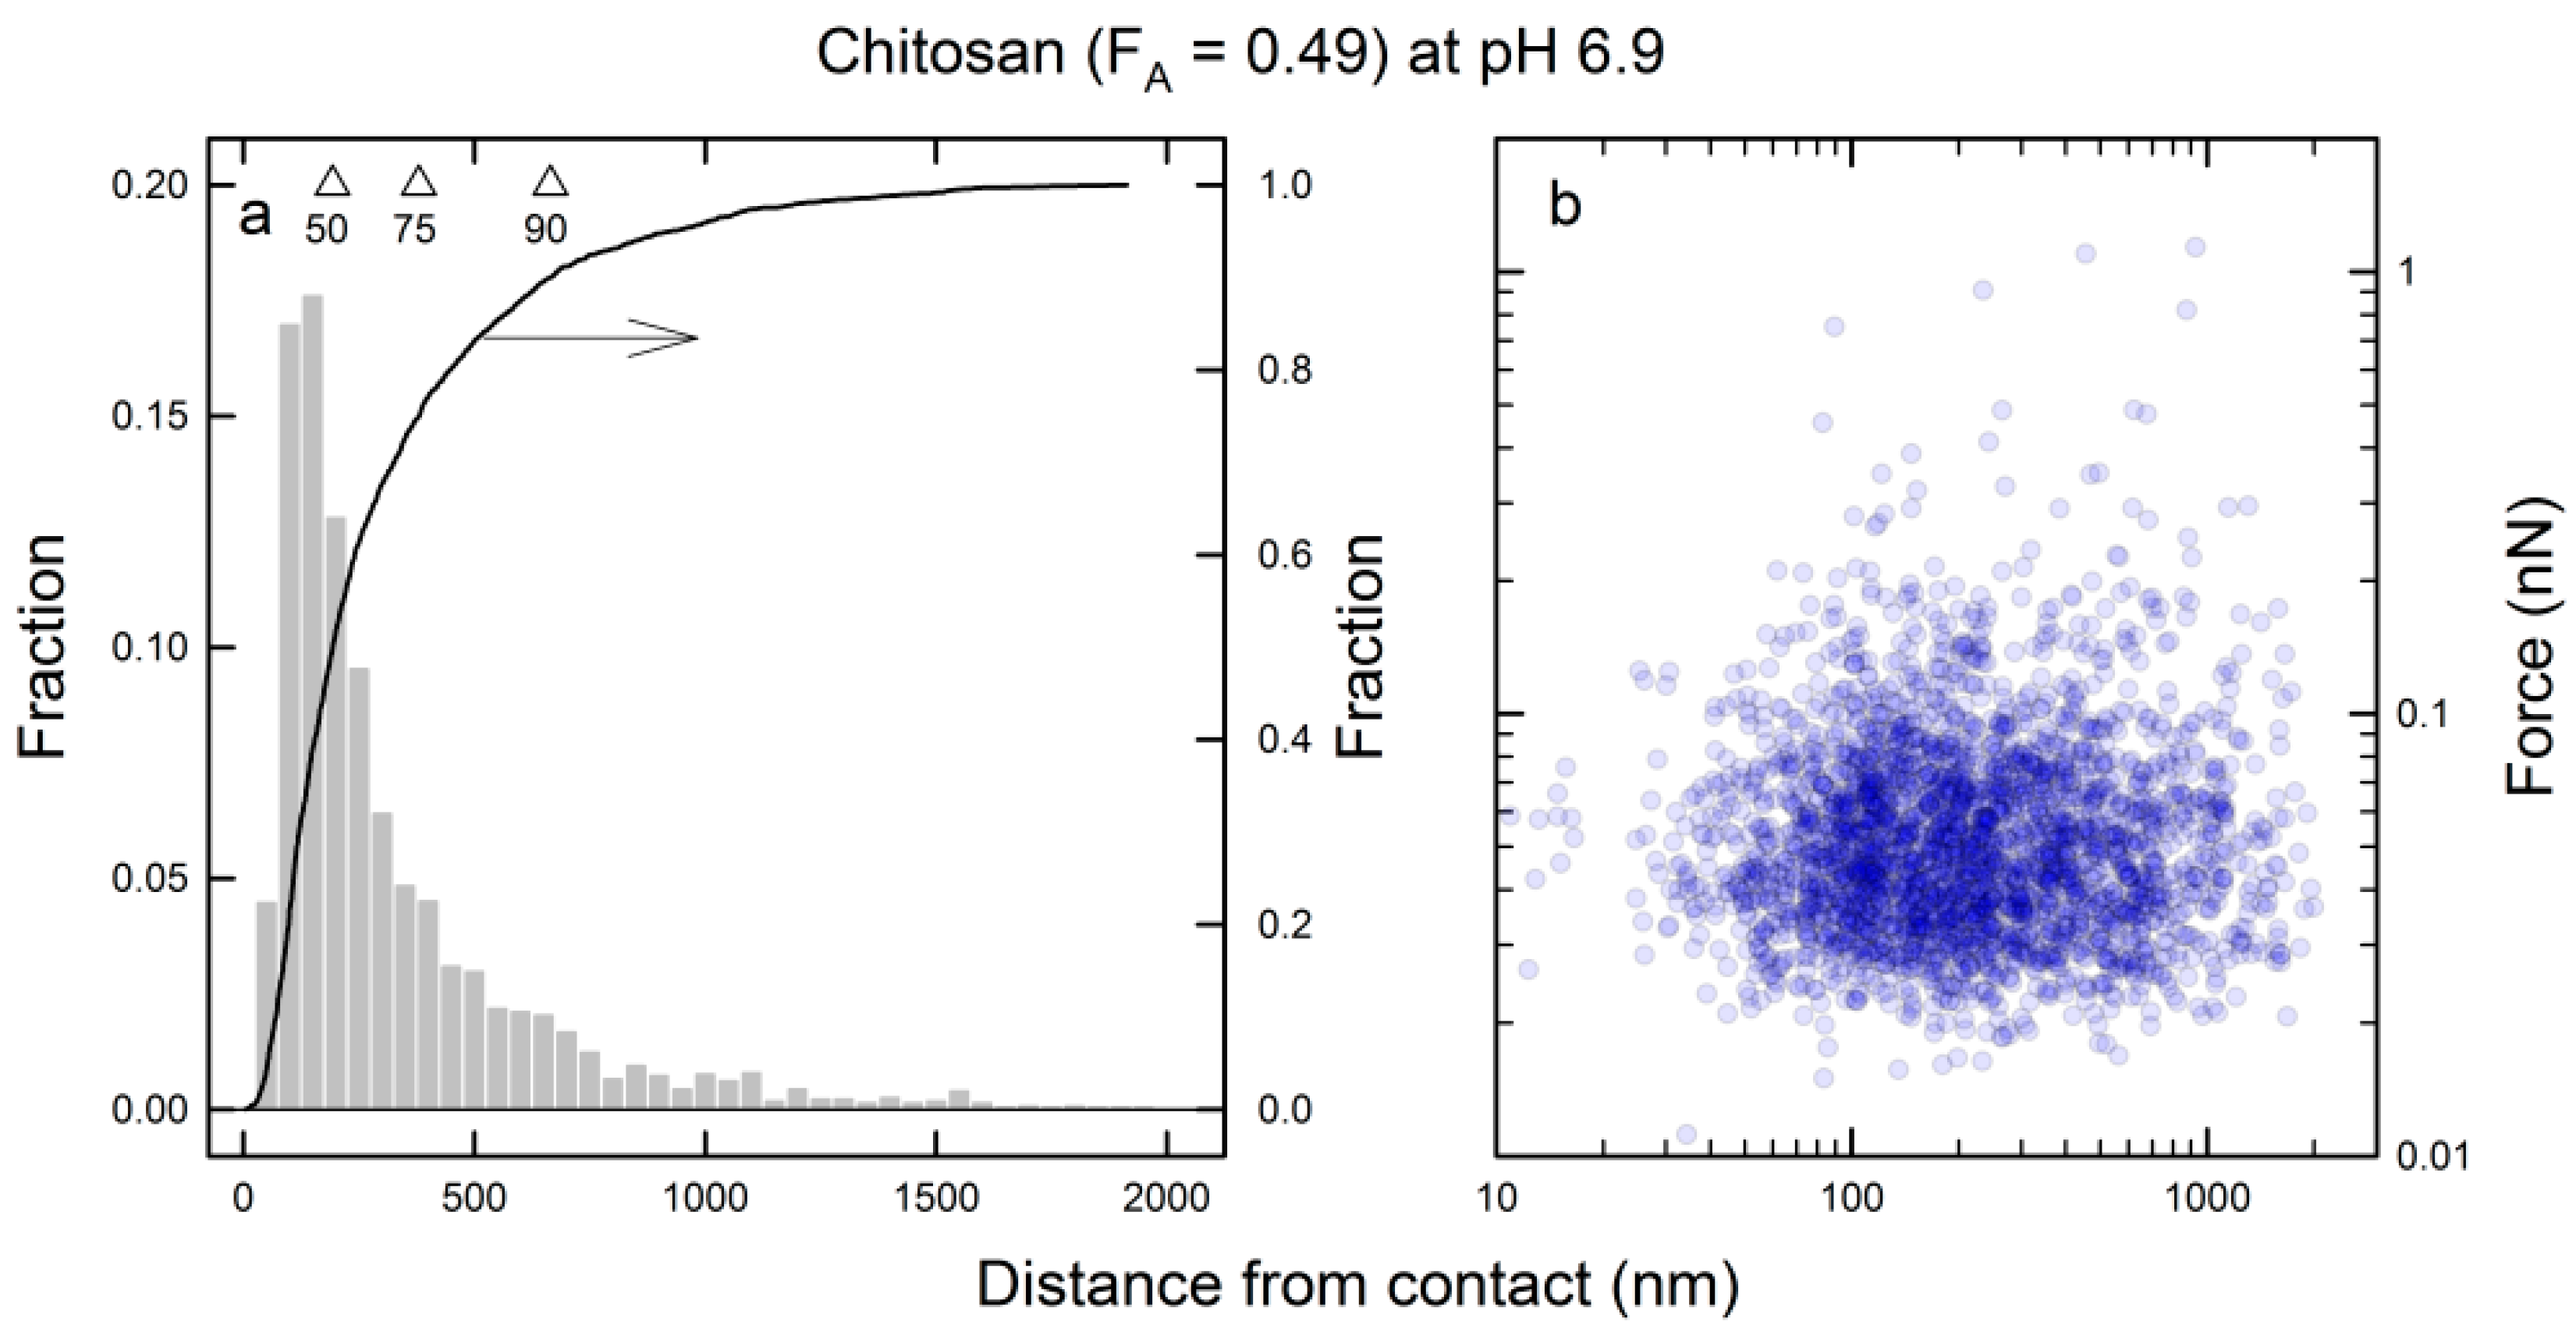
3.2. Mucin-Chitosan Forced Unbinding Curves

The force curves display molecular unbinding events at various AFM tip-mica separations and the curves are similar, independent of the pH of the solvent and the amount of acetylation of the chitosan (Figure 3). Some of the retraction curves reveal single unbinding events, whereas others contain more than one well-separated unbinding event where the cantilever position has returned to its resting position before the cantilever retraction starts to apply a force to another mucin–chitosan interaction. The well-separated individual unbinding events were included in the force spectroscopy analysis by first determining the magnitude of the unbinding force and then the corresponding force loading rate. Force-distance curves displaying non-well-separated unbinding events, e.g., the lower force-retraction curves in each of the panels in Figure 3, were not included in the basis for determining the unbinding forces, but were included in the fraction of approach–retract cycles displaying interactions (Pint estimates, Figure 2).
Figure 3. Force-distance retraction curves obtained for pig gastric mucin covalently attached to mica and chitosan covalently attached to the AFM tip. The force distance data were collected in an aqueous solution on a high-precision mapping stage. The measurements were conducted in a buffered aqueous solution (25 mM buffer, 150 mM NaCl, pH 6.9, or 25 mM acetate buffer, 150 mM NaCl, pH 5.5). The galleries of force distance curves are shown for the mucin interacting with chitosan with FA = 0.01 and FA = 0.49 at pH 5.5 and 6.9. Data are shown only for the retract directions from the surface and are shifted to the vertical direction for better visibility.
Polymers 07 00161 g003
Force-retraction curves for the control measurements (Figure S1) revealed a substantially reduced amount of interactions (Figure 2). Additionally, the force retraction curves displaying interactions in the control measurements were characterized by the close proximity of the interaction to contact, or peeling-type unbinding (Figure S1). These data and the following indications substantiate that the observed unbinding forces between mucin and chitosan reflect dissociations of physical forces between these molecular pairs. First, the interactions are specific to the molecular pairs studied (see above); second, repeated trials between the functionalized probe and surface show no systematic dependence on trial number (Figure 4); and third, the unbinding forces are mainly up to 0.2 nN (Figure 3 and Figure 5), which is substantially less than the reported forces required for disrupting single covalent bonds, which are in the 1–3 nN range [70].
The chitosan–mucin force unbinding profiles, characterized by an increasing load force applied to the interactions before dissociation (Figure 3), differ from the plateau-like peeling of polyelectrolytes from charged surfaces in general [71,72], and chitosan–surface interactions in particular [73]. The unbinding profiles with an increase in the force applied to the bound complex just before the dissociation event are characteristic of interactions with lifetimes exceeding the time scales of the pulling. Interestingly, similar unbinding profiles have recently been reported alongside peeling-type unbinding plateaus for forced dissociation between cationic block copolymer and an AFM tip with a polyanionic brush [74]. In those studies, the interactions mediated by hydrated anion–cation pairs were found to have a lifetime that gives rise to single-molecule unbinding profiles with clearly identifiable polymer tether stretching and unbinding signatures, as more commonly observed in cases involving specific biological interactions [75,76,77]. The signatures of the unbinding profiles as observed here both for the mucin–chitosan and the mucin–alginate (see below) molecular pairs are similar to the unbinding profiles reported for the unbinding of hydrated anion–cation pairs in polyions, but the unbinding signatures cannot alone be used as a basis for excluding other types of interactions, e.g., hydrogen bonding and hydrophobic interactions, as suggested for the mucin–chitosan case.
The unbinding events were observed at surface–tip separations up to about 1500 nm, with the median of the tip-surface separation for the observed unbinding events typically less than 200 nm. For chitosan (FA = 0.01)–mucin interaction at pH 6.9, the median separation distance for the occurrence of the unbinding events was 193 nm, and the 75% and 90% percentiles of the cumulative distribution were located at 380 nm and 665 nm, respectively (Figure 4). Unbinding forces within the same range were observed in the range of distances from contact without apparent changes in their distributions varying systematically with the distance from contact (Figure 4b). Similarly, the distribution of the corresponding loading rates was also independent of the distance from contact. These trends were also observed for other macromolecular pairs investigated in this study. The distribution of unbinding forces and loading rates indicates that the unbinding is within the quasielastic regime where the local force on the chain is approximated by the equilibrium elastic limit. The statistics of unbinding occurrence also indicate that similar types of localized interactions can form between the molecular pairs at various locations along the polymers while only a few, or in most cases only one pair (Figure 3), is the limit within a given force-distance cycle.
Figure 4. Statistical information from unbinding events for chitosan (FA =0.01)–mucin interactions at pH 6.9 (25 mM Hepes buffer, 150 mM NaCl). (a) Histogram and cumulative (line) distribution of unbinding events versus distance from contact of the tip with the surface. The median (50%), 75% and 90% percentiles of the cumulative distribution are depicted (triangles); (b) Scatter plot of observed unbinding forces versus distance from contact. This scatter plot is shown on double logarithmic scales to provide some separation of the various observations, with a transparent fill color.
Polymers 07 00161 g004
We also note that the force-retraction data for the chitosan (FA = 0.01)–mucin interaction at pH 6.9 (Figure 3c) display unbinding events with a distribution of the AFM-tip–mica surface separations similar to the pH 5.5 case. This particular chitosan is expected not to be soluble in aqueous solution at pH 6.9 [53,54], so a collapsed state of the chitosan close to the anchoring site on the AFM tip with a concomitant reduced accessible stretching could have been envisaged. The fact that we did not observe a force beyond the noise level in stretching the chitosan (FA = 0.01) at pH 6.9 indicates that the required force for extending chitosan under aqueous solution yielding an insoluble state is less than the noise in the employed method (in the order of 5 pN). The reported force of 2.5 pN required to stretch a single collapsed DNA molecule in the presence of 0.1 mM sperimidine [78] is in line with the interpretation that the putative unfolding force for chitosan is less than 5 pN.

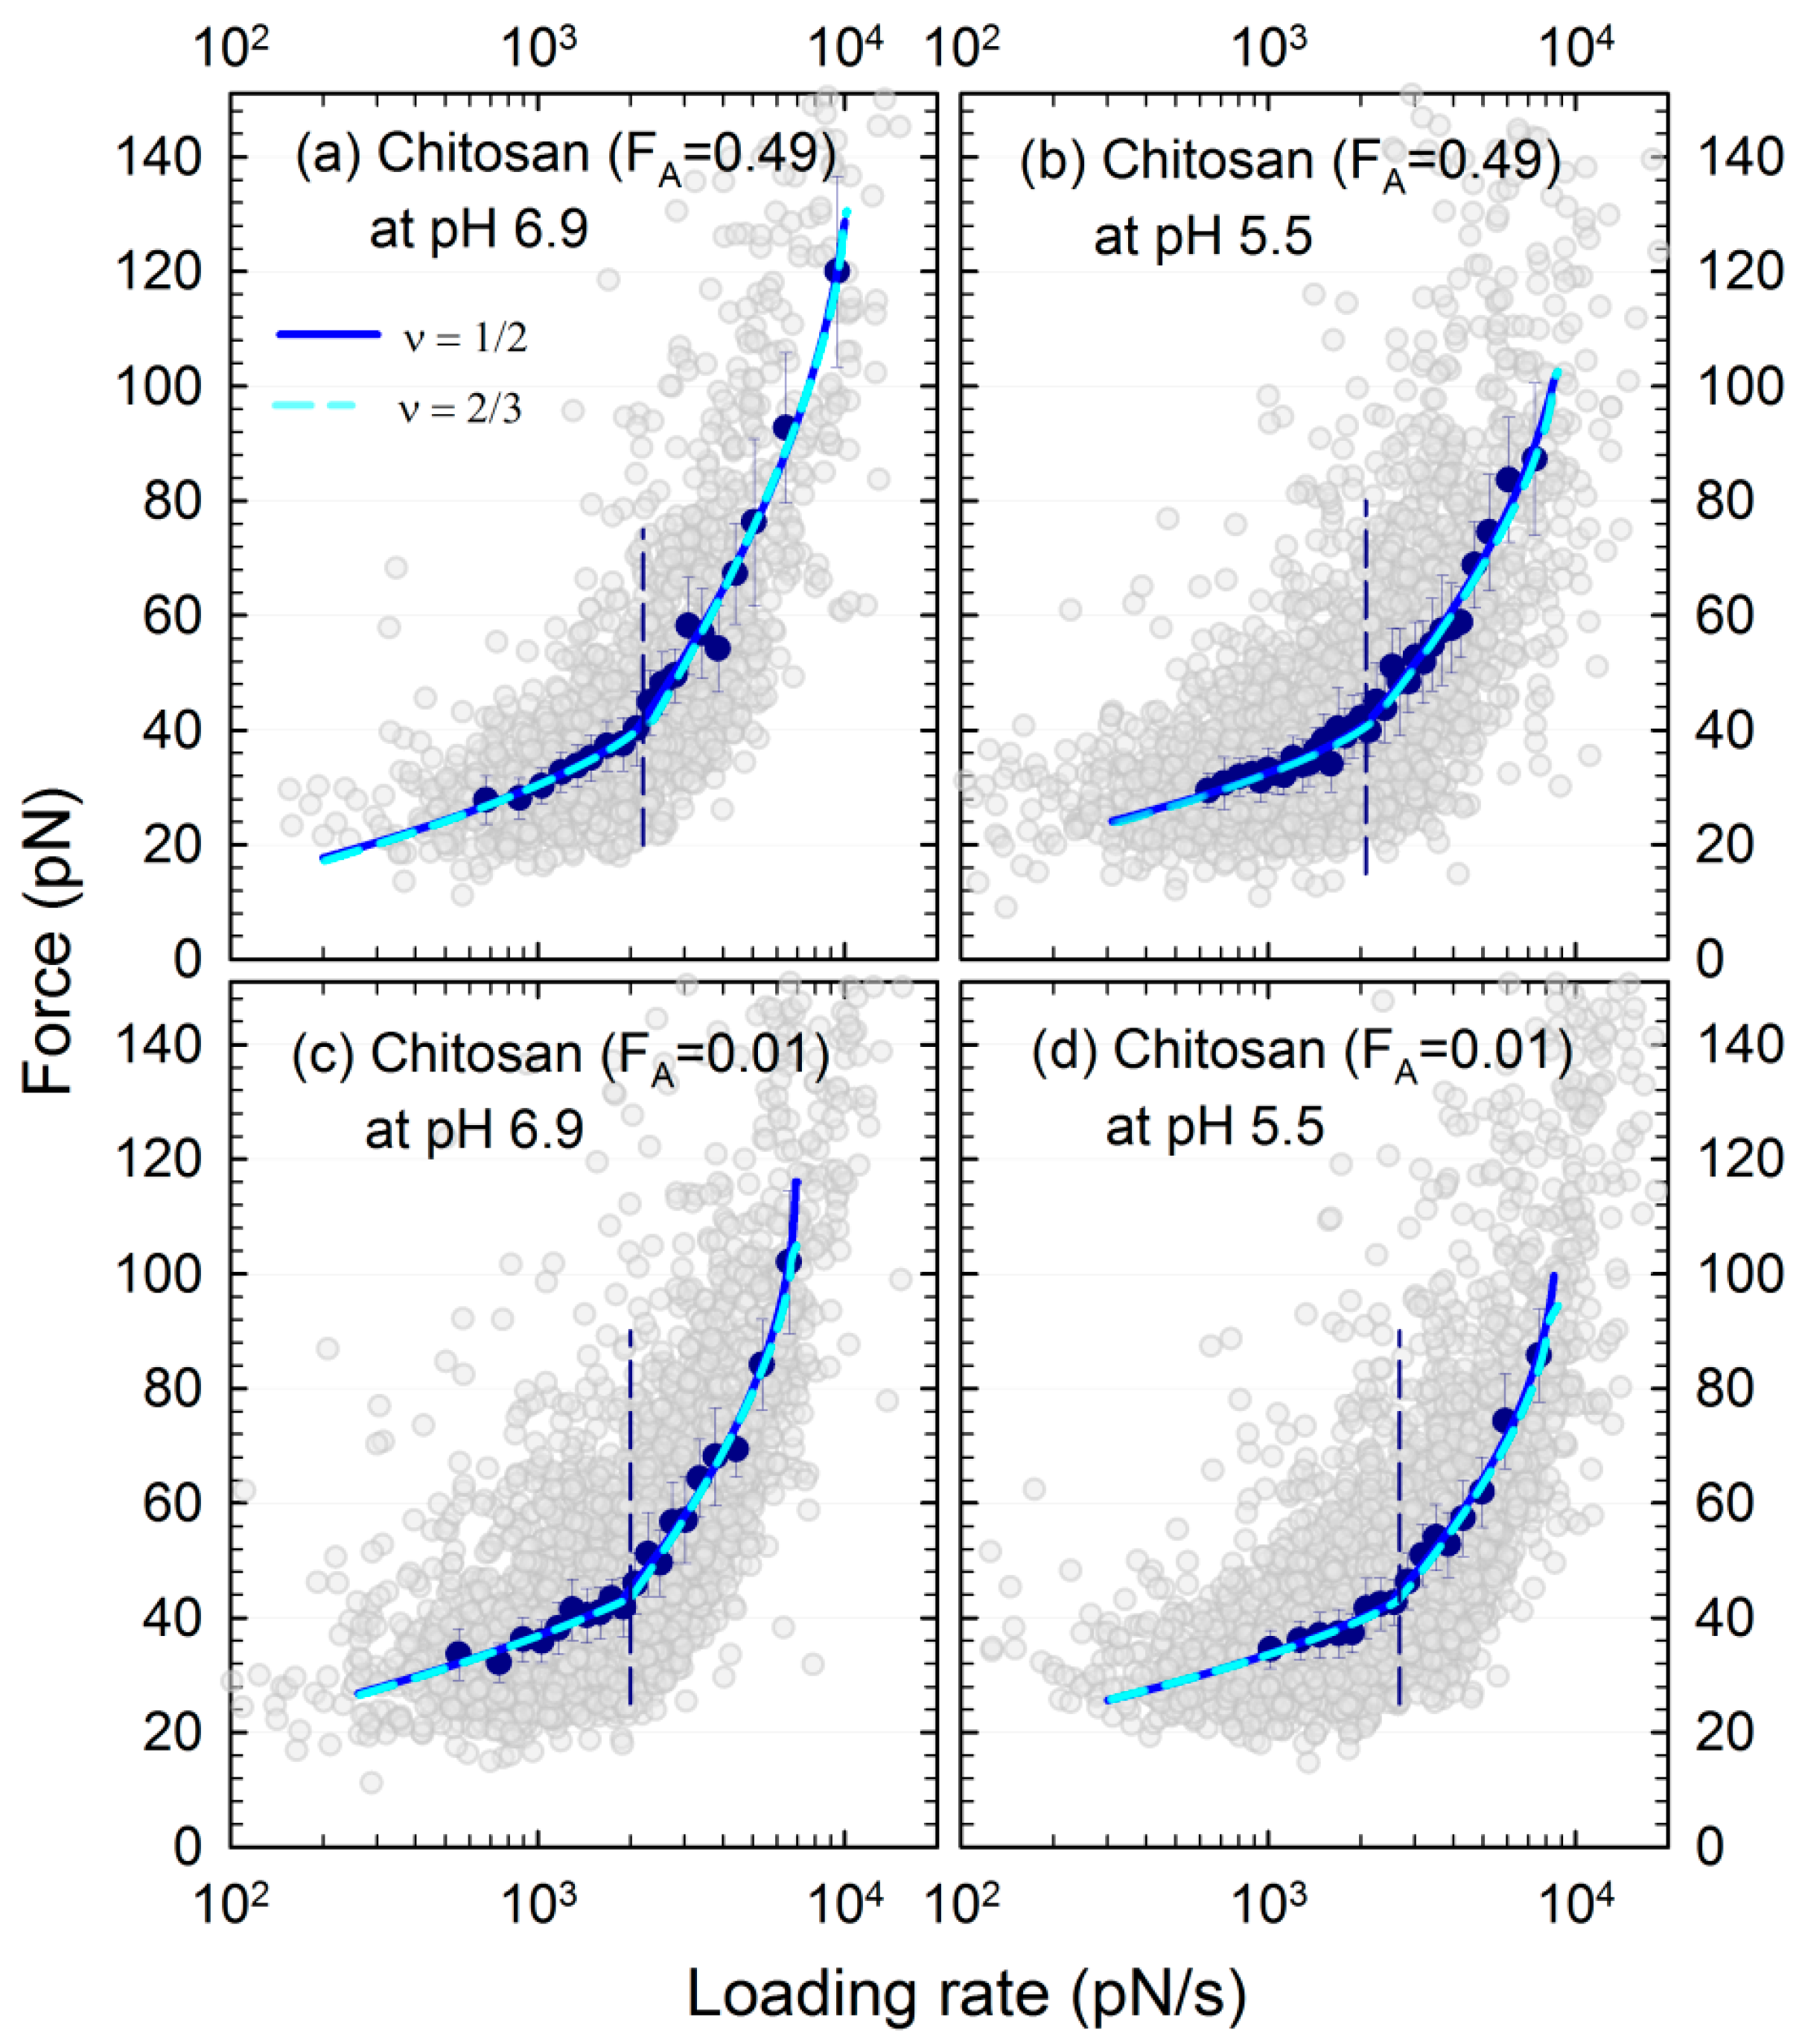
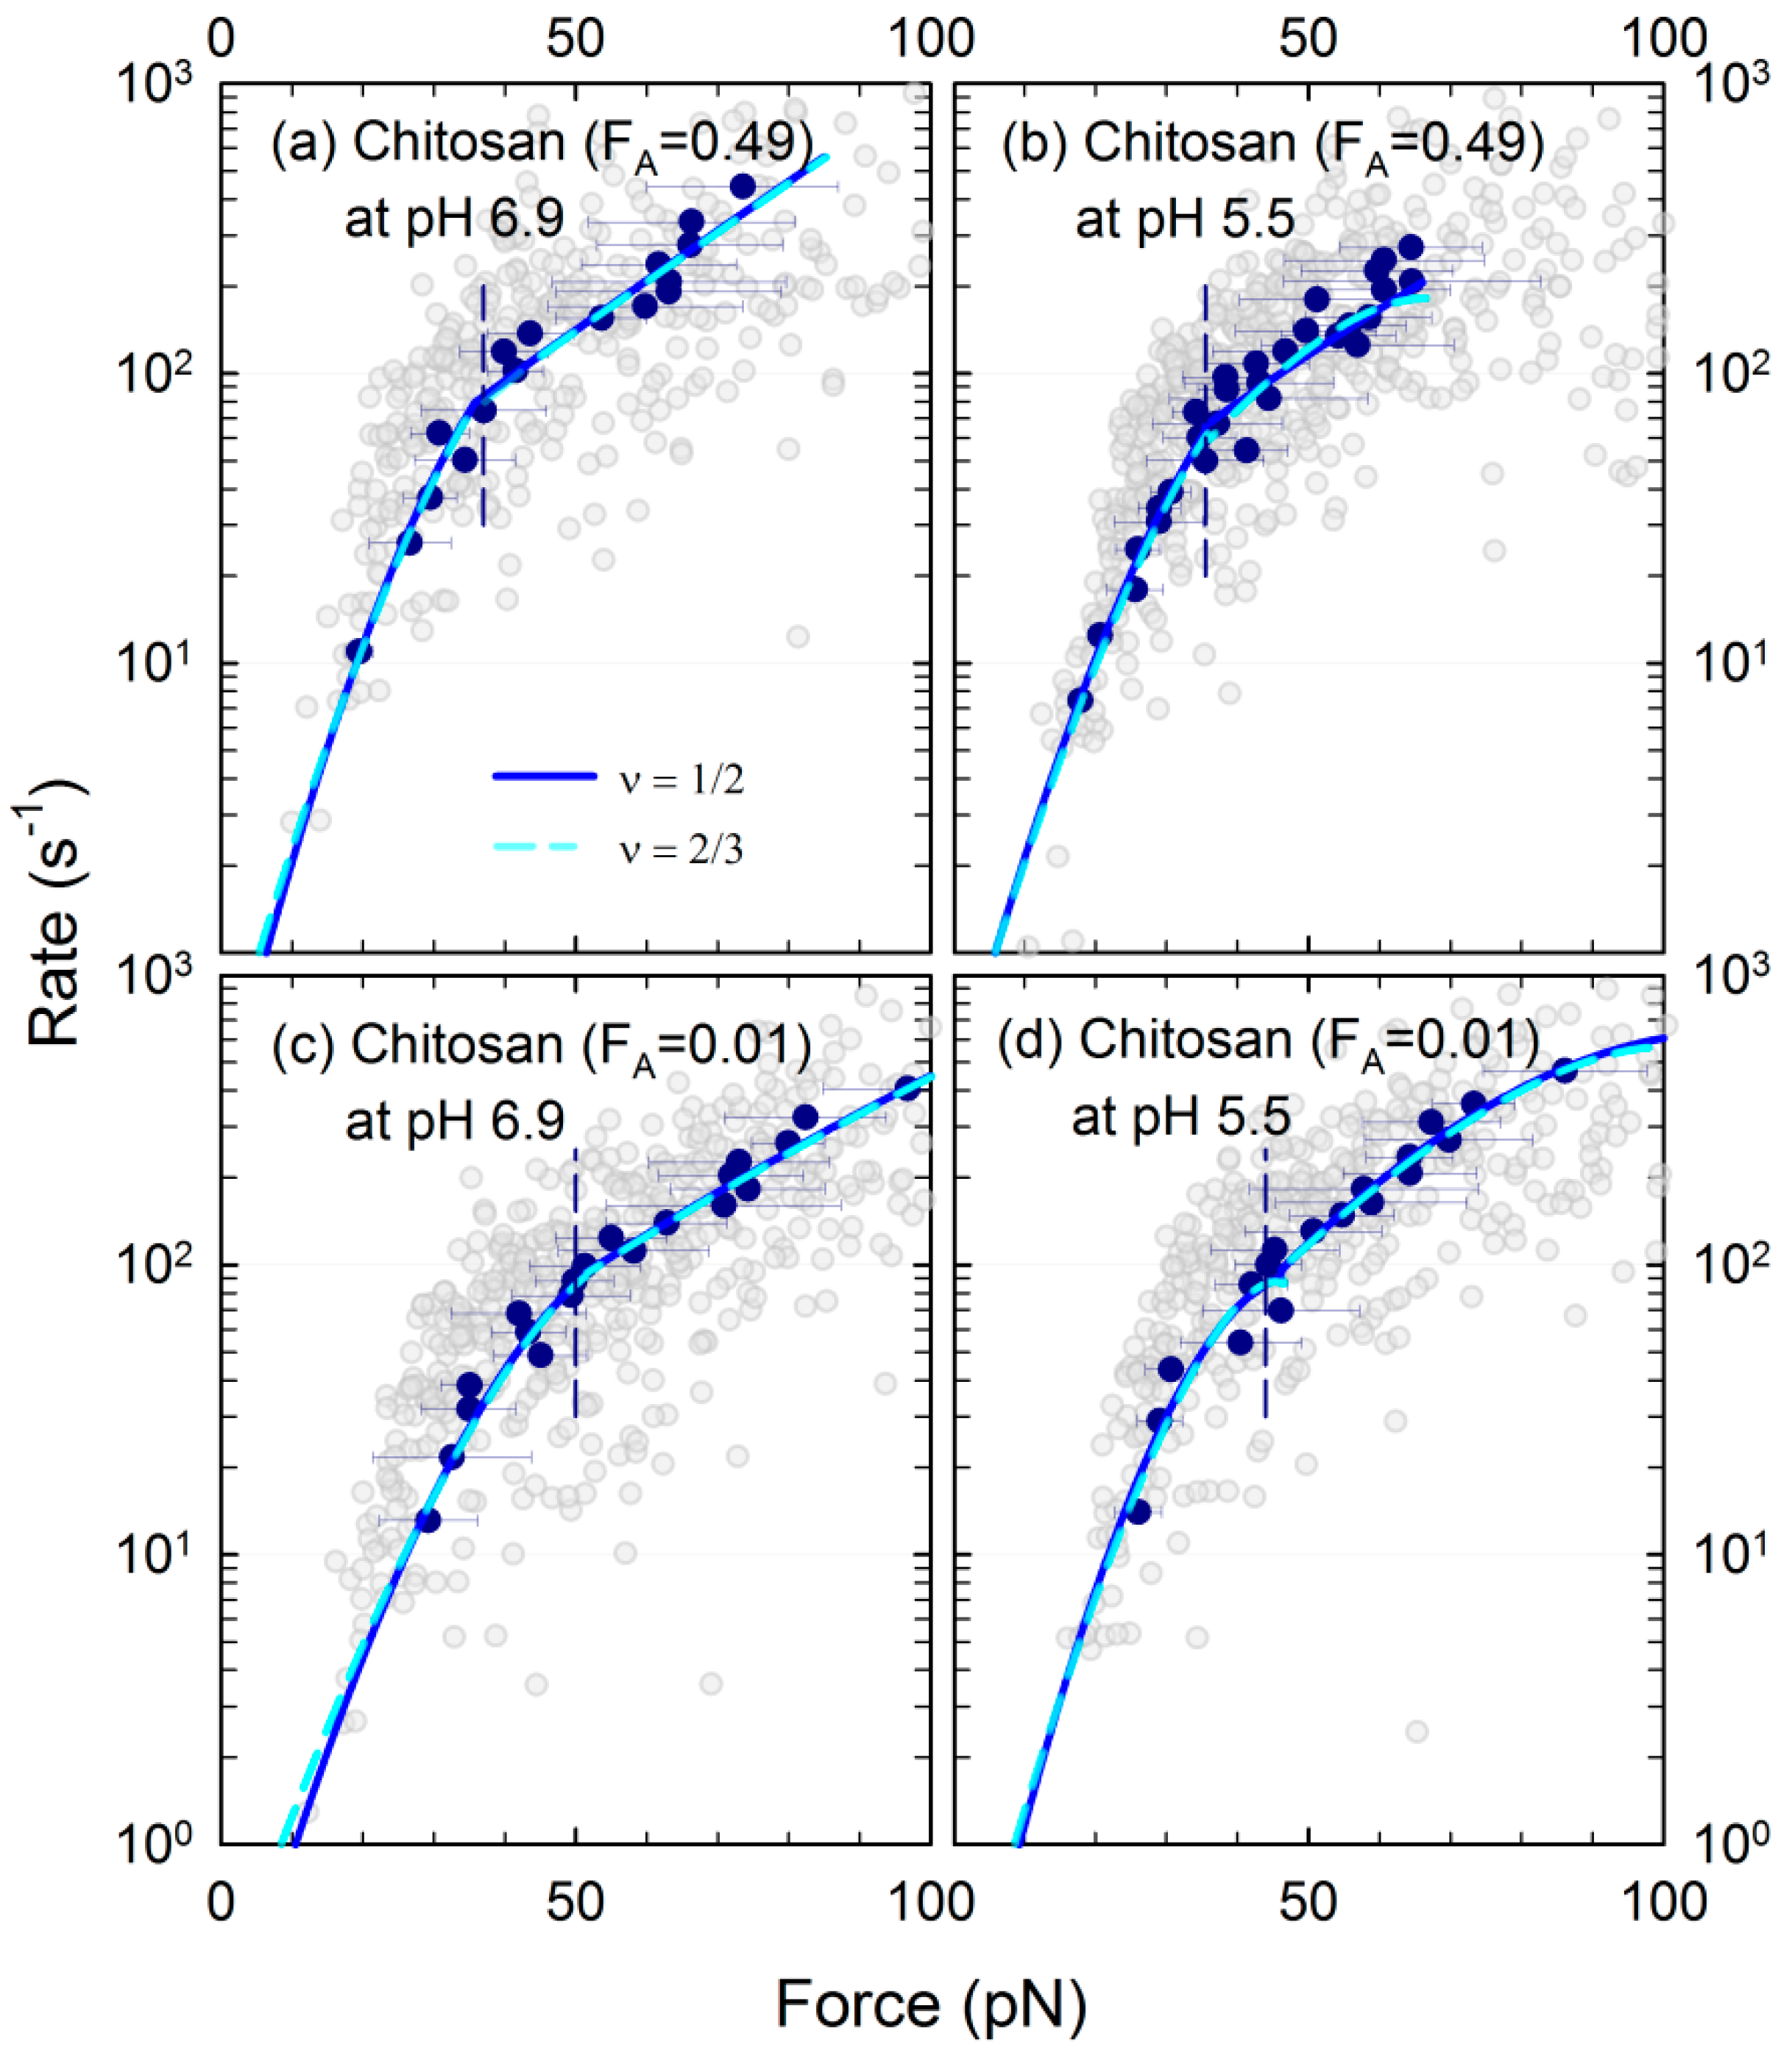
3.3. Energy Landscape of the Mucin–Chitosan Interactions

The energy landscapes of the mucin–chitosans (Figure 5) indicate a nearly linear increase in the mean rupture force with increasing ln(rf) for force loading rates up to about 2 nN/s. This is followed by a transition to a more rapid increase of f with ln(rf). These trends are evident in the data for the two chitosans at both pH values investigated. The fits of P(f) to the experimentally determined distributions of forces for an interval of rf (examples shown in Figure S2) indicate that the distributions are well accounted for.
Conventional procedures to determine parameters for the energy landscape group observed unbinding forces versus ln(rf) into sub-distributions yielding average unbinding forces with corresponding average loading rates. This forms a basis for subsequent regression analysis to obtain estimates of xβ, τ0 and ΔG. However, given the variations in the parameter estimates when varying the number of distributions and number of bins per distribution histogram (see Figure S3 and Figure S4), data for each interacting macromolecular pair were analyzed using a range of sub-distributions, thus yielding average values <xβ>, <τβ> and <ΔG> to account for the sensitivities in data handling. Finally, the predicted coefficient of determination, R2Pred, was calculated for each regression to avoid over fitting. Low predicted R2Pred and those differing significantly from the coefficient of determination R2 were not included in the averaging. The cut-off value for R2Pred was set to ~0.7. Obtained averaged parameters with ν = 1 / 2 for the different interaction couples are shown in Table 2 and Table S1 for the dynamic strength spectrum presentation and constant-force rupture-rate presentation according to Equations (1) and (4), respectively.
Figure 5. Force spectroscopy analysis of mucin–chitosan forced unbinding data for chitosans with FA = 0.01 and 0.49, and at pH 5.5 (25 mM acetate buffer, 150 mM NaCl) and 6.9 (25 mM Hepes buffer, 150 mM NaCl) aqueous buffer. The data is presented as individual dissociation events (transparent symbols for each unbinding event) and mean rupture force versus loading rate (blue symbols) in the sub-distribution, respectively. The continuous lines depict the fit to theory for mean rupture force versus loading rate (Equation (1)) for the energy barriers with ν = 1/2 and ν = 2/3. The dashed vertical line divides the energy landscape in the regions where the outer and inner barriers are limiting the rate. Two examples of histograms for the sub-distributions, one from the outer and one from the inner barrier of each chitosan–mucin couple (Figure 5a–d), are shown in Figure S2.
Polymers 07 00161 g005
The parameters of the energy landscape determined for loading rates less than 2 nN/s indicate a distance to the transition barrier, <xβ>, in the 0.98–1.27 nm range for the two chitosans at the two solvent pHs. The lifetimes of the interaction <τ0> corresponding to this outermost barrier decrease as the degree of acetylation and pH increase, and are all within the 1.1–10.5 s range (Table 2). The more rapid increase in f for loading rates rf larger than 2 nN/s also indicate that there is a second barrier in the energy landscape, with <xβ>, of about 0.12–0.21 nm and lifetimes in the 0.06–0.07 s range (Table 2). The free activation energies <ΔG> are estimated to be in the 6.0 to 8.8 kBT range for the outer barrier and in the 2.5–2.8 kBT range for the inner barrier. The estimated parameters of the mucin–chitosan energy landscapes are nearly invariant to the type of interaction potential (compare estimates for ν = 1 / 2 and ν = 2 / 3 , Table S2). The dissociation rates (inverse of lifetime) were observed to conform to a theory with one rate limiting barrier in the dissociation pathway for forces up to about 40 pN for the chitosan–mucin interactions (one out of multiple analysis shown in Figure 6, corresponding Table S3). The change in the force dependence for larger forces suggests a transition to a dissociation pathway with a rate limiting barrier with other parameters. It should be noted that the employed linear assumption used in estimating the force loading rate just prior to the unbinding events may yield some displacement of the energy landscapes towards lower loading rates at higher unbinding forces, and therefore affect the estimated values of the energy landscape. However, the difference between this procedure and that of employing the fit of a polymer model to the force-extension data as a basis for determination of the loading rate is found to be of the same order as the uncertainties (e.g., Figure 5).
Table 2. Energy landscape parameters obtained for chitosan–mucin and alginate–mucin interactions from the dynamic strength spectrum presentation, i.e., fits of mean force f versus corresponding mean loading rates r f (Equation (1)) with ν = 1 / 2 .
PolymerSolvent pHRange of rf (nN/s)<xβ> (nm)0> (s)G> (kBT)Pred. R2
Chitosan (FA = 0.49)5.50.64–1.891.18 ± 0.083.41 ± 1.017.26 ± 0.330.80–0.95
5.52.01–7.350.20 ± 0.020.07 ± 0.0052.79 ± 0.07 0.90–0.97
6.90.68–1.890.98 ± 0.061.07 ± 0.225.96 ± 0.220.80–0.94
6.92.09–9.460.12 ± 0.010.06 ± 0.0022.49 ± 0.040.89–0.97
Chitosan (FA = 0.01)5.51.02–2.571.27 ± 0.05 7.84 ± 1.788.69 ± 0.280.80–0.90
5.52.84–7.600.21 ± 0.010.07 ± 0.0032.82 ± 0.080.87–0.98
6.90.55–1.901.20 ± 0.0810.5 ± 3.28.77 ± 0.360.74–0.83
6.92.08–5.360.15 ± 0.020.07 ± 0.0042.52 ± 0.060.84–0.98
Alginate (FG = 0.65)6.90.32–4.960.48 ± 0.062.78 ± 1.017.64 ± 0.180.92–0.98
The symbols used to denote the energy landscape parameters are as follows: f is the force loading rate, xβ is the distance to the barrier in the unbinding pathway, τ0 is the lifetime of the complex in the absence of external force, ΔG is the free energy of the activation, and R2 depicts the predicted R square. The < > depict the average obtained by using increasing number of intervals in the histogram representations.
Similar to the dynamic strength spectrum presentation (one out of multiple analysis shown in Figure 5, corresponding Table S2), these trends are evident in the data for the two chitosans for both of the pHs investigated. The transition state distances of the innermost barriers <xβ> are in the 0.64–0.94 nm range for the two chitosans at the two solvent pHs. The lifetimes of the interactions <τ0> corresponding to these outermost barriers decrease with increased acetylation and pH, and are all in the 2.1–5.9 s range (Table S1). The parameters for the inner barriers are estimated as follows: <xβ> in the range of about 0.33–0.42 nm and lifetimes <τ0> in the 0.18–0.36 s range (Table S1). The activation free energies <ΔG> are estimated to be in the 7.7–9.0 kBT and 7.0–8.0 kBT ranges for the outer and inner barrier, respectively. These estimated parameters for the mucin-chitosan energy landscapes are not very sensitive to the type of interaction potential (compare estimates for ν = 1 / 2 and ν = 2 / 3 , Table S3).
Figure 6. The lifetime of the chitosan–mucin interactions versus force for chitosan with FA = 0.01 and 0.49, at pH 5.5 and 6.9 in the aqueous buffer (buffer conditions as in Figure 5). The data is presented as dissociation rate versus magnitude of force at dissociation for individual forced dissociation events (transparent symbols) and mean dissociation rate ± standard deviation versus mean dissociation force (blue symbols) in the sub–distributions, respectively. The continuous lines depict the fit to theory for dissociation rate versus rupture force (Equation (2)) for the energy barriers with ν = 1/2 and ν = 2/3. The vertical dashed lines depict the border between the region where the inner and outer barrier are limiting the rate.
Polymers 07 00161 g006
Estimates of the parameters for the energy landscapes for the mucin–chitosan interaction obtained from the constant-force rupture-rate presentation (Table S1) are similar to the values obtained from the dynamic strength spectrum presentation (compare data in Table S1 with Table 2). Since the latter is invariant to the number of bins, whilst the constant-force rupture-rate presentation is not, the dynamic strength spectrum presentation yielded more robust parameter estimations, as can also be seen from the R2Pred values in Figure S3 and Figure S4. In both presentations, the phenomenological approach (ν = 1) was found to be insufficient to describe the systems as judged from poor regression goodness and increasing force variance with increasing loading rate, which should be constant for this model to be valid [68]. This data is only included for comparison.
The structure of the chitosans and mucins is expected to support multiple interactions along the individual polymer chains. The effects of the zipper-type, multiple-interaction-site model on force spectroscopy profiles have been modeled theoretically [79]. In the present case with interaction probabilities up to 45% (Figure 2), it is also difficult to totally exclude possible interactions supported by parallel chains bridging the AFM tip and the mucin immobilized to the mica surface. More explicit signs of possible multiple interactions include a trend in the observed in Pint versus pulling rate. This can be interpreted as follows: the longer the functionalized AFM tip and mica surface spend in proximity, the slower the pulling, which allows a longer period for bond formation. In the force–distance curve panels, we have also included examples (e.g., Figure 3, lower traces) that are consistent with macromolecular interactions supported by multiple molecular groups. Deconvolution of individual binding strength and number of effective interactions following theories in the field [79,80,81] are in the present case, difficult due to the varying tether length to the interaction site. The estimated parameters for the energy landscapes should therefore be considered effective parameters.

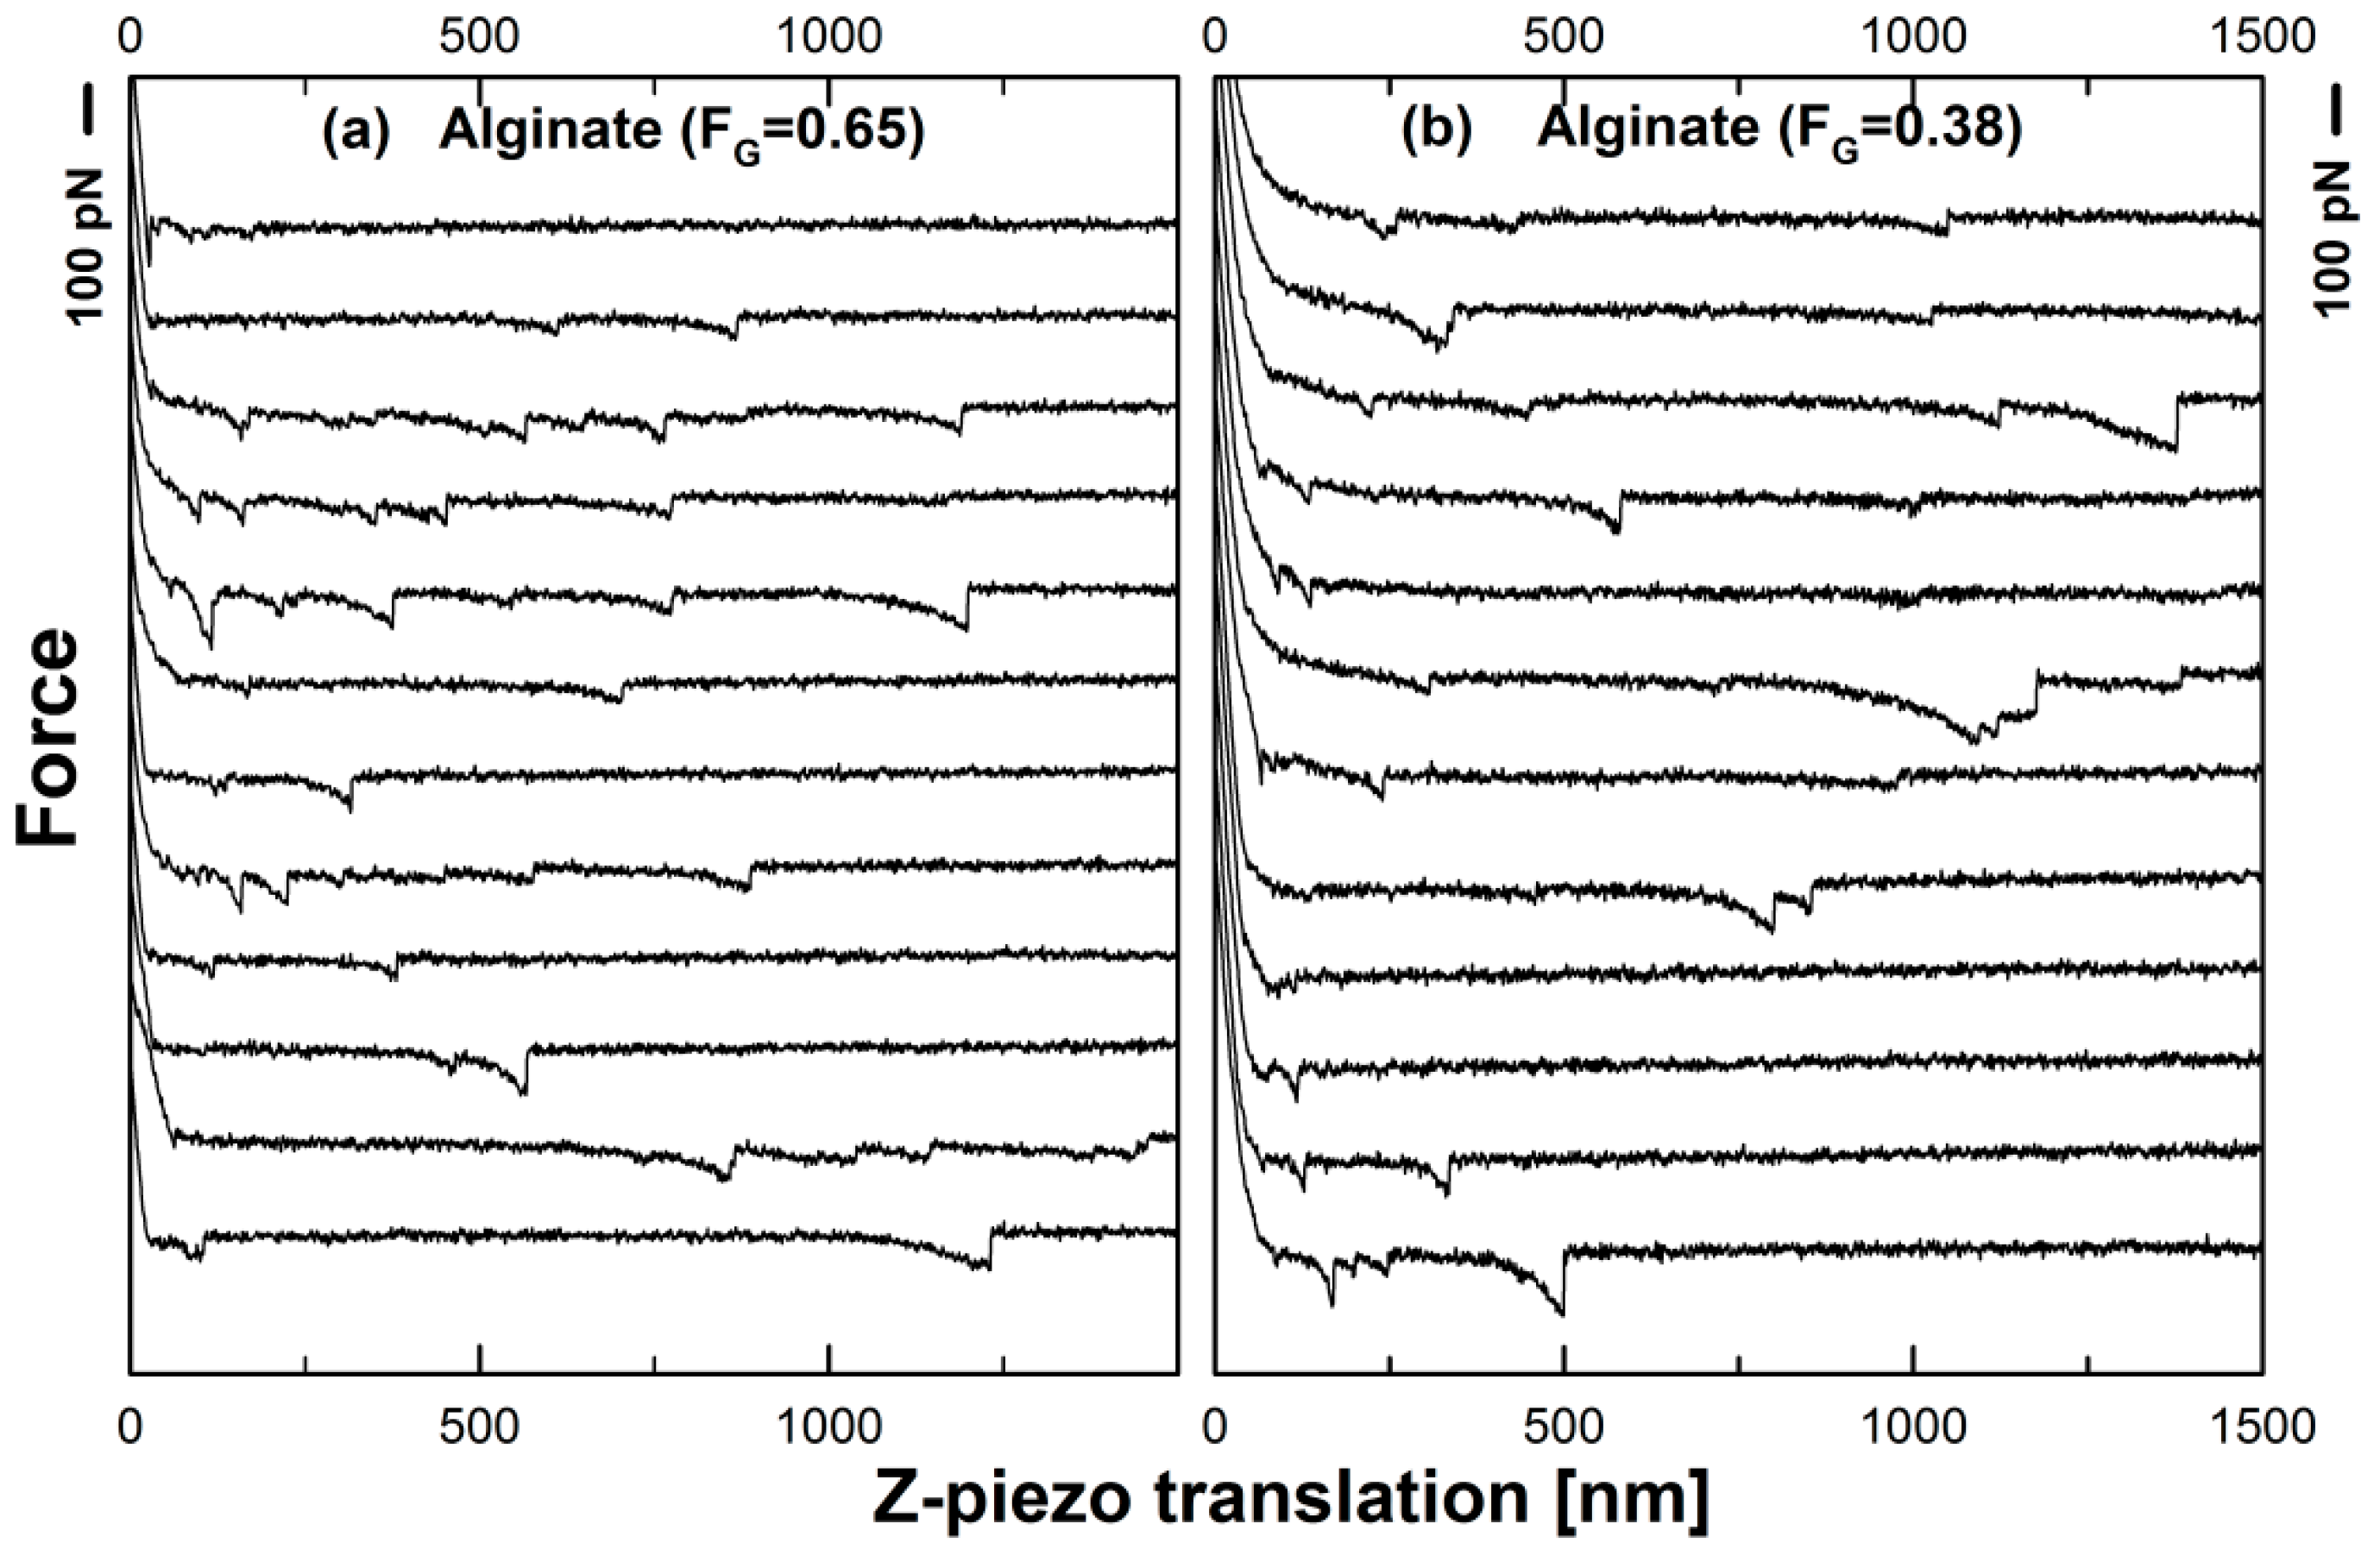
3.4. Mucin–Alginate Interactions

For experiments between alginate functionalized tips and mucin functionalized surfaces, molecular unbinding events are observed up to 1500 nm from the surface (Figure 7). Some retraction curves display signatures of only one unbinding event, whereas others contain well-separated unbinding events along the complete retraction distance. The well-separated individual unbinding events were included in the force spectroscopy analysis in a similar manner as for the analysis of the chitosan–mucin interactions.
Similar to the mucin–chitosan interactions determined by AFM technique, the observed dissociation events in the mucin–alginate case reflect forced dissociation of physical bonds between such molecular pairs. This emerges from the observation of no major decline in the magnitudes of the forces following repeated trials, the presence of the unbinding events being specific to the molecular pair [49,62] and the magnitude up to about 0.2 nN being much less than 1–3 nN being the force needed to break covalent bonds.
The energy landscapes of the mucin–alginate (FG = 0.65) interaction indicate an initial nearly linear relationship between the mean rupture force with increasing ln(rf). A possible tendency toward a stronger dependence of f versus ln(rf), similar to that observed in the mucin–chitosan cases, is not clearly evident in the data (Figure 8). Preliminary data for the mucin–alginate (FG = 0.38) indicate overlap with mucin–alginate (FG = 0.65) interactions (data not shown). The parameters of the energy landscape indicate a distance to the transition barrier, <xβ>, of about 0.5 nm, a lifetime for the associated state of 2.8 s and a free activation energy <ΔG> of about 7.6 kBT for the mucin–alginate (FG = 0.65) case (Table 2). Similar estimates were obtained from the constant-force rupture-rate presentation (compare Table 2 with Table S1).
Figure 7. Force-distance retraction curves obtained for pig gastric mucin covalently attached to mica and alginates covalently attached to the AFM tip. The force distance data were collected in aqueous solution on a high-precision mapping stage. The measurements were conducted in buffered aqueous solution (25 mM Hepes buffer, 150 mM NaCl, pH 6.9). The galleries of force distance curves are shown for the mucin interacting with alginates with FG = 0.65 (a); and FG = 0.38 (b). Data are shown only for the retraction directions from the surface, and are shifted in the vertical direction for better visibility.
Polymers 07 00161 g007
Figure 8. Analysis of mucin–alginate (FG = 0.65) interactions in aqueous buffer (25 mM Hepes, 150 mM NaCl, pH 6.9) using mean rupture force versus loading rate (a) and dissociation rate versus rupture force (b) representation. The data is presented as individual dissociation events (transparent symbols for each unbinding event) and the mean value of rupture force versus loading rate (Figure 8a) and mean dissociation rate versus rupture force (Figure 8b). The mean values are calculated within the sub–distributions. The continuous lines depict the fits according to Equation (1) (Figure 8a) or Equation (2) (Figure 8b) for the energy barriers with ν = 1/2 and ν = 2/3. Two examples of histograms for the sub-distributions in Figure 8a are shown in Figure S5.
Polymers 07 00161 g008

3.5. Nature of Mucin–Chitosan and Mucin–Alginate Interactions

Alginate and chitosan are two rather different biopolymers, both of which have a long history of research and use in pharmaceutical and mucoadhesive applications. Whilst chitosan performs well as a mucoadhesive agent both in vivo [32,33,34,35,36,37,38] and in vitro [2,25,26,28,39,40,41,42,43,44,45,46], alginate is generally considered to be poorly mucoadhesive. In this study both polymers clearly demonstrate intermolecular interactions with mucins. The finding that one barrier in the energy landscape is not always sufficient to account for the experimental data may indicate that localized net interactions supported by more than one molecular pair are involved. The multitude of interaction capacities hosted by the various molecular groups of mucin on one hand and chitosans on the other can be expected to yield complex energy landscapes with such features. The cationic nature of chitosan is thought to be centrally important for its interaction with mucins [2,25,26], which carry a net negative charge at physiological pH. The fraction of z–piezo retraction cycles showing interactions, Pint, does indicate that there is a substantial effect from changes in pH for the chitosan–mucin interaction, particularly for the chitosan with FA = 0.49. These observed changes in Pint parallel changes in the pH-dependent charge density of chitosan, and can be considered indicative of an electrostatic contribution to the overall mucin–chitosan interaction. Whilst both chitosans will be less charged at pH 6.9 and charged at pH 5.5, they will have different charge densities at pH 5.5, where the charge density for the chitosan with FA = 0.01 will approach 1 whereas that of the chitosan with FA = 0.49 will be approximately 0.5 of the residues. It is therefore interesting that the pH dependence of Pint is less obvious for the chitosan with FA = 0.01, which will have a greater difference in charge density at the two pH values than the chitosan with FA = 0.49, suggesting that Coulomb forces alone do not completely explain the interactions seen. The two chitosans will also respond somewhat differently to the changes in pH, with the chitosan with FA = 0.01 being insoluble at pH 6.9, whereas the chitosan with FA = 0.49 will remain soluble, albeit with a somewhat less expanded molecular conformation. As such, the wide variation in Pint for the chitosan with FA = 0.01 at pH 6.9 may reflect the poor solubility. Additionally, the obtained force curves do not display significant differences as a function of pH. These data indicate that electrostatic interactions alone do not account for the mucoadhesive properties of chitosan and are in agreement with other studies where hydrogen bonding and hydrophobic interactions have also been implicated as contributing to the mucoadhesion of chitosan [2]. If we consider the situation at pH 5.5, where both chitosans are soluble and in an extended molecular conformation, then the potential for hydrophobic interactions, which will be substantially greater in the chitosan with FA = 0.49 than that with FA = 0.01, may explain why the chitosan with the lower charge density shows a slightly greater (rather than lower, as would be expected from a purely electrostatic interaction) Pint (Figure 2). Indeed, the reported decreased second virial coefficient with increasing FA in a series of chitosan was suggested to be driven by an increase in the hydrophobic interactions due the increased number of N–acetyl groups [82].
Although there appears to be a significantly lower Pint seen for the mucin–alginate pairs, direct comparison between interaction frequencies between alginates and chitosans are difficult due to the optimization of the immobilization protocols towards single–molecule observations. It is interesting to note, however, that a tendency for a longer lifetime of the chitosan–mucin interaction (outermost barrier) was found, as compared to the alginate–mucin interaction (Table 2). Although mucins carry a net negative charge, there is the potential for isolated positive charges along the molecule, so charge–charge interactions between mucins and alginates, whilst less obvious than those between mucins and chitosan, cannot be excluded. The molecular groups of alginate do not offer the possibility for hydrophobic interactions that is seen in chitosan, so such forms of interaction will not contribute to the mucin–alginate association. Hydrogen bonding on the other hand is possible in both mucin–chitosan and mucin–alginate interactions. Thus the tendency for longer interaction lifetimes for the mucin–chitosan pairs may reflect a greater range of potential intermolecular interaction types.

3.6. Relevance for Mucoadhesion

Mucoadhesion is a complex phenomenon not least due to the complexity of the mucosal surface and the macromolecules therein. A common feature of mucosal surfaces is the extracellular mucus layer, so when considering mucoadhesion we are generally considering that (at least initially) the contact and adhesion occurs between the mucus layer and the mucoadhesive rather than the cell surface and the mucoadhesive [83,84]. Secreted mucus is a highly hydrated gel of polymeric mucin glycoproteins, lipids, proteins and inorganic salts. Mucin polymers, interacting with each other through multiple diverse non-covalent interactions, are the structure-forming element of the gel and the central determinant of its functional rheological properties [27,84,85]. Mucin molecules are capable of forming many diverse types of intermolecular interactions and of incorporating diverse elements into the mucus gel without destabilization, which in theory makes mucus an appealing surface for adhesion for many different types of material. Indeed the data obtained in this study firmly support the idea that mucins are capable of supporting diverse types of intermolecular interactions. It is of interest that the chitosans, which generally perform better as mucoadhesives and showed greater interaction potential in this study, have the potential for a greater range of intermolecular interactions than the less well performing alginates.
Despite the clear mucoadhesive potential of chitosan as demonstrated here, there are a number of issues relating to the adhesion of a dosage form to mucus. Firstly, constitutive secretion and mucus turnover means that any adhered dosage form risks being rapidly removed along with the mucus it is adhered to [86], and secondly the payload must diffuse upstream across the mucus before reaching the underlying epithelial cells for uptake. Added to this, mucus provides a substantial barrier to the diffusion of large, charged and lipophilic entities, which can dramatically reduce diffusion rates [87,88,89]. Indeed, these issues have resulted in increasing interest in the development of muco-inert carrier systems in the form of mucus-penetrating particles that avoid interaction with mucus and thus experience a lower diffusion barrier [84,90,91,92,93].
However, the high interaction potential of mucins and the ability of mucins to mix with other polymer or biomacromolecule systems without phase separation [51,52] give rise to the intriguing possibility that a polymer from a traditional mucoadhesive dosage form could interact with and diffuse into mucus, giving rise to an interpenetration [94] zone of mixed polymers that has altered barrier or turnover properties compared to the mucus gel. It has previously been shown for example that various polymers found in pharmaceutical formulations may induce changes in mucociliary transport rates [95]. It would be of significant interest, particularly given the varied muco–interaction modes for chitosan, to further explore these possibilities by investigating the interactions between dense mucin layers and chitosan.

4. Conclusions

Chitosan and alginate are among polymers suggested to mediate mucoadhesive properties in the context of drug delivery applications. Given the fundamental role played by mucins in the mucus gel, it is natural to consider mucoadhesion of such polymers in terms of their intermolecular interactions with mucins. In the present work, the binding between mucin and either chitosan or alginate has been determined using forced dissociation of the macromolecular interactions in aqueous solutions. Both molecular pair combinations display interaction forces up to 200 pN with a dependence on force loading rates that can be rationalized in terms of an energy landscape for the interactions with 2 or 1 rate limiting barrier for the chitosan–mucin and alginate–mucin pairs, respectively. Trends in the obtained data depending on macromolecular structural and solvent parameters are rationalized in terms of fundamental forces contributing to the overall net interactions.

Supplementary Materials

Supplementary materials can be accessed at: https://www.mdpi.com/2073-4360/7/2/0161/s1.

Acknowledgments

The authors gratefully acknowledge Kjell M. Vårum for providing the chitosan samples and to Hye Won Lee for performing some of the control experiments.

Author Contributions

Bjørn T. Stokke designed the study, Catherine T. Nordgård and Kurt I. Draget provided materials for the study, Kristin E. Haugstad, Patricia S. Adl and Gjertrud Maurstad collected the data, Armend G. Håti, Bjørn T. Stokke, Catherine T. Nordgård, Kristin E. Haugstad, Marit Sletmoen and Rita S. Dias analyzed the data, Armend G. Håti, Bjørn T. Stokke, Catherine T. Nordgård and Kristin E. Haugstad wrote the manuscript, all authors revised the manuscript and approved the final version.

Conflicts of Interest

The authors declare no conflict of interest.

References

  1. Khutoryanskiy, V.V. Advances in mucoadhesion and mucoadhesive polymers. Macromol. Biosci. 2011, 11, 748–764. [Google Scholar] [CrossRef] [PubMed]
  2. Sogias, I.A.; Williams, A.C.; Khutoryanskiy, V.V. Why is chitosan mucoadhesive? Biomacromolecules 2008, 9, 1837–1842. [Google Scholar] [CrossRef] [PubMed]
  3. Alain, D.; Monique, D. Chitosan, Polymeric Biomaterials, Revised and Expanded; CRC Press: Boca Raton, FL, USA, 2001. [Google Scholar]
  4. Minke, R.; Blackwell, J. The structure of α-chitin. J. Mol. Biol. 1978, 120, 167–181. [Google Scholar] [CrossRef] [PubMed]
  5. Sikorski, P.; Hori, R.; Wada, M. Revisit of α-chitin crystal structure using high resolution X-ray diffraction data. Biomacromolecules 2009, 10, 1100–1105. [Google Scholar] [CrossRef] [PubMed]
  6. Fukamizo, T. Chitinolytic enzymes: Catalysis, substrate binding, and their application. Curr. Protein Pept. Sci. 2000, 1, 105–124. [Google Scholar] [CrossRef] [PubMed]
  7. Ohnuma, T.; Umemoto, N.; Kondo, K.; Numata, T.; Fukamizo, T. Complete subsite mapping of a “loopful” GH19 chitinase from rye seeds based on its crystal structure. FEBS Lett. 2013, 587, 2691–2697. [Google Scholar] [CrossRef] [PubMed]
  8. Stokke, B.; Varum, K.; Holme, H.; Hjerde, R.; Smidsrod, O. Sequence specificities for lysozyme depolymerization of partially N-acetylated chitosans. Can. J. Chem. 1995, 73, 1972–1981. [Google Scholar] [CrossRef]
  9. Horn, S.J.; Sorbotten, A.; Synstad, B.; Sikorski, P.; Sorlie, M.; Varum, K.M.; Eijsink, V.G.H. Endo/exo mechanism and processivity of family 18 chitinases produced by serratia marcescens. FEBS J. 2006, 273, 491–503. [Google Scholar] [CrossRef] [PubMed]
  10. Caridade, S.G.; Monge, C.; Gilde, F.; Boudou, T.; Mano, J.F.; Picart, C. Free-standing polyelectrolyte membranes made of chitosan and alginate. Biomacromolecules 2013, 14, 1653–1660. [Google Scholar] [CrossRef] [PubMed] [Green Version]
  11. Maurstad, G.; Mørch, Y.A.; Bausch, A.R.; Stokke, B.T. Polyelectrolyte layer interpenetration and swelling of alginate-chitosan multilayers studied by dual wavelength reflection interference contrast microscopy. Carbohydr. Polym. 2008, 71, 672–681. [Google Scholar] [CrossRef]
  12. Picart, C.; Schneider, A.; Etienne, O.; Mutterer, J.; Schaaf, P.; Egles, C.; Jessel, N.; Voegel, J.C. Controlled degradability of polysaccharide multilayer films in vitro and in vivo. Adv. Funct. Mater. 2005, 15, 1771–1780. [Google Scholar] [CrossRef]
  13. Schneider, A.; Richert, L.; Francius, G.; Voegel, J.C.; Picart, C. Elasticity, biodegradability and cell adhesive properties of chitosan/hyaluronan multilayer films. Biomed. Mater. 2007, 2. [Google Scholar] [CrossRef]
  14. Neto, A.I.; Cibrao, A.C.; Correia, C.R.; Carvalho, R.R.; Luz, G.M.; Ferrer, G.G.; Botelho, G.; Picart, C.; Alves, N.M.; Mano, J.F. Nanostructured polymeric coatings based on chitosan and dopamine-modified hyaluronic acid for biomedical applications. Small 2014, 10, 2459–2469. [Google Scholar] [CrossRef] [PubMed]
  15. Almodovar, J.; Place, L.W.; Gogolski, J.; Erickson, K.; Kipper, M.J. Layer-by-layer assembly of polysaccharide-based polyelectrolyte multilayers: A spectroscopic study of hydrophilicity, composition, and ion pairing. Biomacromolecules 2011, 12, 2755–2765. [Google Scholar] [CrossRef] [PubMed]
  16. Liu, C.; Thormann, E.; Claesson, P.M.; Tyrode, E. Surface grafted chitosan gels. Part I. Molecular insight into the formation of chitosan and poly(acrylic acid) multi layers. Langmuir 2014, 30, 8866–8877. [Google Scholar] [CrossRef] [PubMed]
  17. Koping-Hoggard, M.; Varum, K.M.; Issa, M.; Danielsen, S.; Christensen, B.E.; Stokke, B.T.; Artursson, P. Improved chitosan-mediated gene delivery based on easily dissociated chitosan polyplexes of highly defined chitosan oligomers. Gene Ther. 2004, 11, 1441–1452. [Google Scholar] [CrossRef] [PubMed]
  18. Strand, S.P.; Danielsen, S.; Christensen, B.E.; Varum, K.M. Influence of chitosan structure on the formation and stability of DNA-chitosan polyelectrolyte complexes. Biomacromolecules 2005, 6, 3357–3366. [Google Scholar] [CrossRef] [PubMed]
  19. Rantala, J.K.; Makela, R.; Aaltola, A.R.; Laasola, P.; Mpindi, J.P.; Nees, M.; Saviranta, P.; Kallioniemi, O. A cell spot microarray method for production of high density sirna transfection microarrays. BMC Genomics 2011, 12. [Google Scholar] [CrossRef] [PubMed]
  20. MacLaughlin, F.C.; Mumper, R.J.; Wang, J.; Tagliaferri, J.M.; Gill, I.; Hinchchliffe, M.; Rolland, A.P. Chitosan and depolymerized chitosan oligomers as condensing carriers for in vivo plasmid delivery. J. Controll. Release 1998, 56, 259–272. [Google Scholar] [CrossRef]
  21. Malmstrom, J.; Lovmand, J.; Kristensen, S.; Sundh, M.; Duch, M.; Sutherland, D.S. Focal complex maturation and bridging on 200 nm vitronectin but not fibronectin patches reveal different mechanisms of focal adhesion formation. Nano Lett. 2011, 11, 2264–2271. [Google Scholar] [CrossRef] [PubMed]
  22. Agirre, M.; Zarate, J.; Ojeda, E.; Puras, G.; Desbrieres, J.; Pedraz, J.L. Low molecular weight chitosan (lmwc)-based polyplexes for pdna delivery: From bench to bedside. Polymers 2014, 6, 1727–1755. [Google Scholar] [CrossRef]
  23. Köping-Höggård, M.; Mel’nikova, Y.S.; Vårum, K.M.; Lindman, B.; Artursson, P. Relationship between the physical shape and the efficiency of oligomeric chitosan as a gene delivery system in vitro and in vivo. J. Gene Med. 2003, 5, 130–141. [Google Scholar] [CrossRef] [PubMed]
  24. Khong, T.T.; Aarstad, O.A.; Skjak-Braek, G.; Draget, K.I.; Varum, K.M. Gelling concept combining chitosan and alginate-proof of principle. Biomacromolecules 2013, 14, 2765–2771. [Google Scholar] [CrossRef] [PubMed]
  25. Bernkop-Schnurch, A.; Dunnhaupt, S. Chitosan-based drug delivery systems. Eur. J. Pharm. Biopharm. 2012, 81, 463–469. [Google Scholar] [CrossRef] [PubMed]
  26. Sigurdsson, H.H.; Loftsson, T.; Lehr, C.M. Assessment of mucoadhesion by a resonant mirror biosensor. Int. J. Pharm. 2006, 325, 75–81. [Google Scholar] [CrossRef] [PubMed]
  27. Smart, J.D. The basics and underlying mechanisms of mucoadhesion. Adv. Drug Deliv. Rev. 2005, 57, 1556–1568. [Google Scholar] [CrossRef] [PubMed]
  28. Das Neves, J.; Bahia, M.F.; Amiji, M.M.; Sarmento, B. Mucoadhesive nanomedicines: Characterization and modulation of mucoadhesion at the nanoscale. Exp. Opin. Drug Deliv. 2011, 8, 1085–1104. [Google Scholar]
  29. Haas, J.; Lehr, C.M. Developments in the area of bioadhesive drug delivery systems. Exp. Opin. Biol. Ther. 2002, 2, 287–298. [Google Scholar] [CrossRef]
  30. Roy, S.; Pal, K.; Anis, A.; Pramanik, K.; Prabhakar, B. Polymers in mucoadhesive drug-delivery systems: A brief note. Des. Monomers Polym. 2009, 12, 483–495. [Google Scholar] [CrossRef]
  31. Chickering, D.E.; Mathiowitz, E. Definitions mechanisms and theories of bioadhesion. In Bioadhesive Drug Delivery Systems: Fundamentals, Novel Approaches, and Developments; Mathiowitz, E., Chickering, D.E., Lehr, C.-M., Eds.; Marcel Dekker: New York, NY, USA, 1999. [Google Scholar]
  32. Bshara, H.; Osman, R.; Mansour, S.; El-Shamy, A.A. Chitosan and cyclodextrin in intranasal microemulsion for improved brain buspirone hydrochloride pharmacokinetics in rats. Carbohydr. Polym. 2014, 99, 297–305. [Google Scholar] [CrossRef] [PubMed]
  33. Cho, S.; Sun, Y.G.; Jarboe, E.A.; Soisson, A.P.; Dodson, M.K.; Gaffney, D.K.; Peterson, C.M.; Janat-Amsbury, M.M. Mucoadhesive hybrid gel improves intraperitoneal platinum delivery. Int. J. Pharm. 2013, 458, 148–155. [Google Scholar] [CrossRef] [PubMed]
  34. Gradauer, K.; Barthelmes, J.; Vonach, C.; Almer, G.; Mangge, H.; Teubl, B.; Roblegg, E.; Dunnhaupt, S.; Frohlich, E.; Bernkop-Schnurch, A.; et al. Liposomes coated with thiolated chitosan enhance oral peptide delivery to rats. J. Controll. Release 2013, 172, 872–878. [Google Scholar] [CrossRef]
  35. Luessen, H.L.; deLeeuw, B.J.; Langemeyer, M.W.E.; de Boer, A.G.; Verhoef, J.C.; Junginger, H.E. Mucoadhesive polymers in peroral peptide drug delivery 6. Carbomer and chitosan improve the intestinal absorption of the peptide drug buserelin in vivo. Pharm. Res. 1996, 13, 1668–1672. [Google Scholar] [CrossRef] [PubMed]
  36. Martin, D.T.; Steinbach, J.M.; Liu, J.C.; Shimizu, S.; Kaimakliotis, H.Z.; Wheeler, M.A.; Hittelman, A.B.; Saltzman, W.M.; Weiss, R.M. Surface-modified nanoparticles enhance transurothelial penetration and delivery of survivin sirna in treating bladder cancer. Mol. Cancer Ther. 2014, 13, 71–81. [Google Scholar] [CrossRef] [PubMed]
  37. Mouez, M.A.; Zaki, N.M.; Mansour, S.; Geneidi, A.S. Bioavailability enhancement of verapamil HCL via intranasal chitosan microspheres. Eur. J. Pharm. Sci. 2014, 51, 59–66. [Google Scholar] [CrossRef] [PubMed]
  38. Nafee, N.A.; Ismail, F.A.; Boraie, N.A.; Mortada, L.M. Mucoadhesive buccal patches of miconazole nitrate: In vitro/in vivo performance and effect of ageing. Int. J. Pharm. 2003, 264, 1–14. [Google Scholar] [CrossRef] [PubMed]
  39. Deacon, M.P.; McGurk, S.; Roberts, C.J.; Williams, P.M.; Tendler, S.J.B.; Davies, M.C.; Davis, S.S.; Harding, S.E. Atomic force microscopy of gastric mucin and chitosan mucoadhesive systems. Biochem. J. 2000, 348, 557–563. [Google Scholar] [CrossRef] [PubMed]
  40. Fiebrig, I.; Harding, S.E.; Rowe, A.J.; Hyman, S.C.; Davis, S.S. Transmission electron microscopy studies on pig gastric mucin and its interactions with chitosan. Carbohydr. Polym. 1995, 28, 239–244. [Google Scholar] [CrossRef]
  41. Pettersson, T.; Dedinaite, A. Normal and friction forces between mucin and mucin–chitosan layers in absence and presence of sds. J. Colloid Interface Sci. 2008, 324, 246–256. [Google Scholar] [CrossRef] [PubMed]
  42. Rossi, S.; Ferrari, F.; Bonferoni, M.C.; Caramella, C. Characterization of chitosan hydrochloride–mucin interaction by means of viscosimetric and turbidimetric measurements. Eur. J. Pharm. Sci. 2000, 10, 251–257. [Google Scholar] [CrossRef] [PubMed]
  43. Rossi, S.; Ferrari, F.; Bonferoni, M.C.; Caramella, C. Characterization of chitosan hydrochloride–mucin rheological interaction: Influence of polymer concentration and polymer: Mucin weight ratio. Eur. J. Pharm. Sci. 2001, 12, 479–485. [Google Scholar] [CrossRef] [PubMed]
  44. Silva, C.A.; Nobre, T.M.; Pavinatto, F.J.; Oliveira, O.N. Interaction of chitosan and mucin in a biomembrane model environment. J. Colloid Interface Sci. 2012, 376, 289–295. [Google Scholar] [CrossRef] [PubMed]
  45. Svensson, O.; Lindh, L.; Cardenas, M.; Arnebrant, T. Layer-by-layer assembly of mucin and chitosan–influence of surface properties, concentration and type of mucin. J. Colloid Interface Sci. 2006, 299, 608–616. [Google Scholar] [CrossRef] [PubMed]
  46. Svensson, O.; Thuresson, K.; Arnebrant, T. Interactions between chitosan-modified particles and mucin–coated surfaces. J. Colloid Interface Sci. 2008, 325, 346–350. [Google Scholar] [CrossRef] [PubMed]
  47. Dalmoro, A.; Barba, A.A.; Lamberti, G.; Grassi, M.; d’Amore, M. Pharmaceutical applications of biocompatible polymer blends containing sodium alginate. Adv. Polym. Technol. 2012, 31, 219–230. [Google Scholar] [CrossRef]
  48. Skaugrud, O.; Hagen, A.; Borgersen, B.; Dornish, M. Biomedical and pharmaceutical applications of alginate and chitosan. Biotechnol. Genet. Eng. Rev. 1999, 16, 23–40. [Google Scholar] [CrossRef] [PubMed]
  49. Sletmoen, M.; Maurstad, G.; Nordgard, C.T.; Draget, K.I.; Stokke, B.T. Oligoguluronate induced competitive displacement of mucin–alginate interactions: Relevance for mucolytic function. Soft Matter 2012, 8, 8413–8421. [Google Scholar] [CrossRef]
  50. Fuongfuchat, A.; Jamieson, A.M.; Blackwell, J.; Gerken, T.A. Rheological studies of the interaction of mucins with alginate and polyacrylate. Carbohydr. Res. 1996, 284, 85–99. [Google Scholar] [CrossRef] [PubMed]
  51. Nordgard, C.T.; Draget, K.I. Oligosaccharides as modulators of rheology in complex mucous systems. Biomacromolecules 2011, 12, 3084–3090. [Google Scholar] [CrossRef] [PubMed]
  52. Taylor, C.; Pearson, J.P.; Draget, K.I.; Dettmar, P.W.; Smidsrod, O. Rheological characterisation of mixed gels of mucin and alginate. Carbohydr. Polym. 2005, 59, 189–195. [Google Scholar] [CrossRef]
  53. Varum, K.M.; Ottoy, M.H.; Smidsrod, O. Water-solubility of partially N-acetylated chitosans as a function of pH: Effect of chemical-composition and depolymerization. Carbohydr. Polym. 1994, 25, 65–70. [Google Scholar] [CrossRef]
  54. Schatz, C.; Pichot, C.; Delair, T.; Viton, C.; Domard, A. Static light scattering studies on chitosan solutions: From macromolecular chains to colloidal dispersions. Langmuir 2003, 19, 9896–9903. [Google Scholar] [CrossRef]
  55. Taylor, C.; Draget, K.I.; Pearson, J.P.; Smidsrod, O. Mucous systems show a novel mechanical response to applied deformation. Biomacromolecules 2005, 6, 1524–1530. [Google Scholar] [CrossRef] [PubMed]
  56. Fogg, F.J.J.; Hutton, D.A.; Jumel, K.; Pearson, J.P.; Harding, S.E.; Allen, A. Characterization of pig colonic mucins. Biochem. J. 1996, 316, 937–942. [Google Scholar] [PubMed]
  57. Vårum, K.M.; Anthonsen, M.W.; Grasdalen, H.; Smidsrød, O. Determination of the degree of N-acetylation and the distribution of N-acetyl groups in partially N-deacetylated chitins (chitosans) by high-field n.M.R. Spectroscopy. Carbohydr. Res. 1991, 211, 17–23. [Google Scholar] [CrossRef] [PubMed]
  58. Grasdalen, H.; Larsen, B.; Smidsrød, O. Study of the composition and sequence of uronate residues in alginate. Carbohydr. Res. 1979, 68, 23–31. [Google Scholar] [CrossRef]
  59. Anthonsen, M.W.; Vårum, K.M.; Smidsrød, O. Solution properties of chitosans: Conformation and chain stiffness of chitosans with different degrees of N-acetylation. Carbohydr. Polym. 1993, 22, 193–201. [Google Scholar] [CrossRef]
  60. Aarstad, O.; Strand, B.L.; Klepp-Andersen, L.M.; Skjåk-Bræk, G. Analysis of G-block distributions and their impact on gel properties of in vitro epimerized mannuronan. Biomacromolecules 2013, 14, 3409–3416. [Google Scholar] [CrossRef] [PubMed]
  61. Sletmoen, M.; Skjak-Braek, G.; Stokke, B.T. Single-molecular pair unbinding studies of mannuronan C-5 epimerase AlgE4 and its polymer substrate. Biomacromolecules 2004, 5, 1288–1295. [Google Scholar] [CrossRef] [PubMed]
  62. Haugstad, K.E.; Gerken, T.A.; Stokke, B.T.; Dam, T.K.; Brewer, C.F.; Sletmoen, M. Enhanced self-association of mucins possessing the T and Tn carbohydrate cancer antigens at the single-molecule level. Biomacromolecules 2012, 13, 1400–1409. [Google Scholar] [CrossRef] [PubMed]
  63. Hutter, J.L.; Bechhoefer, J. Calbiration of atomic–force micoscope tips. Rev. Sci. Instrum. 1993, 64, 1868–1873. [Google Scholar] [CrossRef]
  64. Te Riet, J.; Katan, A.J.; Rankl, C.; Stahl, S.W.; van Buul, A.M.; Phang, I.Y.; Gomez-Casado, A.; Schon, P.; Gerritsen, J.W.; Cambi, A.; et al. Inter laboratory round robin on cantilever calibration for afm force spectroscopy. Ultramicroscopy 2011, 111, 1659–1669. [Google Scholar]
  65. Bell, G.I. Models for the specific adhesion of cells to cells. Science 1978, 200, 618–627. [Google Scholar] [CrossRef] [PubMed]
  66. Evans, E.; Ritchie, K. Dynamic strength of molecular adhesion bonds. Biophys. J. 1997, 72, 1541–1555. [Google Scholar] [CrossRef] [PubMed]
  67. Evans, E. Probing the relation between force–lifetime–and chemistry in single molecular bonds. Annu. Rev. Biophys. Biomol. Struct. 2001, 30, 105–128. [Google Scholar] [CrossRef] [PubMed]
  68. Dudko, O.K.; Hummer, G.; Szabo, A. Intrinsic rates and activation free energies from single-molecule pulling experiments. Phys. Rev. Lett. 2006, 96. [Google Scholar] [CrossRef]
  69. Dudko, O.K.; Hummer, G.; Szabo, A. Theory, analysis, and interpretation of single-molecule force spectroscopy experiments. Proc. Natl. Acad. Sci. USA 2008, 105, 15755–15760. [Google Scholar] [CrossRef] [PubMed]
  70. Grandbois, M.; Beyer, M.; Rief, M.; Clausen-Schaumann, H.; Gaub, H.E. How strong is a covalent bond? Science 1999, 283, 1727–1730. [Google Scholar] [CrossRef] [PubMed]
  71. Hugel, T.; Grosholz, M.; Claussen-Schaumann, H.; Pfau, A.; Gaub, H.; Seitz, M. Elasticity of single polyelectrolyte chains and their desorption from solid supports studied by afm based single molecule force spectroscopy. Macromolecules 2001, 34, 1039–1047. [Google Scholar] [CrossRef]
  72. Friedsam, C.; Gaub, H.E.; Netz, R.R. Probing surfaces with single-polymer atomic force microscope experiments. Biointerphases 2006, 1, MR1–MR21. [Google Scholar] [CrossRef] [PubMed]
  73. Kocun, M.; Grandbois, M.; Cuccia, L.A. Single molecule atomic force microscopy and force spectroscopy of chitosan. Colloid Surf. B Biointerfaces 2011, 82, 470–476. [Google Scholar] [CrossRef]
  74. Spruijt, E.; van den Berg, S.A.; Cohen Stuart, M.A.; van der Gucht, J. Direct measurement of the strength of single ionic bonds between hydrated charges. ACS Nano 2012, 6, 5297–5303. [Google Scholar] [CrossRef] [PubMed]
  75. Rief, M.; Gautel, M.; Oesterhelt, F.; Fernandez, J.M.; Gaub, H.E. Reversible unfolding of individual titin immunoglobulin domains by AFM. Science 1997, 276, 1109–1112. [Google Scholar] [CrossRef] [PubMed]
  76. Noy, A.; Vezenov, D.V.; Kayyem, J.F.; Meade, T.J.; Lieber, C.M. Stretching and breaking duplex DNA by chemical force microscopy. Chem. Biol. 1997, 4, 519–527. [Google Scholar] [CrossRef] [PubMed]
  77. Ritzefeld, M.; Walhorn, V.; Anselmetti, D.; Sewald, N. Analysis of DNA interactions using single-molecule force spectroscopy. Amino Acids 2013, 44, 1457–1475. [Google Scholar] [CrossRef] [PubMed]
  78. Baumann, C.G.; Bloomfield, V.A.; Smith, S.B.; Bustamante, C.; Wang, M.D.; Block, S.M. Stretching of single collapsed DNA molecules. Biophys. J. 2000, 78, 1965–1978. [Google Scholar] [CrossRef] [PubMed]
  79. Williams, P.M. Analytical descriptions of dynamic force spectroscopy: Behaviour of multiple connections. Anal. Chim. Acta 2003, 479, 107–115. [Google Scholar] [CrossRef]
  80. Noy, A. Force spectroscopy 101: How to design, perform, and analyze an afm-based single molecule force spectroscopy experiment. Curr. Opin. Chem. Biol. 2011, 15, 710–718. [Google Scholar] [CrossRef] [PubMed]
  81. Noy, A.; Friddle, R.W. Practical single molecule force spectroscopy: How to determine fundamental thermodynamic parameters of intermolecular bonds with an atomic force microscope. Methods 2013, 60, 142–150. [Google Scholar] [CrossRef] [PubMed]
  82. Schatz, C.; Viton, C.; Delair, T.; Pichot, C.; Domard, A. Typical physicochemical behaviors of chitosan in aqueous solution. Biomacromolecules 2003, 4, 641–648. [Google Scholar] [CrossRef] [PubMed]
  83. Hanes, J.; Demeester, J. Drug and gene delivery to mucosal tissues: The mucus barrier preface. Adv. Drug Deliv. Rev. 2009, 61, 73–74. [Google Scholar] [CrossRef] [PubMed]
  84. Lai, S.K.; Wang, Y.Y.; Hanes, J. Mucus-penetrating nanoparticles for drug and gene delivery to mucosal tissues. Adv. Drug Deliv. Rev. 2009, 61, 158–171. [Google Scholar] [CrossRef] [PubMed]
  85. Taylor, C.; Allen, A.; Dettmar, P.W.; Pearson, J.P. The gel matrix of gastric mucus is maintained by a complex interplay of transient and nontransient associations. Biomacromolecules 2003, 4, 922–927. [Google Scholar] [CrossRef] [PubMed]
  86. Laffleur, F.; Bernkop-Schnurch, A. Strategies for improving mucosal drug delivery. Nanomedicine 2013, 8, 2061–2075. [Google Scholar] [CrossRef] [PubMed]
  87. Crater, J.S.; Carrier, R.L. Barrier properties of gastrointestinal mucus to nanoparticle transport. Macromol. Biosci. 2010, 10, 1473–1483. [Google Scholar] [CrossRef] [PubMed]
  88. Lieleg, O.; Vladescu, I.; Ribbeck, K. Characterization of particle translocation through mucin hydrogels. Biophys. J. 2010, 98, 1782–1789. [Google Scholar] [CrossRef] [PubMed]
  89. Sigurdsson, H.H.; Kirch, J.; Lehr, C.M. Mucus as a barrier to lipophilic drugs. Int. J. Pharm. 2013, 453, 56–64. [Google Scholar] [CrossRef] [PubMed]
  90. Ensign, L.M.; Schneider, C.; Suk, J.S.; Cone, R.; Hanes, J. Mucus penetrating nanoparticles: Biophysical tool and method of drug and gene delivery. Adv. Mater. 2012, 24, 3887–3894. [Google Scholar] [CrossRef] [PubMed]
  91. Lai, S.K.; Suk, J.S.; Pace, A.; Wang, Y.Y.; Yang, M.; Mert, O.; Chen, J.; Kim, J.; Hanes, J. Drug carrier nanoparticles that penetrate human chronic rhinosinusitis mucus. Biomaterials 2011, 32, 6285–6290. [Google Scholar] [CrossRef] [PubMed]
  92. Mert, O.; Lai, S.K.; Ensign, L.; Yang, M.; Wang, Y.Y.; Wood, J.; Hanes, J. A poly(ethylene glycol)-based surfactant for formulation of drug-loaded mucus penetrating particles. J. Controll. Release 2012, 157, 455–460. [Google Scholar] [CrossRef]
  93. Yang, M.; Lai, S.K.; Wang, Y.Y.; Zhong, W.X.; Happe, C.; Zhang, M.; Fu, J.; Hanes, J. Biodegradable nanoparticles composed entirely of safe materials that rapidly penetrate human mucus. Angew. Chem. Int. Ed. 2011, 50, 2597–2600. [Google Scholar] [CrossRef]
  94. Jabbari, E.; Peppas, N.A. Polymer-polymer interdiffusion and adhesion. J. Macromol. Sci. C Polym. Rev. 1994, 34, 205–241. [Google Scholar] [CrossRef]
  95. Shah, A.J.; Donovan, M.D. Rheological characterization of neutral and anionic polysaccharides with reduced mucociliary transport rates. AAPS PharmSciTech 2007, 8, E40–E47. [Google Scholar] [CrossRef]

