
Preparation of Thermochromic Microcapsules of Bisphenol A and Crystal Violet Lactone and Their Effect on Coating Properties

1
Co-Innovation Center of Efficient Processing and Utilization of Forest Resources, Nanjing Forestry University, Nanjing 210037, China
2
College of Furnishings and Industrial Design, Nanjing Forestry University, Nanjing 210037, China
*
Author to whom correspondence should be addressed.
Polymers 2022, 14(7), 1393; https://doi.org/10.3390/polym14071393
Submission received: 1 March 2022
/
Revised: 21 March 2022
/
Accepted: 23 March 2022
/
Published: 29 March 2022
(This article belongs to the Collection Polymeric Coatings)
Abstract
:Thermochromic microcapsules were prepared with a thermochromic compound as core material and urea formaldehyde as wall material. The molar ratio of urea and formaldehyde, the mass ratio of core material to wall material, the concentration of emulsifier, and rotating speed were selected to make a four-level and three-factor L9(34) orthogonal test. It was found that the molar ratio of urea and formaldehyde had the greatest influence on the coating rate of microcapsules. The effects of molar ratio of urea and formaldehyde on the discoloration temperature and coating rate of microcapsules were studied. When the molar ratio of urea to formaldehyde was 1:1.6, the core material: wall material ratio was 4:7, the concentration of emulsifier was 5.0%, and the rotating speed was 1600 rpm, the performance of the microcapsules was the best. When the microcapsule content was 20.0%, the color difference of the paint film was the largest, the gloss and hardness of the paint film decreased with increasing microcapsule content, and the impact resistance of the paint film first increased and then decreased with increasing microcapsule content. The adhesion of the paint film remained unchanged, and was grade 1. When the microcapsule content was 20.0%, the performance of the paint film was at its best. This provides a basis for the application of thermochromic coatings.
1. Introduction
As a renewable and recyclable green material, wood plays an important role in people’s production activities [1,2,3,4]. The easy-to-process nature has led wood to be widely used in structures, doors and windows, furniture, decorations, and so on [5,6,7,8]. Lignocellulose and hemicellulose are easily degraded into glucose, water and carbon dioxide, making the wood susceptible to decay, moths, and mildew [9,10,11]. Coatings can effectively solve these problems and protect the wood [12].
A microcapsule is a kind of microparticle with a shell–core structure composed of core material and wall material [13]. A thermochromic microcapsule is a microcapsule coated with a thermochromic compound as the core material. When the temperature reaches the thermochromic temperature, the microcapsule changes color [14,15]. Pedaballi et al. [16] measured the sedimentation, rheological behavior, and dispersion properties of thermochromic microcapsules in toluene and coating resin. It was found that paint films containing dispersed microcapsules showed better surface flatness and small pores in the microstructure. The paint film with thermochromic microcapsules responded to temperature changes. Ma et al. [17] prepared temperature-reversible thermochromic cement by adding reversible thermochromic microcapsules into white Portland cement. It was found that when blue, green, or red reversible thermochromic microcapsules with a discoloration temperature of 30 °C were added, these reversible thermochromic microcapsules could reversibly change from colored to white, and the conversion temperatures were about 42 °C and 58 °C. Du et al. [18] compared the effects of thermochromic microcapsules on Rtheological and aging behaviors of base and styrene–butadiene–styrene copolymer (SBS)-modified asphalt binders. Thermochromic microcapsules improved fatigue resistances in both base and SBS-modified asphalt binders. Thermochromic microcapsules had little effect on the rutting and cracking properties of SBS-modified asphalt binder. Ma et al. [19] combined thermochromic materials with optimized disperse cationic dyes and designed a new type of thermochromic microcapsule to expand the color range of thermochromic materials. Yang et al. [20] prepared cholesteric liquid crystals (CLC) microcapsules containing cellulose nanocrystals (CNC) and melamine–formaldehyde (MF) resin hybrid shell by means of in situ polymerization with CNC-stabilized Pickering emulsion as template. A thermochromic coating was prepared by mixing CLC microcapsules with a curable adhesive. It was found that the thermochromic paint film could adjust the color within a temperature range of 12 to 42 °C and throughout the wavelength range of visible light. In addition, the obtained thermochromic paint film showed a relatively high reflectivity of up to 30–40%.
There are various preparation methods for obtaining thermochromic microcapsules, such as in situ polymerization, interfacial polymerization, complex coacervation, etc. Because of its simple preparation process, small number of operation procedures, and the fact that the raw materials of the microcapsules are simple and easily available, in situ polymerization has become a common method for preparing microcapsules. In situ polymerization refers to a method in which the monomer (wall material) and the catalyst are located inside the core material or in the microencapsulated medium. The formation conditions require that the monomer is soluble and the polymer is insoluble. In this way, the generated polymer can be deposited on the surface of the capsule core to form microcapsules.
In this paper, the microcapsules were prepared by means of in situ polymerization. The thermochromic compound was coated as the core material of the microcapsules, and the thermochromic microcapsules were applied to coatings. The wall material of the microcapsules consisted of urea-formaldehyde resin, and was hard, tough, highly transparent, and exhibited chemical resistance. The core material was a thermochromic compound of bisphenol A, tetradecanol, and crystal violet lactone with high sensitivity and low color changing temperature, and the optimal process for the preparation of microcapsules was explored. The thermochromic microcapsules were applied to the paint film in order to verify the discoloration effect of the thermochromic paint film, thus broadening the application range of the coatings and increasing their aesthetic value.
2. Materials and Methods
2.1. Experimental Materials
The experimental drugs used in this paper are shown in Table 1.
2.2. Experimental Method
The molar ratio of urea to formaldehyde, the mass ratio of core material to wall material, emulsifier concentration and rotating speed were selected on the basis of the literature and previous experiments to make a four-level and three-factor L9(34) orthogonal test table, as shown in Table 2 and Table 3.
2.2.1. Preparation of Thermochromic Microcapsules
Preparation of core material (thermochromic compound): Tetradecanol was heated to a molten state, a certain mass was accurately weighed and put into a beaker, and then bisphenol A and crystal violet lactone of corresponding mass were added. The ratio of leuco: chromogenic agent: solvent was 1:3:60. The agitator was put into the water bath and heated to 50 °C for stirring. After stirring evenly, the water bath was slowly heated to 90 °C and stirred at 400 rpm for 1.5 h. It was found that the solution became clear and transparent. After cooling to room temperature, the resulting core material with discoloration temperature of 25 °C had been produced.
The emulsifier (gum acacia), distilled water and thermochromic compound of corresponding quality in the beaker were added, and the water bath pot was heated to 50 °C and stirred slowly until the compound was completely dissolved. Then the temperature was raised to 65 °C and stirred at the corresponding speed for 20 min. The stirred solution was put into the ultrasonic emulsifying machine for 5 min, so that the emulsifier was evenly wrapped on the outer surface of the core material.
Preparation of wall material (urea formaldehyde resin): According to Table 4, urea and formaldehyde of corresponding quality were weighed and stirred in a water bath at room temperature until they were completely dissolved. The triethanolamine solution was absorbed and slowly added to the urea formaldehyde solution; the pH value of the solution was adjusted to about 8.5, and then the beaker was sealed, the water bath was heated to 70 °C, and it was stirred at a speed of 300 rpm for 1 h.
Preparation of microcapsules: The core material emulsion obtained after ultrasonication was put into a 35 °C water bath pan, stirring slowly. The separating funnel was used to dissolve the wall material and added it into the core material solution drop by drop. Then, the rotating speed of the water bath was adjusted to 500 rpm, the mass ratio of silica to sodium chloride was 8%, citric acid aqueous solution was added, the pH value of the solution was reduced to about 2.5, and the reaction took 1 h. After the reaction was completed, the temperature was increased to 68 °C, the rotating speed was reduced to 250 rpm, and the reaction was continued for 30 min to obtain the microcapsule solution. It was filtered by vacuum pump, and the blue powder obtained after drying in an oven at 35 °C comprised the color-changing microcapsules.
2.2.2. Single-Factor Experiment
Table 5 presents the list of materials for the single-factor experiment. The molar ratio of urea to formaldehyde was set as 1:2, 1:4, 1:5, 1:6 and 1:8. According to the orthogonal test results, other factors were determined as follows: core material: wall material ratio was 4:7, emulsifier concentration was 5.0%, and rotational speed was 1600 rpm.
2.2.3. Preparation of Thermochromic Paint Film
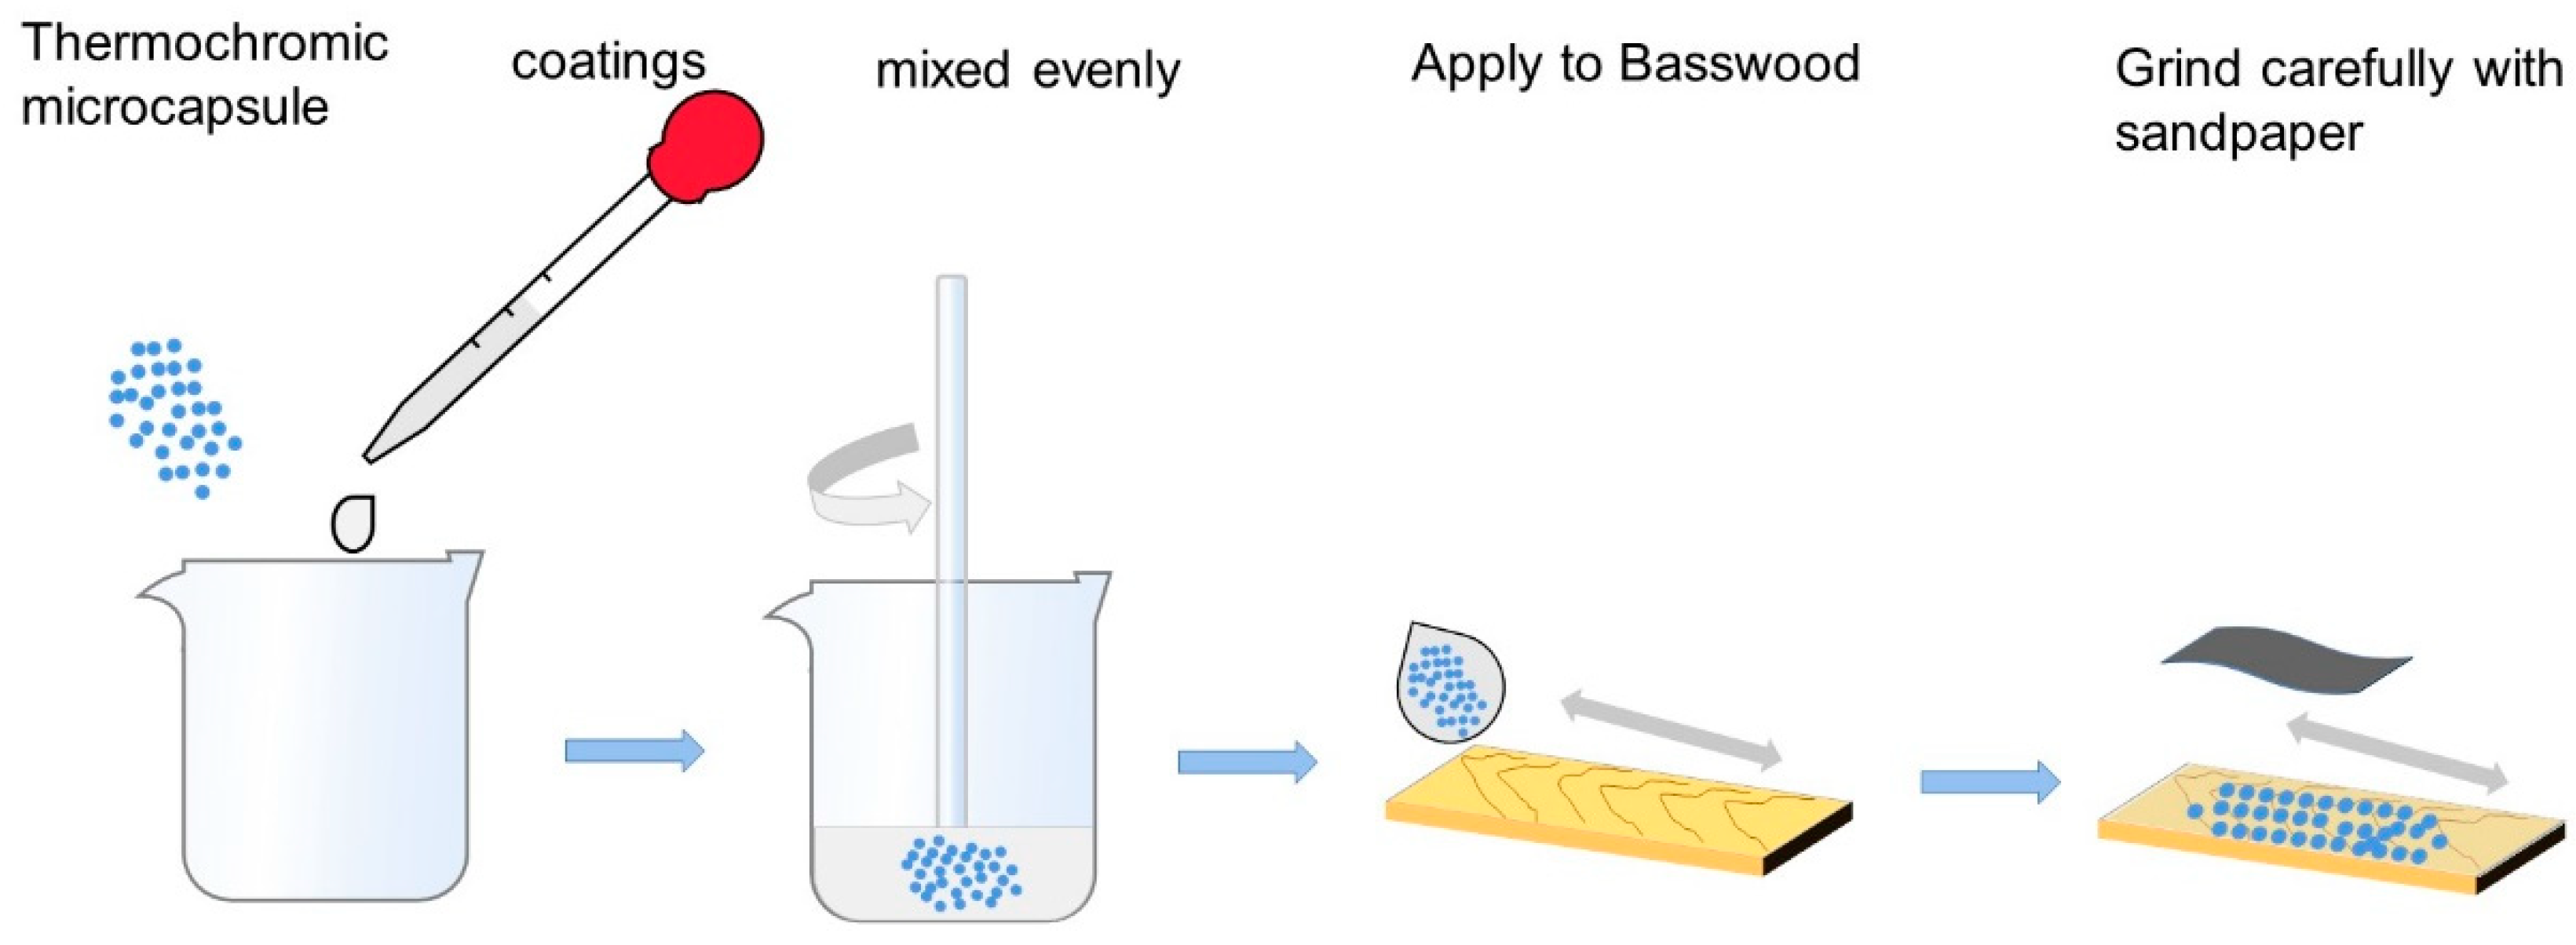
Figure 1 shows the coating process employed to prepare the paint film. Table 6 presents a list of the experimental ingredients of paint film. Firstly, the microcapsules and coatings of corresponding quality were weighed and stirred evenly. Then, the microcapsules and coatings were evenly coated on the surface of Basswood with a paint film preparer, dried at room temperature for 1 h, finely polished with 1000 mesh sandpaper [21], and the floating powder was wiped off to make the surface of paint film smooth and flat. The paint film thickness was about 60 µm [22,23].
2.3. Testing and Characterization
Table 7 present the test instruments used in this experiment.
2.3.1. Testing and Characterization of Microcapsules
Microcapsule morphology analysis: The microcapsules were placed on a clean slide and covered with a cover slide; the slide containing the microcapsule was placed on the table and fixed, the testing software was opened, the light source and magnification were adjusted, and the slide was observed with the biological microscope. The microcapsules were evenly pasted on double-sided adhesive tape, and then sample preparation was carried out by means of a gold spraying technique. After vacuumizing, it was observed using a scanning electron microscope.
Microcapsule coating rate test: A certain weight of microcapsules was weighed and recorded as m1. A certain amount of anhydrous ethanol was added. After mixing evenly, it was sealed with membrane and put into an oven at about 40 °C. It was fully stirred with a glass rod every 15 min. After mixing, it was put into the oven again. After 2 h, the remaining substances were pumped and filtered, dried, and weighed, and the result was recorded as m2. The coating rate (P) of the microcapsules was calculated according to the following formula [24]:
P = (m1 − m2)/m1 × 100%
Discoloration temperature of thermochromic microcapsules: Microcapsules of equivalent quality were taken out and placed in the oven. The oven temperature was set to 40 °C, and was increased by 2 °C at each time step. After reaching the specified temperature, it was kept at that temperature for 10 min to fully heat the microcapsules. During the heating process of the oven, the color change of the microcapsules was observed, and the color change temperature of the microcapsules was recorded.
Solvent resistance: Three groups of 0.02 g microcapsules and thermochromic compound were weighed and placed in six test tubes. Then, 2.0 g acetone, 2.0 g ethyl acetate, and 2.0 g xylene solution were added to each test tube, sealed with a rubber band and fresh-keeping film, and placed on the test tube rack. After 24 h, the color change and dissolution of microcapsules and thermochromic compounds was observed.
Acid and alkali resistance: Three groups of 0.02 g microcapsules and thermochromic compound were weighed and placed in six test tubes. Then, 2.0 g of 0.1 mol/L acetic acid solution, 2.0 g of 0.1 mol/L hydrochloric acid solution, and 2.0 g of 0.1 mol/L triethanolamine solution were added to each test tube. They were sealed with rubber band and fresh-keeping film and placed on the test tube rack. After 24 h, the color change and dissolution of microcapsules and thermochromic compounds were observed.
The thermal stability of the microcapsules was measured by thermogravimetric analyzer, and the temperature range was 35 °C–500 °C.
2.3.2. Testing and Characterization of Paint Film
The color difference of the paint film was tested with a portable colorimeter. The portable color difference meter was turned on and calibrated. After that, the test sample was tested, and the values of L, a and b were recorded. The L, a, and b values represent the color space coordinates of the color at that location, where the L value represents the lightness value. The value of a represents the red–green value. When the value of a is positive, the color is reddish; when the value of a is negative, the color is greenish. b represents the yellow–blue value. When the value of b is positive, the color is yellowish; when the value of b is negative, the color is blueish. The color difference (ΔE) between two points was calculated according to the following formula [25]:
Figure 2 presents a diagram of the temperature test for the paint film. The heating plate was used to test the discoloration temperature of the paint film. While heating the sample with the heating plate, the temperature change on the film surface was measured with a thermometer. The temperature range was set to 50 °C–80 °C, and the chromaticity value was tested once every 5 °C. After heating to the target temperature, this temperature was maintained for 10 min to fully heat the paint film, so that the heat entered the microcapsule inside the paint film, and the chromaticity value of the paint film was measured after 10 min. The color difference was calculated to explore the discoloration temperature of the paint film.
The gloss of the paint film was tested according to GB/T 4893.6-2013 [26]. The film gloss was recorded at 20°, 60° and 85°. The hardness of the paint film was tested according to GB/T 6739–2006 [27]. The pencil was inserted into the pencil hardness tester and rolled forward. If the paint film was not damaged, the maximum hardness of the pencil was taken as the hardness of the paint film. The adhesive force of the paint film was measured according to GB/T 4893.4–2013 [28]. The paint film scriber was used to cut the paint film, and then adhesive tape was attached to the paint film and torn off, and the adhesive force of the paint film was judged according to the peeling area of the paint film. The impact resistance of the paint film was determined according to GB/T 1732-1993 [29]. A QCJ−50 coating impact tester was used to test the impact resistance of the paint film. The maximum height of the paint film without cracking was taken as the impact strength.
3. Results and Discussion
3.1. Morphological Analysis of Microcapsules for the Orthogonal Test
Figure 3 shows the optical microscope image of the microcapsule in the orthogonal test. As can be seen from Figure 3, the lower the core–wall ratio of the microcapsules, the rounder the shape and the more uniform the dispersion of the microcapsules. When increasing the core–wall ratio of microcapsules, the agglomeration phenomenon of the microcapsules became more and more serious, and the particle size of the microcapsules became more and more uneven. When increasing the molar ratio of urea to formaldehyde, the number of transparent crystals in the image gradually increased, and these transparent crystals were uncoated core materials. The higher the molar ratio of urea and formaldehyde, the more dihydroxymethylurea is generated. The higher the degree of crosslinking, the denser the wall material of the microcapsules. However, excessive participation of formaldehyde in the reaction produces a large number of hydrophilic hydroxymethyl groups during the polycondensation process, resulting in incomplete polycondensation and failure to completely cover the core material during curing, thus reducing the coating rate of the microcapsules.
Figure 4 shows the scanning electron microscope (SEM) and transmission electron microscope (TEM) images of orthogonal experimental sample 2. From the SEM images, it can be seen that the microcapsules of sample 2 were round in shape and possessed a relatively uniform particle size distribution. From the TEM images, it can be seen that the outer layer of microcapsules was light in color, and the inner layer was dark in color, and the light layer was the wall polymer outside the microcapsules [33]. From the SEM and TEM images, it can be seen that the microcapsules were shell–core structures.
Figure 5 presents the infrared spectrum of the wall material in comparison with that of sample 2. It can be seen from the FTIR of the wall material that the stretching vibration peaks of N-H bond and O-H bond were superimposed at 3353 cm−1, the asymmetric stretching vibration of -CH2- was at 2957 cm−1, and the carbonyl stretching vibration peak of secondary acyl was at 1637 cm−1. The peak at 1549 cm−1 was caused by the bending vibration of the N-H bond of -(C=O)-NH- and the stretching vibration of the C-N bond. The characteristic absorption peak of CH3O was at 1131 cm−1 [34]. These peaks indicated the successful preparation of urea formaldehyde resin.
In the infrared spectrum of microcapsules, the characteristic peak of the core material also appeared, the ester carbonyl C=O absorption peak of the non-lactone ring structure appeared at 1615 cm−1, and the peak of 1368 cm−1 corresponded to the symmetrical stretching absorption peak of carboxylate, which proved that the lactone ring in the molecule was open and formed a conjugated chromogenic structure. The peaks at 2955 cm−1 and 2917 cm−1 belonged to the asymmetric stretching vibration and symmetric stretching vibration of C-H in tetradecanol and methyl in crystal violet lactone [35]. These characteristic peaks indicated the successful preparation of thermochromic microcapsules.
3.2. Orthogonal Experimental Analysis
Table 8 presents the visual analysis table for the orthogonal test. It can be seen from Table 8 that the coating rate of sample 5 was the highest, at 54.0 ± 1.35%. When the molar ratio of urea to formaldehyde was 1:1.5, the core material-to-wall material ratio was 4:7, the concentration of emulsifier was 5.0%, and the rotating speed was 1600 rpm, the coating rate of the microcapsules reached its highest value. On the basis of the analysis of variance table (Table 9), it can be seen that the molar ratio of urea and formaldehyde had the greatest impact on the coating rate of microcapsules, followed by emulsifier concentration, speed, and finally the ratio core material: wall material. Therefore, the single-factor optimization experiment was designed with the molar ratio of urea to formaldehyde as the variable.
It can be seen from Table 10 that the reagent resistance and acid–base resistance of the thermochromic compound were poor. After 24 h, the thermochromic compound dissolved, and the original blue compound became colorless. Compared with the thermochromic compound, the solvent resistance and acid–base resistance of the microcapsule were greatly improved. After 24 h, the color of the microcapsule was still blue, and without dissolution; this showed that the microcapsule technology had a protective effect on the thermochromic compound, and urea formaldehyde resin is able to significantly improve the solvent resistance and acid–base resistance of the thermochromic compound.
3.3. Morphological Analysis of Microcapsules for the Single Factor Test
Figure 6 showed the SEM of microcapsules with different molar ratios. It can be seen from the figure that the particle size of the microcapsules gradually became uniform and decreased with increasing molar ratio. The microcapsules with molar ratios of 1:1.5 and 1:1.6 showed a uniform circular appearance without serious agglomeration. The particle size was uniform, and the diameter was about 5 μm. The greater the amount of formaldehyde involved in the reaction, the more dimethylol urea was produced, the higher the crosslinking degree of the microcapsules, and the tighter the surface of the microcapsules.
Table 11 presents the yield of the single-factor microcapsules. It can be seen from the table that the output of microcapsules with different molar ratio first increases and then decreases with increasing molar ratio. When the molar ratio was 1:1.4, the output reached its highest value, which was 15.91 ± 0.39 g, and when the molar ratio was 1:1.8, the output was at its lowest, which was 12.63 ± 0.31 g.
Table 12 shows the coating rate of single-factor microcapsules. It can be seen that with increasing molar ratio, the coating rate of the microcapsules gradually decreased. When the molar ratio was 1:1.2, the coating rate of microcapsules reached its highest value, which was 70.0 ± 1.75%, and when the molar ratio was 1:1.8, the coating rate of microcapsules reached its lowest value, which was 53.3 ± 1.33%. This is because too much formaldehyde would result in the inclusion of a large number of unreacted hydroxymethyl hydrophilic groups in the polycondensation product, causing the polycondensation to be incomplete, resulting in a low microcapsule encapsulation rate.
Table 13 shows the thermochromic temperature of microcapsules with different core–wall ratio. It can be seen from this that with increasing molar ratio, the discoloration temperature of microcapsules tended to first rise, then decrease, and then rise again. When the molar ratio of urea to formaldehyde was 1:1.6, the thermochromic temperature reached its lowest value, at 65.00 ± 1.62 °C, while the highest value of 95.00 ± 2.37 °C was obtained when the molar ratio was 1:1.8.
Figure 7 presents the TGA of the microcapsules. From the TGA of the microcapsules, it can be seen that the microcapsules had two thermal weight loss stages. When the temperature was about 150 °C, the microcapsules underwent a first thermal decomposition, with a thermal weight loss rate of 29.6%. This is because the wall material of the microcapsule was not sufficiently covered, causing some core materials to dissolve. When the temperature was about 270 °C, the microcapsules underwent a second thermal decomposition, with a thermal weight loss rate of 33.6%, due to the decomposition of the core material and part of the wall material of the microcapsules.
Figure 8 presents the schematic diagram before and after the discoloration of microcapsules with a molar ratio of urea and formaldehyde of 1:1.6. Figure 9 shows the discoloration mechanism of the thermochromic microcapsules. The crystal violet lactone was initially a closed-loop structure, and provided electronic compounds in the discoloration system, while bisphenol A was used as an electron absorbing compound. When the temperature was low, the -OH of bisphenol A reacted with the central carbon atom of crystal violet lactone; the crystal violet lactone ring broke, formed a conjugated double bond structure, and the discolored complex appeared blue. At high temperature, due to the melting of the solvent, the conjugated double bond broke, and the crystalline violet lactone reconstituted its lactone ring structure, resulting in a colorless microcapsule.
3.4. Effect of Microcapsule Content on the Color Difference of Paint Film
The chromaticity values of the paint films with different microcapsule contents at different temperatures are shown in Table 14, and the change in the color difference with temperature is shown in Figure 10. It can be seen from the figure that the color difference of the paint film without microcapsules fluctuated little with the change in temperature. The color difference of the paint film with microcapsules increased gradually with increasing temperature. At about 80 °C, the color difference of the paint film was the greatest. With increasing microcapsule content, the color difference of the paint film showed an upward trend. When the microcapsule content was 0~10%, the color change of paint film surface was not obvious, and the color difference was small. The overall color difference was less than 8.0. When the microcapsule content was 20%, the color difference change of the paint film was at its most obvious. When the microcapsule content in the paint film was low, the microcapsules were not able to fully cover the surface of the substrate, and the color of the wood at room temperature changed little. Therefore, the color difference of the paint film changed little with increasing temperature. When the microcapsule content in the paint film was high, although the surface of the substrate became blue at room temperature, the color difference of the paint film did not change significantly with increasing temperature. This is because there were too many microcapsules in the paint film. During the heating process, the temperature decreased layer by layer in the conduction process, and the temperature of the inner microcapsule was much lower than that of the outside. Therefore, too many microcapsules in the paint film is not conducive to the discoloration effect of the paint film. Figure 11 presents a diagram of the substrate before and after heating. It can be seen from the figure that there was no change on the substrate surface after heating from room temperature to 80 °C. Figure 12 presents the color change of paint film at different temperatures. It can be seen from the figure that the color of the paint film gradually became lighter with increasing temperature, and the color of the paint film gradually recovered when the temperature decreased. It can be seen that the paint film with microcapsules has reversible thermochromic properties.
The effects of different microcapsule contents on the gloss of the paint film are shown in Figure 13. With the increase of microcapsule content, the gloss of the paint film decreased gradually. When the thermochromic microcapsule content was 0~10%, the gloss of the paint film decreased sharply. When the microcapsule content was 15%~25%, the gloss of the paint film changed slightly. The smoothness and roughness of the paint film surface affect the gloss of the paint film. Increasing the microcapsule content in the paint film will increase the roughness of the paint film, thus reducing the light reflection ability and gloss of the paint film.
The influence of microcapsule content on the mechanical properties of the paint film is shown in Table 15. With increasing microcapsule content, the hardness of the paint film gradually decreased. When the microcapsule content was 0~10%, the hardness of the paint film was 2H. With the microcapsule content was increased, the hardness of the paint film decreased to HB, and the decline was relatively gentle. The adhesion remained unchanged. The adhesion grade of the paint film with a content of 0~25% was grade 1. This is because the particle size of the microcapsules was small, meaning that the dispersion of the microcapsules in the paint film was better, and thus the adhesion of the paint film remained unchanged. The impact resistance first increased and then decreased. When the microcapsule content in the paint film was 20%, the impact resistance of the paint film was the best, which was 17.00 ± 0.42 kg∙cm. This is because the microcapsules were small particles with a shell–core structure [36,37]. The shell material of the microcapsules is able to protect the core material to a certain extent. When microcapsules were added to the paint film and coated on the surface of substrate, the microcapsule particles form a protective layer, which improves the impact resistance of the paint film.
Figure 14 shows the infrared spectra of the paint film with thermochromic microcapsules and the paint film without microcapsules. For the paint film without microcapsules, the peak at 3445 cm−1 was the stretching vibration peak of the hydroxyl group, the characteristic peak of the C=O bond in ester at 1730 cm−1, and the characteristic peak of C-H in methyl and methylene at 2929 cm−1 and 2849 cm−1 [38]. These are the characteristic peaks of alkyd resin paint film. These characteristic peaks could also be seen in the paint film with microcapsules. In addition, there were characteristic peaks of thermochromic microcapsules. The peak at 3353 cm−1 was the stretching vibration peak of the N-H bond and the O-H bond, the peak at 2957 cm−1 was the asymmetric stretching vibration peak of CH2, the peak at 1637 cm−1 was the carbonyl stretching vibration peak of the secondary acyl, and the peak at 1131 cm−1 was the characteristic absorption peak of CH3O. These peaks indicated the successful preparation of urea formaldehyde resin. The absorption peak of ester carbonyl C=O with a non-lactone ring structure appeared at 1615 cm−1, and the peak at 1380 cm−1 corresponded to the symmetrical stretching absorption peak of carboxylate. There was no disappearance or addition of characteristic peaks, indicating that there was no chemical reaction between microcapsules and paint film.
Table 16 presents the chromaticity values of paint film with 20% thermochromic microcapsules and that without microcapsules before and after aging [39]. The paint film with microcapsules was blue before aging, and after aging, the paint film became white, with a color difference of 22.23 ± 0.55. After aging for 144 h, the paint film lost its discoloration properties. This is because the conjugated double bond structure in the core of the thermochromic microcapsule broke under the continuous irradiation of ultraviolet light, and therefore, the color of the paint film was white at room temperature. In addition, the lactone ring structure of crystalline violet lactone was also decomposed and damaged, so the paint film no longer had the discoloration capability. In the process of UV aging, the paint film on the wood surface showed obvious yellowing without microencapsulation, with a color difference of 7.26 ± 0.18. This is because the film-forming material of alkyd resin paint was sensitive to ultraviolet light, being prone to degradation and crosslinking reaction under ultraviolet radiation, resulting in irreversible yellowing of the paint film [40].
4. Conclusions
In this paper, thermochromic microcapsules were prepared by in situ polymerization, and the effect of the thermochromic microcapsule content of the coatings on the properties of the paint film was investigated. The orthogonal experiment found that the best preparation process was as follows: core material: wall material 4:7, emulsifier concentration 5%, and rotating speed 1600 rpm. The molar ratio of urea and formaldehyde had the greatest influence on the coating rate of microcapsules. The single-factor optimization experiment was carried out with the molar ratio of urea and formaldehyde as the variable. When the molar ratio of urea and formaldehyde was 1:1.6, the microcapsule performance was the best. At that point, the discoloration temperature of microcapsules was 65 °C, the yield was 14.58 ± 0.36 g, and the coating rate was 56.60 ± 1.41%. When microcapsules were added to the coatings, it was found that when the microcapsule content was 20%, the performance of the paint film was the best. At that point, the discoloration temperature was 80 °C, the color difference is the largest, the gloss of the paint film was 1.0, the hardness was HB, the adhesion was grade 1, and the impact resistance was 17.00 ± 0.42 kg∙cm. These results lay a foundation for the application of thermochromic coatings on furniture.
Author Contributions
Conceptualization, W.Z.; methodology, W.Z.; validation, W.Z.; resources, W.Z.; data curation, X.Y.; writing—original draft preparation, W.Z.; supervision, X.Y.; data analysis, W.Z.; investigation, W.Z.; writing—review and editing, X.Y. All authors have read and agreed to the published version of the manuscript.
Funding
This research was partly supported by the Natural Science Foundation of Jiangsu Province (BK20201386).
Institutional Review Board Statement
Not applicable.
Informed Consent Statement
Not applicable.
Data Availability Statement
Not applicable.
Conflicts of Interest
The authors declare no conflict of interest.
References
- Meints, T.; Teischinger, A.; Stingl, R.; Hansmann, C. Wood colour of central European wood species: CIELAB characterisation and colour intensification. Eur. J. Wood Wood Prod. 2017, 75, 499–509. [Google Scholar] [CrossRef]
- Liu, Q.; Gao, D.; Xu, W. Influence of the Bottom Color Modification and Material Color Modification Process on the Performance of Modified Poplar. Coatings 2021, 11, 660. [Google Scholar] [CrossRef]
- Zhang, Y.; Gao, Y.; Zhao, M.; Feng, X.; Wang, L.; Yang, H.; Ma, H.; Zhou, J. Effects of torrefaction on the lignin of apricot shells and Its catalytic conversion to aromatics. ACS Omega 2021, 6, 25742–25748. [Google Scholar] [CrossRef]
- Li, R.; He, C.; Wang, X. Effects of processing parameters on mass loss and coating properties of poplar plywood during CO2 laser modification. Eur. J. Wood Wood Prod. 2022, 1–8. [Google Scholar] [CrossRef]
- Ozgenc, O.; Durmaz, S.; Sahin, S.; Boyaci, I.H. Evaluation of the weathering resistance of waterborne acrylic- and alkyd-based films containing HALS, UV absorber, and bark extracts on wood surfaces. J. Coat. Technol. Res. 2020, 17, 461–475. [Google Scholar] [CrossRef]
- Wu, S.-S.; Tao, X.; Xu, W. Thermal Conductivity of Poplar Wood Veneer Impregnated with Graphene/Polyvinyl Alcohol. Forests 2021, 12, 777. [Google Scholar] [CrossRef]
- Li, R.; He, C.; Chen, Y.; Wang, X. Effects of laser parameters on the width of color change area of poplar wood surface during a single irradiation. Eur. J. Wood Wood Prod. 2021, 79, 1–8. [Google Scholar] [CrossRef]
- Liu, Q.; Gu, Y.; Xu, W.; Lu, T.; Li, W.; Fan, H. Compressive Properties of Green Velvet Material Used in Mattress Bedding. Appl. Sci. 2021, 11, 11159. [Google Scholar] [CrossRef]
- Xu, W.; Chen, P.; Yang, Y.; Wang, X.; Liu, X. Effects of freezing and steam treatments on the permeability of Populus tomentosa. Mater. Werkst. 2021, 52, 907–915. [Google Scholar] [CrossRef]
- Yang, Y.; Xu, W.; Liu, X.; Wang, X. Study on permeability of cunninghamia lanceolata based on steam treatment and freeze treatment. Wood Res. 2021, 66, 721–731. [Google Scholar] [CrossRef]
- Li, R.; Fang, L.; Xu, W.; Xiong, X.; Wang, X.A. Effect of laser irradiation on the surface wettability of poplar wood. Sci. Adv. Mater. 2019, 11, 655–660. [Google Scholar] [CrossRef]
- Hazir, E.; Koc, K.H. Evaluation of wood-based coating performance for ultraviolet roller and conventional air-atomization processes. Maderas. Cienc. Tecnol. 2020, 23, 12. [Google Scholar] [CrossRef]
- Qiao, J.C.; Ha, X.L.; Guan, P.; Zhao, Y.; Tian, W. Preparation and development of pharmaceutical microcapsules. Prog. Chem. 2008, 20, 171–181. [Google Scholar]
- Zhu, X.; Liu, Y.; Li, Z.; Wang, W. Thermochromic microcapsules with highly transparent shells obtained through in-situ polymerization of urea formaldehyde around thermochromic cores for smart wood coatings. Sci. Rep. 2018, 8, 1–10. [Google Scholar] [CrossRef] [PubMed] [Green Version]
- Wang, L.; Yan, X.X. Mechanical and optical properties of thermochromic reversible waterborne primer film on Tilia euro-paeawith 1,2-Benzo−6-diethylaminofluorane based microcapsules. Polymers 2020, 12, 2062. [Google Scholar] [CrossRef]
- Pedaballi, S.; Li, C.-C.; Song, Y.-J. Dispersion of microcapsules for the improved thermochromic performance of smart coatings. RSC Adv. 2019, 9, 24175–24183. [Google Scholar] [CrossRef] [Green Version]
- Ma, Y.; Zhu, B. Research on the preparation of reversibly thermochromic cement based materials at normal temperature. Cem. Concr. Res. 2009, 39, 90–94. [Google Scholar] [CrossRef]
- Du, P.; Chen, Z.; Zhang, H. Rheological and aging behaviors of base and SBS modified asphalt with thermochromic microcapsule. Constr. Build. Mater. 2019, 200, 1–9. [Google Scholar] [CrossRef]
- Ma, X.G.; Zhao, S.; Wang, L.; Zhou, H.J. Research on the behaviors of extending thermochromic colors for a new thermochromic microcapsule. J. Text. I 2019, 111, 1097–1105. [Google Scholar] [CrossRef]
- Yang, T.; Yuan, D.; Liu, W.; Zhang, Z.; Wang, K.; You, Y.; Ye, H.; de Haan, L.T.; Zhou, G. Thermochromic cholesteric liquid crystal microcapsules with cellulose nanocrystals and a melamine resin hybrid shell. ACS Appl. Mater. Interfaces 2022, 14, 4588–4597. [Google Scholar] [CrossRef]
- Liu, Q.; Gao, D.; Xu, W. Effect of Sanding Processes on the Surface Properties of Modified Poplar Coated by Primer Compared with Mahogany. Coatings 2020, 10, 856. [Google Scholar] [CrossRef]
- Liu, Q.; Gao, D.; Xu, W. Effect of Paint Process on the Performance of Modified Poplar Wood Antique. Coatings 2021, 11, 1174. [Google Scholar] [CrossRef]
- Xu, W.; Fang, X.; Han, J.; Wu, Z.; Zhang, J. Effect of Coating Thickness on Sound Absorption Property of Four Wood Species Commonly Used for Piano Soundboards. Wood Fiber Sci. 2020, 52, 28–43. [Google Scholar] [CrossRef] [Green Version]
- Chang, Y.; Yan, X. Preparation and self-repairing properties of MF-coated shellac water-based microcapsules. Coatings 2020, 10, 778. [Google Scholar] [CrossRef]
- GB/T 3181-1995; Colour Standard for Paint Film. Standardization Administration of the People’s Republic of China: Beijing, China, 1995.
- GB/T 4893.6-2013; Test of Surface Coatings of Furniture-Part 6: Determination of gloss value. Standardization Administration of the People’s Republic of China: Beijing, China, 2013.
- GB/T 6739-2006; Paints and Varnishes-Determination of Film Hardness by Pencil Test. Standardization Administration of the People’s Republic of China: Beijing, China, 2006.
- GB/T 4893.4-2013; Test of Surface Coatings of Furniture-Part 4: Determination of Adhesion-Cross Cut. Standardization Administration of the People’s Republic of China: Beijing, China, 2013.
- GB/T 1732-1993; Determination of Impact Resistance of Film. Standardization Administration of the People’s Republic of China: Beijing, China, 1993.
- GB/T 1865-2009; Paints and varnishes- Artificial Weathering and Exposure to Artificial Radiation-Exposure to Filtered Xen-on-arc Radiation. Standardization Administration of the People’s Republic of China: Beijing, China, 2009.
- Zhang, Y.; Ma, H.; Chen, D.; Zhou, J. Technical and Benefit Evaluation of Fruit-Wood Waste Gasification Heating Coproduction of an Activated Carbon System. ACS Omega 2021, 6, 633–641. [Google Scholar] [CrossRef]
- Zhang, Y.; Wang, L.; Wu, Y.; Chen, Y.; Ma, H.; Zhou, H.; Zhu, Z.; Liu, S.; Zhou, J. Pyrolysis characteristics, kinetics, and its product characteristics of grape stem. Bioresour. 2019, 14, 7901–7919. [Google Scholar] [CrossRef]
- Alizadeh, M.; Sarabi, A.A. pH-Responsive MFPTT microcapsules containing dimethyl sulfoxide: Preparation, characterization and tuning the release behavior of microcapsule contents. Prog. Org. Coat. 2019, 134, 78–90. [Google Scholar] [CrossRef]
- Nuryawan, A.; Singh, A.P.; Park, B.-D. Swelling behaviour of cured urea–formaldehyde resin adhesives with different formaldehyde to urea mole ratios. J. Adhes. 2014, 91, 677–700. [Google Scholar] [CrossRef]
- Tozum, M.S.; Aksoy, S.A.; Alkan, C. Manufacturing surface active shell and bisphenol A free thermochromic acrylic micro-capsules for textile applications. Int. J Energ. Res. 2020, 45, 7018–7037. [Google Scholar] [CrossRef]
- Park, B.-D.; Kim, J.-W. Dynamic mechanical analysis of urea–formaldehyde resin adhesives with different formaldehyde-to-urea molar ratios. J. Appl. Polym. Sci. 2008, 108, 2045–2051. [Google Scholar] [CrossRef]
- Mirabedini, S.; Kiamanesh, A. The effect of micro and nano-sized particles on mechanical and adhesion properties of a clear polyester powder coating. Prog. Org. Coatings 2013, 76, 1625–1632. [Google Scholar] [CrossRef]
- de Carvalho, R.K.C.; Ortega, F.D.S.; Morandim-Giannetti, A.D.A. Alkyd resin synthesis by enzymatic alcoholysis. Iran. Polym. J. 2019, 28, 747–757. [Google Scholar] [CrossRef]
- Hu, W.-G.; Wan, H. Comparative study on weathering durability property of phenol formaldehyde resin modified sweetgum and southern pine specimens. Maderas. Cienc. Tecnol. 2022, 24, 1–14. [Google Scholar] [CrossRef]
- Wei, S.Y.; Pintus, V.; Schreiner, M. A comparison study of alkyd resin used in art works by Py-GC/MS and GC/MS: The influence of aging. J. Anal. Appl. Pyol. 2013, 104, 441–447. [Google Scholar] [CrossRef]
Figure 1.
Preparation process of paint film.

Figure 2.
Temperature test diagram of paint film.

Figure 3.
OM of microcapsule in orthogonal test. (A–H) Samples 1–9.

Figure 4.
SEM (A) and (B) TEM of thermochromic microcapsules.

Figure 5.
FTIR spectra of urea formaldehyde resin and thermochromic microcapsules.

Figure 6.
SEM of single-factor experimental microcapsules: molar ratio of urea to formaldehyde (A) 1:1.2, (B) 1:1.4, (C) 1:1.5, (D) 1:1.6, (E) 1:1.8.
Figure 6.
SEM of single-factor experimental microcapsules: molar ratio of urea to formaldehyde (A) 1:1.2, (B) 1:1.4, (C) 1:1.5, (D) 1:1.6, (E) 1:1.8.

Figure 7.
TGA of thermochromic microcapsules with different molar ratios.

Figure 8.
Schematic diagram of microcapsules with molar ratio of 1:1.6 at 65 °C. (A) before discoloration; (B) after discoloration.
Figure 8.
Schematic diagram of microcapsules with molar ratio of 1:1.6 at 65 °C. (A) before discoloration; (B) after discoloration.

Figure 9.
Thermochromic mechanism of microcapsules.

Figure 10.
Variation with temperature of the color difference of the paint film.

Figure 11.
Substrate before and after thermal treatment: (A) before; (B) after.

Figure 12.
Color change of paint film at different temperatures: (A–E) temperature rise; (F–I) temperature drop.
Figure 12.
Color change of paint film at different temperatures: (A–E) temperature rise; (F–I) temperature drop.

Figure 13.
Gloss of paint film with different microcapsule content.

Figure 14.
FTIR of paint film with microcapsules.


Table 1.
List of experimental materials.
| Experimental Materials | Molecular Mass (g/mol) | CAS | Manufacturer |
|---|---|---|---|
| Crystal violet lactone | 415.52 | 1552–42–7 | Wuhan Huaxiang Biotechnology Co., Ltd., Wuhan, China |
| Bisphenol A | 228.28 | 80–05–7 | Wuhan Kanos Technology Co., Ltd., Wuhan, China |
| Tetradecanol | 214.38 | 112–72–1 | Guangzhou Jiangshun Chemical Technology Co., Ltd., Guangzhou, China |
| Urea | 60.06 | 57–13–6 | Guangzhou Suixin Chemical Co., Ltd., Guangzhou, China |
| 37% formaldehyde solution | 30.03 | 50–00–0 | Jinan Huasheng Chemical Co., Ltd., Jinan, China |
| Triethanolamine | 149.19 | 102–71–6 | Shandong Chengkai New Material Co., Ltd., Shandong, China |
| Citric acid monohydrate | 502.51 | 99026–99–0 | Jinan Xiaoshi Chemical Co., Ltd., Jinan, China |
| Gum acacia | - | 9000–01–5 | Nanjing Jinyou Biotechnology Co., Ltd., Nanjing, Liaocheng, China |
| Absolute ethanol | 46.06 | 64–17–5 | Guangzhou Chengyi Nuoyi Instrument Co., Ltd., Guangzhou, China |
| Acetone | 58.08 | 67–64–1 | Guangzhou Jiangshun Chemical Technology Co., Ltd., Guangzhou, China |
| Ethyl acetate | 88.10 | 141–78–6 | Jinan Zhengkang Chemical Co., Ltd., Jinan, China |
| Xylene | 106.16 | 1330–20–7 | Suzhou Tianke Trading Co., Ltd., Suzhou, China |
| Acetic acid | 60.05 | 64–19–7 | Jinan Xiaoshi Chemical Co., Ltd., Jinan., China |
| Hydrochloric acid | 36.46 | 7647–01–0 | Jinan Xiaoshi Chemical Co., Ltd., Jinan., China |
Table 2.
Influencing factors and level of orthogonal experiment.
| Level | Urea: Formaldehyde | Core Material: Wall Material | Emulsifier Concentration (%) | Speed (rpm) |
|---|---|---|---|---|
| 1 | 1:1 | 1:7 | 3 | 1000 |
| 2 | 1:1.5 | 4:7 | 4 | 1300 |
| 3 | 1:2 | 7:7 | 5 | 1600 |
Table 3.
Orthogonal experimental design of thermochromic microcapsules.
| Experiment Number | Urea: Formaldehyde | Core Material: Wall Material | Emulsifier Concentration (%) | Speed (rpm) |
|---|---|---|---|---|
| 1 | 1:1 | 1:7 | 3 | 1000 |
| 2 | 1:1 | 4:7 | 4 | 1300 |
| 3 | 1:1 | 7:7 | 5 | 1600 |
| 4 | 1:1.5 | 1:7 | 4 | 1600 |
| 5 | 1:1.5 | 4:7 | 5 | 1000 |
| 6 | 1:1.5 | 7:7 | 3 | 1300 |
| 7 | 1:2 | 1:7 | 5 | 1300 |
| 8 | 1:2 | 4:7 | 3 | 1600 |
| 9 | 1:2 | 7:7 | 4 | 1000 |
Table 4.
Experimental materials used to prepare the microcapsules.
| Experiment Number | Urea (g) | Formaldehyde (g) | Distilled Water (mL) | Emulsifier (g) | Discoloration Complex (g) | Sodium Chloride (g) | Silica (g) |
|---|---|---|---|---|---|---|---|
| 1 | 3.00 | 4.05 | 90.00 | 0.26 | 0.64 | 0.09 | 0.09 |
| 2 | 3.00 | 4.05 | 90.00 | 1.37 | 2.57 | 0.36 | 0.36 |
| 3 | 3.00 | 4.05 | 90.00 | 3.00 | 4.50 | 0.63 | 0.63 |
| 4 | 3.00 | 6.08 | 105.00 | 0.40 | 0.75 | 0.10 | 0.10 |
| 5 | 3.00 | 6.08 | 105.00 | 2.00 | 3.00 | 0.42 | 0.42 |
| 6 | 3.00 | 6.08 | 105.00 | 2.10 | 5.25 | 0.74 | 0.74 |
| 7 | 3.00 | 8.10 | 120.00 | 0.57 | 0.85 | 0.12 | 0.12 |
| 8 | 3.00 | 8.10 | 120.00 | 2.28 | 3.40 | 0.48 | 0.48 |
| 9 | 3.00 | 8.10 | 120.00 | 3.20 | 6.00 | 0.85 | 0.85 |
Table 5.
List of materials for single-factor experiment.
| Experiment Number | Molar Ratio of Urea to Formaldehyde | Urea (g) | Formaldehyde (g) | Distilled Water (g) | Emulsifier (g) | Discoloration Complex (g) | Sodium Chloride (g) | Silica (g) |
|---|---|---|---|---|---|---|---|---|
| 10 | 1:1.2 | 8 | 12.62 | 256.00 | 4.87 | 7.31 | 1.03 | 1.03 |
| 11 | 1:1.4 | 8 | 14.73 | 272.00 | 5.18 | 7.77 | 1.09 | 1.09 |
| 12 | 1:1.5 | 8 | 15.79 | 280.00 | 5.33 | 8.00 | 1.12 | 1.12 |
| 13 | 1:1.6 | 8 | 16.84 | 288.00 | 5.48 | 8.23 | 1.16 | 1.16 |
| 14 | 1:1.8 | 8 | 18.95 | 304.00 | 5.79 | 8.69 | 1.52 | 1.52 |
Table 6.
Experimental ingredients of paint film.
| Microcapsule Content (%) | Weight of Microcapsules (g) | Weight of Coatings (g) |
|---|---|---|
| 0 | 0 | 4.00 |
| 5.0 | 0.20 | 3.80 |
| 10.0 | 0.40 | 3.60 |
| 15.0 | 0.60 | 3.40 |
| 20.0 | 0.80 | 3.20 |
| 25.0 | 1.00 | 3.00 |
Table 7.
List of experimental materials.
| Testing Machine | Machine Model | Manufacturer |
|---|---|---|
| Electronic balance | JCS-W | Harbin Zhonghui weighing instrument Co., Ltd., Harbin, China |
| Collector type constant temperature heating magnetic stirrer | DF−101S | Gongyi Yuhua Instrument Co., Ltd., Gongyi, China |
| Ultrasonic emulsifying disperser | TL−650CT | Shanghai Xinnuo Instrument Group Co., Ltd., Shanghai, China |
| Pear-shaped separating funnel | 60ML | Nanjing kangluoda Experimental Technology Co., Ltd., Nanjing, China |
| Circulating water multipurpose vacuum pump | SHZ-D | Zhengzhou biochemical instrument Co., Ltd., Zhengzhou, China |
| Electric heating constant temperature blast drying oven | DHG−9643BS-Ⅲ | Shanghai Xinmiao medical device manufacturing Co., Ltd., Shanghai, China |
| Biological microscope | Zeiss Axio Scope A1 | Shenzhen Guanggu Optical Instrument Co., Ltd., Shenzhen, China |
| Scanning electron microscope | Quanta−200 | Shenzhen Sanhao Instrument Equipment Co., Ltd., Shenzhen, China |
| Fourier transform infrared spectrometer | VERTEX 80V | Xiamen Qunlong Instrument Co., Ltd., Xiamen, China |
| Colorimeter | SEGT-J | Beijing Shidai peak Technology Co., Ltd., Beijing, China |
| Gloss meter | DT60 | Changzhou dude Precision Instrument Co., Ltd., Changzhou, China |
| Thermogravimetric analyzer | STA8000 | PerkinElmer Inc., Waltham, MA, USA |
Table 8.
Visual analysis of orthogonal experiment.
| Experiment Number | Urea: Formaldehyde | Core Material: Wall Material | Emulsifier Concentration (%) | Speed (rpm) | Coating Rate (%) |
|---|---|---|---|---|---|
| 1 | 1:1 | 1:7 | 3 | 1000 | 30.00 ± 0.75 |
| 2 | 1:1 | 4:7 | 4 | 1300 | 48.00 ± 1.20 |
| 3 | 1:1 | 7:7 | 5 | 1600 | 52.00 ± 1.30 |
| 4 | 1:1.5 | 1:7 | 4 | 1600 | 24.00 ± 0.60 |
| 5 | 1:1.5 | 4:7 | 5 | 1000 | 54.00 ± 1.35 |
| 6 | 1:1.5 | 7:7 | 3 | 1300 | 53.00 ± 1.32 |
| 7 | 1:2 | 1:7 | 5 | 1300 | 10.00 ± 0.25 |
| 8 | 1:2 | 4:7 | 3 | 1600 | 8.00 ± 0.20 |
| 9 | 1:2 | 7:7 | 4 | 1000 | 2.00 ± 0.05 |
| Mean1 | 43.333 | 21.333 | 30.333 | 28.667 | |
| Mean1 | 43.667 | 36.667 | 24.667 | 37.000 | |
| Mean1 | 6.667 | 35.667 | 38.667 | 28.000 | |
| Range | 37.000 | 15.334 | 14.000 | 9.000 |
Table 9.
Variance analysis of the orthogonal experiment.
| Factor | Sum of Squares of Deviations | Freedom | F Ratio | F Critical Value | Significance |
|---|---|---|---|---|---|
| Molar ratio of urea to formaldehyde | 2713.55 | 2 | 17.98 | 19.00 | |
| Core material: wall material | 441.55 | 2 | 2.92 | 19.00 | |
| Emulsifier concentration | 297.55 | 2 | 1.97 | 19.00 | |
| Speed | 150.88 | 2 | 1.00 | 19.00 | |
| Error value | 150.89 | 2 | 150.89 |
Table 10.
Reagent resistance and acid–base resistance analysis of microcapsules.
| Reagent | Dissolution | Color Change | ||
|---|---|---|---|---|
| Discoloration Compound | Thermochromic Microcapsule | Discoloration Compound | Thermochromic Microcapsule | |
| Acetone | solution | insolubilization | colorless | invariant |
| Ethyl acetate | solution | insolubilization | colorless | invariant |
| Xylene | solution | insolubilization | colorless | invariant |
| Acetic acid | solution | insolubilization | colorless | invariant |
| Hydrochloric acid | solution | insolubilization | colorless | invariant |
| Triethanolamine | solution | insolubilization | colorless | invariant |
Table 11.
Yield of single-factor microcapsules.
| Molar Ratio of Urea to Formaldehyde | Yield (g) |
|---|---|
| 1:1.2 | 15.48 ± 0.38 |
| 1:1.4 | 15.91 ± 0.39 |
| 1:1.5 | 14.93 ± 0.37 |
| 1:1.6 | 14.58 ± 0.36 |
| 1:1.8 | 12.63 ± 0.31 |
Table 12.
Coating rate of single-factor microcapsules.
| Experiment Number | Molar Ratio of Urea to Formaldehyde | Coating Rate (%) |
|---|---|---|
| 10 | 1:1.2 | 70.00 ± 1.75 |
| 11 | 1:1.4 | 63.30 ± 1.58 |
| 12 | 1:1.5 | 60.00 ± 1.50 |
| 13 | 1:1.6 | 56.60 ± 1.41 |
| 14 | 1:1.8 | 53.30 ± 1.33 |
Table 13.
Thermochromic temperature of single microcapsule.
| Experiment Number | Molar Ratio of Urea to Formaldehyde | Thermochromic Temperature (°C) |
|---|---|---|
| 10 | 1:1.2 | 68.00 ± 1.70 |
| 11 | 1:1.4 | 75.00 ± 1.87 |
| 12 | 1:1.5 | 71.00 ± 1.77 |
| 13 | 1:1.6 | 65.00 ± 1.62 |
| 14 | 1:1.8 | 95.00 ± 2.37 |
Table 14.
Chromaticity values of paint film at different temperatures.
| Microcapsule Content (%) | Color Parameter | 55 °C | 60 °C | 65 °C | 70 °C | 75 °C | 80 °C |
|---|---|---|---|---|---|---|---|
| 0 | L | 77.70 ± 1.94 | 64.00 ± 1.60 | 62.40 ± 1.56 | 81.10 ± 2.02 | 70.70 ± 1.76 | 62.30 ± 1.55 |
| a | 11.20 ± 0.28 | 18.10 ± 0.452 | 18.50 ± 0.46 | 9.60 ± 0.24 | 15.50 ± 0.38 | 18.30 ± 0.45 | |
| b | 47.10 ± 1.17 | 32.80 ± 0.82 | 31.10 ± 0.77 | 43.40 ± 1.08 | 28.40 ± 0.71 | 26.90 ± 0.67 | |
| 5 | L | 61.70 ± 1.54 | 59.00 ± 1.47 | 59.40 ± 1.48 | 64.00 ± 1.6 | 64.30 ± 1.60 | 64.30 ± 1.60 |
| a | 15.20 ± 0.38 | 16.00 ± 0.40 | 17.10 ± 0.42 | 15.70 ± 0.39 | 15.30 ± 0.38 | 14.80 ± 0.37 | |
| b | 35.50 ± 0.88 | 33.20 ± 0.83 | 33.10 ± 0.82 | 38.20 ± 0.95 | 40.00 ± 1.00 | 39.70 ± 0.99 | |
| 10 | L | 61.90 ± 1.54 | 59.00 ± 1.47 | 62.50 ± 1.56 | 63.70 ± 1.59 | 63.10 ± 1.57 | 63.80 ± 1.59 |
| a | 7.90 ± 0.19 | 11.00 ± 0.27 | 10.60 ± 0.26 | 10.50 ± 0.26 | 11.70 ± 0.29 | 10.80 ± 0.27 | |
| b | 27.00 ± 0.67 | 35.70 ± 0.89 | 30.10 ± 0.75 | 31.20 ± 0.78 | 32.20 ± 0.80 | 32.20 ± 0.80 | |
| 15 | L | 60.50 ± 1.51 | 59.50 ± 1.48 | 64.60 ± 1.61 | 62.90 ± 1.57 | 63.30 ± 1.58 | 61.70 ± 1.54 |
| a | 6.80 ± 0.17 | 8.20 ± 0.20 | 7.90 ± 0.197 | 9.10 ± 0.22 | 8.40 ± 0.21 | 9.40 ± 0.23 | |
| b | 24.50 ± 0.61 | 24.90 ± 0.62 | 26.20 ± 0.65 | 27.10 ± 0.67 | 29.30 ± 0.73 | 30.30 ± 0.75 | |
| 20 | L | 50.40 ± 1.26 | 68.90 ± 1.72 | 66.40 ± 1.66 | 69.00 ± 1.72 | 68.80 ± 1.72 | 69.70 ± 1.74 |
| a | −0.40 ± 0.01 | 0.10 ± 0.00 | 3.10 ± 0.077 | 1.80 ± 0.04 | 2.70 ± 0.067 | 2.20 ± 0.05 | |
| b | 16.00 ± 0.04 | 5.20 ± 0.13 | 9.50 ± 0.23 | 7.80 ± 0.19 | 10.40 ± 0.26 | 10.00 ± 0.25 | |
| 25 | L | 63.00 ± 1.57 | 65.50 ± 1.63 | 67.10 ± 1.67 | 68.00 ± 1.70 | 69.00 ± 1.72 | 69.70 ± 1.74 |
| a | −1.10 ± 0.02 | −1.00 ± 0.02 | 0.20 ± 0 | 1.80 ± 0.04 | 0.90 ± 0.02 | 2.70 ± 0.06 | |
| b | 0.75 ± 0.01 | 3.80 ± 0.09 | 6.20 ± 0.15 | 9.80 ± 0.24 | 8.80 ± 0.22 | 11.10 ± 0.27 |
Table 15.
Mechanical properties of microcapsule paint films with different microcapsule contents.
| Microcapsule Content (%) | Hardness | Adhesion (Grade) | Impact Resistance (kg∙cm) |
|---|---|---|---|
| 0 | 2H | 1 | 8.00 ± 0.20 |
| 5 | 2H | 1 | 10.00 ± 0.25 |
| 10 | 2H | 1 | 13.00 ± 0.32 |
| 15 | H | 1 | 15.00 ± 0.37 |
| 20 | HB | 1 | 17.00 ± 0.42 |
| 25 | HB | 1 | 15.00 ± 0.37 |
Table 16.
Chromaticity value and color difference of paint film before and after aging.
| Microcapsule Content (%) | Condition | L | a | b | ΔL | Δa | Δb | Color Difference |
|---|---|---|---|---|---|---|---|---|
| 0 | Before aging | 77.55 ± 1.93 | 14.65 ± 0.36 | 37.9 ± 0.94 | 6.88 ± 0.17 | 2.18 ± 0.05 | 0.83 ± 0.02 | 7.26 ± 0.18 |
| After aging | 70.68 ± 1.76 | 12.48 ± 0.31 | 37.08 ± 0.92 | |||||
| 20.0 | Before aging | 65.43 ± 1.63 | −0.4 ± 0.01 | 1.60 ± 0.04 | −5.00 ± 0.12 | −6.12 ± 0.15 | −20.77 ± 0.51 | 22.23 ± 0.55 |
| After aging | 70.47 ± 1.76 | 5.7 ± 0.14 | 22.37 ± 0.55 |
Publisher’s Note: MDPI stays neutral with regard to jurisdictional claims in published maps and institutional affiliations. |
© 2022 by the authors. Licensee MDPI, Basel, Switzerland. This article is an open access article distributed under the terms and conditions of the Creative Commons Attribution (CC BY) license (https://creativecommons.org/licenses/by/4.0/).
Share and Cite
MDPI and ACS Style
Zhao, W.; Yan, X. Preparation of Thermochromic Microcapsules of Bisphenol A and Crystal Violet Lactone and Their Effect on Coating Properties. Polymers 2022, 14, 1393. https://doi.org/10.3390/polym14071393
AMA Style
Zhao W, Yan X. Preparation of Thermochromic Microcapsules of Bisphenol A and Crystal Violet Lactone and Their Effect on Coating Properties. Polymers. 2022; 14(7):1393. https://doi.org/10.3390/polym14071393
Chicago/Turabian StyleZhao, Wenting, and Xiaoxing Yan. 2022. "Preparation of Thermochromic Microcapsules of Bisphenol A and Crystal Violet Lactone and Their Effect on Coating Properties" Polymers 14, no. 7: 1393. https://doi.org/10.3390/polym14071393
Note that from the first issue of 2016, this journal uses article numbers instead of page numbers. See further details here.