Article

A Statistical Study on the Development of Metronidazole-Chitosan-Alginate Nanocomposite Formulation Using the Full Factorial Design

by
Hazem Abdul Kader Sabbagh
1,
Samer Hasan Hussein-Al-Ali
1,2,*,
Mohd Zobir Hussein
3,*,
Zead Abudayeh
1,
Rami Ayoub
1 and
Suha Mujahed Abudoleh
1
1
Department of Basic Pharmaceutical Science, Faculty of Pharmacy, Isra University, Amman 11622, Jordan
2
Department of Chemistry, Faculty of Science, Isra University, Amman 11622, Jordan
3
Materials Synthesis and Characterization Laboratory, Institute of Advanced Technology (ITMA), Universiti Putra Malaysia, 43400UPM Serdang, Selangor, Malaysia
*
Authors to whom correspondence should be addressed.
Polymers 2020, 12(4), 772; https://doi.org/10.3390/polym12040772
Submission received: 27 February 2020 / Revised: 19 March 2020 / Accepted: 22 March 2020 / Published: 1 April 2020
(This article belongs to the Special Issue Polymeric Carriers for Biomedical and Nanomedicine Application)

Abstract

:
The goal of this study was to develop and statistically optimize the metronidazole (MET), chitosan (CS) and alginate (Alg) nanoparticles (NP) nanocomposites (MET-CS-AlgNPs) using a (21 × 31 × 21) × 3 = 36 full factorial design (FFD) to investigate the effect of chitosan and alginate polymer concentrations and calcium chloride (CaCl2) concentration ondrug loading efficiency(LE), particle size and zeta potential. The concentration of CS, Alg and CaCl2 were taken as independent variables, while drug loading, particle size and zeta potential were taken as dependent variables. The study showed that the loading efficiency and particle size depend on the CS, Alg and CaCl2 concentrations, whereas zeta potential depends only on the Alg and CaCl2 concentrations. The MET-CS-AlgNPs nanocomposites were characterized by X-ray diffraction (XRD), Fourier-transform infrared spectroscopy (FTIR), thermal gravimetric analysis (TGA), scanning electron microscopy (SEM) and in vitro drug release studies. XRD datashowed that the crystalline properties of MET changed to an amorphous-like pattern when the nanocomposites were formed.The XRD pattern of MET-CS-AlgNPs showed reflections at 2θ = 14.2° and 22.1°, indicating that the formation of the nanocompositesprepared at the optimum conditions havea mean diameter of (165±20) nm, with a MET loading of (46.0 ± 2.1)% and a zeta potential of (−9.2 ± 0.5) mV.The FTIR data of MET-CS-AlgNPs showed some bands of MET, such as 3283, 1585 and 1413 cm−1, confirming the presence of the drug in the MET-CS-AlgNPs nanocomposites. The TGA for the optimized sample of MET-CS-AlgNPs showed a 70.2% weight loss compared to 55.3% for CS-AlgNPs, and the difference is due to the incorporation of MET in the CS-AlgNPs for the formation of MET-CS-AlgNPs nanocomposites. The release of MET from the nanocomposite showed sustained-release properties, indicating the presence of an interaction between MET and the polymer. The nanocomposite shows a smooth surface and spherical shape. The release profile of MET from its MET-CS-AlgNPs nanocomposites was found to be governed by the second kinetic model (R2 between 0.956–0.990) with more than 90% release during the first 50 h, which suggests that the release of the MET drug can be extended or prolonged via the nanocomposite formulation.

Graphical Abstract

1. Introduction

Design of experiment (DE) is a systematic method in research used to determine the relationship between independent variables and response variables [1,2]. There are different types of DE, which include factorial designs [3,4,5], fractional factorial designs [6,7], full factorial designs (FFD) [8,9], Plackett–Burman designs [10,11], central composite designs (Box–Wilson designs) [12,13], Box–Behnken designs (BBD) [14,15], Taguchi designs (TD) [16,17] and response surface designs (RSD) [18,19].
In pharmacy, the term optimization can be defined as the process of discovering the best way of using the existing resources while taking into account all the parameters that influence the decisions of any experiment [20]. Modern pharmaceutical optimization involves a systematic design of experiments to improve drug formulation. The process begins with predicting and evaluating the independent variables that affect the formulation response and selecting the best response values. With optimization, the formulation steps and preparation that fulfill the desired characteristics of the final product could be minimized.
Polynomial is one form of regression analysis. It is a non-linear analysis that correlates between the independent variable (x) and the dependent variable (y) as an nth degree polynomial in x. Different ways can be used in the fitting of the regression analysis for establishing approximate mathematical models. One of these fitting methods is called the stepwise method [21,22].It involves choosing the predictive variables by an automatic procedure [23,24]. In each step, a variable is added to or subtracted from the set of explanatory variables based on some pre-specified criteria.
After decades of basic nanosciences research, nanotechnology applications offer a wide range of opportunities in the fields of agriculture [24,25], food [26], environment [27,28] and drug delivery [29,30,31]. Nano-formulation technology has produced many new innovative drug delivery systems. Smart drug delivery, as well as polymeric nano-formulation as solid colloidal particles with diameters ranging from 1 to 1000 nm, preserves drugs against chemical decomposition and modifies drug release profiles in a controlled manner [25,26]. Polymeric nanoparticles are one example of nano-formulation. Research on polymeric nanoparticles has been especially focused on their role in drug delivery and drug targeting owing to their particle size and long circulation in the blood [27,28].They can be used therapeutically in vaccines, or as drug carriers, in which the drug can be encapsulated, entrapped, chemically attached, adsorbed or dissolved [29].
Chitosan and alginate, which are polymeric materials, were widely used in the development of nano-formulation products [30]. Both are non-toxic, stable hydrophilic polymers [31,32]. Chitosan-alginate has been used as a sustained release polymer matrix in different dosage forms [30,31,33,34]. Drug side effects may occur when administered in large quantities and sustained release formulations in nanocomposites by a single dose might be a suitable way to decrease drug complications due to its high concentration and increased patient compliance [35,36,37,38].
The drug used in this research, metronidazole (MET), is an antibiotic drug usually used to treat bacterial infections of the vagina, stomach or intestines, liver, skin, joints, brain, heart and respiratory tract. However, it is ineffective for viral infections (such as the common cold and flu).
There have been many attempts by researchers to load MET using nano-formulations such as nanostructure lipid carriers (NLCs) [39], nano-emulsions [40], MET loaded into niosomes and then coated on dental implants using a layer-by-layer dip-coating technique with poly(lactic acid) (PLA) [41] and magnetic nanocomposites [42].
In the present study, the incorporation of MET into polymer nanoparticles was achieved. To the best of our knowledge, this work is reported for the first time, where MET as a guest drug was encapsulated into CS for the formation of CS-Algnanoparticleswith optimized preparation parameters.Traditionally, optimization is done by evaluating each factor independently. However, in a single-factor experiment, the interactions between important parameters are ignored. Response surface methodology (RSM) can be used to analyze the interactions between the different variables. The experimental data is input as a quadratic equation and the response is predicted. Stepwise regression analysis is one of the methodsthat can derive the best equation that can describe the data via surface or contour plots. Thus, in this work, Minitab softwareversion 18.1 and full factorial design were used to examine the effect of three independent variables (concentration of CS, Alg, and CaCl2) on three dependent variables (loading efficiency, particle size and zeta potential) for the synthesis of CS-Alg nanoparticles.

2. Materials and Methods

2.1. Materials

The chemicals used in this study are metronidazole (C6H9N3O3 (99% purity), Sigma-Aldrich, Taufkirchen, Germany), low molecular weight chitosan (10–120 kDa, 90% deacetylation, Sigma-Aldrich), and low viscosity sodium alginate (10–100 kDa, AZ Chem., Sigma Aldrich). All HPLCsolutions were used from VWR (West Chester, PA, USA). All other chemicals, including acetic acid and calcium chloride, were purchased from Chem CO (Port Louis, Mauritius).

2.2. Preparation of CS-Alg Nanoparticles and MET-CS-AlgNPs Nanocomposites

The method used was a modification of what is called the ionotropic pregelation method [43,44]. Solutions of CS, Alg and CaCl2 were first prepared. The pH of the CS and Alg solutions was adjusted to 5.5 and 5.0, respectively. The first step was the formation of the AlgNPs pre-gel, which was achieved by adding 6 mL of different concentrations of aqueous CaCl2 solution to 10 mL of Alg, followed by 30 min of stirring. The second step was the addition of 4 mL of CS solution to the AlgNPs pre-gel with stirring for another 30 min. The resultant solution was stirred overnight at room temperature to form uniform nanoparticles. The same procedure was used to form MET-CS-AlgNPs nanocomposites using only 100 milligrams of MET mixed with the Alg solution.

2.3. Methodology

First, the modeling of the responses (loading efficiency, particle size and zeta potential) was presented. Secondly, the FFD was built to perform the experiments. This was followed by the use of multiple regressions to develop the loading efficiency, particle size and zeta potential model responses. Finally, the analysis of concentration variance was used to analyze the experimental data to predict the effects and contribution of parameters on responses.

2.3.1. Modeling of Different Responses

The loading efficiency percentis the first response, which was taken as a parameter and was defined as the amount of total entrapped drug divided by the total weight of the nanoparticles. The second and third responses measured were particle size and zeta potential. Table 1 shows the three independent parameters and their levels.

2.3.2. Full Factorial Design

Full factorial design (FFD) is a method used by researchersto design experiments that consist of several factors with separate possible levels. With FFD, the experiment takes all possible combinations of the levels across all such factors. FFD allows researchers to study the effect of each factor, as well as their interactions, on the response variable [45]. In this study, the FFDwas used to conduct the experiments. Therefore, (21 × 31 × 21) × 3 = 36 combinations were used, corresponding to n = 3 parameters or factors (CS, Alg and CaCl2) (Table 2).

2.4. MET Loading Efficiency

High-speed centrifugation was used to determine the loading efficiency (LE) of MET in the prepared nanocomposites, in which 2.0 mL of suspension were centrifuged (Hettich Universal 30 RF) at 10,000 rpm for 10 min, and the drug loading was measured by high-performance liquid chromatography (HPLC, Shimadzu, Japan), using a Venusil C18 column (4.6 mm × 250 mm, 5 μm) at 25°C. The UV detection wavelength was 323 nm, and the mobile phase was prepared by mixing acetonitrile/0.1% with phosphoric acid (5:95, v/v). The flow rate was 1.0 mL/min. The LE was calculated as follows:
%   Loading Effciency   ( LE ) = T p T f mass of nanoparticles × 100
where Tp is the total mass of MET used to prepare the nanocomposites, and Tf is the free mass of MET in the supernatant.

2.5. Particle Size and Zeta Potential of Nanocomposites

Particle size and zeta potential of the nanocompositeswere analyzed through a dynamic light scattering (DLS) method using a Zetasizer Nano S (Malvern, UK) at the Arab Pharmaceutical Manufacturing. The analysis was performed in triplicates at a temperature of 25 °C.
For the particle size analysis, the samples were dispersed in distilled water, the cells were filled and capped and checked for the absence of any bubbles.
The samples were prepared for zeta potential analysis by dispersing themin the distilled water and measuring the zeta values at 25 °C.

2.6. Controlled Release Study of the MET from the Nanocomposites

The in vitro release of MET from the nanocomposites wasdetermined in a solution at pH 1.2, using a Perkin Elmer UV–Vis spectrophotometer with λmax of 323 nm. A suitable amount of each nanocomposite was added to 2 mL of the media. The cumulative amount of drug released into the solution was measured at preset time intervals at corresponding λmax.
The percentage release of MET into the release media was calculated according to the formula:
% Release = Concentration   of   MET   at   time   t   ( ppm ) Concentration   corresponding   to   100 %   release   of   MET   ( ppm ) × 100
The concentration corresponding to 100% release was obtained by adding a known amount of the nanocomposites into 2 mL HCl followed by sonicating and heating the nanocomposites at 37 °C.

2.7. Instrumentation

Powder X-ray diffraction (XRD) patterns were used to determine the crystal structure of the samples in the range of 2–70 degrees on an XRD-6000 diffractometer (Shimadzu, Tokyo, Japan) using CuKα radiation (λ=1.5406 Å) at 30 kV and 30 mA at Universiti Putra Malaysia. Fourier transform infrared spectroscopy (FTIR) spectra of the materials were recorded over the range of 400–4000 cm−1 on a Perkin Elmer (model Smart UAIR-two). The thermogravimetric analysis was carried out using a Metter-Toledo 851e instrument (Switzerland) with a heating rate of 10 °C min−1, in 150 μL alumina crucibles and in the range of 30–900 °C. The zeta potential was measured at 25 °C by the dynamic light scattering (DLS) method using a Malvern Zetasizer Nano ZS (Malvern Instruments, Malvern, UK). UV–Vis spectra were measured to determine the release profiles using a Shimadzu UV-1601 spectrophotometer.

3. Results and Discussion

3.1. MultipleLinear Regression Analysis

Multiple regression analysis is a statistical method that is used to estimate the correlation between dependent and independent variables. The term correlation coefficient () indicates how well the data fit the multiple regression models. It provides a measure of how well-observed outcomes are replicated by the model, as the proportion of total variation of outcomes explained by the model. An close to 1 indicates that the regression model perfectly fits the data; the higher the , the more the dependent variations are explained by input variables and therefore the better the model.
However, the demerit with is that it will stay the same or increase with the addition of more variables, even if they do not have any relationship with the output variables. This can be solved by using the “adjusted R square”, which is sensitive for adding variables that do not improve the model.
The linear (CS, Alg, and CaCl2), linear-square (CS*CS, Alg*Alg, and CaCl2*CaCl2) and linear-interaction equations (CS*Alg, CS*CaCl2 and Alg*CaCl2) have been fitted using a Minitab software for LE, particle size and zeta potential variables. The data was analyzed using stepwise regression which is a way to build a model by adding or removing independent variables, usually via a series of F-tests or T-tests. The variables to be added or removed are chosen based on the test statistics of the estimated coefficients.
Table 3 shows the ANOVA values for LE, particle size and zeta potential given in the suggested models. The P-value is less than 0.05, showing the model which is significant at a 95% confidence level. These LE, particle size and zeta potential models show that lack-of-fit error value is insignificant (0.283, 0.821 and 0.432, respectively) indicating that the fitted model is accurate enough to predict the response. The mathematical models were developed to determine the optimal values of the MET-CS-AlgNPs formulation conditions leading to maximum values of LE, minimumvalues of particle size and a negative value (~20 mV) of zeta potential.
The equations can be given in terms of the coded values of the independent variables as shown in the following Table 4.
Table 4 shows the regression model for three dependent variables for LE, particle size and zeta potential. The LE model showed that R-square values were found to be 98.91%, 98.68% and 99.35%, respectively. Moreover, the Adj-R-square values were found to be 98.62%, 98.19% and 99.02%, respectively.

3.2. Evaluation of the Models

3.2.1. Pareto Chart of Responses of Standardized Effects and Normal Plot of the Standardized Effects

A Pareto chart (Figure 1) is a graphical overview of the process factors and/orinteractions of influence, in ranking order from the most influencialto theleast influencial. A threshold line (P-value 0.05) indicates the minimum magnitude of statistically significant effects, considering the statistical significance of 95%.
Figure 1A indicates that the effect of BB i.e., CS × CS is statistically insignificant toward LE. The effect of AC (Alg × CaCl2) has the highest standardized effect on the LE followed by A, B, C, AB and BC. Hence, the term BB should not be considered for the empirical relation. The insignificance of BB can also be reasserted from the normal plot (Figure 1A), in which the points that do not fall near the fitted line are important. The factors having a negligible effect on the output response tend to be smaller and are centeredaround zero.
Figure 1B represents the effect of different parameters on particle size. The results indicate that all the effects are statistically significant. Factor A (Alg) has the highest standardized effect on the particle size followed by B, C, BC, BB, AB and AC. The significance of factors can be shown in the normal plot (Figure 1B).
Figure 1C shows the effect of different factors on the zeta potential response. The main factors (A, and C), square factors (B*B) and 2-way interaction (A*C and B*C) have a statistically significant effect on the response. C (CaCl2) has the highest standardized effect on the zeta potential followed by AC, A, BB, and BC. Hence, the terms AB and B should not be considered for the empirical relation.

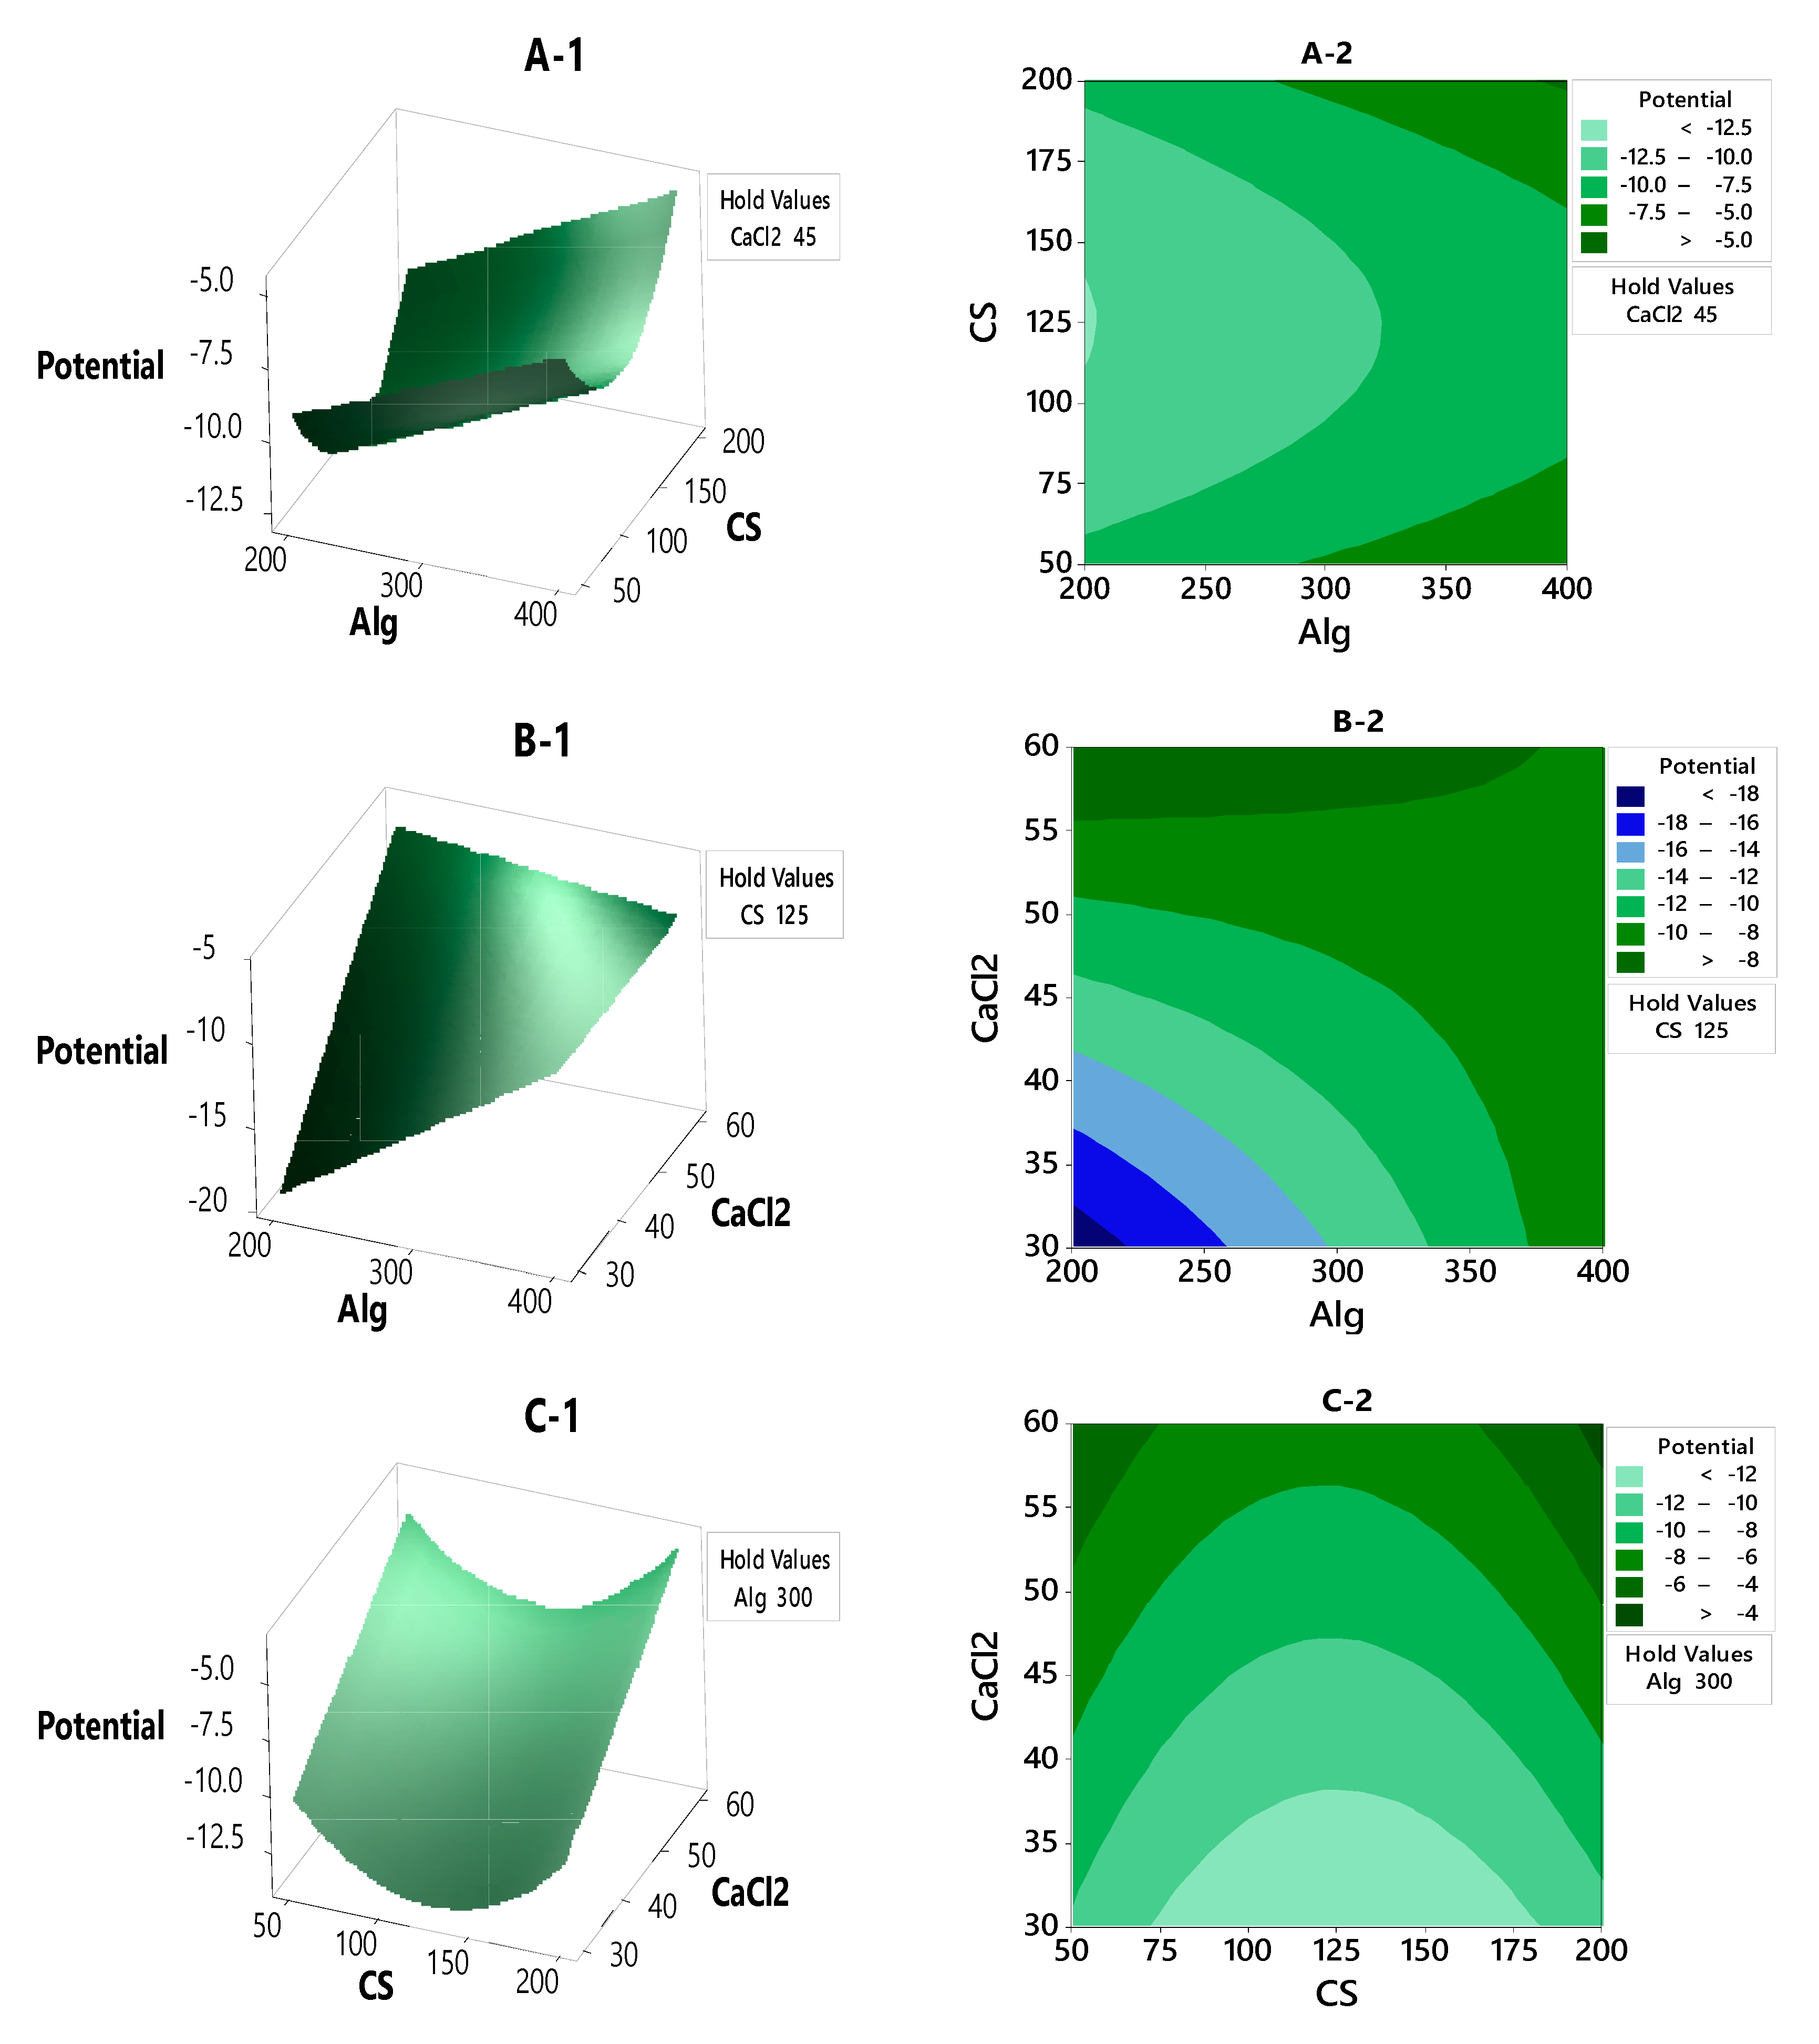
3.2.2. Contour Plot and Surface Plot of LE, Particle Size and Zeta Potential Against Selected Independent Variables

The effect of the formulation and process variables on LE responsecan be evaluated by studying thecontour and response surface plots. Figure 2A-1,A-2 shows the response plots of LE as a function of CS and Alg concentrations, and it is seen to display a stationary ridge pattern. As the color gets darker, the LE response increases. The stationary ridge has a flat shape. Increasing the concentration of CS and decreasing the Alg can afford more space for LE (>55%). In Figure 2B-1,B-2, the contour and response surface plots show minimax patterns, with the stationary point (saddle point) being near the center of the design. From the stationary point (saddle point), increasing CaCl2 concentration while decreasing the Alg concentrationled to an increase in the LE response. Figure 2C-1,C-2 showsa flat shaped stationary ridge, and increasing the concentration of CS while decreasing CaCl2 concentration led to an increase of the LE by more than 52%.
Figure 3A-1,A-2 shows a rising ridge pattern. As the color gets lighter, the particle size decreases. The minimum particle size was achieved using high concentrations of Alg and the lowest concentration of CS. From Figure 3A-2 it can be seen that the particle size below 50 nm can be prepared using 50 mg of CS and 400 mg of Alg. Figure 3B-1,B-2 shows that the particle size below 120 nm can be prepared by using 400 mg of Alg and 60 mg of CaCl2. In the case of CS and CaCl2 variables in Figure 3C-1,C-2, rising ridge pattern can also be seen. The particle size lower than 120 nm can be obtained using CS concentrations of 200 mg and CaCl2 concentrations ranging between 30 and 60 mg.
Figure 4 shows the3Dresponse surface and contourplots of the combined effect of CS, Alg and CaCl2on the zeta potential charge. The plots show that all the variables affect the zeta potential with rising ridge patterns. Figure 4A-1,A-2 shows the combined effect of Alg and CS concentrations; when the color gets lighter, the zeta potential becomesgreater than −12.5 mV, whereas when the color gets darker, the zeta potential becomesless than −5.0 mV. The zeta potential was higher than −5.0 mV when the Alg concentration was higherthan 300 mg and CS concentration was between 50–75 mg and 160–200 mg, whereas the zeta potential was lower than −12.5 mV when the concentration of Alg was less than 300 mg and the CS concentration was between 60–185 mg.
Figure 4B-1,B-2 shows the contour plots of the effect of Alg and CaCl2 on the zeta potential. The zeta potential was between −8 and −18 mV; it was around −18 mV at low concentrations of both Alg and CaCl2, and around −8 mV at Alg concentrations between 200–350 mg with concentrations of CaCl2 between 55–60 mg.
Figure 4C-1,C-2 shows that the 3D surface and contour plots represent a rising ridge pattern. As the color gets darker, the zeta potential response reaches −4 mV; this occurs at high concentrations of CaCl2 of 55–60 mg and CS concentrations below 50 mg and higher than 200 mg. The zeta potential response at −4 mV can be achieved at a low concentration of CaCl2 of below 30 mg and a CS concentration between 75–175 mg.

3.2.3. Main effects plot for LE, particle size and zeta potential

Figure 5 shows a plot of the main effects (CS, Alg and CaCl2) used to examine differences between level means for LE, particle size and zeta potential factors. All factors seem to affect the LE, particle size and zeta potential because the line is not horizontal. Figure 5A shows that Alg at a concentration of 200 mg gave a higher LE (55%) compared to400 mg (40%). A CaCl2 concentration of 30 mg had a higher LE mean (50%) than the one at 60 mg (45%). The CS also affected the LE, with 200 mg of CS having had a higher LE mean (51%) than at 60 mg (43%). It is evident from Figure 5B that particle size is minimal (≈150 nm) at the highest level of Alg (400 mg)and CaCl2 (60 mg). In addition, the minimal particle size of approximately 100 nm can be obtained with the lowest level of CS (60 mg).
Based on the main effect plots in Figure 5C, the zeta potential was found to be the lowest at all of the highest values of Alg, CS and CaCl2 parameters tested. Both the parameters of Alg and CaCl2 concentrations show a linear potential pattern with an increase in their levels. However, CS concentration shows otherwise; although the highest level of CS concentration tested resulted in −7 mV potential, its mid-point shows a downward curvature in its response. The −11, −10 and −14 mV values of the mean zeta potential are observed at 200 mg of Alg, 120 mg of CS and 30 mg of CaCl2. From our studies, based on their potential data, the prepared nanocomposites were stable.

3.2.4. The Interaction between the Factors thatAffects the LE, Particle Size and Zeta Potential

The interaction plots in Figure 6, Figure 7 and Figure 8 show how the relationship between one independent factor and a continuous response depends on the value of the second independent factor. The plot displays mean values for the levels of one factor on the x-axis and a separate line for each level of the other factor. The parallel lines in the interaction indicate that there is no relationship between the variables. When an interaction occurs, the lines are less parallel, and the strength of the interaction becomes greater.
In this interaction plot, the lines in Figure 6A are parallel, which indicates that there is a relationship between the variables. The interaction in Figure 6B has a nonparallel line, indicating that the relationship between Alg and LE depends on the value of CaCl2. For example, if 300 mg of Alg is used, then 30, 45 and 60 mg of CaCl2 are associated with the 50 % LE means, similar to that in Figure 6C.
Figure 7 shows that there is an interaction between the Alg*CS (Figure 7A) and CS*CaCl2 (Figure 7C). Figure 7A shows that there is a significant interaction between Alg and CS. The green and redlines (200 and 125 mg CS, respectively) show that the mean size response decreases when the Alg factor level is low, while in Figure 7C, the green, red and blue lines, which correspond to 60, 45 and 30 mg CaCl2, respectively, show that the particle size mean response decreases when the CS factor level is low.
The interaction plotsshown in Figure 8A,B show the lines are not parallel, indicating that the relationship between Alg concentration and zeta potential depends on the value of CS (Figure 8A) and CaCl2 (Figure 8B). For example, when Algwas used at concentrations of 200 mg, then CaCl2 at 30 mg was associated with the −20 mV mean zeta potential (Figure 8B). However, when Alg with concentrationsof 200 mg was used, then CS at 50 and 125 mg was associated with −10 mV mean zeta potential (Figure 8A).
The Normal Plot of the Standardized effects, Normal probability plots, Residuals versus fitted value and Residuals versus observation toward LE, Particle Size and Zeta Potential (Figures S1–S4 in Supplementary Materials).

3.3. Optimization of LE, Particle Size and Zeta Potential

In this study, the data was used to build a mathematical model such as linear, linear interaction, linear square and second-order model. Table 5 shows the selected mathematical model used to optimize the conditions of 46.05% for LE, minimizing the particle size to a 164 nm value and achieving a −9.25 mV zeta potential, using 350 mg Alg, 150 mg CS and 40 mg CaCl2 (Figure 9).

3.4. Validation Test for Building Model

The comparison of experimental results with predicted values is shown in Table 6. From the table, the theoretical values for response were close to the experimentally obtained values. This result indicates that the mathematical models can be successfully used to predict the LE, particle size and zeta potential values for any combination of the Alg, CS and CaCl2 within the range of the performed experimentation.

3.5. X-Ray Diffraction of MET-CS-AlgNPs Nanocomposites

From the literature, the XRD diffractogram of CS shows crystalline properties with an intense peak at 2θ = 19.7°. At the same time, the XRD diffractogram of Alg shows semi-crystalline properties with a peak at 2θ = 13.6° [46].
XRD patterns of pure MET, CS-AlgNPs and MET-CS-AlgNPs nanocomposite formulations are illustrated in Figure 10A–C. The MET powder shows two sharp single peaks at 2θ = 11.0° and 22.3°,whereas the blank CS-AlgNPs nanoparticles gave a peak at 2θ = 14.9° and 21.6°, which indicates there is an amorphous pattern. The intensity of the diffraction peak of the CS-AlgNPs nanoparticles at 21.6° 2θ decreased after loading of MET and the peak for MET at 2θ = 11.0 and 22.3° disappeared in the MET-CS-AlgNPs nanocomposite. This might be due to the loading of MET inside the amorphous region of the nanocomposite matrix.

3.6. FTIR Spectroscopic Analysis of CS-AlgNPs and MET-CS-AlgNPs

FTIR spectra of MET, CS-AlgNPs and MET-CS-AlgNPs are presented in Figure 11A–C. The FTIR spectra of pure MET (Figure 11A) show characteristic peaks at 3457 cm−1 (Hydroxyl –OH), 3100 cm−1 (C–C stretching), 1534 and 1366 cm−1)nitroso N–O stretch), and 1075, 875 cm−1 (C–N stretch) [47].
For CS-AlgNPs (Figure 11B), a band at 3296 cm−1 was observed due to O–H and N–H stretching. Absorptions due to vibration asymmetry CH2 and symmetry CH2 were located at 2930 and 2850 cm−1, respectively. A strong band near 1589 cm−1 corresponds to the C=O, C–N and N–H bending of amide I. Asymmetric stretching band of the COO group was centered near to 1420 cm−1 [48].
For MET-CS-AlgNPs (Figure 11C), some bands were downshifted; for example, from 3296to 3283 cm−1, from 1589 to 1585 cm−1 and from 1408 to 1413 cm−1. This can be explained due to the interaction between MET and CS-AlgNPs.

3.7. Thermogravimetric Analysis of MET-CS-AlgNPs Nanocomposites

The thermal decomposition process of MET-CS-AlgNPs nanocomposites and its pure counterpart CS-AlgNPs was evaluated by TGA/DTG analyses. These analysis curves give thepercentage weight loss due to the thermal decomposition (Figure 12). The results show that a pure MET sample undergoes a one-stage thermal degradation process, whileCS-AlgNPs and MET-CS-AlgNPs samples are degraded in a three-stage process. For the MET sample, the decomposition process occurred between 137–288 °C and with a mineral residue of 0.9% [49], which was due to the vaporization of volatile components [50].
The CS-AlgNPs show three main thermal stages; the first stage of the decomposition process occurred between 60–200 °C, which was due to the vaporization of volatile components, such as water molecules immobilized between chitosan chains during the coating process [51]. Based on the structure of CS and Alg, H2O molecules can be bounded by the hydroxyl group [52].
The second stage of weight loss, which occurred between 200–520 °C, is due to the release of water bound to the functional groups of CS and Alg polymers, which was not completely removed in the first step of the dehydration, and to the degradation of both polymers.
A third inflection point occurred between 520–800 °C, which may be associated with the decomposition of functional groups of both polymers which were not completely removed by the previous stages.
The TGA of MET-CS-AlgNPs (Figure 12) also shows three weight loss steps similar to CS-AlgNPs. The MET-CS-AlgNPs shows 70.2% weight loss compared to 55.3% for CS-AlgNPs. The extra weight loss is due to the incorporation of MET in the CS-AlgNPs.

3.8. Scanning Electron Microscopy

The CS-AlgNPs and MET-CS-AlgNPs were morphologically characterized using the SEM (Figure 13). The micrographs of CS-AlgNPs (Figure 13A) show that the nanoparticles have a smooth surface with a spherical shape which is in agreement with previous studies [53]. Figure 13B shows that MET-CS-AlgNPsnanocomposites also have a spherical shape.

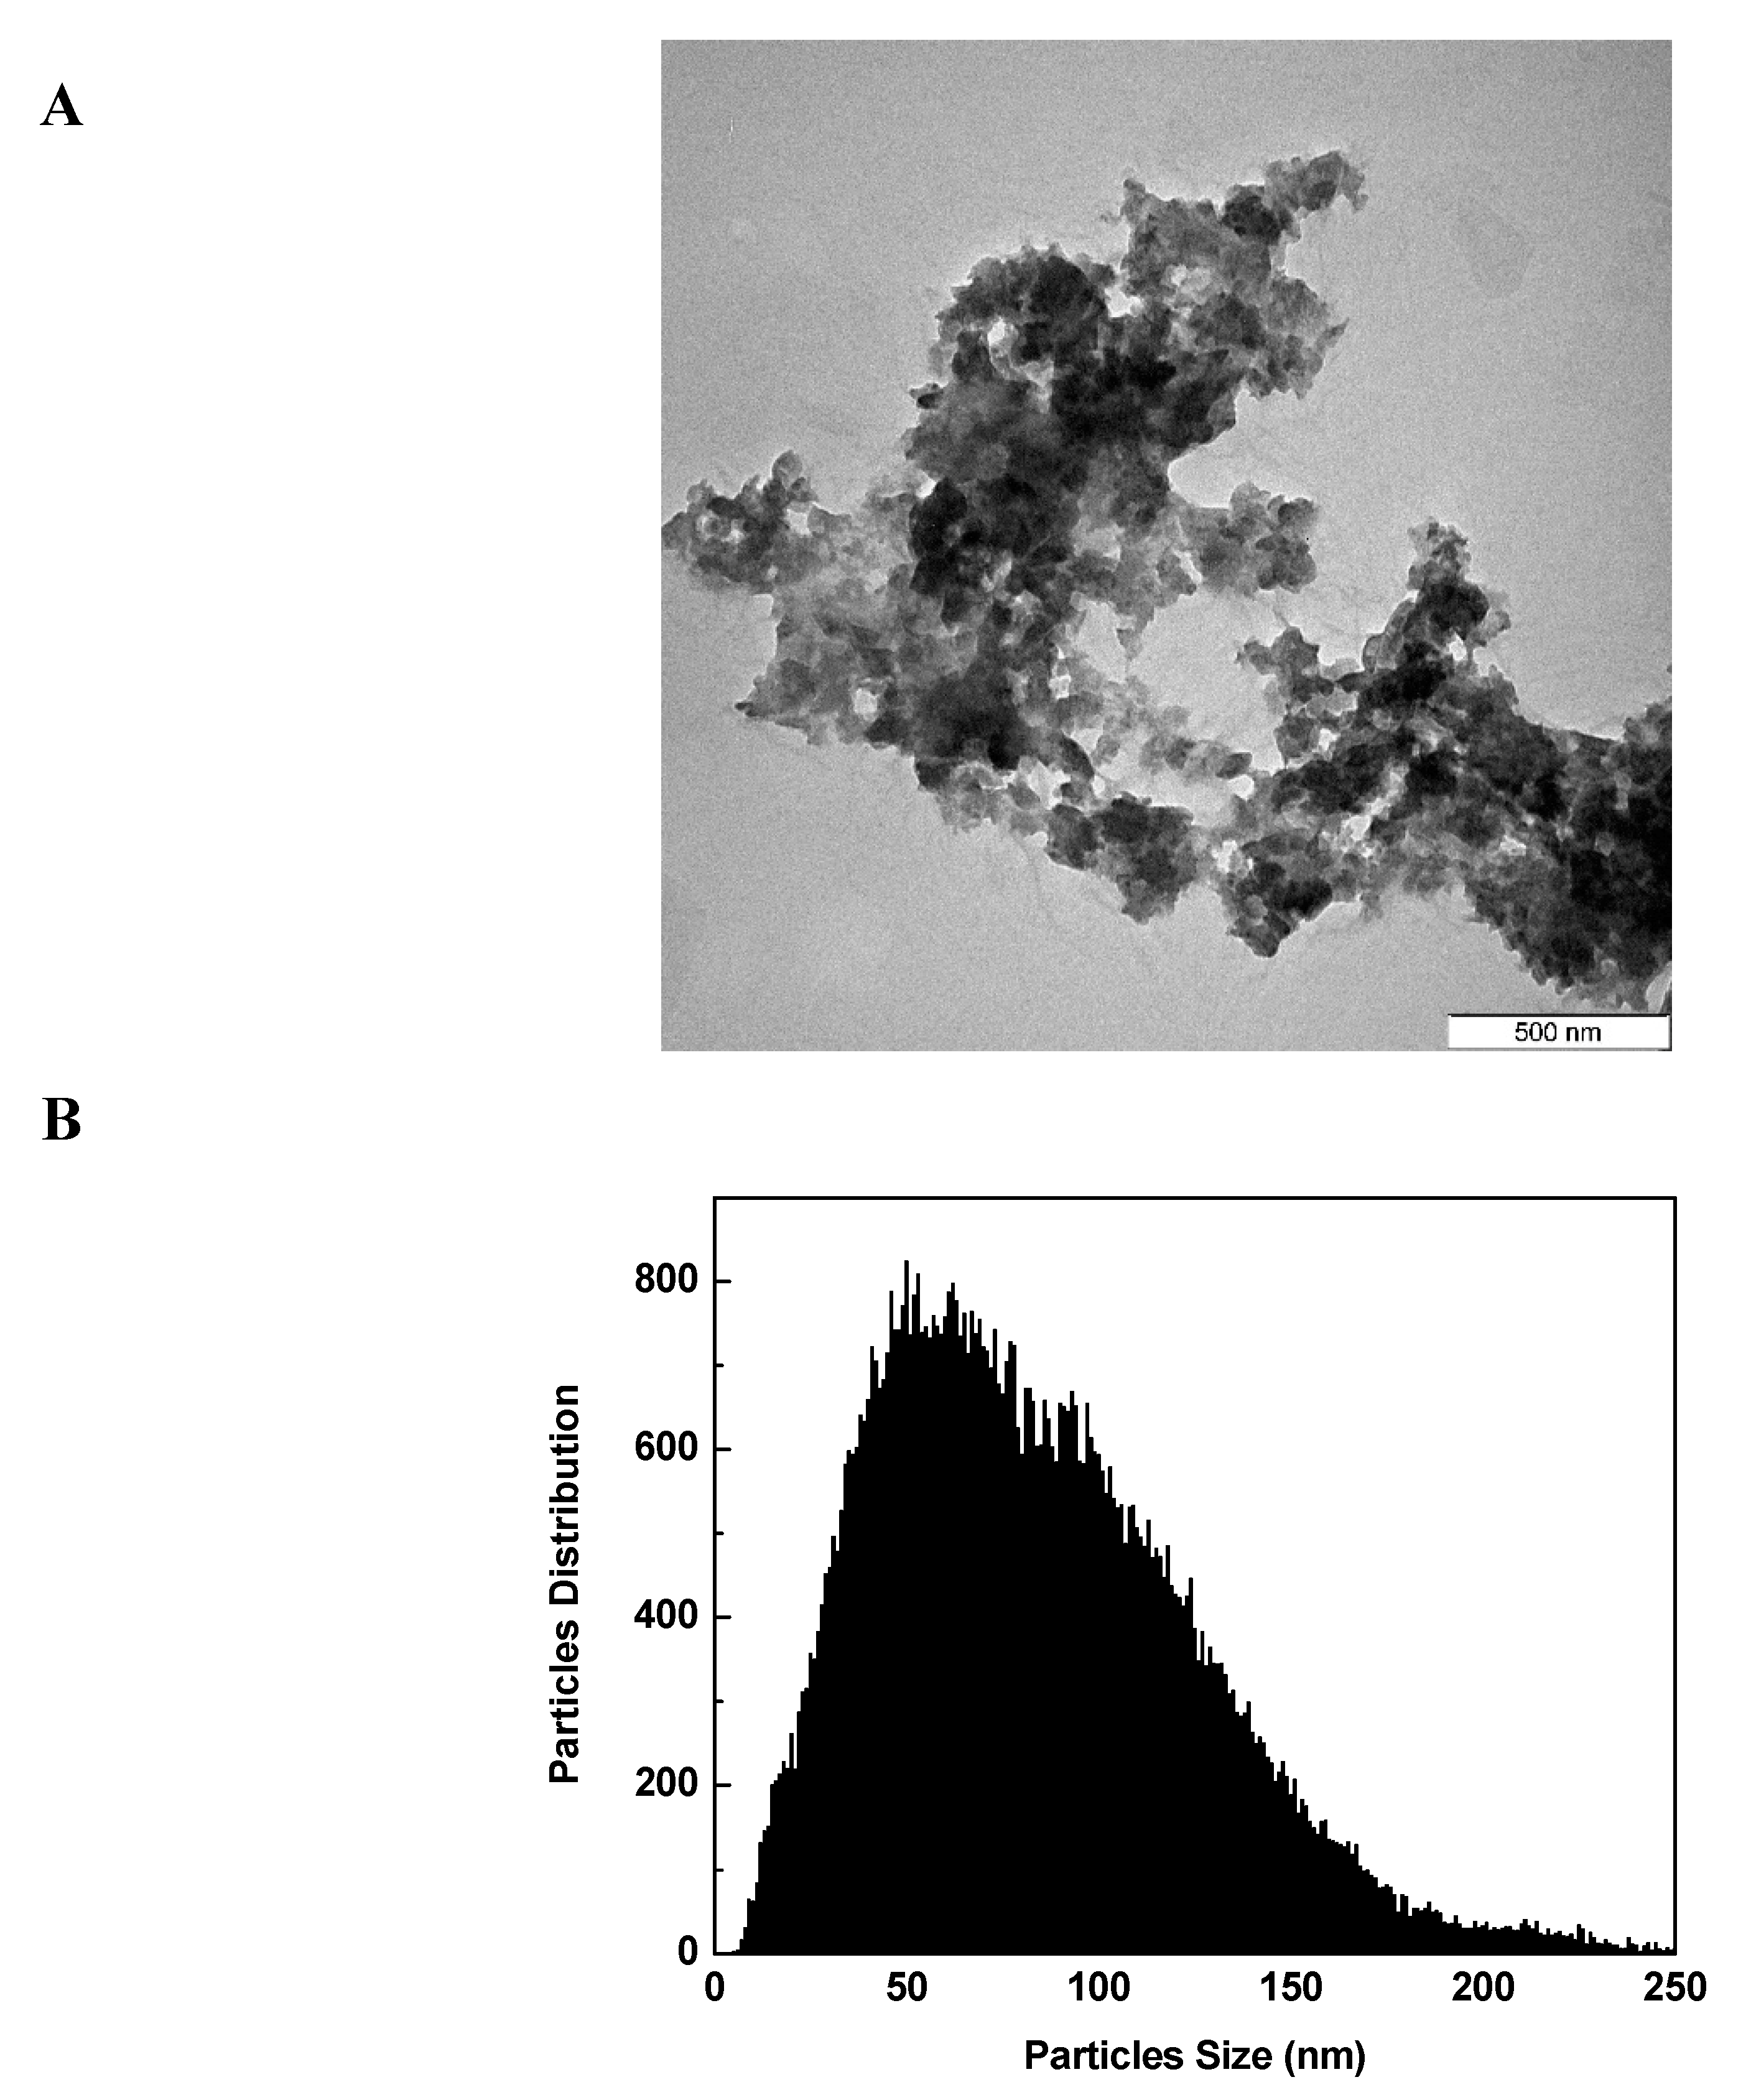
3.9. Transmission Electron Microscopy

The MET-CS-AlgNPs nanocomposites were also examined using the transmission electron microscope (TEM), and the structure is as shown in Figure 14. From the Figure, it can be seen that the nanocomposites have irregular spherical shapes with agglomerate behaviors. The size of the main individual nanocomposites is around 80–110 nm.

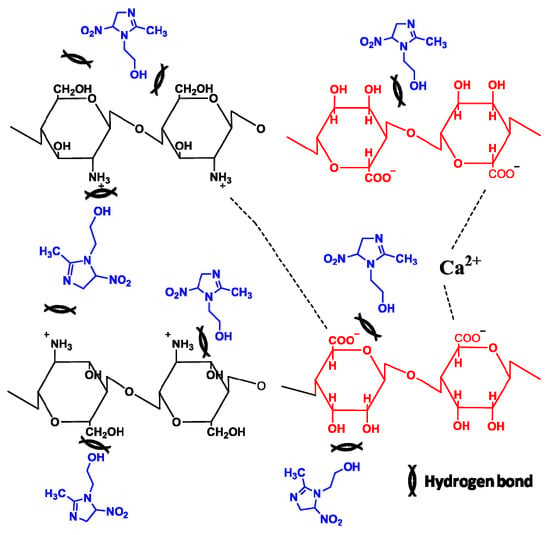
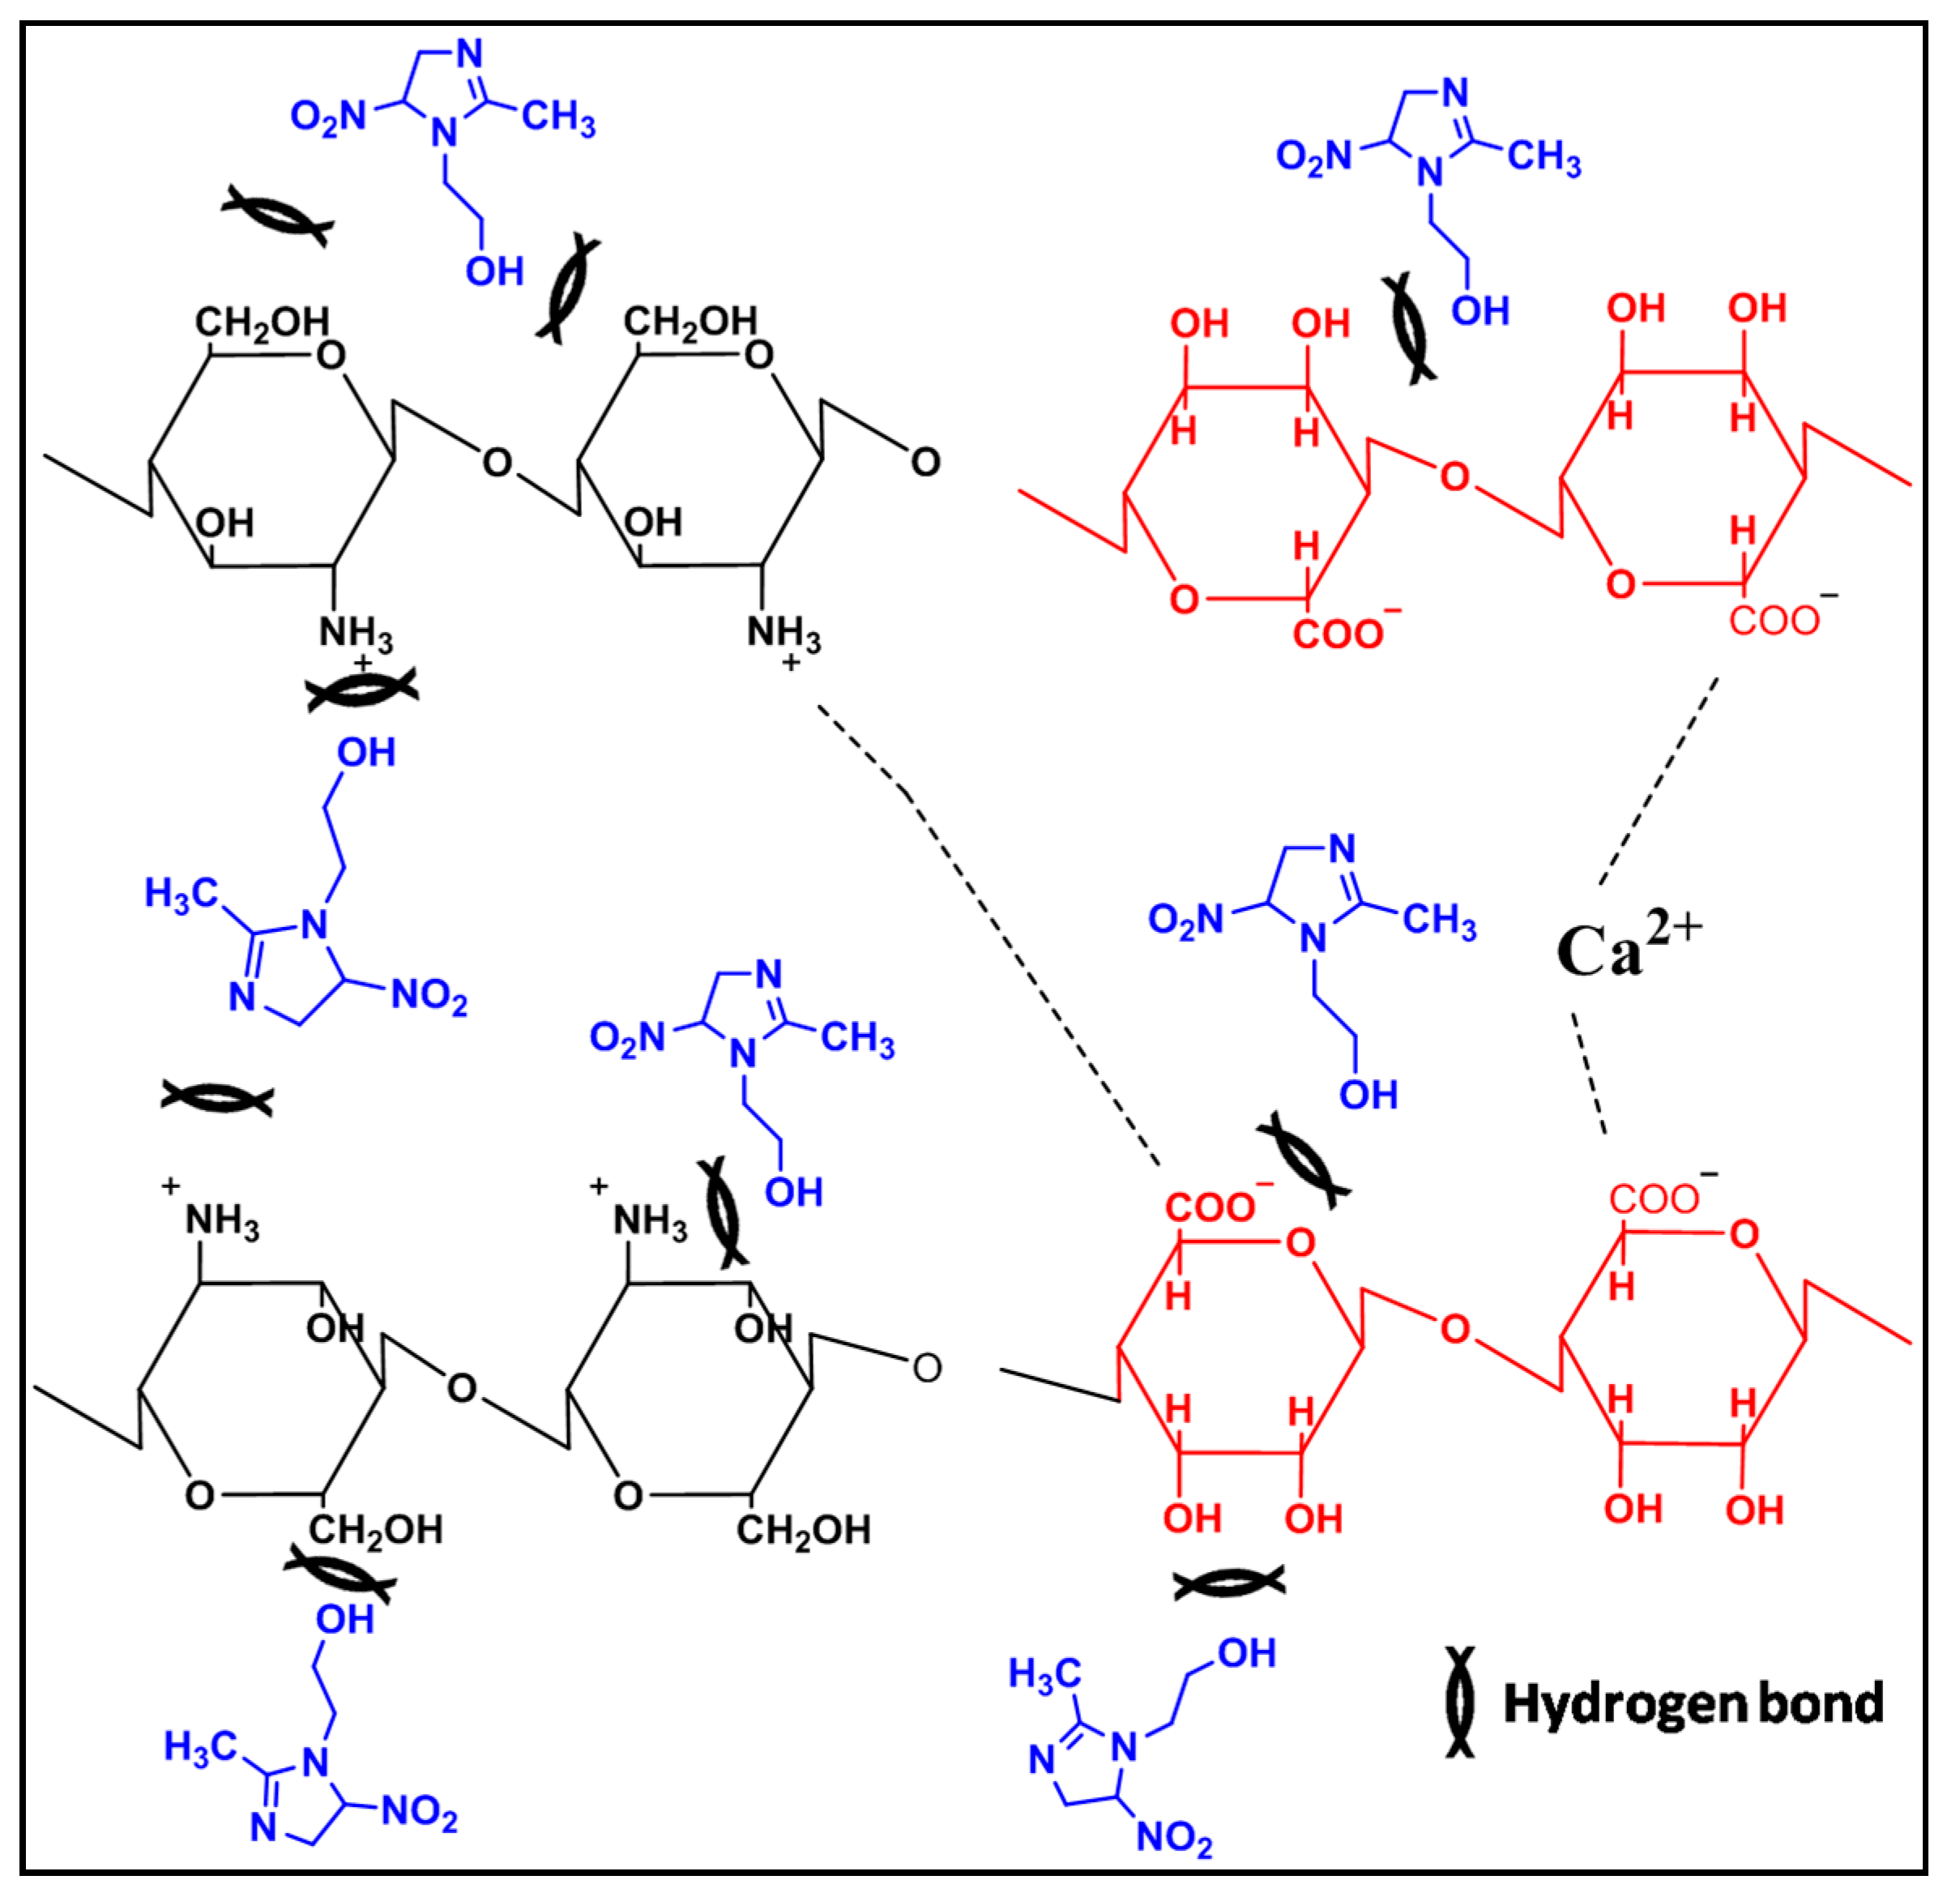
3.10. Interactions between Chemical Components of MET-CS-AlgNPs Nanocomposites

Possible interaction between the components of the nanocomposites is shown in Figure 15. From the Figure, it can be seen that CS and Alg chains polymers are electrostatically held between positive charges of CS (protonated by acetic acid) and negative charges of Alg [54]. Moreover, calcium cations interact with negative charges of Alg. The structure of MET contains hydroxide (OH–) and nitro (NO2–) groups, which led to the formation of different hydrogen bonds with CS and Alg polymers (Figure 15).

3.11. Release Properties of MET from MET-CS-AlgNPs Nanocomposites

The release profiles of MET-loaded CS-AlgNPs were obtained at 0.1M HCl (pH 1.2, to simulate physiological environments in the stomach). As shown in Figure 16, free MET was initially released very rapidly and almost 95% was released within 3.3 h for MAC 5 nanocomposite. This phenomenon is called the burst effect, and it may be due to the presence of the free drug in the nanocomposite. The MET release process from MAC 8, MAC 21 and MAC 19 nanocomposites was observed in two stages with sustained release properties. After 23 h, 90% of the MET was released from the MAC 19, whereas, after 40 hours, 90%, of the MET was released from the MAC 8 and MAC 21. The MAC 8 nanocomposite reached 97% release after 63 h. The MET release at 0.1M HCl could be explained by the enhanced solubility of CS at lower pH (1.2),which in turn promoted the diffusion of the MET through the pores of the AlgNPs matrix into the media [55,56]. These results suggest that the MET-CS-AlgNPs nanocomposites can be used in oral or intravenous administration.
The release kinetics of MET from MAC 8, MAC 21, MAC 19, and MAC 5 nanocomposites in 0.1M HCl were evaluated by fitting the data to various kinetic models (Table 7). Based on the highest adjusted R2, the best fitted model for all MAC 8, MAC 21, MAC 19, and MAC 5 nanocomposites was the second kinetic model with R2 values of 0.988, 0.956, 0.990 and 0.977, respectively.

4. Conclusions

For the multiple linear regression analysis, the mathematical models for LE, particle size and zeta potential were developed using the responsesurface methodology to formulate the input parameters, which were Alg, CS and CaCl2 concentrations. Selected mathematical models showed that the developed response surface methodology models werestatistically significant and suitable for all conditions to have higher and adjusted R² values. High correlation values were determined between the experimental data and predicted ones.The concentrations of Alg, CS and CaCl2 with values of 350, 150 and 40 mg, respectively, were determined as the optimum conditions, resulting in the maximum LE (46.04%), the minimum particle size (164 nm) and the optimum zeta potential (−9.25 mV). The verification experiment was carried out to check the validity of the developed mathematical model that predicted LE, particle size and zeta potential within the range of 10% error limit and the prepared nanocomposites were generally stable.
In vitro MET release study of selected formulations; MAC 8, MAC 21, MAC 19, and MAC 5 showed 97%, 90%, 90% and 99% release in 60, 40, 20 and 10h, respectively. These results indicate that the nanocomposites could be effective in sustaining the MET release for a prolonged period.

Supplementary Materials

The following are available online at https://www.mdpi.com/2073-4360/12/4/772/s1, Figure S1: Normal Plot of the Standardized effects toward LE (A), particles size (B) and zeta potential (C); Figure S2: Normal probability plots for LE (A), particles size (B), and zeta potential (C); Figure S3: Residuals versus fitted value for LE (A), particles size (B), and zeta potential (C); Figure S4: Residuals versus observation order for LE (A), particles size (B) and zeta potential (C).

Author Contributions

H.A.K.S., Methodology, Formal analysis, Writing—original draft; S.H.H.-A.-A., Supervision, Funding acquisition; M.Z.H., Funding acquisition; Z.A.; R.A. and S.M.A., review & editing. All authors have read and agreed to the published version of the manuscript.

Funding

The author would like to thank the Faculty of Pharmacy, Isra University and Universiti Putra Malaysia for Grant Putra Berimpak, UPM/800-3/3/1/GPB/2019/9678800, Vot. No. 9678800 for providing funding for part of this research. This study was also supported by Hikma Pharmaceuticals Research and Development Department.

Conflicts of Interest

The authors report no conflict of interest in this work.

References

  1. Abdallah, I.; Ibrahim, A.; Ibrahim, N.; Rizk, M.; Tawakkol, S. Simultaneous determination of atenolol and nifedipine by using spectrophotometric method with multivariate calibration and HPLC method implementing “design of experiment”. Pharm. Anal. Acta 2015, 6, 2. [Google Scholar]
  2. Agrahari, V.; Meng, J.; Zhang, T.; Youan, B.-B.C. Application of design of experiment and simulation methods to liquid chromatography analysis of topical HIV microbicides stampidine and HI443. J. Anal. Bioanal. Tech. 2014, 5, 180. [Google Scholar] [PubMed]
  3. Lewis, G.A.; Mathieu, D.; Phan-Tan-Luu, R. Pharmaceutical Experimental Design; CRC Press: Boca Raton, FL, USA, 1998. [Google Scholar]
  4. Rani, A.P.; Hema, V. Full factorial design in formulation of lamotrigine suspension using locust bean gum. Int. J. Chem. Sci. 2013, 11, 751–760. [Google Scholar]
  5. Kumar, R.S.; Yagnesh, T.N.S.; Kumar, V.G. Optimisation of ibuprofen fast dissolving tablets employing starch xanthate using 23 factorial design. Int. J. Appl. Pharm. 2017, 9, 51–59. [Google Scholar] [CrossRef]
  6. Box, G.E.; Hunter, J.S. The 2 k—P fractional factorial designs. Technometrics 1961, 3, 311–351. [Google Scholar] [CrossRef]
  7. Gunst, R.F.; Mason, R.L. Fractional factorial design. Wiley Interdiscip. Rev. Comput. Stat. 2009, 1, 234–244. [Google Scholar] [CrossRef]
  8. Shahabadi, S.M.S.; Reyhani, A. Optimization of operating conditions in ultrafiltration process for produced water treatment via the full factorial design methodology. Sep. Purif. Technol. 2014, 132, 50–61. [Google Scholar] [CrossRef]
  9. Salea, R.; Widjojokusumo, E.; Hartanti, A.W.; Veriansyah, B.; Tjandrawinata, R.R. Supercritical fluid carbon dioxide extraction of Nigella sativa (black cumin) seeds using taguchi method and full factorial design. Biochem. Compd. 2013, 1, 1. [Google Scholar] [CrossRef] [Green Version]
  10. Jacques, P.; Hbid, C.; Destain, J.; Razafindralambo, H.; Paquot, M.; De Pauw, E.; Thonart, P. Optimization of biosurfactant lipopeptide production from Bacillus subtilis S499 by Plackett-Burman design. Appl. Biothem. Biotechnol. 1999, 77, 223–233. [Google Scholar] [CrossRef]
  11. Ahuja, S.; Ferreira, G.; Moreira, A. Application of plackett-Burman design and response surface methodology to achieve exponential growth for aggregated shipworm bacterium. Biotechnol. Bioeng. 2004, 85, 666–675. [Google Scholar] [CrossRef]
  12. Sarlak, N.; Nejad, M.A.F.; Shakhesi, S.; Shabani, K. Effects of electrospinning parameters on titanium dioxide nanofibers diameter and morphology: An investigation by Box–Wilson central composite design (CCD). Chem. Eng. J. 2012, 210, 410–416. [Google Scholar] [CrossRef]
  13. Wsól, V.; Fell, A.F. Central composite design as a powerful optimisation technique for enantioresolution of the rac-11-dihydrooracin—The principal metabolite of the potential cytostatic drug oracin. J. Biochem. Biophys. Methods 2002, 54, 377–390. [Google Scholar] [CrossRef]
  14. Ferreira, S.C.; Bruns, R.; Ferreira, H.; Matos, G.; David, J.; Brandao, G.; da Silva, E.P.; Portugal, L.; Dos Reis, P.; Souza, A. Box-Behnken design: An alternative for the optimization of analytical methods. Anal. Chim. Acta 2007, 597, 179–186. [Google Scholar] [CrossRef] [PubMed]
  15. Tak, B.-Y.; Tak, B.-S.; Kim, Y.-J.; Park, Y.-j.; Yoon, Y.-H.; Min, G.-H. Optimization of color and COD removal from livestock wastewater by electrocoagulation process: Application of Box–Behnken design (BBD). J. Ind. Eng. Chem. 2015, 28, 307–315. [Google Scholar] [CrossRef] [Green Version]
  16. Thirugnanasambandham, K.; Sivakumar, V.; Shine, K. Optimization of reverse osmosis treatment process to reuse the distillery wastewater using Taguchi design. Desalin. Water Treat. 2016, 57, 24222–24230. [Google Scholar] [CrossRef]
  17. Luo, W.; Pla-Roca, M.; Juncker, D. Taguchi design-based optimization of sandwich immunoassay microarrays for detecting breast cancer biomarkers. Anal. Chem. 2011, 83, 5767–5774. [Google Scholar] [CrossRef]
  18. O’shea, N.; Rößle, C.; Arendt, E.; Gallagher, E. Modelling the effects of orange pomace using response surface design for gluten-free bread baking. Food Chem. 2015, 166, 223–230. [Google Scholar] [CrossRef]
  19. Lesch, S. Sensor-directed response surface sampling designs for characterizing spatial variation in soil properties. Comput. Electron. Agric. 2005, 46, 153–179. [Google Scholar] [CrossRef]
  20. Chowdary, K.; Shankar, K.R. Optimization of pharmaceutical product formulation by factorial designs: Case studies. J. Pharm.Res. 2016, 15, 105–109. [Google Scholar] [CrossRef] [Green Version]
  21. Miller, A.J. Selection of subsets of regression variables. J. R. Stat. Soc. Ser. A Gen. 1984, 147, 389–410. [Google Scholar] [CrossRef]
  22. Wagner, J.M.; Shimshak, D.G. Stepwise selection of variables in data envelopment analysis: Procedures and managerial perspectives. Eur. J. Oper. Res. 2007, 180, 57–67. [Google Scholar] [CrossRef]
  23. Effroymson, M. Multiple regression analysis. In Mathematical Methods for Digital Computers; Ralson, A., Wilf, H.S., Eds.; John Wiley and Sons, Inc.: New York, NY, USA, 1960. [Google Scholar]
  24. Draper, N.R.; Smith, H. Applied Regression Analysis; John Wiley & Sons: Hoboken, NJ, USA, 1998; Volume 326. [Google Scholar]
  25. Gref, R.; Minamitake, Y.; Peracchia, M.T.; Trubetskoy, V.; Torchilin, V.; Langer, R. Biodegradable long-circulating polymeric nanospheres. Science 1994, 263, 1600–1603. [Google Scholar] [CrossRef] [PubMed] [Green Version]
  26. Jawahar, N.; Meyyanathan, S. Polymeric nanoparticles for drug delivery and targeting: A comprehensive review. Int. J. HealthAllied Sci. 2012, 1, 217. [Google Scholar] [CrossRef]
  27. Allemann, E.; Gurny, R.; Doelker, E. Drug-loaded nanoparticles: Preparation methods and drug targeting issues. Eur. J. Pharm. Biopharm. 1993, 39, 173–191. [Google Scholar]
  28. Yih, T.; Al-Fandi, M. Engineered nanoparticles as precise drug delivery systems. J. Cell. Biochem. 2006, 97, 1184–1190. [Google Scholar] [CrossRef]
  29. Meyer, M. Bioavailability of drugs and bioequivalence. Encycl. Pharm. Technol. 1998, 1. [Google Scholar] [CrossRef] [Green Version]
  30. Li, T.; Shi, X.W.; Du, Y.M.; Tang, Y.F. Quaternized chitosan/alginate nanoparticles for protein delivery. J. Biomed. Mater. Res. Part A Off. J. Soc. Biomater. Jpn. Soc. Biomater. Aust. Soc. Biomater. Korean Soc. Biomater. 2007, 83, 383–390. [Google Scholar] [CrossRef]
  31. Azhar, F.F.; Olad, A. A study on sustained release formulations for oral delivery of 5-fluorouracil based on alginate–chitosan/montmorillonite nanocomposite systems. Appl. Clay Sci. 2014, 101, 288–296. [Google Scholar] [CrossRef]
  32. Dai, Y.N.; Li, P.; Zhang, J.P.; Wang, A.Q.; Wei, Q. Swelling characteristics and drug delivery properties of nifedipine-loaded pH sensitive alginate–chitosan hydrogel beads. J. Biomed. Mater. Res. Part B Appl. Biomater. Off. J. Soc. Biomater. Jpn. Soc. Biomater. Aust. Soc. Biomater. Korean Soc. Biomater. 2008, 86, 493–500. [Google Scholar] [CrossRef]
  33. Taleb, M.F.A.; Alkahtani, A.; Mohamed, S.K. Radiation synthesis and characterization of sodium alginate/chitosan/hydroxyapatite nanocomposite hydrogels: A drug delivery system for liver cancer. Polym. Bull. 2015, 72, 725–742. [Google Scholar] [CrossRef]
  34. Dubnika, A.; Loca, D.; Berzina-Cimdina, L. Functionalized hydroxyapatite scaffolds coated with sodium alginate and chitosan for controlled drug delivery. Proc. Est. Acad. Sci. 2012, 61, 193. [Google Scholar] [CrossRef]
  35. Freiberg, S.; Zhu, X.X. Polymer microspheres for controlled drug release. Int. J. Pharm. 2004, 282, 1–18. [Google Scholar] [CrossRef] [PubMed]
  36. Mayol, L.; Borzacchiello, A.; Guarino, V.; Serri, C.; Biondi, M.; Ambrosio, L. Design of electrospayed non-spherical poly (l-lactide-co-glicolide) microdevices for sustained drug delivery. J. Mater. Sci. Mater. Med. 2014, 25, 383–390. [Google Scholar] [CrossRef] [PubMed] [Green Version]
  37. Deshmukh, R.K.; Naik, J.B. Aceclofenac microspheres: Quality by design approach. Mater. Sci. Eng. C 2014, 36, 320–328. [Google Scholar] [CrossRef] [PubMed]
  38. Jiang, F.; Wang, D.-P.; Ye, S.; Zhao, X. Strontium-substituted, luminescent and mesoporous hydroxyapatite microspheres for sustained drug release. J. Mater. Sci. Mater. Med. 2014, 25, 391–400. [Google Scholar] [CrossRef] [PubMed]
  39. Shinde, U.A.; Parmar, S.J.; Easwaran, S. Metronidazole-loaded nanostructured lipid carriers to improve skin deposition and retention in the treatment of rosacea. Drug Dev. Ind. Pharm. 2019, 45, 1039–1051. [Google Scholar] [CrossRef]
  40. Vazini, H. Anti-Trichomonas vaginalis activity of nano Micana cordifolia and Metronidazole: An in vitro study. J. Parasit. Dis. 2017, 41, 1034–1039. [Google Scholar] [CrossRef]
  41. Nasongkla, N.; Tanesanukul, C.; Nilyok, S.; Wongsuwan, N.; Tancharoen, S.; Nilanont, S. Nano-coating of metronidazole on dental implants for antibacterial application. In Proceedings of the 2018 IEEE 12th International Conference on Nano/Molecular Medicine and Engineering (NANOMED), Waikiki Beach, HI, USA, 2–5 December 2018; pp. 59–62. [Google Scholar]
  42. Nasseh, N.; Barikbin, B.; Taghavi, L.; Nasseri, M.A. Adsorption of metronidazole antibiotic using a new magnetic nanocomposite from simulated wastewater (isotherm, kinetic and thermodynamic studies). Compos. Part B Eng. 2019, 159, 146–156. [Google Scholar] [CrossRef]
  43. Rajaonarivony, M.; Vauthier, C.; Couarraze, G.; Puisieux, F.; Couvreur, P. Development of a new drug carrier made from alginate. J. Pharm. Sci. 1993, 82, 912–917. [Google Scholar] [CrossRef]
  44. Loquercio, A.; Castell-Perez, E.; Gomes, C.; Moreira, R.G. Preparation of chitosan-alginate nanoparticles for trans-cinnamaldehyde entrapment. J. Food Sci. 2015, 80, N2305–N2315. [Google Scholar] [CrossRef]
  45. Montgomery, D.C. Design and Analysis of Experiments; John Wiley & Sons: Hoboken, NJ, USA, 2001; Volume 52, pp. 218–286. [Google Scholar]
  46. Trivedi, M.K.; Branton, A.; Trivedi, D.; Nayak, G. Characterization of physicochemical and thermal properties of chitosan and sodium alginate after biofield treatment. Pharm. Anal. Acta 2015, 6. [Google Scholar] [CrossRef] [Green Version]
  47. Khan, G.; Yadav, S.K.; Patel, R.R.; Nath, G.; Bansal, M.; Mishra, B. Development and evaluation of biodegradable chitosan films of metronidazole and levofloxacin for the management of periodontitis. AAPS Pharm. Sci. Tech. 2016, 17, 1312–1325. [Google Scholar] [CrossRef] [PubMed] [Green Version]
  48. Kumari, S.D.C.; Tharani, C.; Narayanan, N.; Kumar, C.S. Formulation and characterization of Methotrexate loaded sodium alginate chitosan Nanoparticles. Indian J. Res. Pharm. Biotechnol. 2013, 1, 915. [Google Scholar]
  49. De Souza, N.; de Souza, F.; Basílio, I.; Medeiros, A.; Oliveira, E.; Santos, A.; Macwdo, R.; Macędo, R. Thermal stability of metronidazole drug and tablets. J. Therm. Anal. Calorim. 2003, 72, 535–538. [Google Scholar] [CrossRef]
  50. Anand, M.; Sathyapriya, P.; Maruthupandy, M.; Beevi, A.H. Synthesis of chitosan nanoparticles by TPP and their potential mosquito larvicidal application. Front. Lab. Med. 2018, 2, 72–78. [Google Scholar] [CrossRef]
  51. Kulig, D.; Zimoch-Korzycka, A.; Jarmoluk, A.; Marycz, K. Study on alginate–chitosan complex formed with different polymers ratio. Polymers 2016, 8, 167. [Google Scholar] [CrossRef]
  52. Neto, C.d.T.; Giacometti, J.; Job, A.; Ferreira, F.; Fonseca, J.; Pereira, M. Thermal analysis of chitosan based networks. Carbohydr. Polym. 2005, 62, 97–103. [Google Scholar] [CrossRef]
  53. Mukhopadhyay, P.; Paban Kundu, P. Chitosan-graft-PAMAM/alginate core-shell nanoparticles: A safe and promising oral insulin carrier in Animal Model. RSC Adv. 2015, 5. [Google Scholar] [CrossRef]
  54. Dubey, R.; Bajpai, J.; Bajpai, A. Chitosan-alginate nanoparticles (CANPs) as potential nanosorbent for removal of Hg (II) ions. Environ. Nanotechnol. Monit. Manag. 2016, 6, 32–44. [Google Scholar] [CrossRef]
  55. Patel, B.K.; Parikh, R.H.; Aboti, P.S. Development of oral sustained release rifampicin loaded chitosan nanoparticles by design of experiment. J. Drug Deliv. 2013, 2013, 370938. [Google Scholar] [CrossRef]
  56. Sorasitthiyanukarn, F.N.; Muangnoi, C.; Bhuket, P.R.N.; Rojsitthisak, P.; Rojsitthisak, P. Chitosan/alginate nanoparticles as a promising approach for oral delivery of curcumin diglutaric acid for cancer treatment. Mater. Sci. Eng. C 2018, 93, 178–190. [Google Scholar] [CrossRef] [PubMed]
  57. Dong, L.; Yan, L.; Hou, W.-G.; Liu, S.-J. Synthesis and release behavior of composites of camptothecin and layered double hydroxide. J. Solid State Chem. 2010, 183, 1811–1816. [Google Scholar] [CrossRef]
  58. Ho, Y.-S.; Ofomaja, A.E. Pseudo-second-order model for lead ion sorption from aqueous solutions onto palm kernel fiber. J. Hazard. Mater. 2006, 129, 137–142. [Google Scholar] [CrossRef] [PubMed]
  59. Sakore, S.; Chakraborty, B. Formulation and evaluation of enalapril maleate sustained release matrix tablets. Int. J. Pharm. 2013, 4, 21–26. [Google Scholar]
Figure 1. Pareto Chart of the standardized effects toward LE (A), particle size (B) and zeta potential (C).
Polymers 12 00772 g001
Figure 2. The contour plot and response surface of the LE with variances of CaCl2, Alg and CS concentrations.
Polymers 12 00772 g002
Figure 3. The contour plot and response surface of the particle size with variances of CaCl2, Alg and CS concentrations.
Polymers 12 00772 g003
Figure 4. The contour plot and response surface of the zeta potential with variances of CaCl2, Alg and CS concentrations.
Polymers 12 00772 g004
Figure 5. Main effects plot for LE, particle size and zeta potential.
Polymers 12 00772 g005
Figure 6. Interaction effects of factors on the loading efficiency.
Polymers 12 00772 g006
Figure 7. Interaction effects of factors on the particle size.
Polymers 12 00772 g007
Figure 8. Interaction effects of factors on the zeta potential.
Polymers 12 00772 g008
Figure 9. The optimization plot for metronidazole (MET), chitosan (CS) and alginate (Alg) nanoparticles (NP) (MET-CS-AlgNPs) nanocomposites.
Polymers 12 00772 g009
Figure 10. XRD diffraction spectra of MET (A), CS-AlgNPs (B) and MET-CS-AlgNPs (C).
Polymers 12 00772 g010
Figure 11. FTIR spectra of MET (A), CS-AlgNPs (B) and MET-CS-AlgNPs (C).
Polymers 12 00772 g011
Figure 12. TGA curves of MET, CS-AlgNPs and MET-CS-AlgNPs nanocomposites.
Polymers 12 00772 g012
Figure 13. SEM micrographs of CS-AlgNPs (A) and MET-CS-AlgNPs (B) (100,000×).
Polymers 12 00772 g013
Figure 14. TEM images of MET-CS-AlgNPs (A) and their particle size distribution (B).
Polymers 12 00772 g014
Figure 15. Possible interactions between components of MET-CS-AlgNPs nanocomposites.
Polymers 12 00772 g015
Figure 16. In vitrorelease behaviors of MET from MET-CS-AlgNPs nanocomposites in the 0.1 M HCl solutions.
Polymers 12 00772 g016
Table 1. Independent parameters and their levels.
ParameterLevels (mg)
LowMediumHigh
AAlg200-400
BCS50100200
CCaCl230-60
Table 2. Composition of formulations.
Std OrderRun OrderSample CodeAlgCSCaCl2
171MAC120020030
242MAC240020060
103MAC340010060
24MAC42005060
355MAC540020030
206MAC64005060
327MAC74005060
68MAC820020060
229MAC940010060
2910MAC1020020030
3611MAC1140020060
1412MAC122005060
2513MAC132005030
514MAC1420020030
915MAC1540010030
116MAC162005030
3117MAC174005030
2618MAC182005060
319MAC1920010030
720MAC204005030
1621MAC2120010060
1122MAC2240020030
2823MAC2320010060
2724MAC2420010030
1325MAC252005030
2326MAC2640020030
3027MAC2720020060
1528MAC2820010030
3429MAC2940010060
1830MAC3020020060
1231MAC3140020060
1932MAC324005030
433MAC3320010060
834MAC344005060
3335MAC3540010030
2136MAC3640010030
Table 3. ANOVA values for loading efficiency (LE), particle size and zeta potential.
LE model
DFAdj SSAdj MSF valueCoefT ValueVIFP value
Model79585.391369.34337.9547.90867.86-0.000
Alg11771.001771.00437.07−7.385−20.911.040.000
CS1431.85431.85106.584.36110.321.040.000
CaCl21208.24208.2451.39−2.532−7.171.040.000
CS*CS12.092.090.51−0.605−0.721.030.480
Alg*CS1236.52136.529.011.2523.001.040.006
Alg*CaCl216545.516545.511615.40−13.998−40.191.010.000
CS*CaCl2122.7122.715.600.9872.371.040.026
Lack-of-fit420.775.191.35---0.283
Particle size model
Model714154820221.1202.86185.0051.90-0.000
Alg14588945889.3460.35−43.50−21.461.100.000
CS13027030270303.6744.4217.431.120.000
CaCl211957519574.9196.37−28.53−14.011.120.000
CS*CS161046103.761.23−36.54−7.831.130.000
Alg*CS119631962.619.6911.644.441.190.000
Alg*CaCl21700700.27.02−5.43−2.651.060.016
CS*CaCl211114611145.6111.81−27.64−10.571.170.000
Lack-of-fit417343.40.38---0.821
Zeta potential model
Model7399.87557.125303.51−10.501−44.19-0.000
Alg185.09385.093452.112.11921.261.070.000
CS10.2560.2561.360.1331.171.190.263
CaCl21191.991191.9911020.073.30831.941.250.000
CS*CS130.17230.172160.313.34712.661.130.000
Alg*CS10.4040.4042.150.1641.471.170.165
Alg*CaCl21181.922181.922966.57-3.182-31.091.220.000
CS*CaCl211.8551.8559.850.3443.141.050.007
Lack-of-fit30.5620.1870.99---0.432
DF: degrees of freedom, SS: sum of squares, F: F-test value and P: error variance.
Table 4. Regression model for dependent variables.
Regression ModelR-sq (%)R-sq (adj)%
LE= −46.07 + 0.3252Alg − 0.0045 CS +2.5210CaCl2 0.000108 CS*CS+0.000167Alg*CS − 0.009332Alg*CaCl2+ 0.000878 CS*CaCl298.9198.62
Size= 96.7 − 0.4660Alg + 2.856CS + 2.256CaCl2 − 0.006495CS*CS + 0.001552Alg*CS − 0.00362 Alg*CaCl2 − 0.02457CS*CaCl298.6898.19
Potential= −43.80 + 0.11391Alg − 0.1673CS + 0.8187CaCl2 + 0.000595CS*CS + 0.000022Alg*CS − 0.002121Alg*CaCl2 + 0.000305CS*CaCl299.3599.02
Table 5. Response optimization plot for different responses.
ValueAlg
(350 mg)
CS
(150 mg)
CaCl2
(40 mg)
Optimization Responses
LE46.0 ± 2.1%
Minimum Size164.71 ± 20.03 nm
Zeta potential−9.25 ± 0.51 mV
Table 6. Response optimization for LE, particle size and zeta potential.
No.AlgCSCaCl2%LEParticle Size (nm)Zeta Potential (mV)
ExpTheoError %ExpTheoError %ExpTheoError %
13001005045.043.04.71151268.7−9.5−8.96.7
22002003043.345.54.82852772.9−14.5−16.210.5
33501504048.846.06.11501659.1−10.8−11.56.1
Table 7. The correlation coefficients (R2) obtained by fitting the MET release data from MET-CS-AlgNPs nanocomposites in aqueous solutions at 0.1M HCl [57,58,59].
SamplesR2
Pseudo-First OrderPseudo-Second OrderHixson-Crowell ModelKorsmeyer-Peppas Model
MAC 80.9170.9880.7810.877
MAC 210.9030.9560.7340.882
MAC 190.9300.9900.8220.891
MAC 50.6640.9770.7870.856
Equationln(qeqt) = lnqek1tt/qt = 1/k2qe2 + t/qe M o 3 q t 3 = Kt q t q = Kt n
qe is the quantity released at equilibrium, qt is the quantity released at the time (t), Mo is the initial quantity of drug in the nanocomposite, q is the release at the infinite time and k is the rate constant of the release kinetics

