Water Footprint Assessment of Selected Polymers, Polymer Blends, Composites, and Biocomposites for Industrial Application

 ,
,
Abstract
:
1. Introduction
2. Experimental
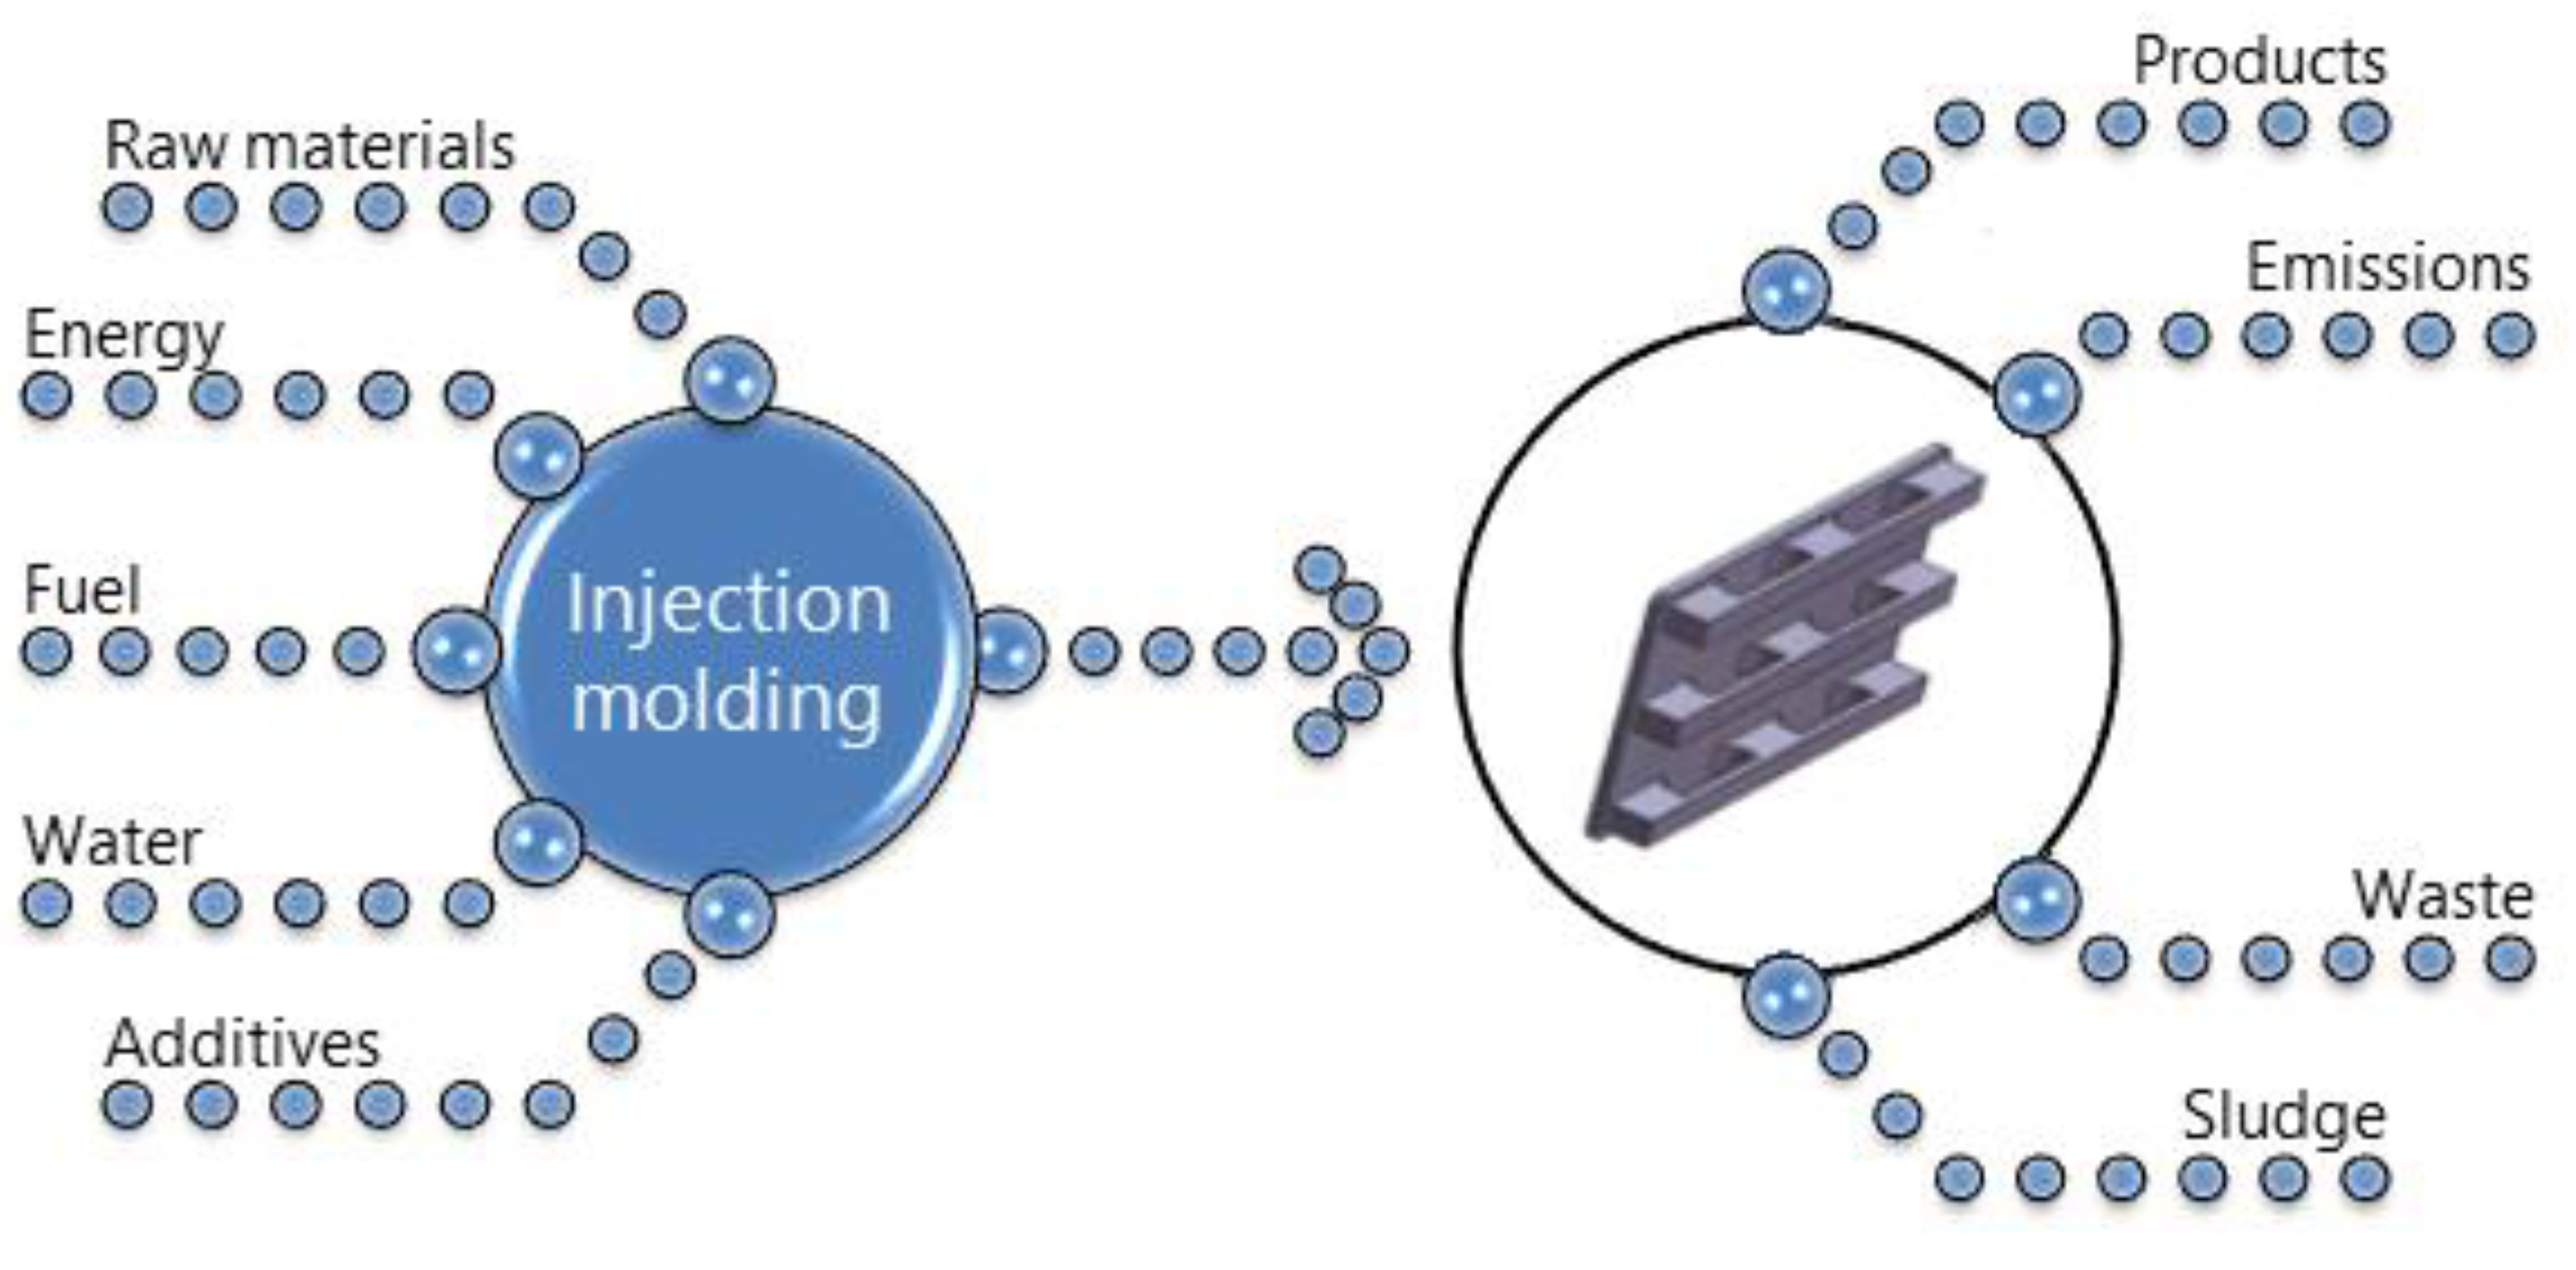
2.1. Aims and Scope of Analysis
2.2. Methodology of Water Footprint Calculation
- • establishing of goals and scope of analysis,
- • accounting of water footprint,
- • assessment of water footprint sustainability,
- • formulation of water footprint response.
- Relevance—all applied methods and data gathered for quantitative determination of environmental footprints of product should be relevant to analysis.
- Completeness—during quantitative determination of footprints, all material and energy flows, as well as other aspects, which are necessary for the compatibility with boundaries of analyzed system and requirements for the analysis and applied methods, should be considered.
- Integrity—during all steps of environmental footprint assessment of the product, compatibility with proper methodology should be maintained in order to increase integrity of analysis and comparability with similar works.
- Accuracy—all uncertainties of the system and its modelling, as well as reports related to the analysis should be limited.
- Clarity—information related to the environmental footprint of the product should be revealed in the manner that provides the recipients basis for decision-making and enables interested parties’ evaluation of their reliability and credibility.
2.3. Input Data
- polymerization of propylene is performed with 95% yield,
- 75% of the production is based on suspension polymerization,
- 25% of the production is based on gas phase polymerization,
- for both types of polymerization, 4 MJ of electric energy per kg of PP and 4 MJ of thermal energy is required.
3. Results and Discussion
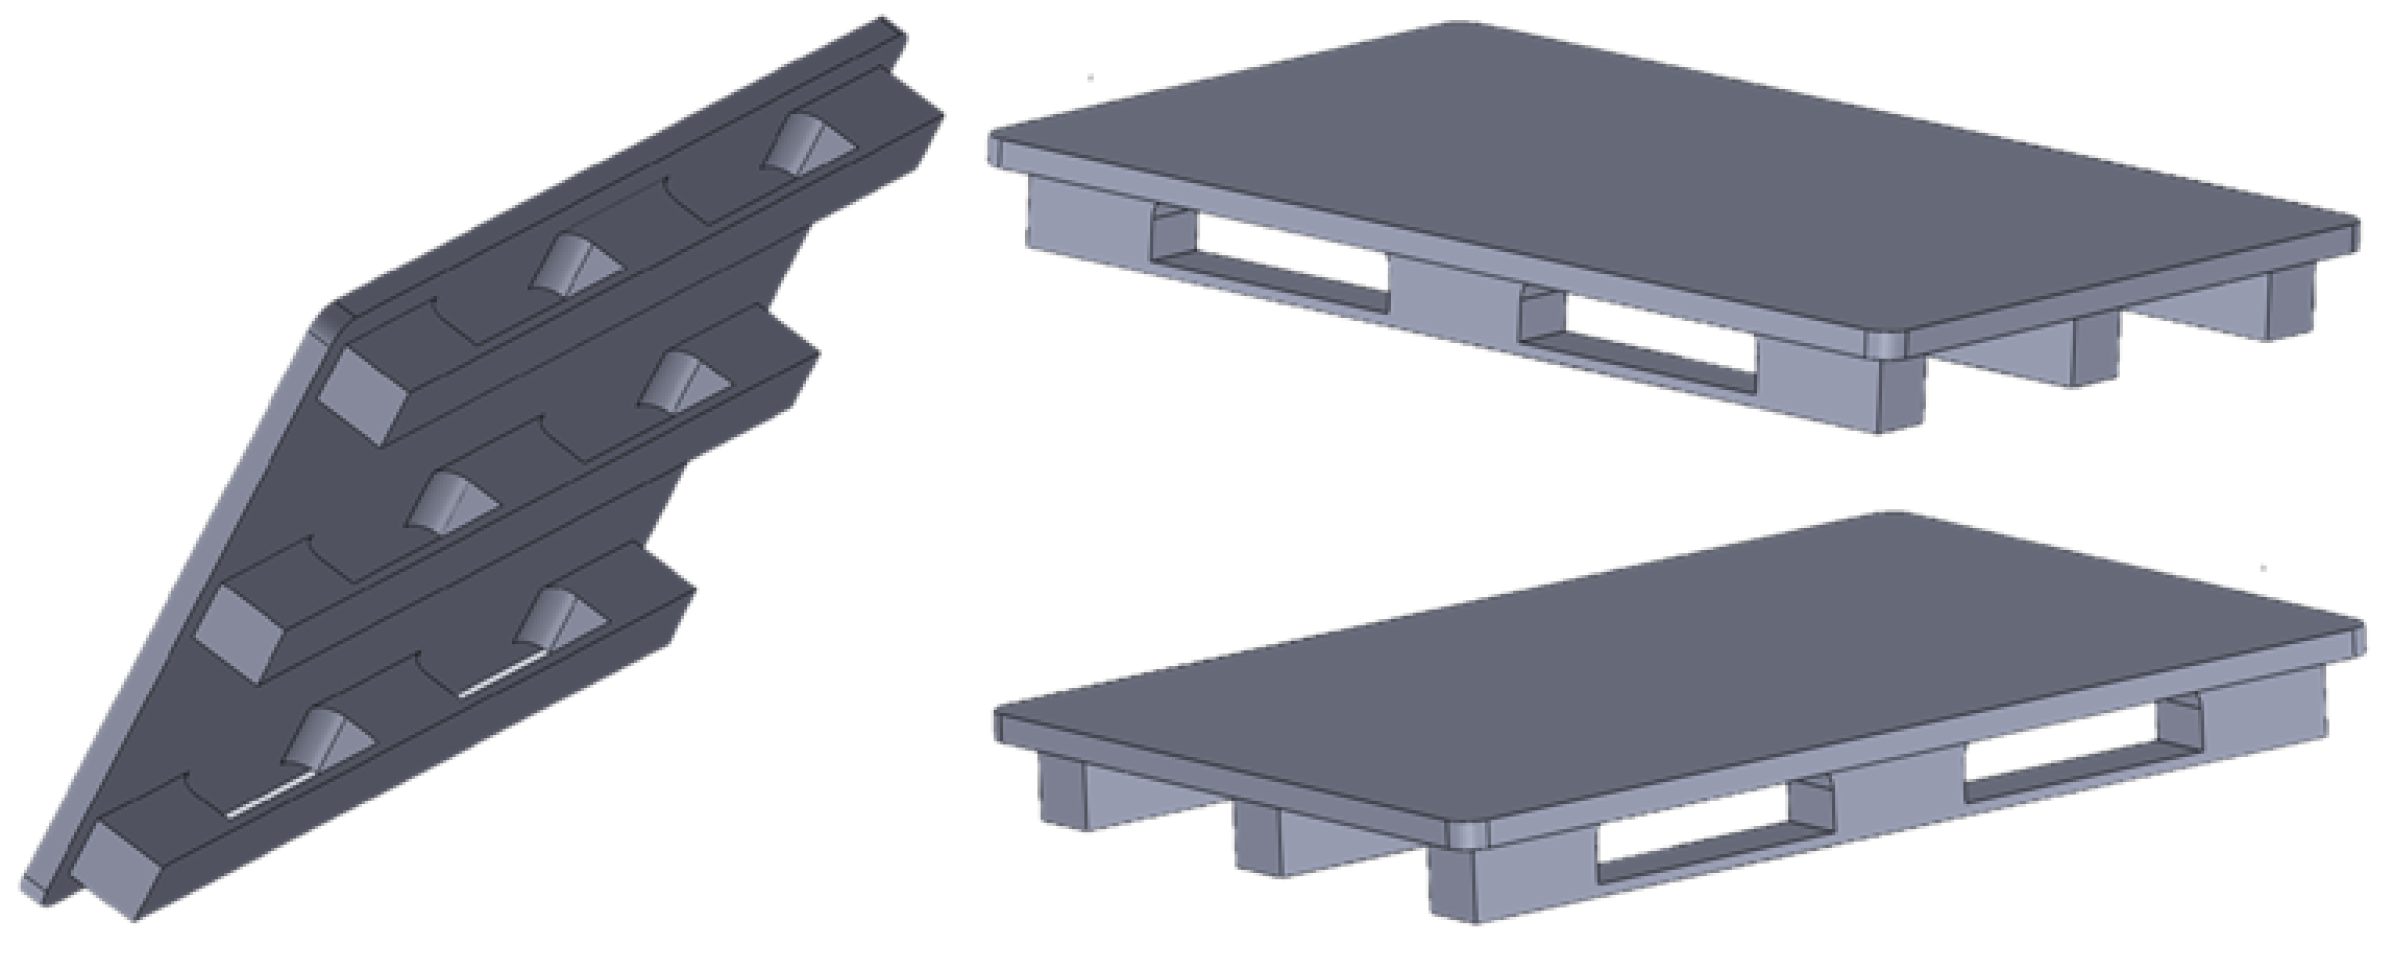
3.1. Water Footprint of EUR-Pallet
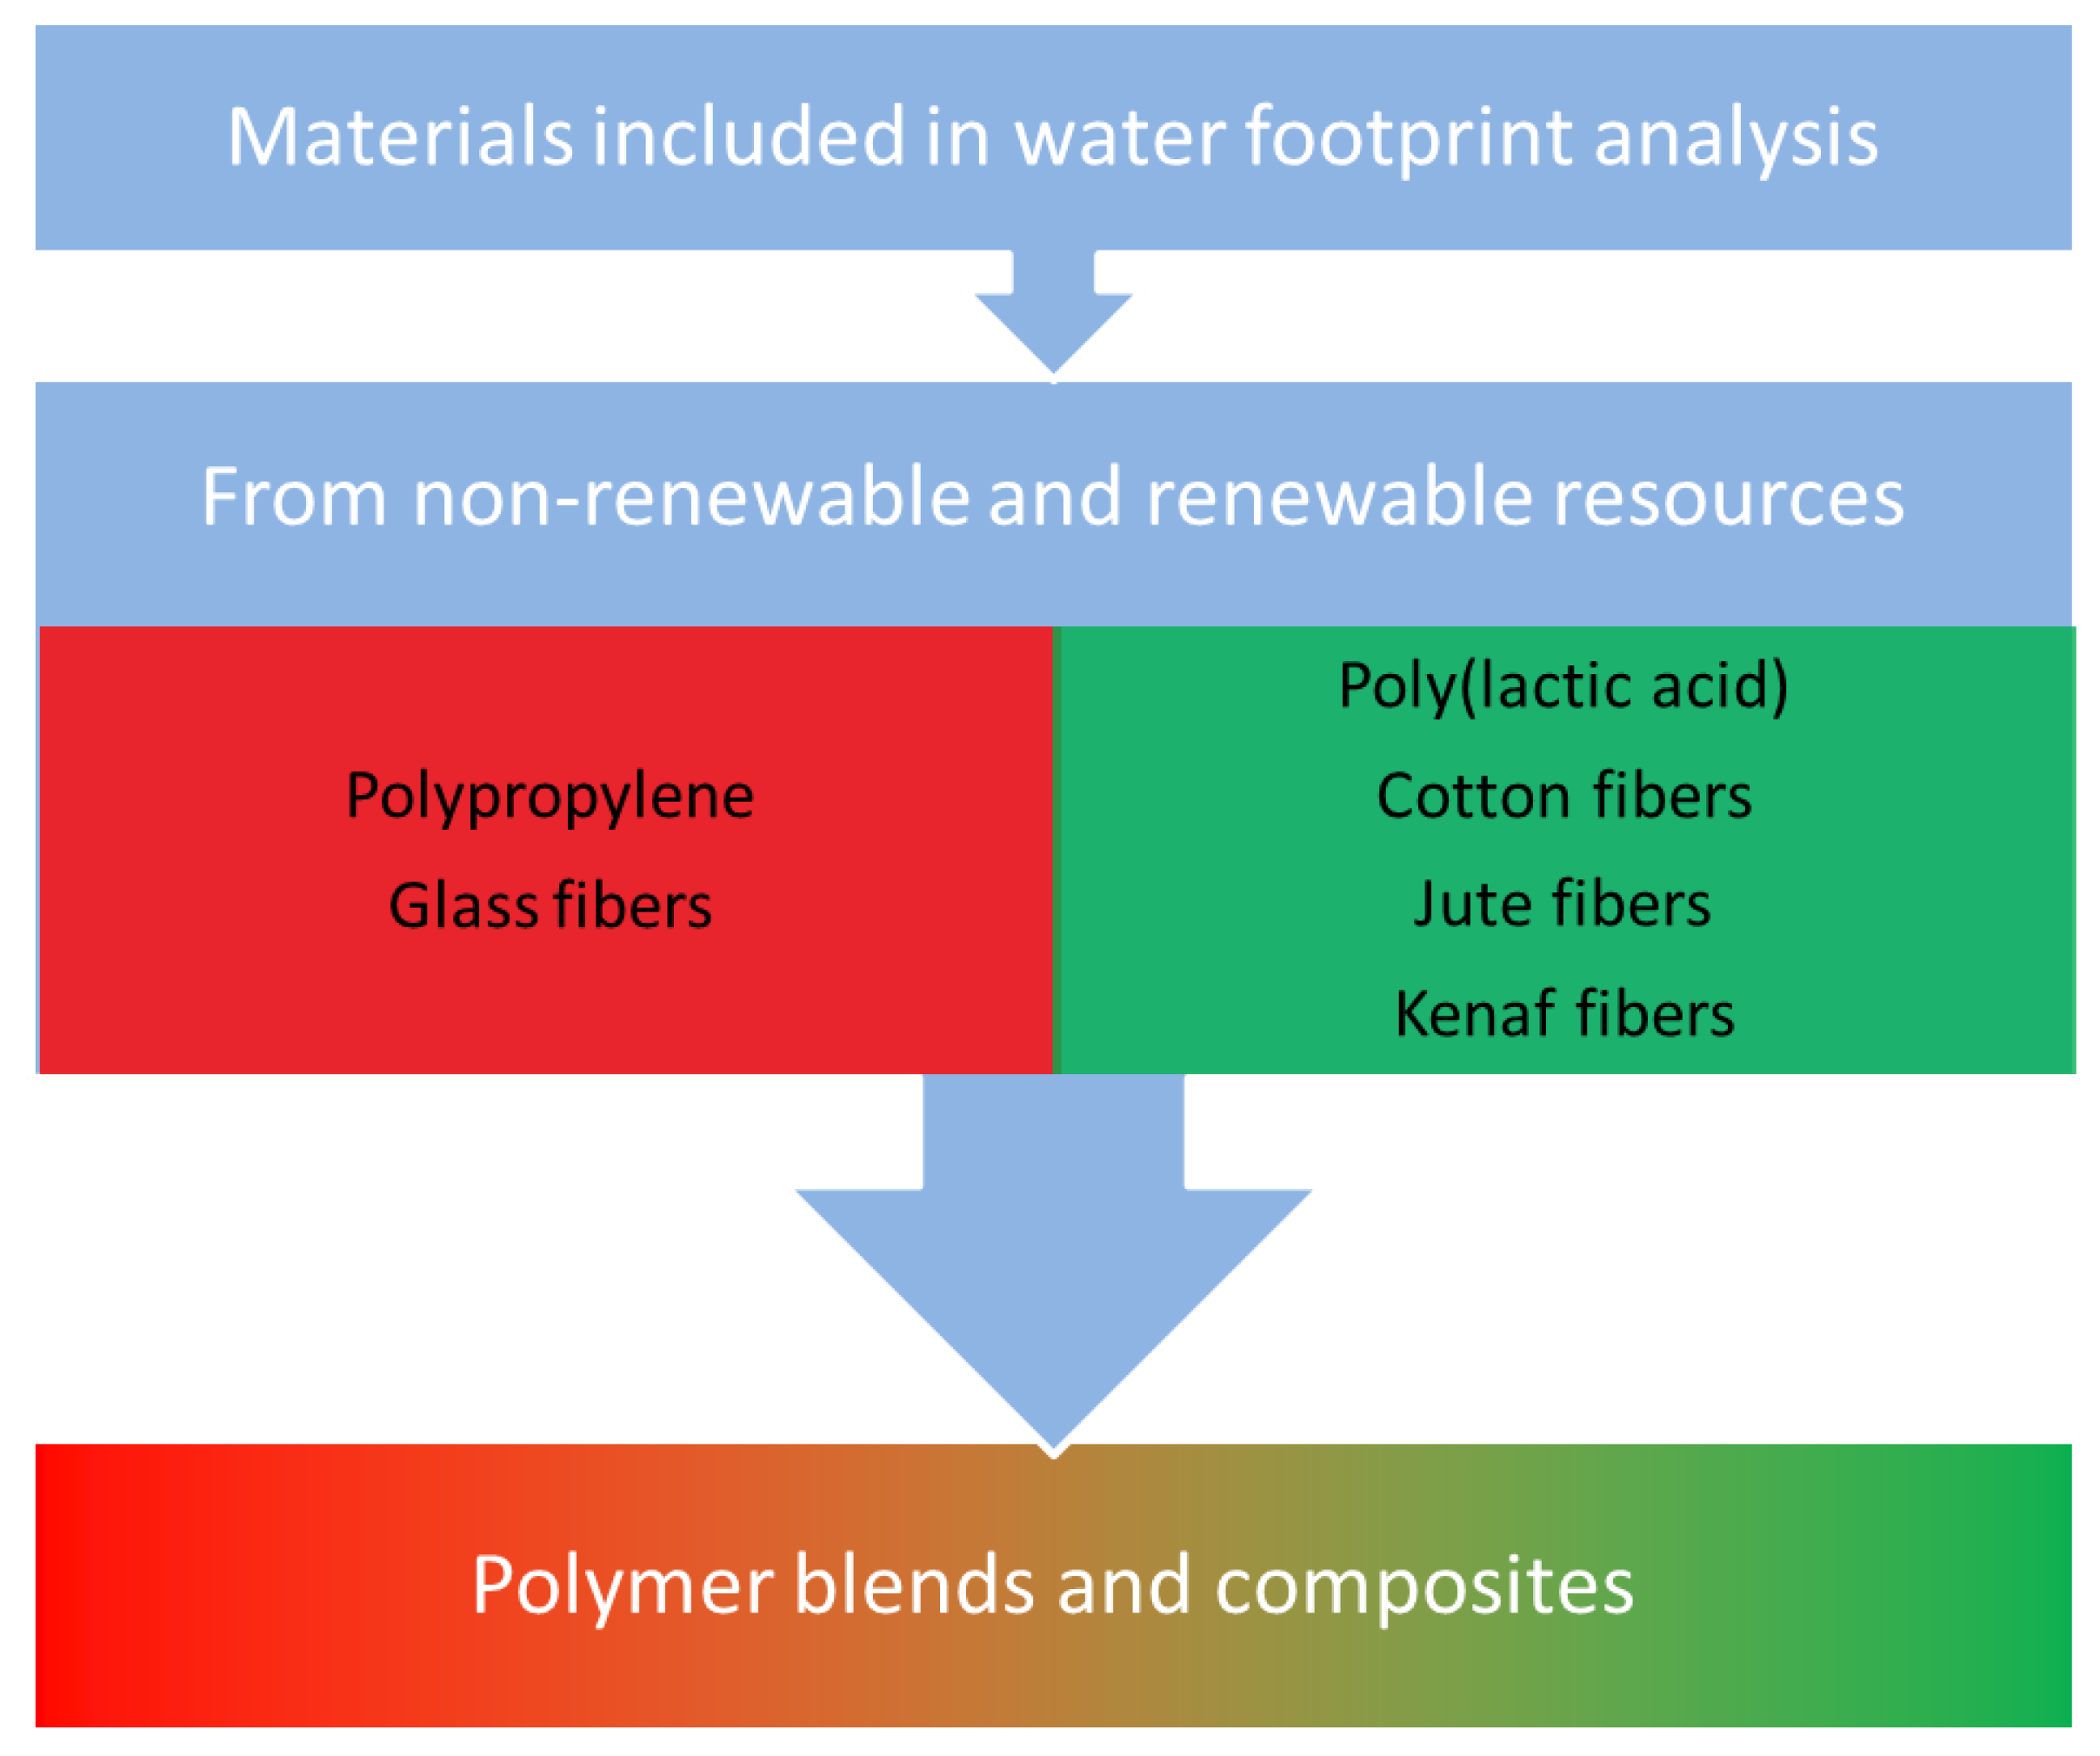
3.2. Water Footprint of Applied Raw Materials
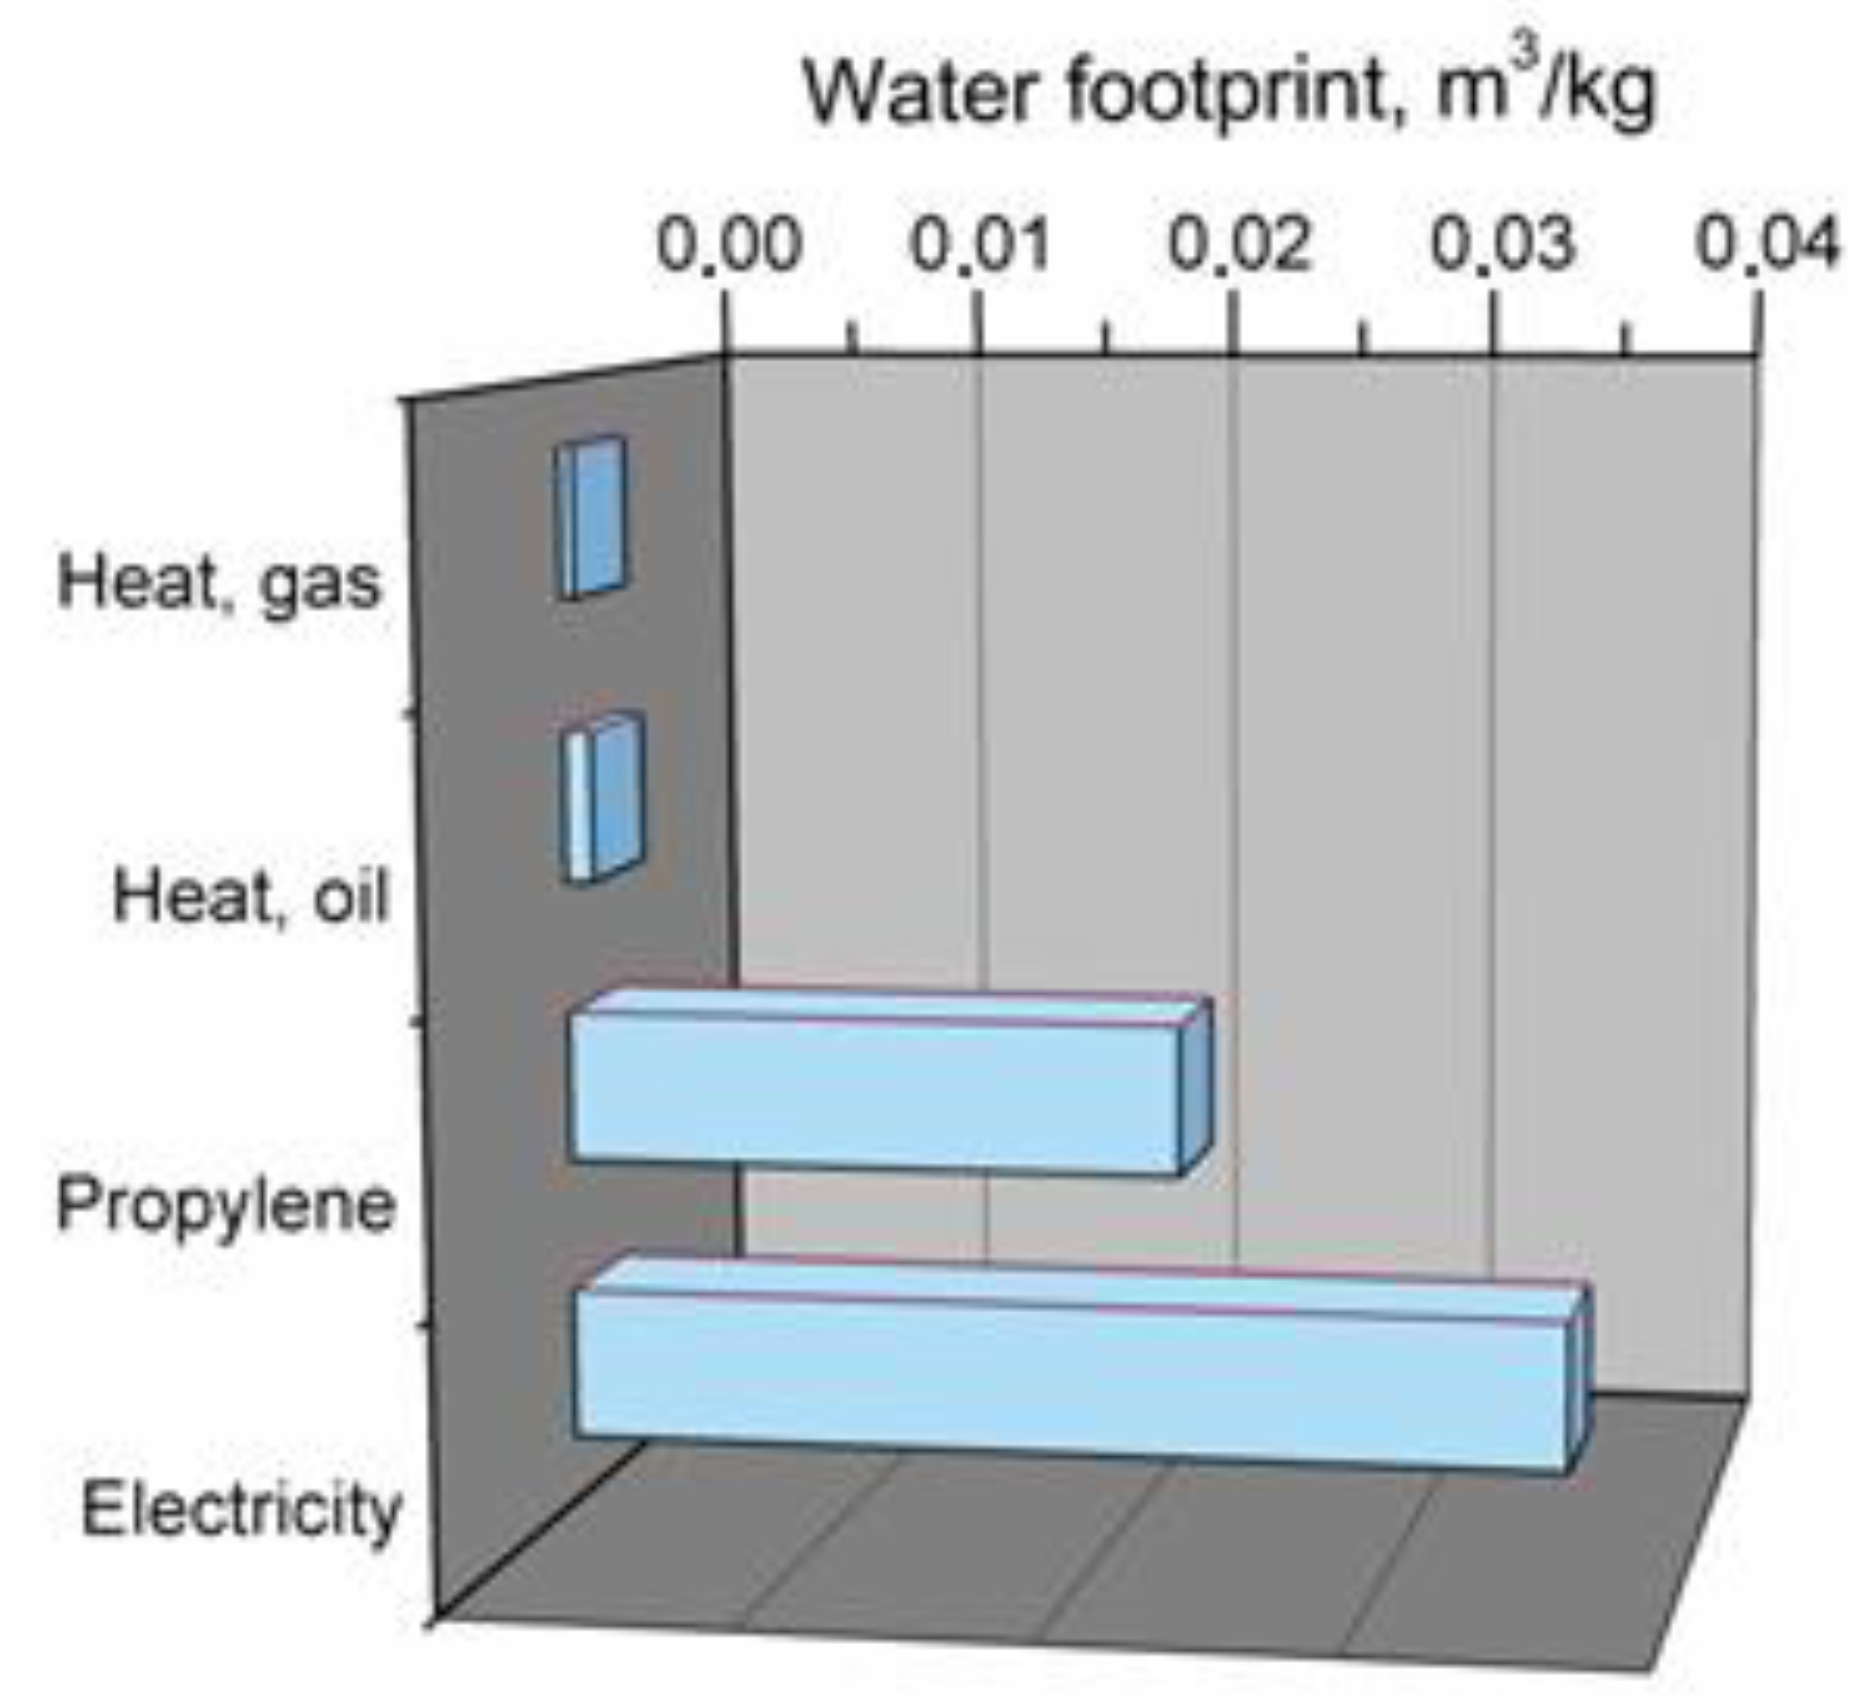
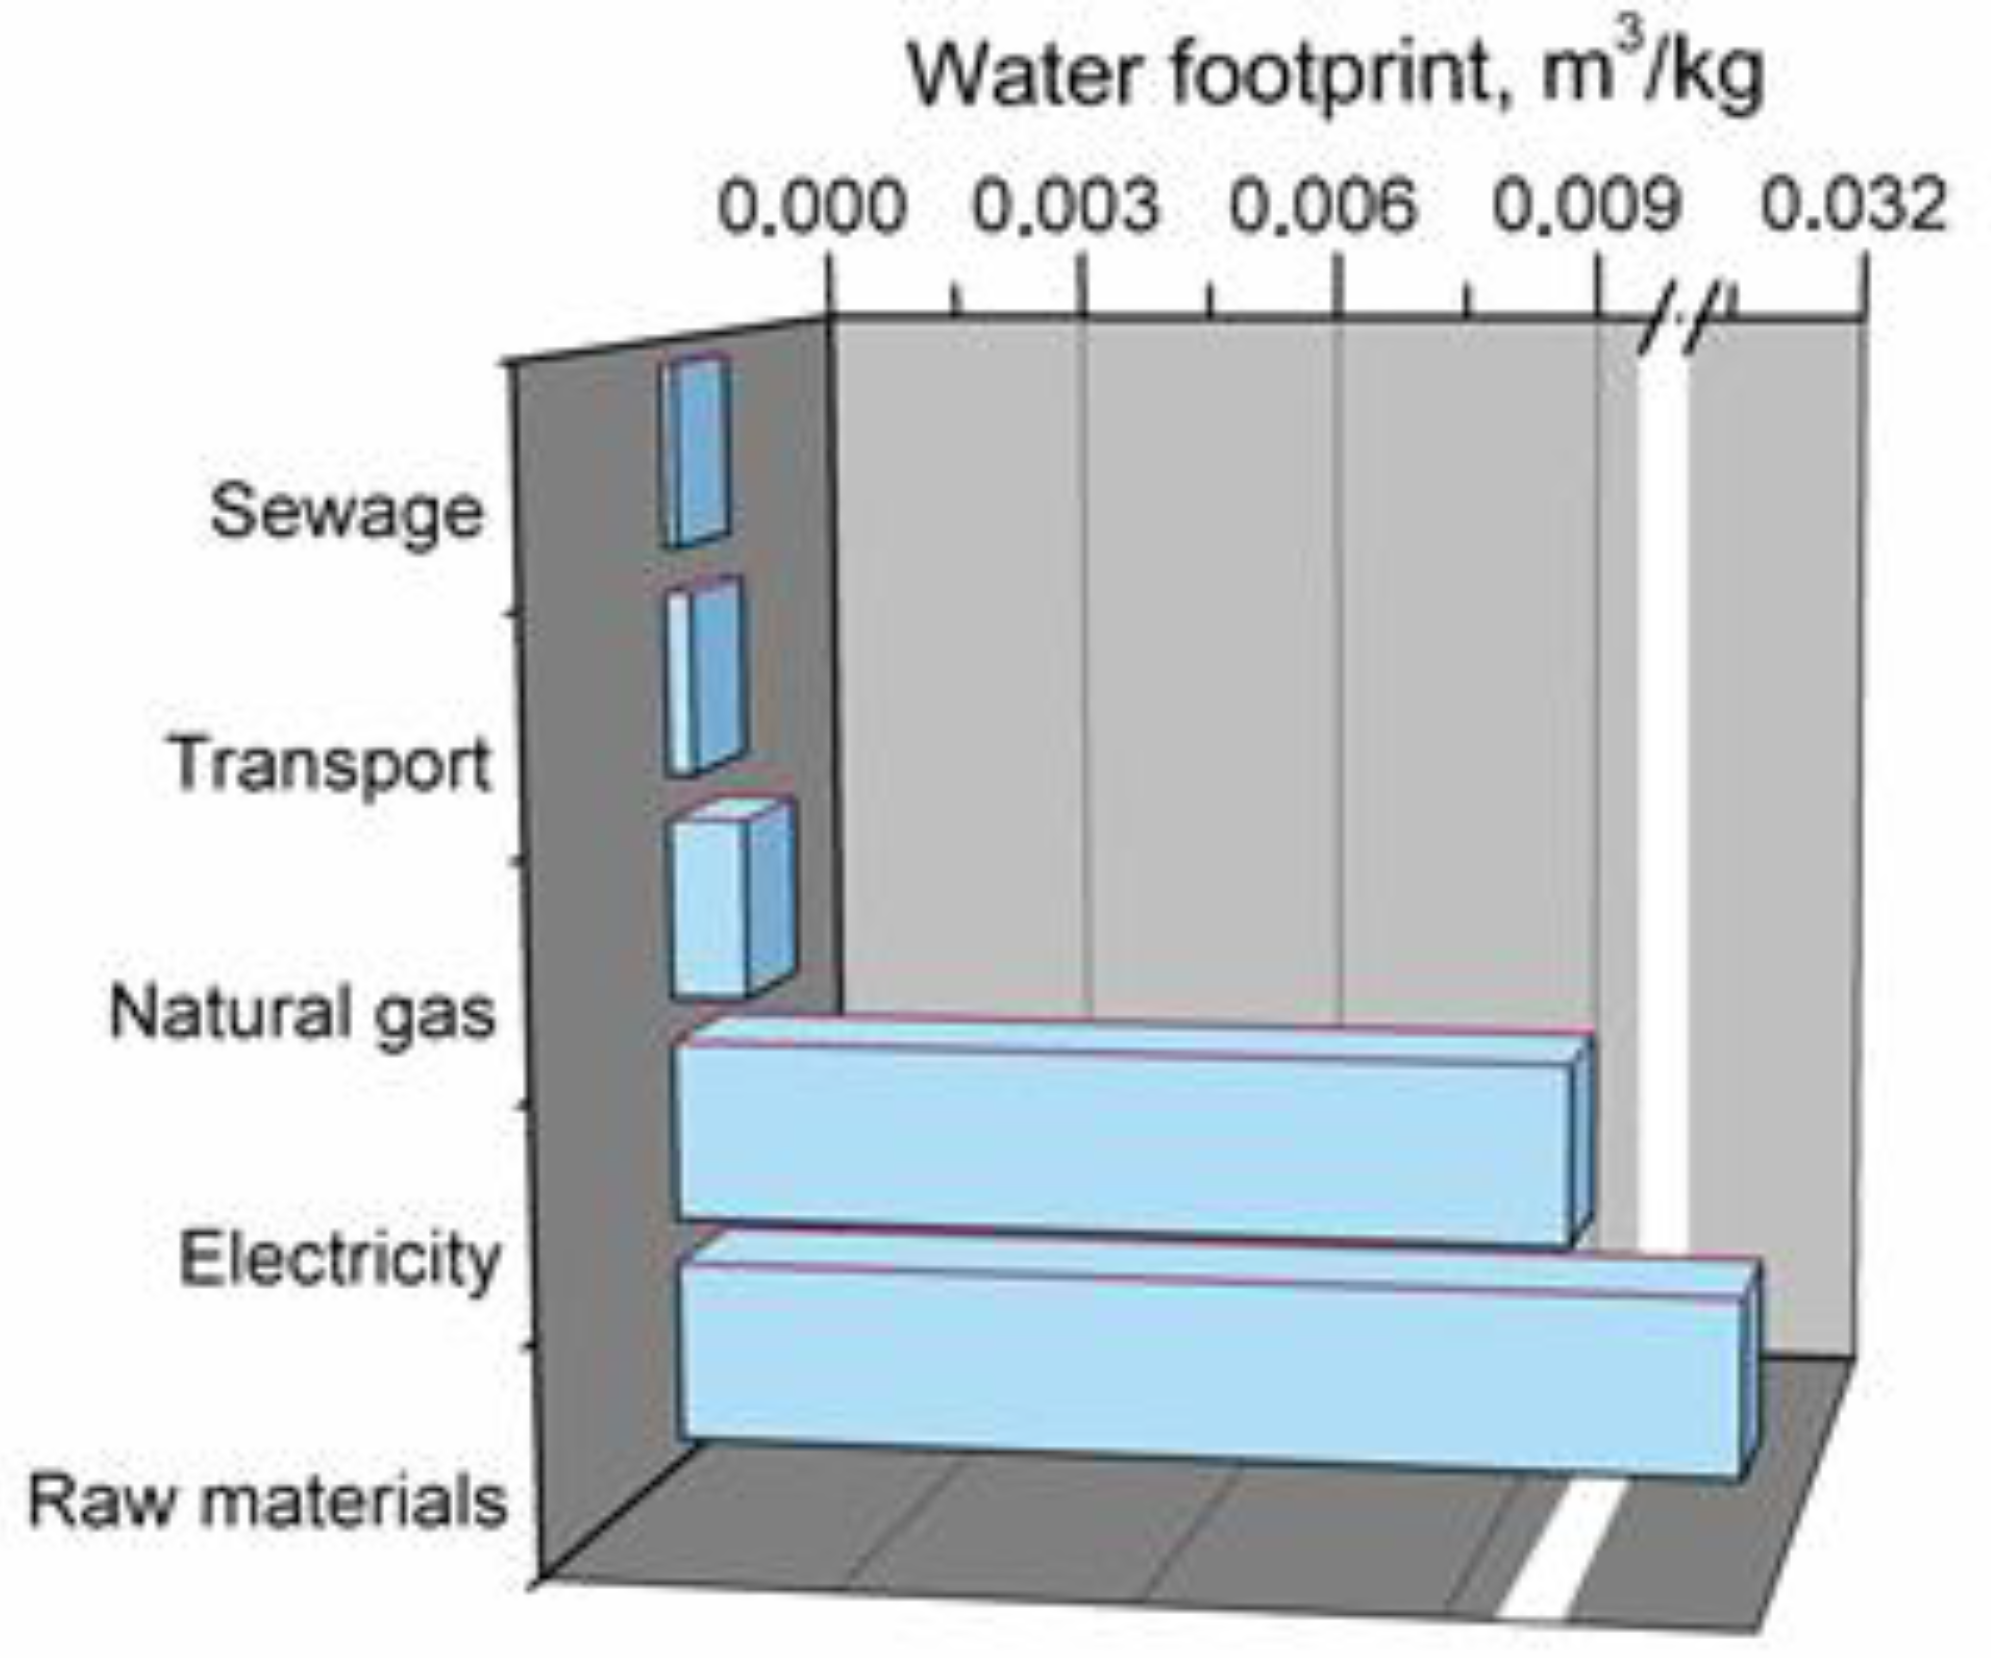
3.2.1. Polypropylene
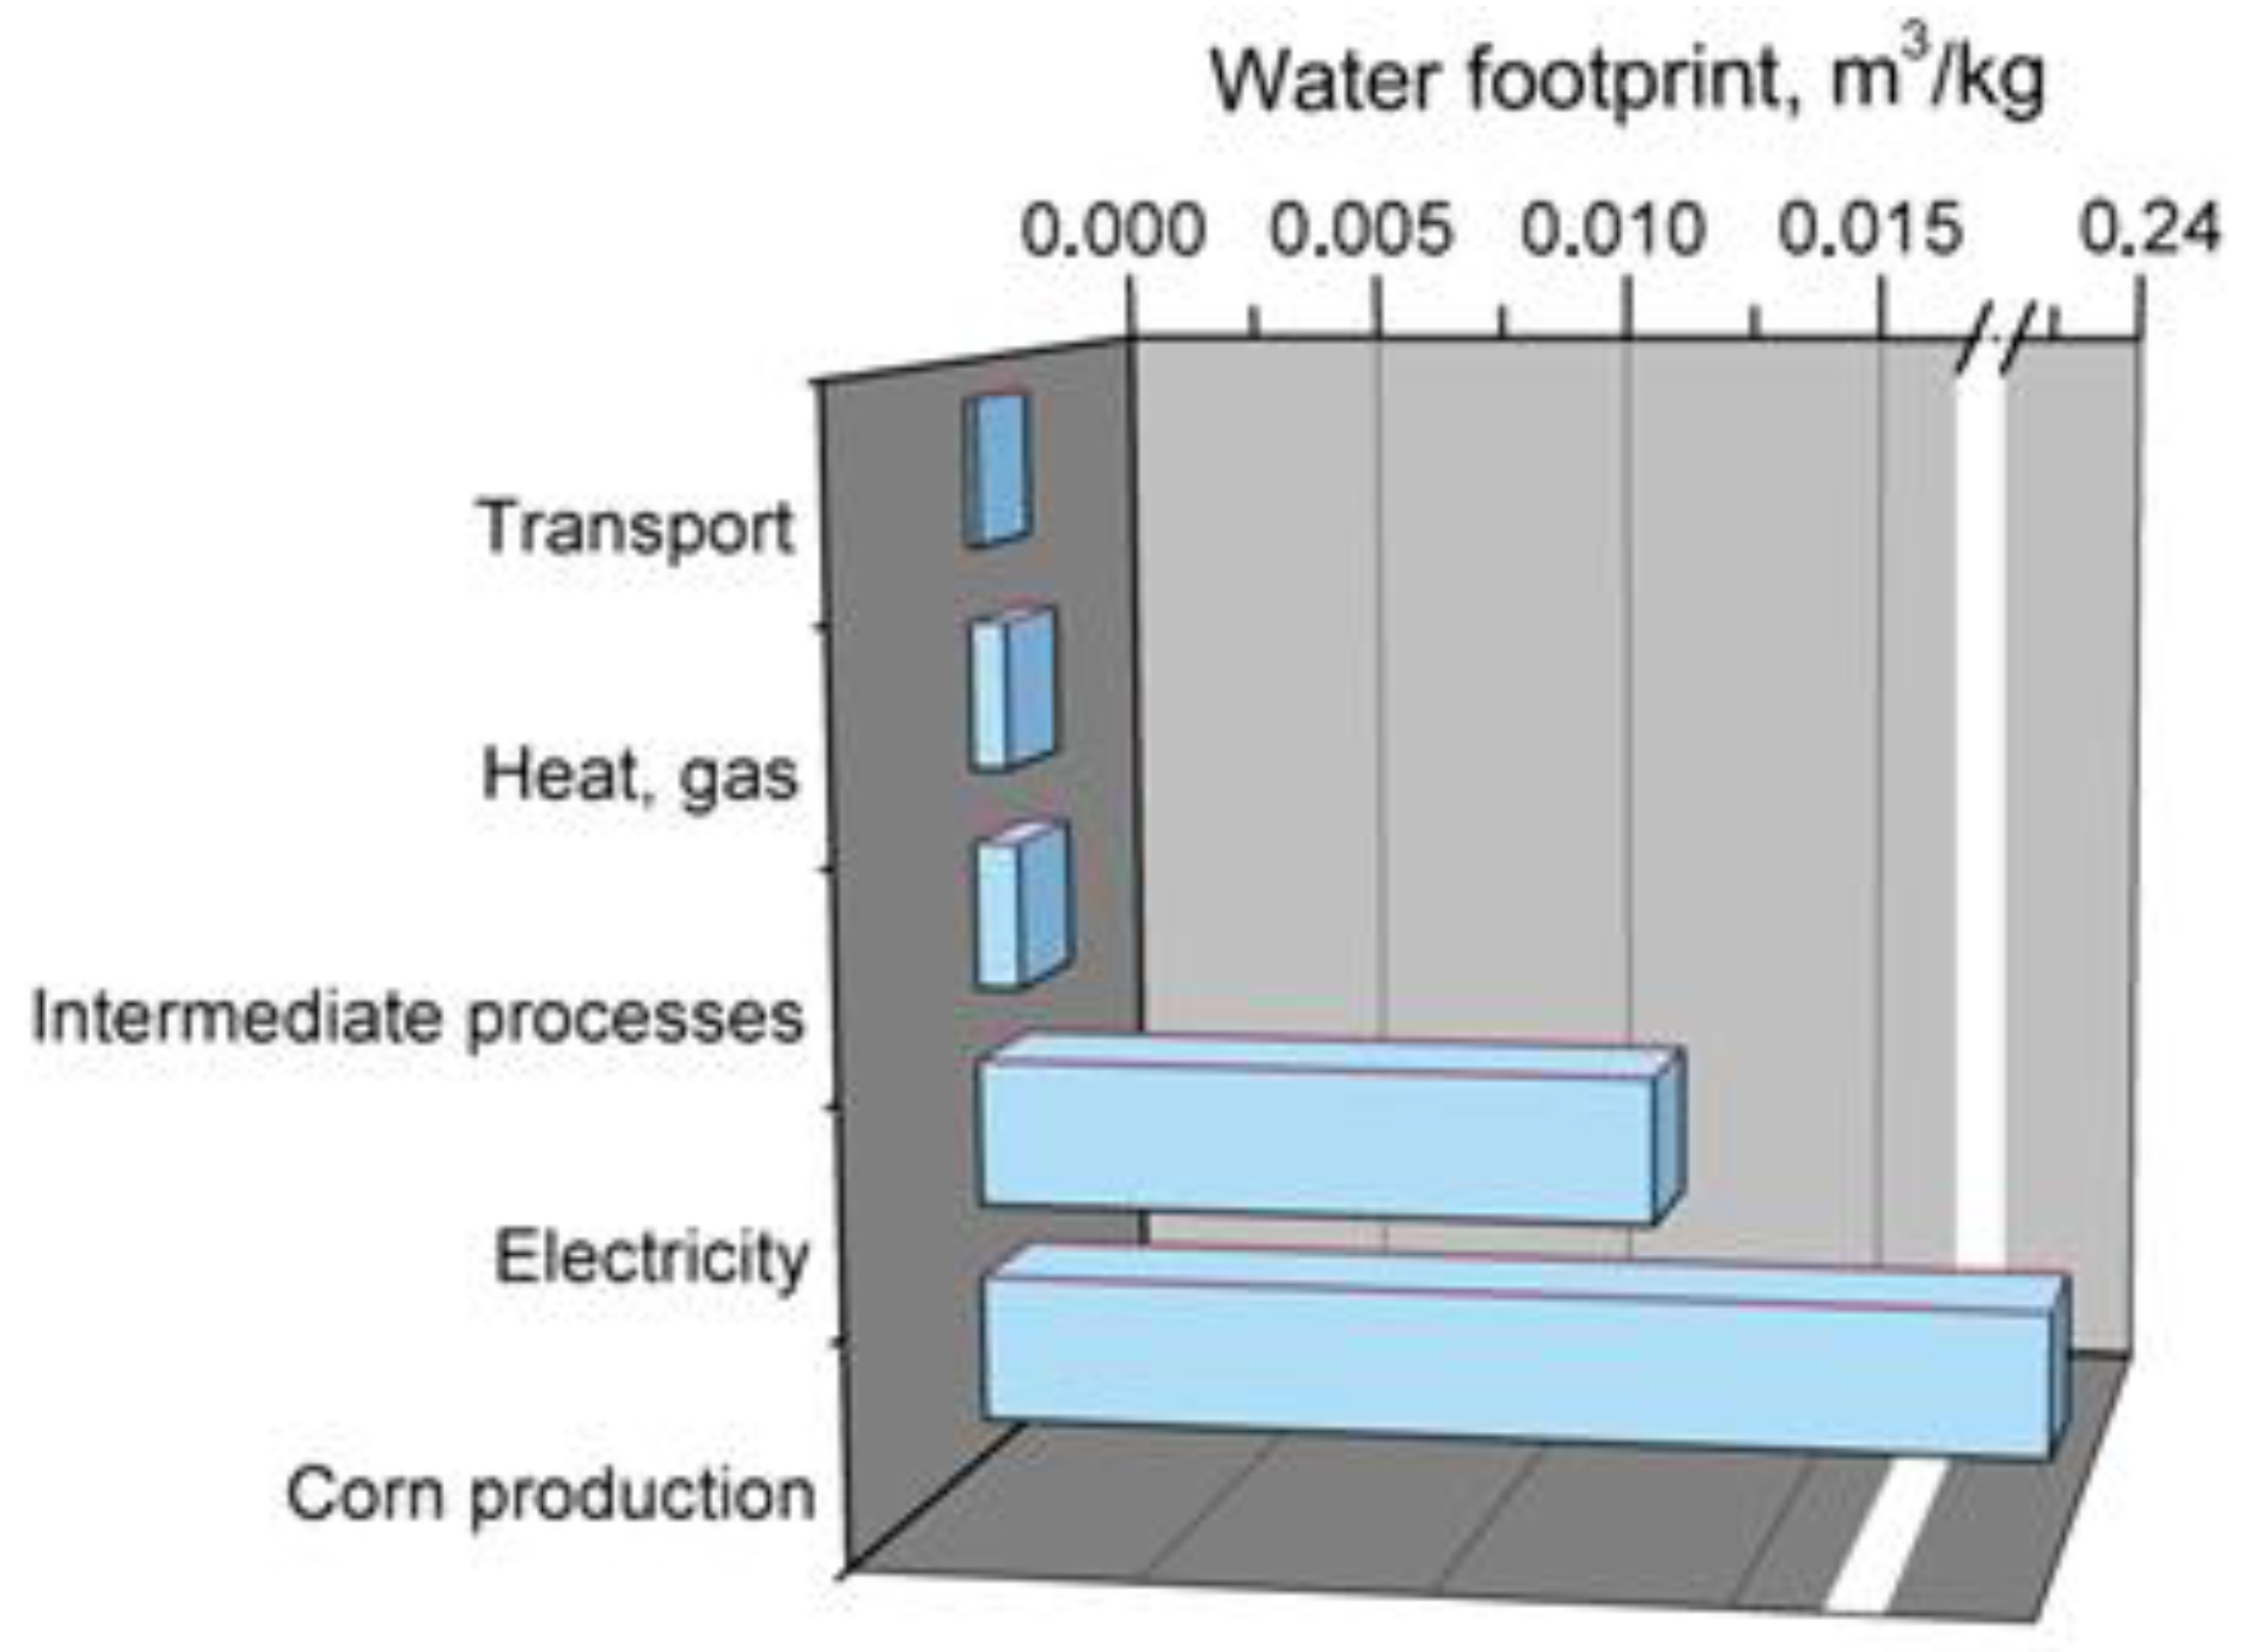
3.2.2. Poly(lactic acid)
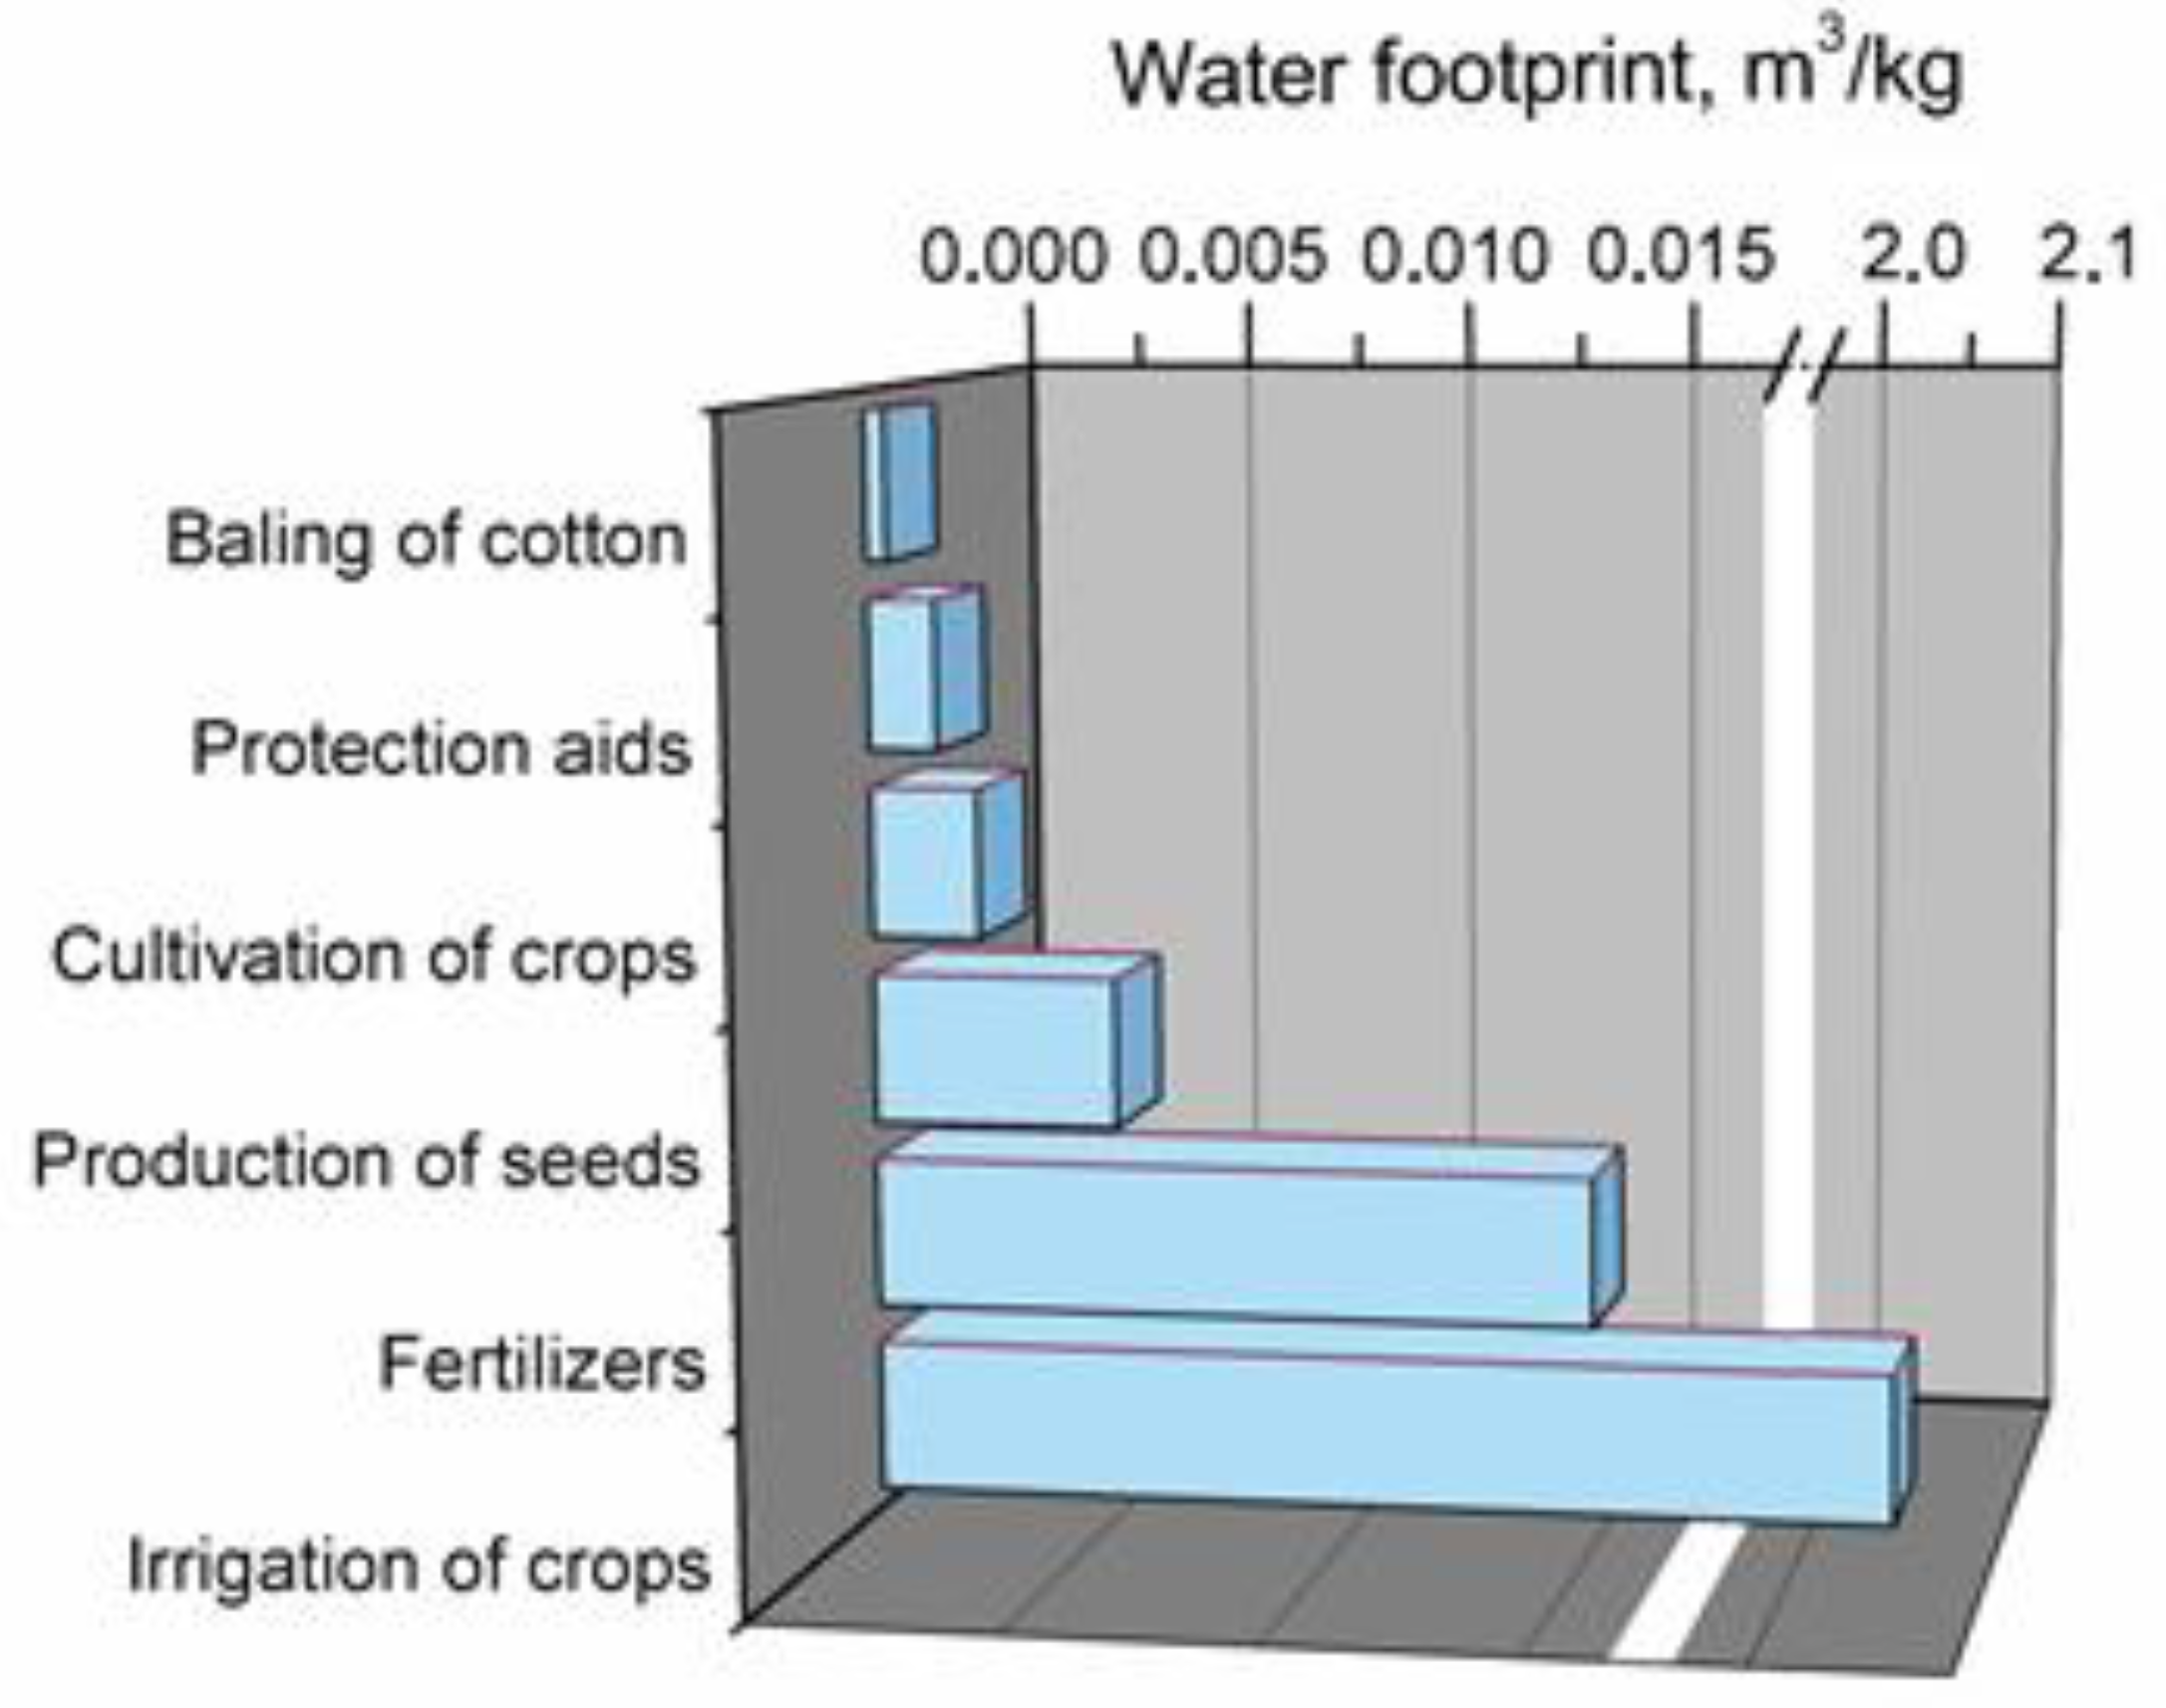
3.2.3. Cotton Fibers
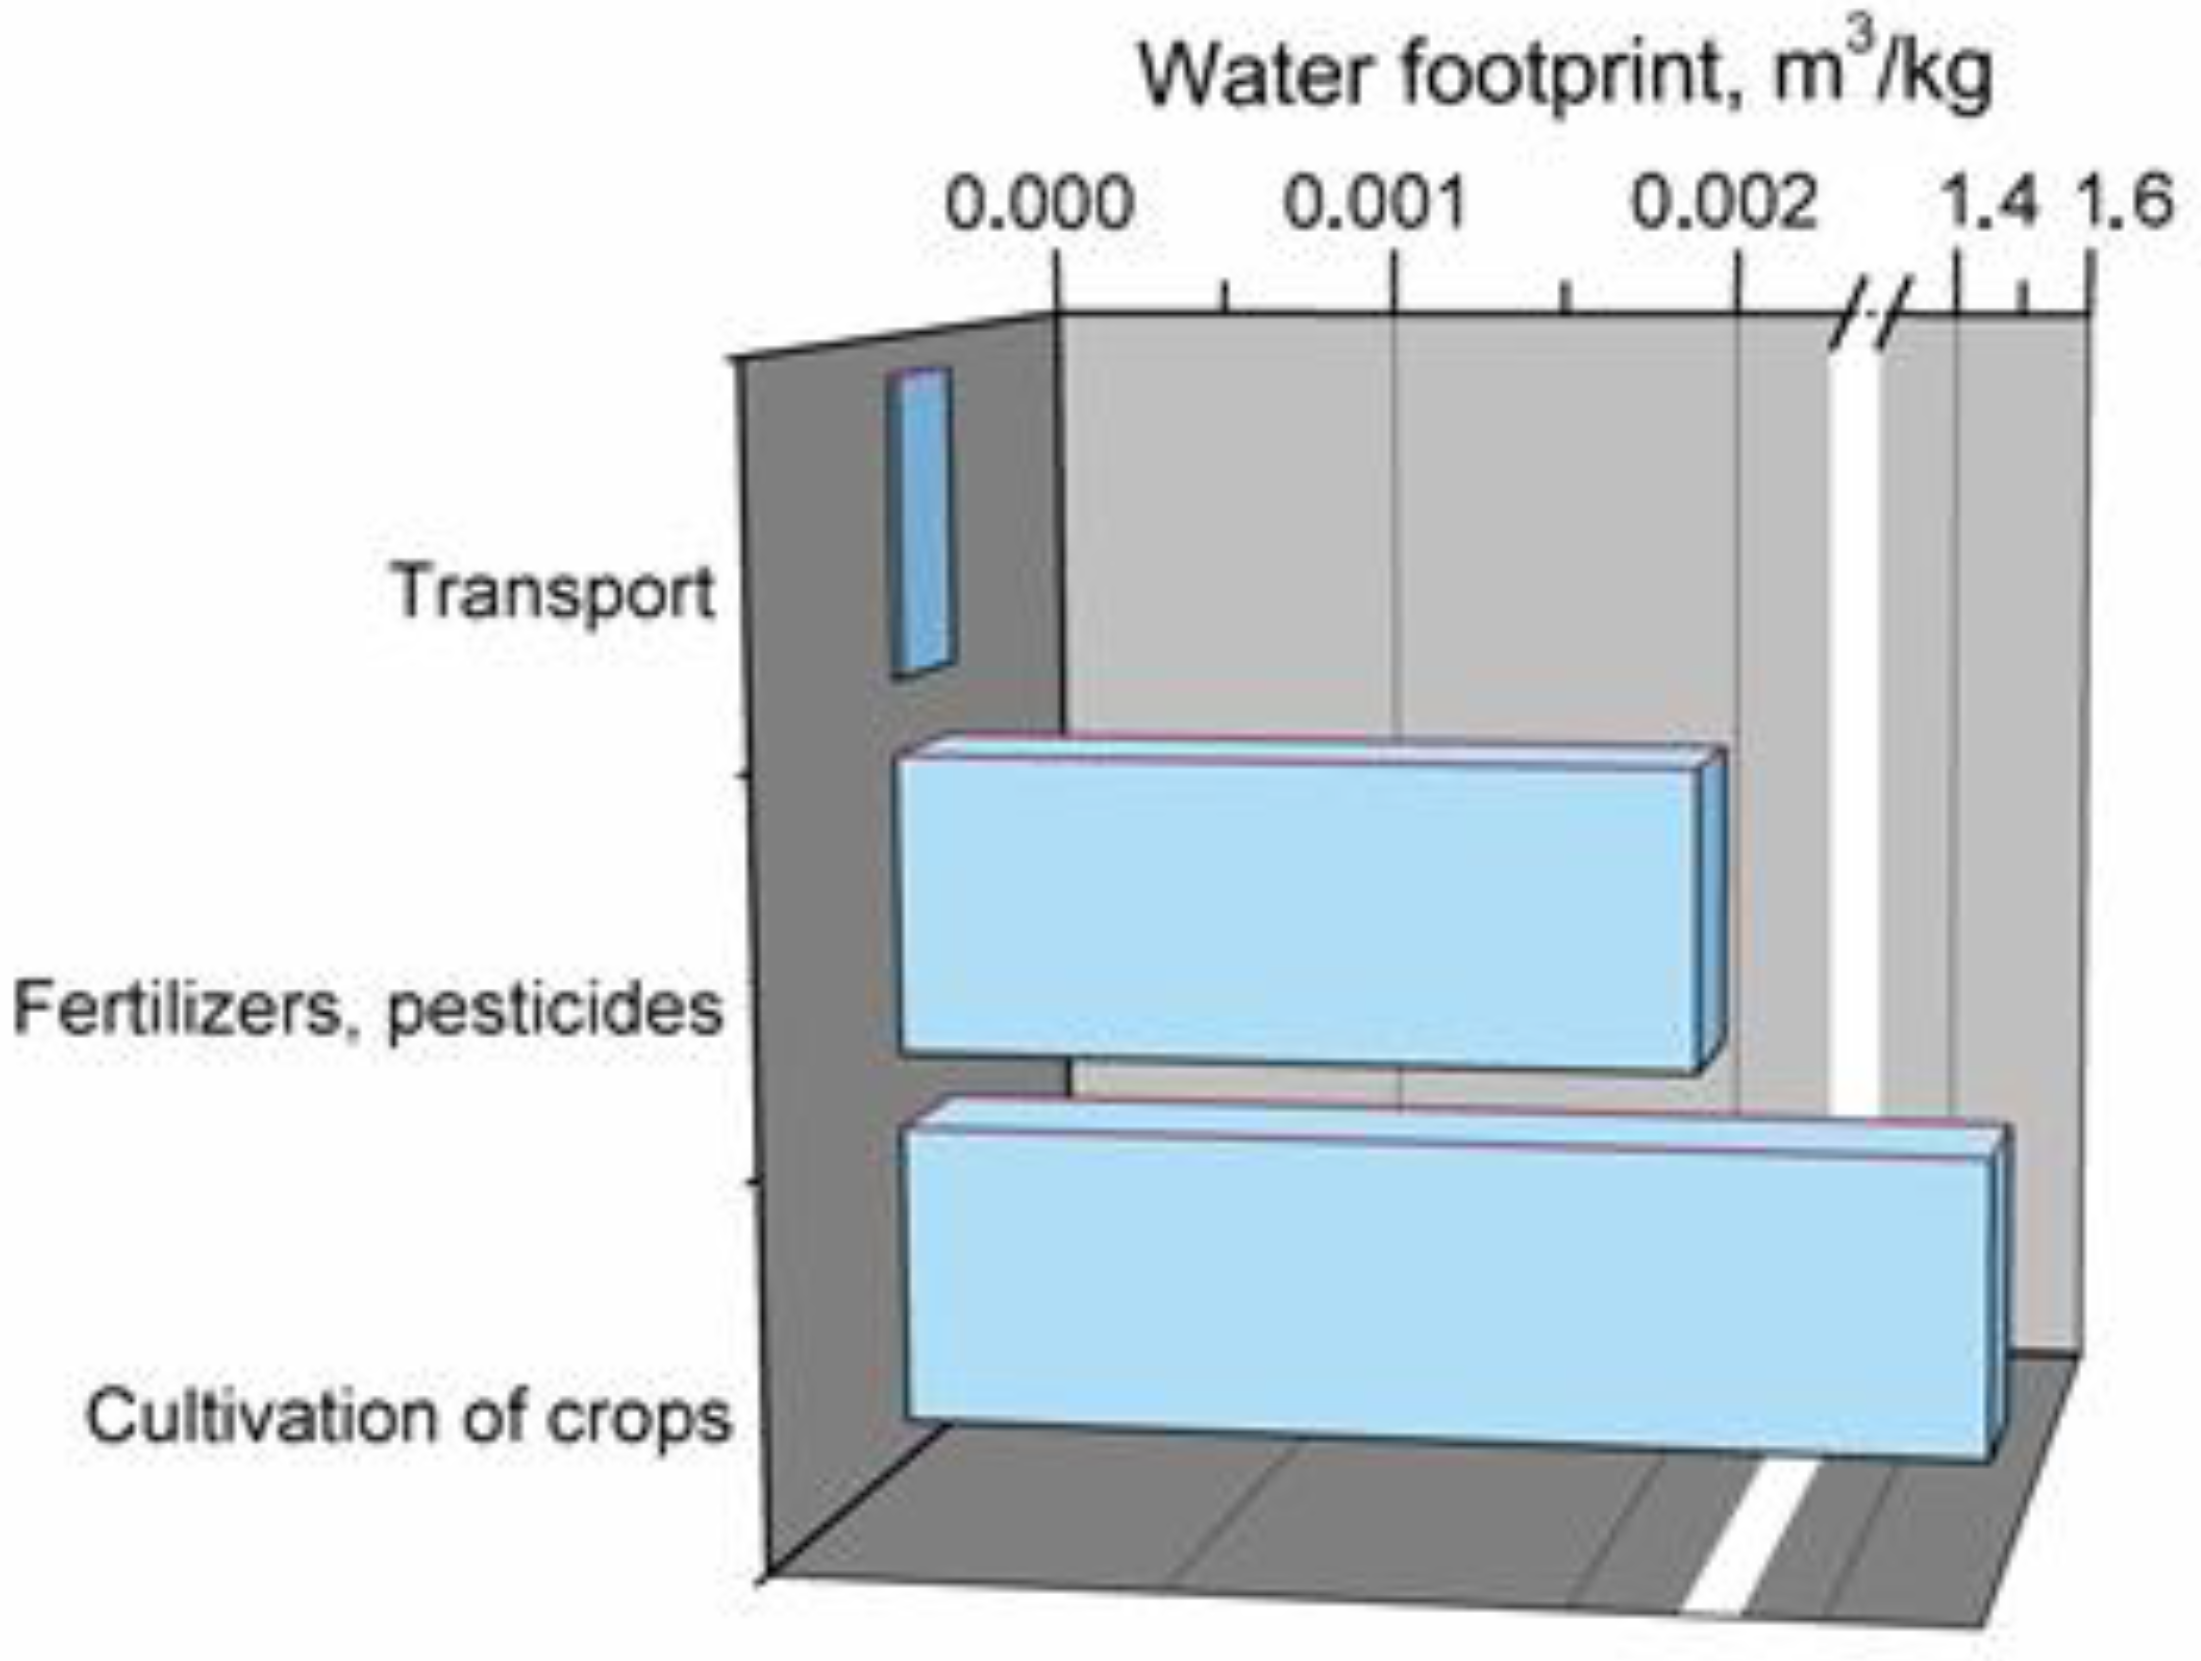
3.2.4. Jute Fibers
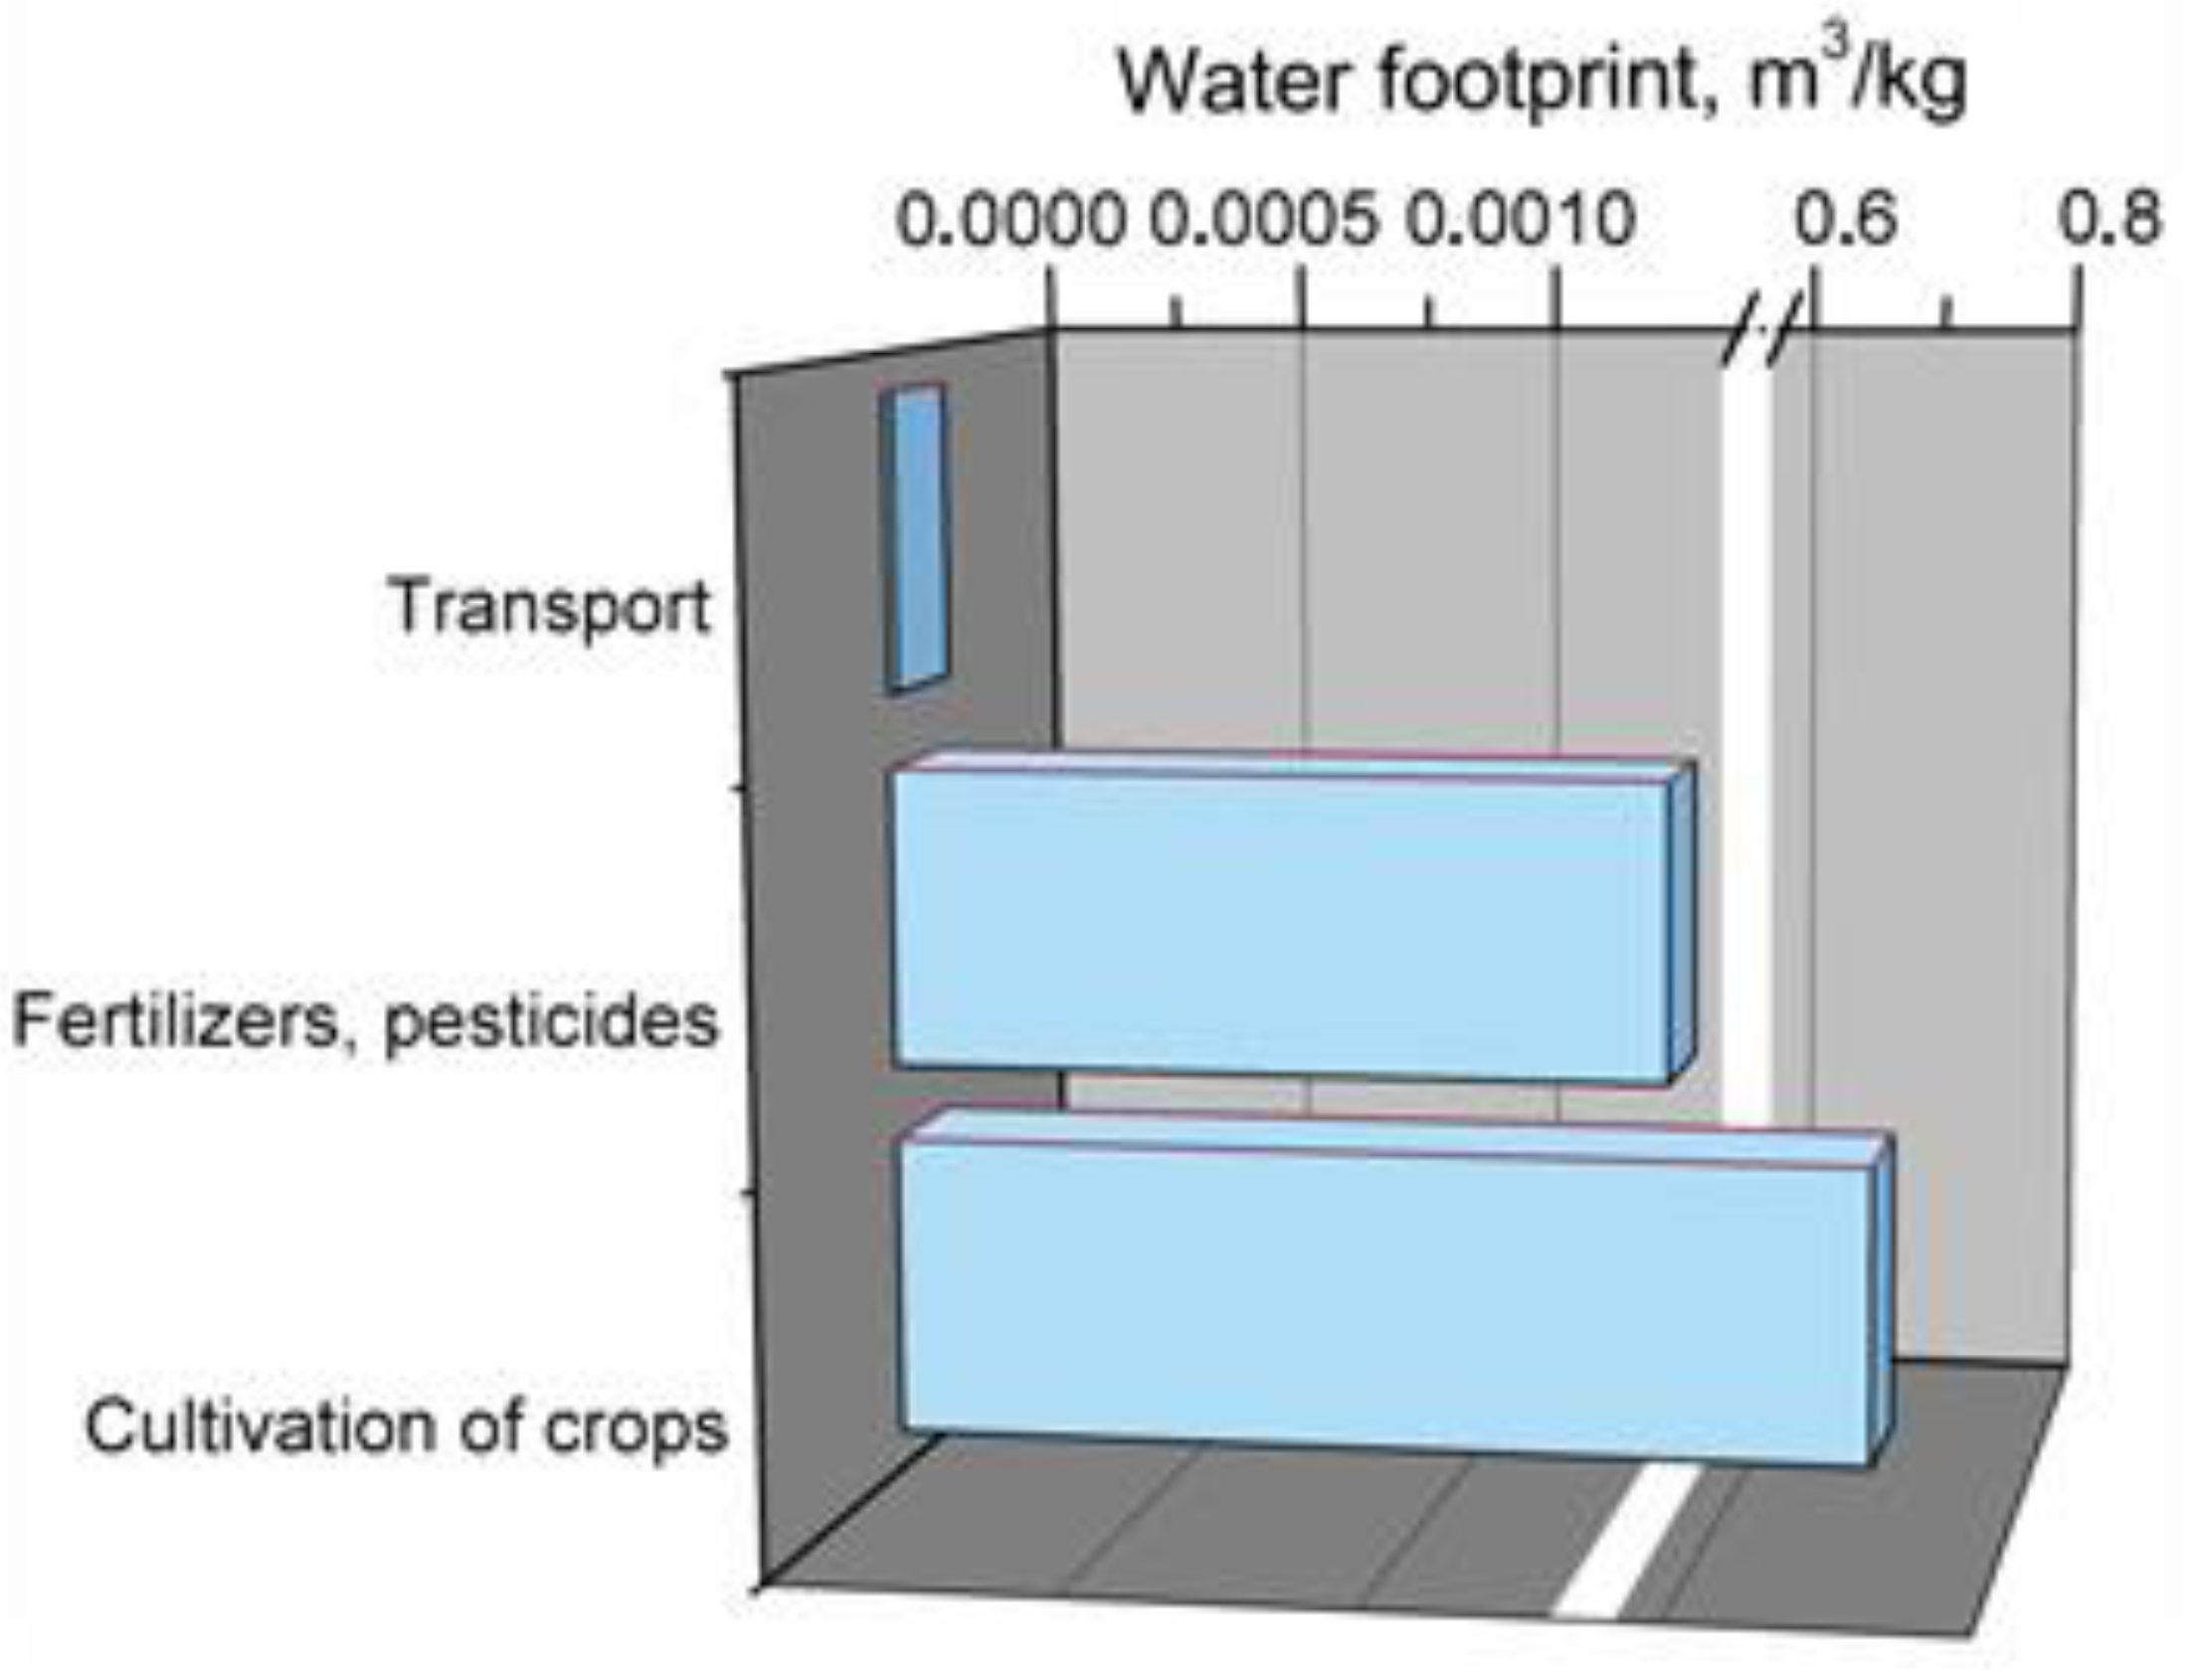
3.2.5. Kenaf Fibers
3.2.6. Glass Fibers
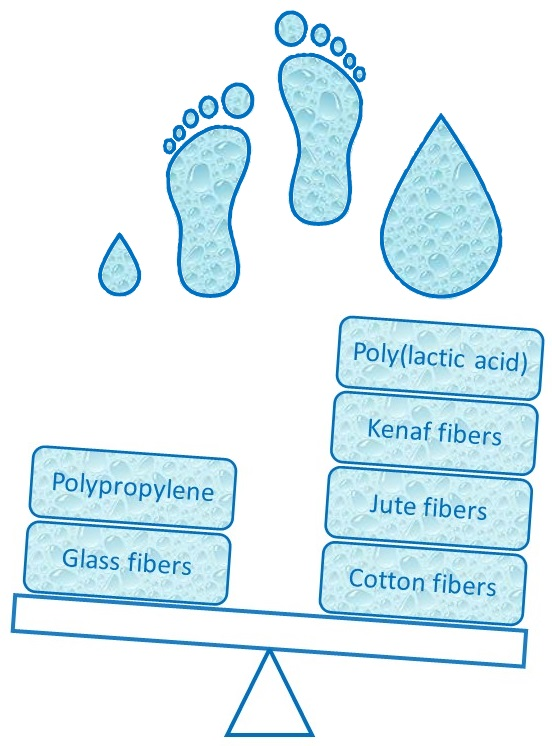
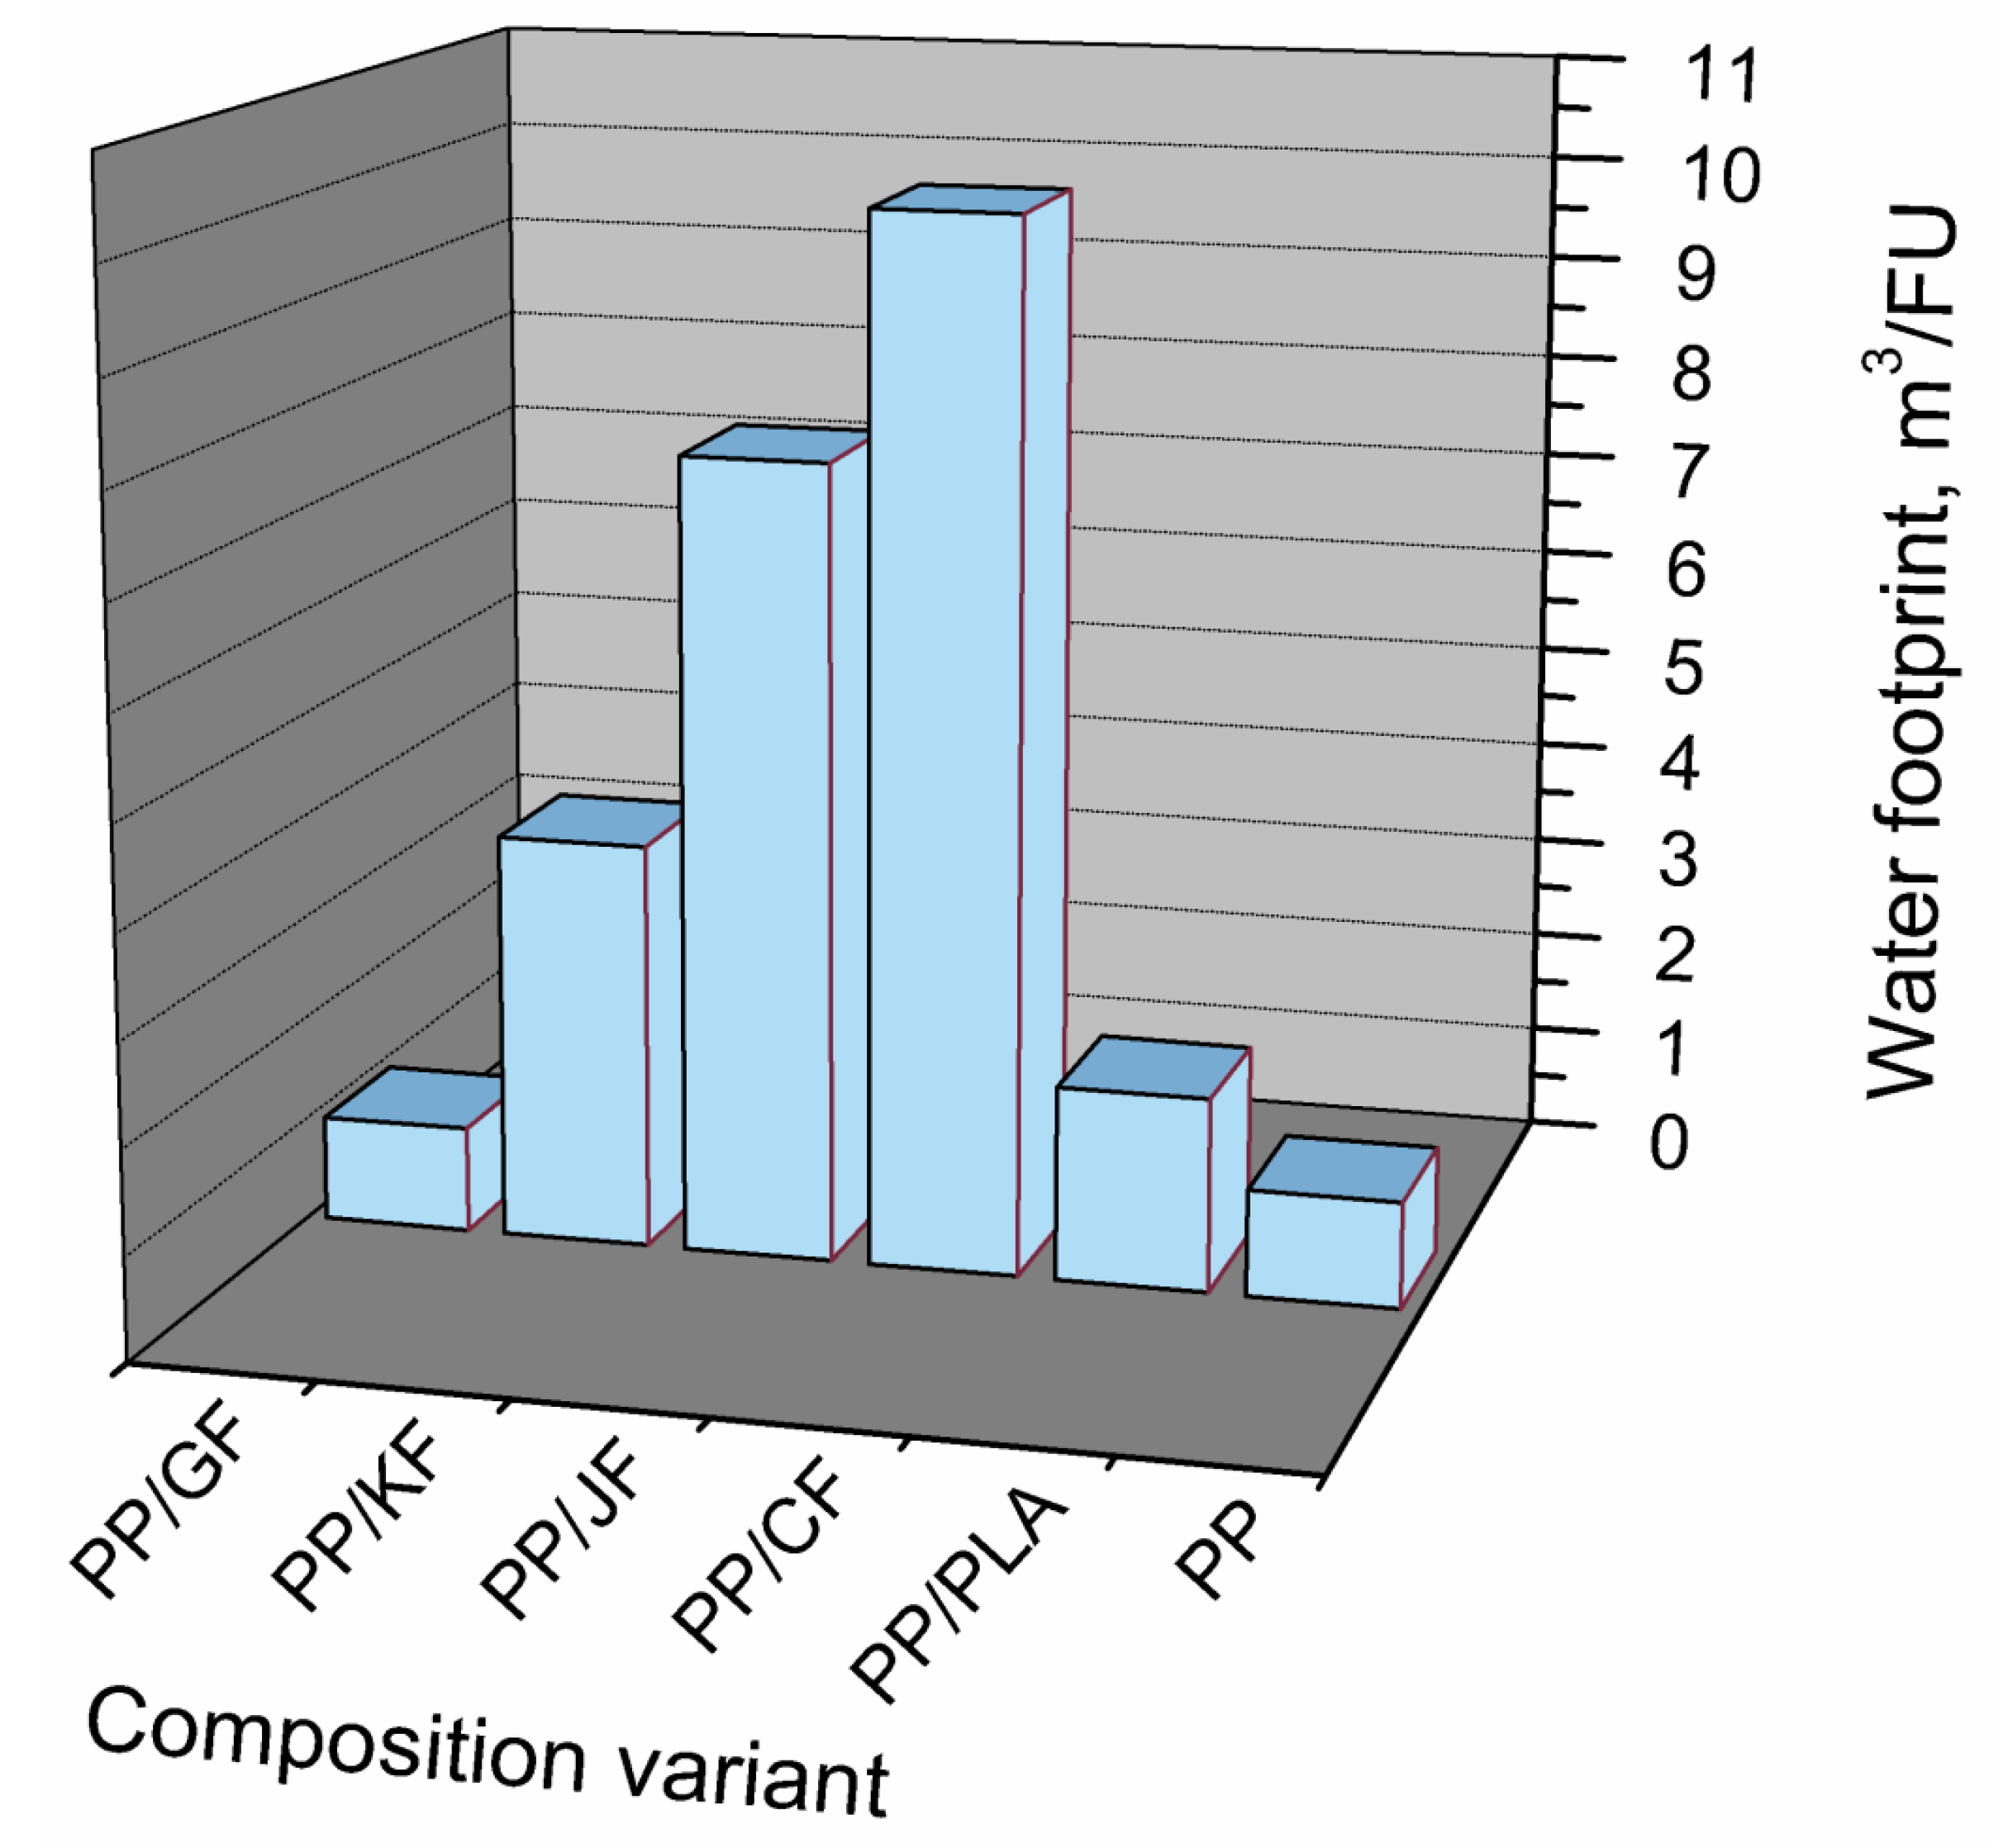
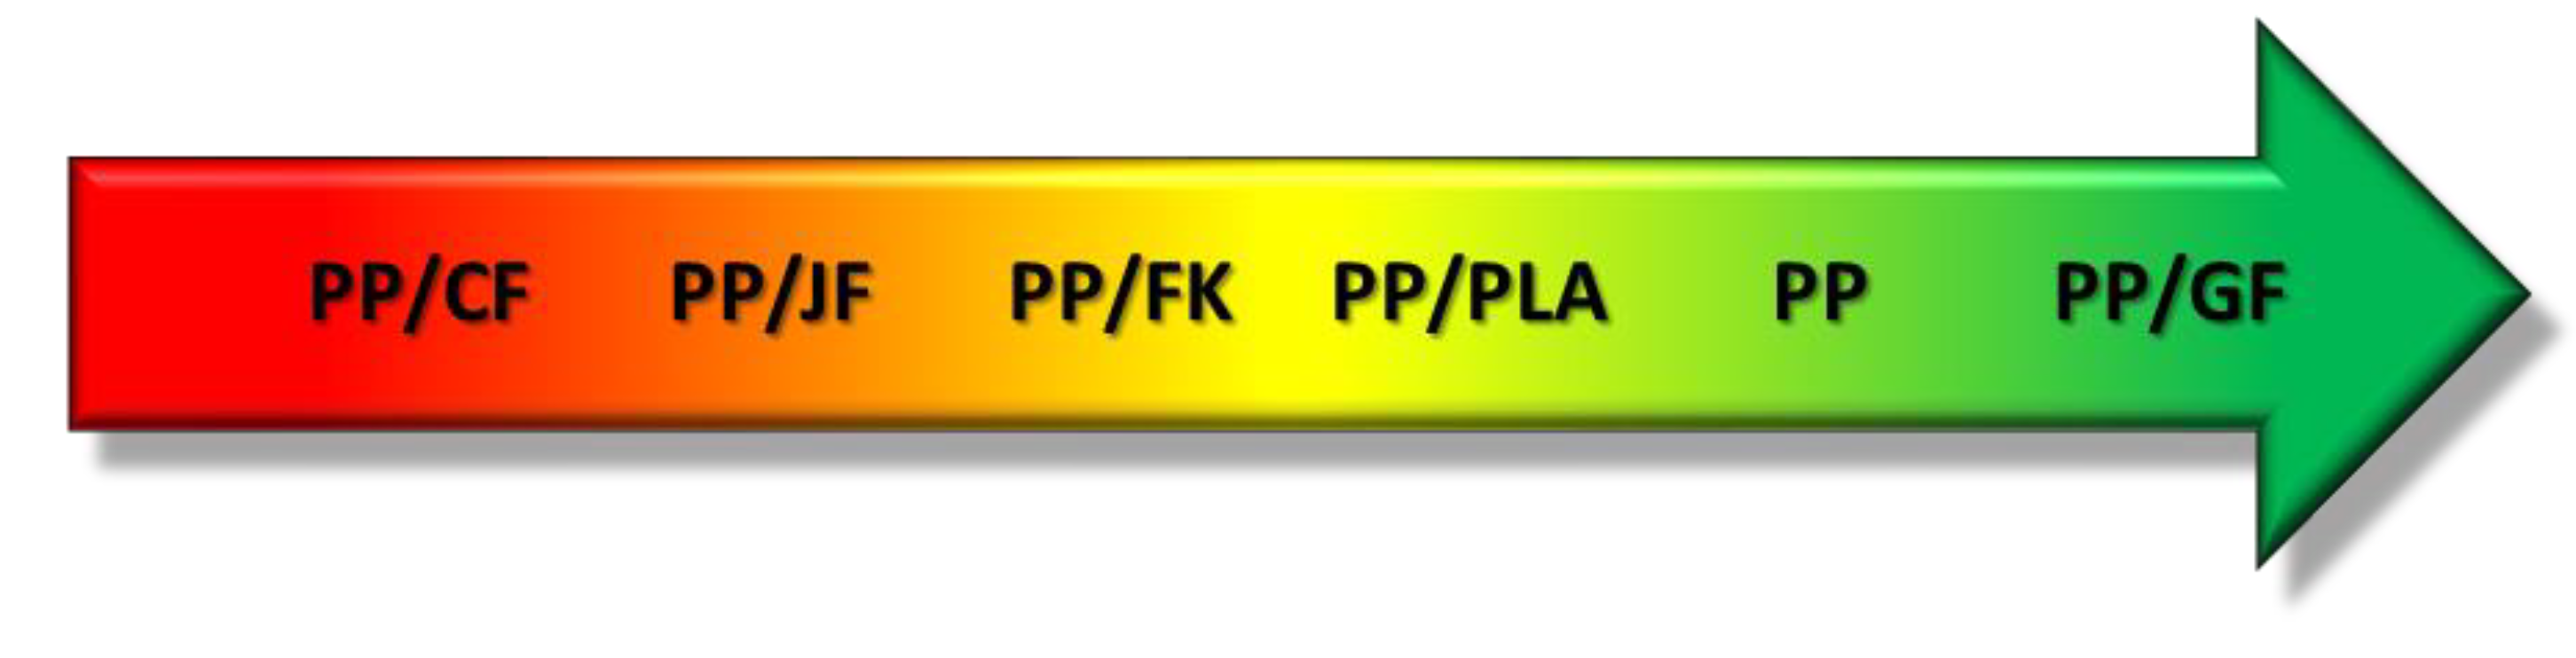
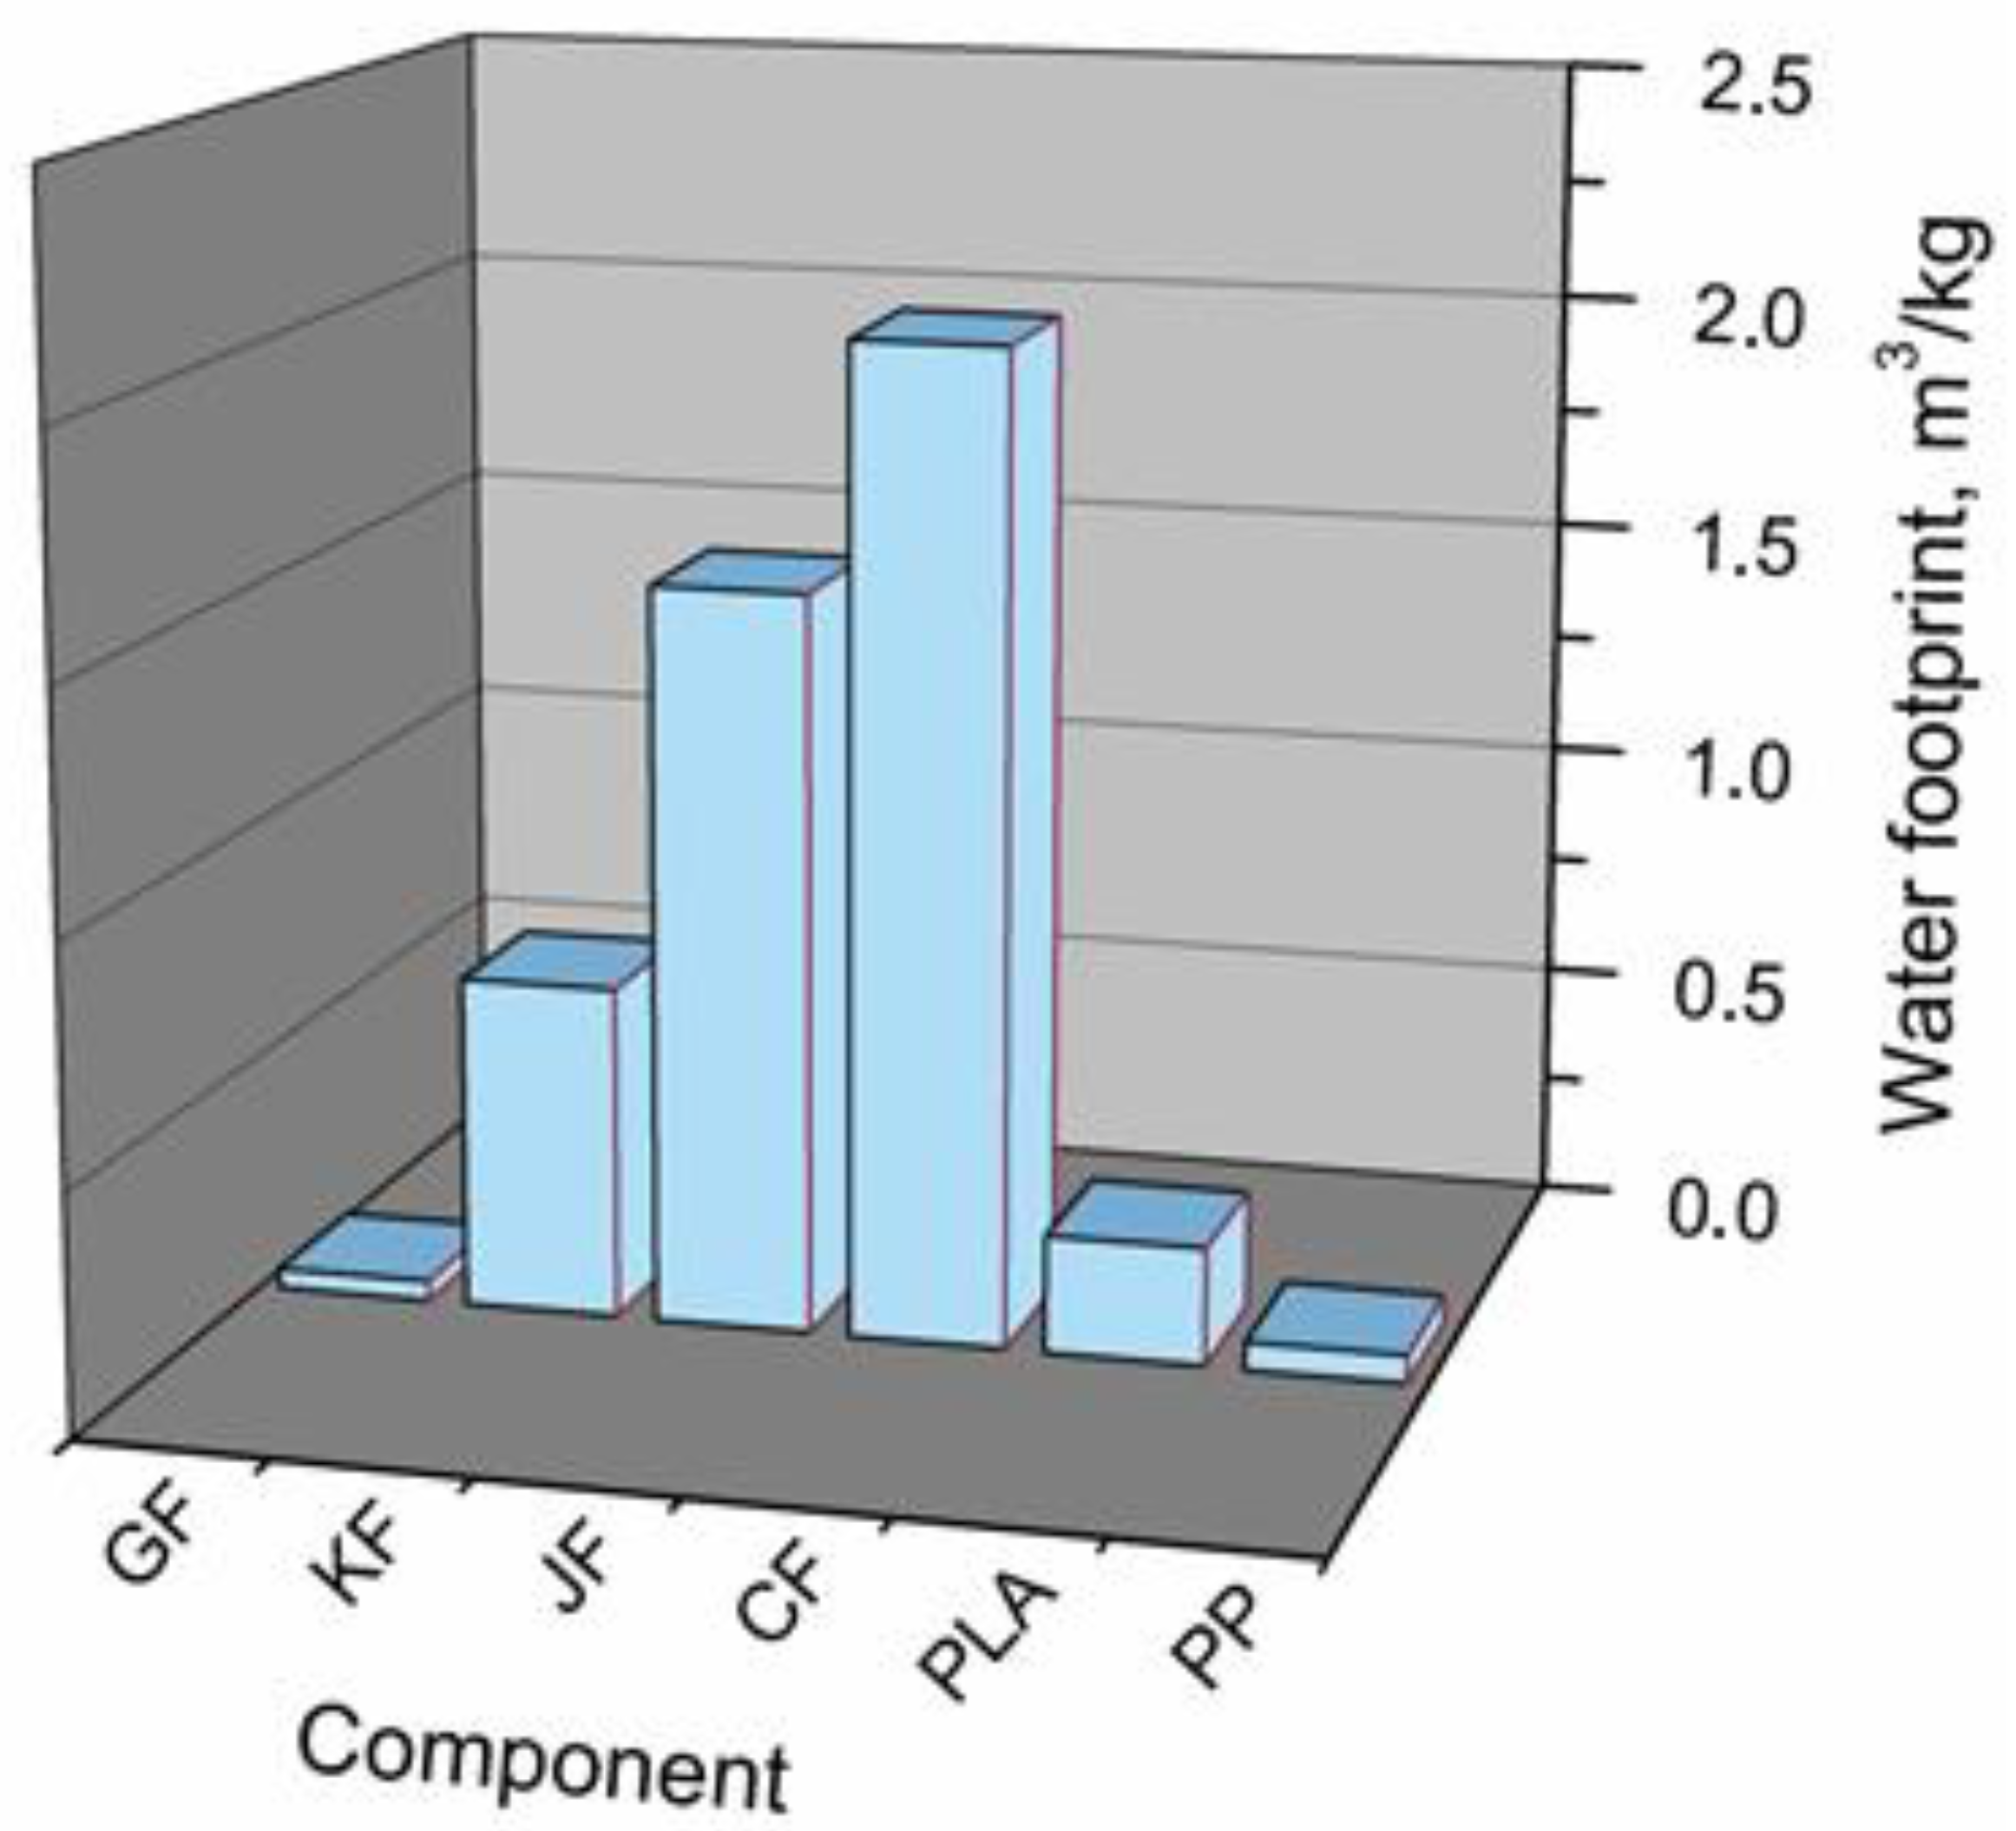
3.2.7. Summary
4. Conclusions
- proper management of waste generated during plastics production, which could be recycled and partially introduced into stream of raw materials, reducing the use of primary resources,
- introduction of continuous processes instead of periodic ones, which could enhance the ecological and economical aspects of production processes, e.g., reduce the amount of water required for production and additional operations, such as purification of fillers modified in a periodic manner with the use of various organic or inorganic solvents,
- creating added value for waste materials, which are currently not utilized, e.g., various types of waste from food industry, which could be applied as source of lignocellulosic fillers in the manufacturing of wood polymer composites.
Author Contributions
Funding
Conflicts of Interest
References
- Korol, J.; Lenża, J.; Formela, K. Manufacture and research of TPS/PE biocomposites properties. Compos. Part B Eng. 2015, 68, 310–316. [Google Scholar] [CrossRef]
- PLA Recycling Within PET Stream Debated. Available online: https://www.earth911.com/inspire/programs-initiatives/pla-recycling-within-pet-stream-debated (accessed on 17 July 2019).
- Baulch, S.; Perry, C. Evaluating the impacts of marine debris on cetaceans. Mar. Pollut. Bull. 2014, 80, 210–221. [Google Scholar] [CrossRef] [PubMed]
- Fife, D.T.; Robertson, G.J.; Shutler, D.; Braune, B.M.; Mallory, M.L. Trace elements and ingested plastic debris in wintering dovekies (Alle alle). Mar. Pollut. Bull. 2015, 91, 368–371. [Google Scholar] [CrossRef] [PubMed]
- Suaria, G.; Aliani, S. Floating debris in the Mediterranean Sea. Mar. Pollut. Bull. 2014, 86, 494–504. [Google Scholar] [CrossRef]
- Alvarez-Chavez, C.R.; Edwards, S.; Moure-Eraso, R.; Geiser, K. Sustainability of bio-based plastics: General comparative analysis and recommendations for improvement. J. Clean. Prod. 2012, 23, 47–56. [Google Scholar] [CrossRef]
- Tsiropoulos, I.; Faaij, A.P.C.; Lundquist, L.; Schenker, U.; Briois, J.F.; Patel, M.K. Life cycle impact assessment of bio-based plastics from sugarcane ethanol. J. Clean. Prod. 2015, 90, 114–127. [Google Scholar] [CrossRef]
- Korol, J.; Burchart-Korol, D.; Pichlak, M. Expansion of environmental impact assessment for eco-efficiency evaluation of biocomposites for industrial application. J. Clean. Prod. 2016, 113, 144–152. [Google Scholar] [CrossRef]
- Vilaplana, F.; Stromberg, E.; Karlsson, S. Environmental and resource aspects of sustainable biocomposites. Polym. Degrad. Stabil. 2010, 95, 2147–2161. [Google Scholar] [CrossRef]
- Martinez, P.; Garraín, D.; Vidal, R. LCA of Biocomposites Versus Conventional Products. In Proceedings of the 3rd International Conference on Life Cycle Management, University of Zurich, Zurich, Switzerland, 27–29 August 2007. [Google Scholar]
- Vidal, R.; Martinez, P.; Garraín, D. Life cycle assessment of composite materials made of recycled thermoplastics combined with rice husks and cotton linters. Int. J. Life Cycle Ass. 2009, 14, 73–82. [Google Scholar] [CrossRef]
- Yates, M.R.; Barlow, C.Y. Life cycle assessments of biodegradable, commercial biopolymers—A critical review. Resour. Conserv. Recycl. 2013, 78, 54–66. [Google Scholar] [CrossRef]
- Broeren, M.L.M.; Kuling, L.; Worrell, E.; Shen, L. Environmental impact assessment of six starch plastics focusing on wastewater-derived starch and additives. Resour. Conserv. Recycl. 2017, 127, 246–255. [Google Scholar] [CrossRef]
- Mahalle, L.; Alemdar, A.; Mihai, M.; Legros, N. A cradle-to-gate life cycle assessment of wood fibre-reinforced polylactic acid (PLA) and polylactic acid/thermoplastic starch (PLA/TPS) biocomposites. Int. J. Life Cycle Assess. 2014, 19, 1305–1315. [Google Scholar] [CrossRef]
- Korol, J.; Lenża, J.; Burchart-Korol, D.; Bajer, K. Wytwarzanie i badanie wybranych właściwości recyklatów LDPE. Przem. Chem. 2012, 91, 2196–2201. [Google Scholar]
- Hottle, T.A.; Bilec, M.M.; Landis, A.E. Biopolymer production and end of life comparisons using life cycle assessment. Resour. Conserv. Recycl. 2017, 122, 295–306. [Google Scholar] [CrossRef] [Green Version]
- Pawelzik, P.; Carus, M.; Hotchkiss, J.; Narayan, R.; Selke, S.; Wellisch, M.; Weiss, M.; Wicke, B.; Patel, M.K. Critical aspects in the life cycle assessment (LCA) of bio-based materials – Reviewing methodologies and deriving recommendations. Resour. Conserv. Recycl. 2013, 73, 211–228. [Google Scholar] [CrossRef]
- Ridoutt, B.G.; Pfister, S. A revised approach to water footprinting to make transparent the impacts of consumption and production on global freshwater scarcity. Global Environ. Chang. 2010, 20, 113–120. [Google Scholar] [CrossRef]
- Hoekstra, A.Y.; Mekonnen, M.M.; Chapagain, A.K.; Mathews, R.E.; Richter, B.D. Global Monthly Water Scarcity: Blue Water Footprints versus Blue Water Availability. PLoS ONE 2012, 7, e32688. [Google Scholar] [CrossRef]
- Hoekstra, A.Y.; Hung, P.Q. Virtual Water Trade: A Quantification of Virtual Water Flows between Nations in Relation to International Crop Trade. Value of Water Research Report Series (No. 11); UNESCO-IHE Institute for Water Education: Delft, The Netherland, 2002; Available online: https://www.waterfootprint.org/Reports/Report11.pdf (accessed on 17 July 2019).
- Chapagain, A.K.; Hoekstra, A.Y.; Savenije, H.H.G.; Gautam, R. The water footprint of cotton consumption: An assessment of the impact of worldwide consumption of cotton products on the water resources in the cotton producing countries. Ecol. Econ. 2006, 60, 186–203. [Google Scholar] [CrossRef]
- Chapagain, A.K.; Hoekstra, A.Y. The global component of freshwater demand and supply: An assessment of virtual water flows between nations as a result of trade in agricultural and industrial products. Water Int. 2008, 33, 19–32. [Google Scholar] [CrossRef]
- Galloway, J.N.; Burke, M.; Bradford, G.E.; Naylor, R.; Falcon, W.; Chapagain, A.K.; Gaskell, J.C.; McCullough, E.; Mooney, H.A.; Oleson, K.L.L.; et al. International trade in meat: The tip of the pork chop. AMBIO 2007, 36, 622–629. [Google Scholar] [CrossRef]
- Chapagain, A.K.; Orr, S. An improved water footprint methodology linking global consumption to local water resources: A case study of Spanish tomatoes. J. Environ. Manag. 2009, 90, 1219–1228. [Google Scholar] [CrossRef] [PubMed]
- Chen, Z.M.; Chen, G.Q. Virtual water accounting for the globalized world economy: National water footprint and international virtual water trade. Ecol. Indic. 2013, 28, 142–149. [Google Scholar] [CrossRef]
- Berger, M.; Warsen, J.; Krinke, S.; Bach, V.; Finkbeiner, M. Water footprint of European cars: Potential impacts of water consumption along automobile life cycles. Environ. Sci. Technol. 2012, 46, 4091–4099. [Google Scholar] [CrossRef] [PubMed]
- Hoekstra, A.Y. The Water Footprint of Industry. In Assessing and Measuring Environmental Impact and Sustainability; Klemes, J.J., Ed.; Butterworth-Heinemann: Oxford, UK, 2015; pp. 221–254. [Google Scholar] [CrossRef]
- Ercin, A.E.; Hoekstra, A.Y. Water footprint scenarios for 2050: A global analysis. Environ. Int. 2014, 64, 71–82. [Google Scholar] [CrossRef]
- Mazeika Bilbao, A.; Carrano, A.L.; Hewitt, M.; Thorn, B.K. On the environmental impacts of pallet management operations. Manag. Res. Rev. 2011, 34, 1222–1236. [Google Scholar] [CrossRef]
- Etcheverry, M.; Barbosa, S.E. Glass Fiber Reinforced Polypropylene Mechanical Properties Enhancement by Adhesion Improvement. Materials 2012, 5, 1084–1113. [Google Scholar] [CrossRef] [Green Version]
- Korol, J. Wpływ zastosowania mieszadła statycznego na właściwości biokompozytów PEHD/skrobia modyfikowana. Przem. Chem. 2014, 93, 457–463. [Google Scholar]
- Zajchowski, S.; Ryszkowska, J. Kompozyty polimerowo-drzewne—charakterystyka ogólna oraz ich otrzymywanie z materiałów odpadowych. Polimery 2009, 54, 674–682. [Google Scholar] [CrossRef]
- Czaplicka-Kolarz, K.; Burchart-Korol, D.; Korol, J. Ocena środowiskowa biokompozytów z zastosowaniem techniki LCA. Polimery 2013, 58, 476–481. [Google Scholar] [CrossRef]
- Czaplicka-Kolarz, K.; Burchart-Korol, D.; Korol, J. Zastosowanie analizy cyklu życia i egzergii do oceny środowiskowej wybranych polimerów. Polimery 2013, 58, 605–609. [Google Scholar] [CrossRef]
- Korol, J. Polyethylene matrix composites reinforced with keratin fibers obtained from waste chicken feathers. J. Biobased Mater. Bioenergy 2012, 6, 355–360. [Google Scholar] [CrossRef]
- Weiss, M.; Haufe, J.; Carus, M.; Brandao, M.; Bringezu, S.; Hermann, B.; Patel, M.K. A review of the environmental impacts of biobased materials. J. Ind. Ecol. 2012, 16, S169–S181. [Google Scholar] [CrossRef]
- Bajer, K.; Kaczmarek, H. Methods of biodegradation study of polymeric materials. Polimery 2007, 52, 13–18. [Google Scholar] [CrossRef]
- Formela, K.; Zedler, L.; Hejna, A.; Tercjak, A. Reactive extrusion of bio-based polymer blends and composites—Current trends and future developments. Express Polym. Lett. 2018, 12, 24–57. [Google Scholar] [CrossRef]
- Tworzywa Sztuczne—Fakty 2015. Analiza Produkcji, Zapotrzebowania Oraz Odzysku Tworzyw Sztucznych w Europie. Available online: https://www.plasticseurope.org/download_file/force/1075/521 (accessed on 22 July 2019).
- Błędzki, A.K.; Franciszczak, P.; Osman, Z.; Elbadawi, M. Polypropylene biocomposites reinforced with softwood, abaca, jute, and kenaf fibers. Ind. Crop. Prod. 2015, 70, 91–99. [Google Scholar] [CrossRef]
- AL-Oqla, F.M.; Sapuan, S.M. Natural fiber reinforced polymer composites in industrial applications: Feasibility of date palm fibers for sustainable automotive industry. J. Clean. Prod. 2014, 66, 347–354. [Google Scholar] [CrossRef]
- Alves, C.; Ferrao, P.M.C.; Silva, A.J.; Reis, L.G.; Freitas, M.; Rodrigues, L.B.; Alves, D.E. Ecodesign of automotive components making use of natural jute fiber composites. J. Clean. Prod. 2010, 18, 313–327. [Google Scholar] [CrossRef]
- Ploypetchara, N.; Suppakul, P.; Atong, D.; Pechyen, C. Blend of Polypropylene/Poly(lactic acid) for Medical Packaging Application: Physicochemical, Thermal, Mechanical, and Barrier Properties. Energy Procedia 2014, 56, 201–210. [Google Scholar] [CrossRef] [Green Version]
- Bioplastics Market Data 2017. Global Production Capacities of Bioplastics 2017–2022. Available online: https://docs.european-bioplastics.org/publications/market_data/2017/Report_Bioplastics_Market_Data_2017.pdf (accessed on 22 July 2019).
- Korol, J.; Rydarowski, H. Wytwarzanie i Badanie Właściwości Biokompozytów Polimerowych na Bazie Polietylenu i Skrobi Termoplastycznej. In Polimery I Kompozyty Konstrukcyjne; Wróbel, G., Ed.; Logos Press: Cieszyn, Poland, 2011; pp. 218–225. [Google Scholar]
- Kuciel, S.; Rydarowski, H. Biokompozyty z Surowców Odnawialnych; Collegium Columbinum: Kraków, Poland, 2012. [Google Scholar]
- Chow, C.; Xing, X.; Li, R. Moisture absorption studies of sisal fibre reinforced polypropylene composites. Compos. Sci. Technol. 2007, 67, 306–313. [Google Scholar] [CrossRef]
- Hoekstra, A.Y. Virtual Water Trade. In Proceedings of the International, Expert Meeting on Virtual Water Trade. Value of Water Research Report Series (No. 12), Delft, The Netherlands, 12–13 December 2002; UNESCO-IHE Institute for Water Education: Delft, The Netherlands, 2003. Available online: https://waterfootprint.org/media/downloads/Report12.pdf (accessed on 17 July 2019).
- Hoekstra, A.Y. A critique on the water-scarcity weighted water footprint in LCA. Ecol. Indic. 2016, 66, 564–573. [Google Scholar] [CrossRef] [Green Version]
- Zhou, L.; Mekonnen, M.M.; Hoekstra, A.Y. The effect of inter-annual variability of consumption, production, trade and climate on crop-related green and blue water footprints and inter-regional virtual water trade: A study for China (1978–2008). Water Res. 2016, 94, 73–85. [Google Scholar] [CrossRef] [PubMed]
- Hoekstra, A.Y.; Chapagain, A.K.; Aldaya, M.M.; Mekonnen, M.M. The Water Footprint Assessment Manual: Setting the Global Standard; Earthscan: London, UK, 2011; Available online: https://waterfootprint.org/media/downloads/TheWaterFootprintAssessmentManual_2.pdf (accessed on 17 July 2019).
- European Commission. 2013/179/EU: Commission Recommendation of 9 April 2013 on the Use of Common Methods to Measure and Communicate the Life Cycle Environmental Performance of Products and Organisations; European Commission: Brussels, Belgium, 2013; Available online: https://eur-lex.europa.eu/eli/reco/2013/179/oj (accessed on 17 July 2019).
- Harding, K.G.; Dennis, J.S.; von Blottnitz, H.; Harrison, S.T.L. Environmental analysis of plastic production processes: Comparing petroleum-based polypropylene and polyethylene with biologically-based poly-beta-hydroxybutyric acid using life cycle analysis. J. Biotechnol. 2007, 130, 57–66. [Google Scholar] [CrossRef] [PubMed]
- Althaus, H.J.; Dinkel, F.; Werner, F. Life Cycle Inventories of Renewable Materials. Final Report Ecoinvent Data V.2.0.; Swiss Centre for LCI, Empa-TSL: Dűbendorf, Switzerland, 2007. [Google Scholar]
- Kellenberger, D.; Althaus, H.J.; Jungbluth, N.; Künniger, T. Life Cycle Inventories of Building Products. Final Report Ecoinvent Data V.2.0.; Swiss Centre for LCI, Empa-TSL: Dűbendorf, Switzerland, 2007. [Google Scholar]
- U.S. Life Cycle Inventory Database. Available online: https://www.lcacommons.gov/nrel/search (accessed on 22 July 2019).
- Nemecek, T.; Kägi, T.; Blaser, S. Life Cycle Inventories of Agricultural Production Systems. Ecoinvent Report Version 2.0.; Swiss Centre for LCI, Empa-TSL: Dűbendorf, Switzerland, 2007. [Google Scholar]
- National Institute of Research on Jute and Allied Fibre Technology. Available online: http://www.nirjaft.res.in (accessed on 22 July 2019).
- Mekonnen, M.M.; Hoekstra, A.Y. The green, blue and grey water footprint of crops and derived crop products. Hydrol. Earth Syst. Sci. 2011, 15, 1577–1600. [Google Scholar] [CrossRef] [Green Version]
- Larson, W.; Richter, B.; Birner, S.; Selvendiran, P. Water Footprint Assessments. Dehydrated Onion Products Micro-Irrigation Systems; Jain Irrigation Systems Ltd.: Jalgaon, Maharashtra, India, 2010. [Google Scholar]


| Component | Variant | |||||
|---|---|---|---|---|---|---|
| PP | PP/PLA | PP/CF | PP/JF | PP/KF | PP/GF | |
| Content, wt % | ||||||
| Polypropylene | 100 | 70 | 70 | 70 | 70 | 90 |
| Poly(lactic acid) | - | 30 | - | - | - | - |
| Cotton fibers | - | - | 30 | - | - | - |
| Jute fibers | - | - | - | 30 | - | - |
| Kenaf fibers | - | - | - | - | 30 | - |
| Glass fibers | - | - | - | - | - | 10 |
© 2019 by the authors. Licensee MDPI, Basel, Switzerland. This article is an open access article distributed under the terms and conditions of the Creative Commons Attribution (CC BY) license (http://creativecommons.org/licenses/by/4.0/).
Share and Cite
Korol, J.; Hejna, A.; Burchart-Korol, D.; Chmielnicki, B.; Wypiór, K. Water Footprint Assessment of Selected Polymers, Polymer Blends, Composites, and Biocomposites for Industrial Application. Polymers 2019, 11, 1791. https://doi.org/10.3390/polym11111791
Korol J, Hejna A, Burchart-Korol D, Chmielnicki B, Wypiór K. Water Footprint Assessment of Selected Polymers, Polymer Blends, Composites, and Biocomposites for Industrial Application. Polymers. 2019; 11(11):1791. https://doi.org/10.3390/polym11111791
Chicago/Turabian StyleKorol, Jerzy, Aleksander Hejna, Dorota Burchart-Korol, Błażej Chmielnicki, and Klaudiusz Wypiór. 2019. "Water Footprint Assessment of Selected Polymers, Polymer Blends, Composites, and Biocomposites for Industrial Application" Polymers 11, no. 11: 1791. https://doi.org/10.3390/polym11111791