Article

Nutritional Characterization of Chilean Landraces of Common Bean

1
Centro de Estudios en Alimentos Procesados (CEAP), Campus Lircay, Talca 3480094, Chile
2
Departamento de Producción Agrícola, Facultad de Ciencias Agrarias, Universidad de Talca, Talca 3460000, Chile
3
Laboratorio de Genética Molecular Vegetal, Instituto de Nutrición y Tecnología de los Alimentos, Universidad de Chile, Santiago 7830490, Chile
4
Laboratorio de Genómica Funcional & Bioinformática, Facultad de Ciencias Agronómicas, Universidad de Chile, Santiago 8820808, Chile
5
Departamento de Ciencias Vegetales, Facultad de Agronomía e Ingeniería Forestal, Pontificia Universidad Católica de Chile, Santiago 7820436, Chile
*
Authors to whom correspondence should be addressed.
These authors contributed equally to this work.
Plants 2024, 13(6), 817; https://doi.org/10.3390/plants13060817
Submission received: 4 February 2024 / Revised: 5 March 2024 / Accepted: 6 March 2024 / Published: 12 March 2024
(This article belongs to the Section Crop Physiology and Crop Production)

Abstract

:
Common bean (Phaseolus vulgaris L.) is the primary grain legume cultivated worldwide for direct human consumption due to the high nutritional value of its seeds and pods. The high protein content of common beans highlights it as the most promising source of plant-based protein for the food industry. Additionally, landraces of common bean have great variability in nutritional traits, which is necessary to increase the nutritional quality of elite varieties. Therefore, the main objective of this study was to nutritionally characterize 23 Chilean landraces and 5 commercial varieties of common bean to identify genotypes with high nutritional value that are promising for the food industry and for genetic improvement programs. The landrace Phv23 (‘Palo’) was the most outstanding with high concentrations of minerals such as P (7.53 g/kg), K (19.8 g/kg), Mg (2.43 g/kg), Zn (52.67 mg/kg), and Cu (13.67 mg/kg); essential amino acids (364.8 mg/g protein); and total proteins (30.35 g/100 g seed). Additionally, the landraces Phv9 (‘Cimarrón’), Phv17 (‘Juanita’), Phv3 (‘Araucano’), Phv8 (‘Cabrita/Señorita’), and Phv4 (‘Arroz’) had a high protein content. The landrace Phv24 (‘Peumo’) stood out for its phenolic compounds (TPC = 218.1 mg GA/100 g seed) and antioxidant activity (ORAC = 22,167.9 μmol eq trolox/100 g extract), but it has moderate to low mineral and protein concentrations. In general, the concentration of nutritional compounds in some Chilean landraces was significantly different from the commercial varieties, highlighting their high nutritional value and their potential use for the food industry and for genetic improvement purposes.

1. Introduction

Common bean (Phaseolus vulgaris L.) is one of the most cultivated and consumed legumes in the world, especially in Latin America and Africa [1,2]. Common bean is the most important species among the genus Phaseolus L. cultivated for direct human consumption, contributing about 30% of the total daily protein intake in developing countries [3]. In addition, the high protein content of common beans is associated with increased satiety, and hence its consumption could help to treat obesity [4]. This legume is mainly consumed as dry beans or fresh vegetable in the form of snap bean pods [2]. Due to its high nutritional value and the demand for healthier foods [5], the world production of common beans reached 28.3 million metric tons in 2022, cultivated on a global area of about 36.7 million hectares, where the main producing region was Asia, followed by America and Africa [6].
Nutritionally, common beans are recognized as a good and inexpensive source of proteins, which have a concentration 2 to 3 times higher than cereal grains [7]. In fact, bean grains have between 20 and 30% protein; contain essential amino acids, folates, and complex carbohydrates such as dietary fiber; and are low in saturated fats [7,8]. They are also a rich source of vitamins such as folates, tocopherols, thiamine, riboflavin, niacin, biotin, and pyridoxine, and minerals such as potassium, phosphorus, calcium, iron, and zinc [1,7]. Additionally, common beans are characterized by a high content of bioactive compounds (flavonoids, tannins, phenolic, and other antioxidants), which have properties to reduce the risk of cancer and other chronic diseases [9,10]. Despite their nutritional benefits, common beans also contain anti-nutrients such as some enzyme inhibitors (α-amylase, trypsin, chymotrypsin), phytic acid, flatulence factors (oligosaccharides), and lectins, which affect the bioavailability and digestibility of nutrients and minerals [11].
Both nutritional and anti-nutritional compounds are influenced by agronomic management [12], environmental conditions [13], and genotypes [14,15]. Traditionally, the main objective of phenotypic selection in common bean has been to increase the yield during the domestication and post-domestication processes [16]. Therefore, most modern cultivars have lower levels of nutrients and vitamins [17]. In this sense, exploring the diversity related to nutritional and anti-nutritional parameters in ancient, landrace, or wild common beans is a key prerequisite to increase the nutritional quality of modern varieties. The common bean is divided into two gene pools, Mesoamerican and Andean, which are eco-geographically, morphologically, and genetically different [18]. Within the Andean genetic pool, the Chilean race of common bean is particularly interesting as modern Chilean landraces maintain levels of variability and genetic identity like the ancestral common bean from Argentina, being recognized as a genetic reservoir of the current Andean gene pool [19] and therefore as a possible source of alleles associated with nutritional quality. In this context, the Chilean landraces of common bean represent an interesting genetic resource to evaluate their nutritional value for food and genetic improvement purposes.
From a nutritional point of view, Chilean landraces of common bean have been poorly studied. In fact, the only study evaluating the nutritional composition was carried out by Paredes et al. [20], who found a wide variability of macro- and micro-elements such as N, Fe, and Zn in the seeds. Considering that landraces are significant sources of protein, carbohydrates, vitamins, and minerals which are necessary for food security and healthy food supply [21], the main goal of this research was to nutritionally characterize Chilean landraces of common bean to identify some promising landraces with high nutritional value for direct consumption, the development of functional ingredients, and breeding purposes.

2. Results

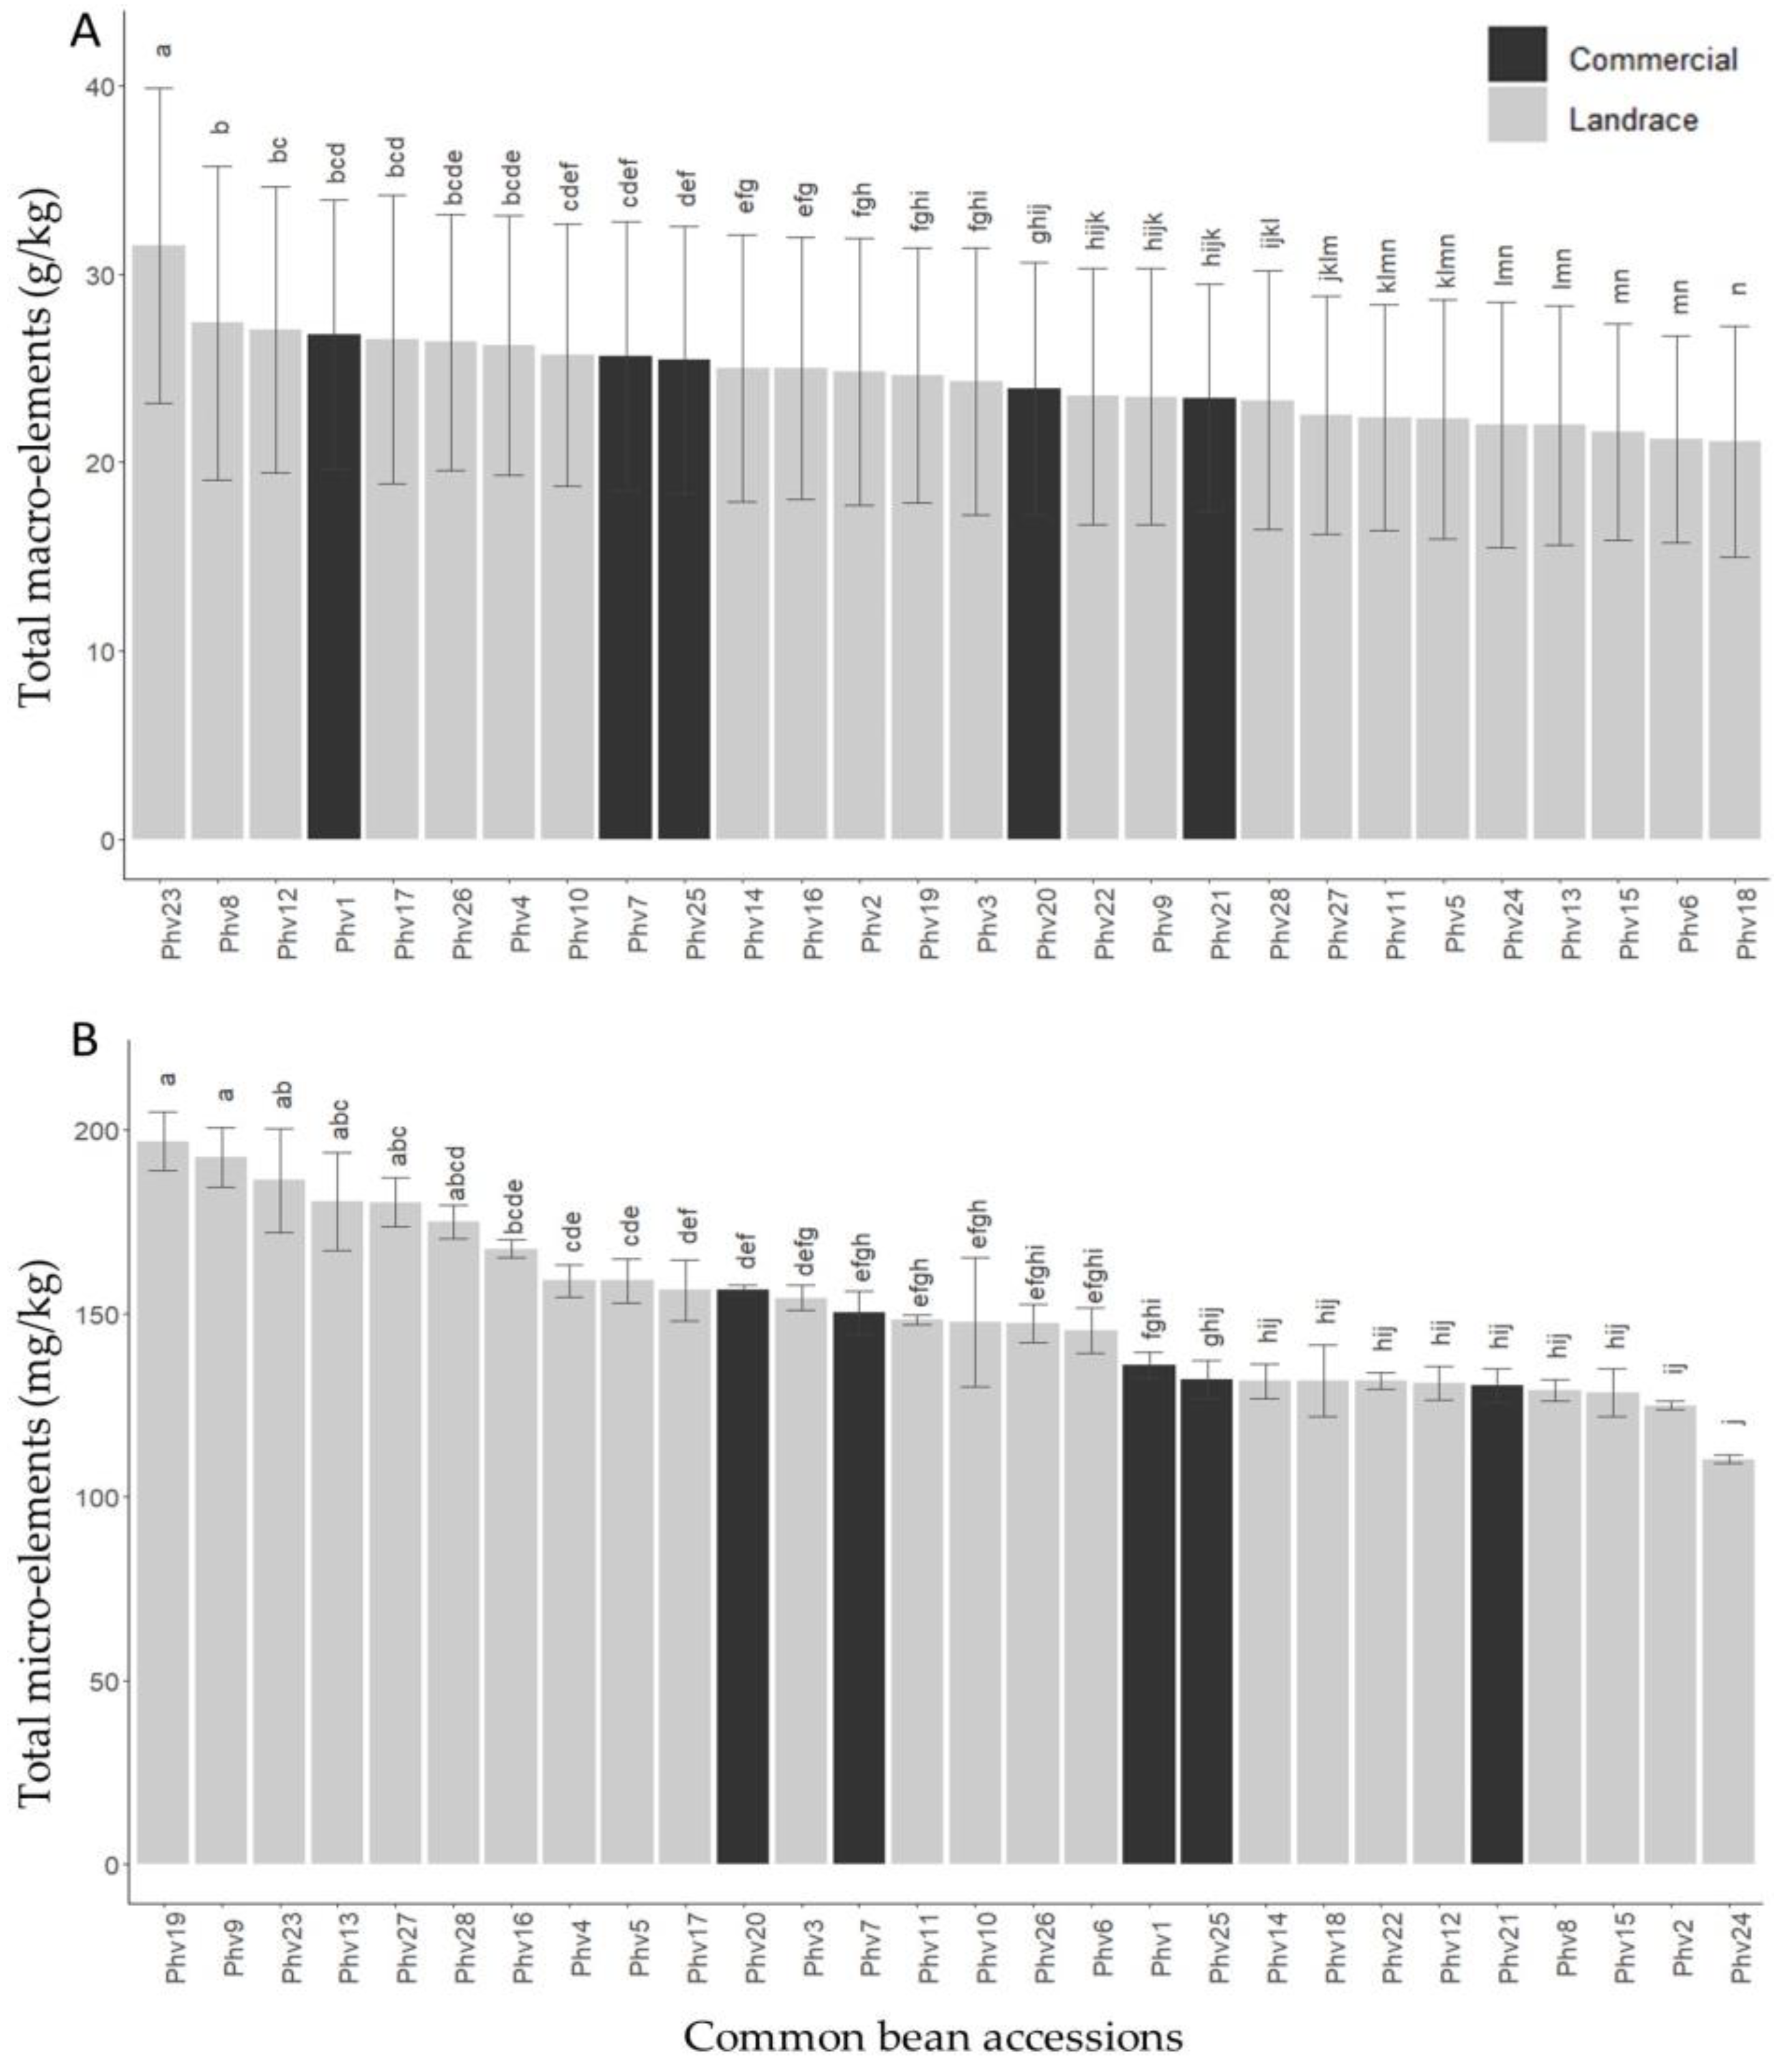
2.1. Variability among Chilean Common Beans

A summary of the descriptive statistics (mean, standard deviation, and range) for the 31 nutritional traits evaluated in this study is shown in Table 1. Additionally, the raw data (Table S1) and descriptive statistics for the 23 Chilean landraces and 5 commercial varieties of common beans are shown in Table S2. The analysis of variance (ANOVA) indicated that there are significant differences between the common bean accessions for all the traits evaluated (Table 1; Table S2), which will be discussed in the following sections.

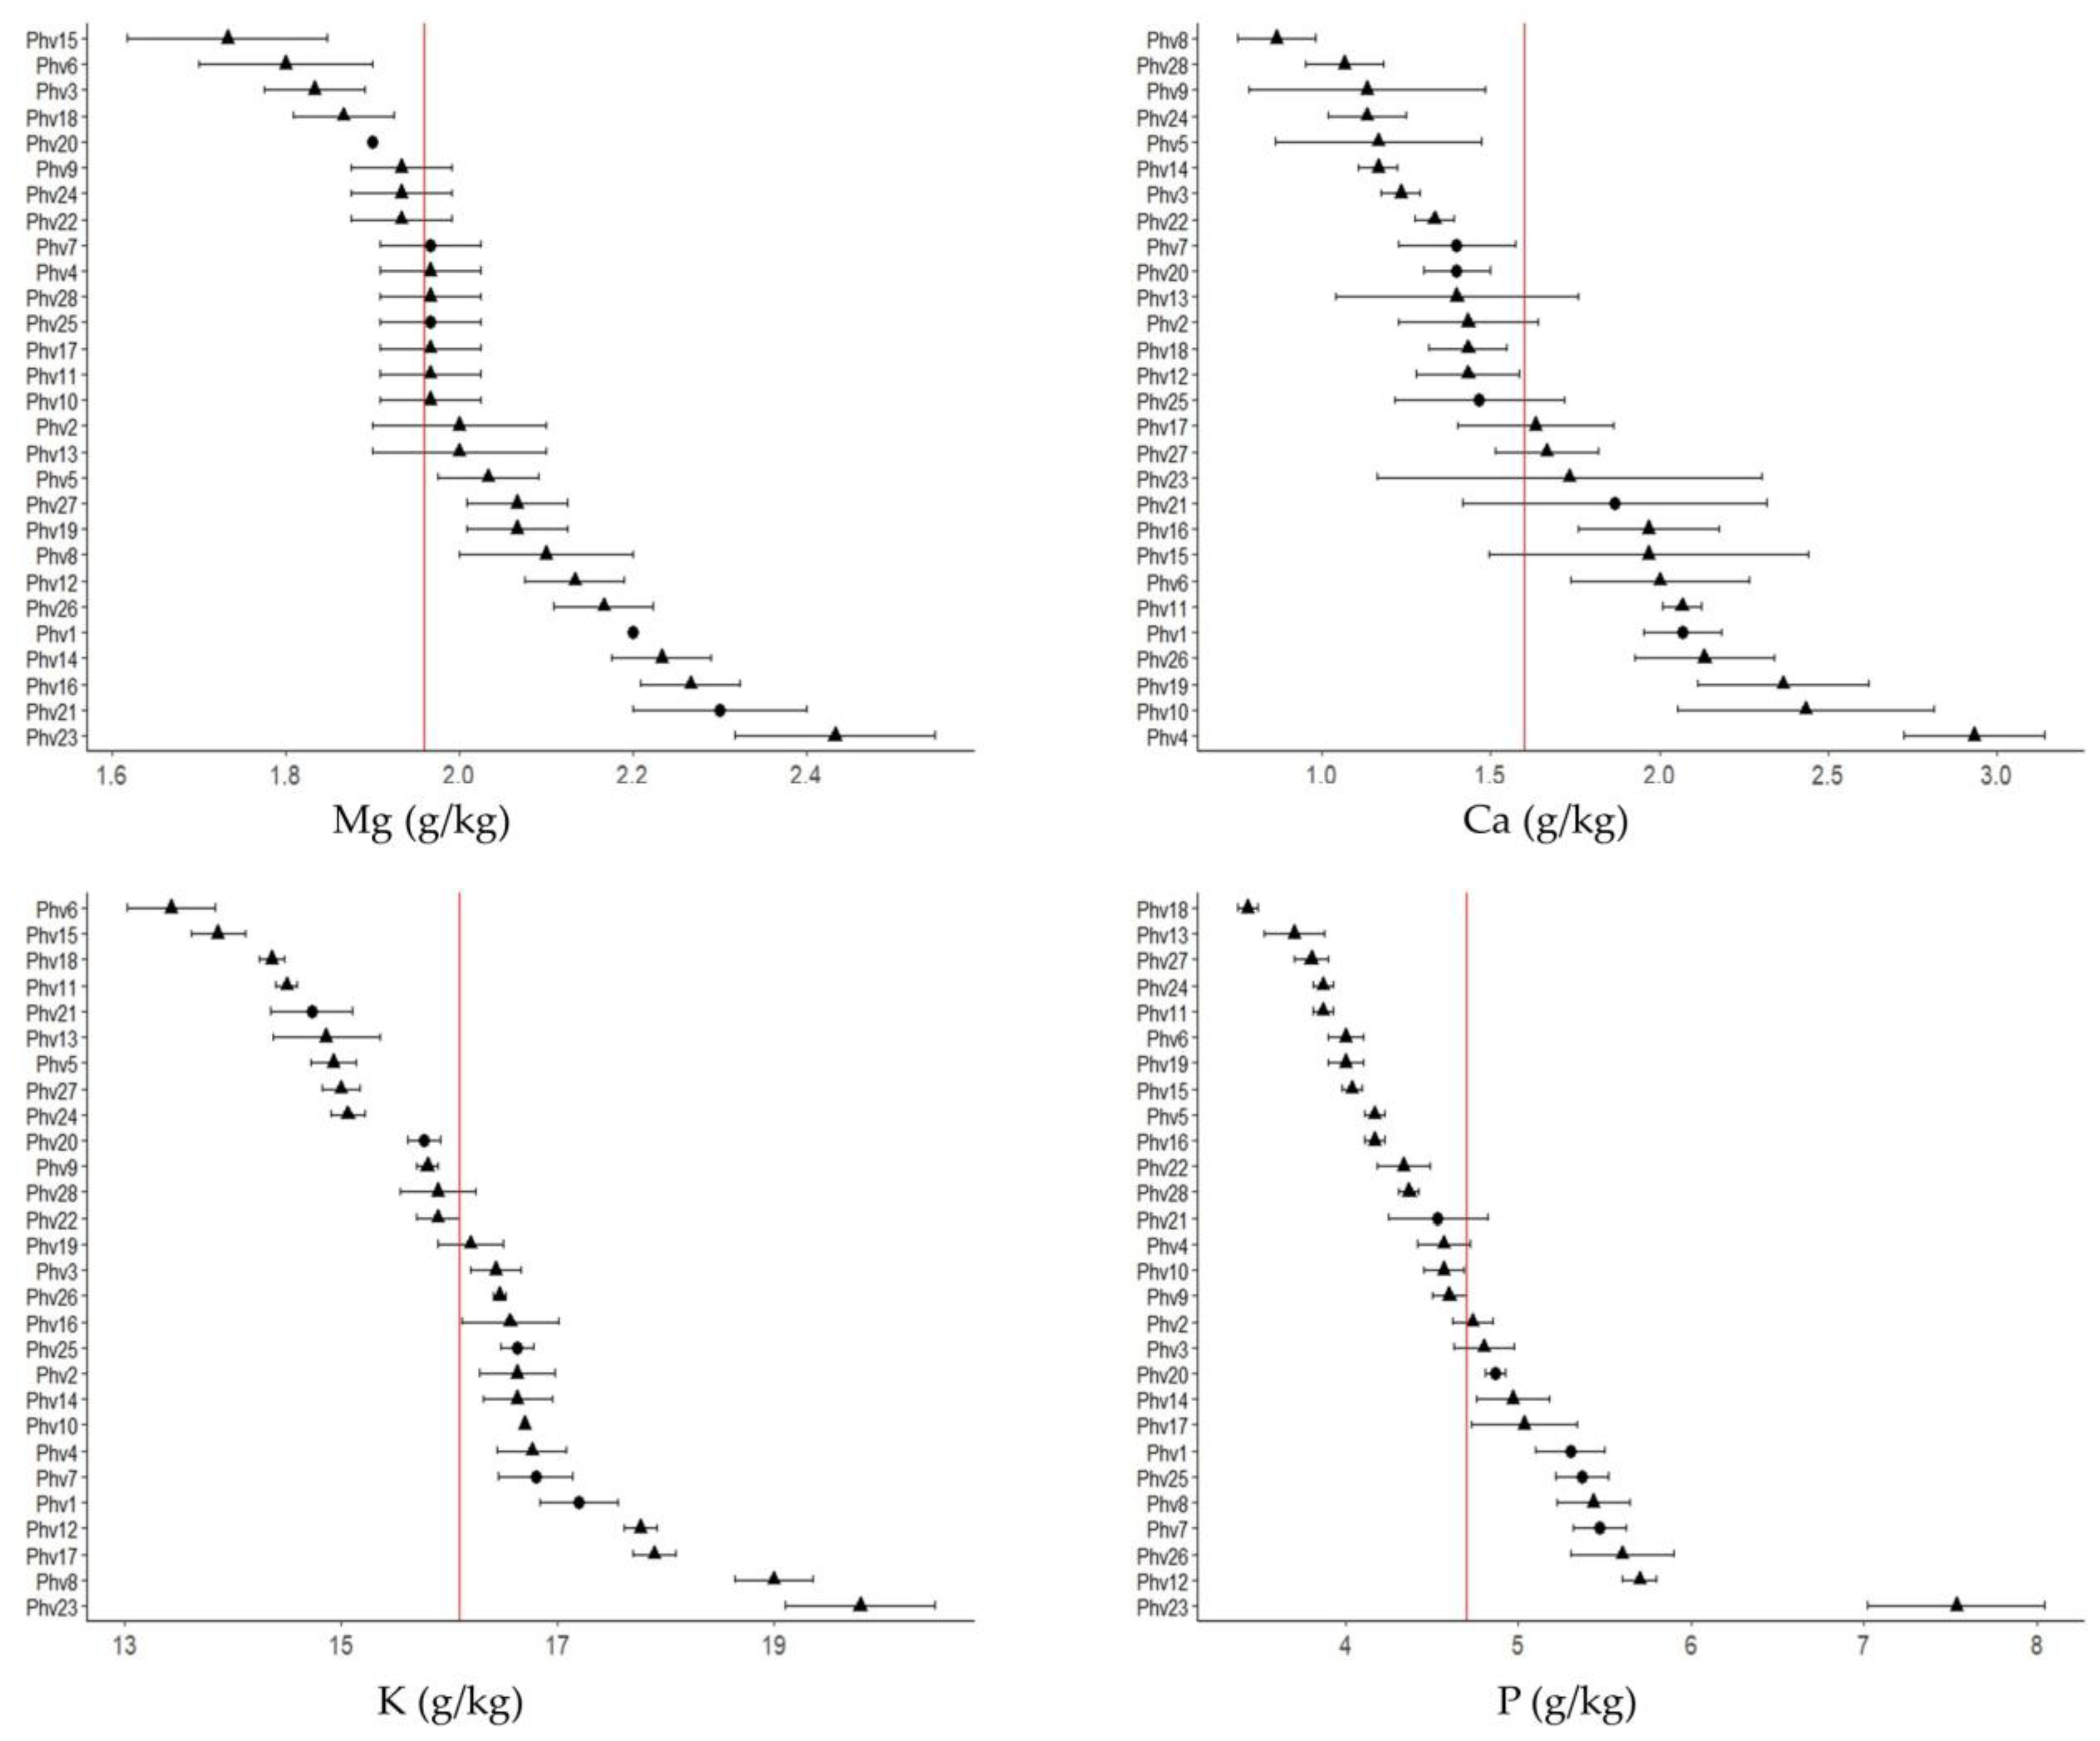
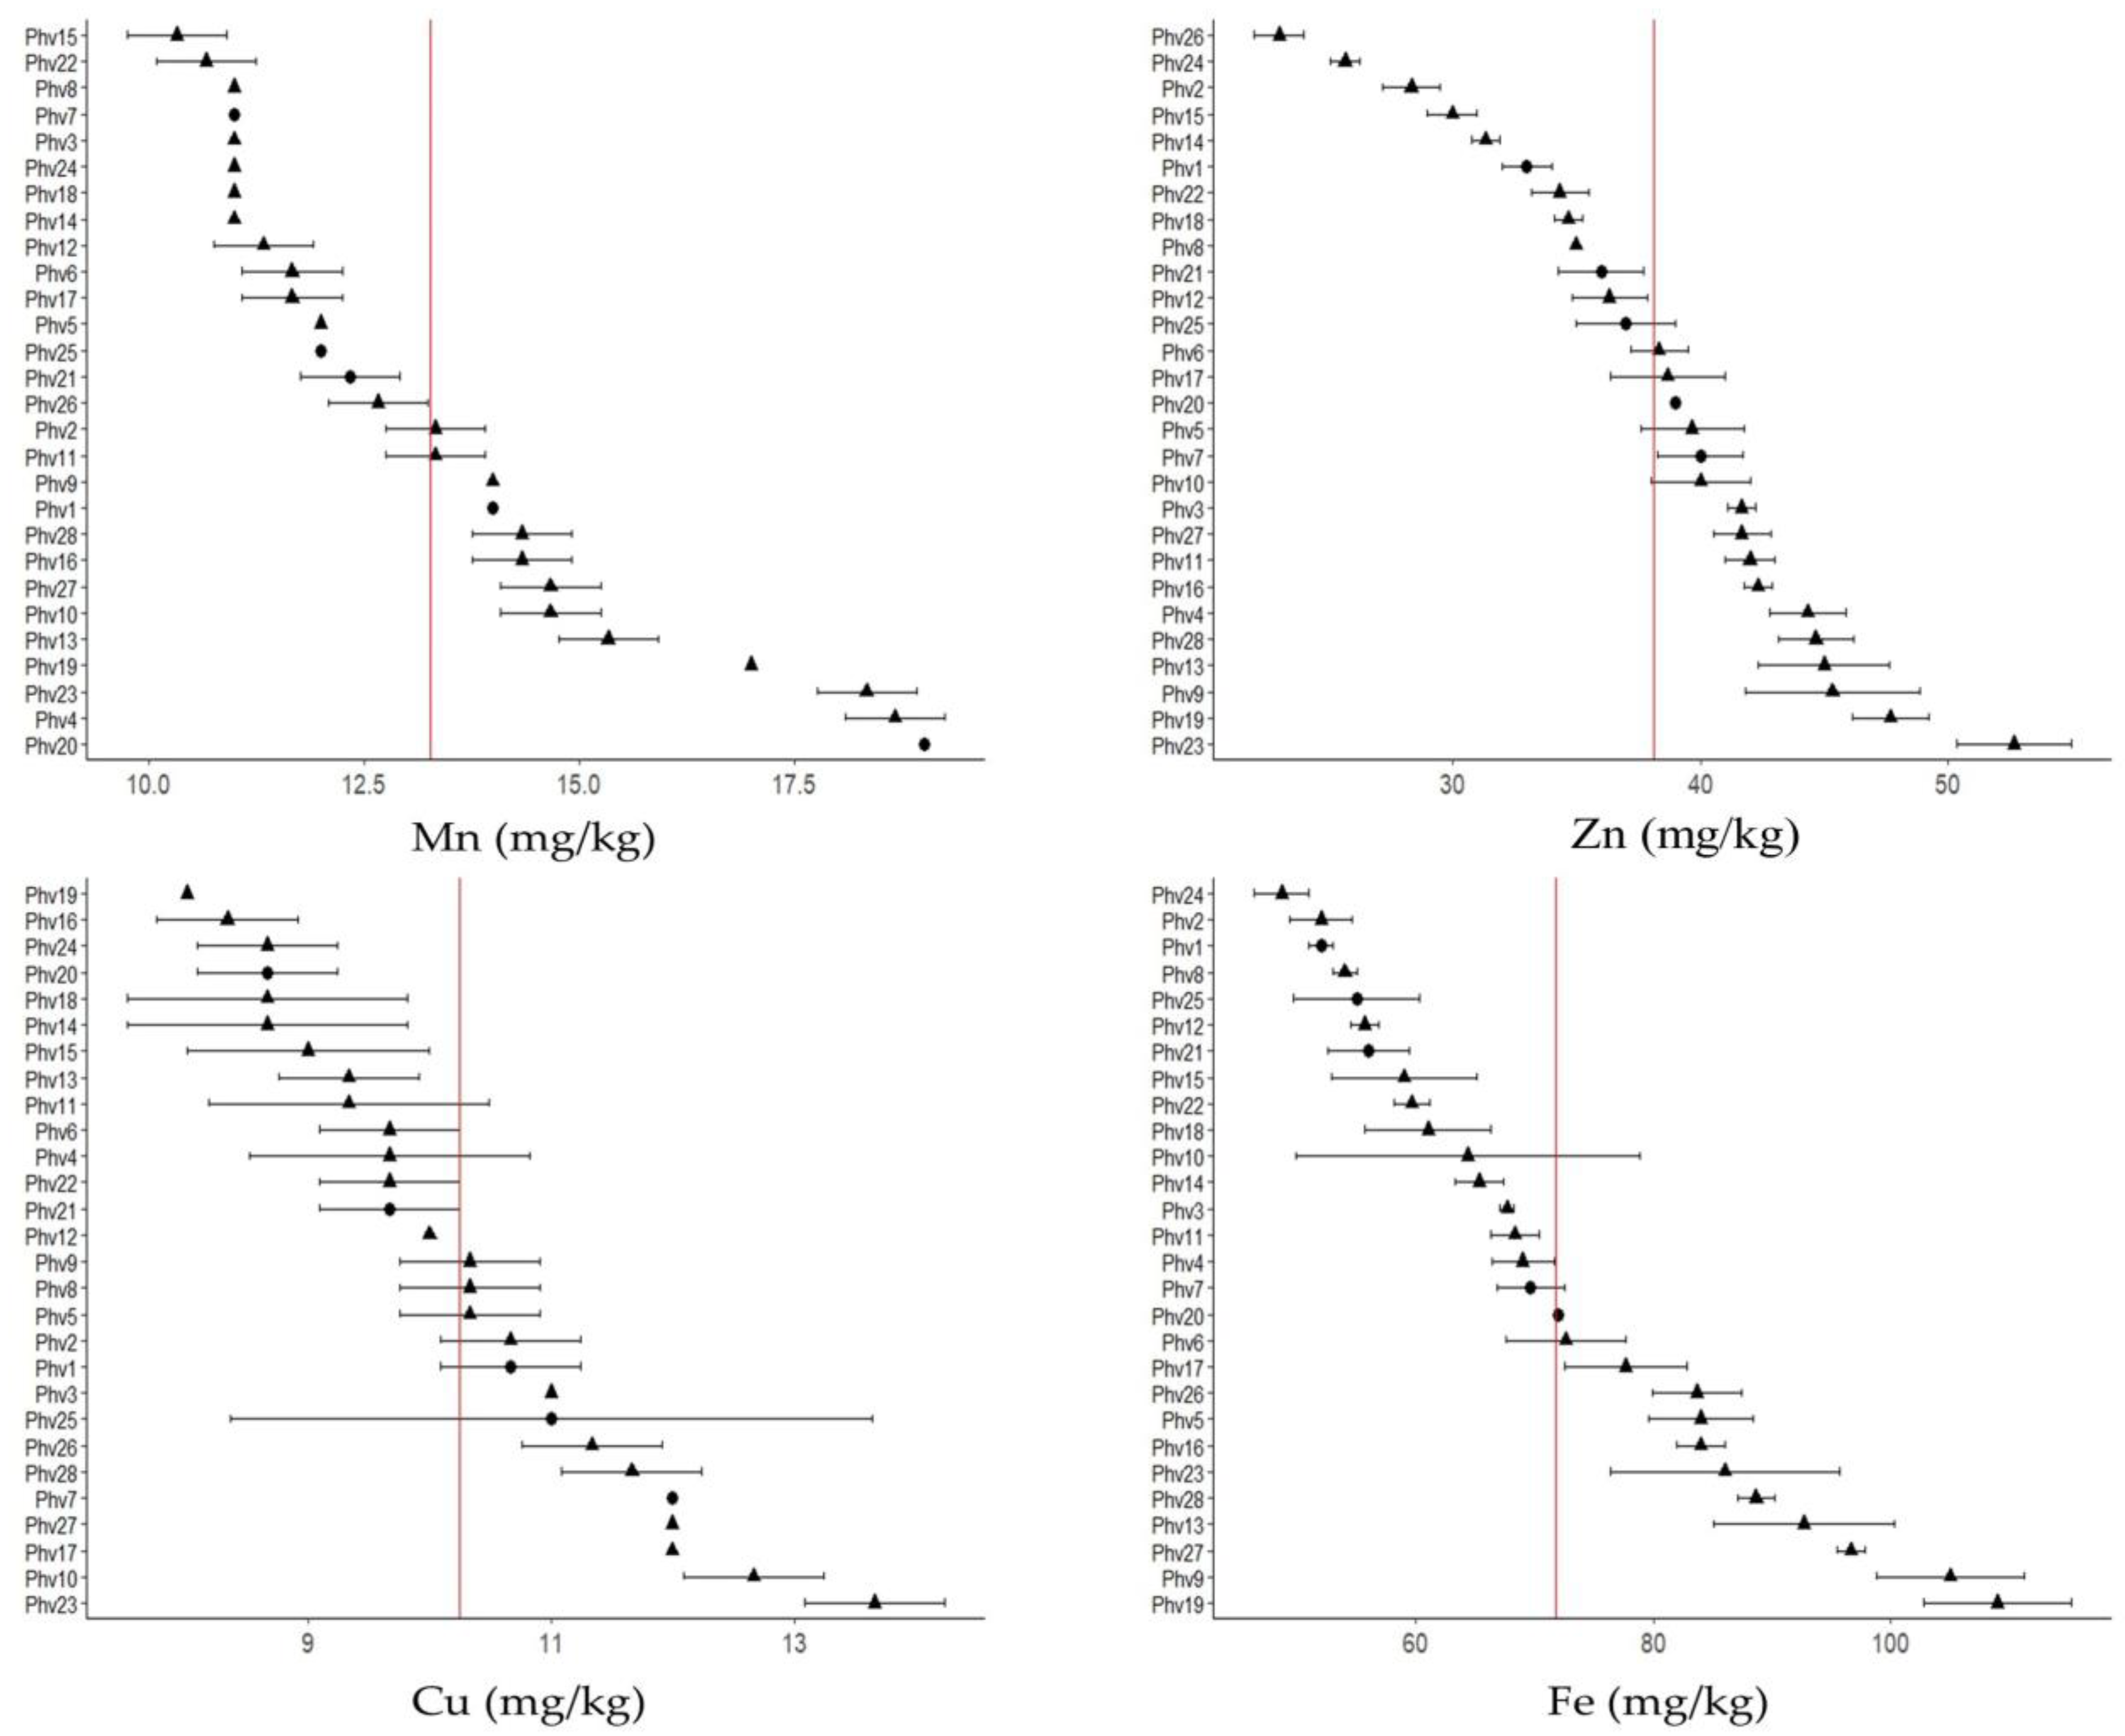
2.2. Mineral Contents

In general, Fe (71.76 mg/kg) was the micro-element most abundant within the accessions evaluated, while Cu (10.25 mg/kg) was the one with the lowest concentration. For the macro-elements, K and Ca were the elements with the highest (16.13 g/kg) and lowest (1.64 g/kg) concentration, respectively (Table 1). The mineralogical analysis of the Chilean common bean accessions for macro- and micro-elements showed wide and significant variation for all minerals analyzed (Figure 1).
The Phv23 (‘Palo’) and Phv18 (‘Manteca’) Chilean landraces were those with the highest (31.5 g/kg) and lowest (21.1 g/kg) concentration of macro-elements, respectively (Figure 1A). Specifically, the Phv23 landrace was the one that presented the highest concentration for all macro-elements (P = 7.53 g/kg; K = 19.8 g/kg; Mg = 2.43 g/kg) except for Ca, where the Phv4 (‘Arroz’) landrace had the highest concentration (2.93 g/kg). The lowest concentrations of P (3.43 g/kg), K (13.43 g/kg), Ca (0.87 g/kg), and Mg (1.73 g/kg) were found for the Phv18 (‘Manteca’), Phv6 (‘Azufrado’), Phv8 (‘Cabrita/Señorita’), and Phv15 (‘Hallado Alemán’) Chilean landraces, respectively. For total micro-elements, the Phv19 (‘Mantequilla’) Chilean landrace was the one with the highest concentration (190.0 mg/kg), while the Phv24 (‘Peumo’) landrace was the one with the lowest (110.33 mg/kg) concentration (Figure 1B). Interestingly, the Phv23 (‘Palo’) landrace was the one with the highest concentration of Zn (52.67 mg/kg) and Cu (13.67 mg/kg). In fact, Phv23 (‘Palo’) had a high concentration of total micro-elements, which is significantly different with respect to commercial varieties. The commercial varieties presented intermediate values for all macro- and micro-elements, except for Mn, where the Phv20 (‘Miami’) variety had the highest concentration (19.0 mg/kg).
In summary, for the total mineral concentration, the Chilean landrace Phv23 (‘Palo’) stands out among all the Chilean landraces evaluated, including the commercial varieties. The mean and standard deviation of all macro- and micro-elements for each accession are shown in Figure 2 and Figure 3, respectively.
The µXRF analysis showed that the highest Ca concentration was found in the coat seed, while K was mainly stored in the cotyledons (Figure 4A). The highest S concentration was found in the cotyledons while P was evenly distributed in both tissues (Figure 4B).

2.3. Amino Acid Profile and Protein Content

Glutamic acid (Glu) was the most abundant amino acid (120.06 mg/g of protein) in the 28 common bean accessions, while Trans-4-hidroxyproline (4Hyp) was the least abundant (1.79 mg/g of protein; Table S2). The total concentration of essential amino acids (EAAs) showed a wide variation among the beans, where the Phv15 (‘Hallado Alemán’) and Phv28 (‘Tórtola’) had the highest (367.9 mg/g protein) and lowest (293.2 mg/g protein) concentration, respectively (Figure 5A). The Phv23 (‘Palo’) landrace, which had a high concentration of mineral elements, had the fifth highest concentration of EAAs; however, its concentration was not statistically different from the landrace with the highest concentration (Phv15: ‘Hallado Alemán’). In addition, Phv23 (‘Peumo’) was the one with the highest concentration of phenylalanine (59.4 mg/g protein), and also had high values of methionine (10.3 mg/g protein) and threonine (40.7 mg/g protein). The commercial varieties Phv21 (‘Negro’), Phv25 (‘Rojo Canda’), and Phv1 (‘Alubia’) had a high (366.6 mg/g protein), medium (342.4 mg/g protein), and low (311.5 mg/g protein) concentration of EAAs. The tryptophan (trp) concentration varied from 24.2 to 396.9 for Phv19 (‘Mantequilla’) and Phv26 (‘Sapito’) in the Chilean landraces, respectively (Figure S2). The total concentration of non-essential amino acids (NEAAs) varied significantly (Figure 5B), where the Chilean landraces Phv3 (‘Araucano’) and Phv28 (‘Tórtola’) had the highest (452.1 mg/g protein) and lowest (369.5 mg/g protein) concentration.
The Chilean landraces Phv15 (‘Hallado Alemán’), Phv3 (‘Araucano’), and Phv23 (‘Palo’) were the most interesting for total amino acid concentration. A complete summary of the EAA and NEEA contents for all 28 common bean accession is shown in Figures S3 and S4, respectively.
The soluble and total protein concentration varied significantly among the different common bean accessions (Figure 6). The total protein concentration of Chilean landraces ranged from 20.31% (Phv19: ‘Mantequilla’) to 30.35% (Phv23: ‘Palo’), while the total protein concentration of the commercial varieties ranged from 21.27% (Phv25: ‘Rojo Canada’) to 24.33% (Phv7: ‘Blanco Español’). The high concentration of total proteins in the landrace Phv23 (‘Palo’) is in accordance with the high concentration of total amino acids. Interestingly, the six accessions with the highest total protein concentration correspond to the Chilean landraces Phv23 (‘Palo’), Phv9 (‘Cimarrón’), Phv17 (‘Juanita’), Phv3 (‘Araucano’), Phv8 (‘Cabrita/Señorita’), and Phv4 (‘Arroz’), which were statistically different from the commercial varieties (Figure 6A).
The concentration of soluble proteins (SPs) varied widely among the Chilean landraces (Figure 6B). Phv24 (‘Peumo’) and Phv11 (‘Coscorrón’) had the highest (10.01 mg/mL) and lowest (1.77 mg/mL) SP concentration, respectively. The Phv24 (‘Peumo’), with high SPs, had a moderate concentration of total protein. On the contrary, the Phv23 (‘Palo’), with high TP, also had a moderate concentration of soluble proteins, indicating a possible negative correlation between these two (SP and TP) traits.

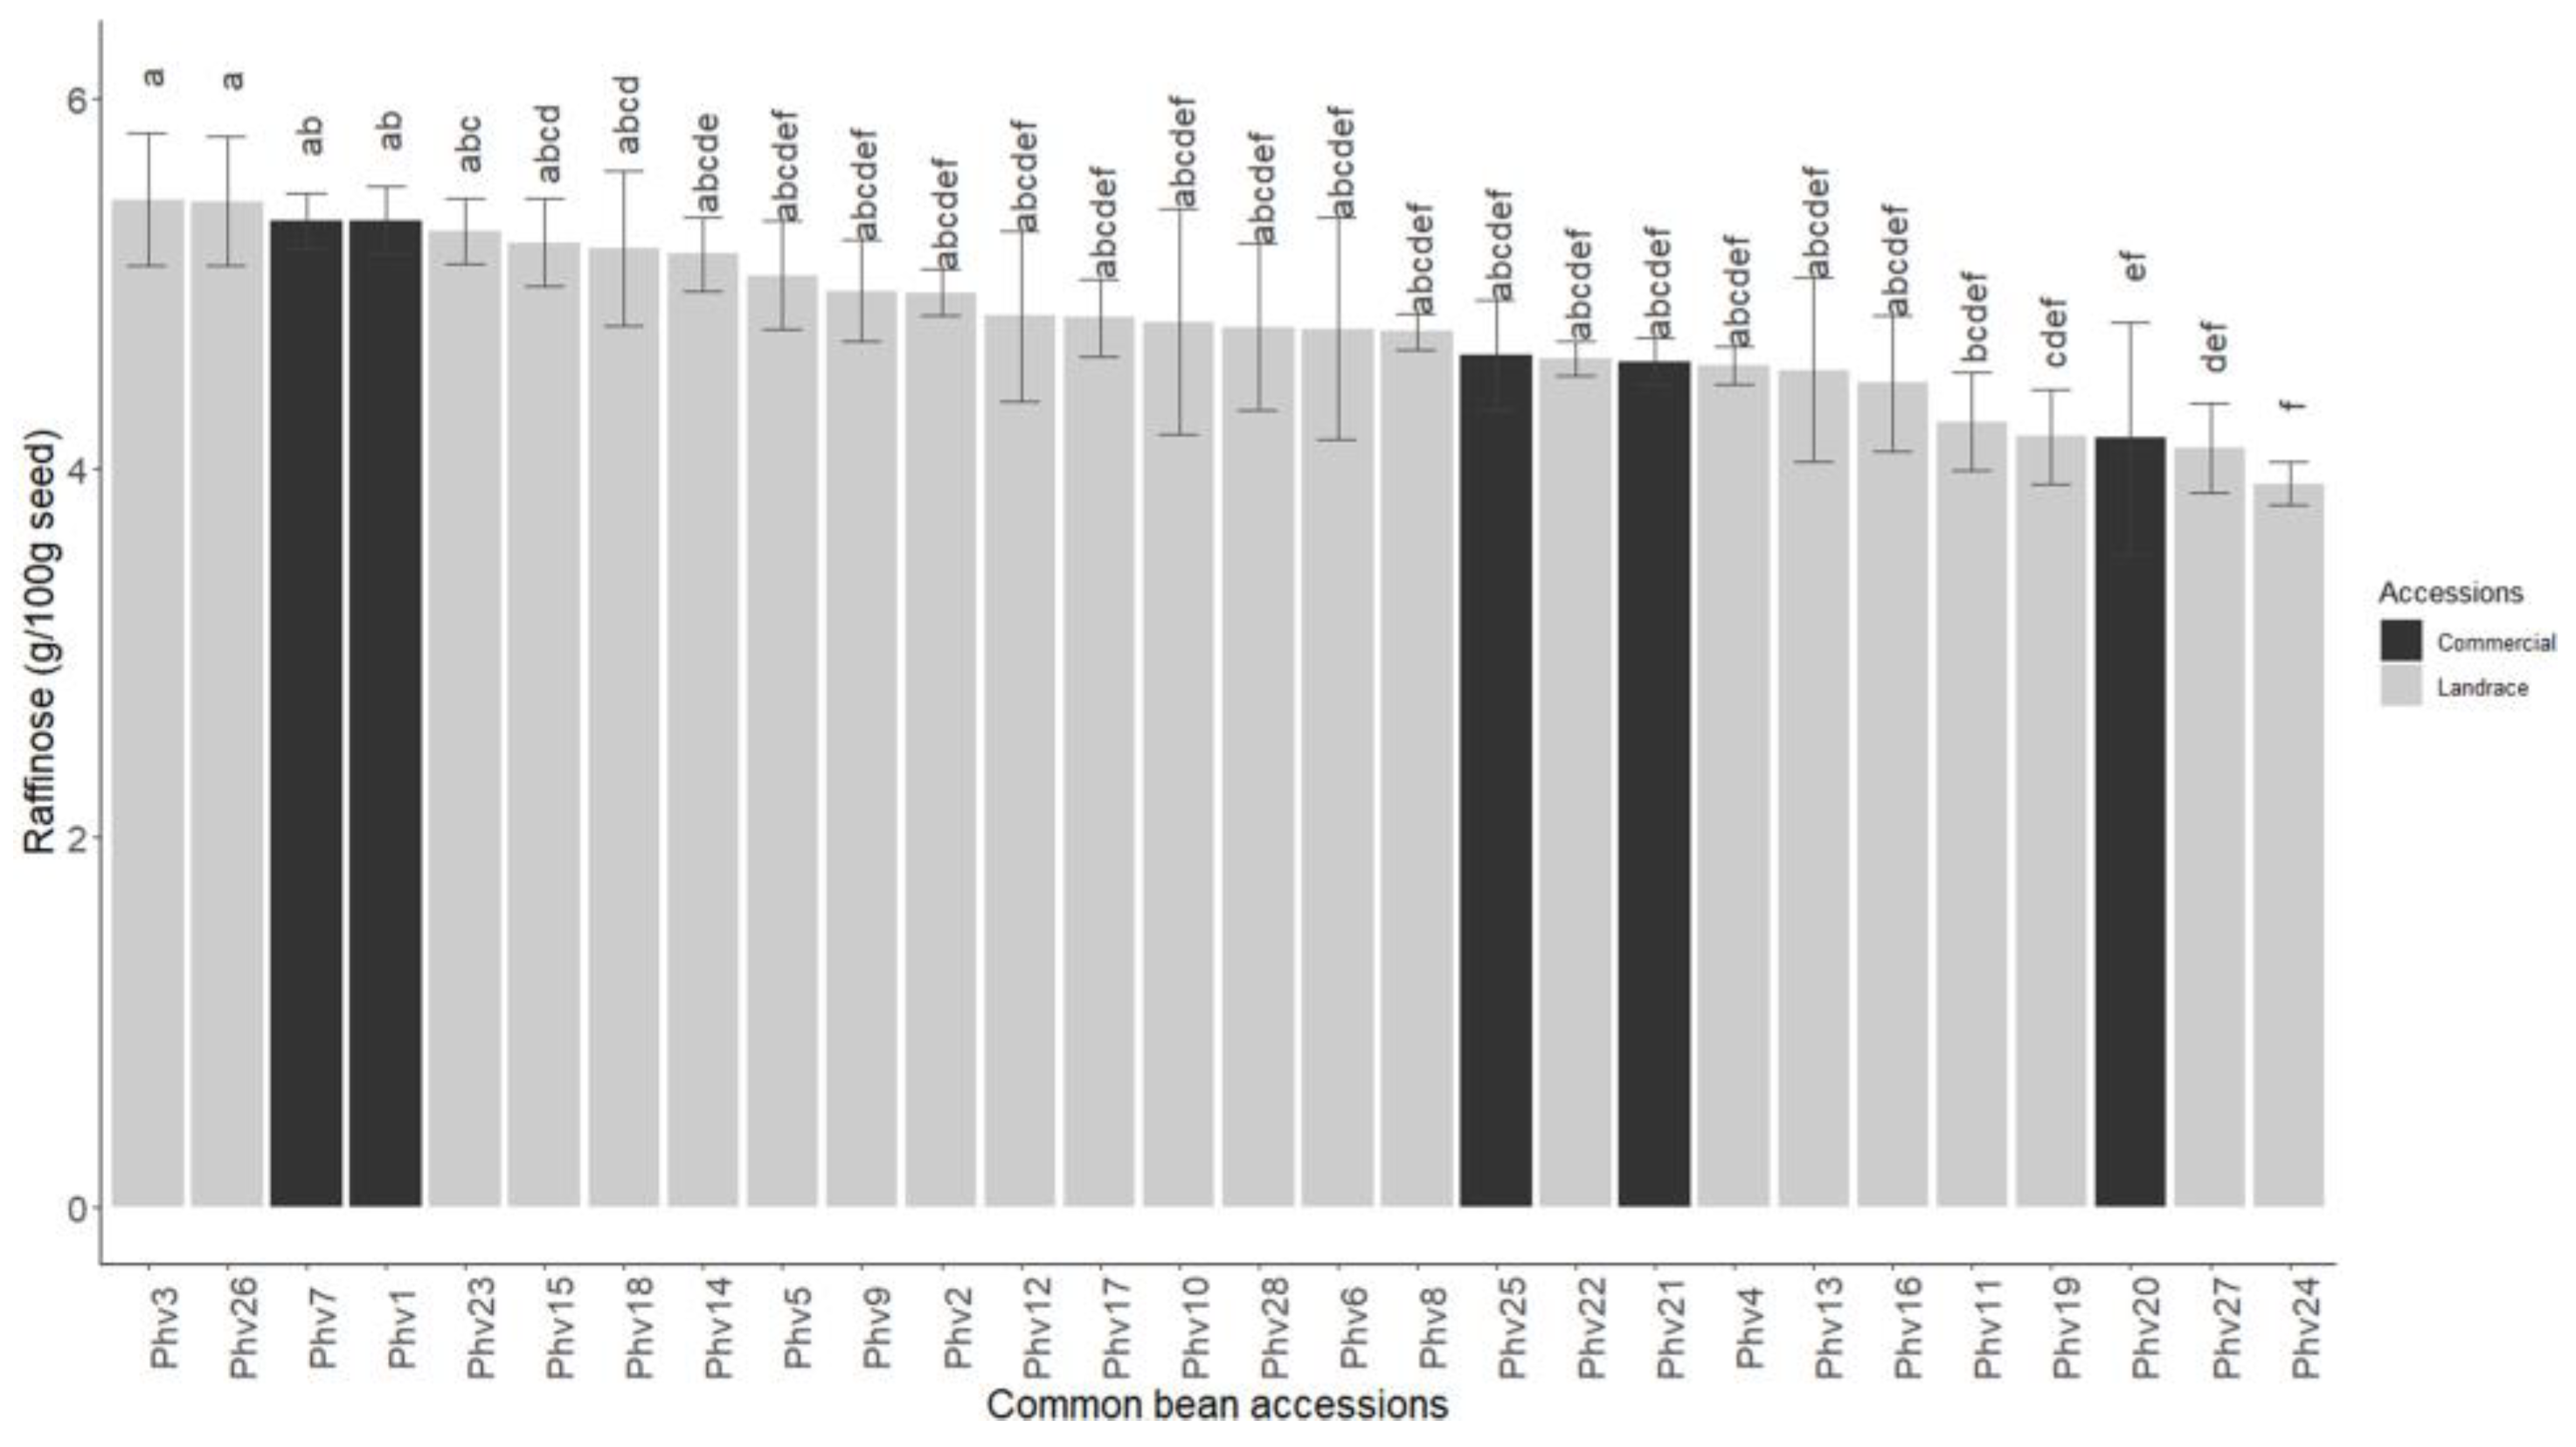
2.4. Sucrose and Raffinose Content

The raffinose (RFO) concentration of the Chilean common beans ranged significantly from 5.4 mmol/100 g in Phv3 (‘Araucano’) and Phv26 (‘Sapito’) to 3.92 mmol/100 g in Phv24 (‘Peumo’). However, the RFO concentration in Pvh24 (‘Peumo’) was not significantly different from the commercial varieties Phv25 (‘Rojo Canada’), Phv21 (‘Negro’), and Phv20 (‘Miami’), which had concentrations of 4.61, 4.58, and 4.16 mmol/100 g (Figure 7). Among the commercial varieties, the RFO concentration ranged from 4.16 mmol/100 g in Phv20 (‘Miami’) to 5.34 mmol/100 g in Phv1 (‘Alubia’) and Phv7 (‘Blanco Español’). In addition, the sucrose concentration exhibited greater variation than raffinose (Figure S5). In the Chilean landraces, the sucrose concentration ranged from 1.1% to 4.75% in Phv6 (‘Azufrado’) and Phv18 (‘Manteca’), respectively. The commercial varieties presented moderate concentration of sucrose varying from 2.25% to 3.47% in the varieties Phv20 (‘Miami’) and Phv21 (‘Negro’), respectively.

2.5. Antioxidant Activity and Phenolic Concentration

The total phenolic concentration (TPC) and oxygen radical absorbance capacity (ORAC) varied widely among the 28 common bean accessions (Figure 8). The Chilean landraces Phv24 (‘Peumo’) and Phv11 (‘Coscorrón’) had the highest (218.1 mg GA/100 g) and lowest (49.1 mg GA/100 g) TPC, while the commercial varieties had moderate to low TPC (Figure 8A). The ORAC varied from 4544.9 to 23,045.0 umol eq trolox/100g extract in the Chilean landraces Phv11 (‘Coscorrón’) and Phv3 (‘Araucano’), respectively (Figure 8B). The commercial variety Phv20 (‘Miami’) stands out for having a high ORAC (22,366.86 umol eq trolox/100 g extract) and TPC (150.30 mg GA/100 g). Additionally, the landrace Pvh24 (‘Peumo’), which has the highest TPC and one of the highest ORACs, had the lowest raffinose concentration and a moderate sucrose concentration, which suggests that Phv24 (‘Peumo´) can be used for direct consumption or the development of functional ingredients.

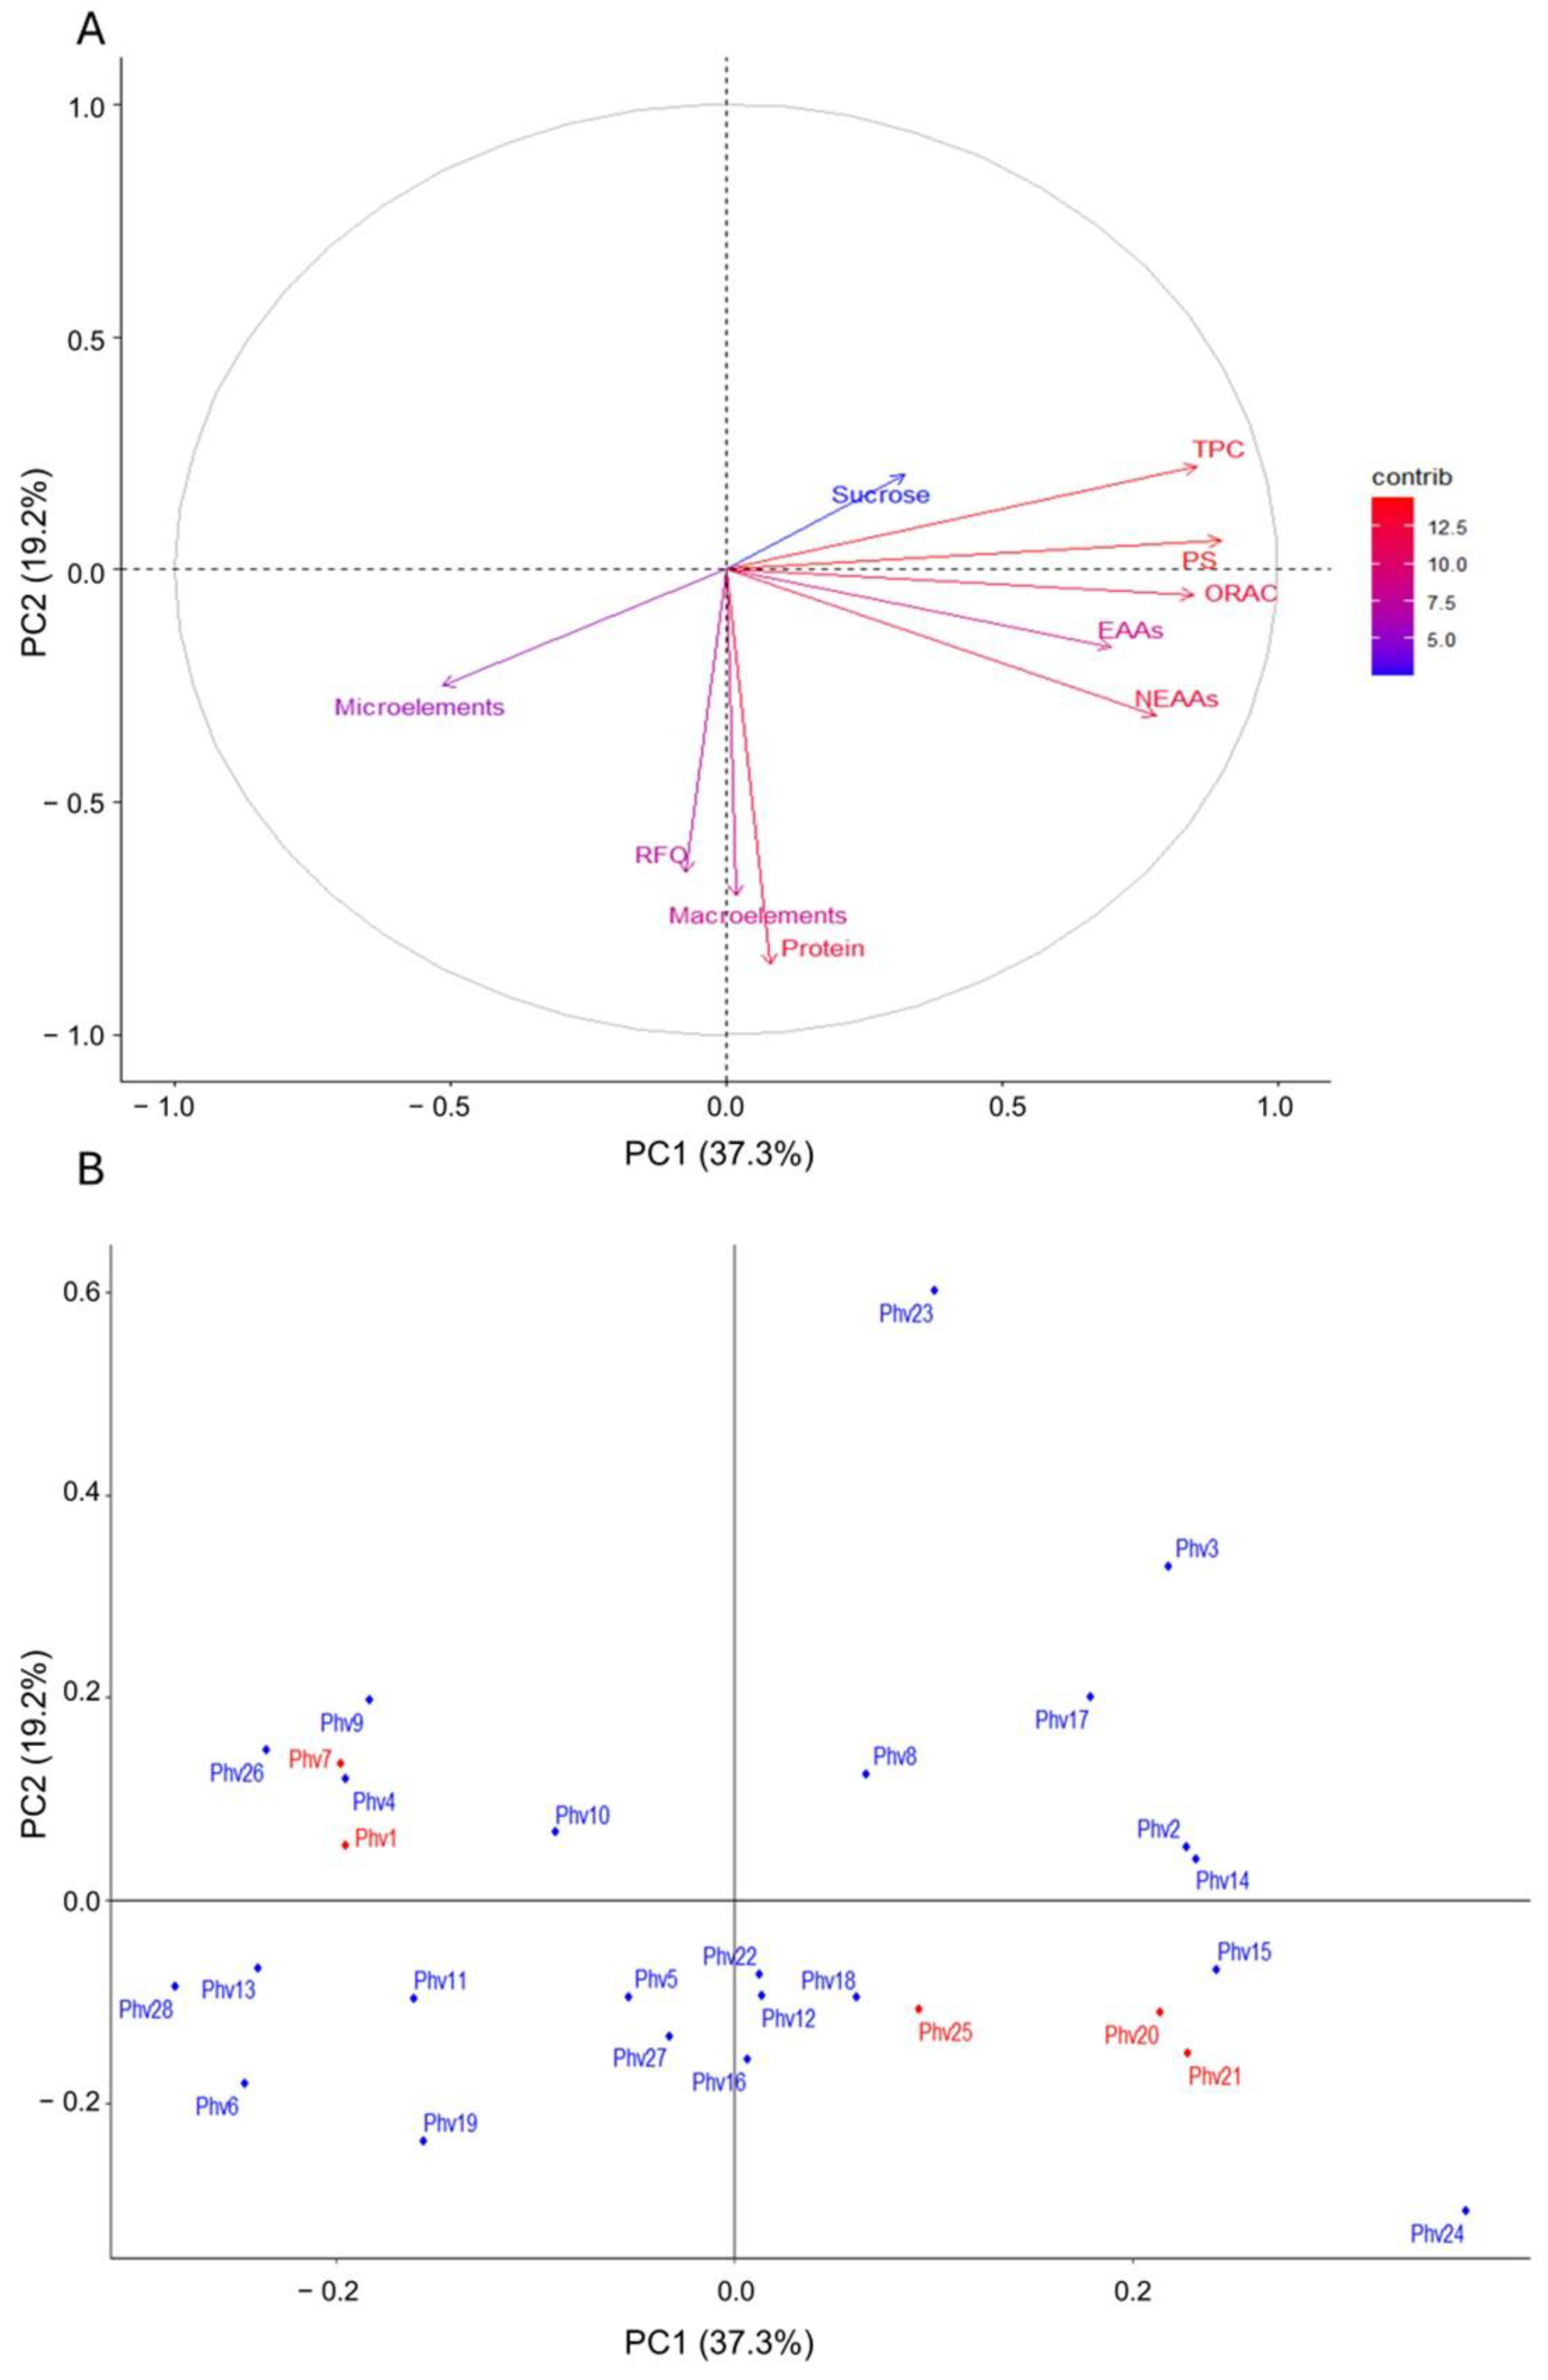
2.6. PCA and Correlations between the Traits

The principal component analysis based on sucrose, TPC, ORAC, total proteins (TP), soluble proteins (SP), raffinose (RFO), minerals (macro and micro), and amino acids (essential and non-essential) is shown in Figure 9A. Principal component 1 (PC1) and PC2 explained 37.3% and 19.2% of the total variance, respectively. There was no clear differentiation between the Chilean landraces and the commercial varieties (Figure 9B). PC1 was positively correlated with EAAs, NEAAs, ORAC, TPC, and SP, while it was negatively correlated with micro-elements. The loading plot from the PCA analysis indicated that SP and TPC contributed the most to the differentiation between accessions (Figure S6).
PCA based on minerals (micro and macro-elements) could not differentiate between the Chilean landraces and commercial varieties either (Figure S7A), where PC1 and PC2 explained 35.2% and 25.1% of the total variation, respectively. PC1 was negatively correlated with K, P, Mg, and Cu concentrations, while PC2 was positively correlated with B and negatively correlated with Ca (Figure S7B). In addition, the PCA based on amino acid (EAA and NEAA) concentration no differentiate between the Chilean landraces and the commercial varieties (Figure S8A), where PC1 and PC2 explained 46.8% and 15.5% of the total variation, respectively. PC1 was positively correlated with Leu, Ile, and Val, and negatively correlated with Trp, while PC2 was positively correlated with Asp and 4Hyp (Figure S8B).
Finally, the correlations between all the evaluated nutritional and anti-nutritional traits are shown in Figure 10. In general, most amino acids showed a significant and positive correlation between them, except for tryptophan and alanine which showed a negative correlation. A moderate positive correlation (r2 = 0.38*) exists between total protein concentration (nutritional compound) and RFO concentration (anti-nutritional compound). Additionally, soluble proteins (SPs) had a high and positive correlation with compounds related to antioxidant capacity such as TPC (r2 = 0.89*) and ORAC (r2 = 0.81*). In contrast, TPC had moderate negative correlations with some minerals such as Zn (r2 = −0.38), Fe (r2 = −0.41), and Ca (r2 = −0.39), while ORAC had a negative correlation with Fe (r2 = −0.38).

3. Discussion

3.1. Variability among Chilean Common Beans

Significant variability was found for the 31 nutritional and anti-nutritional traits in the 23 Chilean landraces and 5 commercial varieties of common bean evaluated. Considering that the Chilean landraces mainly have been evaluated from a genetic point of view [19,22,23], and are poorly studied nutritionally [20], these results are of great value since they confirm the potential of Chilean landraces to be used in the processed food industry, especially to make healthy food products as well as for the genetic improvement of the nutritional quality of commercial varieties.

3.2. Mineral Contents

The only study evaluating nutritional compounds in Chilean landraces was performed by Paredes et al. [20], who reported a wide variability in macro- and micro-elements. For macro-elements, P ranged from 4.0 to 5.6 g/kg, K varied between 14.2 and 18.4 g/kg, Ca ranged from 1.0 and 2.6 g/kg, and Mg ranged from 1.3 and 2.3 g/kg [20], which were like those reported in this study. Furthermore, the concentration of these macro-elements in the Chilean landraces was like those reported for 25 American and European common bean accessions, belonging mainly to the Mesoamerican genetic pool [24]. On the contrary, a higher concentration of Ca (5.86 to 12.29 g/kg) and a lower concentration of Mg (0.64–1.10 mg/kg) were found in 29 common bean genotypes from CIAT and USA including both gene pools [25].
From a nutritional standpoint, P concentration is important in common bean seeds because it is related to phytate concentration [26]. In fact, phytic acid is recognized as an efficient chelator of nutritionally important mineral cations; therefore, it is an anti-nutrient for different essential minerals in the diet, especially Fe and Zn [27]. The Chilean landraces stand out for their high Fe (49–109 mg/kg) and Zn (26–48 mg/kg) concentration in comparison with Brazilian varieties of P. vulgaris whose Fe and Zn concentration varied from 14.4 to 27.3 mg/kg and 12.1 to 26.7 mg/kg, respectively [28]. Additionally, in a core collection from the International Center for Tropical Agriculture (CIAT) that includes about 1100 genotypes from both gene pools, the Fe concentration ranged from 35 mg/kg to 92 mg/kg, with a mean of 55 mg/kg [29]. However, the Fe and Zn concentrations were slightly lower compared to accessions from the Mesoamerican genetic pool [24]. A negative correlation has been evidenced between the phytate content and the content of Fe and Zn [28]. Given that in our study high contents of Fe and Zn were found in the Chilean landraces, a low content of phytates could be expected.
Among the Chilean landraces, Phv23 (‘Palo’) is highlighted due to its high concentration of micro- (Cu, Zn, Mn) and macro-elements (Mg, P, and K) that are key for human health. Therefore, this landrace could be a good candidate to increase the content and bioavailability of some important minerals in commercial varieties to improve mineral intake of the population.

3.3. Amino Acid Profile and Protein Content

One of the objectives of this study was to identify Chilean landraces of common bean with potential uses in the food industry as raw materials for plant-based products, and one of the most important traits for this purpose is the protein concentration of the seeds. The average total protein (TP) was 24.19% for the 28 accessions of common beans and 24.58% for the 23 Chilean landraces. The TP for Chilean landraces was higher than other races of P. vulgaris from the Mesoamerica gene pool, whose TP ranged from 19.3 to 23.03% [28,30]. The landraces Phv23 (‘Palo’), Phv9 (‘Cimarrón’), Phv17 (‘Juanita’), Phv3 (‘Araucano’), Phv8 (‘Cabrita/Señorita’), and Phv4 (‘Arroz’) have a high protein concentration and are statistically different from commercial varieties, suggesting that they could be used as raw materials for the development of plant-based products, thus reflecting the high nutritional value of these Chilean landraces. Additionally, these landraces can be useful in breeding programs to increase the protein concentration of available commercial varieties.
The main essential amino acids found in common beans were leucine and lysine, while sulfur amino acids such as methionine were present in low concentrations. On the other hand, cysteine was not detectable in this study. However, it has been reported that P. vulgaris accumulates large amounts of non-protein sulfur amino acid derivatives, such as S methyl Cys and γ glutamyl S methyl Cys, in mature seeds [31]. Considering that common beans contain low levels of sulfur amino acids such as methionine and cysteine [32], the Chilean landraces Phv15 (‘Hallado Alemán’) and Phv3 (‘Araucano’) have an excellent potential to be used in the food industry due to their remarkable levels of methionine. On the other hand, tryptophan (Trp) is one of the most oxidizable amino acids and it has been proposed to be relevant for human nutrition because it is essential in the synthesis of melatonin and serotonin, as well as vitamin B3 [33]. A high signal was found for Phv26 (‘Sapito’), indicating that this typical Chilean landrace has a high content of this essential amino acid, which has been discussed as a potential protective factor for physical and mental health [34].

3.4. Sucrose and Raffinose Content

A high raffinose concentration in legumes may limit their consumption due to the production of gases and digestive disturbances [35]. However, raffinose play an essential role in plant biology by protecting embryos during desiccation and serves as an energy source during germination [36]. Furthermore, raffinose also protects plants against different types of abiotic stress such as heat, drought, salt, and oxidative stresses [37]. Although sucrose and myo-inositol are precursors of raffinose in legume seeds and affect their accumulation at maturity [38], there was no significant correlation between RFO and sucrose accumulation in mature seeds in this study. In contrast, other legumes such as chickpea have showed a positive correlation between raffinose and myo-inositol and sucrose, especially during the early seed developmental stages [39]. The Chilean landrace Phv24 (‘Peumo’) has the potential to be used in genetic improvement programs to reduce the raffinose in seeds.

3.5. Antioxidant Activity and Phenolic Content

Evidence from medical studies indicates that the consumption of polyphenol-rich foods can help mitigate cardiovascular and non-communicable diseases such as diabetes and cancer [40,41,42]. The Chilean landraces evaluated have a high concentration of phenols ranging from 49.18 mg GAE/100 g (Phv11: ‘Coscorrón’) to 218.11 mg GAE/100 g (Phv24: ‘Peumo’), with an average of 112.76 mg GAE/100 g. Some authors indicate that the phenolic concentration of the Mesoamerican and the Andean gene pools are in the range of 35 to 389 mg GAE/100 g [43]. Similarly, Espinosa-Alonso et al. [44] reported a TPC range between 90 and 211 mg GAE/100 g for the genotypes of the Durango and Jalisco races. In this sense, the content of phenolic compounds in Chilean landraces is within the values obtained for the genotypes of both genetic pools (Mesoamerican and Andes). However, Valdés et al. [45] reported a phenolic concentration between 350 and 500 mg GAE/100 g for genotypes from Brazil.
According to the content of total phenolic compounds (TPCs) and antioxidant activity (ORAC), the landrace Phv24 (‘Peumo’) is one of the most promising to increase the phenolic compounds and antioxidant activity in bean varieties for health purposes.

4. Materials and Methods

4.1. Plant Materials

A total of 28 common bean accessions were evaluated for their nutritional composition in this study: 23 correspond to Chilean landraces and 5 correspond to commercial varieties cultivated in Chile. These accessions have different growth habits varying from type I, characterized by plants that present terminal reproductive buds and inflorescences (determinate), to type IV, characterized by tall indeterminate plants with long vines, terminal vegetative buds, and strong climbing ability [46], including the intermediate growth habits II and III (Figure 11; Table S4). Chilean landraces were collected from local farmers in the central–south regions of the country (O’Higgins to Maule regions). A field experiment was conducted in Curepto (35°05′ S; 72°01′ W; 9 m.a.s.l), a coastal area of the Maule region. The common bean genotypes were arranged in a randomized complete block design with three replicates. Plots were arranged as single rows with 3 plants per plot.

4.2. Mineral Composition

The seeds were oven-dried at 65 °C, finely milled, and then calcinated at 550 °C, and the ashes were subsequently digested with HCl 2N. Flame atomic absorption spectrometry (FAAS) (Agilent Technologies 280 FS/240 FS, Santa Clara, CA, USA) was used to determine the concentration of K, Ca, Mg, Cu, Zn, Mn, and Fe. Total N was determined by an elemental analyzer (TruSpec CN Leco®, St. Joseph, MI, USA). P and B concentrations were measured by colorimetry (Agilent Cary 8454 UV/Vis, Santa Clara, CA, USA) using the vanadate–molybdate method and the azomethine-H method, respectively. The chemical analyses were performed according to the standard methodologies used in Chile, which were published by Sadzawka et al. [47]. Total protein (TP) content was calculated by the factor of 6.25 according to the Dumas method [46]. Elemental mapping of common bean seeds was obtained using micro X-ray fluorescence (μ XRF) spectroscopy (BrukerTM M4 Tornado PlusTM, Bremen, Germany). For the measurements, the X-ray was operated at 50 kV and 30 μA (Rh anode with a Kα = 20.6), with a spot size of 20 μm, and an energy-dispersive silicon drift detector (30 mm2 and 142 eV for Mn Kα, XFlashTM, Singapore). Measurements were taken under 2 mbar vacuum conditions; the images were produced using a 20 μm × 20 μm pixel and an X-ray exposition time of 20 ms per pixel.

4.3. Amino Acids Composition

Amino acid hydrolysis was carried out according to AOAC 994.12 [48] to determine all essential amino acids (EAAs: glycine, histidine, threonine, valine, methionine, isoleucine, leucine, phenylalanine, and lysine) and non-essential amino acids (NEAAs: aspartic acid, glutamic acid, trans-4-hydroxyproline, serine, arginine, alanine, proline, and tyrosine), except for tryptophan and cysteine. Briefly, seeds were milled finely and subsequently hydrolyzed in 6 N HCl. Samples were derivatized, and individual amino acids were separated by HPLC using an Inerstil C18 ODS-3 250 mm × 5 µm × 4.6 mm column (GL Science, Dillenburgstraat, Netherlands) according to the literature [49]. Amino acid standard mix (0.015 to 0.240 mg/mL) calibration curves were used to identify and quantify the amino acids.

4.4. Sugars Content

Raffinose (RFO) was quantified spectrophotometrically at 510 nm (Tecan Infinite M200 PRO-Nano Quant, Mannedorf, Switzerland) using the Megazyme Raffinose/Sucrose Glucose Assay Kit according to the manufacturer’s recommendations (Megazyme®, Bray, Ireland). The determination of sugars (glucose, fructose, maltose, lactose, and sucrose) was performed by HPLC (Agilent 1200 series, Santa Clara, CA, USA) with a refraction index (RI) detector. For the pre-treatment of samples, 9 mL of 50% ethanol was added to a 1.0 g common bean sample, shaken in an orbital shaker for 1 h, and then centrifuged for 15 min at 5000 rpm, and the supernatant was subsequently injected into an ultra-amino column (4.6 × 150 mm, 3 µm particle; Restek, Bellefonte, PA, USA) set at 40 °C, and then the RI detector at 32 °C. The mobile phase was acetonitrile/water 85/15% v/v at 1.2 mL/min for 35 min. The respective calibration curves were prepared with a mix of sugar standards with a concentration between 5 and 75 g/L [50].

4.5. Total Phenolic Content (TPC)

TPC was determined by the Folin–Ciocalteu method [51]. For the pretreatment of samples, 8 mL of 60% ethanol was added to 2.0 g of bean flour, shaken in an orbital shaker for 1 h (400 rpm), and then centrifuged for 15 min at 6000 rpm, and the supernatant was subsequently measured. Gallic acid was employed for the calibration curve. Briefly, in a transparent plate with 96 wells, 200 µL of Folin’s reagent was added to each well using 15 µL of the sample, 40 µL of sodium carbonate solution (7.5% w/v), and 45 µL of MilliQ water, then the transparent plate was placed in a microplate reader (Synergy HTX Multi-Mode Reader, Biotek, Winooski, VT, USA). Finally, absorbance was measured at 750 nm and the results are expressed as mg GAE (Gallic Acid Equivalent)/100 g of sample [52].

4.6. Antioxidant Activity

A microplate reader (Synergy HTX Multi-Mode Reader, Biotek, USA) was used to analyze the oxygen radical absorbance capacity (ORAC). The samples were prepared by weighing 0.5 g and adding 20 mL of the acetone/water extraction solvent (50 + 50, v/v). The sample was shaken at 400 rpm at room temperature in an orbital shaker for 1 h. Once the shaking was over, the extracts were centrifuged at 7000 rpm for 30 min, and the supernatant was ready for analysis after dilution with buffer solution. For the measurement, black plates with 96 wells were used. Briefly, sodium fluorescein (0.015 mg/mL), AAPH radical solution (120 mg/mL), and Trolox standard solution (100 µM) were prepared with phosphate buffer (75 mM, pH 7). The operating conditions for the final reaction consisted of 50 μL of diluted extract, Trolox standard or phosphate buffer (blank), 50 μL of fluorescein, and 25 μL of AAPH incubated at 37 °C in the microplate reader. The fluorescence was recorded every 5 min over 60 min, differences in the areas under the fluorescence decay curve (AUC) between the blank and the sample over time were compared, and the results were expressed as μM Trolox Equivalents [53].

4.7. Determination of Tryptophan and Its Oxidation Products

The soluble protein (SP) concentration was determined in microplates using the bicinchoninic acid assay (BCA protein assay, Thermo Scientific, Rockford, IL, USA). The calibration curves were prepared using bovine serum albumin (BSA) as a standard protein. The absorbance was measured at 562 nm in a microplate reader (ELx800, BioTek, Winooski, VT, USA). The same extracts described in the determination of TPC were used, previously concentrated by rapid vacuum (Thermo Scientific Savant SpeedVac SPD121P) and reconstituted in 200 μL of distilled water. Protein was adjusted to have a final concentration of 0.161 mg/mL, diluting with phosphate buffer (100 mM, pH 7.4) to a final volume of 1 mL. Steady-state fluorescence for tryptophan (Trp) and its oxidation products N Formylkynurenine (N formyl Kyn) and kynurenine (Kyn) was determined in a fluorescence spectrofluorometer (L.S. 55, Perkin Elmer, Waltham, MA, USA). The excitation/emission wavelengths were set to 295 nm/360 nm for Trp, 325 nm/434 nm for N-formyl Kyn, and 365 nm/480 nm for Kyn.

4.8. Statistical Analyses

All statistical analyses were performed using Rstudio 2023.09.1 software. Descriptive statistics for each nutritional trait were calculated in the package ‘dplryr’ using the summarize function [54]. Pearson’s correlation between all variables was implemented with the package ‘corrplot’ [55]. One-way analysis of variance (ANOVA) was performed using the ‘aov’ function to determine differences between the means of the common bean accessions for all the traits evaluated, except for tryptophan which was measured only once. Statistically significant differences (p < 0.05) between the means were determined by Tukey’s tests using the TukeyHSD function from the ‘agricolae’ package [56]. Three principal component analyses (PCAs) were performed and visualized using the ‘Factoextra’ package [57]. A PCA was performed using the following ten variables: total micro- and macro-elements, total essential (EAAs) and non-essential (NEAAs) amino acids, SP, ORAC, TPC, RFO, sucrose, and protein. Then, individual PCAs were performed for micro- and macro-elements and essential and non-essential amino acids. Finally, scatterplots and barplots were graphed using the ‘ggplot2′ package [58].

5. Conclusions

The present study allowed the identification of a group of Chilean landraces with high potential to be used in the food industry to develop functional foods, as well as to improve the nutritional value of commercial varieties through genetic improvement. However, the landraces highlighted in this study are mainly of growth habit III and IV. Therefore, they are useful and recommended for small farmers.

Supplementary Materials

The following supporting information can be downloaded at https://www.mdpi.com/article/10.3390/plants13060817/s1, Figure S1: Concentration of Boron (B) for the 28 common bean accessions. Chilean landraces and commercial varieties are indicated with a triangle and a circle in the scatterplots, respectively. The red vertical line indicates the average boron concentration in all accessions. Significant differences between each accession according to the Tukey test are shown in the Table S2. Figure S2: Content of Tryptophan (Trp) evaluated by fluorescence for 28 common bean accessions evaluated. Figure S3: Mean concentration and standard deviation of essential amino acids (EAAs) for the 28 common bean accessions. Chilean landraces and commercial varieties are indicated with a triangle and a circle in the scatterplots, respectively. The red vertical line indicates the average concentration of each element in all accessions. Significant differences between each accession according to the Tukey test are shown in the Table S2. Figure S4: Mean concentration and standard deviation of non-essential amino acids (NEAAs) for the 28 common bean accessions. Chilean landraces and commercial varieties are indicated with a triangle and a circle in the scatterplots, respectively. The red vertical line indicates the average concentration of each element in all accessions. Significant differences between each accession according to the Tukey test are shown in the Table S2. Figure S5: Content of sucrose for the 28 common bean accessions evaluated. Bars with different letters are significantly different (p < 0.05) according to Tukey test. Figure S6: Loading for the variables that most contribute to the first two principal components. Figure S7: PCA based on minerals (micro and macro-elements). Figure S8: PCA based on amino acids (essential and non- essential). Table S1: Content of amino acids, minerals, sucrose, total phenolic compounds and proteins for the 28 common bean accessions evaluated. Table S2: Descriptive statistics and significant differences according to Tukey test for the 23 Chilean landraces and 5 commercial varieties of common beans. Table S3. Correlation values for all nutritional traits evaluated. Table S4. 28 common bean accessions used.

Author Contributions

Conceptualization, B.C., K.M. B.A., R.P.-D. and R.A.C.; methodology, A.P., L.A.M., C.F., D.O., R.P.-D., M.F. and R.A.C.; software and visualization, K.M. and O.A.; formal analysis, K.M.; investigation, B.C. and K.M.; resources, B.C.; data curation, B.C., B.A., R.P.-D., R.A.C., K.M. and O.A.; writing—original draft preparation, K.M., R.P.-D. and O.A.; supervision, H.S. and A.R.S.; project administration, B.C.; funding acquisition, B.C. and R.A.C.; writing—review and editing, K.M., B.C., O.A., B.A., R.P.-D. and R.A.C. All authors have read and agreed to the published version of the manuscript.

Funding

This research was funded by ANID, Fortalecimiento Científico R20F0001, and the grants Fondecyt N° 1201050 and Fondequip N° EQM200239.

Data Availability Statement

Data are contained as Supplementary Materials.

Acknowledgments

We thank the support of Centro de Estudios en Alimentos Procesados-CEAP, ANID, Fortalecimiento Cientifico R20F0001, Talca, Chile.

Conflicts of Interest

The authors declare no conflicts of interest.

References

  1. Broughton, W.J.; Hernández, G.; Blair, M.; Beebe, S.; Gepts, P.; Vanderleyden, J. Beans (Phaseolus spp.)—Model food legumes. Plant Soil 2003, 252, 55–128. [Google Scholar] [CrossRef]
  2. Araújo, S.S.; Beebe, S.; Crespi, M.; Delbreil, B.; González, E.M.; Gruber, V.; Lejeune-Henaut, I.; Link, W.; Monteros, M.J.; Prats, E.; et al. Abiotic stress responses in legumes: Strategies used to cope with environmental challenges. Crit. Rev. Plant Sci. 2015, 34, 237–280. [Google Scholar] [CrossRef]
  3. Labastida, D.; Ingvarsson, P.K.; Rendon-Anaya, M. Dissecting the genetic basis of drought responses in common bean using natural variation. Front Plant Sci. 2023, 14, 1143873. [Google Scholar] [CrossRef]
  4. Kristensen, M.D.; Bendsen, N.T.; Christensen, S.M.; Astrup, A.; Raben, A. Meals based on vegetable protein sources (beans and peas) are more satiating than meals based on animal protein sources (veal and pork)—A randomized cross-over meal test study. Food Nutr. Res. 2016, 60, 32634. [Google Scholar] [CrossRef]
  5. Tas, A.A.; Shah, A.U. The replacement of cereals by legumes in extruded snack foods: Science, technology and challenges. Trends Food Sci. Technol. 2021, 116, 701–711. [Google Scholar] [CrossRef]
  6. FAO. FAOSTAT Statistical Database. 2022. Available online: https://www.fao.org/faostat/en/#home (accessed on 1 March 2024).
  7. Hayat, I.; Ahmad, A.; Masud, T.; Ahmed, A.; Bashir, S. Nutritional and health perspectives of beans (Phaseolus vulgaris L.): An overview. Cr. Rev. Food Sci. Nutr. 2014, 54, 580–592. [Google Scholar] [CrossRef]
  8. Maphosa, Y.; Jideani, V.A.; Maphosa, Y.; Jideani, V.A. The Role of Legumes in Human Nutrition. In Functional Food—Improve Health through Adequate Food; IntechOpen: Rijeka, Croatia, 2017; pp. 103–122. [Google Scholar]
  9. Amarowicz, R.; Pegg, R.B. Legumes as a source of natural antioxidants. Eur. J. Lipid Sci. Tech. 2008, 110, 865–878. [Google Scholar] [CrossRef]
  10. Messina, V. Nutritional and health benefits of dried beans. Am. J. Clin. Nutr. 2014, 100, 437–442. [Google Scholar] [CrossRef] [PubMed]
  11. Carbas, B.; Machado, N.; Oppolzer, D.; Ferreira, L.; Queiroz, M.; Brites, C.; Rosa, E.A.; Barros, A.I. Nutrients, antinutrients, phenolic composition, and antioxidant activity of common bean cultivars and their potential for food applications. Antioxidants 2020, 9, 186. [Google Scholar] [CrossRef] [PubMed]
  12. Saleh, S.; Liu, G.; Liu, M.; Ji, Y.; He, H.; Gruda, N. Effect of irrigation on growth, yield, and chemical composition of two green bean cultivars. Horticulturae 2018, 4, 3. [Google Scholar] [CrossRef]
  13. Nicoletto, C.; Zanin, G.; Sambo, P.; Dalla Costa, L. Quality assessment of typical common bean genotypes cultivated in temperate climate conditions and different growth locations. Sci. Hortic. 2019, 256, 108599. [Google Scholar] [CrossRef]
  14. Shang, R.; Wu, H.; Guo, R.; Liu, Q.; Pan, L.; Li, J.; Hu, Z.; Chen, C. The diversity of four anti-nutritional factors in common bean. Hortic. Plant J. 2016, 2, 97–104. [Google Scholar] [CrossRef]
  15. Ribeiro, N.D.; dos Santos, G.G.; Maziero, S.M.; dos Santos, G.G. Genetic diversity and selection of bean landraces and cultivars based on technological and nutritional traits. J. Food Compos. Anal. 2021, 96, 103721. [Google Scholar] [CrossRef]
  16. Smýkal, P.; Nelson, M.N.; Berger, J.D.; Von Wettberg, E.J. The impact of genetic changes during crop domestication on healthy food development. Agronomy 2018, 8, 26. [Google Scholar] [CrossRef]
  17. Assefa, T.; Assibi Mahama, A.; Brown, A.V.; Cannon, E.K.; Rubyogo, J.C.; Rao, I.M.; Blair, M.W.; Cannon, S.B. A review of breeding objectives, genomic resources, and marker-assisted methods in common bean (Phaseolus vulgaris L.). Mol. Breed. 2019, 39, 1–23. [Google Scholar] [CrossRef]
  18. Schmutz, J.; McClean, P.E.; Mamidi, S.; Wu, G.A.; Cannon, S.B.; Grimwood, J.; Jenkins, J.; Shu, S.; Song, Q.; Chavarro, C.; et al. A reference genome for common bean and genome-wide analysis of dual domestications. Nat. Genet. 2014, 46, 707–713. [Google Scholar] [CrossRef] [PubMed]
  19. Trucchi, E.; Benazzo, A.; Lari, M.; Iob, A.; Vai, S. Ancient genomes reveal early Andean farmers selected common beans while preserving diversity. Nat. Plants 2021, 7, 123–128. [Google Scholar] [CrossRef] [PubMed]
  20. Paredes, M.; Becerra, V.; Tay, J. Inorganic nutritional composition of common bean (Phaseolus vulgaris L.) genotypes race Chile. Chil. J. Agr. Res. 2009, 69, 486–495. [Google Scholar] [CrossRef]
  21. Celmeli, T.; Sari, H.; Canci, H.; Sari, D.; Adak, A.; Eker, T.; Toker, C. The nutritional content of common bean (Phaseolus vulgaris L.) landraces in comparison to modern varieties. Agronomy 2018, 8, 166. [Google Scholar] [CrossRef]
  22. Blair, M.W.; Diaz, J.M.; Hidalgo, R.; Diaz, L.M.; Duque, M.C. Microsatellite characterization of Andean races of common bean (Phaseolus vulgaris L.). Theor. Appl. Genet. 2007, 116, 29–43. [Google Scholar] [CrossRef] [PubMed]
  23. Becerra, V.; Paredes, M.; Rojo, R.; Díaz, M.; Blair, M.W. Microsatellite marker characterization of Chilean common bean (Phaseolus vulgaris L.) germplasm. Crop Sci. 2010, 50, 1932–1941. [Google Scholar] [CrossRef]
  24. Murube, E.; Beleggia, R.; Pacetti, D.; Nartea, A.; Frascarelli, G.; Lanzavecchia, G.; Bellucci, E.; Nanni, L.; Gioia, T.; Marciello, U.; et al. Characterization of nutritional quality traits of a common bean germplasm collection. Foods 2021, 10, 1572. [Google Scholar] [CrossRef]
  25. Akond, A.G.M.; Crawford, H.; Berthold, J.; Talukder, Z.I.; Hossain, K. Minerals (Zn, Fe, Ca and Mg) and antinutrient (phytic acid) constituents in common bean. Am. J. Food Technol. 2011, 6, 235. [Google Scholar] [CrossRef]
  26. Mambrin, R.B.; Sausen, D.; Moura, D.; Carvalho, I.R.; Szareski, V.J. Phosphorus nutrition in beans. Commun. Plant Sci. 2021, 11, 46–56. [Google Scholar]
  27. Ramírez-Cárdenas, L.; Leonel, A.J.; Costa, N.M.B.; Reis, F.P. Zinc bioavailability in different beans as affected by cultivar type and cooking conditions. Food Res. Int. 2010, 43, 573–581. [Google Scholar] [CrossRef]
  28. Destro de Lima, J.; Ribeiro Rivadavea, W.; Frehner Kavalco, S.A.; Gonçalves Junior, A.C.; Daniela Lopes, A.; Jaqueline da Silva, G. Chemical and nutritional characterization of bean genotypes (Phaseolus vulgaris L.). AIMS Agric. Food 2021, 6, 932–944. [Google Scholar] [CrossRef]
  29. Islam, F.M.A.; Basford, K.E.; Jara, C.; Redden, R.J.; Beebe, S. Seed compositional and disease resistance differences among gene pools in cultivated common bean. Genet. Resour. Crop Evol. 2002, 49, 285–293. [Google Scholar] [CrossRef]
  30. Mojica, L.; de Mejía, E.G. Characterization and Comparison of Protein and Peptide Profiles and their Biological Activities of Improved Common Bean Cultivars (Phaseolus vulgaris L.) from Mexico and Brazil. Plant Foods Hum. Nutr. 2015, 70, 105–112. [Google Scholar] [CrossRef] [PubMed]
  31. Saboori-Robat, E.; Joshi, J.; Pajak, A.; Solouki, M.; Mohsenpour, M.; Renaud, J.; Marsolais, F. Common Bean (Phaseolus vulgaris L.) Accumulates Most S-Methylcysteine as Its γ-Glutamyl Dipeptide. Plants 2019, 8, 126. [Google Scholar] [CrossRef] [PubMed]
  32. Nosworthy, M.G.; Neufeld, J.; Frohlich, P.; Young, G.; Malcolmson, L.; House, J.D. Determination of the protein quality of cooked Canadian pulses. Food Sci. Nutr. 2017, 5, 896–903. [Google Scholar] [CrossRef] [PubMed]
  33. Rombouts, C.; Hemeryck, L.Y.; Van Hecke, T.; De Smet, S.; De Vos, W.H.; Vanhaecke, L. Untargeted metabolomics of colonic digests reveals kynurenine pathway metabolites, dityrosine and 3-dehydroxycarnitine as red versus white meat discriminating metabolites. Sci. Rep. 2017, 7, 42514. [Google Scholar] [CrossRef] [PubMed]
  34. Reuter, M.; Zamoscik, V.; Plieger, T.; Bravo, R.; Ugartemendia, L.; Rodriguez, A.B.; Kirsch, P. Tryptophan-rich diet is negatively associated with depression and positively linked to social cognition. Nutr. Res. 2021, 85, 14–20. [Google Scholar] [CrossRef] [PubMed]
  35. Doria, E.; Campion, B.; Sparvoli, F.; Tava, A.; Nielsen, E. Anti-nutrient components and metabolites with health implications in seeds of 10 common bean (Phaseolus vulgaris L. and Phaseolus lunatus L.) landraces cultivated in southern Italy. J. Food Compos. Anal. 2012, 26, 72–80. [Google Scholar] [CrossRef]
  36. Elango, D.; Rajendran, K.; Van der Laan, L.; Sebastiar, S.; Raigne, J.; Thaiparambil, N.A.; El Haddad, N.; Raja, B.; Wang, W.; Ferela, A.; et al. Raffinose Family Oligosaccharides: Friend or Foe for Human and Plant Health? Front. Plant Sci. 2022, 13, 829118. [Google Scholar] [CrossRef] [PubMed]
  37. Yan, S.; Liu, Q.; Li, W.; Yan, J.; Fernie, A.R. Raffinose Family Oligosaccharides: Crucial Regulators of Plant Development and Stress Responses. Cr. Rev. Plant Sci. 2022, 41, 286–303. [Google Scholar] [CrossRef]
  38. Karner, U.; Peterbauer, T.; Raboy, V.; Jones David, A.; Hedley, C.L.; Richter, A. Myo-Inositol and sucrose concentrations affect the accumulation of raffinose family oligosaccharides in seeds. J. Exp. Bot. 2004, 55, 1981–1987. [Google Scholar] [CrossRef]
  39. Gangola, M.P.; Jaiswal, S.; Kannan, U.; Gaur, P.M.; Båga, M.; Chibbar, R.N. Galactinol synthase enzyme activity influences raffinose family oligosaccharides (RFO) accumulation in developing chickpea (Cicer arietinum L.) seeds. Phytochemistry 2016, 125, 88–98. [Google Scholar] [CrossRef]
  40. Del Rio, D.; Rodriguez-Mateos, A.; Spencer, J.P.E.; Tognolini, M.; Borges, G.; Crozier, A. Dietary (Poly)phenolics in Human Health: Structures, Bioavailability, and Evidence of Protective Effects Against Chronic Diseases. Antioxid. Redox Sign. 2013, 18, 1818–1892. [Google Scholar] [CrossRef]
  41. Grosso, G.; Godos, J.; Lamuela-Raventos, R.; Ray, S.; Micek, A.; Pajak, A.; Sciacca, S.; D’Orazio, N.; Del Rio, D.; Galvano, F. A comprehensive meta-analysis on dietary flavonoid and lignan intake and cancer risk: Level of evidence and limitations. Mol. Nutr. Food Res. 2017, 61, 1600930. [Google Scholar] [CrossRef]
  42. Nardini, M. Phenolic Compounds in Food: Characterization and Health Benefits. Molecules 2022, 27, 783. [Google Scholar] [CrossRef]
  43. Rodríguez Madrera, R.; Campa Negrillo, A.; Suárez Valles, B.; Ferreira Fernández, J.J. Phenolic Content and Antioxidant Activity in Seeds of Common Bean (Phaseolus vulgaris L.). Foods 2021, 10, 864. [Google Scholar] [CrossRef] [PubMed]
  44. Espinosa-Alonso, L.G.; Lygin, A.; Widholm, J.M.; Valverde, M.E.; Paredes-Lopez, O. Polyphenols in Wild and Weedy Mexican Common Beans (Phaseolus vulgaris L.). J. Agric. Food Chem. 2006, 54, 4436–4444. [Google Scholar] [CrossRef]
  45. Valdés, S.T.; Coelho, C.M.M.; Michelluti, D.J.; Tramonte, V.L.C.G. Association of genotype and preparation methods on the antioxidant activity, and antinutrients in common beans (Phaseolus vulgaris L.). LWT Food Sci. Technol. 2011, 44, 2104–2111. [Google Scholar] [CrossRef]
  46. Singh, S.P. A key for identification of different growth habits of Phaseolus vulgaris L. Annu. Rep. Bean. Improv. Coop. 1982, 25, 92–95. [Google Scholar]
  47. Sadzawka, A.; Carrasco, M.; Demanet, R.; Flores, H.; Grez, R.; Mora, M.; Neaman, A. Métodos de análisis de tejidos vegetales. Ser. Actas INIA 2007, 40, 140. [Google Scholar]
  48. AOAC. Official Methods of Analysis, 15th ed.; Association of Analytical Chemists International: Washington, DC, USA, 1995. [Google Scholar]
  49. Bidlingmeyer, B.A.; Cohen, S.A.; Tarvin, T.L.; Frost, B. A New, Rapid, High-Sensitivity Analysis of Amino Acids in Food Type Samples. J. AOAC Int. 1987, 70, 241–247. [Google Scholar] [CrossRef]
  50. Bouhlali, E.T.; Ramchoun, M.; Alem, C.; Ghafoor, K.; Ennassir, J.; Zegzouti, Y.F. Functional composition and antioxidant activities of eight Moroccan date fruit varieties (Phoenix dactylifera L.). J. Saudi Soc. Agric. Sci. 2017, 16, 257–264. [Google Scholar] [CrossRef]
  51. Ahmad-Qasem, M.H.; Cánovas, J.; Barrajón-Catalán, E.; Micol, V.; Cárcel, J.A.; García-Pérez, J.V. Kinetic and compositional study of phenolic extraction from olive leaves (var. Serrana) by using power ultrasound. Innov. Food Sci. Emerg. Technol. 2013, 17, 120–129. [Google Scholar] [CrossRef]
  52. Rodríguez, L.; Plaza, A.; Méndez, D.; Carrasco, B.; Tellería, F.; Palomo, I.; Fuentes, E. Antioxidant Capacity and Antiplatelet Activity of Aqueous Extracts of Common Bean (Phaseolus vulgaris L.) Obtained with Microwave and Ultrasound Assisted Extraction. Plants 2022, 11, 1179. [Google Scholar] [CrossRef]
  53. Ou, B.; Chang, T.; Huang, D.; Prior, R.L. Determination of Total Antioxidant Capacity by Oxygen Radical Absorbance Capacity (ORAC) Using Fluorescein as the Fluorescence Probe: First Action 2012.23. J. AOAC Int. 2013, 96, 1372–1376. [Google Scholar] [CrossRef]
  54. Wickham, H.; François, R.; Henry, L.; Müller, K.; Wickham, M.H. Package ‘dplyr’. A Grammar of Data Manipulation, R package version 8; 2019. Available online: https://cran.r-hub.io/web/packages/dplyr/dplyr.pdf (accessed on 15 December 2023).
  55. Wei, T.; Simko, V.; Levy, M.; Xie, Y.; Jin, Y.; Zemla, J. Package ‘corrplot’. Statistician 2017, 56, e24. [Google Scholar]
  56. De Mendiburu, F.; de Mendiburu, M.F. Package ‘agricolae’, R Package Version 1; 2019. Available online: https://cran.r-project.org/web/packages/agricolae/index.html (accessed on 15 December 2023).
  57. Kassambara, A.; Mundt, F. Package ‘factoextra’. Extract and Visualize the Results of Multivariate Data Analyses, R Package Version 1.0.7; 2017. Available online: https://CRAN.R-project.org/package=factoextra (accessed on 15 December 2023).
  58. Wickham, H. ggplot2. Wiley Interdiscip. Rev. Comput. Stat. 2011, 3, 180–185. [Google Scholar] [CrossRef]
Figure 1. Total macro- (A) and micro-element (B) concentrations for the 28 common bean accessions evaluated. Bars with different letters are significantly different (p < 0.05) according to the Tukey test. The abbreviations Phv1 to Phv28 correspond to the 28 accessions of Phaseolus vulgaris (Phv) used in this study. For more details about the accessions, see Table S1.
Plants 13 00817 g001
Figure 2. Mean concentration of macro-elements (Mg, Ca, K, and P) for the 28 common bean accessions. Chilean landraces and commercial varieties are indicated with a triangle and a circle in the scatterplots, respectively. The red vertical line indicates the average concentration of each element in all accessions. Significant differences between each accession according to the Tukey test are shown in Table S2.
Plants 13 00817 g002
Figure 3. Mean concentration of micro-elements (Mn, Zn, Cu, and Fe) for the 28 common bean accessions. Chilean landraces and commercial varieties are indicated with a triangle and a circle in the scatterplots, respectively. The red vertical line indicates the average concentration of each element in all accessions. Significant differences between each accession according to the Tukey test are shown in Table S2. The boron (B) concentration is shown in Figure S1.
Plants 13 00817 g003
Figure 4. Micro X-ray (µXRF) fluorescence image of K and Ca (A), and P and S (B) distribution in seeds of 28 common bean accessions. K localization is indicated in red, Ca in green, P in blue, and S in yellow.
Plants 13 00817 g004
Figure 5. Total essential (A) and non-essential (B) amino acid contents for the 28 common bean accessions evaluated. Bars with different letters are significantly different (p < 0.05) according to the Tukey test.
Plants 13 00817 g005
Figure 6. Soluble (A) and total (B) protein contents for the 28 common bean accessions evaluated. Bars with different letters are significantly different (p < 0.05) according to the Tukey test.
Plants 13 00817 g006
Figure 7. Raffinose (RFO) concentration for the 28 common bean accessions evaluated. Bars with different letters are significantly different (p < 0.05) according to Tukey test.
Plants 13 00817 g007
Figure 8. Total phenolic concentration (A) and ORAC (B) for the 28 common bean accessions evaluated. Bars with different letters are significantly different (p < 0.05) according to the Tukey test.
Plants 13 00817 g008
Figure 9. (A) Loading plot from the principal component analysis. (B) Principal component analysis for the 28 accessions based on sucrose, total phenolic concentration (TPC), ORAC, total protein (TP), soluble protein (SP), raffinose (RFO), minerals (macro and micro), and amino acids (essential and non-essential).
Plants 13 00817 g009
Figure 10. Correlation plot matrix between all traits for the 23 Chilean landraces and 5 commercial varieties of common bean. Only significant correlations are shown (p < 0.05). The size and color of the circles indicate the value of each correlation. For details of correlation values, see Table S3.
Plants 13 00817 g010
Figure 11. Shape and color of the 28 common beans used in this study. Phv1 (‘Alubia’), Phv7 (‘Blanco Español’), Phv20 (‘Miami’), Phv21 (‘Negro’), and Phv25 (‘Rojo Canada’) correspond to commercial varieties cultivated in Chile (*).
Plants 13 00817 g011
Table 1. Mean, standard deviation (Sd), and range among the 28 common bean accessions for the nutritional quality traits analyzed.
CategoryTraitUnitMeanSdMinMaxSignificance
SugarsSucroseg/100 g seed2.610.851.114.75*
RFOmmol/100 g seed4.790.433.925.45*
Antioxidant activity TPCmg GA/100 g seed111.3844.5549.18218.11*
ORACumol eq trolox/100 g extract12,821.045936.164544.9123,045.01*
Protein content SPmg/mL5.282.211.7710.01*
TPg/100 g seed24.192.6020.3130.35*
Macro-elementsPg/kg4.670.843.437.53*
Kg/kg16.131.4513.4319.80*
Cag/kg1.640.480.872.93*
Mgg/kg2.030.151.732.43*
Totalg/kg24.472.3121.1031.50*
Micro-elementsMnmg/kg13.272.5310.3319.00*
Znmg/kg38.136.7123.0052.67*
Cumg/kg10.251.428.0013.67*
Femg/kg71.7616.6648.67109.00*
Bmg/kg17.322.7413.0026.33*
Totalmg/kg150.7422.62110.33197.00*
EAAsGly.Hismg/g protein61.194.2049.9268.77*
Thrmg/g protein35.452.6130.9140.71*
Valmg/g protein39.592.7934.4845.72*
Metmg/g protein7.341.943.3211.84*
Ilemg/g protein35.753.1330.6341.82*
Leumg/g protein61.084.3053.6468.79*
Phemg/g protein42.865.2935.9159.40*
Lysmg/g protein50.994.9343.7861.62*
Totalmg/g protein334.2423.23293.27367.94*
NEAAsAspmg/g protein90.227.0275.35101.42*
Glumg/g protein120.068.3498.63134.13*
4Hypmg/g protein1.790.620.753.30*
Sermg/g protein47.403.9940.2059.44*
Argmg/g protein56.096.4146.6770.01*
Alamg/g protein37.253.1931.3543.09*
Promg/g protein31.562.7027.6537.50*
Tyrmg/g protein26.334.1118.7634.36*
Totalmg/g protein410.7024.38369.57452.15*
RFO: raffinose; TPC: total phenolic content; ORAC: antioxidant capacity; SP: soluble proteins; TP: total protein content; EAAs: essential amino acids; NEAAs: non-essential amino acids. * p < 0.05 according to ANOVA.
Disclaimer/Publisher’s Note: The statements, opinions and data contained in all publications are solely those of the individual author(s) and contributor(s) and not of MDPI and/or the editor(s). MDPI and/or the editor(s) disclaim responsibility for any injury to people or property resulting from any ideas, methods, instructions or products referred to in the content.

